
Early deglacial Atlantic overturning decline and its role in
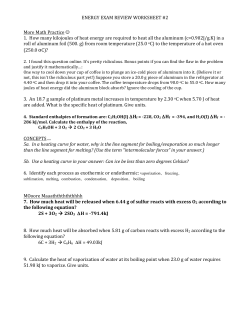
Clim. Past, 11, 135–152, 2015
www.clim-past.net/11/135/2015/
doi:10.5194/cp-11-135-2015
© Author(s) 2015. CC Attribution 3.0 License.
Early deglacial Atlantic overturning decline and its role in
atmospheric CO2 rise inferred from carbon isotopes (δ 13C)
A. Schmittner1 and D. C. Lund2
1 College
of Earth, Ocean, and Atmospheric Sciences, Oregon State University, Corvallis, Oregon, USA
of Marine Sciences, University of Connecticut, USA
2 Department
Correspondence to: A. Schmittner ([email protected])
Received: 12 June 2014 – Published in Clim. Past Discuss.: 9 July 2014
Revised: 5 January 2015 – Accepted: 8 January 2015 – Published: 5 February 2015
Abstract. The reason for the initial rise in atmospheric
CO2 during the last deglaciation remains unknown. Most recent hypotheses invoke Southern Hemisphere processes such
as shifts in midlatitude westerly winds. Coeval changes in
the Atlantic meridional overturning circulation (AMOC) are
poorly quantified, and their relation to the CO2 increase is
not understood. Here we compare simulations from a global,
coupled climate–biogeochemistry model that includes a detailed representation of stable carbon isotopes (δ 13 C) with a
synthesis of high-resolution δ 13 C reconstructions from deepsea sediments and ice core data. In response to a prolonged
AMOC shutdown initialized from a preindustrial state, modeled δ 13 C of dissolved inorganic carbon (δ 13 CDIC ) decreases
in most of the surface ocean and the subsurface Atlantic, with
largest amplitudes (more than 1.5 ‰) in the intermediatedepth North Atlantic. It increases in the intermediate and
abyssal South Atlantic, as well as in the subsurface Southern,
Indian, and Pacific oceans. The modeled pattern is similar
and highly correlated with the available foraminiferal δ 13 C
reconstructions spanning from the late Last Glacial Maximum (LGM, ∼ 19.5–18.5 ka BP) to the late Heinrich stadial event 1 (HS1, ∼ 16.5–15.5 ka BP), but the model overestimates δ 13 CDIC reductions in the North Atlantic. Possible reasons for the model–sediment-data differences are discussed. Changes in remineralized δ 13 CDIC dominate the total
δ 13 CDIC variations in the model but preformed contributions
are not negligible. Simulated changes in atmospheric CO2
and its isotopic composition (δ 13 CCO2 ) agree well with ice
core data. Modeled effects of AMOC-induced wind changes
on the carbon and isotope cycles are small, suggesting that
Southern Hemisphere westerly wind effects may have been
less important for the global carbon cycle response during
HS1 than previously thought. Our results indicate that during the early deglaciation the AMOC decreased for several
thousand years. We propose that the observed early deglacial
rise in atmospheric CO2 and the decrease in δ 13 CCO2 may
have been dominated by an AMOC-induced decline of the
ocean’s biologically sequestered carbon storage.
1
Introduction
Earth’s transition from the LGM (Last Glacial Maximum)
(23–19 ka BP), into the modern warm period of the Holocene
(10–0 ka BP) remains enigmatic (Denton et al., 2006). Evidence of an early warming of the Southern Hemisphere and
atmospheric CO2 increase (Petit et al., 1999; Denton et al.,
2010) has prompted hypotheses of a Southern Hemisphere
trigger for the deglaciation (Stott et al., 2007; Timmermann
et al., 2009). But the early rise in atmospheric CO2 , although
an important forcing for deglacial global warming (Shakun
et al., 2012), remains unexplained. Various mechanisms have
been proposed. Prominent recent studies suggest wind (Anderson et al., 2009; Denton et al., 2010; Toggweiler et al.,
2006) and/or stratification (Watson and Naveira Garrabato
2006; Schmittner et al. 2007; Sigman et al. 2007; Tschumi
et al., 2011) changes in the Southern Ocean and/or changes
in the North Pacific circulation (Menviel et al., 2014).
Others have suggested that the deglaciation was initiated
by a collapse of the AMOC (Atlantic meridional overturning circulation) caused by the melting of Northern Hemisphere ice sheets (Clark et al., 2004; Sigman et al. 2007;
Anderson et al., 2009; Denton et al., 2010; Shakun et al.,
2012; He et al., 2013) and abrupt North Atlantic climate
Published by Copernicus Publications on behalf of the European Geosciences Union.
136
changes (Broecker et al., 1985). This idea is appealing since
the AMOC is known from theory to exhibit multiple steady
states with the possibility of rapid transitions between them
(Stommel, 1961). Moreover, AMOC variations are consistent
with the observed antiphasing of surface temperatures between the hemispheres (Crowley 1992; Blunier et al., 1998;
Schmittner et al., 2003; Stocker and Johnson, 2003; EPICA
community members 2006; Shakun et al., 2012) and evidence for ITCZ (intertropical convergence zone) migration
(Menviel et al., 2008). However, surface temperatures and
tropical rainfall patterns alone do not allow robust inferences
about the AMOC (Kurahashi-Nakamura et al., 2014) and evidence from the deep ocean for circulation variations remains
sparse. One widely cited record of protactinium : thorium ratios (231 Pa / 230 Th) from the subtropical North Atlantic has
been interpreted as an AMOC collapse around 19–18 ka BP
followed by a rapid resumption ∼ 15 ka BP in the warm
Bølling–Allerød period (McManus et al., 2004). However,
this interpretation has been questioned (Keigwin and Boyle,
2008) and a subsequent set of 231 Pa/320 Th records (Gherardi et al., 2009) suggested that a complete AMOC cessation
during HS1 (Heinrich stadial event 1) was unlikely. Moreover, our understanding of 231 Pa / 230 Th in the modern ocean
continues to evolve (Anderson and Hayes, 2013) and inferences on the basin or global scale circulation from a single
site require validation with multiple proxies from a range of
oceanographic locations. A quantitative deglacial AMOC reconstruction constrained by distributed interior ocean observations continues to be lacking. Here we attempt a first step
towards such a reconstruction by combining model simulations with δ 13 C measurements of sediment samples.
Deep-sea reconstructions based on δ 13 C are more common than 231 Pa / 230 Th, the processes governing δ 13 C are
better understood, and realistic three-dimensional models exist (e.g., Schmittner et al., 2013), providing necessary ingredients for quantitative hypothesis testing. Here we compile
deep-ocean δ 13 C reconstructions at a high temporal resolution from the early deglaciation and compare them with
model simulations of δ 13 C changes caused by AMOC variations in order to test the hypothesis that the AMOC was
reduced during HS1. We also compare our model results
to observations of atmospheric CO2 concentrations and the
δ 13 C of atmospheric CO2 in order to assess mechanisms of
the early deglacial CO2 rise. Here we do not address the
full deglaciation but restrict our investigation to its initial
phase from the late LGM (∼19.5–18.5 ka BP) to the late HS1
(∼16.5–15.5 ka BP).
Various modeling studies have previously examined the
effect of AMOC changes on atmospheric CO2 , with sometimes conflicting results (Marchal et al., 1998; Marchal et al.,
1999; Scholze et al., 2003; Köhler et al., 2005; Schmittner
et al., 2007a; Obata, 2007; Schmittner and Galbraith, 2008;
Menviel et al., 2008, 2012, 2014; Bozbiyik et al., 2011).
Schmittner and Galbraith (2008) found that a large AMOC
reduction decreases the efficiency of the ocean’s biological
Clim. Past, 11, 135–152, 2015
A. Schmittner and D. C. Lund: Did AMOC trigger CO2 rise?
pump if North Atlantic Deep Water (NADW) is more depleted in preformed nutrients than water masses sourced in
the south (Antarctic Bottom Water (AABW) and Antarctic
Intermediate Water (AAIW)), and it thus leads to the outgassing of CO2 into the atmosphere and gradually increasing atmospheric CO2 over several thousand years, consistent
with theory (Ito and Follows 2005; Marinov et al., 2008a,
b) and ice core CO2 reconstructions (Ahn and Brook, 2007).
Some of the differences in model responses may thus be due
to the simulations of preformed nutrients. Whereas Schmittner and Galbraith (2008) have demonstrated consistency of
their model with modern preformed nutrient observations,
such a validation is not published, to our knowledge, for other
models (e.g., the LOVECLIM model used by Menviel et al.,
2008, 2014). Several studies found a dependency of the results on the initial state (Köhler et al., 2005; Schmittner et al.,
2007a; Menviel et al., 2008), suggesting that starting from
glacial conditions may give a different answer than starting from modern conditions. However, none of these studies
have validated their initial deep-ocean LGM states with reconstructions. Thus inferences from these studies regarding
the sensitivity of the real ocean carbon cycle to initial conditions remain subject to considerable uncertainty.
Effects of Southern Hemisphere westerly winds on atmospheric CO2 have also been quantified with models before (Winguth et al., 1999; Menviel et al., 2008; Tschumi
et al., 2008, 2011; d’Orgeville et al., 2010; Lee et al., 2011;
Völker and Köhler, 2013). Most of these studies conclude
that reasonably expected changes in the strength and/or latitude of westerly winds cannot explain a large fraction of
the observed 100 ppm glacial–interglacial CO2 amplitude
(Winguth et al., 1999, Menviel et al., 2008, Tschumi et al.,
2008, 2011, d’Orgeville et al., 2010, Völker and Köhler,
2013). An exception is the work by Lee et al. (2011), who
find a 20–60 ppm CO2 increase for a 25% strengthening of
the westerly winds. However, their wind stress forcing was
calculated from an atmosphere only model, which was forced
with a very large heat flux anomaly and leads to large areas
of the subtropical North Atlantic experiencing extreme cooling of more than 10 ◦ C, much more than reconstructed (Bard
et al., 2000). We will show below that more realistic coupled
ocean–atmosphere model simulations of an AMOC collapse
result in much smaller wind stress changes. For comparison,
a complete removal of the Antarctic Ice Sheet leads only
to a 50 % reduction in Southern Hemisphere westerly winds
(Schmittner et al., 2011). Tschumi et al. (2011), whose simulations include δ 13 C and are forced with wind stress changes
over the Southern Ocean, conclude that stratification changes
there can explain the observed rise in atmospheric CO2 and
the decrease in δ 13 CCO2 during HS1. Here we propose a different mechanism, namely changes in the AMOC and its effect on the efficiency of the biological pump, as an alternative
hypothesis for the ice core observations. Another difference
from previous studies is that we directly and quantitatively
test Anderson et al.’s (2009) hypothesis that AMOC changes
www.clim-past.net/11/135/2015/
A. Schmittner and D. C. Lund: Did AMOC trigger CO2 rise?
137
Table 1. Sediment cores used in this study. Note that cores 1 and 2 have been averaged for the comparison with the model simulations shown
in Figs. 7–10 and Table 2.
1
2
3
4
5
6
7
8
9
10
11
12
13
14
15
16
17
18
19
20
21
22
23
24
25
26
Core
Longitude
Latitude
Depth (m)
References
Age model (if different)
ODP984
NEAP4K
RAPiD-10-1P
ODP980
NA87-22
KN166-14-JPC-13
MD01-2461
SO75-26KL
MD99-2334K
MD95-2037
KNR166-2-26JPC
M35003-4
KNR159-5 90GGC
KNR159-5 36GGC
KNR159-5 17JPC
KNR159-5 78GGC
KNR159-5 33GGC
KNR159-5 42JPC
KNR159-5 30GGC
KNR159-5 125GGC
RC11-83
MD01-2588
74KL
NIOP905
MD97-2120
W8709A-13PC
61◦ N
61◦ N
62◦ N
55◦ N
55◦ N
53◦ N
52◦ N
37◦ N
37◦ N
37◦ N
24◦ N
12◦ N
28◦ S
28◦ S
28◦ S
28◦ S
28◦ S
28◦ S
28◦ S
30◦ S
41◦ S
41◦ S
14◦ N
10◦ N
45◦ S
42◦ N
24◦ W
24◦ W
17◦ W
15◦ W
14◦ W
33◦ W
13◦ W
10◦ W
10◦ W
32◦ W
83◦ W
61◦ W
46◦ W
46◦ W
46◦ W
46◦ W
46◦ W
46◦ W
46◦ W
45◦ W
9◦ E
25◦ E
57◦ E
52◦ E
174◦ E
126◦ W
1649
1627
1237
2179
2161
3082
1153
1099
3146
2159
546
1299
1105
1268
1627
1820
2082
2296
2500
3589
4718
2907
3212
1580
1210
2710
Praetorius et al. (2008)
Rickaby and Elderfield (2005)
Thornalley et al. (2010)
Benway et al. (2010)
Vidal et al. (1997)
Hodell et al. (2010)
Peck et al. (2007)
Zahn et al. (1997)
Skinner and Shackleton (2004)
Labeyrie et al. (2005)
Lynch-Stieglitz et al. (2014)
Zahn and Stuber (2002)
Lund et al. (2014); Curry and Oppo (2005)
Curry and Oppo (2005); Sortor and Lund (2011)
Tessin and Lund (2013)
Tessin and Lund (2013)
Tessin and Lund (2013)
Curry and Oppo (2005); Tessin and Lund (2013)
Tessin and Lund (2013)
Tessin and Lund (2013); Hoffman and Lund (2012)
Charles et al. (1996)
Ziegler et al. (2013)
Sirocko et al. (1993)
Jung et al. (2009)
Pahnke and Zahn (2005)
Lund et al. (2011); Mix et al. (1999)
Lund et al. (2014)
affect atmospheric circulation and wind stress in the Southern Ocean to such a degree that the outgassing of CO2 contributes importantly to the total CO2 rise during HS1. We do
this by applying realistic wind stress changes from a coupled
ocean–atmosphere model simulation of an AMOC shutdown
to a global carbon cycle model including isotopes.
2
Methods
We have compiled 25 published deep-ocean records covering the early deglaciation at a high temporal resolution (Table 1). Mostly published age models are used, except in some
cases where the radiocarbon calibration was updated as described in Lund et al. (2014). In order to be consistent with
the treatment of the other cores in Lund et al. (2014), we have
updated the age model of MD01-2461 by recalibrating the
radiocarbon ages using INTCAL13 and reservoir ages estimated by Stern and Lisiecki (2013). The ages may have considerable (O(1 ka)) uncertainties. However, we believe that
the records are of sufficient resolution and their age models are well enough constrained to evaluate multimillennial
changes. The purpose of this paper is to present an initial
comparison to model results focusing on model analysis. The
quantification of age uncertainties and their effects on the results are beyond the scope of this paper. The sediment data
compilation is available in the supplement to this paper.
www.clim-past.net/11/135/2015/
Lund et al. (2014)
Waelbroeck et al. (2011)
See text (Section 2)
Lund et al. (2014)
Waelbroeck et al. (2011)
Lund et al. (2014)
We employ the Model of Ocean Biogeochemistry and Isotopes (MOBI 1.4), a coupled climate–biogeochemical system that includes δ 13 C cycling in the three-dimensional
ocean, land, and atmosphere to explore the effect of AMOC
variations on carbon isotopes (see the Appendix for a more
detailed model description). MOBI’s large-scale ocean distribution of δ 13 CDIC in dissolved inorganic carbon (DIC) is
consistent with modern water column observations (Schmittner et al., 2013). It is embedded in the University of Victoria climate model of intermediate complexity version 2.9
and run to a preindustrial equilibrium with prognostic atmospheric CO2 and δ 13 CCO2 . Subsequently four numerical
experiments, each ∼ 3500 years long, were conducted with
varying amplitudes (0.05, 0.1, 0.15, and 0.2 Sv; referred to
as FW0.05, FW0.1, FW0.15, and FW0.2, respectively; Sv
stands for Sverdrup, i.e. 106 m3 s−1 ) of a stepwise, 400year-long freshwater input to the North Atlantic between
45–65◦ N and 60–0◦ W (Fig. 1a). The added freshwater is
not compensated for elsewhere, but it affects surface tracer
concentrations though dilution. Lower salinity and increased
buoyancy of surface waters causes the AMOC to slow down.
Note that these are idealized experiments, designed to examine only how AMOC variations impact the global δ 13 C distribution. Realistic initial conditions for the LGM are currently
not available. Thus, we do not attempt realistic deglacial simulations. However, it is well known that the δ 13 C distribution
of the LGM ocean (Curry and Oppo, 2005; Gebbie, 2014)
Clim. Past, 11, 135–152, 2015
138
A. Schmittner and D. C. Lund: Did AMOC trigger CO2 rise?
ification of the surface (not shown here; see Figs. 5 and 6
and Plate 2 in Schmittner et al., 2007a), deeper mixed layers,
and decreased stratification in the Southern Ocean (Schmittner et al., 2007a) and North Pacific (Saenko et al., 2005),
as illustrated in Fig. 2 by the thickening of isopycnal layers
between 26.8 ≤ σ2 ≤ 27.63.
3.2
Figure 1. Time series of (A) North Atlantic freshwater forcing,
(B) AMOC response, (C) atmospheric CO2 concentrations, and
(D) δ 13 C of atmospheric CO2 (solid, left axis) and global mean
surface ocean δ 13 CDIC (dashed, right axis) for four model simulations (color lines). Symbols in (C) and thick black curve (error
estimates are indicated by thin lines) in (D) show ice core measurements (Marcott et al., 2014, Schmitt et al., 2012) (bottom and right
axes in (C)).
and atmospheric CO2 concentrations (Monnin et al., 2001;
Lourantou et al., 2010; Parrenin et al., 2013; Marcott et al.,
2014) were different from the preindustrial. In order to account for these differences in initial conditions, our data–
model comparison focuses on anomalies rather than absolute
values. Possible sensitivity of the results to initial conditions
is further discussed in the Discussion section below. Selected
model data are available in the supplement to this paper.
3
3.1
Results
Simulated circulation changes
The AMOC reduces in all experiments (Fig. 1b). However,
in FW0.05 and FW0.1 the reduction is reversible, and, after hosing is stopped, the AMOC quickly returns to its initial state. In experiments FW0.15 and FW0.2, on the other
hand, the AMOC collapses permanently (Fig. 2). Reduced
salt input to the deep ocean by North Atlantic Deep Water
(NADW) leads to a freshening of the deep ocean and salinClim. Past, 11, 135–152, 2015
Simulated carbon cycle changes
The effect on atmospheric CO2 in model simulations with
partial and short AMOC reductions (FW0.05 and FW0.1) is
negligible. In contrast, in the simulations with a large and
prolonged AMOC decline (FW0.15 and FW0.2) CO2 starts
to rise about 500 years after the beginning of the hosing. It
continues to increase gradually by ∼ 25 ppm until year 2000,
after which its rate of change slows. The amplitude and rate
of change of the simulated CO2 increase agrees well with
the long-term trend of measurements of HS1 air recovered
from Antarctic ice (Monin et al., 2011; Parrenin et al., 2013;
Marcott et al., 2014), but the model does not reproduce the
rapid increase around 16 250 BP.
The simulated atmospheric CO2 increase in FW0.15 and
FW0.2 is due to a loss of ocean carbon to the atmosphere.
Initially net primary production (NPP) declines within a few
hundred years from 64 to 54 Pg C yr−1 , consistent with
Schmittner (2005; not shown here), which reduces the production of dissolved organic carbon (DOC), whereas dissolved inorganic carbon increases initially until around year
600, after which it starts to decline. By model year 3500
the ocean has lost ∼ 120 Pg C (Fig. 3d) in FW0.15, most of
which (∼ 90 Pg C) is due to DIC and less (∼ 30 Pg C) due to
DOC. The ocean’s DIC loss is caused by a reduced efficiency
of the biological pump as indicated by the large loss of remineralized DIC (∼ 400 Pg C; Fig. 3g), most of which is due to
less organic matter oxidation (DICorg ; Fig. 4), whereas it is
buffered by the increase in preformed DIC due to rising surface ocean DIC and atmospheric CO2 , consistent with previous results and theory (Schmittner and Galbraith, 2008; Ito
and Follows, 2005; Marinov et al., 2008a, b).
3.3
Simulated carbon isotope changes
The loss of biologically sequestered, isotopically light
(δ 13 Corg = −20 ‰) organic carbon increases deep-ocean
δ 13 CDIC by ∼ 0.06 ‰ (Fig. 3f). Accumulation of this isotopically light carbon in the surface ocean and atmosphere
decreases their δ 13 CDIC (by ∼ −0.3 ‰) and δ 13 CCO2 by
∼ −0.25 ‰, respectively (Fig. 1d). Modeled land carbon
storage increases (Fig. 3a) and its average δ 13 CL decreases
(Fig. 3c), implying that land cannot be the cause of the atmospheric changes. The simulated atmospheric δ 13 CCO2 decline in models FW0.15 and FW0.2 is consistent, both in amplitude and the rate of change, with ice core measurements
(Fig. 1d; Schmitt et al., 2012), but the model response may
www.clim-past.net/11/135/2015/
A. Schmittner and D. C. Lund: Did AMOC trigger CO2 rise?
139
Figure 2. Meridional overturning stream function (black contour lines; solid and dashed lines denote negative and positive values, respectively, and clockwise and counterclockwise flow) in the Southern (A, D), Atlantic (B,E), and Indian and Pacific (C, F) oceans at year 0
(averaged from year −1000 to 0) (A, B, C) and 2500 (averaged from year 2000 to 3000) (D, E, F). Three zonally averaged potential density
(σ2 ) isolines (27.63, 27.5, 26.8) are shown as green lines.
depend on boundary and/or initial conditions and this agreement may be fortuitous.
The simulated preindustrial (model year 0; Fig. 5a–c) distribution of δ 13 CDIC in the ocean is characterized by high
values in the surface and deep North Atlantic and low values
in the deep North Pacific, consistent with a previous model
version and observations (Schmittner et al., 2013). Sinking
of isotopically well-equilibrated surface waters with low nutrient and respired carbon content causes high δ 13 CDIC values in the deep North Atlantic, whereas aging and accumulation of isotopically light respired organic matter progressively decreases δ 13 CDIC as deep waters flow into the South
Atlantic and further into the Indian and Pacific oceans. Thus,
the modern interbasin difference in deep water δ 13 CDIC is
caused by the interbasin meridional overturning circulation
(MOC) (Boyle and Keigwin, 1982). Hence, as the AMOC
collapses, the δ 13 CDIC difference between North Atlantic and
North Pacific deep waters is reduced (Fig. 5d–f).
Differences between years 2500 and 0 (Fig. 5g–i) show the
largest δ 13 CDIC decreases at intermediate depths (1–2.5 km)
in the northern North Atlantic. Anomalies decrease further
south, but a pronounced minimum emerges at the depth of
NADW (2–3 km, Fig. 2) in the South Atlantic with positive
www.clim-past.net/11/135/2015/
anomalies below, at the depth of Antarctic Bottom Water, and
above, at the depth of Antarctic Intermediate Water. South
of 40◦ S in the Atlantic as well as in the Indian and Pacific
oceans, δ 13 CDIC increases everywhere below ∼ 500 m due
to reduced export of 13 C-depleted carbon from the photic
zone. The weakening of the biological pump causes surface
ocean δ 13 C to decrease by 0.2–0.4 ‰ in the Indian and Pacific basins, possibly explaining the onset of planktonic δ 13 C
minima on glacial terminations (Spero and Lea, 2002). The
deep-ocean signal dominates the global mean δ 13 CDIC increase of 0.04 ‰ by year 2500 (Fig. 3f). In the North Pacific δ 13 CDIC shows the largest increase at a depth of around
1 km, owing to reduced stratification and intensified intermediate water formation (Saenko et al., 2005), which decreases
the amount of respired carbon and increases remineralized
δ 13 C (δ 13 Crem ; Fig. 6) there. δ 13 Crem increases in most of
the deep Pacific, Indian and Southern oceans due to the loss
of respired carbon, whereas, in the Atlantic, respired carbon accumulates, leading to a decrease in δ 13 Crem . Although
changes in δ 13 Crem dominate the spatial variations of the total δ 13 CDIC changes, preformed δ 13 C (δ 13 Cpre ) variations are
not negligible, particularly in the Atlantic, where they decrease by more than 0.3 ‰.
Clim. Past, 11, 135–152, 2015
140
A. Schmittner and D. C. Lund: Did AMOC trigger CO2 rise?
Figure 3. Simulated changes in global land (left) and ocean (right) carbon inventories (in Pg C; 1 ppm = 2.1 Pg C) and their averaged δ 13 C
(in per mil) in model FW0.15. Changes in (A) land carbon 1CL = 1CV + 1CS (black) are due to vegetation 1CV (green) and soil 1CS
(red) changes. Vegetation is composed of C3 and C4 plants (CV = C3 + C4 ), but C4 plants contribute only a small fraction (B) to the total.
Changes in C4 plant biomass (blue line in A) are negligible comparedPto those in C3 plants (difference
Pbetween green and blue lines).
Panel (C) shows biomass weighted mean δ 13 C of the land δ 13 CL = ( i Cv,i × δ 13 Ci + Cs × δ 13 Cs )/( i Cv,i + Cs ) (black), vegetation
P
P
δ 13 Cv = ( i Cv,i × δ 13 Ci )/( i Cv,i ) (green), and soil δ 13 Cs (red). Ocean carbon changes 1CO = 1DIC + 1DOC +1POC (D, black) are
| {z }
∼0
due to dissolved organic (DOC, blue) and inorganic (DIC, red) carbon and negligible changes in particulate organic carbon (POC, not shown).
Total ocean δ 13 CO = (DIC·δ 13 CDIC +DOC·δ 13 CDOC )/(DIC+DOC) (F, black) is dominated by changes in δ 13 CDIC (red). δ 13 CDOC (blue
line in panel E) changes play only a minor role for 1δ 13 CO , as illustrated by the dashed black line in (F), which was calculated assuming
a constant δ 13 CDOC = −21.5 ‰. However, the relative contribution of DOC to CO decreases by about 10 %, which explains the difference
between the solid red and dashed black lines in (F). DIC changes are further separated into remineralized (DICrem , 1δ 13 Crem , purple) and
preformed (DICpre , 1δ 13 Cpre , light blue) components in (G) and (H), following Schmittner et al. (2014). All anomalies are shown relative
to model year 0, at which absolute numbers are CL = 1785 Pg C, CO = 37 390 Pg C, CDIC = 37 191 Pg C, CDOC = 297 Pg C, CPOC =2 Pg C,
δ 13 CDIC = 0.72 ‰, and δ 13 CDOC = −21.5 ‰.
Table 2. Statistical indices of comparison for the reconstructed
HS1 (15.5–16.5 ka BP) minus LGM (18.5–19.5 ka BP) ocean δ 13 C
changes with those from the model simulations (model years 2000–
3000 mean minus years −1000 to 0 mean): correlation coefficients
(r), root-mean-squared errors (rms), bias (model mean minus observed mean), and the ratio of model over observed standard deviations (rstd). The number of data points is n = 25.
Model
r
rms
bias
rstd
FW0.05
FW0.1
FW0.15
FW0.2
0.76
0.76
0.85
0.85
0.45
0.45
0.49
0.64
0.26
0.26
−0.29
−0.38
0.02
0.03
1.75
2.11
Clim. Past, 11, 135–152, 2015
3.4
Observed carbon isotope changes during HS1
Observations from the North Atlantic show large δ 13 CDIC
decreases early in the deglaciation (Fig. 7a–e; Fig. 8a).
The largest amplitudes (∼ 1 ‰) are found in high-resolution
records from the northern North Atlantic (61◦ N) at intermediate (1.3–1.6 km) depths (Praetorius et al., 2008; Rickaby
and Elderfield, 2005; Thornalley et al., 2010). Further south
and in deeper water, the δ 13 CDIC decrease is smaller (0.4 to
0.7 ‰) (Vidal et al., 1997; Hodell et al., 2010; Zahn et al.,
1997; Skinner and Shackleton, 2004; Labeyrie et al., 2005;
Zahn and Stuber, 2002). Changes simulated at the same locations by model experiments FW0.15 and FW0.2, which
exhibit multimillennial AMOC collapses, are generally similar in amplitude, albeit somewhat larger and in some cases
www.clim-past.net/11/135/2015/
A. Schmittner and D. C. Lund: Did AMOC trigger CO2 rise?
141
Figure 4. Vertical profiles of globally horizontally averaged ocean DIC (top left) and δ 13 C (bottom left) at years 0 (black) and 2500 (red)
of experiment FW0.15. Right panels show changes (year 2500 minus year 0) in DIC = DICpre + DICrem and δ 13 C = δ 13 Cpre + δ 13 Crem
(green) as well as preformed DICpre and remineralized DICrem = DICorg + DICCaCO3 . See Schmittner et al. (2013) for the calculation of
the individual terms. The differences between the blue and green lines are due to changes in preformed DIC and δ 13 C.
earlier. Note that the timing of the rapid δ 13 CDIC decrease in
core NEAP4K is later than in the two nearby cores ODP984
and RAPID-10-1P, presumably because the age model of
NEAP4K is not as well constrained as those from the other
two cores.
Despite similar AMOC evolutions, model FW0.15 shows
smaller amplitudes than model FW0.2, in better agreement
with the reconstructions, due to local effects of the different freshwater forcing on stratification and δ 13 CDIC . The
overall spatial distribution of the observed δ 13 CDIC changes,
with largest amplitudes at intermediate depths in the northern
North Atlantic and decreases further south and in deeper waters, is in best agreement with the results from model FW0.15
(Figs. 7 and 8; Table 2).
A new data set from the Brazil Margin in the South Atlantic (Figs. 7f–k, 9) (Tessin and Lund, 2013; Lund et al.,
2015) shows increasing δ 13 CDIC by 0.2–0.4 ‰ between 1.1
and 1.3 km depth and decreasing δ 13 CDIC by ∼ 0.5 ‰ between 1.6 and 2.1 km depth, whereas deeper in the water
column the data are noisier without a clear trend. Model
FW0.15’s initial δ 13 CDIC values at the Brazil Margin are
higher than the observations mainly for two reasons (Fig. 9).
www.clim-past.net/11/135/2015/
First, the model does not consider the whole ocean lowering of δ 13 CDIC due to the reduction in land carbon during
the LGM, and, second, it does not include the shoaling of
NADW and very low δ 13 CDIC values in South Atlantic bottom waters (Curry and Oppo, 2005; Gebbie, 2014). Thus the
simulated δ 13 CDIC decrease extends deeper than in the observations and shows a substantial reduction below 2.2 km.
However, the reconstructed pattern of opposing δ 13 C signal
between shallow–intermediate and mid-depths agrees well
with the simulated changes due to large AMOC reductions
(Fig. 9). The rapid initial increase at intermediate depths appears to be influenced by two factors. First, there is a reduced return flow of low δ 13 CDIC from the Indian ocean (not
shown). Second, less upwelling (Schmittner et al., 2005) of
low δ 13 CDIC deep water into the upper and surface Southern Ocean leads to a deepening of the high δ 13 CDIC Antarctic Intermediate and Subantarctic Mode waters, which, together with decreased stratification and deeper mixed layers (Schmittner et al., 2007a; Fig. 2), increases δ 13 CDIC by
∼ 0.3 ‰ at 1.2 km depth in all ocean basins at mid-southern
latitudes (Fig. 5g–i).
Clim. Past, 11, 135–152, 2015
142
A. Schmittner and D. C. Lund: Did AMOC trigger CO2 rise?
Figure 5. Zonally averaged distributions of δ 13 CDIC (color shading and black isolines) as a function of latitude and depth simulated by
model FW0.15 in the Atlantic (left), Indian (center) and Pacific (right) ocean basins at model years 0 (A–C) and 2500 (D–F; A–F use top
color scale), and the difference (G–I; bottom color scale). Symbols in bottom panels denote locations of observations shown in Fig. 7.
The simulated δ 13 CDIC increase at 1.2 km depth in the
southwest Pacific (∼ 0.5 ‰) and at 1.6 km depth in the tropical Indian Ocean (∼ 0.3 ‰) agrees well with local reconstructions (Fig. 7p and o), but the simulated changes happen 1.5 ka earlier than in the sediment data. The lack of age
model error estimates for the sediment data currently prevents a more detailed assessment of the simulated temporal
evolution. In deep waters of the Southern and Indian oceans,
the reconstructions are noisy and no clear trend can be identified (Fig. 7l–n). Core W8709A-13PC from the deep eastern
North Pacific (Lund et al., 2011) shows no trend in contrast to
models FW0.15 and FW0.2. More data from the deep North
Pacific are needed in order to better assess model simulations
there.
3.5
Sensitivity to wind changes
The model results discussed above did not include the effects
of wind changes. Winds enter the UVic (University of Victoria) model in three ways:
Clim. Past, 11, 135–152, 2015
1. moisture advection velocities uq determine convergence
of specific humidity and thus precipitation;
2. wind stress τ supplies momentum to the surface ocean
and sea ice;
3. wind speed u modulates the air–sea exchange of heat,
water, and gases (CO2 , O2 ).
Figure 11 shows the annual mean fields derived from the National Center for Environmental Prediction (NCEP) reanalysis (Kalnay et al., 1996) used in the above runs.
In order to test the sensitivity of our results to these variables, we performed three additional simulations, in which
we use anomalies calculated from hosing experiments with
the Oregon State University/University of Victorial (OSUVic) model (bottom panels in Fig. 11). The OSUVic model
includes a fully coupled dynamical atmosphere at T42 resolution (Schmittner et al., 2011), whereas the other components are identical to the UVic model version 2.8 without dynamic vegetation. In response to an AMOC shutdown, OSUVic simulates a large anticyclonic anomaly over the North
www.clim-past.net/11/135/2015/
A. Schmittner and D. C. Lund: Did AMOC trigger CO2 rise?
143
Figure 6. Impact of AMOC collapse on δ 13 Cpre (top) and 1δ 13 Crem (bottom). Zonally averaged changes between year 2500 and year 0
of model run FW0.15 in the Atlantic (left), Indian Ocean (center), and Pacific (right). Note the different color scales and isoline differences
used. For absolute values of δ 13 Cpre and 1δ 13 Crem , see Figs. 6 and 12 in Schmittner et al. (2013).
Atlantic, a cyclonic anomaly over the North Pacific, a southward shift of the ITCZ particularly over the Atlantic, and
a southward shift of Southern Hemisphere westerlies consistent with previous studies (Timmermann et al., 2007; Zhang
and Delworth, 2005; Schmittner et al., 2007b). Note that
the changes in Southern Hemisphere westerlies are generally
less than 10 % of the absolute values of the control simulation
and thus much smaller than those used by Lee et al. (2011).
The OSUVic wind anomalies are applied at model year
400 of the FW0.15 simulation (blue dashed line in panel A of
Fig. 12). The wind changes have only a modest impact on
simulated carbon cycle and isotope distributions (Fig. 12).
The largest effect is due to changes in moisture advection velocities, which lead to a rapid decrease in vegetation and soil
carbon around year 400. This causes a rapid CO2 increase
by a few parts per million and a rapid decrease of δ 13 CCO2
by a few hundredths of a per mil. It also delays the oceanic
carbon loss by a few hundred years. However, the multimillennial response and our conclusions are not impacted much
by the wind changes.
www.clim-past.net/11/135/2015/
4
Discussion
Taken together, the changes in the sedimentary deep ocean
δ 13 CDIC reconstructions from the LGM to the late HS1 are
most consistent with simulations of a severe and prolonged,
multimillennial AMOC reduction. Model FW0.15 fits the reconstructions best, as indicated by a high correlation coefficient (rFW0.15 = 0.85; Fig. 10; Table 2), a root-mean-squared
error (rmsFW0.15 = 0.49) just slightly larger than for models
FW0.05 and FW0.1, and a standard deviation closest to the
observations (rstdFW0.15 = 1.75). However, δ 13 CDIC changes
in the North Atlantic are about twice as large in the model
than in the reconstructions, which causes the standard deviation in model FW0.15 to be 75 % larger than that of the
observations. One reason for this discrepancy may be that
AMOC changes during HS1 were smaller than those simulated here (Gherardi et al., 2009; Lund et al., 2015). A second reason could be the mismatch in initial conditions. If
the LGM AMOC was weaker and shallower than in the
model’s preindustrial simulation, as indicated by a number of
Clim. Past, 11, 135–152, 2015
144
A. Schmittner and D. C. Lund: Did AMOC trigger CO2 rise?
Figure 7. Comparison of simulated (lines as in Fig. 1; left and top axes) and observed (symbols as in Fig. 5; right and bottom axes) δ 13 CDIC
time series in the North Atlantic (A–E), South Atlantic (F–L), Indian (M–O), and Pacific (P) oceans. If no numbers are given on the right
axis, the scale is identical to the left axis. If numbers are given on the right axis, the scale is different but the range (max–min) is identical to
that of the left axis. Note that different ranges of the vertical axis are used for the different columns, whereas, within each column they are
the same.
reconstructions (Lynch-Stieglitz et al., 2007; Gebbie, 2014),
the model would overestimate changes in volume fluxes and
perhaps carbon isotopes even if a complete AMOC collapse
did occur during HS1. A third reason may be biases in the
foraminifera-based δ 13 CDIC reconstructions, e.g., due to a
dependency on carbonate ion concentrations (Spero et al.,
1997) or dampened records of the actual δ 13 CDIC changes
by smoothing and averaging due to bioturbation and/or age
model errors. The former would affect particularly regions
with large changes in carbonate ion concentrations such as
the North Atlantic in the case of an AMOC collapse and the
latter may affect particularly low-resolution sediment cores
as indicated by reduced agreement with lower-resolution data
from a previous study (Sarnthein et al., 1994) (rFW0.15 =
0.80; rmsFW0.15 = 0.60; Fig. 10). Resolving the likelihood
Clim. Past, 11, 135–152, 2015
of these different possibilities will be an important task for
future research.
Due to these issues our results can only be regarded as
semiquantitative. Qualitatively, they support the interpretation of McManus et al.(2004) of the 231 Pa / 230 Th record, but
they cannot rule out the possibility of a reduced but not necessarily collapsed HS1 AMOC based on analyses of Atlantic
carbon and oxygen isotope data (Lund et al., 2015; Oppo and
Curry, 2015). More work is needed for a truly quantitative reconstruction of early deglacial AMOC changes.
Our simulations suggest that an AMOC decline during
HS1 could have caused the observed rise in atmospheric CO2
and the decrease in δ 13 CCO2 by modulating the global efficiency of the ocean’s biological pump. This is in contrast
with ideas that invoke Southern Ocean (Toggweiler et al.,
www.clim-past.net/11/135/2015/
A. Schmittner and D. C. Lund: Did AMOC trigger CO2 rise?
145
Figure 8. Heinrich Stadial 1 (16.5–15.5 ka BP) minus LGM (19.5–18.5 ka BP) difference in δ 13 CDIC in the Atlantic (left) and Indian and
Pacific (right) basins from our high-resolution synthesis of reconstructions averaged on the model grid (top) compared to model FW0.15
results (bottom; averages of model years 2000 to 3000 minus averages of model years −1000 to 0.).
Figure 9. Simulated (solid; model FW0.15) and observed (dashed)
vertical profiles of δ 13 CDIC at the Brazil Margin in the South Atlantic before (black) and after (red) the AMOC collapse. Observations show 1 ka averages of smoothed (2 ka) data. Results for model
FW0.2 are very similar to FW0.15 (not shown). However, models
FW0.05 and FW0.1 show almost no changes from their initial (year
−500) distribution (not shown).
www.clim-past.net/11/135/2015/
Figure 10. HS1 minus LGM change in δ 13 C from Sarnthein
et al. (1994; blue) our high-resolution compilation (red) vs. changes
between years −500 and 2500 (1000-year centered averages) predicted by model experiment FW0.15 at the same locations. The diagonal 1 : 1 line corresponds to a perfect match.
Clim. Past, 11, 135–152, 2015
146
A. Schmittner and D. C. Lund: Did AMOC trigger CO2 rise?
1111111111111111111111111111111111
111 1 11 111
1
1
1
11 1
11
1
11
111111111111111111111 1 1 1
1
1
1
1
1
1
1
1
1
1
1
1
1
1
1
1
1
1
1
1
1
1
1
11
11
11
11
Figure 11. (A) Annual mean wind stress τ (arrows) and wind speed u (color) fields used in the control run of the UVic model. (B) Changes
in annual mean wind stress 1τ and wind speed 1u derived from a hosing simulation with the OSUVic model. (C) and (D) as (A) and (B)
but for moisture advection velocities uq (arrows) and precipitation (color). Note the differences in scales between the top and bottom panels.
Figure 12. Sensitivity to changes in winds. Experiment FW0.15 (red) is repeated with changes in moisture advection velocities uq (light
blue), uq plus wind stress τ (green), and uq + τ plus wind speed u (dark blue) calculated from the OSUVic model. See Fig. 11 and text for
more details.
Clim. Past, 11, 135–152, 2015
www.clim-past.net/11/135/2015/
A. Schmittner and D. C. Lund: Did AMOC trigger CO2 rise?
147
Figure 13. Simulated average preindustrial land δ 13 C distribution (model year 0). Each pool’s (five vegetation plant functional types, PFTs,
and one soil, S, carbon compartment) δ 13 C value was weighted by its mass in calculating the average as explained in the caption for Fig. 2.
Desert regions with negligible vegetation carbon (< 10 g m−2 ) are shown in white.
2006; Anderson et al., 2009; Tschumi et al., 2011; Lee et al.,
2011) and/or North Pacific (Menviel et al., 2014) mechanisms for the early deglacial CO2 rise. However, as discussed above, one possible explanation for the overestimated
North Atlantic δ 13 CDIC changes in the model is that the early
deglacial AMOC changes were smaller. If this was the case,
the model could possibly also overestimate the effects on atmospheric CO2 and δ 13 CCO2 and the agreement with the ice
core observations could be fortuitous.
A critical test of our hypothesis that the AMOC reduction caused a decrease in the efficiency of the biological
pump may come from additional δ 13 CDIC reconstructions
from the deep Pacific and Indian oceans, which hold most
of the ocean’s carbon and where the model predicts δ 13 CDIC
to increase but where few sedimentary data are currently
available (Figs. 4 and 7). Indeed, our mechanism relies on
changes in the inflow of (low preformed nutrient) Atlantic
deep water into the Southern, Indian, and Pacific oceans.
Currently it is not known if this inflow was weaker during
the LGM. Gebbie (2014) suggests a similar AMOC to the
modern one. Kwon et al. (2012) suggest an even stronger influence of North Atlantic water in the global deep ocean at
the LGM. These findings may indicate that our simulations
with modern initial conditions may also be applicable to the
early deglacial, but a solid quantitative assessment remains to
be performed. Such an assessment requires simulations with
more realistic initial conditions, which will be an important
task for future work.
www.clim-past.net/11/135/2015/
Our wind stress experiments show much smaller impacts
on the carbon cycle than those caused by the buoyancy forcing and suggest only a minor effect on the overall rise in atmospheric CO2 during HS1, but they are subject to the same
caveats as discussed above with respect to initial conditions.
However, changes in tropical winds associated with ITCZ
shifts impact the hydrological cycle and terrestrial carbon
and cause a jump of CO2 by a few parts per million (Fig. 12).
Although this is much smaller than the 12 ppm jump recently
observed around 16 250 years BP by Marcott et al. (2014), it
suggests a mechanism that could explain rapid increases in
atmospheric CO2 .
We have not discussed the later parts of the deglacial
period such as the Bølling–Allerød (15–13 ka BP), during
which the AMOC was presumably reinvigorated (McManus
et al. 2004). In our model this would lead to a decrease in
atmospheric CO2 , whereas ice core data show stable concentrations (Monin et al., 2011; Parrenin et al., 2013; Marcott et al. 2014), suggesting that an additional process counteracted the AMOC effect. We speculate that this process
may be related to a deepening of the AMOC beyond LGM
depths and the erosion of the deep South Atlantic reservoir of
respired carbon, consistent with recent reconstructions that
show that δ 13 CDIC decreases there later in the deglaciation
(Lund et al., 2015).
Clim. Past, 11, 135–152, 2015
148
5
A. Schmittner and D. C. Lund: Did AMOC trigger CO2 rise?
Conclusions
A comparison of distributed deep-ocean δ 13 CDIC reconstructions with our model simulations suggests that, during HS1,
the AMOC was substantially reduced for several thousand
years. However, due to remaining model–sediment-data differences and a mismatch in initial conditions, we cannot assess the likelihood of a partial AMOC reduction versus a
complete shutdown.
Agreement of simulated atmospheric CO2 and δ 13 CCO2
with ice core data, if not fortuitous, supports our hypothesis of an AMOC-induced reduction of the oceans’ biological
pump during HS1. However, this idea needs further testing
with more realistic simulations in the future, improving initial conditions and transient forcing.
AMOC-induced wind changes simulated in a coupled
ocean–atmosphere model only have a small impact on the
carbon cycle and isotope distributions in our carbon cycle
model, suggesting that wind changes were less important
than previously thought in controlling atmospheric CO2 and
δ 13 CCO2 during HS1. However, effects of wind shifts on the
hydrological cycle and terrestrial carbon could explain some
of the recently observed rapid CO2 increases (Marcott et al.
2014).
The University of Victoria Earth System Climate Model
(UVic ESCM) (Weaver et al., 2001), is used in version 2.9
(Eby et al., 2009). It consists of a coarse-resolution (1.8◦ ×
3.6◦ , 19 vertical layers) ocean general circulation model coupled to a one-layer atmospheric energy–moisture balance
model and a dynamic thermodynamic sea ice model, both
at the same horizontal resolution. The model is forced with
seasonally varying solar irradiance at the top of the atmosphere, cloud albedo, wind stress, wind speed, and moisture
advection velocities. This seasonal forcing does not change
between different years. Atmospheric CO2 and δ 13 C are calculated in a single box assuming rapid mixing.
Description of land carbon isotopes (δ 13 C and
δ 14 C) model
The land carbon isotopes model has not been published before. Therefore, we provide a description and evaluation
here. It is based on TRIFFID, the Top-down Representation of Interactive Foliage and Flora Including Dymamics
dynamic vegetation model by Cox (2001), as modified by
Meissner et al. (2003) and Matthews et al. (2004), which
solves prognostic equations for total vegetation carbon density Cv = 12 Cv + 13 Cv and fractional coverage vi ∈ (0, 1) of
five plant functional types (PFTs; i = 1, . . ., 5):
∂
Cv,i νi = νi 5i − νi 3i ,
∂t
Clim. Past, 11, 135–152, 2015
We added prognostic equations for the heavy carbon isotopes
13 C and 14 C to both vegetation,
∂ 13
13
13
Cv,i νi = γ5,i
νi 5i − γ3,i
νi 3i ,
(A3)
∂t
and soil,
X
∂ 13
13
Cs =
γ3,i
3i − γR13 Rs ,
(A4)
∂t
i
∂ 14
14
14
νi 3i − κνi 14 Cv,i ,
(A5)
νi 5i − γ3,i
Cv,i νi = γ5,i
∂t
and
X
∂ 14
Cs =
λ3,i 3i − γR14 Rs − κ 14 Cs, i ,
(A6)
∂t
i
where fractionation during photosynthesis is indicated by
factors
γ513 =
13
β5
(A7)
13
1 + β5
and
Appendix A: Model description
A1
where 5i is net primary production (NPP) and 3i is litter
production, which enters the soil carbon pool. Total soil carbon density is calculated according to
X
∂
Cs =
3i − Rs .
(A2)
∂t
i
(A1)
13
13 13
β5
= α5
RA ,
(A8)
where
13
=
RA
13 C
CO2
12 C
CO2
(A9)
is the heavy to light isotope ratio of atmospheric CO2 .
Fractionation factors are different for C3 and C4 plants:
0.979, for C3
13
αNPP,i =
,
(A10)
0.993, for C4
which corresponds to a fractionation of ε 13 = (1 − α 13 ) =
−7 ‰ for C4 plants and ε 13 = −21 ‰ for C3 plants
(O’Leary, 1988).
No fractionation occurs during litter production or respiration:
γ313 =
13
β3
13
1 + β3
13
13
β3
= Rv,i
=
γR13 =
13 C
v
,
Cv − 13 Cv
βR13
1 + βR13
βR13 = Rs13 =
,
,
13 C
s
.
Cs − 13 Cs
(A11)
(A12)
(A13)
(A14)
For radiocarbon Eqs. (A5) and (A6), radioactive decay is
considered though κ = 1.210×10⁻⁴ a −1 , which corresponds
www.clim-past.net/11/135/2015/
A. Schmittner and D. C. Lund: Did AMOC trigger CO2 rise?
to a half life of 5730 years, and twice the fractionation during
NPP is assumed with respect to δ 13 C ε 14 = 2ε 13 , such that
0.958, for C3
14
.
(A15)
αNPP,i =
0.986, for C4
The simulated spatial distribution of average δ 13 C (Fig. 13)
varies from −13 ‰ in regions dominated by C4 grasses such
as North Africa and Australia to −27 ‰ in most other regions, which are dominated by C3 plants, due to the differences in fractionation factors for C3 and C4 plants used in the
model. This distribution is broadly consistent with previous
independent estimates (Still and Powell, 2010; Powell et al.,
2012).
A2
149
In order to convert isotope ratios to delta values,
δ 13 C = (R/Rstd − 1),
(A19)
13 =
we now use the conventional standard ratio Rstd
13 = 1, which was used in Schmittner
0.0112372 instead of Rstd
14 = 1.17 × 10⁻¹² is used.
et al. (2013). For radiocarbon Rstd
MOBI 1.4 includes dissolved organic carbon (DOC) cycling described in Somes et al. (2014). The close agreement
of the preindustrial δ 13 CDIC distributions with model FeL of
Schmittner et al. (2013) suggests that none of the changes described above have a major impact on the simulated δ 13 CDIC .
The Supplement related to this article is available online
at doi:10.5194/cp-11-135-2015-supplement.
Description of ocean carbon isotope model
We use the Model of Ocean Biogeochemistry and Isotopes
(MOBI) version 1.4. The ocean carbon isotope component
is described in detail in Schmittner et al. (2013). Here we
only describe differences with respect to that publication.
The physical UVic model version was updated to version
2.9 (Schmittner et al. (2013) used 2.8). The ocean ecosystem
model has been modified by changing zooplankton grazing,
using a slightly different approach to consider iron limitation of phytoplankton growth as described in detail in Keller
et al. (2012). This model gives very similar results to model
FeL (iron limitation), which uses a simple mask to consider iron limitation of phytoplankton growth, in Schmittner
et al. (2013).
The implementation of the carbon isotope equations has
been changed from the “alpha” formulation to the “beta” formulation, courtesy of Christopher Somes. In the alpha formulation, the change in the heavy (rare) isotope carbon density
13 C (in mol C m−3 ) of the product (e.g., phytoplankton) of a
given process (e.g., photosynthesis),
∂ 13
∂
∂
C = αR 13 12 C = αR 13 C,
∂t
∂t
∂t
(A16)
is calculated as the product of the total carbon change ∂C/∂t
times the fractionation factor α for that process times the
heavy to light isotope ratio of the source (e.g., sea water DIC)
R 13 =13 C/12 C. This formulation assumes total carbon,
C = 12 C + 13 C ≈ 12 C,
(A17)
is equal to 12 C, which is a good approximation since 13 C is
usually 2 orders of magnitude smaller than 12 C.
However, the assumption (Eq. 17) can be avoided by using
the beta formulation, in which the heavy isotope change is
calculated according to
β 13 ∂
∂ 13
C=
C,
∂t
1 + β 13 ∂t
where β 13 = α 13 R 13 .
www.clim-past.net/11/135/2015/
(A18)
Acknowledgements. A. Schmittner has been supported by
the National Science Foundation’s Marine Geology and Geophysics program grant OCE-1131834. Most reconstructions
listed in Table 2 were extracted from the National Oceanic
and Atmospheric Administration’s (NOAA) National Climatic
Data Center (NCDC) Paleoclimatology Program Database
(http://www.ncdc.noaa.gov/data-access/paleoclimatology-data).
We are grateful to all data generators who make their data available
on public databases. We are also thankful to Claire Waelbroeck,
Rainer Zahn, and Ros Rickaby for generously sharing data used in
this study. Thanks to Christopher Somes for rewriting the carbon
isotope model in the beta formulation.
Edited by: H. Fischer
References
Anderson, R. and Hayes, C.: New insights into gochemical proxies from GEOTRACES, 11th International Conference on Paleoceanography, Sitges, Spain, 2013.
Anderson, R. F., Ali, S., Bradtmiller, L. I., Nielsen, S. H. H.,
Fleisher, M. Q., Anderson, B. E., and Burckle, L. H.: Winddriven upwelling in the Southern Ocean and the deglacial rise
in atmospheric CO2 , Science, 323, 1443–1448, 2009.
Bard, E., Rostek, F., Turon, J-L., and Gendreau, S.: Hydrological
impact of Heinrich Events in the subtropical northeast Atlantic,
Science, 289, 1321–1324, 2010.
Benway, H. M., McManus, J. F., Oppo, D. W., and Cullen, J. L.: Hydrographic changes in the eastern sub polar North Atlantic during
the last deglaciation, Quaternary Sci. Rev., 29, 3336–3345, 2010.
Blunier, T., Chappellaz, J., Schwander, J., Dällenbach, A.,
Staffer, B., Stocker, T. F., Raynaud, D., Jouzel, J., Clausen, H. B.,
Hammer, C. U., and Johnsen, S. J.: Asynchrony of Antarctic and
Greenland climate change during the last glacial period, Nature,
394, 739–743, 1998.
Boyle, E. A. and Keigwin, L. D.: Deep circulation of the North Atlantic over the last 200 000 years: Geochemical evidence, Science, 218, 784–787, 1982.
Bozbiyik, A., Steinacher, M., Joos, F., Stocker, T. F., and Menviel, L.: Fingerprints of changes in the terrestrial carbon cycle
Clim. Past, 11, 135–152, 2015
150
in response to large reorganizations in ocean circulation, Clim.
Past, 7, 319–338, doi:10.5194/cp-7-319-2011, 2011.
Broecker, W. S., Peteet, D. M., and Rind, D.: Does the ocean–
atmosphere system have more than one stable mode of operation?, Nature, 315, 21–26, 1985.
Charles, C. D., Lynch-Stieglitz, J., Ninnemann, U. S., and Fairbanks, R. G.: Climate connections between the hemisphere revealed by deep sea sediment core ice core correlations, Earth
Planet. Sc. Lett., 142, 19–27, 1996.
Clark, P. U., McCabe, A. M., Mix, A. C., and Weaver, A. J.: Rapid
rise of sea level 19 000 years ago and its global implications, Science, 304, 1141–1144, doi:10.1126/Science.1094449, 2004.
Cox, P.: Description of the “TRIFFID” Dynamic Global Vegetation
Model, Hadley Center, Technical Note 24, 1–16, 2001.
Crowley, T. J.: North Atlantic Deep Water cools the southern hemisphere, Paleoceanography, 7, 489–497, 1992.
Curry, W. B. and Oppo, D. W.: Glacial water mass geometry and the distribution of delta C-13 of Sigma CO2 in
the western Atlantic Ocean, Paleoceanography, 20, PA1017,
doi:10.1029/2004PA001021, 2005.
Denton, G., Broecker, W. S., and Alley, R. B.: The mystery invervall
17.5 to 14.5 kyr ago, PAGES News, 14, 14–16, 2006.
Denton, G. H., Anderson, R. F., Toggweiler, J. R., Edwards, R. L.,
Schaefer, J. M., and Putnam, A. E.: The last glacial termination,
Science, 328, 1652–1656, 2010.
Eby, M., Zickfeld, K., Montenegro, A., Archer, D., Meissner, K. J.,
and Weaver, A. J.: Lifetime of anthropogenic climate change:
millennial time scales of potential CO2 and surface temperature
perturbations, J. Climate, 22, 2501–2511, 2009.
EPICA community members: One-to-one coupling of glacial climate variability in Greenland and Antarctica, Nature, 444, 195–
198, 2006.
Gebbie, G.: How much did glacial North Atlantic water shoal?, Paleoceanography, 29, 190–209, 2014.
Gherardi, J., Labeyrie, L., Nave, S., Francois, R., McManus, J.,
and Cortijo, E.: Glacial-interglacial circulation changes
inferred from 231 Pa/230 Th, Paleoceanogr., 24, PA2204,
doi:10.1029/2008PA001696, 2009.
He, F., Shakun, J. D., Clark, P. U., Carlson, A. E., Liu, Z., OttoBliesner, B. L., and Kutzbach, J. E.: Northern Hemisphere forcing of Southern Hemisphere climate during the last deglaciation,
Nature, 494, 81–85, 2013.
Hodell, D. A., Evans, H. F., Channell, J. E. T., and Curtis, J. H.:
Phase relationships of North Atlantic ice-rafted debris and
surface-deep climate proxies during the last glacial period, Quaternary Sci. Rev., 29, 3875–3886, 2010.
Hoffman, J., and Lund, D. C.: Refining the stable isotope
budget for Antarctic Bottom Water: New results from the
abyssal southwestern Atlantic, Paleoceanogr., 27, PA1213,
doi:10.1029/2011PA002216, 2012.
Ito, T. and Follows, M. J.: Preformed phosphate, soft tissue pump
and atmospheric CO2 , J. Mar. Res., 63, 813–839, 2005.
Jung, S. J. A., Kroon, D., Ganssen, G., Peeters, F., and
Ganeshram, R.: Enhanced Arabian Sea intermediate water flow
during glacial North Atlantic cold phases, Earth Planet. Sc. Lett.,
280, 220–228, 2009.
Kalnay, E., Kanamitsu, M., Kistler, R., Collins, W., Deaven, D.,
Gandin, L., Iredell, M., Saha, S., White, G., Woollen, J.,
Zhu, Y., Chelliah, M., Ebisuzaki, W., Higgins, W., Janowiak, J.,
Clim. Past, 11, 135–152, 2015
A. Schmittner and D. C. Lund: Did AMOC trigger CO2 rise?
Mo, K. C., Ropelewski, C., Wang, J., Leetmaa, A., Reynolds, R.,
Jenne, R., and Joseph, D.: The NCEP/NCAR 40 year reanalysis
project, B. Am. Meteorol. Soc., 77, 437–471, 1996.
Keigwin, L. D. and Boyle, E. A.: Did North Atlantic overturning halt 17,000 years ago?, Paleoceanography, 23, PA1101,
doi:10.1029/2007PA001500, 2008.
Keller, D. P., Oschlies, A., and Eby, M.: A new marine ecosystem model for the University of Victoria Earth System Climate
Model, Geosci. Model Dev., 5, 1195–1220, doi:10.5194/gmd-51195-2012, 2012.
Köhler, P., Joos, F., Gerber, S., and Knutti, R.: Simulated changes
in vegetation distribution, land carbon storage, and atmospheric
CO2 in response to a collapse of the North Atlantic thermohaline
circulation, Clim. Dyn., 25, 689–708, 2005.
Kurahashi-Nakamura, T., Losch, M., and Paul, A.: Can sparse proxy
data constrain the strength of the Atlantic meridional overturning
circulation?, Geosci. Model Dev., 7, 419–432, doi:10.5194/gmd7-419-2014, 2014.
Kwon, E. Y., Hein, M. P., Sigman, D. M., Galbraith, E. D.,
Sarmiento, J. L., and Toggweiler, J. .R.: North Atlantic ventilation of ”southern-sourced” deep water, Paleoceanography, 27,
PA2208, doi:10.1029/2011PA002211, 2012.
Labeyrie, L., Waelbroeck, C., Cortijo, E., Michel, E., and Duplessy, J. C.: Changes in deep water hydrology during the Last
Deglaciation, CR Geosci., 337, 919–927, 2005.
Lourantou, A., Lavric, J. V., Kohler, P., Barnola, J. M., Paillard, D.,
Michel, E., Raynaud, D., and Chappellaz, J.: Constraint of the
CO2 rise by new atmospheric carbon isotopic measurements during the last deglaciation, Global Biogeochem Cy, 24, GB2015,
doi:10.1029/2009gb003545, 2010.
Lund, D. C., Tessin, A. C., Hoffman, J. L., and Schmittner, A.:
Southwest Atlantic watermass evolution during the last deglaciation, Paleoceanography, in review, 2015.
Lund, D. C., Mix, A. C., and Southon, J.: Increased ventilation age
of the deep northeast Pacific Ocean during the last deglaciation,
Nat. Geosci., 4, 771–774, 2011.
Lynch-Stieglitz, J., Adkins, J. F., Curry, W. B., Dokken, T.,
Hall, I. R., Herguera, J. C., Hirschi, J. J. M., Ivanova, E. V.,
Kissel, C., Marchal, O., Marchitto, T. M., McCave, I. N., McManus, J. F., Mulitza, S., Ninnemann, U., Peeters, F., Yu, E. F.,
and Zahn, R.: Atlantic meridional overturning circulation during
the Last Glacial Maximum, Science, 316, 66–69, 2007.
Lynch-Stieglitz, J., Schmidt, M. W., Henry, L. G. Curry, W. B.,
Skinner, L. C., Mulitza, S., Zhang, R., and Chang, P.: Muted
change in Atlantic overturning circulation over some glacialaged Heinrich events, Nature Geosci., 7, 144–150, 2014.
Marchal, O., Stocker, T. F., and Joos, F.: Impact of oceanic reorganizations on the ocean carbon cycle and atmospheric carbon
dioxide content, Paleoceanography, 13, 225–244, 1998.
Marchal, O., Stocker, T. F., Joos, F., Indermühle, A., Blunier, T., and
Tschumi, J.: Modeling the concentration of atmospheric CO2
during the Younger Dryas climate event, Climate Dynamics, 15,
341–354, 1999.
Marcott, S., A., Bauska, T., K., Buizert, C., Steig, E., J.,
Rosen, J., L., Cuffey, K., M., Fudge, T., J., Severinghaus, J., P.,
Ahn, J., Kalk, M., L., McConnell, J., R., Sowers, T., Taylor, K., C., White, J., W., C., Brook, E., J.: Centennial-scale
changes in the global carbon cycle during the last deglaciation,
Nature, 514, 616–619, 2014.
www.clim-past.net/11/135/2015/
A. Schmittner and D. C. Lund: Did AMOC trigger CO2 rise?
Marinov, I., Follows, M., Gnanadesikan, A., Sarmiento, J. L.,
and Slater, R. D.: How does ocean biology affect atmospheric
pCO2 ?, Theory and models, J. Geophys. Res., 113, C07032,
doi:10.1029/2007jc004598, 2008a.
Marinov, I., Gnanadesikan, A., Sarmiento, J. L., Toggweiler, J. R.,
Follows, M., and Mignone, B. K.: Impact of oceanic circulation on biological carbon storage in the ocean and atmospheric pCO2 , Global Biogeochem. Cy., 22, GB3007,
doi:10.1029/2007GB002958, 2008b.
Matthews, H. D., Weaver, A. J., Meissner, K. J., Gillett, N. P.,
and Eby, M.: Natural and anthropogenic climate change: incorporating historical land cover change, vegetation dynamics and the global carbon cycle, Clim. Dynam., 22, 461–479,
doi:10.1007/s00382-004-0392-2, 2004.
McManus, J. F., Francois, R., Gherardi, J. M., Keigwin, L. D.,
and Brown-Leger, S.: Collapse and rapid resumption of Atlantic
meridional circulation linked to deglacial climate changes, Nature, 428, 834–837, 2004.
Meissner, K. J., Weaver, A. J., Matthews, H. D., and Cox, P. M.:
The role of land surface dynamics in glacial inception: a study
with the UVic Earth System Model, Clim. Dynam., 21, 515–537,
doi:10.1007/S00382-003-0352-2, 2003.
Menviel, L., Timmermann, A., Mouchet, A., and Timm, O.:
Meridional reorganizations of marine and terrestrial productivity during Heinrich events, Paleoceanography, 23, PA1203,
doi:10.1029/2007pa001445, 2008.
Menviel, L., Joos, F., and Ritz, S. P.: Simulating atmospheric CO2 ,
13 C and the marine carbon cycle during the Last GlacialeInterglacial cycle: possible role for a deepening of the mean remineralization depth and an increase in the oceanic nutrient inventory,
Quaternary Sci. Rev., 56, 46–68, 2012.
Menviel, L., England, M. H., Meissner, K. J., Mouchet, A., and
Yu, J.: Atlantic-Pacific seesaw and its role in outgassing CO2
during Heinrich events, Paleoceanography, 29, 58–70, 2014.
Mix, A. C., Lund, D. C., Pisias, N. G., Boden, P., Bornmalm, L.,
Lyle, M., and Pike, J.: Rapid climate oscillations in the Northeast
Pacific during the last deglaciation reflect northern and southern
sources, in: Mechanisms of Global Climate Change at Millennial
Time Scales, edited by: Clark, P., Webb, R. S., and Keigwin, L.
D., Geophysical Monograph Series, 112, American Geophysical
Union, Washington DC, 127–148, 1999.
Monnin, E., Indermühle, A., Dällenbach, A., Flückiger, J., Stauffer, B., Stocker, T. F., Raynaud, D., and Barnola, J.-M.: Atmospheric CO2 concentrations over the Last Glacial Termination,
Science, 291, 112–114, 2001.
Obata, A.: Climate-carbon cycle model response to Freshwater discharge into the North Atlantic, J. Climate, 20, 5962–5976, 2007.
O’Leary, M. H.: Carbon isotopes in photosynthesis, Bioscience, 38,
328–336, 1988.
Oppo, D. W. and Curry, W. B.: What can benthic δ 13 C and δ 18 O
data tell us about the Atlantic circulation during Heinrich Stadial
1?, Paleoceanography, in review, 2015.
Pahnke, K. and Zahn, R.: Southern Hemisphere water mass conversion linked with North Atlantic climate variability, Science, 307,
1741–1746, 2005.
Parrenin, F., Masson-Delmotte, V., Köhler, P., Raynaud, D., Paillard, D., Schwander, J., Barbante, C., Landais, A., Wegner, A.,
and Jouzel, J.: Synchronous change of atmospheric CO2 and
www.clim-past.net/11/135/2015/
151
Antarctic temperature during the last deglacial warming, Science, 339, 1060–1063, 2013.
Peck, V. L., Hall, I. R., Zahn, R., and Scourse, J. D.: Progressive reduction in NE Atlantic intermediate water ventilation prior to Heinrich events: Response to NW European ice
sheet instabilities?, Geochem. Geophys. Geosyst., 8, Q01N10,
doi:10.1029/2006GC001321, 2005.
Petit, J. R., Jouzel, J., Raynaud, D., Barkov, N. I., Barnola, J. M.,
Basile, I., Bender, M., Chappellaz, J., Davis, M., Delaygue, G.,
Delmotte, M., Kotlyakov, V. M., Legrand, M., Lipenkov, V. Y.,
Lorius, C., Pepin, L., Ritz, C., Saltzman, E., and Stievenard, M.:
Climate and atmospheric history of the past 420 000 years from
the Vostok ice core, Antarctica, Nature, 399, 429–436, 1999.
Powell, R. L., Yoo, E.-H., and Still, C. J.: Vegetation and soil
carbon-13 isoscapes for South America: integrating remote sensing and ecosystem isotope measurements, Ecosphere, 3, art109,
doi:10.1890/ES12-00162.1, 2012.
Praetorius, S. K., McManus, J. F., Oppo, D. W., and Curry, W. B.:
Episodic reductions in bottom-water currents since the last ice
age, Nat. Geosci., 1, 449–452, 2008.
Rickaby, R. E. M., and Elderfield, H.: Evidence from the highlatitude North Atlantic for variations in Antarctic intermediate water flow during the last deglaciation, Geochem. Geophy.
Geosy., 6, Q05001, doi:10.1029/2004GC000858, 2005.
Saenko, O., Schmittner, A., and Weaver, A. J.: The Atlantic–Pacific
Seesaw, J. Climate, 17, 2033–2038, 2004.
Sarnthein, M., Winn, K., Jung, S. J., Duplessy, J. C., Labeyrie, L.,
Erlenkeuser, H., and Ganssen, G.: Changes in east Atlantic deepwater circulation over the last 30 000 years: eight time slice reconstructions, Paleoceanography, 9, 209–267, 1994.
Schmitt, J., Schneider, R., Elsig, J., Leuenberger, D., Lourantou, A., Chappellaz, J., Köhler, P., Joos, F., Stocker, T. F., Leuenberger, M., and Fischer, H.: Carbon isotope constraints on the
deglacial CO2 rise from ice cores, Science, 336, 711–714, 2012.
Schmittner, A., Saenko, O. A., and Weaver, A. J.: Coupling of the
hemispheres in observations and simulations of glacial climate
change, Quaternary Sci. Rev., 22, 659–671, 2003.
Schmittner, A.: Decline of the marine ecosystem caused by a reduction in the Atlantic overturning circulation, Nature, 434, 628–
633, 2005.
Schmittner, A. and Galbraith, E. D.: Glacial greenhouse-gas fluctuations controlled by ocean circulation changes, Nature, 456,
373–376, 2008.
Schmittner, A., Brook, E. J., and Ahn, J.: Impact of the ocean’s
overturning circulation on atmospheric CO2 , in: Ocean Circulation: Mechanisms and Impacts, edited by: Schmittner, A., Chiang, J. C. H., and Hemming, S. R., Geophysical Monograph Series, 173, American Geophysical Union, Washington DC, 315–
334, 2007a.
Schmittner, A., Galbraith, E. D., Hostetler, S. W., Pedersen, T. F.,
and Zhang, R.: Large fluctuations of dissolved oxygen in the Indian and Pacific oceans during Dansgaard-Oeschger oscillations
caused by variations of North Atlantic Deep Water subduction,
Paleoceanography, 22, PA3207, doi:10.1029/2006PA001384,
2007b.
Schmittner, A., Silva, T. A., Fraedrich, K., Kirk, E., and Lunkeit, F.:
Effects of mountains and ice sheets on global ocean circulation,
J. Climate, 24, 2814–2829, 2011.
Clim. Past, 11, 135–152, 2015
152
Schmittner, A., Gruber, N., Mix, A. C., Key, R. M., Tagliabue, A.,
and Westberry, T. K.: Biology and air–sea gas exchange controls
on the distribution of carbon isotope ratios (δ 13 C) in the ocean,
Biogeosciences, 10, 5793–5816, doi:10.5194/bg-10-5793-2013,
2013.
Scholze, M., Knorr, W., and Heimann, M.: Modelling terrestrial
vegetation dynamics and carbon cycling for an abrupt climatic
change event, The Holocene, 13, 327–333, 2003.
Shakun, J. D., Clark, P. U., He, F., Marcott, S. A., Mix, A. C.,
Liu, Z. Y., Otto-Bliesner, B., Schmittner, A., and Bard, E.: Global
warming preceded by increasing carbon dioxide concentrations
during the last deglaciation, Nature, 484, 49–54, 2012.
Sigman, D. M., de Boer, A. M., and Haug, G. H.: Antarctic stratification, atmospheric water vapor, and Heinrich Events: A hypothesis for late Pleistocene Deglaciations, in: Ocean Circulation: Mechanisms and Impacts, edited by: Schmittner, A., Chiang, J. C. H., and Hemming, S. R., Geophysical Monograph Series, 173, American Geophysical Union, Washington DC, 315–
334, 2007a.
Sirocko, F., Sarnthein, M., Erlenkeuser, H., Lange, H., Arnold, M.,
and Duplessy, J. C.: Century-scale events in monsoonal climate
over the past 24,000 years, Nature, 364, 322–324, 1993.
Skinner, L. C. and Shackleton, N.: Rapid transient changes in
Northeast Atlantic deep water ventilation age across termination
I, Paleoceanography, 19, doi:10.1029/2003pa000983, 2004.
Sortor, R. N. and Lund, D. C.: No evidence for a deglacial intermediate water 114 C anomaly in the SW Atlantic, Earth Planet. Sci.
Lett., 310, 65–72, 2011.
Spero, H. J. and Lea, D. W.: The cause of carbon isotope minimum
events on glacial terminations, Science, 296, 522–525, 2002.
Stern, J. V. and Lisiecki, L. E.: North Atlantic circulation and reservoir age changes over the past 41 000 years, Geophys. Res. Lett.,
40, 3693–3697, 2013.
Still, C. J. and Powell, R. L.: Continental-Scale Distributions of
Vegetation Stable Carbon Isotope Ratios, edited by: West, J. B.,
Bowen, G. J., Dawson, T. E., and Tu, K. P., Springer Netherlands,
Dordrecht, 179–193, 2010.
Stommel, H.: Thermohaline convection with two stable regimes of
flow, Tellus, 13, 224–230, 1961.
Stott, L., Timmermann, A., and Thunell, R.: Southern Hemisphere
and deep-sea warming led deglacial atmospheric CO2 rise and
tropical warming, Science, 318, 435–438, 2007.
Tessin, A. C. and Lund, D. C.: Isotopically depleted carbon in the
mid-depth South Atlantic during the last deglaciation, Paleoceanography, 28, 296–306, 2013.
Thornalley, D. J. R., Elderfield, H., and McCave, I. N.: Intermediate and deep water paleoceanography of the northern North Atlantic over the past 21 000 years, Paleoceanography, 25, PA1211,
doi:10.1029/2009pa001833, 2010.
Timmermann, A., Okumura, Y., An, S. I., Clement, A., Dong, B.,
Guilyardi, E., Hu, A., Jungclaus, J. H., Renold, M., Stocker, T. F.,
Stouffer, R. J., Sutton, R., Xie, S. P., and Yin, J.: The influence of
a weakening of the Atlantic meridional overturning circulation
on ENSO, J. Climate, 20, 4899–4919, 2007.
Clim. Past, 11, 135–152, 2015
A. Schmittner and D. C. Lund: Did AMOC trigger CO2 rise?
Timmermann, A., Timm, O., Stott, L., and Menviel, L.: The roles
of CO2 and orbital forcing in driving Southern Hemispheric
temperature variations during the Last 21 000 yr, J. Climate, 22,
1626–1640, 2009.
Toggweiler, J. R., Russell, J. L., and Carson, S. R.: Midlatitude westerlies, atmospheric CO2 , and climate change
during the ice ages, Paleoceanography, 21, Pa2005,
doi:10.1029/2005pa001154, 2006.
Tschumi, T., Joos, F., Gehlen, M., and Heinze, C.: Deep ocean ventilation, carbon isotopes, marine sedimentation and the deglacial
CO2 rise, Clim. Past, 7, 771–800, doi:10.5194/cp-7-771-2011,
2011.
Vidal, L., Labeyrie, L., Cortijo, E., Arnold, M., Duplessy, J. C.,
Michel, E., Becque, S., and vanWeering, T. C. E.: Evidence for
changes in the North Atlantic Deep Water linked to meltwater
surges during the Heinrich events, Earth Planet. Sc. Lett., 146,
13–27, 1997.
Völker, L. and Köhler, P.: Responses of ocean circulation and carbon cycle to changes in the position of the Southern Hemisphere
westerlies during the Last Glacial Maximum, Palaeoceaogr., 28,
726–739, 2013.
Waelbroeck, C., Skinner, L. C., Labeyrie, L., Duplessy, J. C.,
Michel, E., Vazquez Riveiros, N., Gherardi, J. M.,
and Dewilde, F.: The timing of deglacial circulation
changes in the Atlantic, Paleoceanography, 26, PA3213,
doi:10.1029/2010pa002007, 2011.
Watson, A. J., and Naveira Garabato, A.: The role of Southern
Ocean mixing and upwelling in glacial-interglacial atmospheric
CO2 , Tellus B, 58, 73–87, 2011.
Weaver, A. J., Eby, M., Wiebe, E. C., Bitz, C. M., Duffy, P. B.,
Ewen, T. L., Fanning, A. F., Holland, M. M., MacFadyen, A.,
Matthews, H. D., Meissner, K. J., Saenko, O., Schmittner, A.,
Wang, H. X., and Yoshimori, M.: The UVic Earth System Climate Model: model description, climatology, and applications to
past, present and future climates, Atmos. Ocean, 39, 361–428,
2001.
Zahn, R. and Stuber, A.: Suborbital intermediate water variability
inferred from paired benthic foraminiferal Cd/Ca and delta C13 in the tropical West Atlantic and linking with North Atlantic
climates, Earth Planet. Sc. Lett., 200, 191–205, 2002.
Zahn, R., Schonfeld, J., Kudrass, H. R., Park, M. H., Erlenkeuser, H., and Grootes, P.: Thermohaline instability in the
North Atlantic during meltwater events: stable isotope and icerafted detritus records from core SO75-26KL, Portuguese margin, Paleoceanography, 12, 696–710, 1997.
Zhang, R. and Delworth, T. L.: Simulated tropical response to a substantial weakening of the Atlantic thermohaline circulation, J.
Climate, 18, 1853–1860, 2005.
Ziegler, M., Diz, P., Hall, I. R., and Zahn, R.: Millennial-scale
changes in atmospheric CO2 levels linked to the Southern Ocean
carbon isotope gradient and dust flux, Nat. Geosci., 6, 457–461,
2013.
www.clim-past.net/11/135/2015/


© Copyright 2026