
MODELING THE DISTRIBUTION, DEPTH AND
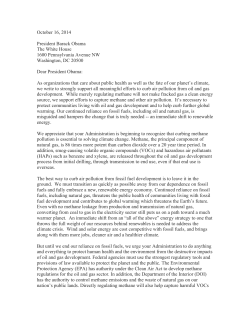
POCKMARKS IN THE FJORDS OF WESTERN SVALBARD AND
THEIR IMPLICATIONS ON GAS HYDRATE DISSOCIATION
1,2
1,2,3
1
2,4
Srikumar Roy , Kim Senger , Riko Noormets , Martin Hovland
1
Department of Arctic Geology, University Centre in Svalbard, PO Box 156, N-9171 Longyearbyen, Svalbard, Norway 2Department of Earth Science, University of Bergen, Allégaten 41, N-5007 Bergen, Norway
3
4
Centre for Integrated Petroleum Research (CIPR), Uni Research, Allégaten 41, N-5007 Bergen, Norway
Statoil ASA, Forusbeen 50, 4035 Stavanger, Norway
*
corresponding author: [email protected], +4746235159
INTRODUCTION
STUDY AREA - ISFJORDEN (WESTERN SVALBARD)
Pockmarks are circular to elliptical in planform depression
commonly occurring on muddy sea bottom. Their formation is
mostly related to the seepage of gaseous or fluid hydrocarbons
through the seabed. The pockmark-forming gas/fluid may originate
either directly from the biogenic or thermogenic source or from the
dissociating gas hydrates that may locally be associated with the
subsea permafrost.
In the Arctic, gas hydrate is widespread, trapped within marine
sediments and permafrost. The gas hydrate stability zone (GHSZ)
for a specific gas to form hydrate beneath the sea floor is controlled
by temperature (dependent on bottom water temperature and
geothermal gradient) and pressure (dependent on water depth and
depth beneath seabed), as well as pore water chemistry.
Dissociation of gas hydrate in response to changed temperature
and/or pressure can produce a rapid release of free methane through
the sediments creating pockmarks on the seafloor (Judd &
Hovland, 2007; Mienert et al, 2010). The presence of active
hydrocarbon source rocks along the western Svalbard continental
margin (Knies et al., 2004), the Central Spitsbergen Basin
(Nøttvedt et al., 1993) and reactivated fault systems like the
Billefjorden Fault Zone form favourable preconditions for
hydrocarbon accumulation and migration through the seabed and
hence formation of pockmarks. Dewatering of marine sediments
due to sediment overloading during glacial readvances may also
result in the formation of pockmarks.
Study area is located in the Isfjorden fjord system in central Spitsbergen, Svalbard. During the last glacial maximum c. 18-20ky
BP, Svalbard and its surrounding continental shelf was covered by an ice sheet. Retreat of the ice sheet margin from the Isfjorden
Trough begun c. 15ky BP, by 12ky BP the shelf was ice free and by c. 11ky BP the the ice margin had retreated well into the fjords
(Ingólfsson, 2011).
High resolution swath bathymetric data were used to systematically map the submarine glacial landforms and pockmarks in the
Isfjorden fjord system in central Svalbard. Pockmarks recorded in this study occur exclusively in the post glacial marine muds.
SPATIAL DISTRIBUTION OF POCKMARKS IN ISFJORDEN
a)
Isfjorden
b)
Figure1 : Geographic location of Isfjorden in western
Svalbard (Source: Norwegian Polar Institute)
MORPHOLOGY OF POCKMARKS
The Isfjorden area comprises circular, V to U shaped and elliptical
pockmarks. They appear as either single features or
string/composite pock marks. They vary from symmetrical to
asymmetrical on the slopes in vertical cross sections. A total of 844
pockmarks have been identified in the bathymetry imagery.
i) Diameter ranges from 15m to 265 m
ii) Maximum vertical depth of 11 m
Locally raised rims occur. The appearance of the pockmarks varies
from sharply outlined, with well-defined edges and steeper slopes,
to less sharply outlined, with smooth edges and gentler slopes.
Figure 2 : Map showing the distribution of pockmarks on the bathymetry data in (a) Billefjorden, (b)Sassenfjorden and (c) Isfjordbanken respectively.
Elevated rims
Figure 3: Cross-section of a pockmark in Billefjorden
illustrating the V-shaped structure (extreme left).
Composite pockmarks associated with raised rims (left).
Figure 4: Closer look at the glacial lineations and
associated pockmarks in Billefjorden ( right). Note the
colour-coding for exact location from figure 2(a).
Figure 5: Distribution of pockmark diameter (extreme
left) and relief (left) in the Isfjorden.
MODELING THE DISTRIBUTION, DEPTH AND THICKNESS OF THE
HYDRATE
STABILITY
ZONE
IN
ISFJORDEN
-2-C
5-C
oC
Temperature
-2
0.5
3
Depth to top of HSZ (Pure
224m 286m 366m
methane phase boundary)
Case Number
01
02
03
Depth to top of HSZ (Methane +
129m 170m 224m
10% ethane phase boundary)
Case Number
05
06
07
Bottom water
temperature (°C)
The presence of higher molecular weight gases in the shallow
waters of Svalbard might facilitate formation of gas hydrates as they
become more stable with added gas types (e.g. ethane and propane)
at much lower pressures and higher temperatures than for pure
methane hydrate (Baker, 1972). Taking into account the uncertainty
of the unknown gas composition, four cases are also discussed
wherein the methane gas is assumed to be contaminated with up to
10% of ethane.
Case_05
Case_06
Case_01
Case_07
Case_02
Case_08
Case_03
5
0.5-C
445m
Case_04
3-C
Figure 7 (top): Map showing an extrapolated seabottom temperature map of Isfjorden.
04
279m
08
Table 1: Temperature and top of HSZ values of the eight case studies
discussed in this study.
Figure 6: Ocean bottom temperature data from the
International Council for the Exploration of the Sea (ICES)
demonstrates that the sea-bottom temperature varies from – 2
to 5 °C in the Isfjorden region. Source: Ices.dk, Data bounding
box (13.75-17.75E, 78-78.75N), Temperatures within 10m of
seabed.
Figure 8 (right): Water depth required for each case
study considering the corresponding temperatures for
methane hydrate stability. (using HWHydrate
software). Depth to the top of hydrate stability zone at
different
ocean bottom temperatures. Case_04
indicates that pure methane does not form hydrate at 5
°C in this region considering maximum water depth of
428m.
THICKNESS CALCULATION OF HYDRATE STABILITY ZONE IN ISFJORDEN
The gas hydrate stability zone (HSZ)
in sediments can be delineated on a
temperature versus depth (pressure)
profile with respect to the
hydrothermal gradient (for subsea
gas hydrates), geothermal gradient
and clathrate phase boundary. A
geothermal gradient of 25 °C/km has
been used for the HSZ thickness
calculations in this study. The phase
boundaries were calculated using
HWHydrate software.
a)
b)
c)
Figure 10 (a to g): Thickness maps of hypothetical
Hydrate Stability Zones for pure methane hydrate and
methane + 10% ethane hydrate formation.
d)
e)
f)
g)
Longyearbyen
Figure 9: 25 degrees / km geothermal gradient
making a secant with the two phase boundaries to
delineate the HSZ
a)
b)
c)
Figure 11 :(Above)Distribution of pockmarks in different water depth intervals in (a) Billefjorden, (b) Sassenfjorden and (c) Isfjordbanken.
CONCLUSIONS
• The preliminary mapping and modelling results suggest that, in addition to the potential deep sources for the seabed seeps, the pockmarks within the mapped GHSZ regions in the Isfjorden could have resulted partly from the dissociation of gas
hydrates. The GHSZ is expected to taper out at its landward limit at a depth of about 400m, where water temperature is 3 °C. Moreover the effect of progressive warming of the northward-flowing West Spitsbergen current of about 1 °C over the last 30
years (Schauer et al., 2004) in the area could potentially increase the hydrate instability.
• Another potential cause for the formation of the pockmarks may be the release of methane associated with the thawing permafrost.
• The production of biogenic sediments in Svalbard fjords is comparatively low (Elverhøi, 1984). Hence, thermogenic gas is more likely a cause for the formation of the pockmarks in the fjords of Svalbard.
• Elongated planform of pockmarks on Isfjorbanken could result from the stronger bottom currents as compared to the inner Isfjorden where the pockmarks are of more circular shape.
Further investigation of gas hydrates and monitoring of methane release is needed to quantify the likely magnitude of future emissions and their possible implications on the regional and global climate.
ACKNOWLEDGEMENTS
This work is financed by the Research Council of Norway. The
multibeam data from the Norwegian Hydrographic Service is
presented in accordance with permission number 08/620.
Schlumberger provided academic license of Petrel.
HWHydrate was used for the hydrate stability modelling.
REFERENCES
Knies, J., Damm, E., Gutt, J., Mann, U., Pinturier, L. (2004). Near-surface hydrocarbon anomalies in shelf sediments off Spitsbergen: Evidences for past seepages. Geochemistry Geophysics Geosystems G3,v. 5 .
Mienert, J., Vanneste, M, Haflidason, H., Bünz, S. (2010). Norwegian margin outer shelf cracking: a consequence of climate-induced gas hydrate dissociation? . International Journal of Earth Science, v. 99, p. 207-225
Judd, A.G., Hovland, M., (2007). Seabed Fluid Flow, the Impact on Geology, Biology, and the Marine Environment. Cambridge University Press. 475pp.
Landvik, J., Ingolfsson, O´ ., Mienert, J., Lehman, S., Solheim, A., Elverhøi, A. & Ottesen, D. (2005). Rethinking Late Weichselian ice sheet dynamics in coastal NW Svalbard. Boreas,v. 34, p. 7-24.
Schauer, U., E. Fahrbach, S. Osterhus, and G. Rohardt (2004). Arctic warming through the Fram Strait: Oceanic heat transport from 3 years of measurements, J. Geophysical Reseach, v. 109, C06026, doi:10.1029/ 2003JC001823
Nøttvedt, A., Livbjerg, F., Midbøe, P. S., and Rasmussen, E. (1993). Hydrocarbon potential of the Central Spitsbergen Basin: Arctic Geology and Petroleum Potential, Norwegian Petroleum Society, Special publication, v. 2, p. 333-361.


© Copyright 2026