
Document
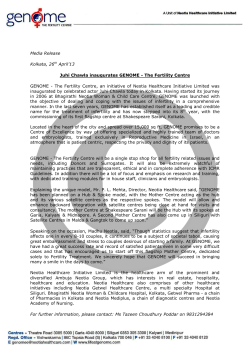
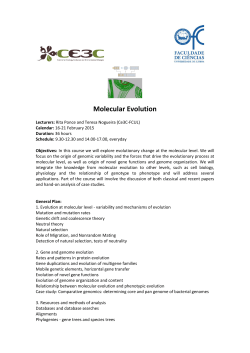
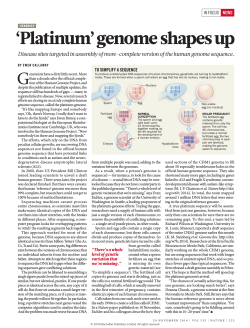
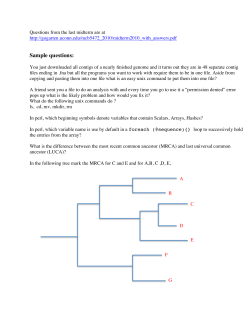
Article
Tiger Swallowtail Genome Reveals Mechanisms for
Speciation and Caterpillar Chemical Defense
Graphical Abstract
Authors
Qian Cong, Dominika Borek, Zbyszek
Otwinowski, Nick V. Grishin
Correspondence
[email protected]
In Brief
The swallowtail butterfly has attracted
broad attention from people. Now, Cong
et al. present the genome of the Eastern
Tiger Swallowtail obtained with a protocol
that works for highly heterozygous
genomes. Comparative analyses provide
insights to caterpillar chemical defense,
winter sleep of pupae, speciation
mechanisms, and hybrid species.
Highlights
d
Genome sequence of Eastern Tiger Swallowtail, the first for
the Papilionidae family
d
A cost-effective protocol to sequence and assemble highly
heterozygous genomes
d
Molecular basis for terpene synthesis in the Papilionidaespecific organ, osmeterium
d
Mutations in circadian clock proteins that dictate different
timing of pupal diapause
Cong et al., 2015, Cell Reports 10, 1–10
February 17, 2015 ª2015 The Authors
http://dx.doi.org/10.1016/j.celrep.2015.01.026
Please cite this article in press as: Cong et al., Tiger Swallowtail Genome Reveals Mechanisms for Speciation and Caterpillar Chemical Defense, Cell
Reports (2015), http://dx.doi.org/10.1016/j.celrep.2015.01.026
Cell Reports
Article
Tiger Swallowtail Genome Reveals Mechanisms
for Speciation and Caterpillar Chemical Defense
Qian Cong,2 Dominika Borek,2 Zbyszek Otwinowski,2 and Nick V. Grishin1,2,*
1Howard Hughes Medical Institute, University of Texas Southwestern Medical Center, 5323 Harry Hines Boulevard, Dallas,
TX 75390-9050, USA
2Department of Biophysics and Biochemistry, University of Texas Southwestern Medical Center, 5323 Harry Hines Boulevard, Dallas,
TX 75390-8816, USA
*Correspondence: [email protected]
http://dx.doi.org/10.1016/j.celrep.2015.01.026
This is an open access article under the CC BY-NC-ND license (http://creativecommons.org/licenses/by-nc-nd/3.0/).
SUMMARY
Predicting phenotype from genotype represents the
epitome of biological questions. Comparative genomics of appropriate model organisms holds the
promise of making it possible. However, the high
heterozygosity of many Eukaryotes currently prohibits assembling their genomes. Here, we report
the 376 Mb genome sequence of Papilio glaucus
(Pgl), the first sequenced genome from the Papilionidae family. We obtained the genome from a wildcaught specimen using a cost-effective strategy
that overcomes the high (2%) heterozygosity problem. Comparative analyses suggest the molecular
bases of various phenotypic traits, including terpene
production in the Papilionidae-specific organ,
osmeterium. Comparison of Pgl and Papilio canadensis transcriptomes reveals mutation hotspots
(4% genes) associated with their divergence: four
key circadian clock proteins are enriched in interspecies mutations and likely responsible for the difference in pupal diapause. Finally, the Pgl genome
confirms Papilio appalachiensis as a hybrid of Pgl
and Pca, but suggests it inherited 3/4 of its genes
from Pca.
are fueling excitement in the field (Kunte et al., 2014; You et al.,
2013; Zhan et al., 2011).
A showy North American butterfly, the Eastern Tiger Swallowtail, Papilio glaucus (Pgl), is honored as the state insect in five
states in the US (Figures 1A and 1B). Pgl has remarkable
morphological and behavioral features at all stages of its development. Like other swallowtails, the Pgl caterpillar possesses a
fleshy, fork-shaped osmeterium. Upon threat, this organ everts
to emit malodorous, predator-repelling terpenes (Eisner and
Meinwald, 1965). The caterpillar mimics a snake, with this
tongue-like osmeterium and two eyespots on the thorax. The
Pgl chrysalis undergoes conditional diapauses (Hagen et al.,
1991). Female adults of Pgl are dimorphic between a yellow
form and a melanic form to mimic the unpalatable Pipevine Swallowtail, Battus philenor (Brower, 1958).
Pgl and its sister species, Papilio canadensis (Pca), diverged
0.6 million years ago (Kunte et al., 2011), and yet developed substantial differences in thermal preference, caterpillar food plants,
body size, and female mimicry (Hagen et al., 1991). Unlike Pgl,
Pca undergoes obligate pupal diapause. However, Pgl and Pca
hybridize in a narrow zone where they meet. A hybrid species
from the Appalachian Mountains, Papilio appalachiensis (Pap),
was described recently (Pavulaan and Wright, 2002). These three
species offer a model system to study evolution, hybridization,
and speciation, and these studies will benefit from the decoding
of a Papilio genome.
RESULTS AND DISCUSSION
INTRODUCTION
An organism in all of its complexity of morphological and behavioral traits develops through interaction between its genetic
makeup and the environment. Unraveling and predicting these
traits from the genotype chart the future of biological research.
The success of such prediction depends on the ability to
routinely sequence and analyze the genomes of thousands of
individuals from selected model organisms. In this quest, butterflies and moths, which have relatively small genomes but complex life cycles and diverse wing patterns, are emerging as
powerful models. A new paradigm that gene exchange between
species is pivotal in the evolution of adaptation (Heliconius
Genome, 2012), and anticipation of using comparative genomics
to uncover molecular mechanisms responsible for complex traits
A Cost-Effective Protocol for De Novo Sequencing and
Assembly of Highly Heterozygous Genomes
Despite rapid development of next generation sequencing techniques, assembling highly heterozygous genomes remains a
challenge. Many insects have large, widespread, and morphologically variable populations with high heterozygosity (Allendorf,
1986). Extensive inbreeding was used to overcome this problem
in the Heliconius melpomene (Hme)2 and Bombyx mori (Bmo) (International Silkworm Genome Consortium, 2008; Xia et al., 2004)
genome projects, while the highly hetergozygous Plutella xylostella (Pxy) genome was cloned into over 100,000 fosmids and
required 114 Illumina lanes to sequence (You et al., 2013). These
laborious and expensive procedures impede acquisition of
numerous eukaryotic genomes for data-driven discoveries.
Cell Reports 10, 1–10, February 17, 2015 ª2015 The Authors 1
Please cite this article in press as: Cong et al., Tiger Swallowtail Genome Reveals Mechanisms for Speciation and Caterpillar Chemical Defense, Cell
Reports (2015), http://dx.doi.org/10.1016/j.celrep.2015.01.026
Figure 1. The Pgl Genome Is Highly Heterozygous
(A and B) (A) Dorsal and (B) ventral aspects of the
sequenced Pgl specimen that was preserved after
tissue sampling.
(C) Histogram of 17-mer frequency in all the
sequence reads before (blue curve) and after (red
curve) error correction, which corrected the
sequencing errors but not the heterozygosity
problem. The peak on the left (about 30) represents frequency distribution of 17-mers from heterozygous regions, and the peak on the right
(about 60) is for homozygous regions. The relative
height of the two peaks is an indicator for heterozygosity level. The black lines indicate the height of
the two peaks (heterozygous peak and homozygous peak) in a similar graph for Pxy (estimated
from Figure S3 in You et al., 2013).
(D) Percentage of SNPs in 1,000-bp overlapping
windows.
See also Figure S1 and Table S3.
The Pgl genome is comparable to Pxy in terms of size and heterozygosity, and the latter is reflected by the histogram of K-mer
(K bp segment) frequencies in the sequence reads (Figure 1C)
(Kajitani et al., 2014). K-mers from heterozygous regions of
maternal and paternal chromosomes will be different, while
those from homozygous regions will have identical sequences.
Therefore, the distribution of K-mer frequency in the sequencing
data will form two peaks: heterozygous and homozygous, and
the relative height of the two peaks reflects the heterozygosity
level in the sequenced genome.
Our protocol allowed us to obtain the Pgl genome with quality
comparable to other Lepidoptera using DNA from a single wildcaught specimen and sequence data from a single Illumina lane.
Briefly, we extracted DNA from a piece of Pgl adult thoracic muscle. Paired-end libraries (250 and 500 bp) and three mate-pair
libraries (2, 6, and 15 kb) made with a modified Cre-lox-based
protocol (Van Nieuwerburgh et al., 2012) were sequenced at
both ends for 150 bp (Table S1A). After the removal of low quality
sequences and error correction (Table S1B), we used Platanus
(Kajitani et al., 2014) software designed for highly heterozygous
genomes (Table S1C) to assemble the reads. The primary assembly contained a number of shorter scaffolds with significantly
lower coverage (Figures S1C and S1D), representing highly heterozygous regions that were not merged to equivalent segments
in the homologous chromosomes. Using in-house scripts, these
scaffolds were merged to obtain the final assembly (details in
Experimental Procedures and Supplemental Information).
Genome Quality Assessment and Gene Annotation
We assembled a 376 Mb genome of Pgl and compared its quality
and content with published Lepidoptera genomes (Table 1;
Tables S2A and S2B). The scaffold N50 of Pgl is 230 kb, compa2 Cell Reports 10, 1–10, February 17, 2015 ª2015 The Authors
rable to other butterfly genomes, but
shorter than the Pxy genome. However,
despite a larger N50, the Pxy genome assembly is incomplete as measured by the
presence of CEGMA (Core Eukaryotic
Genes Mapping Approach) genes (Parra et al., 2007), Cytoplasmic Ribosomal Proteins and independently assembled transcripts, while the Pgl genome rivals the best in terms of
completeness. The residue coverage of CEGMA genes (Table
S2C) by single Pgl scaffolds is the same as the current Bmo
assembly with an N50 of 3.7 Mb, indicating that the quality of
the Pgl draft is sufficient for protein annotation and comparative
analysis.
The Pgl genome is highly heterozygous with an overall SNP
rate of 2%. The distribution of SNPs in the genome is prominently
nonrandom (Figure 1D; Figure S1E), with a SNP rate of 0.8% in
the coding regions (Table S3A). 505 protein-coding genes have
significantly more (false discovery rate <0.1) SNPs than the
average (Table S3B). Enriched GO terms show that many of
these genes encode enzymes (Table S3C; Figures S1F and
S1G). They are also significantly enriched in proteins involved
in the detection of stimuli (chemosensory ionotropic receptors),
which may be related to the wide range of food plants they
feed on. Repeats constitute 22% of the Pgl genome (Table
S1D), which is similar to other butterflies, but less than in moth
genomes. We predicted 15,695 protein-coding genes in the
Pgl genome (Table S1E) and annotated the function for 11,975
of them (Table S1F).
Comparative Analysis of Lepidoptera Genomes Reveals
Genetic Bases for Morphological Traits
We compared the Pgl protein set with other Lepidoptera. Phylogenetic trees built both from an alignment of the 3,858 universal
single-copy orthologs (Figure 2A; Figure S2A) and from synteny
(Figure S2B; Table S4A) indicate that Pgl groups with other butterflies. Except Pxy, the other four species share over 85% of
genes in micro-syntenic blocks. All the Pgl Hox genes that are
Please cite this article in press as: Cong et al., Tiger Swallowtail Genome Reveals Mechanisms for Speciation and Caterpillar Chemical Defense, Cell
Reports (2015), http://dx.doi.org/10.1016/j.celrep.2015.01.026
Table 1. Quality and Composition of Lepidoptera Genomes
a
Feature
Pgl
Dpl
Hme
Bmo
Pxy
Genome size (Mb)
376
249
274
480
394
na
na
Heterozygosity (%)
Scaffold N50 (kb)
1.80
230
0.55
207
277
2b
c
27 (3,700 )
734
CEGMA (%)
99.3
99.3
98.0
99.3
98.0
CEGMA coverage by
single scaffold (%)
85.6
85.9
85.6
85.6
81.7
95.7
98.9
94.6
98
83
Cytoplasmic ribosomal
proteins (%)
100
100
De novo assembled
transcripts (%)
98
96
Repeat content (%)
22.2
16.3
24.9
44.1
34.0
Number of proteins (k)
15.7
15.1
12.8
14.3
18.1
na
na, not applicable. See also Table S2.
a
Dpl, Danaus plexippus.
b
Estimated by comparing the distribution of K-mer frequency in the
sequence reads, as shown in Figure 1C.
c
N50 for the improved genome assembly.
expected to be linked are on the same scaffold (Figure 2B; Figures S2C and S2D; Table S4B), indicating the good quality of
Pgl assembly.
The Pgl genome reveals expansions in several protein families (Table S4C). Previous studies identified six opsins from
Pgl (Briscoe, 2000), whereas the genome assembly suggests
nine (Table S4D). Pgl has more green-light-sensitive opsins,
which may indicate a more advanced color perception.
The identified opsins cluster into four groups (Figure 2C): in
addition to the previously reported UV, blue- and green-lightsensitive opsins, we discovered another group of putative
UV-sensitive opsins similar to the Drosophila Rh7 (Brody and
Cravchik, 2000). Other notable gene expansions include the
eclosion hormone (Figure 2D; Table S4E) that triggers the
emergence of adults (Truman, 2005), and circadian clockcontrolled proteins that are involved in timing of the eclosion
(Myers et al., 2003). Different eclosion hormone copies may
vary in temporal-spatial distribution and impart complex regulation of eclosion, allowing Pgl to diapause conditionally in
response to external stimuli.
The largest expansion involves farnesyl pyrophosphate synthase (FPPS) homologs belonging to a family of isoprenoid
biosynthesis enzymes that synthesize steroids and terpenes
(Figure 2E) (Dhar et al., 2013). The 24 Pgl FPPS genes cluster
at several genomic loci (Table S4F). The FPPS proteins are predicted to adopt an isprenoid synthase fold (Figures S3A and S3B)
with fully preserved catalytic sites in 19 of them (Zhang et al.,
2013b). The amino acids lining the FPPS substrate-binding sites
are less conserved, implying diverse substrate specificity (Figure S3C). RNA sequencing (RNA-seq) data indicate that this
gene expansion occurs in other Papilionidae species (Table
S4G). The Papilio-specific FPPS enzymes form a clade in the
evolutionary tree (Figure 2F), and we hypothesized that they
could function in a pathway to synthesize predator-repelling
terpenes secreted by the osmeterium, a Papilionidae-specific
organ among butterflies.
Speciation between Papilio glaucus and Papilio
canadensis
We have built an isolation-with-migration model (Hey and Nielsen, 2007) (Table S5A) using all transcripts shared by the Pgl
and Pca to simulate their evolutionary history (Figure S4A). The
model predicts that they diverged approximately half a million
years ago and underwent dramatic increases in the effective
population size, resulting in high DNA variability. The model
also suggests gene flow between Pgl and Pca, consistent with
their successful mating in the lab and the discovery of a hybrid
species, Pap.
At the whole-transcriptome level, Pgl and Pca are easily distinguishable. Combining all 8,230 transcripts shared among the
three Pgl (including the one for whole-genome sequencing) and
two Pca specimens, the average variation rate and dN/dS ratio
within species are significantly lower (p < 10 4) than the inter-species values (Table S5B; Figures S4B and S4C). However, due to
the closeness of intra- and inter- species variation rates, these
two species are indistinguishable by most individual genes.
Only 351 (4.3%, Table S5C) transcripts display higher inter-species variation in both protein and DNA. As the number of samples
being analyzed increases, the number of such genes will become
even smaller. Therefore, only a small fraction of genes, which we
term ‘‘divergence hotspots,’’ drive the speciation and adaptation
to different environments. The divergence hotspots are mostly
conserved within species (Figure 3A). Overlap between divergence hotspots and positively selected loci in Pgl and Pca (Table
S5D) is small (11.1%), because 97.5% of these loci reflect adaptive evolution within either Pgl or Pca (Figure S4D).
The divergence hotspots show significant (p < 10 2) enrichment in 57 GO terms (Figure 3B; Figure S4E; Table S5E). The
GO terms suggest that Pgl and Pca differ in defense against
xenobiotics (e.g., GO: 0009410), insecticides (e.g., GO:
0017143), and bacteria (e.g., GO: 009617), which is consistent
with the fact that they are exposed to different food plants, plant
defense compounds, insecticides, and bacteria.
The GO term, ‘‘eclosion rhythm’’ is among the most significantly enriched. This GO term is associated with four divergence
hotspots that are the central players in the circadian clock system: CLOCK, CYCLE, PEROID, and TIMELESS (Zhu et al.,
2008) (Figures 4A and 4B; Figures S5A–S5D). These proteins
regulate the timing for adults to hatch from pupae (opposite to
diapause) and the temperature preference rhythm in Drosophila
(Blanchardon et al., 2001; Kaneko et al., 2012). Mapping amino
acid differences between species to 3D structure templates
shows that these mutations concentrate on one side of the
CLOCK/CYCLE complex (Huang et al., 2012), forming clusters
on the surface (Figure 4C). A similar distribution of mutation sites
is observed in PERIOD (Figure S5E). The surface clustering of
mutations suggest that they likely modify interactions between
circadian clock proteins and other regulators. Differences in
modulation of this timing system could determine the different
phenotypes: obligate diapause versus conditional diapause.
Novel Nuclear DNA Barcodes for Insect Identification
The widely used mitochondrial DNA barcode encoding part
of cytochrome c oxidase subunit 1 (COI) is routinely used for
insect identification and cryptic species discovery. However,
Cell Reports 10, 1–10, February 17, 2015 ª2015 The Authors 3
Please cite this article in press as: Cong et al., Tiger Swallowtail Genome Reveals Mechanisms for Speciation and Caterpillar Chemical Defense, Cell
Reports (2015), http://dx.doi.org/10.1016/j.celrep.2015.01.026
Figure 2. Comparative Analysis of Lepidoptera Genomes and Protein Families that Underwent Gene Expansion in Pgl
(A) Evolutionary tree based on the concatenated alignment of universal single-copy orthologs.
(B) Arrangement of Hox genes on scaffolds of all published Lepidoptera genomes. Orthologs are shown as boxes of the same color; a box surrounded by dashed
lines represents a gene that is missing in the genome assembly; double boxes in the same position indicate gene duplications and ‘‘//’’ marks the boundaries
between different scaffolds.
(C) Phylogenetic tree of Opsins.
(D) Phylogenetic tree of eclosion hormones.
(E) A typical reaction of isoprenoid biosynthesis enzymes.
(F) Phylogenetic tree of isoprenoid biosynthesis enzymes. Abbreviations of the species and protein names are used as labels in the phylogenetic trees.
See also Figures S2 and S3 and Table S4.
maternally inherited mitochondrial DNA can be transferred between species via cellular symbionts (Whitworth et al., 2007), hybridization, and backcrossing and therefore may have a history
different from the whole organism. Consequently, tests with
4 Cell Reports 10, 1–10, February 17, 2015 ª2015 The Authors
COI barcodes need to be supplemented with work based on nuclear barcodes. The commonly used nuclear markers for insects
include 18s rRNA, wingless, EF1a genes and non-coding ITS1
and ITS2. However, these nuclear barcodes fail to distinguish
Please cite this article in press as: Cong et al., Tiger Swallowtail Genome Reveals Mechanisms for Speciation and Caterpillar Chemical Defense, Cell
Reports (2015), http://dx.doi.org/10.1016/j.celrep.2015.01.026
Figure 3. Divergence Hotspots and Associated GO Terms
(A) Venn diagram showing divergence hotspots
and highly variable proteins within species.
(B) Enriched GO terms (biological processes)
associated with divergence hotspots. GO terms
are grouped in space by similarity in meaning and
colored by the level of significance as shown by
the label at the upper left corner. Annotations are
shown for the most significantly enriched terms
(false discovery rate <0.2).
See also Figure S4 and Table S5.
closely related species such as Pgl and Pca, which are clearly
separated by COI barcodes. In a quest for nuclear barcodes,
we searched for long (>150 bp) exons that: (1) are present in
most genomes as confidently identifiable and alignable singlecopy orthologs; (2) differ between many pairs of closely related
insect species, but are less variable within species (Figure S6A).
Out of 22,731 long exons shared by Pgl and Pca specimens,
only 236 can confidently (p < 0.05) distinguish the two species,
and only 41 have a higher discriminating power than the COI
barcode (Table S6A) in either binomial tests or inter-species
divergence level. We used 56 insect genomes forming 460 close
species pairs (Table S6B) to further reduce the candidate list.
Finally, 11 nuclear barcodes were selected (Table 2; Table
S6C). In addition to their ability to distinguish sister species,
most of them represent the phylogeny of insects better than
the COI barcode (Figures S6B–S6E).
Reference Genome Provides New Insights into Hybrid
Species Papilio appalachiensis
Using the Pgl genome as a reference, we compared the transcripts of Pap and its parental species (Figure 5A; Table S7A),
Pgl and Pca. Based on the 7,410 shared transcripts, Pap is
more similar to Pca than to Pgl. The two Pap specimens show
the lowest variability, which agrees with it being a distinct species with a smaller effective population size, rather than a result
of presently continuing hybridizations of Pgl and Pca. However,
the situation may change as more specimens from different
localities are sequenced, and more sequences from additional
species are needed to fully understand speciation in these
Papilio species.
High intra-species variation hinders attribution of a Pap gene
to its parental species by marginally higher sequence identity
alone. We assign the origin of a Pap gene to a particular species
if its sequence is similar to those from this species but different
(p < 0.05) from the other species. Thus, we detected 207 Pcaoriginated and 70 Pgl-originated transcripts that are shared by
both Pap specimens (Tables S7B and S7C). Stringent tests
with Bonferroni correction show similar hybrid composition of
Pap genes. Despite the small number of confidently assigned
genes, they represent a majority (86%)
of genes that are significantly different between Pgl and Pca (Figure 5B). Only eight
Pap genes are significantly (p < 0.05)
different from both parental species (Table S7D). As shown in Figure 5B, Pgl-originated genes in one
Pap specimen are never Pca-originated in another Pap specimen, suggesting that the Pap population may not be a mixture
of hybrids where the same loci could contain both Pgl- and
Pca-originated alleles.
We used the Pgl assembly to analyze the genomic distribution
of statistically supported Pgl-originated genes. These genes are
significantly (p < 10 7) more likely to cluster in the genome
compared to randomly selected gene sets of the same size. In
addition, neighborhoods of these Pgl-originated genes are enriched in genes with higher similarity to Pgl (Figure 5C; Figure S7A). This trend of clustering is even more prominent for
Pca-originated genes (Figures S7B and S7C), suggesting that
the linkage between some loci was kept at the time when Pap
was originating by hybridization.
The results support a hybrid origin of Pap with about 72%
genes inherited from Pca, explaining the higher morphological
and behavioral similarity between Pap and Pca. For instance,
Pap with obligate diapause has all four divergence hotspots
involved in the circadian clock system inherited from Pca, offering additional evidence for the proposed functional role of these
genes. In contrast, the Pgl 6-phosphogluconate dehydrogenase
(6PGD), which was shown to be closely linked to the melanic female-enabling gene on the Z chromosome (Hagen and Scriber,
1989), is inherited from Pgl. This link could be relevant to the
observed Pgl-like black females in Pap from West Virginia, where
the two Pap specimens were collected (Zhang et al., 2013a). Two
putative transcriptional factors in the neighborhood of 6PGD
(Table S7E) are candidate regulators of melanic female trait.
EXPERIMENTAL PROCEDURES
See the Supplemental Information for detailed protocols. In-house scripts and
intermediate results are available at http://prodata.swmed.edu/LepDB/. Academic users can use them freely.
Library Preparation and Sequencing
We dissected approximately 80 mg of muscle from the thorax of a freshly caught
and frozen male Papilio glaucus (USA: Texas, Denton County, Lake Ray Roberts
State Park, Greenbelt Corridor along Elm Fork of the Trinity River, 33.2536,
Cell Reports 10, 1–10, February 17, 2015 ª2015 The Authors 5
Please cite this article in press as: Cong et al., Tiger Swallowtail Genome Reveals Mechanisms for Speciation and Caterpillar Chemical Defense, Cell
Reports (2015), http://dx.doi.org/10.1016/j.celrep.2015.01.026
Figure 4. Circadian Clock System Could
Explain Differences in Diapause between
Pgl and Pca
(A) Domain diagram of CLOCK, CYCLE, PERIOD,
and TIMELESS. Mutations within species are
marked by green flags, and positions that are
conserved within but differ between species
are marked by red flags.
(B) Circadian clock system. CRY, cryptochrome
proteins.
(C) Map of inter-species mutations on the spatial
structure template (PDB id: 4F3L) of CLOCK/
CYCLE complex. The mutations are marked by red
(CLOCK) and pink (CYCLE) dots, and the
approximate position of disordered loops is shown
as black beads on threads.
See also Figure S5.
97.0434, 4-VIII-2013) and preserved the remaining nearly intact specimen. The
specimen will be deposited in the National Museum of Natural History, Smithsonian Institution, Washington, DC, USA (USNM). We extracted genomic DNA
from this piece of tissue with the ChargeSwitch gDNA mini tissue kit and obtained approximately 20 mg DNA. 250- and 500-bp paired-end libraries were
prepared using enzymes from NEBNext Modules and following the Illumina TruSeq DNA sample preparation guide. 2-, 6-, and 15-kb mate-pair libraries were
prepared using a protocol that was modified from a previously published CreLox-based method (Van Nieuwerburgh et al., 2012). For the 250-, 500-, 2-, 6-,
and 15-kb libraries, approximately 1, 1, 1.7, 3, and 7.2 mg of DNA were used,
respectively. After quantifying the DNA concentration with the KAPA Library
Quantification Kit, we mixed 250-, 500-, 2-, 6-, and 15-kb libraries to get the final
library with relative molar concentration 40:20:8:4:3. The final library was sent to
the genomics core facility at UT Southwestern Medical Center to sequence
150 bp at both ends with a rapid run on Illumina HiSeq1500.
Genome Assembly and Quality Assessment
We removed the sequence reads that did not pass the purity filter and classified the rest according to their TruSeq adaptor indices. Mate-pair libraries
were processed by the Delox script (Van Nieuwerburgh et al., 2012) to remove
the loxP sequences and separate the true mate-pair reads from paired-end
reads. All reads were processed by mirabait (Chevreux et al., 1999) to remove
contamination from the TruSeq adapters, fastq_quality_trimmer to remove low
quality portions at both ends, JELLYFISH (Marc¸ais and Kingsford, 2011) to
obtain k-mer frequencies in all the libraries, and QUAKE (Kelley et al., 2010)
to correct sequencing errors. The data processing resulted in nine libraries
that were supplied to Platanus (Kajitani et al., 2014) for genome assembly:
250- and 500-bp paired-end libraries, three paired-end and three mate-pair libraries from 2-, 6-, and 15-kb libraries, and a single-end library containing all
reads whose pairs were removed in the process.
The size of the genome assembled by Platanus was larger than the expected
size based on the 15-mer coverage by the reads used for assembly. We mapped these reads to this initial assembly with Bowtie2 (Langmead and Salzberg,
2012) and calculated the coverage of each scaffold with the help of SAMtools
(Li et al., 2009). Many short scaffolds in the assembly showed coverage that
was about half of the expected value; they likely came from highly heterozygous regions that were not merged to the equivalent segments in the homologous chromosomes. We merged them into other scaffolds if they could be
fully aligned to another significantly less covered region (coverage >90%
and uncovered region <500 bp) in a longer scaffold with high sequence identity
(>95%). Similar problems occurred in the initial Heliconius melpomene
6 Cell Reports 10, 1–10, February 17, 2015 ª2015 The Authors
genome assembly, and a similar strategy was
used to improve it (Heliconius Genome, 2012).
We obtained the most recent versions of all published Lepidoptera genomes, including Bombyx
mori, Danaus plexippus, Heliconius melpomene,
and Plutella xylostella (Duan et al., 2010; Heliconius Genome, 2012; International Silkworm Genome Consortium, 2008; Tang et al., 2014; You et al.,
2013; Zhan et al., 2011; Zhan and Reppert, 2013). Their quality was evaluated
and compared with the Pgl genome. Using the criteria applied in the Monarch
butterfly genome paper (Zhan et al., 2011), we estimated the completeness of
these genomes based on their coverage of independently obtained transcripts,
CEGMA (Parra et al., 2007) genes, and the Cytoplasmic Ribosomal Proteins.
Transcriptome Assembly
We used the reads from the previously published RNA-seq libraries of two Pgl,
two Pca, two Pap, and two Papilio polytes specimens (Zhang et al., 2013a).
After removal of contamination from TruSeq adapters and the low-quality
portion of the reads, we applied three methods to assemble the transcriptomes: (1) de novo assembly by Trinity (Haas et al., 2013), (2) reference-based
assembly by TopHat (Kim et al., 2013) (v.2.0.10) and Cufflinks (Roberts et al.,
2011) (v.2.2.1), and (3) reference-guided assembly by Trinity. The results from
all three methods were then integrated by PASA (Haas et al., 2008). For the
more distantly related Papilio polytes, only de novo assembly was performed.
Identification of Repeats and Gene Annotation
Two approaches were used to identify repeats in the Pgl genome: the
RepeatModeler (Smit and Hubley, 2010) pipeline and in-house scripts that extracted regions with coverage four times more than expected. These repeats
were submitted to the CENSOR (Jurka et al., 1996) server to assign them to the
repeat classification hierarchy. The species-specific repeat library and repeats
classified in RepBase (Jurka et al., 2005) (v.18.12) were used to mask repeats
in the genome by RepeatMasker (Smit et al., 2010).
From the transcriptome of each Pgl specimen, we obtained two sets of transcript-based annotations from two pipelines: TopHat followed by Cufflinks and
Trinity followed by PASA. In addition, we obtained five sets of homology-based
annotations by aligning protein sets from all four published Lepidoptera and
Drosophila melanogaster (Misra et al., 2002) to the Pgl genome with exonerate
(Slater and Birney, 2005). Proteins from the entire UniRef90 (Suzek et al., 2007)
database were used to generate another set of gene predictions by genblastG
(She et al., 2011). Integrating the evidence from transcripts and homologs, we
manually curated and selected 1,313 confident gene models to train de novo
gene predictors: AUGUSTUS (Stanke et al., 2006), SNAP (Korf, 2004), and
GlimmerHMM (Majoros et al., 2004). These trained predictors, the self-trained
Genemark (Besemer and Borodovsky, 2005) and a consensus-based pipeline,
Maker (Cantarel et al., 2008) were used to generate another five sets of gene
models. Homology and transcript evidence was supplied to AUGUSTUS,
Please cite this article in press as: Cong et al., Tiger Swallowtail Genome Reveals Mechanisms for Speciation and Caterpillar Chemical Defense, Cell
Reports (2015), http://dx.doi.org/10.1016/j.celrep.2015.01.026
Table 2. Nuclear Barcode Candidates and the COI Barcode
Test Pgl versus Pca
Gene ID and Exon Number
Length (bp)
pgl3382.3_e1
1,005
pgl6760.2_e9
232
Validation in Others
p value
V1 (%)
V2 (%)
A1 (%)
A2 (%)
V3 (%)
FlyBase Ortholog
0
2.33
0.1
88.9
66.7
0.25
CG12084
2.2E-3
2.4
0.43
66.7
62.5
0.72
CG32346
pgl170951.1_e1
1,482
6.4E-14
2.18
0.34
88.9
66.7
0.72
CG12529
pgl667.7_e7
1,131
5.9E-8
1.97
0.44
88.9
88.9
0.90
CG32498
pgl6877.1_e1
2,372
0
1.36
0.21
87.5
100
0.40
CG16940
pgl2859.6_e2
1,653
9.3E-9
1.28
0.24
88.9
100
0.70
CG6294
pgl5965.3_e17
1,604
4.4E-9
1.18
0.19
77.8
88.9
0.31
CG7020
pgl170945.2_e6
1,224
2.9E-7
1.13
0.16
88.9
88.9
0.35
CG32707
pgl6110.7_e1
2,616
0
0.98
0.11
100
100
0.46
CG8434
pgl6877.3_e2
1,347
3.3E-9
0.91
0.07
100
100
0.24
CG3889
pgl12124.2_e10
2,336
9.4E-11
0.9
0.13
62.5
66.7
0.60
CG3696
3.1E-6
2.14
0.46
75
28.6
0.62
CG34067
COI
654
V1, minimum inter-species variation rate; V2, maximum intra-species variation rate; V3, minimum variation rate between other closely related species
pairs; A1, agreement between the topology of the evolutionary tree for Drosophila species built on this barcode and that built on whole-genome data;
A2, similar to A1 but for the Anopheles species. See also Figure S6 and Table S6.
SNAP, and Maker to boost their performance. In total, we generated 15 sets of
gene predictions and integrated them with EvidenceModeller (Haas et al.,
2008) to generate the final gene models.
We predicted the function of Pgl proteins by transferring annotations and
GO terms from the closest BLAST hit (E-value <10 5) in the Swissprot (UniProt
Consortium, 2014) database and FlyBase (St Pierre et al., 2014), respectively.
Finally, we performed InterproScan (Jones et al., 2014) to identify conserved
protein domains and functional motifs, to predict coiled coils, transmembrane
helices, and signal peptides, to detect homologous 3D structures, to assign
Pgl proteins to protein families, and to map them to metabolic pathways.
Detection of SNPs
We mapped all the sequence reads used to assemble the Pgl genome to the
Pgl scaffolds with Bowtie2, and, using both SAMtools followed by BCFtools
(Li et al., 2009) and the Genome Analysis Toolkit (DePristo et al., 2011), we
identified SNPs and indels that happened to only one of the homologous chromosomes. To analyze the distribution of SNPs, we divided the genome into
exons, introns, repeats, and intergenic regions. The percentage of SNPs in
1,000-bp windows in the genome and the distances between neighboring
SNPs were used to reflect this distribution, and a random distribution of
SNPs was simulated in silico as a control. We identified proteins with significantly more SNPs with binomial tests (p = average percentage of SNPs in
all exons, m = number of SNPs in the exons of a protein, N = length of a
protein) followed by false discovery rate (FDR) tests (Storey and Tibshirani,
2003). We considered proteins with Q-values from FDR tests smaller than
0.1 to be significantly enriched in SNPs. Enriched GO terms associated with
these SNP-enriched proteins were identified by means of another binomial
test (p = probability of this GO term being associated with any Pgl protein,
m = number of SNP-enriched proteins associated with this GO term, N = number of SNP-enriched proteins). The significantly enriched GO terms (p < 0.01)
were submitted to the REVIGO (Supek et al., 2011) web server.
Comparison of Lepidoptera Genomes
We used OrthoMCL (Li et al., 2003) to identify the orthologous groups from the
Lepidoptera species. We aligned the protein sequences of universal singlecopy orthologs with MAFFT (Katoh and Standley, 2013) and built an evolutionary tree from the concatenated alignment with PhyML 3.0 (Guindon
et al., 2010) (JTT model [Jones et al., 1992]). We calculated the percentage
of genes in micro-syntenic blocks and identified gene inversion events. The
frequency of gene inversions was used to build a synteny-based tree using
BioNJ (Gascuel, 1997). In a case study, we identified the homeodomains
from Hox genes in all published Lepidoptera and in the unpublished Manduca
sexta and Helicoverpa punctigera genomes (BCM-HGSC), using homeodomains from Drosophila in the HomeoDB (Zhong and Holland, 2011) as reference. Orthologous groups among these homeodomains were detected using
a phylogenetic tree built by PhyML (JTT model) on the MAFFT alignment.
If two OrthoMCL-defined orthologous groups overlapped in the Drosophila
proteins that they mapped to, we merged them into one family. The total number and total length of proteins in a family were used to identify expanded gene
families in Pgl. The most significantly expanded gene families with well-defined
functions were further investigated to include all relevant proteins using reciprocal BLAST results and function annotations. Proteins encoded by the
genome but missed in the protein sets were predicted with the help of genblastG. Protein sequences from each family were aligned with MAFFT or
PROMALS3D (Pei et al., 2008). Evolutionary trees were built with PhyML
(JTT model) and visualized in FigTree.
Speciation between Papilio glaucus and Papilio canadensis
We used PASA to map the transcripts from two Pgl and two Pca specimens to
the genome and considered transcripts to be orthologous if they mapped to the
same loci. We used MAFFT and BLAST to align the orthologous transcripts and
extracted the positions that were consistently aligned by both methods and
shared among all specimens to obtain the final alignments. We discarded any
alignments that were shorter than 50 bp. From each alignment, we calculated
the pairwise identities on both the DNA and protein levels and identified transcripts, namely, ‘‘divergence hotspots,’’ that were more similar between any
pairs from the same species than from different species. We identified the enriched GO terms associated with these proteins using both binomial tests as
described above and the DAVID Bioinformatics Resources (Huang et al.,
2009). Significantly enriched GO terms (p < 0.01) were visualized in REVIGO.
Important divergence hotspots were submitted to MESSA (Cong and Grishin,
2012) to perform secondary structure and disordered region prediction, domain
identification, and 3D structure prediction. In addition, we used PAML (Yang,
2007) to identify proteins with positively selected sites, with a model that allowed the dN/dS ratio (u) to vary among sites. To study the evolutionary history
of Pgl and Pca, we removed protein-coding genes with signs of recombination
detected by PhiPack (Bruen et al., 2006), and randomly divided the rest into 20
data sets and applied IMa2 (Hey and Nielsen, 2007) and IMfig (Hey, 2010) to
build and visualize the isolation with migration models.
Selection of Nuclear DNA Barcodes for Insect Identification
We selected nuclear DNA barcodes from exons that were longer than 150 bp
and shared among all Pgl and Pca specimens. We performed binomial tests
(p = maximal percentage of intra-species mutations, m = minimal number of
Cell Reports 10, 1–10, February 17, 2015 ª2015 The Authors 7
Please cite this article in press as: Cong et al., Tiger Swallowtail Genome Reveals Mechanisms for Speciation and Caterpillar Chemical Defense, Cell
Reports (2015), http://dx.doi.org/10.1016/j.celrep.2015.01.026
Figure 5. Reference Genome Supports Pap as a Hybrid Species
(A) Variation within and between species over all common transcripts shared between Pgl, Pca, and Pap.
(B) Venn diagram of statistically supported Pca-originated, Pgl-originated proteins in Pap, and proteins that are significantly different between Pca and Pgl.
(C) Percentage of Pgl-like genes in the neighborhood of confident (p < 0.05) Pgl-originated genes is significantly (p < 0.01) higher than that in the neighborhood of
randomly selected samples of genes. Pgl-like genes are defined as those with average sequence identity to Pgl genes higher than the average sequence identity
to Pca genes by at least 0.2%. See also Figure S7 and Table S7.
inter-species mutations, N = length of the exon) to select exons that could
confidently distinguish Pgl and Pca. Exons that showed lower p values in
this test or higher inter-species variation than the COI barcode were considered to be nuclear barcode candidates. We further removed exons without
unique and confident (identity >40%, coverage >80%) orthologs in other
Lepidoptera genomes and those that could not distinguish other closely
related insect species. For the final barcode candidates, we tested their ability
to reflect the phylogeny by comparing the evolutionary trees (PhyML based on
the MAFFT alignment) built on them to those based on whole-genome data for
Drosophila species in FlyBase and Anopheles species in Vectorbase (Neafsey
et al., 2013), using TOPD/FMTS (Puigbo` et al., 2007) to quantify the similarity in
the topology of the trees.
ited in the NCBI SRA database under accession numbers SRX806850,
SRX806851, SRX806914, SRX806951, SRX807040, SRX807049, and
SRX807050. The sequence reads to assemble the genome have been deposited at the same database under accession numbers: SRR1707280,
SRR1707287, SRR1707316, SRR1707405, SRR1707569, SRR1707572, and
SRR1707573.
Studies of Papilio appalachiensis, the Hybrid Species
We detected and aligned orthologs among all Pgl, Pca, and Pap specimens
using the procedure described above. We assigned a Pap transcript to Pgl if
it was significantly (p < 0.05) different from all orthologs in Pca in a binomial
test (p = maximum intra-species variation rate for Pgl and Pca, m = minimum
mutation number compared to orthologs in Pca, n = length of the transcript)
and not different (p > 0.05) from the Pgl transcripts in another test (p =
maximum intra-species variation rate for Pgl and Pca, m = maximum mutation
number compared to orthologs in Pgl, n = length of the transcript). Pca-originated genes were assigned similarly. The numbers of statistically supported
Pgl- and Pca-originated transcripts were used to estimate the fraction of
Pap genes that were inherited from Pca.
We further tested if the Pgl-like genes tend to cluster in the genome by
comparing their distribution to random samples. In the first test, we counted
the number of Pgl-originated genes (p < 0.05) that have other Pgl-originated
genes (p < 0.05) in the same scaffold. In the second test, we identified genes
that showed higher sequence identities to orthologs from Pgl than to those
from Pca by a certain cutoff (0.2%, 0.4%, and 0.6%) and defined them as
Pgl-like genes. We calculated the percentage of Pgl-like genes [Pgl-like
genes/(Pgl-like genes + Pca-like genes)] in the neighborhood of the confident
Pgl-originated (p < 0.05) genes and random samples of the same size. Similar
tests were performed for Pca-like genes as well.
AUTHOR CONTRIBUTIONS
SUPPLEMENTAL INFORMATION
Supplemental Information includes Supplemental Experimental Procedures,
seven figures, and seven tables and can be found with this article online at
http://dx.doi.org/10.1016/j.celrep.2015.01.026.
Q.C. designed and performed experiments and computational analyses and
drafted the manuscript; D.B. and Z.O. designed and supervised experimental
studies and helped with data analyses; N.V.G. conceived and directed the
project. All authors wrote the manuscript.
ACKNOWLEDGMENTS
We acknowledge Texas Parks and Wildlife Department (Natural Resources
Program Director David H. Riskind) for the permit #08-02Rev that makes
research based on material collected in Texas State Parks possible. We thank
Jeremy Semeiks for suggestions on sequence data processing, Johann Deisenhofer, Lisa N. Kinch, R. Dustin Schaeffer, and Raquel Bromberg for critical
suggestions and proofreading of the manuscript. Q.C. is a Howard Hughes
Medical Institute International Student Research fellow. This work was supported in part by the NIH (GM094575 to N.V.G.) and the Welch Foundation
(I-1505 to N.V.G.).
Received: October 17, 2014
Revised: December 19, 2014
Accepted: January 9, 2015
Published: February 12, 2015
ACCESSION NUMBERS
REFERENCES
The genome sequence has been deposited at DDBJ/EMBL/GenBank under
the accession number JWHW00000000. The version described in this paper
is version JWHW01000000. The sequencing experiments have been depos-
8 Cell Reports 10, 1–10, February 17, 2015 ª2015 The Authors
Allendorf, F.W. (1986). Genetic drift and the loss of alleles versus heterozygosity. Zoo Biol. 5, 181–190.
Please cite this article in press as: Cong et al., Tiger Swallowtail Genome Reveals Mechanisms for Speciation and Caterpillar Chemical Defense, Cell
Reports (2015), http://dx.doi.org/10.1016/j.celrep.2015.01.026
Besemer, J., and Borodovsky, M. (2005). GeneMark: web software for gene
finding in prokaryotes, eukaryotes and viruses. Nucleic Acids Res. 33,
W451–W454.
Hey, J. (2010). The divergence of chimpanzee species and subspecies as revealed in multipopulation isolation-with-migration analyses. Mol. Biol. Evol. 27,
921–933.
Blanchardon, E., Grima, B., Klarsfeld, A., Che´lot, E., Hardin, P.E., Pre´at, T., and
Rouyer, F. (2001). Defining the role of Drosophila lateral neurons in the control
of circadian rhythms in motor activity and eclosion by targeted genetic ablation
and PERIOD protein overexpression. Eur. J. Neurosci. 13, 871–888.
Hey, J., and Nielsen, R. (2007). Integration within the Felsenstein equation for
improved Markov chain Monte Carlo methods in population genetics. Proc.
Natl. Acad. Sci. USA 104, 2785–2790.
Briscoe, A.D. (2000). Six opsins from the butterfly Papilio glaucus: molecular
phylogenetic evidence for paralogous origins of red-sensitive visual pigments
in insects. J. Mol. Evol. 51, 110–121.
Brody, T., and Cravchik, A. (2000). Drosophila melanogaster G proteincoupled receptors. J. Cell Biol. 150, F83–F88.
Brower, J.V.Z. (1958). Experimental studies of mimicry in some North American butterflies: Part II. Battus philenor and Papilio troilus, P. polyxenes and
P. glaucus. Evolution 12, 123–136.
Bruen, T., Phillipe, H., and Bryant, D. (2006). A quick and robust statistical test
to detect the presence of recombination. Genetics 172, 2665–2681.
Cantarel, B.L., Korf, I., Robb, S.M., Parra, G., Ross, E., Moore, B., Holt, C.,
Sa´nchez Alvarado, A., and Yandell, M. (2008). MAKER: an easy-to-use annotation pipeline designed for emerging model organism genomes. Genome
Res. 18, 188–196.
Chevreux, B., Wetter, T., and Suhai, S. (1999). Genome Sequence Assembly
Using Trace Signals and Additional Sequence Information. Computer Science
and Biology: Proceedings of the German Conference on Bioinformatics 99,
45–56.
Cong, Q., and Grishin, N.V. (2012). MESSA: MEta-Server for protein sequence
analysis. BMC Biol. 10, 82.
DePristo, M.A., Banks, E., Poplin, R., Garimella, K.V., Maguire, J.R., Hartl, C.,
Philippakis, A.A., del Angel, G., Rivas, M.A., Hanna, M., et al. (2011). A framework for variation discovery and genotyping using next-generation DNA
sequencing data. Nat. Genet. 43, 491–498.
Dhar, M.K., Koul, A., and Kaul, S. (2013). Farnesyl pyrophosphate synthase: a
key enzyme in isoprenoid biosynthetic pathway and potential molecular target
for drug development. New Biotechnol. 30, 114–123.
Duan, J., Li, R., Cheng, D., Fan, W., Zha, X., Cheng, T., Wu, Y., Wang, J., Mita,
K., Xiang, Z., and Xia, Q. (2010). SilkDB v2.0: a platform for silkworm (Bombyx
mori ) genome biology. Nucleic Acids Res. 38, D453–D456.
Eisner, T., and Meinwald, Y.C. (1965). Defensive Secretion of a Caterpillar
(Papilio). Science 150, 1733–1735.
Gascuel, O. (1997). BIONJ: an improved version of the NJ algorithm based on a
simple model of sequence data. Mol. Biol. Evol. 14, 685–695.
Guindon, S., Dufayard, J.F., Lefort, V., Anisimova, M., Hordijk, W., and Gascuel, O. (2010). New algorithms and methods to estimate maximum-likelihood
phylogenies: assessing the performance of PhyML 3.0. Syst. Biol. 59,
307–321.
Haas, B.J., Salzberg, S.L., Zhu, W., Pertea, M., Allen, J.E., Orvis, J., White, O.,
Buell, C.R., and Wortman, J.R. (2008). Automated eukaryotic gene structure
annotation using EVidenceModeler and the Program to Assemble Spliced
Alignments. Genome Biol. 9, R7.
Haas, B.J., Papanicolaou, A., Yassour, M., Grabherr, M., Blood, P.D., Bowden,
J., Couger, M.B., Eccles, D., Li, B., Lieber, M., et al. (2013). De novo transcript
sequence reconstruction from RNA-seq using the Trinity platform for reference
generation and analysis. Nat. Protoc. 8, 1494–1512.
Hagen, R.H., and Scriber, J.M. (1989). Sex-linked diapause, color, and allozyme loci in Papilio glaucus: linkage analysis and significance in a hybrid
zone. J. Hered. 80, 179–185.
Huang, W., Sherman, B.T., and Lempicki, R.A. (2009). Systematic and integrative analysis of large gene lists using DAVID bioinformatics resources. Nat.
Protoc. 4, 44–57.
Huang, N., Chelliah, Y., Shan, Y., Taylor, C.A., Yoo, S.H., Partch, C., Green,
C.B., Zhang, H., and Takahashi, J.S. (2012). Crystal structure of the heterodimeric CLOCK:BMAL1 transcriptional activator complex. Science 337,
189–194.
International Silkworm Genome Consortium (2008). The genome of a lepidopteran model insect, the silkworm Bombyx mori. Insect Biochem. Mol. Biol. 38,
1036–1045.
Jones, D.T., Taylor, W.R., and Thornton, J.M. (1992). The rapid generation of
mutation data matrices from protein sequences. Comput. Appl. Biosci. 8,
275–282.
Jones, P., Binns, D., Chang, H.Y., Fraser, M., Li, W., McAnulla, C., McWilliam,
H., Maslen, J., Mitchell, A., Nuka, G., et al. (2014). InterProScan 5: genomescale protein function classification. Bioinformatics 30, 1236–1240.
Jurka, J., Klonowski, P., Dagman, V., and Pelton, P. (1996). CENSOR—a program for identification and elimination of repetitive elements from DNA
sequences. Comput. Chem. 20, 119–121.
Jurka, J., Kapitonov, V.V., Pavlicek, A., Klonowski, P., Kohany, O., and Walichiewicz, J. (2005). Repbase Update, a database of eukaryotic repetitive elements. Cytogenet. Genome Res. 110, 462–467.
Kajitani, R., Toshimoto, K., Noguchi, H., Toyoda, A., Ogura, Y., Okuno, M.,
Yabana, M., Harada, M., Nagayasu, E., Maruyama, H., et al. (2014). Efficient
de novo assembly of highly heterozygous genomes from whole-genome
shotgun short reads. Genome Res. 24, 1384–1395.
Kaneko, H., Head, L.M., Ling, J., Tang, X., Liu, Y., Hardin, P.E., Emery, P., and
Hamada, F.N. (2012). Circadian rhythm of temperature preference and its neural control in Drosophila. Curr. Biol. 22, 1851–1857.
Katoh, K., and Standley, D.M. (2013). MAFFT multiple sequence alignment
software version 7: improvements in performance and usability. Mol. Biol.
Evol. 30, 772–780.
Kelley, D.R., Schatz, M.C., and Salzberg, S.L. (2010). Quake: quality-aware
detection and correction of sequencing errors. Genome Biol. 11, R116.
Kim, D., Pertea, G., Trapnell, C., Pimentel, H., Kelley, R., and Salzberg, S.L.
(2013). TopHat2: accurate alignment of transcriptomes in the presence of insertions, deletions and gene fusions. Genome Biol. 14, R36.
Korf, I. (2004). Gene finding in novel genomes. BMC Bioinformatics 5, 59.
Kunte, K., Shea, C., Aardema, M.L., Scriber, J.M., Juenger, T.E., Gilbert, L.E.,
and Kronforst, M.R. (2011). Sex chromosome mosaicism and hybrid speciation among tiger swallowtail butterflies. PLoS Genet. 7, e1002274.
Kunte, K., Zhang, W., Tenger-Trolander, A., Palmer, D.H., Martin, A., Reed,
R.D., Mullen, S.P., and Kronforst, M.R. (2014). doublesex is a mimicry supergene. Nature 507, 229–232.
Langmead, B., and Salzberg, S.L. (2012). Fast gapped-read alignment with
Bowtie 2. Nat. Methods 9, 357–359.
Li, L., Stoeckert, C.J., Jr., and Roos, D.S. (2003). OrthoMCL: identification of
ortholog groups for eukaryotic genomes. Genome Res. 13, 2178–2189.
Hagen, R.H., Lederhouse, R.C., Bossart, J.L., and Scriber, J.M. (1991). Papilio
canadensis and P. glaucus are distinct species. J. Lepid. Soc. 45, 245–258.
Li, H., Handsaker, B., Wysoker, A., Fennell, T., Ruan, J., Homer, N., Marth, G.,
Abecasis, G., and Durbin, R.; 1000 Genome Project Data Processing Subgroup (2009). The Sequence Alignment/Map format and SAMtools. Bioinformatics 25, 2078–2079.
Heliconius Genome, C.; Heliconius Genome Consortium (2012). Butterfly
genome reveals promiscuous exchange of mimicry adaptations among species. Nature 487, 94–98.
Majoros, W.H., Pertea, M., and Salzberg, S.L. (2004). TigrScan and
GlimmerHMM: two open source ab initio eukaryotic gene-finders. Bioinformatics 20, 2878–2879.
Cell Reports 10, 1–10, February 17, 2015 ª2015 The Authors 9
Please cite this article in press as: Cong et al., Tiger Swallowtail Genome Reveals Mechanisms for Speciation and Caterpillar Chemical Defense, Cell
Reports (2015), http://dx.doi.org/10.1016/j.celrep.2015.01.026
Marc¸ais, G., and Kingsford, C. (2011). A fast, lock-free approach for efficient
parallel counting of occurrences of k-mers. Bioinformatics 27, 764–770.
Misra, S., Crosby, M.A., Mungall, C.J., Matthews, B.B., Campbell, K.S., Hradecky, P., Huang, Y., Kaminker, J.S., Millburn, G.H., Prochnik, S.E., et al.
(2002). Annotation of the Drosophila melanogaster euchromatic genome: a
systematic review. Genome biology 3, RESEARCH0083.
Myers, E.M., Yu, J., and Sehgal, A. (2003). Circadian control of eclosion: interaction between a central and peripheral clock in Drosophila melanogaster.
Current biology: CB 13, 526–533.
Neafsey, D.E., Christophides, G.K., Collins, F.H., Emrich, S.J., Fontaine, M.C.,
Gelbart, W., Hahn, M.W., Howell, P.I., Kafatos, F.C., Lawson, D., et al. (2013).
The evolution of the Anopheles 16 genomes project. G3 3, 1191–1194.
Parra, G., Bradnam, K., and Korf, I. (2007). CEGMA: a pipeline to accurately
annotate core genes in eukaryotic genomes. Bioinformatics 23, 1061–1067.
Pavulaan, H., and Wright, D.M. (2002). Pterourus appalachiensis (Papilionidae:
Papilioninae), a new swallowtail butterfly from the Appalachian region of
the United States. Taxonomic Report of the International Lepidoptera Survery
3, 1–10.
Suzek, B.E., Huang, H., McGarvey, P., Mazumder, R., and Wu, C.H. (2007).
UniRef: comprehensive and non-redundant UniProt reference clusters. Bioinformatics 23, 1282–1288.
Tang, W., Yu, L., He, W., Yang, G., Ke, F., Baxter, S.W., You, S., Douglas, C.J.,
and You, M. (2014). DBM-DB: the diamondback moth genome database.
Database 2014, bat087.
Truman, J.W. (2005). Hormonal control of insect ecdysis: endocrine cascades
for coordinating behavior with physiology. Vitam. Horm. 73, 1–30.
UniProt Consortium (2014). Activities at the Universal Protein Resource
(UniProt). Nucleic Acids Res. 42, D191–D198.
Van Nieuwerburgh, F., Thompson, R.C., Ledesma, J., Deforce, D., Gaasterland, T., Ordoukhanian, P., and Head, S.R. (2012). Illumina mate-paired DNA
sequencing-library preparation using Cre-Lox recombination. Nucleic Acids
Res. 40, e24.
Whitworth, T.L., Dawson, R.D., Magalon, H., and Baudry, E. (2007). DNA barcoding cannot reliably identify species of the blowfly genus Protocalliphora
(Diptera: Calliphoridae). Proc. Biol. Sci. 274, 1731–1739.
Pei, J., Kim, B.H., and Grishin, N.V. (2008). PROMALS3D: a tool for multiple
protein sequence and structure alignments. Nucleic Acids Res. 36, 2295–
2300.
Xia, Q., Zhou, Z., Lu, C., Cheng, D., Dai, F., Li, B., Zhao, P., Zha, X., Cheng, T.,
Chai, C., et al.; Biology Analysis Group (2004). A draft sequence for the
genome of the domesticated silkworm (Bombyx mori). Science 306, 1937–
1940.
Puigbo`, P., Garcia-Vallve´, S., and McInerney, J.O. (2007). TOPD/FMTS: a new
software to compare phylogenetic trees. Bioinformatics 23, 1556–1558.
Yang, Z. (2007). PAML 4: phylogenetic analysis by maximum likelihood. Mol.
Biol. Evol. 24, 1586–1591.
Roberts, A., Pimentel, H., Trapnell, C., and Pachter, L. (2011). Identification of
novel transcripts in annotated genomes using RNA-Seq. Bioinformatics 27,
2325–2329.
You, M., Yue, Z., He, W., Yang, X., Yang, G., Xie, M., Zhan, D., Baxter, S.W.,
Vasseur, L., Gurr, G.M., et al. (2013). A heterozygous moth genome provides
insights into herbivory and detoxification. Nat. Genet. 45, 220–225.
She, R., Chu, J.S., Uyar, B., Wang, J., Wang, K., and Chen, N. (2011). genBlastG: using BLAST searches to build homologous gene models. Bioinformatics 27, 2141–2143.
Zhan, S., and Reppert, S.M. (2013). MonarchBase: the monarch butterfly
genome database. Nucleic Acids Res. 41, D758–D763.
Slater, G.S., and Birney, E. (2005). Automated generation of heuristics for biological sequence comparison. BMC Bioinformatics 6, 31.
Smit, A.F.A., and Hubley, R. (2010). RepeatModeler Open-1.0 (Seattle: The
Institute for Systems Biology).
Smit, A.F.A., Hubley, R., and Green, P. (2010). RepeatMasker Open-3.0 (Seattle: The Institute for Systems Biology).
Zhan, S., Merlin, C., Boore, J.L., and Reppert, S.M. (2011). The monarch butterfly genome yields insights into long-distance migration. Cell 147, 1171–
1185.
Zhang, W., Kunte, K., and Kronforst, M.R. (2013a). Genome-wide characterization of adaptation and speciation in tiger swallowtail butterflies using de
novo transcriptome assemblies. Genome Biol. Evol. 5, 1233–1245.
St Pierre, S.E., Ponting, L., Stefancsik, R., and McQuilton, P.; FlyBase Consortium (2014). FlyBase 102—advanced approaches to interrogating FlyBase.
Nucleic Acids Res. 42, D780–D788.
Zhang, Y., Zhu, W., Liu, Y.L., Wang, H., Wang, K., Li, K., No, J.H., Ayong, L.,
Gulati, A., Pang, R., et al. (2013b). Chemo-immunotherapeutic anti-malarials
targeting isoprenoid biosynthesis. ACS medicinal chemistry letters 4,
423–427.
Stanke, M., Scho¨ffmann, O., Morgenstern, B., and Waack, S. (2006). Gene
prediction in eukaryotes with a generalized hidden Markov model that uses
hints from external sources. BMC Bioinformatics 7, 62.
Zhong, Y.F., and Holland, P.W. (2011). HomeoDB2: functional expansion of a
comparative homeobox gene database for evolutionary developmental
biology. Evol. Dev. 13, 567–568.
Storey, J.D., and Tibshirani, R. (2003). Statistical significance for genomewide
studies. Proc. Natl. Acad. Sci. USA 100, 9440–9445.
Supek, F., Bo
snjak, M., Skunca,
N., and Smuc,
T. (2011). REVIGO summarizes
Zhu, H., Sauman, I., Yuan, Q., Casselman, A., Emery-Le, M., Emery, P., and
Reppert, S.M. (2008). Cryptochromes define a novel circadian clock mechanism in monarch butterflies that may underlie sun compass navigation. PLoS
Biol. 6, e4.
and visualizes long lists of gene ontology terms. PLoS ONE 6, e21800.
10 Cell Reports 10, 1–10, February 17, 2015 ª2015 The Authors


© Copyright 2026