
International Journal of Geographical Information Science
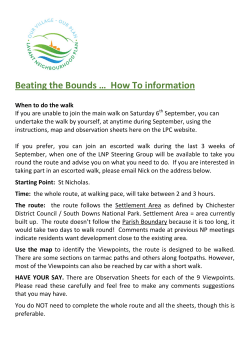
International Journal of Geographical Information Science Decision L etter ( I J GI S-2 0 1 5 -0 0 1 0 ) (Accepted letter) From : [email protected] To: [email protected] CC: Su bject: International Journal of Geographical Information Science - Decision on Manuscript ID IJGIS-2015-0010 Body: 10-Feb-2015 Dear Dr. Chang: Manuscript ID IJGIS-2015-0010 entitled "Route Planning and Cost Analysis for Travelling through Arctic Northeast Passage Using Public 3D GIS" which you submitted to the International Journal of Geographical Information Science, has been reviewed. The comments of the reviewers are included at the bottom of this letter. The reviewers have recommended publication, but also suggest some minor revisions to your manuscript. Therefore, I invite you to respond to the reviewers' comments and revise your manuscript. Please try to avoid making the paper longer (keep in mind that the average length of papers in this journal is 18-20 published pages). It is important that you take note of our new practice of putting accepted papers up on our web site prior to proof reading and typesetting. Whilst this has the considerable advantage of making your paper available to colleagues quickly, it also does mean that you need to ensure that the spelling and grammar is of a high standard. To revise your manuscript, please select the link below, which will take you your decision letter, and where you need to resubmit your manuscript. https://mc.manuscriptcentral.com/ijgis?URL_MASK=c8991414bcfd4367a65e7a2a4538cece You will be unable to make your revisions on the originally submitted version of the manuscript. Instead, revise your manuscript using a word processing program and save it on your computer. Please also highlight the changes to your manuscript within the document by using the track changes mode in MS Word or by using bold or colored text. Once the revised manuscript is prepared, you can upload it and submit it through your Author Center. When submitting your revised manuscript, you will be able to respond to the comments made by the reviewers in the space provided. You can use this space to document any changes you make to the original manuscript. In order to expedite the processing of the revised International Journal of Geographical Information Science rP Fo Route Planning and Cost Analysis for Travelling through Arctic Northeast Passage Using Public 3D GIS Manuscript Type: Draft Research Article Geographic Information Systems < Keywords Relating to Theory, Simulation < Keywords Relating to Theory, Web GIS < Keywords Relating to Theory, Route planning < Keywords Relating to Theory w ie ev Keywords: International Journal of Geographical Information Science rR Manuscript ID: ee Journal: ly On http://mc.manuscriptcentral.com/tandf/ijgis Page 1 of 25 Route Planning and Cost Analysis for Travelling through Arctic Northeast Passage Using Public 3D GIS To plan undeveloped optimal routes between Asia and Europe via the Arctic Northeast Passages using a 3D geographic information system (GIS), voyage paths are simulated in a Fo 3D visual form. This ensures that the distances are calculated accurately, and that other voyage data such as water depths, sea ice distribution, and seashore topology are also easily rP deciphered, giving a more direct and clear demonstration compared to simplified presentations on an Electronic Chart Display & Information System (ECDIS). This article also implements a higher-geometry maze router in ice zone areas to obtain the optimal path ee in relation to safety and costs. This paper compares the optimal Arctic Northeast Passages with traditional routes through the Suez Canal for dynamic analyses of the cost efficiency rR (including time costs, fuel costs, and other factors) of travel between major ports in Asia and Europe. The average benefit assessment is around 30%~45% in a bulk carrier comparison. ev Thus, a 3D GIS can easily obtain and demonstrate safe navigation routes, providing a very convenient tool for initial planning. iew Keywords: Arctic Northeast Passage; route planning; route cost analysis; higher-geometry maze router 1. Introduction On The Arctic Ocean has been covered by ice for thousands of years, with the ice areas ly 1 2 3 4 5 6 7 8 9 10 11 12 13 14 15 16 17 18 19 20 21 22 23 24 25 26 27 28 29 30 31 32 33 34 35 36 37 38 39 40 41 42 43 44 45 46 47 48 49 50 51 52 53 54 55 56 57 58 59 60 International Journal of Geographical Information Science narrowing the opening of the Arctic waterway; however, global warming in recent years has caused the Arctic ice to melt (Polyakov et al. 2012). Therefore, the openings of the Arctic waterways are not as narrow as before, causing the countries that neighbor the Arctic Ocean to begin actively exploring these Arctic waterways and collecting information regarding Arctic waters and terrain for a new Arctic route. The current exploration has focused on three Arctic waterways: the Northeast Passage, 1 http://mc.manuscriptcentral.com/tandf/ijgis International Journal of Geographical Information Science Northwest Passage, and a potential route through the center of the Arctic (Østreng et al. 2013). Because the central area of the Arctic Ocean has been covered by a thick ice layer for many years, this route would be the last to open and the reason this route has not yet been exploited. The yellow and red routes shown in Figure 1 illustrate the possible Northeast Passage and Northwest Passage, respectively. iew ev rR ee rP Fo Figure 1. Depictions of possible Northeast Passage and Northwest Passage in 3D using Google Earth On The Northeast Passage has recently attracted the attention of numerous Asian countries such as China, South Korea, and Japan, who have begun to build ships with superior ly 1 2 3 4 5 6 7 8 9 10 11 12 13 14 15 16 17 18 19 20 21 22 23 24 25 26 27 28 29 30 31 32 33 34 35 36 37 38 39 40 41 42 43 44 45 46 47 48 49 50 51 52 53 54 55 56 57 58 59 60 Page 2 of 25 ice-breaking capabilities to explore Arctic regions and understand the geographic environment (Wergeland and Østreng 2013, IMRF 2014). Although numerous ships have been dispatched from Asia to collect navigation information about the Arctic Ocean, there is still limited knowledge about such routes. Merchant ships of China recently sailed the Northeast Passage from Dalian to Rotterdam for the first time, which showed that this voyage can save about nine navigational days compared to the traditional Suez Canal route 2 http://mc.manuscriptcentral.com/tandf/ijgis Page 3 of 25 (Huang et al. 2014). For Arctic shipping models, Lasserre listed all the related research from 1991 to 2013 (Lasserre 2014). Arctic Routes have been studied for two decades ((Wergeland 1992, Mulherin 1996, Kamesaki et al. 1999, Kitagawa et al. 2001, Griffiths 2005, Arpiainen and Kiili 2006, Guy 2006, Somanathan et al. 2007), and many studies have investigated the economics and accessibility of this route (Borgerson 2008, Dvorak 2009, Verny and Grigentin 2009, Chernova and Volkov 2010, Srinath 2010, Liu and Kronbak 2010, Paterson Fo 2011, Schøyen and Bråthen 2011, Carmel 2012, Falck 2012, Stephenson et al. 2013). rP Because of the increasing advancement and convenience of network information, new navigation routes presented using a 3D geographic information system (GIS) are more ee clearly understood (Steiniger and Hunter 2013). Reflecting the phrase “a picture is worth a thousand words,” a 3D GIS provides users with simulated environmental images of the rR routes desired, increasing the ease of comprehension and route planning. There are many geographic information systems on the market. Representative products include ArcGIS, ev MapGIS, SuperGIS, GeoMedia, GeoStar, and MapInfo (Pang et al. 2013). When planning iew new routes, 3D GISs and network platforms can be integrated to analyze the various required costs and identify the most cost-efficient route, thereby offering users a collaborative problem-solving method. As mentioned in the IMO Polar Code, neither the IMO On Performance Standard for ECDIS nor the IEC test standard for ECDIS (IEC 61174) specifically mentions the display of ENCs at high latitudes, and as most ECDISs display ly 1 2 3 4 5 6 7 8 9 10 11 12 13 14 15 16 17 18 19 20 21 22 23 24 25 26 27 28 29 30 31 32 33 34 35 36 37 38 39 40 41 42 43 44 45 46 47 48 49 50 51 52 53 54 55 56 57 58 59 60 International Journal of Geographical Information Science their charts in Mercator form, which cannot correctly show the polar regions (Anon. 2013). ECDIS uses gnomonic projection in polar areas (Andriani Skopeliti and Tsoulos 2014). Google Earth displays the earth in 3D, which is suitable for the polar region and arctic planning. In this study, Google Earth was chosen as a network GIS because it is free to access and commonly used. This application software is a virtual globe software program developed by 3 http://mc.manuscriptcentral.com/tandf/ijgis International Journal of Geographical Information Science Google that uses satellite imagery, aerial photography, and GISs to map a 3D model of the earth. In 2009, it began providing a seafloor topography service that allows users to observe the terrain of the seafloor. The software also includes precise information about the depth, weather, sea ice, and other diverse layers to facilitate route planning. The development of visible routes is primarily focused on Arctic routes through the Arctic Ocean that link the three continents of Asia, Europe, and North America. This study adopted Google Earth route Fo planning features, which are capable of 3D visual simulations (Patterson 2007, Britt and LaFontaine 2009). In addition, this study employed the elevation profile feature to determine rP water depths and Arctic Ocean sea ice distribution layers for the planning of the Northeast Passage (NEP). Next, the distance deviations were found between actual navigation routes ee and the routes using Google Earth to prove that Google Earth is accurate and capable. After rR the route planning was completed, this study compared the shipping costs between the Northeast Passage and the traditional Suez Canal route. Other than the time and distance ev costs, the percentage of costs generated by other uncertain factors were determined to factor in the cost benefit margins between the two routes and provide decision makers with iew additional information to select the most profitable route. Recently, the IMO (International Maritime Organization) has been developing a draft International code of safety for ships On operating in polar waters (Polar Code), which would cover the full range of design, construction, equipment, operation, training, search and rescue, and environmental protection ly 1 2 3 4 5 6 7 8 9 10 11 12 13 14 15 16 17 18 19 20 21 22 23 24 25 26 27 28 29 30 31 32 33 34 35 36 37 38 39 40 41 42 43 44 45 46 47 48 49 50 51 52 53 54 55 56 57 58 59 60 Page 4 of 25 matters relevant to ships operating in the inhospitable waters surrounding the two poles (IMO 2012). This paper is organized as follows: The procedure for planning the Arctic Northeast route is shown in section 2, and further cost functions and benefit assessments are presented in sections 3 and 4. 2. Route Planning Before route planning, the deviations between the planned routes using Google Earth and 4 http://mc.manuscriptcentral.com/tandf/ijgis Page 5 of 25 the actual routes were examined. The actual navigation route data were obtained by referencing the actual Evergreen China-Europe Shuttle Service (CES) data. When inputting corresponding waypoint values into Google earth and obtaining the Google Earth distances for such routes, the differences between them were negligible, proving that Google Earth has accurate distance values and is suitable for route planning. 2.1 Distance Accuracy for Route Planning Fo The schematic diagram of the European shipping route taken by Evergreen CES from rP the port of Kaohsiung in Taiwan to the port of Rotterdam in the Netherlands was adopted to reflect the traditional Suez Canal route. As shown in Figure 2, the red line denotes the route ee from the port of Kaohsiung to the port of Rotterdam, and the blue line denotes the return route from the port of Rotterdam through Hamburg in Germany and the River Thames in the rR United Kingdom, and finally returning to the port of Kaohsiung through the original route (Evergreen 1999-2012). iew ev On Figure 2. Schematic diagram of Evergreen CES navigation route ly 1 2 3 4 5 6 7 8 9 10 11 12 13 14 15 16 17 18 19 20 21 22 23 24 25 26 27 28 29 30 31 32 33 34 35 36 37 38 39 40 41 42 43 44 45 46 47 48 49 50 51 52 53 54 55 56 57 58 59 60 International Journal of Geographical Information Science Based on the statistics of the above routes obtained through Google Earth and the actual route data obtained through Evergreen, the greatest deviation between any two waypoints was calculated to be 0.01993, giving a maximum error of approximately 2%. This confirmed that Google Earth is good at approximating the path length as a planning tool. 2.2 Route Planning using Google Earth To plan a feasible route, the water depths must also be considered. A tentative route was 5 http://mc.manuscriptcentral.com/tandf/ijgis International Journal of Geographical Information Science first planned by determining the ocean depth’s color in Google Earth’s display. Next, slight adjustments to the route were further implemented using the Google Earth elevation profile feature to ensure that the ocean depth remained constant, and the risk of grounding was avoided. Based on the three climatic characteristics, the Northeast Passage was divided into four sections. The first and fourth sections comprise the route from the departure port to the Bering Strait and from the Barents Sea to the port of destination, respectively; these two Fo sections were classified as the general navigation areas. The second area, which spanned the distance between the entrance and exit points of the Bering Strait, was classified as a rP navigation area with a high possibility of fog (H-P fog) because of the high frequency of summer fogs in the region (Fett et al. 1993). Navigational speed should be reduced when ee travelling through this area. The third area was classified as the ice-zone navigation area and rR comprised the travel distance in the Arctic Ocean. It is advised that the travelling speed in this ice-zone area should be restricted to about 6~8 kn (Worby et al. 2008, Veritas 2009). ev Navigating in Arctic areas must take into account the distribution of the Arctic floating ice areas and must also be assisted by the elevation profile feature to determine the water depth. iew Information regarding the Arctic floating ice distribution can be obtained by referencing the Arctic Ocean sea ice distribution timeline provided by the U.S. National Snow and Ice Data On Centre (as shown in Figure 6). For the sea ice area, the costs of avoiding ice and breaking ice (icebreaker) are different. Therefore, it is necessary to map the ice sea area for further calculation to search for the minimum-cost or optimal route. ly 1 2 3 4 5 6 7 8 9 10 11 12 13 14 15 16 17 18 19 20 21 22 23 24 25 26 27 28 29 30 31 32 33 34 35 36 37 38 39 40 41 42 43 44 45 46 47 48 49 50 51 52 53 54 55 56 57 58 59 60 Page 6 of 25 2.3 Route Planning by Higher-geometry Router in Sea Ice Area The Arctic Ocean sea ice distribution diagram allows users to plan routes that avoid sea ice while maintaining sufficient water depth for safe passage. To optimize the planning route, a higher-geometry maze router with weighted regions (Jan et al. 2008, Chang et al. 2003) is implemented as shown below. A detailed description of the algorithm is given in Appendix A. 6 http://mc.manuscriptcentral.com/tandf/ijgis Page 7 of 25 Regarding the route planning for ice areas, areas where the ice is thinner than 1 m were assumed to be generally navigable with an icebreaker (Dichtel 1951). For an ice-strengthened ship, the navigable ice thickness depends on the ship class certification (Veritas 2009). The information regarding ice thickness was obtained using satellites and detection by navigation instruments of the surrounding sea areas. Google Earth was used to calculate voyage distances, and the distance data of the initial planned routes were displayed Fo in a window. Then, maze routing and turn penalties were adopted to seek the optimal path by the proposed method. rP Nautical charts from Google Earth are color images that include data such as the water ee depth, and latitude and longitude coordinates. This route planning method determines navigability through wave propagation and marks the results using colors. Therefore, route rR planning can be completed by propagating a wave from the starting point to the terminal point to identify the water depth and area features. The Arctic Ocean was divided into five ev areas using different colors. Land was marked in yellow, and coastal areas not deep enough iew for navigation were marked in green. The Arctic ice was divided into thick and thin ice areas. The thin ice areas were presented in light blue, indicating navigability with icebreakers, whereas the thick ice areas unnavigable for icebreakers were marked in white. The other On ice-free areas of sufficient water depth were marked in dark blue (Figure 3(a)). ly 1 2 3 4 5 6 7 8 9 10 11 12 13 14 15 16 17 18 19 20 21 22 23 24 25 26 27 28 29 30 31 32 33 34 35 36 37 38 39 40 41 42 43 44 45 46 47 48 49 50 51 52 53 54 55 56 57 58 59 60 International Journal of Geographical Information Science Figure 3(a). Arctic Ocean divided into five area types Figure 3(b). Converted grid plane with three area types The five ocean area types were converted to a grid plane with three area types for 7 http://mc.manuscriptcentral.com/tandf/ijgis International Journal of Geographical Information Science implementation of the higher-geometry maze router to optimize the planning route. The unnavigable land, shallow sea, and thick ice areas were assigned a weight of ∞ in black . Ships could break the ice and navigate through thin ice areas, but the incurred costs were relatively higher than the cost of sailing in the dark blue navigable areas. Therefore, the thin ice areas were assigned a weight of two in grey, and the dark blue of the ocean was assigned a weight of one in white, as shown in Figure 3(b). After assigning the weights of all the areas’ Fo grid graphs, a higher-geometry maze router was employed to calculate wave propagations for determining the minimum-cost path. It should be noted that the propagation speed for the rP weight value of two was half that of the weight value of one. The calculation began from the starting point and expanded in all directions until all the grids of the navigable areas were ee calculated. The calculation ended when the target point was reached, and the path with the rR least costs was attained by backtracking (Figure 4(a)). Therefore, assigning a weight to the thin ice areas facilitated finding an optimal path through the ice areas and avoiding the ev obstacles in the unnavigable areas (Figure 4(b)). iew ly On 1 2 3 4 5 6 7 8 9 10 11 12 13 14 15 16 17 18 19 20 21 22 23 24 25 26 27 28 29 30 31 32 33 34 35 36 37 38 39 40 41 42 43 44 45 46 47 48 49 50 51 52 53 54 55 56 57 58 59 60 Page 8 of 25 (a) (b) Figure 4. Completed route planning in areas of Arctic Ocean 2.4 Flow Chart of Northeast Passage Planning For the initial planning of the Arctic Northeast route, four waypoint areas were determined if the reference water depth was navigable. The general navigation area involved sailing at 8 http://mc.manuscriptcentral.com/tandf/ijgis Page 9 of 25 normal speed and routing based on the designated water depths from Google. The ship speed could be reduced while sailing in the navigation area with (H-P fog). For the ice sea area, the minimum cost (optimal) path could be obtained using the algorithm of the higher‐geometry maze router with weighted regions. Once the entire route path was obtained, the voyage cost function (calculated by Excel) was built-in for dynamic cost estimation. The visible simulation of the voyage was displayed, and the potential benefit was also shown in a Fo webpage window for consideration. The flow chart of this study is shown in Figure 5. iew ev rR ee rP ly On 1 2 3 4 5 6 7 8 9 10 11 12 13 14 15 16 17 18 19 20 21 22 23 24 25 26 27 28 29 30 31 32 33 34 35 36 37 38 39 40 41 42 43 44 45 46 47 48 49 50 51 52 53 54 55 56 57 58 59 60 International Journal of Geographical Information Science 9 http://mc.manuscriptcentral.com/tandf/ijgis International Journal of Geographical Information Science Initial planning INPUT Departure and destination Route planning by Google Earth Reference water depth data Divided into four areas with different speeds YES rP Fo According to ice sea thickness and iceb sea distribution to determine path is in ice zone or not NO Optimal path based on higher geometry maze router with turn penalty ee General navigation/ Navigation area with H-P fog Simulate the entire route path Formulate the voyage cost function ev rR Benefit assessment iew Webpage of Cost-benefit analysis Display route planning Dynamic cost estimate and benefit Visible 3D simulation of the path END ly On 1 2 3 4 5 6 7 8 9 10 11 12 13 14 15 16 17 18 19 20 21 22 23 24 25 26 27 28 29 30 31 32 33 34 35 36 37 38 39 40 41 42 43 44 45 46 47 48 49 50 51 52 53 54 55 56 57 58 59 60 Page 10 of 25 Figure 5. Flow chart of Arctic Northeast route planning 2.5 Planning of Northeast Passage To plan a feasible route, the water depths also had to be considered. A tentative route was first planned by determining the ocean depths based on the colors in Google Earth’s display. Next, slight adjustments to the route were further implemented using the Google Earth elevation profile feature to ensure that the ocean depth remained constant, and the risk of 10 http://mc.manuscriptcentral.com/tandf/ijgis Page 11 of 25 grounding was avoided. The Northeast Passage was divided into four areas based on the climatic characteristics of the area. These areas comprised two general navigation areas at the start and end, a navigation area with H-P fog, and an arctic floating ice area, as shown in Figure 6. When travelling the traditional Suez route, ships must reduce their speed upon entering the Suez Canal, causing the route to be divided into two areas, namely, a general navigation area and the Suez Canal area. iew ev rR ee rP Fo ly On 1 2 3 4 5 6 7 8 9 10 11 12 13 14 15 16 17 18 19 20 21 22 23 24 25 26 27 28 29 30 31 32 33 34 35 36 37 38 39 40 41 42 43 44 45 46 47 48 49 50 51 52 53 54 55 56 57 58 59 60 International Journal of Geographical Information Science Figure 6. Schematic of planned Arctic route and floating ice layers The depth profile in Figure 6 includes an overview of the NEP with the designated water depths for navigation to prevent the ship from grounding. In this study, the departure and destination ports were first selected, and routes were planned according to the water depth data provided by Google Earth. Regarding Arctic routes, different navigation speeds were set in various areas, and it was determined whether the areas were suitable for ice navigation 11 http://mc.manuscriptcentral.com/tandf/ijgis International Journal of Geographical Information Science according to the water depth data, sea ice thickness, and sea ice distribution areas. The sea ice had a piecewise distribution that was considered using weighted regions. Therefore, the ship routing model (Mannarini et al. 2013) was not suitable for this case. Maze routing and turn penalties are necessary route planning methods (Szlapczynski 2006, Jan et al. 2008, Chang et al. 2013) for ice navigation, identifying the optimal paths to enhance the accuracy of route planning. After planning the general navigation, fog, and ice areas, the latitude and Fo longitude coordinates of the turning points were exported to Google Earth and the entire route was simulated by applying the Google Earth tour simulation. Subsequently, a voyage rP cost function was formulated to calculate the costs of the Northeast and traditional routes. The two costs were compared. Their benefits were assessed, and the results were expressed ee in benefit margins. Finally, the planned routes and outcomes of the benefit assessment were rR displayed on a webpage to present the results simultaneously. Google Earth was used to simulate the navigation environment. In addition to water depth ev data, the planning process also employed the 3D seafloor topography (bathymetry), which iew could provide a better understanding of the water depth and underwater topography. It should be noted that Google Earth is not yet officially certified as an ECDIS, which means it cannot be used as an actual navigation tool. However, it is useful for route simulation On planning using overall 3D images based on accurate voyage data. A certified ECDIS needs to be approved by an officially authorized or flag state to enhance navigation safety and particularly to prevent ships from grounding (Hecht 2002). ly 1 2 3 4 5 6 7 8 9 10 11 12 13 14 15 16 17 18 19 20 21 22 23 24 25 26 27 28 29 30 31 32 33 34 35 36 37 38 39 40 41 42 43 44 45 46 47 48 49 50 51 52 53 54 55 56 57 58 59 60 Page 12 of 25 This study created a route planning website for readers. The method used to plan the routes from the port of Shanghai in China to the port of Rotterdam in the Netherlands was also used to plan other routes. Google Earth was embedded into a self-made website for route planning. A total of five ports in Asia were included, namely, the port of Shanghai in China, port of Tokyo in Japan, port of Busan in South Korea, port of Hong Kong in China, 12 http://mc.manuscriptcentral.com/tandf/ijgis Page 13 of 25 and port of Kaohsiung in Taiwan. Additionally, three European ports were incorporated, namely, the port of Oslo in Norway, port of Rotterdam in the Netherlands, and port of Hamburg in Germany. Permutations of these eight ports generate 15 possible routes. The shipping costs of the various routes were assessed based on the cost variations. Therefore, 15 possible routes and their estimated costs could be established and presented to the reader. 3. Formulating Voyage Cost Function Fo Concerning trip-time costs for charters, charterers must bear fixed costs such as the cost rP of renting the ship. The rental cost of the ship is typically determined according to current market conditions. Regarding variable costs, charterers must cover the voyage distance, fuel ee consumption, and discretionary costs generated by other uncertain factors. The objective function of the minimum voyage cost is shown below (Lin 2010). rR Min. CTotal CTt Exoil P _ mol Exch (1) ev where CTt represents the ship’s total time cost, Exoil represents the total voyage fuel cost, P_mol represents models of propulsion systems (the value is subject to a ship model), and iew Exch represents the discretionary costs generated by other uncertain factors (including icebreaker fees and extra environmental fees). CTotal represents the sum of the ship’s total time cost, total voyage fuel cost, and discretionary costs. By establishing this function, the On voyage cost can be determined. The A added before the cost variable name is for the Arctic Northeast route, and the S added ly 1 2 3 4 5 6 7 8 9 10 11 12 13 14 15 16 17 18 19 20 21 22 23 24 25 26 27 28 29 30 31 32 33 34 35 36 37 38 39 40 41 42 43 44 45 46 47 48 49 50 51 52 53 54 55 56 57 58 59 60 International Journal of Geographical Information Science before the variable name is for the traditional Suez Canal route. It should be noted that all the cost variables (time cost, fuel cost, and discretionary costs) must be evaluated using an actual ship voyage to obtain the required coefficients before they can be used to formulate the cost function. 3.1 Total Time Cost for Ship The ship’s total time cost includes the capital and depreciation costs that the ship 13 http://mc.manuscriptcentral.com/tandf/ijgis International Journal of Geographical Information Science operators incur. The relationship between the voyage costs and navigation time is expressed as follows: CTt Tt Cday Ship_ ty (2) where CTt represents the ship’s total time cost, Tt represents the voyage time, Cday represents the daily ship rental cost, and Ship_ty represents the type of ship: bulk carrier, container, tanker, passenger ship, etc. (the value is subject to the ship type). Fo Carriers that do not own a ship can rent one using the trip-time charter method, where the daily rental cost is used to calculate the time cost for the ship. Generally, heavier ships or rP those featuring special equipment (i.e., ships with ice-breaking capabilities) are more expensive to construct, and thus possess a higher ship time cost. Because of the change in the ee daily ship rental cost resulting from variations in the ship weight, equipment, global rR economic environment, and charter time, carriers must limit the voyage time to minimize voyage costs (Lin 2010). To calculate the Northeast Passage navigation time, the following formula was employed: ev ADi i 1 AV 24 i 4 ATt iew (3) where ATt represents the total voyage time, AD1 represents the voyage distance from the On port of departure to the Bering Strait, AD2 represents the voyage distance between the entrance and exit points of the Bering Strait, AD3 represents the voyage distance travelled in ly 1 2 3 4 5 6 7 8 9 10 11 12 13 14 15 16 17 18 19 20 21 22 23 24 25 26 27 28 29 30 31 32 33 34 35 36 37 38 39 40 41 42 43 44 45 46 47 48 49 50 51 52 53 54 55 56 57 58 59 60 Page 14 of 25 the Arctic Ocean, AD4 represents the voyage distance from the Barents Sea to the destination, and AVi represents the service ship velocity for voyage ADi. For example, the regular navigation speed (AD1 and AD4) for a bulk carrier ship is 14 kn, but the ship velocity can be reduced to 12 kn in AD2 and only 6~8 kn in ice area AD3. To calculate the time cost for the traditional Suez Canal route, the following formula was employed: 14 http://mc.manuscriptcentral.com/tandf/ijgis Page 15 of 25 SDi i 1 SVi 24 3 STt (4) where STt represents the total voyage time, SD1 represents the voyage distance from the port of departure to the Suez Canal entrance, SD2 represents the voyage distance through the Suez Canal, SD3 represents the voyage distance from the Suez Canal exit to the destination, and SVi represents the service ship velocity for voyage SDi. A ship usually needs to spend at Fo least 20 h travelling through the Suez Canal, not including the time waiting in the queue. The time spent at sea can be estimated by using the voyage distance and service ship rP velocity. In the formula, Ti Di , 24 is included in the denominator to enable Vi 24 ee conversion of the solution into days for easier calculation. Di denotes the voyage distance (in rR nautical miles), and Vi is the ship velocity (knots per hour) for section i. 3.2 Fuel Cost for Ship ev 3 A ship’s fuel consumption is directly proportional to V if the ship displacement is iew fixed. The following fuel consumption formula was established: CF a V 3 (5) On where C F represents the hourly fuel consumption (in tonnes) of the ship, a represents the ship type-dependent coefficient, and V represents the ship velocity (in knots). However, ly 1 2 3 4 5 6 7 8 9 10 11 12 13 14 15 16 17 18 19 20 21 22 23 24 25 26 27 28 29 30 31 32 33 34 35 36 37 38 39 40 41 42 43 44 45 46 47 48 49 50 51 52 53 54 55 56 57 58 59 60 International Journal of Geographical Information Science revisions to this formula are required based on the results of a comparison with actual ship navigation data. The fuel consumption for the four areas of the Northeast Passage was determined using the following formula: ( ACF )i a AVi 3 , i 1 ~ 4 (6) where ACF i represents the fuel consumption for voyage ADi, and AVi 3 represents the 15 http://mc.manuscriptcentral.com/tandf/ijgis International Journal of Geographical Information Science service ship velocity for voyage ADi. The Northeast Passage total fuel cost formula was derived as follows: 4 Min. AExoil = ( ACF )i ( AT )i 24 (7) i 1 The total fuel consumption was determined by summing the fuel consumed for the four voyages of the route. The unit for Exoil was fuel consumed per hour (in tonnes); thus, the Fo value of Exoil was multiplied by the voyage navigation time (in hours). Referencing the fuel rP costs of the traditional Suez Canal route, the total fuel cost formula was established, as shown below. ee 3 Min. SExoil = ( SCF )i ( ST )i 24 3.3 Discretionary Costs (8) i 1 rR The discretionary costs included the cost of travelling through the Suez Canal and ev employing an icebreaker ship through the Northeast Passage. The discretionary costs (i.e., iew Suez Canal tolls) for the traditional route were calculated based on the ship weight and toll rates for the selected ship type. The Northeast Passage has a voyage period of only 6~8 weeks from July to September per year. The navigation season could be longer if icebreakers On are available. The cost of employing an icebreaker for the Northeast Passage is regulated by the Russian Northern Sea Route Administration (NSR 2013). Thus, the theoretical cost ly 1 2 3 4 5 6 7 8 9 10 11 12 13 14 15 16 17 18 19 20 21 22 23 24 25 26 27 28 29 30 31 32 33 34 35 36 37 38 39 40 41 42 43 44 45 46 47 48 49 50 51 52 53 54 55 56 57 58 59 60 Page 16 of 25 saving of the NEP strongly depends on whether shipping companies are able to take advantage of this short period. For ships travelling the Northeast Passage, the protective and fragile ecology of the Arctic Ocean may demand higher insurance standards compared to other sea regions. Insurance companies may also be reluctant to provide insurance for fear of ice-related calamities. Because the departure and destination ports of both routes are identical, and the voyage 16 http://mc.manuscriptcentral.com/tandf/ijgis Page 17 of 25 time of Arctic shipping routes is limited by weather conditions (Zhang 2009), this study set the route navigation period in seasons when the Arctic routes are accessible. In addition, because the total ship weight and ports of call were identical, assessments of the harbor costs and voyage suspension costs were not included in this study. After assessing all items, the time cost, fuel cost, and discretionary costs for the traditional route and the Northeast Passage were summed. The objective function of the Fo minimum voyage cost for the carriers was determined, as listed below. rP ACTotal ACTt AExoil P _ mol AExch SCTotal SCTt SExoil P _ mol SExch (9) (10) ee Here, (9) represents the objective function of the minimum voyage cost for the Northeast Passage, and (10) represents the objective function of the minimum voyage cost for the rR traditional route, which are referred to as ACTotal and STCotal, respectively. ACTt and SCTt represent the total time costs for the Northeast and traditional routes, respectively. ACTt and ev SCTt denote the total fuel costs for the Northeast and traditional routes, respectively. 4. Benefit Analysis and Simulation Result iew The objective cost function for the two routes was obtained using the cost estimates explained above. Because the Northeast Passage navigation data were relatively deficient, On only known portion factors that affect the shipping costs could be included in the assessment. Therefore, the percentage of difference between the Northeast Passage total cost and the ly 1 2 3 4 5 6 7 8 9 10 11 12 13 14 15 16 17 18 19 20 21 22 23 24 25 26 27 28 29 30 31 32 33 34 35 36 37 38 39 40 41 42 43 44 45 46 47 48 49 50 51 52 53 54 55 56 57 58 59 60 International Journal of Geographical Information Science traditional route total cost was set as the benefit margin (Figure 7). 17 http://mc.manuscriptcentral.com/tandf/ijgis International Journal of Geographical Information Science Fo Figure 7. Difference between concepts of benefit schematic Using the benefit margin, ship carriers can estimate the cost generated by other uncertain rP factors. The benefit margin also reflects the discretionary costs for the Northeast Passage. Dividing the difference between the traditional route’s total cost and the Northeast Passage’s ee total cost by the traditional route’s total cost, the following assessment function was derived: rR CBM SCTotal ACTotal % SCTotal (11) where CBM represents the benefit margin, SCTotal represents the minimum voyage cost for ev the traditional route, and ACTotal represents the minimum voyage cost for the Northeast iew Passage. The Northeast Passage has a shorter distance compared to the traditional Suez route. Thus, the benefit margin increases if the port is closer to northern Asia. A greater difference in the benefit margin indicates a larger cost from factors not On included in the assessment. Conversely, a smaller difference in the benefit margin signifies a smaller cost from factors not included in the assessment. Therefore, when selecting departure ly 1 2 3 4 5 6 7 8 9 10 11 12 13 14 15 16 17 18 19 20 21 22 23 24 25 26 27 28 29 30 31 32 33 34 35 36 37 38 39 40 41 42 43 44 45 46 47 48 49 50 51 52 53 54 55 56 57 58 59 60 Page 18 of 25 and destination ports for ships that travel the Northeast Passage, ship carriers may assess the benefit margin using this model. Furthermore, when the benefit margin is less than a certain set value, ship carriers may consider dismissing the voyage option. 18 http://mc.manuscriptcentral.com/tandf/ijgis Page 19 of 25 rP Fo Figure 8. Route planning and dynamic cost estimate of benefit The results of this study are shown in the self-made website for route planning, comparing ee the optimal Arctic Northeast route with the traditional route through the Suez Canal using a rR dynamic analysis of the cost efficiency (including the time costs, fuel costs, and other factors) of major ports between Asia and Europe, in which the left portion of the website features an ev embedded Google Earth diagram of the planned route and the right portion is a self-made evaluation program of the benefit assessment for users, directly showing the estimated CBM iew by inputting given ports and assessment cost values (Figure 8). For example, one of the simulation routes from the Port of Shanghai to the Port of On Rotterdam (with a ship velocity of 14 kn) is displayed in Figure 8. The blue line beginning on the right denotes the voyage from the port of Shanghai to the Bering Strait (AD1), which ly 1 2 3 4 5 6 7 8 9 10 11 12 13 14 15 16 17 18 19 20 21 22 23 24 25 26 27 28 29 30 31 32 33 34 35 36 37 38 39 40 41 42 43 44 45 46 47 48 49 50 51 52 53 54 55 56 57 58 59 60 International Journal of Geographical Information Science measures approximately 2990 nautical miles. The yellow line denotes the voyage between the entrance and exit points of the Bering Strait (AD2), which measures approximately 763 nautical miles. The red line denotes the voyage through the Arctic Ocean (AD3), which measures approximately 2209 nautical miles, and finally, the blue line denotes the voyage from the Barents Sea to the port of Rotterdam (AD4), which measures 1718 nautical miles. Because the ship travelled at the same velocity for AD1 and AD4, the same color is used to indicate its speed, and the remaining voyages are marked using various colors representing 19 http://mc.manuscriptcentral.com/tandf/ijgis International Journal of Geographical Information Science different speeds. For the Northeast Passage, the water depth of the total voyage ranged between 15 and 9000 m, and the total voyage distance measured approximately 7680 nautical miles. The distance is 3860 nautical miles shorter than the traditional Suez Canal route. Figure 8 shows the Northeast Passage and traditional Suez Canal route planned using Google Earth. A cost evaluation table that compares the Arctic Northeast routes with traditional routes Fo via the Suez Canal from five different ports in Asia to a European port is given below. Table 1 Cost evaluation of two competing routes ev rR ee rP The planning route can display zoom and rotation angles to the user’s desired location. The iew route simulation from Asia to Europe is available in simulated 3D navigation images. Combining the five ports in Asia and three European ports generates 15 possible routes. As can be clearly evaluated and shown on our website, the average benefit assessment is around On 30%~45% for the bulk carrier examples. The shipping costs of the various routes were assessed based on the voyage cost function. ly 1 2 3 4 5 6 7 8 9 10 11 12 13 14 15 16 17 18 19 20 21 22 23 24 25 26 27 28 29 30 31 32 33 34 35 36 37 38 39 40 41 42 43 44 45 46 47 48 49 50 51 52 53 54 55 56 57 58 59 60 Page 20 of 25 5. Conclusion This study uses the online GIS Google Earth as the theoretical route planning and visualization software. According to statistical comparisons, the distance deviation between the actual route and the planned route in Google earth is within 2%. To plan the optimal routes, the water-depth and Arctic sea ice distribution data provided by Google Earth and a higher-geometry maze routing algorithm with turn penalties were also employed. The newly planned optimal routes comprised various routes that depart from major Asian ports through 20 http://mc.manuscriptcentral.com/tandf/ijgis Page 21 of 25 the Arctic Northeast Passage to ports in Europe. The fuel costs, voyage time, and ship rental costs for each route were estimated. However, because the costs of some of these factors vary over time, dynamic costs must also be evaluated. In practice, the practical 3D Arctic route planning should be implemented in an accredited IMO ECDIS system to provide users an alternative method of clearly displaying and presenting the current navigational paths. In addition, before travelling these routes, assessments from environmental specialists are required. Currently, the use of icebreakers is regulated by the Russian Northern Sea Route Administration, which allows states to regulate maritime activities in Arctic ice‐covered Fo waters because crossing the Arctic Ocean is not merely a cost-benefit issue, but also involves the care and protection of the marine environment. ee rP APPENDIX A The input for the 4-geometry maze router is a cell map, the source (S) and destination (D) and the output path is a minimum cost value in weighted regions of cell map. rR Algorithm: 4-geometry-maze-router (Cell-map, S, D, LLpath) Input: Cell-map, S, D Output: LLpath iew Step 0: Initialization: ev For each cell Ci,j (RWi, j , ATi, j, Visi, j) in an m × n cell map, the initial RWi, j value is 1 if the cell Ci, j is in the free space or if Ci, j is in the barrier. If the parameter RW of any cell has a finite value between 1 and , the cell belongs to one of the weighted On regions. ATi, j = and Visi, j = false for all cells, 0 i m-1, 0 j n-1. The initial value of index is 0. path-exists = FALSE; ly 1 2 3 4 5 6 7 8 9 10 11 12 13 14 15 16 17 18 19 20 21 22 23 24 25 26 27 28 29 30 31 32 33 34 35 36 37 38 39 40 41 42 43 44 45 46 47 48 49 50 51 52 53 54 55 56 57 58 59 60 International Journal of Geographical Information Science Step 1: Input the coordinates of a given-source, S. If RWi, j of the source cell is not equal to , then update ATi, j = 0, else return the error message “The source cell is in the barrier” and terminate. Step 2: Compute the number of required buckets. Step 2.1: Determine the required index number (buckets) of the linked list LLindex. index_no = ( 2 × RWmax) / 10 + 2, where RWmax is the 21 http://mc.manuscriptcentral.com/tandf/ijgis International Journal of Geographical Information Science maximum RW in the weighted regions. Step 3: Compute the time of arrival between the source cell and the remaining cells. Step 3.1: Move the source cell into the temporary list TL and update the source cell’s Visi,j to true. Remove the source cell from the TL into the bucket LL0. Step 3.2: Fo Step 3.3: For each cell in the LLindex, update the AT i, j of its neighboring cells. rP Step 3.3.1: Remove the index of the first cell Ci, j from the front end of the LLindex and update this cell’s Visi, j to true. ee Step 3.3.2: Update the ATi’, j’ value of the 4-geometry neighbors of cell Ci, j. rR Case 1: If i i j ' j 1 , 2 2 ev then New _ ATi ', j ' ATi, j 1 ( RWi, j RWi ', j ' ) / 2 Case 2: If i i j ' j 2 , 2 2 iew then New _ ATi ', j ' ATi , j 2 ( RWi , j RWi ', j ' ) / 2 If New_ ATi’, j’ < ATi’, j’, then ATi’, j’ = New_ ATi’, j’. On Step 3.3.3: Iterations If LLindex is not empty, then go back to steps 3.3. ly 1 2 3 4 5 6 7 8 9 10 11 12 13 14 15 16 17 18 19 20 21 22 23 24 25 26 27 28 29 30 31 32 33 34 35 36 37 38 39 40 41 42 43 44 45 46 47 48 49 50 51 52 53 54 55 56 57 58 59 60 Page 22 of 25 Step 3.4: Move the cells’ indices in the TL into their corresponding buckets. Step 3.4.1: For all the indices in the TL, move (i, j) from TL into LL AT Step 3.4.2: If the TL is empty, then update the index value index = (index + 1) mod index_no. Step 3.5: Iterations 22 http://mc.manuscriptcentral.com/tandf/ijgis i, j mod index _ no Page 23 of 25 if D cell in LLindex then { path-exists = TRUE; break Step 3; } If rest of buckets is not empty, then repeat steps 3.3. if (path-exists = TRUE) then else path does not exist; RETRACE (Cell-map(ATD) , LLpath); rP Fo 6. References ANDRIANI SKOPELITI, P. and TSOULOS, L. 2014. Choosing a Suitable Projection for Navigation in the Arctic. Anon., Testing of ECDIS Equipment for Use in the Polar Regions. ed. 26th TSMAD and 5th DIPWG Meeting, 10-14 June 2013 Silver Spring, Maryland, USA. rR ee ARPIAINEN, M. and KIILI, R. 2006. Arctic shuttle container link from Alaska US to Europe. Aker Arctic. BORGERSON, S. G. 2008. Arctic meltdown: the economic and security implications of global warming. foreign affairs, 87(2), 63-77. ev BRITT, J. and LAFONTAINE, G. 2009. Google Earth. Social studies and the young learner, 21(4), 20-23. CARMEL, S. 2012. Commercial Shipping in the Arctic. Marine Board Workshop Safe Navigation in the US Arctic. CHANG, K. Y., JAN, G. E. and PARBERRY, I. 2003. A Method for Searching Optimal Routes with Collision Avoidance on Raster Charts. The Journal of Navigation, 56, 371-384. CHERNOVA, S. and VOLKOV, A. 2010. Economic feasibility of the Northern Sea Route container shipping development. DICHTEL, W. J., An Investigation into the Physical and Electrical Characteristics of Sea Ice. iew ly On 1 2 3 4 5 6 7 8 9 10 11 12 13 14 15 16 17 18 19 20 21 22 23 24 25 26 27 28 29 30 31 32 33 34 35 36 37 38 39 40 41 42 43 44 45 46 47 48 49 50 51 52 53 54 55 56 57 58 59 60 International Journal of Geographical Information Science ed. Proceedings of the Alaskan Science Conference of NAS NRC, 1951 Washington, p122-p.125. DVORAK, R. E., 2009. Engineering and economic implications of ice-classed containerships. Massachusetts Institute of Technology. EVERGREEN, 1999-2012. China-Europe Shuttle Service(CES). [online]. Available from: http://www.shipmentlink.com/tvs2/jsp/TVS2_ServiceProfile.jsp?line=CES&segment =W. FALCK, H., Shipping in Arctic Waters The Northern Sea Route. ed. Mariehamn: Marine 23 http://mc.manuscriptcentral.com/tandf/ijgis International Journal of Geographical Information Science Insurance Seminar (2012, Mariehamn, 26 April 2012), 2012. GRIFFITHS, F. 2005. New illusions of a Northwest Passage. International energy policy, the Arctic and the Law of the Sea, 303-309. GUY, E. 2006. Evaluating the viability of commercial shipping in the Northwest Passage. Journal of Ocean Technology, 1(1), 9-18. HUANG, L., LASSERRE, F. and ALEXEEVA, O. 2014. Is China's interest for the Arctic driven by Arctic shipping potential? Asian Geographer, (ahead-of-print), 1-13. IMO, 2012. Shipping in polar waters. [online]. Available from: http://www.imo.org/MediaCentre/HotTopics/polar/Pages/default.aspx. IMRF, 2014. Into the Arctic [online]. Available from: Fo http://www.international-maritime-rescue.org/index.php/regional-groups/asia-pacific/ 83-lifeline-august-2014-english/797-into-the-arctic. JAN, G. E., CHANG, K. Y. and PARBERRY, I. 2008. Optimal path planning for mobile robot navigation. IEEE/ASME Transactions on Mechatronics, 13(4), 451-460. KAMESAKI, K., KISHI, S. and YAMAUCHI, Y. 1999. Simulation of NSR navigation based on year round and seasonal operation scenarios. Oslo: INSROP (Working paper 8). KITAGAWA, H., et al. 2001. The Northern Sea route-The shortest sea route linking East rR ee rP Asia and Europe. Ship and Ocean Foundation, Tokyo. LASSERRE, F. 2014. Case studies of shipping along Arctic routes. Analysis and profitability perspectives for the container sector. Transportation Research Part A: Policy and ev Practice, 66, 144-161. LIN, H. C., 2010. A decision-making of goods freight for carrier in dry-bulk shipping market. (Master). National Taiwan Ocean University LIU, M. and KRONBAK, J. 2010. The potential economic viability of using the Northern Sea Route (NSR) as an alternative route between Asia and Europe. Journal of Transport Geography, 18(3), 434-444. MULHERIN, N. E. A., 1996. Development and Results of a Northern Sea Route Transit Model. US Army corps of Engineers, Hanover, NH, CRREL Report 96-5. NSR, 2013. Ice-covered Areas. [online]. Available from: http://www.arctic-lio.com/nsr_legislation. iew ly On 1 2 3 4 5 6 7 8 9 10 11 12 13 14 15 16 17 18 19 20 21 22 23 24 25 26 27 28 29 30 31 32 33 34 35 36 37 38 39 40 41 42 43 44 45 46 47 48 49 50 51 52 53 54 55 56 57 58 59 60 Page 24 of 25 ØSTRENG, W., et al., 2013. Shipping in Arctic waters: a comparison of the Northeast, Northwest and trans polar passages. Springer Science & Business. PANG, G. L., CHEN, D. Q. and HUANG, M. 2013. Architecture Earthquake Disaster Simulation Based on Three-Dimension GIS Algorithm. Advanced Materials Research, 722, 441-446. PATERSON, T. 2011. Cost comparison of shipping in the Arctic. Arctic Shipping 2011. PATTERSON, T. C. 2007. Google Earth as a (not just) geography education tool. Journal of Geography, 106(4), 145-152. 24 http://mc.manuscriptcentral.com/tandf/ijgis Page 25 of 25 POLYAKOV, I. V., WALSH, J. E. and KWOK, R. 2012. Recent changes of Arctic multiyear sea ice coverage and the likely causes. Bulletin of the American Meteorological Society, 93(2), 145-151. SCH YEN, H. and BR THEN, S. 2011. The Northern Sea Route versus the Suez Canal: cases from bulk shipping. Journal of Transport Geography, 19(4), 977-983. SOMANATHAN, S., FLYNN, P. C. and SZYMANSKI, J. K. 2007. Feasibility of a sea route through the Canadian Arctic. Maritime Economics & Logistics, 9(4), 324-334. SRINATH, B. N., 2010. Arctic Shipping: Commercial Viability of the Arctic Sea Routes. MSc Dissertation. City Univ. STEINIGER, S. and HUNTER, A. J. 2013. The 2012 free and open source GIS software Fo map–A guide to facilitate research, development, and adoption. Computers, Environment and Urban Systems, 39, 136-150. STEPHENSON, S. R., BRIGHAM, L. W. and SMITH, L. C. 2013. Marine accessibility along Russia's Northern Sea Route. Polar Geography, 37(2), 111-133. VERITAS, D. N., 2009. Ships for Navigation in Ice. Norway: DNV. VERNY, J. and GRIGENTIN, C. 2009. Container shipping on the Northern Sea Route. International Journal of Production Economics, 122(1), 107-117. rR ee rP WERGELAND, T. 1992. The Northern Sea Route - Rosy prospects for commercial shipping. International Challenges, 12(1), 43-57. WERGELAND, T. and ØSTRENG, W. 2013. Northeast, Northwest and Transpolar Passages ev in comparison. Shipping in Arctic Waters. A Comparison of the Northeast, Northwest and Trans Polar Passages, 299-352. WORBY, A. P., et al. 2008. Thickness distribution of Antarctic sea ice. Journal of Geophysical Research: Oceans (1978–2012), 113(C5). ZHANG, X. 2009. The Economic Estimate of Arctic Sea Routes and Its Strategic Significance for the Development of Chinese Economy. China Soft Science, 86-93. iew ly On 1 2 3 4 5 6 7 8 9 10 11 12 13 14 15 16 17 18 19 20 21 22 23 24 25 26 27 28 29 30 31 32 33 34 35 36 37 38 39 40 41 42 43 44 45 46 47 48 49 50 51 52 53 54 55 56 57 58 59 60 International Journal of Geographical Information Science 25 http://mc.manuscriptcentral.com/tandf/ijgis can use this space to document any changes you make to the original manuscript. In order to expedite the processing of the revised manuscript, please be as specific as possible in your response to the reviewers. IMPORTANT: Your original files are available to you when you upload your revised manuscript. Please delete any redundant files before completing the submission. Because we are trying to facilitate timely publication of manuscripts submitted to the International Journal of Geographical Information Science, your revised manuscript should be uploaded as soon as possible. If it is not possible for you to submit your revision in a reasonable amount of time, we may have to consider your paper as a new submission. Once again, thank you for submitting your manuscript to the International Journal of Geographical Information Science and I look forward to receiving your revision. Sincerely, Prof. brian lees Associate Editor, International Journal of Geographical Information Science [email protected]


© Copyright 2026