
The Effect of Social Interaction on Economic Transactions: September 2012
The Effect of Social Interaction on Economic Transactions:
An Embarrassment of Niches?
Avi Goldfarb, Ryan C. McDevitt, Sampsa Samila, and Brian Silverman∗
September 2012
Abstract
We show that social interaction reduces the diversity of products purchased by consumers
in two retail settings. First, we consider a field experiment conducted by Sweden’s monopoly
alcohol retailer and find that moving purchases from behind the counter to self-service differentially increases the sales of difficult-to-pronounce products. Second, we use individual-level
panel data from a pizza delivery restaurant to show that online orders are more obscure, complex, and calorific, which increases both consumer and producer surplus. Combined, these
results suggest that social inhibitions can substantially affect market outcomes, with much of
this effect likely related to consumers’ fear of embarrassment.
JEL: D12, D18, L81, L86
Keywords: long tail; Internet economics; consumer behavior; embarrassment
∗ Respectively at University of Toronto, University of Rochester, National University of Singapore, and University
of Toronto. We thank Heski Bar Isaac and seminar participants at New York University, the University of Toronto,
and the NBER Summer Institute for helpful comments.
1
Introduction
Economic transactions often require social interaction.
In this paper, we examine
whether these interactions inhibit certain kinds of benign economic activity. Specifically, we show that consumers purchase a wider variety of goods across two distinct
retail settings when transactions require less communication, with the largest increase in
sales occurring for those items that might cause embarrassment when ordered verbally.
In our first setting, we use a field experiment conducted by Sweden’s governmentrun alcohol monopoly retailer, Systembolaget, to identify the effects of changing from
behind-the-counter to self-service alcohol sales. We find that moving to a self-service
format results in the store selling a greater variety of products, with a significant fraction
of this change coming from those with difficult-to-pronounce names. As shown in Section
2, the sales of hard-to-pronounce alcohol products increase 11% in stores that switch
to self-service, which contributes to a 19% decline in the concentration of sales at these
stores.
In our second setting, we use individual-level panel data from a pizza delivery restaurant that introduced a Web-based ordering system in the middle of our sample period.
Comparing orders from before and after the advent of online sales, we document a considerable change in consumers’ purchases. As shown in Section 3, the average item in an
online pizza order is 14% more complex, has 3% more calories, and is 20% less popular.
Our results suggest that the non-social nature of online transactions explains these differences, which has a substantial effect on both consumer and producer surplus. From a
structural demand model, we estimate that consumer surplus increased 5.4% due to the
reduction in social interaction associated with online ordering, an estimate larger than
that of Brynjolfsson et al. (2003) for the benefits of online booksellers’ greater selection
of products. Moreover, our estimates also suggest a 3.5% increase in producer surplus
stemming from impersonal Web orders.
Combined, these findings suggest that interpersonal exchange affects both the type
1
and the diversity of products purchased by consumers, which we interpret as evidence
that embarrassment is the mechanism through which social interaction matters. This
interpretation implies that, in the case of alcohol sales, consumers may fear appearing
unsophisticated by mispronouncing a name when ordering from a sales clerk; once a
store introduces a self-service format and eliminates the need to pronounce a name,
consumers feel more comfortable pursuing an otherwise uncomfortable transaction. For
pizza orders, customers may prefer to avoid judgment of their food consumption — an
order with peculiar instructions or excessive calories may provoke ridicule from others.
By moving the transaction online and eliminating a layer of social interaction, a customer
becomes unencumbered to order otherwise embarrassing items.
An alternative explanation for our results is that, rather than wanting to reduce
embarrassment, consumers may wish to minimize the potential for misinterpretation.
While we cannot fully reject this explanation in the alcohol setting, particular institutional details and further analysis help rule it out for pizza orders. Namely, customers
who made more-complex or error-ridden orders before Web ordering was available are
not more likely to make online orders, suggesting that ease-of-use does not mechanically
lead to more-complex orders online. In addition, instructions that are trivial to make
on both channels and correlated with complexity and calories, such as ordering double
toppings, again appear more often in online orders.
That consumers avoid purchasing products that may cause embarrassment in front
of others has received considerable attention in sociology, psychology, medicine, and
political science. The foundation for these ideas dates back to at least Goffman’s claim
that social interactions are performances in which individuals act to project a desired
image of themselves, and that embarrassment occurs when this projection is disrupted
(Goffman 1956, 1959). Embarrassment is therefore a social phenomenon.
In their review article on the psychology of embarrassment, Keltner & Buswell (1997)
discuss how a fear of embarrassment imposes costs as individuals take self-destructive
steps to avoid it. A fear of embarrassment leads patients to delay seeking medical help
2
for chest pain (Meischke et al. 1995), for cancer treatment in general (Smith et al. 2005),
and for testicular and breast cancers in particular (Chapple et al. 2004, Lerman et al.
1990); it can affect voting choices (Niemi 1976); it can alter food consumption (Lee
& Goldman 1979, Polivy et al. 1986, Banaji & Prentice 1994, Roth et al. 2001, AllenO’Donnell et al. 2011); and it can stifle the purchase and use of contraceptives (Dahl
et al. 1998, 2001).
Other research has shown that social cues, though not directly related to embarrassment, may also affect individuals’ choices. For instance, Akerlof & Kranton (2000)
and Akerlof & Kranton (2008) show that social identity affects behavior, while Ratner
& Kahn (2002) and Ariely & Levav (2000) find specifically that social norms change
variety-seeking behavior. In a similar vein, a wide literature has shown how perceptions
of fairness influence actions (Rabin 1993, Fehr et al. 1993). Similarly, DellaVigna et al.
(2012) argue that social pressure has a substantial impact on charitable giving, and
perform a welfare calculation (much like our analysis in the pizza setting) showing that
“social pressure costs” reduce donors’ welfare in door-to-door fundraising. Also closely
related to our framework is the model of privacy in Daughety & Reinganum (2010).
They derive a demand for privacy within a model where agents receive utility from
other agents’ perceptions of their type. When actions are public, they show that “social
pressure” influences individuals’ choices. In some sense, our analysis examines the basic
assumption of this model: whether social pressure does indeed affect choices.
Online, an extensive literature has speculated that a lack of social interaction might
cause individuals to alter their behavior. For instance, Kling et al. (1999) conclude that
“People say or write things under the cloak of anonymity that they might not otherwise say or write.” The perceived anonymity afforded by digital technologies has been
credited with an increase in the distribution of pornography (Edelman 2009, Holmes
et al. 1998) and with the bestseller status of erotica novels such as Fifty Shades of Grey
(Rosman 2012). To this point, Griffiths (2001) asserts that Internet pornography is popular because “it overcomes the embarrassment of going into shops to buy pornography
3
over the shop counter,” a phenomenon Coopersmith (2000) labels a “social transactions
cost.”
Building on this literature, our findings provide a new explanation for a commonly
discussed Internet phenomenon — that niche products comprise a comparatively large
share of total sales online, dubbed the “long tail” in Anderson (2004) — by showing
that a reduction in social interaction leads to a less-concentrated sales distribution. The
current literature emphasizes the roles of inventory capacity (Brynjolfsson et al. 2003)
and search technologies (Brynjolfsson et al. 2011, Bar-Isaac et al. 2012) but does not
discuss how the impersonal nature of online transactions might affect sales patterns. And
while a lengthy social psychology literature has studied how a lack of personal interaction
affects online behavior (Gackenbach 2007), labeling it the “online disinhibition effect”
(Joinson 1998, Suler 2004), no work has examined its implications for market outcomes.
As anonymity represents a distinguishing characteristic of most online transactions,
our paper emphasizes a key aspect of Internet commerce that has not been discussed
previously in the economics literature (Scott Morton 2006).
The purpose of our paper is therefore to formalize and measure the importance
of these ideas using two common microeconomic settings. We chose them specifically
because each provides a particularly compelling identification strategy to isolate the
effect of social frictions on market outcomes.
First, the menus and prices remain fixed for each of our settings. Because greater
variety can result mechanically in a less-concentrated sales distribution, markets commonly associated with the long tail where retailers offer a wider selection of products,
such as online books or videos, would not provide a suitable setting for our analysis
(Brynjolfsson et al. 2003). Similarly, stores may differ along many dimensions that influence consumers. The panel nature of both settings — and the field experiment used
in the alcohol setting — reduce the potential of these other dimensions to confound our
results. Moreover, the alcohol seller is a legal monopoly, mitigating the risk that the
results may be driven by substitution between retailers.
4
Second, the straightforward menus and webpage in our settings, as well as the nature
of the products themselves, allow us to provide evidence that search and learning do not
drive our results. For example, in the alcohol setting, the increase in sales comes from
hard-to-pronounce products in particular, rather than new or unpopular products. In
the pizza setting, the website does not have sophisticated search tools that Brynjolfsson
et al. (2011) argue will confound a comparison of bricks-and-mortar retailers with online
stores that make searching easier for customers.
Third, similar settings have been studied extensively in the economics and management literatures to understand the distribution of sales (Pozzi forthcoming, Brynjolfsson
et al. 2003), search costs (Forman et al. 2009, Brynjolfsson et al. 2009, De los Santos
et al. 2012), and questions of economic efficiency (Seim & Waldfogel 2012). Thus, our
settings are firmly in the mainstream and complement previous studies.
Finally, while not an experiment, the pizza setting in particular allows us to control
for individual-level tendencies and selection into online ordering because the transaction
history includes customers who purchased from the store both before and after online
ordering became available. As a result, we can combine this rich transaction data
with information about the store’s costs to estimate changes in consumer and producer
surplus.
We proceed by first detailing the results of the field experiment that moved alcohol
purchases from behind the counter to self-service, finding that difficult-to-pronounce
products experienced a particularly large increase in sales. We then analyze the data
from the pizza delivery restaurant, providing evidence of a rise in unusual orders and an
estimate of the impact of this increase on consumer and producer surplus. We conclude
with a discussion of both the limitations and potential wider implications of our results.
5
2
Systembolaget’s Sales Format Experiment
2.1
Data and Setting
In our first setting, we examine a field experiment conducted by Sweden’s governmentrun alcohol monopoly, Systembolaget, in the first part of the 1990s.1 For Sweden’s 1990
population of 8.5 million, Systembolaget operated approximately 400 stores across the
country. Outside of these stores, Swedish law prohibits the sale of wine, distilled spirits,
and strong beer (above 3.5% ABV).
Prior to 1989, all of the transactions at Systembolaget’s stores occurred behind the
counter, whereby customers approach the counter and order from a clerk who then
retrieves the item. In 1989, Systembolaget decided to conduct a field experiment to explore the impact of moving to the more familiar self-service retail model. To identify the
likely implications of self-service and reduce the chances of simply cannibalizing sales
across stores, Systembolaget chose 14 relatively isolated towns, each with a single Systembolaget store, to participate in the experiment.2 According to Skog (2000), using the
1984 to 1989 period, the towns were matched into seven pairs “in such a way as to make
the members of each pair as similar as possible in terms of population size, economic
bases and sales of alcoholic beverages; the latter both in terms of volume per capita and
pattern of variation over time.” The pairs were also chosen to be sufficiently far apart
so as to prevent spillover effects. The member of each pair chosen to switch formats was
decided randomly, with Table 1 listing the pairs of stores and their characteristics.
Several institutional details make Systembolaget’s experimental setting especially
clean. First, during the experiment, prices and product offerings did not change in the
treatment stores relative to the control stores — only the format of the store changed. As
a result, consumers’ responses are not confounded by endogenous changes in prices and
product offerings. Second, Systembolaget is a monopoly seller of alcohol (above 3.5%
1 Much
of this description comes from Skog’s (2000) assessment of the experiment’s impact on alcohol consumption.
the experiment was restricted to one-store towns, Stockholm and the other major cities in Sweden are
not in the data.
2 Because
6
Table 1: Summary statistics for Systembolaget stores participating in field experiment
as of January 1991.
Towns
Filipstad
Nybro
Koping
Saffle
Vanersborg
Lidkoping
Motala
Falun
Karlshamn
Lerum
Ludvika
Vetlanda
Mariestad
Varnamo
Treatment or control
Treatment
Control
Treatment
Control
Treatment
Control
Treatment
Control
Treatment
Control
Treatment
Control
Treatment
Control
Date of change
June 1991
None
July 1991
None
Nov. 1991
None
May 1992
None
Sept. 1993
None
Sept. 1994
None
Jan. 1995
None
Town Population
13296
20997
26345
17960
36734
36097
42223
54364
31407
33548
29144
28170
24847
31314
Sales (units)
58413
53542
97701
46807
99028
84143
92758
123305
82538
88043
78178
65646
92972
88514
Herfindahl
0.0296
0.0184
0.0215
0.0207
0.0144
0.0163
0.0155
0.0094
0.0145
0.0167
0.0237
0.0192
0.0140
0.0141
Sales (Liters)
28404
27764
50513
23581
51084
43611
48069
69196
43830
46687
41441
33069
47584
45906
Revenue in million Krona
234.7
281.0
418.0
223.2
449.0
374.4
441.3
614.2
425.8
345.5
371.6
307.0
427.6
424.1
ABV) within Sweden and therefore competitors’ responses to the format change are
unlikely to be relevant outside of weak beer and non-alcoholic drinks. Third, according
to the 2007 annual report, prices are based on a fixed (legislated) per-unit markup.
Fourth and finally, advertising and promotions were banned for alcohol above 2.25%
ABV (though foreign magazines sold in Sweden may carry alcohol advertisements).
All items sold in Systembolaget stores are listed in a menu and every store provides
the same menu to patrons (though they may stock different items), with Figure 1 showing a sample page from a 1996 menu. The menu lists product names (sorted by category)
and prices, and is especially important in stores with behind-the-counter service because
customers cannot simply pick up a bottle prior to purchasing it. At behind-the counter
stores, shown in Figure 2, customers approach the counter and order verbally (with the
option of pointing to an item on the menu); the staff then retreat to the back of the
store to retrieve the items. At self-service stores, shown in Figure 3, customers roam the
aisles and pick up items before bringing them to the cash register for purchase. Thus,
the key changes in the experiment are that the customer can browse the aisles to inspect
products on display and that the customer does not have to ask a clerk for the product.
We argue that the difficulty-of-pronunciation results (rather than results on products
with historically lower sales) should be driven only by the latter social interaction.
7
Figure 1: Page from a Systembolaget menu in 1996
Figure 2: Picture of a typical behind-the-counter Systembolaget store
Figure 3: Picture of a typical self-service Systembolaget store
8
Our data contain monthly sales and prices for each product from the 14 stores in the
experiment between January 1988 to December 1996.3 The products are divided into
seven categories: vodka, other spirits, wine, fortified wine, Swedish beer, imported beer,
and non-alcoholic drinks. We consider a product to be the same regardless of vintage,
though results are robust to considering different vintages of the same varieties by the
same producers to be different wines.
Our analysis proceeds at two levels of aggregation. First, we examine the data at the
category-store-month level to show how a store’s format affects the quantity and variety
of products sold. We focus on units sold as our measure of sales, but we show some
results for volume sold (in liters) and revenue in Swedish Krona. From the units sold
data, we construct a Herfindahl measure of the sales concentration for each category in
each store; this is the sum of the squared market shares of the products (stock-keeping
units) in each category-store-month, with Table 2 providing descriptive statistics. Also
note that prices are highly skewed, ranging from 3 Krona for nonalcoholic drinks to 2325
Krona for a 1983 bottle of Chateau d’Yquem. As such, we use log price in our analysis.
In addition, for some of our analysis we will need an “outside good,” which we define
as units of alcohol sold in restaurants.
Next, we examine the data at the product-store-month level to show how difficultyof-pronunciation affects purchases. We use several measures of how difficult a name is to
pronounce. First, we identify whether the menu provides a pronunciation guide for the
product. As shown in Figure 1, several product listings are accompanied by a phonetic
spelling of the product’s name. We interpret the presence of these guides as indicative
of the word being difficult to pronounce and use this as our primary measure. Second,
we use the number of characters in the product’s name. Third, we hired three native
Swedish speakers to assess the ease of pronouncing each product listed in the January
1991 menu.4
3 We
also have data on product availability and popularity from January 1984 to December 1987.
of this exercise appear in the appendix.
4 Details
9
Table 2: Descriptive statistics
Mean
Std. Dev. Minimum Maximum
Unit of observation is the month - store - category
Herfindahl
0.0900
0.0778
0.0088
0.8059
Units sold
12439
15423
15
159917
Liters sold
6246
7092
3
63220
Revenue in million Krona
54.64
53.69
0.0259
386.0
Unit of observation is the product
Pronunciation guide
0.5428
0.4983
0
1
Word Length
17.820
8.5537
3
70
Mean coder score
8.3923
0.7953
5.33
9
All coders score below top
0.0960
0.2947
0
1
No coders score below top
0.7212
0.4485
0
1
Coder 1 score
8.1594
0.6612
6
9
Coder 2 score
8.7813
0.5341
4
9
Coder 3 score
7.9300
1.8721
1
9
In the 1984 catalog
0.5977
0.4905
0
1
Vodka
0.0730
0.2602
0
1
Other spirits
0.2467
0.4312
0
1
Wine
0.4608
0.4986
0
1
Fortified wine
0.0766
0.2660
0
1
Swedish beer
0.0844
0.2781
0
1
Imported beer
0.0308
0.1727
0
1
Non-alcoholic drinks
0.0277
0.1642
0
1
Unit of observation is the month - store - product
Units sold
129.35
485.17
−203a
29836
Over the counter format
0.2219
0.4156
0
1
Price (Krona)
90.011
80.467
3
2325
Units sold in local restaurants 2.7672
17.739
−488a
2160
Pronunciation guide
0.4827
0.4997
0
1
Word length
15.876
7.4918
3
70
Mean coder score
8.4730
0.6155
0
1
All coders score below top
0.0866
0.2812
0
1
No coders score below top
0.6881
0.4633
0
1
Number of obs.
10570
10570
10570
10570
1658
1658
1625
1625
1625
1631
1628
1628
1658
1658
1658
1658
1658
1658
1658
1658
1016428
1016428
1016428
1016428
1009482
1009482
1009482
1009482
1009482
Only includes products in the 1991 guide (and therefore coded for pronunciation difficulty).
a Sales can be negative if returns for a product at a store in a month exceed sales. Negative sales
represent less than one tenth of one percent of the observations. These observations will be
dropped from most of the analysis because we use a measure of logged sales.
2.2
The Effect of Sales Format on Total Sales and Concentration
In order to estimate the effect of a store’s format on its sales levels (defined in units,
liters, and revenue) and concentration, we use a straightforward difference-in-difference
identification strategy. For store s, product category j, and month t, our estimating
10
equation for each of the four outcomes listed above is:
(Outcomessjt ) = βT reatmentGroupssj ∗ Af terT reatmentssjt + µsj + τt + εsjt . (1)
The analysis thus controls for store-category fixed effects (µsj ) and month fixed effects
(τt ). Therefore, all differences across stores at the category level and all systematic
changes over time are controlled for in the regression. The coefficient β then shows how
sales in the treatment group of stores change after converting to self-service compared
to the control group of stores over the same time period. Because our data come from
a true randomized field experiment, we are less worried about the typical concerns of
endogeneity and omitted variables bias in difference-in-differences studies — the differences between the treatment and control groups should be random. Nevertheless,
we check that the timing of the change in sales and sales concentration is coincident
with the format change. In addition, because a given location is observed several times,
we cluster the standard errors by store in order to reduce the potential for overstating
statistical significance (Bertrand et al. 2004).
Table 3 shows the results of the regressions described in equation (1).
11
12
10570
98
0.08
N
Number of groups
R2
10570
98
0.44
10570
98
0.51
10570
98
0.48
10570
98
0.21
10570
98
0.39
All products
(5)
(6)
Herfindahl
Log sales in units
-0.0168
0.2283
(0.0029)***
(0.0230)***
10570
98
0.08
926414
18292
0.19
N
Number of groups
R2
926414
18292
0.19
Guidance on menu
1016337
18651
0.03
N/A
1016337
18651
0.03
Guidance on menu
Sales in levels
(3)
(4)
51.5672
(8.0646)***
13.1754
-10.9974
(4.7311)**
(7.9656)
-202.8238
-197.0681
(12.9455)***
(12.0695)***
926414
18292
0.19
Word Length
(Negative) Mean
coder score
920236
18107
0.19
All coders
below top
920236
18107
0.19
No coders
below top
920236
18107
0.19
Alt. definitions of difficult-to-pronounce
discrete choice framework
(5)
(6)
(7)
(8)
0.0058
0.0327
0.0841
0.1389
(0.0019)***
(0.0167)*
(0.0188)***
(0.0198)***
0.1658
0.5392
0.2434
0.2953
(0.0219)***
(0.1521)***
(0.0244)***
(0.0260)***
-2.1423
-2.1377
-2.1374
-2.1284
(0.0278)***
(0.0299)***
(0.0300)***
(0.0282)***
Regressions include store fixed effects (differenced out) and 107 monthly fixed effects. Robust standard errors clustered by store in parentheses.
Uses all products observed in the 1991 data. * significant at 10%; ** significant at 5%; *** significant at 1%.
N/A
Definition of difficult to pronounce
Log Price
Self serve stores after change
Self serve × difficult to pronounce
Discrete choice framework
(1)
(2)
0.1180
(0.0227)***
0.2504
0.1964
(0.0234)***
(0.0214)***
-2.1478
-2.1347
(0.0302)***
(0.0275)***
Table 4: Difficulty of pronunciation – product-level data
10570
98
0.44
Products in 1991 guide –
different vintages are distinct
(7)
(8)
Herfindahl
Log sales in units
-0.0171
0.1964
(0.0037)***
(0.0215)***
Regressions include store-category fixed effects (differenced out) and 107 monthly fixed effects. Unit of observation is the store-category-month.
Robust standard errors clustered by store in parentheses. * significant at 10%; ** significant at 5%; *** significant at 1%.
(1)
Herfindahl
-0.0171
(-0.0037)***
Dependent variable →
Self serve stores after change
Only includes products in the 1991 guide
(2)
(3)
(4)
Log sales in units
Log sales in liters
Log sales in Krona
0.1964
0.1843
0.1951
(0.0215)***
(0.0247)***
(0.0238)***
Table 3: Treated stores sell more volume and more variety after the change
Figure 4: Coefficient on being in the treatment group over time (Herfindahl)
Specification resembles Table 3 column (1). Coefficients provided in the appendix.
We show results using products in the 1991 guide, using all products, and using
products in the 1991 guide where different vintages of the same wine are classified as
different products. In most of our analysis, we focus on products that appear in the
1991 guide because they are coded for pronunciation difficulty. Columns 1, 5, and 7
show that the sales concentration, as measured by a Herfindahl, falls substantially after
a store changes to a self-service format: the estimated marginal effect is 0.0171 relative
to an average of 0.09. Columns 2, 3, 4, 6, and 8 show that sales measured in units
increase by approximately 20%.
Figure 4 repeats the analysis in column 1 but at a finer level. Rather than a simple
discrete variable identifying the time a store changes format, we substitute the Self-serve
stores after change variable with a sequence of dummy variables for the quarters before
and after the format change. We find that, prior to the format change, stores in the
treatment group (i.e., those that change format) exhibit no trend towards decreased sales
concentration (measured by the Herfindahl); the timing of the change in the estimated
coefficient is coincident with the timing of the change in format.
13
2.3
The Effect of Format on Difficult-to-Pronounce Products
Next we focus on the product-store-month as the unit of observation to assess how the
difficulty of pronouncing a product’s name affects its sales. We develop a simple discrete
choice demand model of alcohol purchases, with the demand for a product driven by
utility maximization. Suppose the utility to consumer i of purchasing product j in
month t at store s is:
st
uij = Xjst β + µsj + τt + �st
j + vij ,
(2)
where Xjst is a vector of observed product characteristics that vary across time and across
stores, including the logged price, whether the store is self-service, and the interaction
between whether the store is self-service and the difficulty of pronouncing the product’s
s
name; µsj is a product-store fixed effect; τt is a month fixed effect; and vij
is a consumer-
specific preference for product j at time t in store s. Assuming logit errors and defining
j=0 as the outside good, we derive
st
st
log(Sjst ) − log(S0st ) = β1 (LogP rice)st
j + β2 (Self ServeStore)j + β3 (Self ServeStore)j ×
(Dif f icultT oP ronounce)j + µsj + τ t + �st
j
(3)
We estimate this equation as a linear regression with product-store fixed effects and
month fixed effects. Given this setup, a coefficient β3 > 0 suggests that the sales of
difficult-to-pronounce products are lower when people have to directly ask a sales clerk
for the product. One potential bias in this estimated coefficient is that our analysis
assumes the assignment of stores in the experiment is independent of a trend towards
increased sales of difficult-to-pronounce products. To examine this assumption, we show
that the sales of difficult-to-pronounce products did not rise in the treatment stores
relative to the control stores prior to the format change. This specification also uses
price as an exogenous reduced-form control, which we view as reasonable in this setting
given that (i) price does not vary across stores in a given period, (ii) price is set as
14
a fixed markup over wholesale, and, perhaps most importantly, (iii) price is not the
covariate of interest.
Next, we present our results on difficult-to-pronounce products in Table 5. Here,
Columns (1) and (2) contain the main results built from the utility framework shown
in (3), with the former indicating that sales for the average product rise when stores
convert from behind-the-counter to self-service. Given the results in Table 2, this is not
surprising.
More interestingly, Column (2) shows that the coefficient on the interaction of selfservice and difficult-to-pronounce is positive and strongly significant. A back-of-theenvelope calculation suggests that sales of difficult-to-pronounce products, defined by
whether the menu provided by Systembolaget provides a phonetic pronunciation guide
for the product, increase almost 12% relative to the sales of other products. Using the
results of Column (2) to simulate sales and Herfindahls both before and after the format
change, we find that the difficult-to-pronounce covariate drives 12% of the simulated
drop in product concentration and 5.7% of the simulated increase in quantity sold.
Table 5: By measures of popularity of the products
(1)
In the top quartile of
sales between 1984 and 1987
-0.0802
(0.0509)
(2)
Not in the top quartile of
sales between 1984 and 1987
0.0466
(0.0052)***
Self serve stores after change
0.0815
(0.0207)***
0.3021
(0.0043)***
Log Price
-2.1062
(0.0477)***
-1.3612
(0.0074)***
N
Number of groups
R2
258437
2830
0.11
667977
15462
0.23
Self serve × difficult to pronounce
Regressions include store fixed effects (differenced out) and 107 monthly fixed effects. Uses all products observed in the 1991 data.
Difficult to pronounce defined by whether there is pronunciation guidance on the menu.
Robust standard errors clustered by store in parentheses. * significant at 10%; ** significant at 5%; *** significant at 1%.
The remaining columns show the main result is robust to linear regressions (Columns
3 and 4), and alternative definitions of difficult-to-pronounce products (Columns 5
15
Figure 5: Coefficient on interaction between difficult-to-pronounce and being in the treatment
group, over time. Specification resembles 5 column (1). Coefficients provided in the appendix.
through 8). In terms of timing, Figure 5 examines this coefficient on pronunciation
quarter by quarter. Specifically, we estimate a different coefficient for the treatment
stores in each three-month period leading up to, and following, the format change. The
results show a sharp increase in the coefficient for difficult-to-pronounce products after
the format change.
Table 5 shows that the results of the store change on both total sales and the sales of
difficult-to-pronounce products are driven by relatively unpopular products; specifically,
products that were not in the top quartile of sales in the four years prior to our data
(1984-1987). This suggests that the sales of the most popular products are not affected
if they are hard to pronounce, perhaps because they were familiar enough so that people
knew the product names and had less trouble asking for them.
We interpret the results presented in this section as evidence that personal interactions act as a transaction cost that has a meaningful impact on particular types of
products: consumers are less likely to buy a product when they want to avoid a complicated pronunciation (or at least the embarrassment of pointing to it on a menu).
16
We argue that this friction is likely related to the potential for embarrassment, but
we cannot rule out the possibility that it is explained by a consumer’s desire to avoid
miscommunication. Furthermore, the store-level data make it difficult to estimate the
effect these social frictions have on welfare given consumers’ heterogeneous tastes. As
such, we turn next to an alternative setting where we document a similar result and
calculate its impact on welfare. Because we document consistent findings across these
two distinct settings, we interpret our results as providing a compelling body of evidence
that embarrassment is the likely mechanism affecting consumers.
3
Online Ordering at a Pizza Delivery Restaurant
3.1
Data and Setting
To continue exploring how social inhibitions affect consumers’ choices, this section uses
data from a franchised pizza delivery restaurant operating in a mid-size metropolitan
area.5 The franchise is similar to prominent chains such as Domino’s and Papa John’s,
but has a narrower regional presence. The store’s menu is standard, offering pizza
with traditional toppings, breadsticks, calzones, wings, and salads. The store also sells
beverages, but its distribution agreement prohibits the release of any sales data and
beverage sales are therefore excluded from our analysis. Because the store sells familiar
items such as pizza, most customers likely face little uncertainty about their purchases.
The store’s customers can place orders over the phone, at the counter, or, since
January 2009, through the franchise’s website, shown in an anonymous format in Figure
6. By our own (admittedly casual) comparison of the store’s website to larger national
chains’, it is less sophisticated and offers only basic functionality. The store’s website
has no search capabilities, no consumer ratings, no recommendations, no online-specific
promotions, and no saved order list. The store’s rudimentary website is a virtue for
5 Due to a confidentiality agreement required to access the data, many specific details related to both the franchise
and store are omitted.
17
KWWSVKXQJU\KRZLHVKXQJHUUXVKFRPRUGBVSHFLDOVDVS[
identification because it closely resembles the layout of physical menus distributed to
DLJĐĐŽƵŶƚͮ ^ŝŐŶKƵƚ
customers by,ŽŵĞ
the KƌĚĞƌKŶůŝŶĞ
store; little suggests that consumers would alter their behavior based
on any particular feature of the ƵƐƚŽŵŝnjĞzŽƵƌΨϱ͘ϵϵ^ŵĂůůϭƚŽƉKE>/E
website.
ффďĂĐŬƚŽŵĞŶƵ
KZZ^hDDZz
hƐĞ>ĂƐƚKƌĚĞƌ͍ůŝĐŬ,ĞƌĞ
ƵƐƚŽŵŝnjĞzŽƵƌŚĞĞƐĞWŝnjnjĂ
ĞƐĐƌŝƉƚŝŽŶ
ƌĞĂƚĞLJŽƵƌŽǁŶƉŝnjnjĂ͊^ƚĂƌƚǁŝƚŚĐŚĞĞƐĞĂŶĚĂĚĚƚŚĞƚŽƉƉŝŶŐƐŽĨLJŽƵƌĐŚŽŝĐĞ͊
KƌĚĞƌĞƚĂŝůƐ͗
EŽ/ƚĞŵƐĞůĞĐƚĞĚ
^ƚĞƉϭ͗ŚŽŽƐĞzŽƵƌ^ƚLJůĞΘ^ŝnjĞ
zŽƵĂƌĞŽƌĚĞƌŝŶŐĨƌŽŵ͗
WůĞĂƐĞ^ĞůĞĐƚƚŚĞƚLJƉĞŽĨ^ƚLJůĞĨŽƌLJŽƵƌWŝnjnjĂĂŶĚƚŚĞŶƐĞůĞĐƚŽŶĞŽĨƚŚĞĂǀĂŝůĂďůĞƐŝnjĞƐ͘
ZĞŐ
dŚŝŶ
,ƵŶŐƌLJ,ŽǁŝĞΖƐηϬϬϲϭϮ
ϭϴϭϰKďĞƌůŝŶZŽĂĚ
ZĂůĞŝŐŚ͕EϮϳϲϬϴ
WŚŽŶĞ͗;ϵϭϵͿϳϴϵͲϬϬϬϭ
^ŵ
^ƚĞƉϮ͗WůĞĂƐĞ^ĞůĞĐƚĂ&ůĂǀŽƌĞĚƌƵƐƚ
ĐŚĂŶŐĞůŽĐĂƚŝŽŶ
KƌĚĞƌdLJƉĞ͗
a6(/(&7a
a6(/(&7a
a6(/(&7a
ĞůŝǀĞƌLJ
WŝĐŬhƉ
ŽƵƉŽŶ͗
ΎΎΎKƌŝŐŝŶĂůƌƵƐƚΎΎΎ5HPRYH
ŶƚĞƌŽĚĞ
^ƚĞƉϯ͗WůĞĂƐĞ^ĞůĞĐƚ
9DOLGDWH
>ĂƐƚKƌĚĞƌ͗;ǀŝĞǁͿ
DŽĚŝĨLJLJŽƵƌWŝnjnjĂĨƌŽŵƚŚĞůŝƐƚďĞůŽǁ͘ůŝĐŬŽŶĞĂĐŚƚŽƉƉŝŶŐƚŽƌĞŵŽǀĞŝƚ͘
a6(/(&7a
a6(/(&7a
a6(/(&7a
ϰyĂĐŽŶ5HPRYH
^ƚĞƉϰ͗^ƉĞĐŝĂů/ŶƐƚƌƵĐƚŝŽŶƐ
/ƚĞŵEŽƚĞ͗
ΞϮϬϭϮ
Figure 6: Screenshot
of the store’s website stripped of identifying content.
WƌŝǀĂĐLJWŽůŝĐLJ
For phone and counter orders, an employee enters the order through a touchscreen
point of sales terminal, which is then transmitted to a display in the food preparation
area. For website
orders, a customer clicks on a link for a particular base item and then
KWWSVKXQJU\KRZLHVKXQJHUUXVKFRPRUGBVSHFLDOVDVS[
configures it through a series of drop-down menus; the order then goes directly to the
food preparation display. Customers may either pick up completed orders made on all
channels at the store for no additional charge, or have them delivered for a fee plus an
optional gratuity.
18
The dataset used in this paper includes all food items from orders made between
July 2007 and December 2011.6 The store anonymized the data before releasing it
and assigned a unique identifier to all households through a third-party proprietary
system. Because the store’s identifier is at the household level, the terms household and
customer are used interchangeably throughout. Figure 7 provides a sample order made
by a customer containing five base items placed over the phone for delivery.
The measure of complexity in this paper refers to the number of instructions a
customer provides for each base item in his order. For example, we define a large
pizza as complexity 1, a large pepperoni pizza as complexity 2, a large pizza with half
pepperoni and half sausage as complexity 3, and so on. Thus, the minimum complexity
for any base item is 1, while the maximum in the data is 21. This store, like most
pizza franchises, also offers “specialty” pizzas that have preconfigured toppings, such as
a “veggie” pizza with seven toppings. We code specialty pizzas to have complexity 1 in
the data unless the customer provides instructions to add or remove toppings. Under
this definition, the order in Figure 7 has a mean base item complexity of 2.6 and a
maximum base item complexity of 5. The mean complexity comes from having five base
items and a total of 13 instructions, which includes the base of 1 for each item.
The store also provided information for the number of calories in each item. As a
benchmark, a large cheese pizza has 2080 calories, whereas a small garden salad with no
dressing has 40 calories. In the data, the mean and maximum number of calories for the
base items within an order are constructed in an equivalent manner to the measures for
complexity. Using the example in Figure 7 once again, the mean base item has 1196.2
calories, and the maximum base item has 2210.
Finally, the measure of popularity in this paper refers to the number of times an
item has been ordered at the store. A large pizza is the most popular item, having been
ordered 95,846 times. The mean and maximum popularity for the items within an order
6 To preserve the confidentiality of sensitive competitive information, the store did not release data for orders over
$50 (typically large institutional orders) or for promotional orders under $3.49, the price of the least-expensive food
item.
19
!"#$%
&'($')*+,-$'%
&'($')./0$%
&'($').1,$%
!!"#$"%#!!
&#
'()*+(,#./.!012
!
."5$6)7/% 7FGFHIJF07G*IJ
."-8$%
<K05(K03,(FI(0LMN,09OH01*PPF
00000RRR;F,)*S04(,T03,NUIRRR
000004!D7FNUFK(
7G05(K03,(FI(0LMN,09OH01*PPF
000007FNUFK(
000001(WW(,MH*
000009H*MHU
00000RRR;F,)*S04(,T03,NUIRRR
3*HHFGMH0X,(FY
:N,Z(-07NT
00000>90:MGFIM(U
00000>90<(IINS(
7G0?HI*WFUIM
[\CQ$$0LMN,03JM*S(07G)EIMW]
[\CQ$$0LMN,03JM*S(0<,K!IMW]
!
!
!
!
2+3#4,$'%
0345670895'7895:4
!.!.0;<=>899'0?@=
5?<=6;4A0>30%B&#C
$!$DE%%D%%&C
$Q$$
#QB.
BQV$
!Q!$
!Q!$
!Q!$
EQ$$
&Q$$
VQ$$
D%Q#B
D!QB.
9+-#4#"8
!$81D$'/)E$$
.":
.10
.4#"8
;;<=>
?<>F
?<@?
C<FF
AB<?C
G"/,$6#3
#./.!012
3,(Y*I3F,Y
23
AB<?C
7FGFHIJF07G*IJ
Figure 7: Sample order from the store’s sales terminal. Rows with a “1” in the leftmost
column contain base items. The rows below a base item represent instructions to alter
the base item above them (e.g., add a topping). Entries contained within brackets
represent promotions.
are constructed in the same way as they are for the equivalent measures of complexity.
In addition, the proportion of items in an order among the top ten most popular items
serves as an alternative characterization of popularity.
The dataset comprises 160,168 orders made by 56,283 unique customers, with summary statistics reported in Table 6. The average order price is $14.70 and contains
slightly more than two base items. On average, the mean base item within an order has
2.6 instructions and 1,695 calories, while the maximum has 3.3 instructions and 2,023
calories. In terms of popularity, 47.5% of the items in an average order are among the
top ten most popular.
Of the store’s orders, 6.7% have been
placed online and notable differences exist
1FK(0%V0M^0.%
between these and non-Web orders. Customers using the Web spend $0.61 more, on
average, though they order slightly fewer base items; this result stems from online
customers ordering more toppings per item. The mean base item is 15.0% more complex
20
21
Web Order
Order Price
Items in Order
Complexity – Mean Order Item
Complexity – Max Order Item
Calories – Mean Order Item
Calories – Max Order Item
Popularity – Mean Order Item
Popularity – Max Order Item
Popularity – Order Items in Top Ten
N
Variable
Mean
0.067
14.702
2.036
2.646
3.273
1694.613
2022.724
28568.468
60223.529
0.475
160168
Full Sample
Std. Dev.
Min.
0.25
0
6.829
3.49
1.156
1
1.217
1
1.399
1
607.077
110
625.991
110
19424.284
26
35233.225
26
0.325
0
Max.
1
49.99
17
21
21
6010.84
6010.84
95846
95846
1
Web Comparison
Web Mean Non-Web Mean
0
1
15.46
14.85
1.99
2.02
3.06
2.66
3.81
3.26
1798.84
1695.60
2154.81
2009.20
22291.69
29066.06
55576.36
60618.02
0.39
0.48
10693
104804
Table 6: Descriptive statistics for pizza data
9.04
3.27
27.08
32.62
15.92
21.74
41.26
14.04
30.54
t-stat
and has 6.1% more calories in an online order, while the maximum base item is 16.9%
more complex and has 7.2% more calories. In terms of popularity, the average online
order contains 9 percentage points fewer top-ten items.
The average customer has made 2.8 orders since the store’s opening, with a range
from 1 to 88. Approximately 31.9% of customers ordered from the store before it
implemented online ordering, while 76.2% of customers have ordered in the post-Web
period. The intersection is 8.1%, meaning that the sample includes 4,582 customers
who purchased from the store both before and after online ordering became available.
Of these, 700 (1.2% of total customers) made an order both during the pre-Web time
period and through the website after the introduction of online ordering. This group
of customers will be crucial for identifying the causal effects of Web use, as observing
orders across both regimes makes it possible to difference out unobserved heterogeneity
that might drive selection into the online channel.
The store frequently offers promotions, with the average customer using a coupon in
54.3% of his orders. All promotions are available across all channels and Web customers
are slightly less likely to use a promotion. Because physical coupons come affixed to
menus, any customer using a promotion likely has full knowledge of the store’s products,
an institutional detail exploited as a robustness check below.
3.2
The Effect of Online Ordering on the Concentration of Sales
The store’s online orders exhibit a significantly less concentrated sales distribution even
though product selection, prices, and search capabilities remain fixed. To establish the
significance of this result, we compares the sales distribution of the store’s 202 items
(i.e., the five base items, specialty pizzas, and toppings) across three non-overlapping
types of orders, pre-Web orders, Web orders, and non-Web orders made during the
post-Web period. Throughout, items are also distinguished by size (e.g., a large pizza is
considered distinct from a medium pizza), though all results are robust to characterizing
different sizes of the same item as equivalent. Any item purchased fewer than 25 times
22
on any channel is dropped, a conservative restriction.
As in our analysis of the alcohol setting, we use a Herfindahl index to provide a
concise measure of the sales concentration. It is 0.0392 for the pre-Web period, 0.0397
for non-Web sales in the post-Web period, and 0.0253 for Web sales. For comparison,
the Herfindahl index for equal sales across the 202 items is 0.00495. Furthermore,
the percentage of total sales generated by the bottom 80% of products provides an
alternative measure of concentration. For pre-Web orders, the share is 17.8%, for Web
orders it is 25.5%, and for non-Web orders in the post-Web period it is 17.4%. Thus,
the share of the bottom 80% of products is 8.1 percentage points greater for Web orders
compared to non-Web orders during the same time period, which compares to the 4
percentage point difference documented by Brynjolfsson et al. (2011) for online and
catalog clothing sales. Finally, the top ten products comprise 50% of sales pre-Web,
though they account for just 41% of online sales while still constituting 50% of non-Web
sales in the post-Web period.
To establish that the difference in sales concentration across segments is statistically
significant, consider the following regression:
ln(Salesj ) = α + βln(SalesRankj ) + εj ,
(4)
where Salesj is the normalized sales of product j and SalesRankj is the ordinal ranking
of that item within the sales distribution (i.e., the most popular item has SalesRank =
1). The log-linear curve in (4) represents a Pareto curve, and β measures how rapidly
a product’s sales fall as its sales rank increases. A channel has a longer tail compared
to others if β is larger (i.e., less negative) for its products.
Table 7 presents the results from a series of these regressions. On the Web, an item’s
sales fall less rapidly as its sales rank increases, as shown in Columns (2) and (3). To
test the statistical significance of this difference, consider the following specification that
23
Table 7: Popularity of items ordered online and offline
(4)
Pooled Orders
Log Sales
-1.757***
(0.0940)
(5)
Pooled Orders
Quantile Log Sales
-1.915***
(0.0338)
Web Order
-1.187**
(0.510)
-1.072***
(0.212)
Web Order x Log Sales Rank
0.407***
(0.114)
0.353***
(0.0478)
Log Sales Rank
(1)
Pre-Web Orders
Log Sales
-1.974***
(0.129)
(2)
Web Orders
Log Sales
-1.350***
(0.0642)
(3)
Non-Web Orders
Log Sales
-1.757***
(0.0940)
Constant
12.96***
11.04***
12.22***
12.22***
13.17***
(0.562)
(0.289)
(0.420)
(0.420)
(0.150)
Observations
202
202
202
404
404
R2
0.769
0.914
0.873
0.891
0.711
Robust standard errors in parentheses
* p < 0.10, ** p < 0.05, *** p < 0.01
This table presents Pareto curve estimates from Equations (4) & (5). Columns (1)-(3) present the coefficients
from Equation (4) estimated using ordinary least squares. Column (4) presents the coefficients from Equation (5)
estimated using ordinary least squares for the pooled data from the post-Web period. Column (5) presents the coefficients from Equation (5) estimated using quantile regression (median) for the pooled data from the post-Web period.
pools all orders in the post-Web period:
ln(Salesj ) = α + βln(SalesRankj ) + γW ebj + δW ebj x ln(SalesRankj ) + εj ,
(5)
where W ebj is an indicator variable equal to 1 if the observation comes from the Web
channel. As shown in Column (4), a statistically significant positive coefficient δ indicates that the difference between Web and non-Web orders is meaningful. Moreover,
the results from a quantile regression for the conditional median presented in Column
(5) suggest that outliers are not responsible for the change in sales patterns.
Consistent with the results found for alcohol sales in the previous section, these regressions establish that the store’s online orders have a significantly less concentrated
sales distribution. While other online markets also exhibit this pattern, the underlying
cause of the shift is unlikely to be the same here as in previous studies — the selection
of available products remains constant in this case, and search capabilities change little
(Brynjolfsson et al. 2003, 2011). Next, we consider whether a reduction in social inter-
24
action leads to a less-concentrated sales distribution, a pattern of sales often labeled the
“long tail” effect.
3.3
Reduced Social Interaction as a Source of the Long Tail
To investigate whether the impersonal nature of online transactions contributes to the
long-tail sales distribution documented above, we now consider a series of regressions
that show consumers are more likely to make choices associated with embarrassment
if they place orders through the store’s website. As an extensive literature in social
psychology has shown that individuals experience embarrassment when others observe
them eating excessively or unconventionally, this setting has three natural measures of
order-level attributes that consumers may wish to conceal: an item’s complexity, its
calories, and its popularity. For example, Polivy et al. (1986) conduct an experiment
to measure the effect observers have on an individual’s food consumption, finding that
subjects eat less when they believe the experimenter will be aware of their food intake.
At the extreme, studies of bulimia also find that binge eating occurs less frequently in
the presence of others (Waters et al. 2001, Herman & Polivy 1996). Moreover, complexity and obscurity may cause embarrassment if customers fear appearing eccentric
by ordering an unconventional combination of items, which relates to psychological theories of “impression management” (Banaji & Prentice 1994). In this vein, Roth et al.
(2001) provide experimental evidence that subjects adhere to norms for “appropriate”
eating behavior around others. Thus, because it removes a layer of social interaction,
ordering online may lead consumers to purchase items they otherwise would not, as their
transaction becomes anonymous and beyond the judgment of others, an effect labeled
“online disinhibition” by Joinson (1998) and Suler (2004)
To test this theory, we consider a series of regressions that take the form
Yij = α + βXij + γW ebij + δi + εij ,
25
(6)
Table 8: Regression results of embarrassment drivers and web sales
Row
Dependent Variable
Web Order Effect
Standard Error Observations
R2
1
Complexity Mean Order Item
0.380***
(0.0468)
48446
0.376
2
Complexity Max Order Item
0.462***
(0.0516)
48446
0.382
3
Calories
Mean Order Item
50.64**
(21.33)
48446
0.332
4
Calories
Max Order Item
71.93***
(23.28)
48446
0.350
5
Popularity
Mean Order Item
-5658.5***
(633.2)
48446
0.405
6
Popularity
Max Order Item
-4977.3***
(1201.9)
48446
0.371
7
Popularity
Order Items in Top Ten
-0.0770***
(0.0104)
48446
0.405
8
Complexity Half Topping Order
0.106***
(0.0148)
48446
0.304
9
Complexity Double Topping Order
0.0327***
(0.00814)
48446
0.231
10
Complexity
Triple Topping Order
0.00461
(0.00366)
48446
0.347
11
Complexity
Mean Coupon Order Item
0.411***
(0.0680)
25590
0.393
12
Complexity
Max Coupon Order Item
0.465***
(0.0686)
25590
0.400
13
Calories
Mean Coupon Order Item
116.1***
(28.79)
25590
0.332
14
Calories
Max Coupon Order Item
149.6***
(34.48)
25590
0.367
15
Popularity
Mean Coupon Order Item
-6530.5***
(798.0)
25590
0.405
16
Popularity
Max Coupon Order Item
-5723.7***
(1651.2)
25590
0.380
17
Popularity
Coupon Order Items in Top Ten
-0.0929***
(0.0139)
25590
0.443
18
Price
Order Total
0.4336**
(0.2054)
48446
0.349
Standard errors clustered by household in parentheses.
* p < 0.10, ** p < 0.05, *** p < 0.01
Each row represents an OLS regression based on Equation (6). All regressions include controls for the day of the
week an order was made, a monthly time trend, and customer fixed effects. Rows (1) - (10) and (18) are restricted
to customers who have made (i) at least ten orders, (ii) at least one order during the pre-Web period, and (iii) at
least one order during the post-Web period. Rows (11) - (17) are restricted further to those customers who used a
coupon for their order.
with Yij ∈ {complexity, calories, popularity} for order j by customer i; Xij represents
order-specific characteristics such as the day of the week and a time trend; W ebij is
equal to one if the order was made online; and δi is a customer-level fixed effect.
Table 8 presents the results from eighteen different linear regressions based on (6) that
use various dependent variables; furthermore, we restrict the sample to those customers
who have made at least ten orders and have ordered during both the pre-Web and
post-Web periods. This restriction rules out household-level selection into the sample
based on the availability of Web ordering and therefore more cleanly identifies the causal
effect. We also cluster all standard errors by household.
In our first regression, Row (1) uses the mean complexity of the order’s base items as
the dependent variable. Along this dimension, online orders are approximately 14.4%
more complex than the sample mean. Similarly, Row (2) presents the results from a
regression using the maximum complexity of the order’s base items as the dependent
26
variable. This specification provides reassurance that the results are robust to an alternative conception of complexity, as the effects remain similar to above at 14.1%.
A customer may also experience embarrassment if others observe him making an
order with excessive calories. For instance, Allen-O’Donnell et al. (2011) found in their
study of eating behavior that subjects dining alone consumed 7.3% more calories than
those eating in a group. In this spirit, Row (3) presents the results from an OLS
regression of (6) with the mean calories of the order’s base items as the dependent
variable. Here, the mean base item within an online order has 3.0% more calories
compared to the sample mean. Likewise, for regressions in which the base item with
the maximum number of calories within an order is the dependent variable in Row (4),
the effect of placing a Web order is a 3.6% increase.
Rows (5) and (6) connect the effect of impersonal Web orders directly to the longtail phenomenon by showing that items ordered through the store’s website are less
popular, on average. The mean item purchased on the Web is 19.8% less popular, while
the maximum item is 8.3% less popular. Relatedly, Row (7) shows that online orders
have 7.7 percentage points fewer items among the top ten most popular. In all cases,
moving to online ordering leads customers to purchase less common items and results
in a less concentrated sales distribution.
Collectively, these regressions show that the long-tail sales distribution for online
orders results in part from customers ordering more complex items, more obscure items,
and items with more calories. In other words, customers make choices with less potential for embarrassment when their transaction requires them to interact with others. To
conclude that these findings do indeed stem from a social friction related to embarrassment, we next show that several alternative theories unrelated to embarrassment do not
explain the differences documented among online orders.
27
3.4
Alternative Explanations Unrelated to Embarrassment
While the findings discussed above have been robust to customer-level fixed effects and
conservative sample restrictions, we now present additional evidence to affirm the causal
claim that the results in this section are explained by the potential for embarrassment
in social interactions.
Information about available items One potential explanation for the long tail of
online orders is that customers without access to a menu may be more likely to order
prominent items. That is, without information about the full menu of products, a
customer may simply order a large pepperoni pizza because he recalls that item more
readily, not because ordering complicated items causes embarrassment. And because
online customers necessarily have access to the full menu, this may lead to a long-tail
sales distribution as they become aware of less-prominent items. Several results help
rule out this explanation.
First, this setting is a familiar one for most customers and the store’s menu is typical; anyone who has ordered from another pizza delivery restaurant presumably could
surmise the full menu, likely making any difference in information among consumers a
negligible contributor to the marked changes in behavior online.
Second, consider the results from the regression of topping size on Web use presented
in Rows (8)–(10). Here, the dependent variable is equal to one if the order has a
customized topping instruction of a half, double, or triple portion, respectively. In this
case, any customer who knows a topping is available also knows the topping is available
in different amounts. Because Web customers are more likely to alter the size of their
toppings, especially for larger portions, it seems unlikely that information about product
offerings is responsible for the greater complexity among online orders.
Third, consider Rows (11)–(17) which present the results from the benchmark regressions restricted to those customers who used a coupon. Because coupons come affixed
to menus for this store, any customer who uses one plausibly has access to the same
28
information about products as those who order online. Again, all results are robust to
this more conservative sample restriction.
In a related point, consumers with better access to nutritional information may
reduce their caloric intake, as shown by Bollinger et al. (2011). Because the store’s
website has more prominent information about nutrition, the results pertaining to the
impact of online ordering on the number of calories per item are conservative along this
dimension.
Ease-of-use
A second potential explanation for the long tail of online orders is that
complex and calorie-dense orders are easier to make on a website. That is, the online
disinhibition effect does not lead consumers to alter their behavior on the Web, an
easier-to-use interface does. There are two reasons why we think ease-of-use is not a
primary explanation for our results. First, an ease-of-use explanation also would have to
apply to the number of base items within an order — because customers are not more
embarrassed to order two pizzas as opposed to one, the alleged mechanics of the website
that would facilitate providing customized topping instructions also would carry over
to ordering more base items. Recall from Table 6, however, that online orders actually
contain slightly fewer base items, on average. Second, the store’s employees have greater
facility with the ordering system than any customer could possibly have online; they are
simply more adept at using the store’s sales terminal than a customer is at navigating
the website. This is especially true for complex orders that require multiple button
clicks online but could be entered quickly on the store’s touchscreen sales terminals.
Order accuracy
Related to the ease-of-use explanation, consumers may avoid making
complex orders on the phone to reduce the potential for misinterpretation. Recall that
in the alcohol setting, we could not distinguish between actual embarrassment and a
customer’s desire to avoid misinterpretation as explanations for why the self-service
format affected sales of hard-to-pronounce items. In this setting, three institutional
details suggest that embarrassment, and not a fear of miscommunication, best explains
29
customers’ choices.7
First, recall that customers are more likely to order double and triple portions of
toppings online. Although it is as trivial for customers to say, for example, “double
bacon” over the phone as it is for them to click through the online drop-down topping
menu twice, double and triple bacon orders increase more than ten times as much as
double and triple orders for vegetable toppings.
Second, for order accuracy to be a problem, it suggests that employees would make
fewer mistakes when fulfilling the order online compared to over the phone. For instance,
an employee taking an order over the phone in a loud restaurant may not understand a
customer’s instructions and mistakenly deliver the wrong items. We have a (somewhat
noisy) measure of mistakes: “voided” items, which means that the order changed during
the call, either because the employee made a mistake or because the customer altered
his order. To see the role of such mistakes in driving online sales, we compare customers
who had voided orders in the pre-Web period to those who did not. Customers with
voided orders are not more likely to eventually use the Web, suggesting that concerns
over the accuracy of complicated orders due to previous bad experiences does not explain
Web use.
Third, and relatedly, those who made the most complex orders during the pre-Web
period are not more likely to switch to ordering online. These customers are unlikely to
be embarrassed about making complicated orders — they have done so before — but
they would benefit the most from switching to online ordering if it were easier to make
complicated orders through the website or if it were easier to ensure that the right items
are delivered. Those who made more complicated orders during the pre-Web period are
not more likely to place subsequent orders through the website, which again suggests
that ease-of-use and concerns about order accuracy do not lead customers to alter their
behavior.
7 Regression
results in this section are presented in the appendix
30
Selection bias A fourth explanation for the long tail of online orders is that consumers
who use the online channel differ systematically from those who do not (Zentner et al.
2012). For instance, it could be that those who use the Internet also prefer to order
complicated items for reasons unrelated to embarrassment. Note, however, that we
control for this confound directly by using individual-level fixed effects and conservative
sample restrictions to reduce concerns of selection bias. We also provide further evidence
that selection bias does not undermine our results in the supplemental appendix.
Discussion
Given that the results on complexity, calories, and unusual orders do not
appear to be driven entirely by information, ease-of-use, order accuracy, or selection
bias, we argue that the impersonal nature of Internet transactions, which then reduces
the potential for embarrassment, primarily explains the difference in sales distributions
between the online and offline channels. Next, we estimate the welfare effects that stem
from such social frictions.
3.5
Welfare Consequences of Online Disinhibition
Consumer Surplus Because a number of customers switched to online ordering when
given the choice, a straightforward revealed preference argument suggests that their
welfare has increased. These potential welfare gains may derive from several sources.
For one, some consumers may simply find ordering over the Internet more convenient. In
addition, the lack of social interaction may free consumers to configure the items within
their orders in a way that increases utility. On the other hand, some consumers may find
ordering online more cumbersome, or even that complicated orders are easier to make
in person, a converse to the online disinhibition effect. In light of such heterogeneity,
this section outlines a random coefficients discrete choice model to quantify the gains in
consumer surplus attributable to the introduction of online ordering.
To specify the model, let consumer i choose among j discrete complexity options and
m methods of ordering for each of his orders, o. In this case, j indexes the mean number
31
of instructions for the base items within an order, rounded to the nearest integer such
that j ∈ {1, . . . , 6}, which captures 99% of orders. Furthermore, let m ∈ {W eb, N onW eb} represent the chosen method of ordering. The utility a customer derives from an
order with a mean of j instructions through method m is then
e e
Uijmo = βip xpijmo + βic xcijmo + βiw xw
ijmo + βi xijmo + εijmo ,
(7)
where xpijmo is the price associated with an order of mean complexity j; xcijmo ∈
{0, . . . , 6} is the mean complexity of the order’s base items associated with j (xc = 0
is the outside option of no purchase); βic represents the utility consumer i derives from
each unit of instruction; xw
ijmo is an indicator variable equal to one if the order was made
online; βiw represents the “cost” of ordering online — this estimated coefficient will be
negative to rationalize why the majority of orders do not occur through the website;
xeijmo is an indicator variable equal to one if the method of ordering m was not online
and the mean complexity of the order’s base items was j ∈ {4, 5, 6} — βie then represents
the “embarrassment” of making a complex order in the presence of others;8 and εijmo
is an unobserved error term that is identically and independently distributed extreme
value and independent of xijmo and βi . Finally, the outside option of not ordering has
a utility normalized to zero.
The sample for estimation is restricted to the 2030 customers (i) who have made
at least 10 orders, (ii) who ordered in both the pre- and post-Web period, and (iii)
who have a mean base item complexity of six or less. The period spans 56 months and
customers may order up to three times per month, where the counterfactual price is
taken to be the average price across the sample period.
The results from a random coefficients logit appear in Column (3) of Table 9.9 The
coefficients suggest that the mean “cost” of using the website increases to an implicit
price of nearly $8.90, with considerable heterogeneity around this mean. In addition,
8 Fewer
9 See
than 10 percent of orders have a mean item complexity of 4 or higher.
Train (2003) for estimation details.
32
customers derive greater average utility from providing more instructions per item,
holding price constant — about $0.85 per instruction, on average. This preference
varies considerably throughout the sample, however, as the standard deviation of this
coefficient is more than twice as large as the mean effect. Finally, and most importantly,
embarrassment has a meaningful and heterogeneous effect on order choices. In dollar
terms, embarrassment has an average implicit price of $2.75, while those customers two
standard deviations above the mean have a price of embarrassment equivalent to $5.92.
33
Table 9: Coefficient estimates of the structural demand model.
(1)
-0.763***
(0.00245)
(2)
-0.778***
(0.00194)
(3)
-0.579***
(0.0217)
0.390***
(0.01118)
-3.019***
(0.0226)
-3.007***
(0.0226)
-5.154***
(0.276)
3.187***
(0.3286)
0.377***
(0.00734)
0.431***
(0.00613)
0.491***
(0.0701)
1.083***
(0.03829)
-0.667***
(0.0225)
-0.751***
(0.0187)
-1.595***
(0.164)
2.592***
(0.1062)
1.623***
(0.00446)
Observations
3702720
LL
-384061.69
Robust standard errors in parentheses
* p < 0.10, ** p < 0.05, *** p < 0.01
3702720
-376992.4
3702720
-208119.25
Instruct.
Embarrass.
Mean Price
Std. Dev. Price
Mean Web Cost
Std. Dev. Web Cost
Mean Instructions
Std. Dev. Instructions
Mean Embarrassment
Std. Dev. Embarrassment
Constant
Correlation Matrix
Price
Price
0.1524
Web Cost
Web Cost
0.2464
10.16
Instructions
-0.4085
-1.0954
1.1728
Embarrassment
0.7318
3.1945
-2.3106
6.7167
This table presents the estimated coefficients from the discrete choice
model in Equation (7). “Embarrassment” is defined as highly complex
requests ordered offline. Column (1) contains the results from a logit
specification. Column (2) contains the results from a fixed-effects logit
specification. Column (3) contains the results from a random coefficients logit specification.
A full covariance matrix also was estimated for the parameters in the random coefficient logit, as shown at the bottom of Table 9. Most associations are intuitive. For
instance, those who are more sensitive to price also have a high cost of Web use. This
fits with the conventional wisdom that Web use is positively correlated with income
(Goldfarb & Prince 2008). In addition, embarrassment is positively related to price
sensitivity and the cost of Web use, though negatively related to the utility of providing
34
more instructions per item.
Importantly, the random coefficients model permits a calculation of a consumer’s
willingness to pay for certain order attributes. Following Train (1998) and Revelt &
Train (1998), the change in consumer surplus for a given β is
Cio =
ln
� �
j
m
exp(βxijmo ) − ln
βp
� �
j
k
exp(βxijko )
,
(8)
where k indexes a counterfactual choice setting without online ordering. The compensating variation for consumer i and order o is then
CVio =
�
Cio (β)f (β|θ)dβ,
(9)
where θ represents the true parameters.
The average compensating variation constitutes the average of CVio taken over all
orders by all consumers in the sample. Based on Monte Carlo simulations, consumer
surplus has increased 5.4% due to online ordering.10 These gains resemble those of
Brynjolfsson et al. (2003) who estimate that consumer welfare increased by up to 4.2%
due to a larger selection of products available at online booksellers.11 In this sense,
freeing consumers to choose their most preferred item configuration without embarrassment generates additional utility of a magnitude similar to having access to a greater
selection of products over the Internet.
Producer Surplus Because an item’s price is non-decreasing in its complexity, the
store stands to gain by allowing customers to make anonymous orders. As shown in
Row (18) of Table 8, customers spend roughly $0.43 more when they order online. This
increase in spending occurs on the intensive margin, so the store’s per-item margin of
approximately 66% applies. That is, conditional on an order occurring, the store earns
10 Based
on 1000 simulations and 1% tail truncation. See Train (2003) for simulation details.
et al. (2003) estimate a consumer welfare gain between $731 million to $1.03 billion in 2000 relative
to overall book sales of $24.59 billion.
11 Brynjolfsson
35
approximately $0.292 in additional profits by allowing customers to order anonymously
on the Web to the extent that other costs do not change (e.g., labor costs do not increase
because orders have become more complex).
Customers using the Web would have made 0.416 orders per month, on average, but
their spending increases by $0.43. In addition, Web users increase their order frequency
by 0.072 orders per month and spend, on average, $15.46 per order. Thus, the store’s
average monthly gain from each Web customer is $1.29, or 20.8%. As Web customers
now constitute roughly 17% of the store’s total sales, the store earns 3.5% more annually
than it would in a counterfactual setting without online ordering. We hasten to note,
however, that an absence of information about the competitive environment restricts us
to providing only a rough approximation of the incremental profits the store earns each
year due to Web ordering.
These gains may seem underwhelming given the received wisdom that online platforms “disrupt” markets; however, online orders typically come from pre-existing customers — the store would reap a majority of these orders through traditional channels
anyway, and a counterfactual estimation of the gains from online ordering must account
for any cannibalized sales. In this sense, the findings here resemble the relatively modest counterfactual gains attributable to the Internet’s diffusion documented elsewhere
(Greenstein & McDevitt 2011).
Summary
Overall, our calculations suggest that the frictions related to social interac-
tions have a substantial impact on welfare in this setting, yielding a change in consumer
surplus comparable to prior estimates of the impact from online stores’ larger product
selection, as well as an increase in producer surplus that, while modest, nevertheless
justifies the implementation of online ordering.
36
4
Conclusions
We have documented that, in two different retail settings, the amount of interpersonal
interaction required to conduct a transaction has a large effect on the types of products purchased by consumers. First, we showed using data from a field experiment in
which stores changed formats from behind-the-counter to self-service that the sales of
difficult-to-pronounce products experienced the largest gain. Second, we showed that
the addition of an online ordering channel increased the sales of unusual, high-calorie,
and complex items at a pizza delivery restaurant, which increased consumer surplus by a
proportion similar to that estimated by Brynjolfsson et al. (2003) for a greater selection
of products available at online bookstores.
Together, we believe these results suggest that personal interaction can inhibit certain kinds of economic activity, likely due to the potential for embarrassment. While
prior literature in psychology, sociology, and medicine has documented that activities related to health and sexual behaviors differ depending on whether they involve personal
interactions, we document that the phenomenon is broader and applies to even relatively benign causes of embarrassment, such as mispronouncing the name of a product
or making an unusual pizza order.
As with any empirical work, each of our settings has limitations that bound our
ability to conclude forcefully that the social frictions from embarrassment fully explain
consumers’ observed behavior. First, we analyze just two settings. While these settings
are common, their applicability to other markets, particularly beyond retail, remains
speculative. Second, while the lack of equilibrium response by the firms in our setting
is an advantage in terms of cleanly linking the changes in customer behavior to the
changes in sales format, our welfare analysis is necessarily limited in that it does not
take into account competitors’ responses. Thus, our estimate of the impact on welfare is
necessarily rough. Third, while we have tried to eliminate other possible interpretations
for our results, we have simply documented that changing a sales format to one that
37
requires less social interaction leads to different choices by consumers. We cannot definitively conclude that this change is due to embarrassment. Instead, we argue that some
theories are unlikely to explain our results in the alcohol setting (such as competitors’
responses and consumers’ selection into the stores because the stores are geographically
isolated monopolies), and some theories are unlikely to explain our results in the pizza
setting (such as consumers’ desire to reduce the misunderstanding of orders).
Despite these limitations, we believe that by documenting such effects in two distinct
cases with different strengths and weaknesses as empirical settings, we have provided
robust evidence that social interactions influence consumers. In this way, our results
provide a new explanation for the prevalence of long-tail sales distributions in online
markets: impersonal transactions lead consumers to purchase a different mix of products
than they would in settings that require personal interaction. Our results are also
consistent with recent economic models of privacy, especially Daughety & Reinganum
(2010), that frame privacy as an individual’s desire for others to perceive him in a
positive light. Consistent with Goffman (1959) and others, our results suggest that
interpersonal interactions are an important aspect in enhancing this desire. Thus, our
results are informative about why online behavior, which does not require interpersonal
interactions, leads to an online disinhibition effect and identifies a source of consumer
benefit from using the Internet not previously mentioned in the literature (Scott Morton
2006).
Overall, our results build on recent work in economics that examines the role of
social cues in behavior (Akerlof & Kranton 2000, Rabin 1993, Daughety & Reinganum
2010, DellaVigna et al. 2012). Simply put, our results suggest that social interactions
can inhibit benign economic activity, which reduces both consumer surplus and overall
welfare.
38
References
Akerlof, G. A. & Kranton, R. E. (2000), ‘Economics and identity’, Quarterly Journal of
Economics 115(3), 715–753.
Akerlof, G. A. & Kranton, R. E. (2008), ‘Identity, supervision, and work groups’, American Economic Review Papers and Proceedings 98(2), 212–217.
Allen-O’Donnell, M., Cottingham, M., Nowak, T. & Snyder, K. (2011), ‘Impact of group
settings and gender on meals purchased by college students’, Journal of Applied Social
Psychology 41(9), 2268–2283.
Anderson, C. (2004), ‘The long tail’, Wired Magazine 12(10), 170–177.
Ariely, D. & Levav, J. (2000), ‘Sequential choice in group settings: Taking the road less
traveled and less enjoyed’, Journal of Consumer Research 27(3), 279–290.
Banaji, M. & Prentice, D. (1994), ‘The self in social contexts’, Annual Review of Psychology 45(1), 297–332.
Bar-Isaac, H., Caruana, G. & Cuñat Martinez, V. (2012), ‘Search, design and market
structure’, American Economic Review 102(2), 1140–60.
Bertrand, M., Duflo, E. & Mullainathan, S. (2004), ‘How much should we trust
differences-in-differences estimates?’, Quarterly Journal of Economics 119(1), 249–
275.
Bollinger, B., Leslie, P. & Sorensen, A. (2011), ‘Calorie posting in chain restaurants’,
American Economic Journal: Economic Policy 3(1), 91–128.
Brynjolfsson, E., Hu, Y. J. & Rahman, M. S. (2009), ‘Battle of the Retail Channels: How
Product Selection and Geography Drive Cross-Channel Competition’, Management
Science 55(11), 1755–1765.
Brynjolfsson, E., Hu, Y. J. & Smith, M. (2003), ‘Consumer surplus in the digital economy: Estimating the value of increased product variety at online booksellers’, Management Science 49(11), 1580–1596.
Brynjolfsson, E., Hu, Y. & Simester, D. (2011), ‘Goodbye pareto principle, hello long
tail: The effect of search costs on the concentration of product sales’, Management
Science 57(8), 1373–1386.
Chapple, A., Ziebland, S. & McPherson, A. (2004), ‘Qualitative study of men’s perceptions of why treatment delays occur in the uk for those with testicular cancer’, The
British Journal of General Practice 54(498), 25.
Coopersmith, J. (2000), ‘Pornography, videotape, and the internet’, IEEE Technology
and Society Magazine 19(1), 27–34.
Dahl, D., Gorn, G. & Weinberg, C. (1998), ‘The impact of embarrassment on condom
purchase behavior’, Canadian Journal of Public Health 89(6), 368–370.
39
Dahl, D., Manchanda, R. & Argo, J. (2001), ‘Embarrassment in consumer purchase:
The roles of social presence and purchase familiarity’, Journal of Consumer Research
28(3), 473–481.
Daughety, A. & Reinganum, J. (2010), ‘Public goods, social pressure, and the
choice between privacy and publicity’, American Economic Journal: Microeconomics
2(2), 191–221.
De los Santos, B. I., Hortacsu, A. & Wildenbeest, M. (2012), ‘Testing models of consumer
search using data on web browsing and purchasing behavior’, American Economic
Review Forthcoming.
DellaVigna, S., List, J. A. & Malmendier, U. (2012), ‘Testing for altruism and social
pressure in charitable giving’, Quarterly Journal of Economics 127(1), 1–56.
Edelman, B. (2009), ‘Red light states: Who buys online adult entertainment?’, Journal
of Economic Perspectives 23(1), 209–220.
Fehr, E., Kirchsteiger, G. & Riedl, A. (1993), ‘Does fairness prevent market clearing?
an experimental investigation’, Quarterly Journal of Economics 108(2), 437–459.
Forman, C., Ghose, A. & Goldfarb, A. (2009), ‘Competition between local and electronic
markets: How the benefit of buying online depends on where you live’, Management
Science 55(1), 47–57.
Gackenbach, J. (2007), Psychology and the Internet: Intrapersonal, Interpersonal, and
Transpersonal Implications, Academic Press.
Goffman, E. (1956), ‘Embarrassment and social organization’, American Journal of
Sociology 62(3), 264–271.
Goffman, E. (1959), ‘The presentation of self in everyday life’.
Goldfarb, A. & Prince, J. (2008), ‘Internet adoption and usage patterns are different:
Implications for the digital divide’, Information Economics and Policy 20(1), 2–15.
Greenstein, S. & McDevitt, R. (2011), ‘The broadband bonus: Estimating broadband
internet’s economic value’, Telecommunications Policy 35(7), 617–632.
Griffiths, M. D. (2001), ‘Internet gambling: Preliminary results of the first uk prevalence
study’, Electronic Journal of Gambling Issues .
Herman, C. & Polivy, J. (1996), ‘What does abnormal eating tell us about normal
eating?’, Food Choice, Acceptance, and Consumption pp. 207–238.
Holmes, R., Tewksbury, R. & Holmes, S. (1998), ‘Hidden jpgs: A functional alternative
to voyeurism’, The Journal of Popular Culture 32(3), 17–29.
Joinson, A. (1998), Disinhibition and the internet, in ‘Psychology and the Internet: Intrapersonal, Interpersonal, and Transpersonal Implications’, Academic Press, pp. 75–
92.
40
Keltner, D. & Buswell, B. N. (1997), ‘Embarrassment: Its distinct form and appeasement functions’, Psychological Bulletin 122, 250–270.
Kling, R., Lee, Y., Teich, A. & Frankel, M. (1999), ‘Assessing anonymous communication
on the internet: Policy deliberations’, The Information Society 15(2), 79–90.
Lee, A. & Goldman, M. (1979), ‘Effect of staring on normal and overweight students’,
The Journal of Social Psychology 108(2), 165–169.
Lerman, C., Rimer, B., Trock, B., Balshem, A. & Engstrom, P. (1990), ‘Factors
associated with repeat adherence to breast cancer screening’, Preventive Medicine
19(3), 279–290.
Meischke, H., Eisenberg, M. S., Schaeffer, S. M., Damon, S. K., Larsen, M. P. & Henwood, D. K. (1995), ‘Utilization of emergency medical services for symptoms of acute
myocardial infarction’, Heart and Lung 24, 11–18.
Niemi, R. (1976), ‘Costs of voting and nonvoting’, Public Choice 27, 115–119.
Polivy, J., Herman, C., Hackett, R. & Kuleshnyk, I. (1986), ‘The effects of self-attention
and public attention on eating in restrained and unrestrained subjects.’, Journal of
personality and social psychology 50(6), 1253.
Pozzi, A. (forthcoming), ‘Shopping cost and brand exploration in online grocery’, American Economic Journal: Microeconomics .
Rabin, M. (1993), ‘Incorporating fairness into game theory and economics’, American
Economic Review Papers and Proceedings 83(5), 1281–1302.
Ratner, R. K. & Kahn, B. E. (2002), ‘The impact of private versus public consumption
on variety-seeking behavior’, Journal of Consumer Research 29(2), 246–257.
Revelt, D. & Train, K. (1998), ‘Mixed logit with repeated choices: Households’ choices
of appliance efficiency level’, Review of Economics and Statistics 80(4), 647–657.
Rosman, K. (2012), ‘Books women read when no one can see the cover’, The Wall Street
Journal .
Roth, D., Herman, C., Polivy, J. & Pliner, P. (2001), ‘Self-presentational conflict in
social eating situations: A normative perspective’, Appetite 36(2), 165–171.
Scott Morton, F. (2006), ‘Consumer benefit from use of the internet’, Innovation Policy
and the Economy 6, 67–90.
Seim, K. & Waldfogel, J. (2012), ‘Public Monopoly and Economic Efficiency: Evidence
from the Pennsylvania Liquor Control Boards Entry Decisions’, American Economic
Review forthcoming.
Skog, O. (2000), ‘An experimental study of a change from over-the-counter to selfservice sales of alcoholic beverages in monopoly outlets’, Journal of Studies on Alcohol
61(1), 95–100.
41
Smith, L. K., Pope, C. & Botha, J. L. (2005), ‘Patients’ help-seeking experiences and
delay in cancer presentation: a qualitative synthesis’, Lancet 366(9488), 825–831.
Suler, J. (2004), ‘The online disinhibition effect’, CyberPsychology & Behavior 7(3), 321–
326.
Train, K. (1998), ‘Recreation demand models with taste differences over people’, Land
economics pp. 230–239.
Train, K. (2003), Discrete Choice Methods with Simulation, Cambridge University Press.
Waters, A., Hill, A. & Waller, G. (2001), ‘Internal and external antecedents of binge
eating episodes in a group of women with bulimia nervosa’, International Journal of
Eating Disorders 29(1), 17–22.
Zentner, A., Smith, M. & Kaya, C. (2012), ‘Bricks, clicks, blockbusters, and long tails:
How video rental patterns change as consumers move online’. Mimeo, Carnegie Mellon.
42


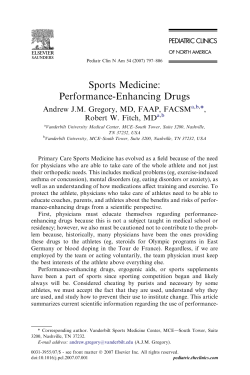
© Copyright 2026