
The Effect of Social Interaction on Economic Transactions: March 2013
The Effect of Social Interaction on Economic Transactions:
An Embarrassment of Niches?
Avi Goldfarb, Ryan C. McDevitt, Sampsa Samila, and Brian Silverman∗
March 2013
Abstract
We show that social interaction reduces the diversity of products purchased by consumers in
two retail settings. First, we consider a field experiment conducted by Sweden’s monopoly alcohol retailer and find that moving purchases from behind the counter to self-service disproportionately increases the sales of difficult-to-pronounce products. Second, we use individual-level
panel data from a pizza delivery restaurant to show that online orders have more complexity
and more calories, and measure the consequences for consumer and producer surplus. Combined, these results suggest that social frictions can substantially affect market outcomes.
JEL: D12, L81, L86
Keywords: social cues; consumer choice; retail; Internet economics; long tail
∗ Respectively at University of Toronto, University of Rochester, National University of Singapore, and University
of Toronto. We thank Heski Bar Isaac, Liran Einav, and seminar participants at the Booth School of Business, City
University of Hong Kong, Columbia GSB, Harvard Business School, McMaster University, NYU Stern, the Ross
School of Business, Singapore Management University, the University of Texas, and the University of Toronto for
helpful comments. We gratefully acknowledge financial support from SSHRC (grant #486971 and #493140).
1
Introduction
Many economic transactions are verbal and social, such as ordering drinks from a bartender, making appointments with a doctor, or buying products from a sales clerk. In
this paper, we consider whether such social interactions influence consumers and, as a
result, inhibit certain types of economic activity. Specifically, we show that consumers in
two different retail settings purchase a wider variety of goods when transactions require
less interpersonal communication, and that much of the change comes from the products most likely to be affected by social frictions. Our results contribute to a growing
literature on how emotions and social cues impact economic behavior, and provide a
new explanation for why on the Internet, where purchases do not require social interaction, sales distributions are often less concentrated than they are for bricks-and-mortar
retailers, a phenomenon commonly referred to as the “long tail.”
In our first setting, we use data from a field experiment conducted by Sweden’s
government-run alcohol monopoly retailer, Systembolaget, in which stores changed formats from behind-the-counter to self-service. From seven pairs of matched towns, each
with a single retail outlet, we show that the stores randomly converted to self-service sell
a greater variety of products (as defined by a less-concentrated sales-distribution), with
a significant fraction of this change coming from products with difficult-to-pronounce
names. As shown in Section 2, the market share of products with difficult-to-pronounce
names increases 6% in stores that switch to self-service.
And because difficult-to-
pronounce products are relatively less popular, an increase in their market share leads
to a decline in the stores’ overall concentration of sales.
In our second setting, we use individual-level panel data from a pizza delivery restaurant that introduced a Web-based ordering system to supplement its phone and counter
service. Comparing sales from before and after the advent of online ordering, we document a considerable change in consumers’ purchases. As shown in Section 3, the average
item in an online order is 14% more complex and has 3% more calories; the different
1
choices made by online consumers also reduce the store’s sales concentration, as orders
with more calories and complexity are more likely to include less-popular items. Importantly, we can exploit several institutional details to conclude that the non-social nature
of online transactions drives these differences, which ultimately have a substantial effect
on both consumer and producer surplus. From a structural demand model, we estimate
that reducing social interaction through online ordering has increased consumer surplus
by 5.4%, an estimate larger than that of Brynjolfsson et al. (2003) for the benefits of
online booksellers’ greater selection of products. Moreover, we estimate that producer
surplus has increased 3.5% due to non-verbal online orders.
Combined, these findings suggest that interpersonal exchange affects both the type
and the diversity of products purchased by consumers. In the case of alcohol sales,
consumers may fear appearing unsophisticated if they mispronounce a name when ordering from a sales clerk; once a store introduces a self-service format and eliminates
the need to pronounce a name, consumers may become more comfortable pursuing an
otherwise mildly embarrassing or frustrating transaction. In the case of pizza orders,
consumers may prefer to avoid social judgment of their food choices — an order with peculiar instructions or excessive calories may elicit negative judgment from others. When
consumers remove a layer of social interaction by ordering through the website, their
tendency to make complicated or high-calorie orders increases. Given these institutional
details, both settings help us isolate the effect of social interactions on market outcomes
while allowing us to rule out several alternative explanations for our results.
First, the products and prices remain fixed for each of our settings, reducing concerns
that concurrent institutional changes cloud our results. Because greater product variety
can result mechanically in a less-concentrated sales distribution, markets commonly
associated with the long tail where retailers offer a wider selection of products, such as
online books or videos, would not provide a suitable setting for our analysis (Brynjolfsson
et al. 2003). Similarly, online retailers may differ from bricks-and-mortar stores beyond
just the extent of social interaction. The panel nature of both settings — and the field
2
experiment used in the alcohol setting — reduce the concern that these other factors
confound our findings.
Second, the straightforward menus and webpage in our settings, as well as the nature
of the products themselves, allow us to provide evidence that search and learning do
not drive our results. For example, in the alcohol setting, the increase in sales comes
from difficult-to-pronounce products in particular, rather than from the broader set of
historically unpopular products. In the pizza setting, the website does not have sophisticated search tools that Brynjolfsson et al. (2011) argue will confound a comparison of
bricks-and-mortar retailers with online stores that facilitate searching for customers. Relatedly, robustness checks that control for the amount of product information available
to consumers yield consistent findings.
Third, similar settings have been considered extensively in the economics and management literatures to study sales distributions (Pozzi forthcoming, Brynjolfsson et al.
2003), search costs (De los Santos et al. 2012), and economic efficiency (Seim & Waldfogel 2012). Thus, our settings are firmly in the mainstream and complement previous
studies by explicitly examining the impact of social frictions on market outcomes.
Fourth, while not from an experiment, the pizza data allow us to control for individuallevel tendencies and selection into the online channel because the transaction history
includes customers who purchased from the store both before and after online ordering
became available, reducing concerns over selection bias. Combined with information on
profit margins, the pizza data also permit us to estimate the changes in consumer and
producer surplus attributable to online ordering.
Furthermore, the pizza data allow us to consider an important alternative explanation for our results: that consumers may wish to avoid misunderstandings while ordering.
Although we cannot reject this explanation in the alcohol setting, in the pizza setting
we show that customers who made more complex or error-ridden orders before online
ordering was available are not more likely to make subsequent orders online. Moreover,
instructions that are trivial to make on both channels but associated with more calories
3
and complexity, such as ordering double toppings, appear more often in online orders.
For these reasons, we argue that concerns over mistakes in complicated orders do not
primarily explain the markedly different choices consumers make online.
The notion that individuals avoid potentially uncomfortable social interactions has
received considerable attention in sociology, psychology, medicine, and political science.
The foundation for these ideas dates (at least) back to Goffman’s claim that social
interactions are performances in which individuals act to project a desired image of
themselves, and embarrassment occurs when this projection is disrupted (Goffman 1956,
1959). Embarrassment is therefore a social phenomenon.1
In their review article on the psychology of embarrassment, Keltner & Buswell (1997)
discuss how a fear of embarrassment harms individuals as they take self-destructive steps
to avoid it. For instance, a fear of embarrassment leads patients to delay seeking medical help for chest pain (Meischke et al. 1995), as well as for more sensitive conditions
such as urological and breast cancers (Chapple et al. 2004, Lerman et al. 1990, McDevitt & Roberts 2011). Others have shown that embarrassment can affect voting choices
(Niemi 1976), alter food consumption (Lee & Goldman 1979, Polivy et al. 1986, Banaji
& Prentice 1994, Roth et al. 2001, Allen-O’Donnell et al. 2011), and stifle contraceptive
purchases (Dahl et al. 1998). Within this vein, removing even one layer of social interaction by using electronic questionnaires rather than in-person interviews at doctors
offices significantly increases patients’ willingness to report incidents of domestic abuse
(Ahmad et al. 2009).
Given the changes we document in consumers’ choices and the prior work in social
psychology referenced above that would predict such a result, we interpret the social
transaction costs in our settings as relating to embarrassment. At the same time, we
cannot isolate embarrassment from other plausible social frictions, such as impatience
or frustration, due to the nature of our data. Even without pinning down the precise
1 This literature emphasizes that embarrassment differs from humiliation and shame. Humiliation relates to a
change in an individual’s sense of dignity (Lindner 2001), whereas shame relates to a person’s core self-image and
can be experienced in social isolation. In contrast, embarrassment can only be experienced in the presence of others
(Klass 1990).
4
source of social discomfort, however, the broader implications of our work remain largely
the same and nevertheless represent a novel contribution to the literature.
Within economics, our paper contributes to the growing literature regarding the
impact of both emotions and social cues on behavior. While no work has addressed
embarrassment directly, recent studies have shown that anger following a loss by the
local football team leads to increased violence (Card & Dahl 2011), that emotions affect
time preferences (Ifcher & Zarghamee 2011), and that guilt impacts family resource
allocations and money transfers (Li et al. 2010). Other research has shown that social
cues, even if unrelated to embarrassment, may also influence individuals’ choices. For
instance, Akerlof & Kranton (2000) and Akerlof & Kranton (2008) show that social
identity affects how individuals behave; Ariely & Levav (2000) find that social norms
change variety-seeking behavior; and Rabin (1993) and Fehr et al. (1993) document
that perceptions of fairness influence actions both in theory and in practice. Similarly,
DellaVigna et al. (2012) show that “social pressure costs” reduce donors’ welfare in
door-to-door fundraising and impact charitable giving.
Also closely related to our framework is the model of privacy in Daughety & Reinganum (2010), where they derive a demand for privacy within a model in which agents
receive utility from other agents’ perceptions of their type; when actions are public,
“social pressure” influences individuals’ choices. In some sense, our analysis examines
the basic assumption of this model: whether social pressure does indeed affect choices.
Related to its implications for privacy, our paper contributes to the Internet economics literature by explicitly examining the effect of social interaction on market outcomes. The perceived anonymity of digital technology (perhaps best captured in a 1993
New Yorker cartoon showing a dog sitting at a computer saying, “On the Internet,
nobody knows you’re a dog”) has been credited with an increase in the distribution
of pornography (Edelman 2009) and with the recent bestseller status of erotica novels
such as Fifty Shades of Grey (Rosman 2012). To this point, Griffiths (2001) asserts that
Internet pornography is popular because “it overcomes the embarrassment of going into
5
shops to buy pornography over the shop counter,” a phenomenon Coopersmith (2000)
labels a “social transaction cost.”
We explore the idea that social frictions may even affect settings with a comparatively
mild potential for embarrassment. As such, our findings provide a new explanation for
a commonly discussed Internet phenomenon — that niche products comprise a comparatively large share of total sales online, dubbed the “long tail” in Anderson (2004) —
by showing that a reduction in social interaction leads to a less-concentrated sales distribution. The current literature emphasizes the roles of inventory capacity and search
technologies (Brynjolfsson et al. 2003, Scott Morton 2006, Pozzi forthcoming), but does
not discuss how the impersonal nature of online transactions could affect sales patterns.
While a lengthy social psychology literature has studied how a lack of personal interaction affects online behavior (Gackenbach 2007), labeling it the “online disinhibition
effect” (Suler 2004), no work (to our knowledge) has examined its implications for market outcomes. As the perception of anonymity is a distinguishing feature of many online
transactions, our paper emphasizes a key aspect of Internet commerce not previously
considered by the economics literature.
The purpose of our paper is therefore to formalize and measure the impact of social
frictions on market outcomes across two common retail settings. We proceed by first
detailing the results from a field experiment that moved alcohol purchases from behind
the counter to self-service, providing evidence that difficult-to-pronounce products experienced a disproportionately large increase in sales. We then document a change in
sales patterns at a pizza delivery restaurant after the introduction of online ordering,
providing evidence of a rise in unusual orders; from this change, we also estimate the
impact on consumer and producer surplus. We conclude by summarizing our results,
discussing their limitations, and speculating about their broader implications.
6
2
Systembolaget’s Sales Format Experiment
2.1
Data and Setting
In our first setting, we examine a field experiment conducted in the early 1990s by
Systembolaget, Sweden’s government-run alcohol retail monopoly.2 For Sweden’s 1990
population of 8.5 million, Systembolaget operated approximately 400 stores across the
country. Outside of these stores, Swedish law prohibits the sale of wine, distilled spirits, and strong beer (above 3.5% ABV). Systembolaget’s directive stipulates that the
organization’s sole purpose is to minimize alcohol-related problems by selling alcohol in
a responsible way. As such, it prohibits profit maximization from being an aim of the
organization and dictates that no brands or suppliers be given preferential treatment.
Prior to 1989, all transactions at Systembolaget’s stores occurred behind the counter,
whereby customers approached the counter and ordered from a clerk who then retrieved
items from a storeroom. In 1989, Systembolaget began to explore the impact of adopting
a self-service format. To identify the likely effects of self-service and reduce the chances
of simply cannibalizing sales across stores, Systembolaget chose 14 relatively isolated
towns, each with a single Systembolaget store, to participate in a field experiment.3
According to Skog (2000), Systembolaget used the 1984 to 1989 period to match towns
into seven pairs “in such a way as to make the members of each pair as similar as possible
in terms of population size, economic bases and sales of alcoholic beverages; the latter
both in terms of volume per capita and pattern of variation over time.” Systembolaget
also chose pairs sufficiently far apart to prevent spillover effects and randomly selected
the store converted to self-service within each pair. Table 1 lists the pairs of stores and
their characteristics.
Several institutional details make Systembolaget’s experimental design an appealing
empirical setting for our analysis. First, prices and product offerings did not change
2 Much
of this description comes from Skog’s (2000) assessment of the experiment’s impact on alcohol consumption.
the experiment was restricted to one-store towns, Stockholm and the other major cities in Sweden are
not in the data.
3 Because
7
Table 1: Summary statistics for Systembolaget stores in the field experiment as of Jan. 1991.
Town
Filipstad
Nybro
Koping
Saffle
Vanersborg
Lidkoping
Motala
Falun
Karlshamn
Lerum
Ludvika
Vetlanda
Mariestad
Varnamo
Treatment or Control
Treatment
Control
Treatment
Control
Treatment
Control
Treatment
Control
Treatment
Control
Treatment
Control
Treatment
Control
Date of Change
June 1991
None
July 1991
None
Nov. 1991
None
May 1992
None
Sept. 1993
None
Sept. 1994
None
Jan. 1995
None
Town Population
13296
20997
26345
17960
36734
36097
42223
54364
31407
33548
29144
28170
24847
31314
Sales (Units)
58413
53542
97701
46807
99028
84143
92758
123305
82538
88043
78178
65646
92972
88514
Herfindahl
0.0296
0.0184
0.0215
0.0207
0.0144
0.0163
0.0155
0.0094
0.0145
0.0167
0.0237
0.0192
0.0140
0.0141
Revenue (Kr. mil.)
234.7
281.0
418.0
223.2
449.0
374.4
441.3
614.2
425.8
345.5
371.6
307.0
427.6
424.1
in the converted stores relative to the control stores during the experiment — only the
format of the stores changed. As a result, endogenous changes in prices and product offerings will not confound any observed changes in sales patterns. Second, Systembolaget
is a monopoly seller of alcohol (above 3.5% ABV) within Sweden, and therefore competitors’ responses to the format change are unlikely to be relevant outside of the weak beer
and non-alcoholic drink segments. Third, according to the 2007 annual report, prices
are based on a fixed (legislated) per-unit markup. Fourth and finally, Sweden prohibits
advertising and promotions for alcohol above 2.25% ABV (though foreign magazines
sold in Sweden may carry alcohol advertisements).
Systembolaget lists each item for sale at its stores in a menu. Every store provides
the same menu (though they may stock different items), with Figure 1 showing a sample
page from a 1996 menu. The menu lists product names (sorted by category and price)
and prices, and is especially important at stores with behind-the-counter service because
customers cannot simply pick up a bottle from the shelf before purchasing it. At behindthe-counter stores, shown in Figure 2, customers approach the counter and order verbally
(with the option of pointing to an item on the menu); the staff then retreat to the back of
the store to retrieve the items. At self-service stores, shown in Figure 3, customers make
their selections from the shelves where items are arranged by category and price, with
each item given shelf space roughly in line with its popularity (recall that Systembolaget
8
is brand-neutral by its directive); customers then bring their selections to the cash
register for purchase. Thus, the key changes in the experiment are that (i) customers
may browse the aisles of products on display and (ii) customers need not ask a clerk for
a product. For these reasons, if social frictions do impact consumers, then the format
change should disproportionately affect difficult-to-pronounce products, rather than the
broader set of products with historically lower sales for which browsing shelves may
represent a type of learning or search process by consumers.
Our data contain monthly sales and prices for each product at the 14 stores in the
experiment from January 1988 to December 1996, with products divided into seven
categories: vodka, other spirits, wine, fortified wine, Swedish beer, imported beer, and
non-alcoholic drinks.4 Category-by-category results are shown in the appendix.
We examine the data at the store-category-month level. We first show how a store’s
format affects the variety and quantity of products purchased by consumers, with variety
measured using a Herfindahl index of the sales concentration for each category in each
store; this is the sum of the squared market shares of the products (stock-keeping units)
in each store-category-month. Table 2 provides descriptive statistics.
We next show the differential sales patterns for difficult-to-pronounce products, which
we classify using three distinct measures. First, we identify whether the menu provides
a pronunciation guide for the product. As shown in Figure 1, several product listings are
accompanied by a phonetic spelling of the product’s name. We interpret the presence
of these guides as indicating that a name is difficult to pronounce and use this as our
primary measure. Notably, the inclusion of a pronunciation guide varies across products’
countries of origin, with just 4% of Swedish products given guides compared to 78% of
French products.5 In our regressions, we will control for such regional variation. Second,
we use the number of characters in the product’s name. Third, we use the assessments
of three native Swedish speakers hired to evaluate the difficulty of pronouncing each
4 We
also have data on product availability and popularity from January 1984 to December 1987.
total, France represents 35% of difficult-to-pronounce products and we therefore show below that the results
are not driven by a change in sales of French products overall.
5 In
9
.r
Sherry och Montilla
Sherry och Montilla
Halvtorr
Torr
8203 Dofta Alicia
Manzanilla Pasada
375 ml
39:-
(dd'nja ali'sia)
Antonio Barbadillo
Medelfyllig, ganska smakrik med
typisk, rätt mogen karaktär.
750 ml *82:375 ml *46:-
8277 Amontillado
Superior
(amtintilja'dd
soperid'r)
Mild, ren amontilladostil med
fräschör. Ganska smakrik.
8231 Real Tesoro
73:750ml
39:375ml
Marqu~del
Real Tesoro
Medelf}'lligmed kraftig,_nötigsmak '
och lite bränd ton. Olorosotyp. ,
8232 Real Tesoro
750 ml
74:RoyalCream
Marqu~ del Real Tesoro
Nötig sherrysmak med russinton och
balanserad friskhet.
750 ml *75:375 ml *41:Medelfyllig med fin sherrykaraktär
och nötig, balanserad smak.
8214 Burdon Rich Cream 750 ml
75:J.Burdon
Fyllig, frisk, eldig smak med inslag ay
russin och nötter. Smakrik med lång
eftersmak.
8275 Amontillado
(am'dntilja'då)
750 ml *76:375 ml *45:Ganska smakrik sherry med lätt,
bränd ton och inslag av torkad frukt.
8282 Oloroso S.A.R
94:- 8215 Ballen Ory Oloroso 750 ml
Osborne
Medelfyllig, balanserad smak av
nötter med viss eldiAAetoch liten
sälta. Ung eftersmak
8216 Leyenda Oloroso
750 ml
95:MGilLu~ue
Fyllig, eldig, komplex smak med
inslag av choklad och nötter, lång
eftersmak.
8201 La Guita Manzanilla 750 ml
Söt
99:-
aa gi'ta)
Rainera Perez Marin
Utt, frisk smak med nötig ton.
Smakrik med lång eftersmak.
8207 La Ina
750 ml 101:Oomecq
375 ml
51:Mild, mogen och balanserad
finokaraktär.
8225 Tio Pepe
750 ml 107:GonzaIez Byass
375 ml
55:Smakrik, intensiv fino med lång
eftersmak och viss elegans.
8218 Palo Cortado
750 ml 122:Bodegas Medina E Hijos
Medelfyllig, torr, nötig och smakrik
sherry med viss sälta och en rostad
ton. Ung eftersmak.
8213 Lustau Almacenista 750 ml 182:Oloroso ,
Emilio Lustau
Fyllig, eldig, mycket smakrik sherry
med inslag av nötter och lång
intensiv eftersmak.
, ~
8211 Gonzalez Byass
750 ml 594:Finest Ory Oloroso
1966
GonzaIez Byass
Torr, eldig, mycket intensiv, syrlig
smak med kraftig fatkaraktär och
inslag av choklad och nötter.
(ålårtl'så)
8226 Bristol
MediumDry
750 ml
81:-
(bri'stel mi'djem dra])
Harvey &: Sons
750 ml *75:375 ml *45:Fyllig med fin fruktighet och god
nötighet. Smakrik.
8291 Royal Cream
(rd'jal krim)
8208 Pedro Ximenez Rare 750 ml
OldSweetPX
(pe'drå schimä'näs)
81:822"1Osborne Amontillado 750 ~
Osborne
Något bränd, nOtigsmak med inslag
av fat, russin och fikon. Läng
eftersmak.
8276 Leyenda Amontillado 750 ml
95:MGilLu~ue
Medelfyllig smak med bränd ton och
karaktär av fat och nötter.
'
(d~~{l!:
W··
&: Humbert
750 ml
375 ml
97:49:-
Bra olorosotyp med nötkaraktär, viss
friskhet och-elegans.
,
Halvsöt
8228 Bristol Cream
(bri'stel krim)
87:750 ml
375 ml
46:Gonzalez Byass
Smakrik med fin nötarom och aning
bränd. Olorosotyp.
(na'ti stlle'ra)
750 ml
375 ml
92:,48:-
Harvey &: Sons
Fyllig, lite simmig.smak med ton av
nötter och russin.
8212 Vendimia Cream
750 ml 134:Sherry
Emilio Lustau
Fyllig, simmig, eldig, komplex smak
med bränd ton och inslag av nötter,
russin och nougat.
'
Montilla
, 2789 Montilla
(månti'lja
8294 Alhambra
750 ml *79:-'
. Smakrik med nötig, balanserad
olorosostil.
8223 Nutty Solera
*90:-
Williams &: Humbert
Något bränd sherrysmak med inslag
av russin och choklad. Smakrik med
lång eftersmak.
Smakiik med fin, balanserad
nötkaraktär.
8209 Dry Sack
,
Dry
750 tpl
*61:-
draj)
Spanien, Montilla-Moriles
.
Fyllig, eldig och smakrik med viss
sherrykaraktär. Torr.
8465 Gran Barquero
Pedro Ximenez
.
wan
700 ml 101:-
barkä'rå)
Spanien, Montilla-Moriles
Barquero
Simmigt, smakrikt, mycket sött vin
med bränd ton och inSlag av russin
och torkad frukt. Läng smak.
Figure 1: Sample page from Systembolaget’s 1996 menu.
* Pant 2 kr ingår i priset.
10
57
Figure 2: Picture of a typical behind-the-counter Systembolaget store.
Figure 3: Picture of a typical self-service Systembolaget store.
product listed in the January 1991 menu.6
2.2
Store Format and the Concentration of Sales
To estimate the impact of a store’s format on the level and concentration of its sales, we
use a straightforward difference-in-difference identification strategy. For store s, product
category c, and month t, our estimating equation is:
Outcomessct = βT reatmentGroupssc ∗ Af terT reatmentssct + µsc + τt + εsct ,
(1)
where outcomes are either a Herfindahl index or sales volume in this subsection, and
the fraction of sales within a store-category-month that are difficult to pronounce in the
next subsection. Given this specification, we control for store-category fixed effects, µsc ,
and month fixed effects, τt ; as such, all differences across stores at the category level
and all systematic changes over time are controlled for in the regression. The coefficient
6 Details
of this exercise appear in the appendix.
11
Table 2: Descriptive statistics for Systembolaget stores.
Mean
Std. Dev.
Min.
Max.
N
Unit of Obs.: Store-Category-Month
Herfindahl
Units Sold
Liters Sold
Swedish Products
French Products
0.0900
12439
6246
0.3819
0.0596
0.0778
15423
7092
0.3873
0.0739
0.0088
15
3
0
0
0.8059
159917
63220
1
0.4348
10570
10570
10570
10570
10570
Market Share Difficult-to-Pronounce
Guide (by Units)
Guide (by Volume)
Over 30 Characters (by Units)
Over 30 Characters (by Volume)
Coder Rates Below Top (by Units)
Coder Rates Below top (by Volume)
0.2162
0.2347
0.0099
0.0101
0.4217
0.4626
0.2348
0.2420
0.0193
0.0194
0.2872
0.3124
0
0
0
0
0
0
0.7737
0.8193
0.1255
0.1254
1
1
10570
10570
10570
10570
10570
10570
Unit of Obs.: Product
Pronunciation Guide
Word Length
Mean Coder Score
Coder 1 Score
Coder 2 Score
Coder 3 Score
Vodka
Other Spirits
Wine
Fortified Wine
Swedish Beer
Imported Beer
Non-Alcoholic Drinks
0.5428
17.820
8.3923
8.1594
8.7813
7.9300
0.0730
0.2467
0.4608
0.0766
0.0844
0.0308
0.0277
0.4983
8.5537
0.7953
0.6612
0.5341
1.8721
0.2602
0.4312
0.4986
0.2660
0.2781
0.1727
0.1642
0
3
5.33
6
4
1
0
0
0
0
0
0
0
1
70
9
9
9
9
1
1
1
1
1
1
1
1658
1658
1625
1631
1628
1628
1658
1658
1658
1658
1658
1658
1658
Unit of Obs.: Store-Product-Month
Units Sold
Behind-the-Counter Format
Price (Krona)
129.35
0.2219
90.011
485.17
0.4156
80.467
−203a
0
3
29836
1
2325
1016428
1016428
1016428
Only includes products in the 1991 guide (and therefore coded for pronunciation difficulty).
a Sales can be negative if returns for a product at a store in a month exceed sales. Negative sales
represent less than one tenth of one percent of the observations. These observations will be
dropped from most of the analysis because we use a measure of logged sales.
β will therefore capture how sales in the treatment group of stores change after they
convert to self-service compared to the control group of behind-the-counter stores over
the same period.
Because our data come from a randomized field experiment, we have fewer concerns
about endogeneity and omitted variables that typically arise in difference-in-differences
12
studies — the differences between the treatment and control groups should be random.
Nevertheless, we also verify that the change in sales is coincident with the format change.
Because we observe each store multiple times and because the matched treatment-control
pairs of stores might have correlated sales in each category, we cluster the standard errors by store-pair-category to reduce the potential for overstating statistical significance
(Bertrand et al. 2004).7
Table 3 shows the results of the regressions described in Equation (1) for both the
more-limited sample of products appearing in the 1991 guide that has a pronunciation
key, as well as for the full sample of products across all guides. Columns (1) and (3)
show that the sales concentration, as measured by a Herfindahl index, falls substantially
after a store changes to self-service: the estimated marginal effect is 0.0154 relative to
an average of 0.0900. Columns (2) and (4) show that sales, measured in units, increase
by approximately 20%.
Table 3: Treated stores sell more volume and more variety after the change.
Only Products in 1991 Guide
Self-Serve Stores After Change
N
Number of Groups
R2
All Products
(1)
Herfindahl
-0.0154***
(0.0041)
(2)
Log Sales in Units
0.1964***
(0.0246)
(3)
Herfindahl
-0.0158***
(0.0037)
(4)
Log Sales in Units
0.2283***
(0.0279)
10570
98
0.08
10570
98
0.44
10570
98
0.22
10570
98
0.39
Regressions include category-store fixed effects (differenced out) and 107 monthly fixed effects.
Unit of observation is the store-category-month.
Robust standard errors clustered by store-pair-category in parentheses.
* significant at 10%; ** significant at 5%; *** significant at 1%.
Figure 4 repeats the analysis in Column (1) at a finer level of detail. Rather than one
discrete variable identifying when a store changes format, we substitute the Self-Serve
Stores After Change variable with a sequence of dummy variables for the quarters before
and after the format change. We find that, prior to the format change, stores in the
treatment group (i.e., those that change format) exhibit no trend towards a decreased
7 Results
are robust to clustering by store. We cluster by store-pair-category because of the potential for correlated
sales of similar products across the similar treatment and control stores.
13
Figure 4: Coefficients of regression of Herfindahl on being in the treatment group over time
Specification resembles Column (1) of Table 3. Coefficients provided in the appendix.
sales concentration; the timing of the change in the estimated coefficient is coincident
with the timing of the format change.
2.3
Store Format and Difficult-to-Pronounce Products
To assess how the format change affects the sales of difficult-to-pronounce products, we
reestimate Equation (1) using the fraction of products sold in each store-category-month
that are difficult to pronounce as the dependent variable, while adding controls for the
Herfindahl index and the log of total quantity sold for that store-category-month. We
use three different measures for difficult-to-pronounce products: (i) whether the menu
provided by Systembolaget includes a phonetic pronunciation guide for the product, (ii)
whether the product’s name has over 30 characters, and (iii) whether any of the coders
14
rated the product less than a “9” for ease-of-pronunciation.8
Table 4 presents the results from nine specifications that regress difficult-to-pronounce
product sales on an indicator variable equal to one after a store converts to a selfservice format, among other controls. As a baseline, Column (1) regresses the fraction
of difficult-to-pronounce product sales on the treatment dummy. Column (2) adds controls for the Herfindahl index and the log of total quantity sold, while Column (3)
controls for the percentage of sales that are of domestic (Swedish) products, as labeled
in the menu; Column (4) weights the fraction of difficult-to-pronounce product sales by
volume rather than units sold. The remaining columns show robustness to alternative
definitions of difficult-to-pronounce names and to alternative sample restrictions. Collectively, all specifications demonstrate that the share of difficult-to-pronounce products
rises substantially when stores switch formats from behind-the-counter to self-service.
A back-of-the-envelope calculation based on Column (2) suggests that the share of
difficult-to-pronounce products increases by 7%.
To understand how increasing the market share of difficult-to-pronounce products
leads to a less-concentrated sales distribution, note that difficult-to-pronounce products
are comparatively less popular in general. Moreover, as shown in Table 5, most of the
sales increase for difficult-to-pronounce products comes from the least popular among
this group. To see this, consider Columns (1) and (2) that compare products in the
top quartile of sales for the four years prior to our data with those not in the top
quartile. In this comparison, only the difficult-to-pronounce products not in the top
quartile experienced a meaningful increase in sales. Furthermore, Columns (3) and (4)
compare products that were and were not in the top quartile of sales at a given store
in a given month. Here, the magnitude of the coefficients shows that, once again, the
relatively unpopular difficult-to-pronounce products experience the largest increase in
sales. Thus, Table 5 suggests that the decrease in sales concentration is partially driven
8 Qualitative results are robust to various perturbations of the definitions of difficult-to-pronounce product, particularly using the hand-coded pronunciation measure. We show three representative examples here and, as discussed
earlier, prefer using the pronunciation guide because the threshold is determined by a third party, independent of
our study.
15
16
* significant at 10%; ** significant at 5%; *** significant at 1%.
Dependent variable is percent sales that are difficult to pronounce. Percentage defined by units sold except in column (4).
Regressions include category-store fixed effects (differenced out) and 107 monthly fixed effects.
Uses all products observed in the 1991 data. Robust standard errors clustered by category-store pair in parentheses.
10570
98
0.35
10570
98
0.36
10570
98
0.07
N
Number of Groups
R2
-0.0337**
(0.0132)
-0.8235***
(0.0499)
-0.0074
(0.0285)
-0.0345**
(0.0137)
-0.8248***
(0.0514)
Guidance on
Menu
(2)
(3)
% Difficult-to-Pronounce % Difficult-to-Pronounce
0.0161**
0.0160*
(0.0081)
(0.0081)
Fraction Domestic
Log Sales
Herfindahl
Self-Serve Stores After Change
(1)
% Difficult-to-Pronounce
0.0220***
(0.0065)
10570
98
0.25
-0.0292**
(0.0136)
-0.5903***
(0.0590)
(4)
% Difficult-to-Pronounce
0.0167***
(0.0062)
10570
98
0.12
0.0023***
(0.0007)
-0.0060**
(0.0023)
Word Length
Over 30
(5)
% Difficult-to-Pronounce
0.0014*
(0.0008)
10570
98
0.49
-0.1237***
(0.0155)
-1.1094***
(0.0981)
Any Coders
Below Top
(6)
% Difficult-to-Pronounce
0.0283**
(0.0119)
7564
84
0.11
-0.0012
(0.0016)
-0.0568**
(0.0226)
10570
98
0.30
-0.1138***
(0.0214)
-0.3301***
(0.0870)
7549
84
0.13
-0.0024
(0.0015)
-0.0933**
(0.0400)
Guidance on Menu & Products Restricted to:
French Names
Short Names
Short French Names
(7)
(8)
(9)
% Difficult-to-Pronounce % Difficult-to-Pronounce % Difficult-to-Pronounce
0.0066**
0.0341***
0.0062**
(0.0028)
(0.0096)
(0.0030)
Table 4: Difficult-to-pronounce products have a disproportionately large sales increase.
by the disproportionate increase in sales of difficult-to-pronounce products.
Table 5: Treated stores sell more relatively unpopular difficult-to-pronounce products after the
change.
Products from 1984-87
Top Quartile
Not Top Quartile
Products from All Years
Top Quartile
Not Top Quartile
(1)
% Difficult-to-Pronounce
0.0047
(0.0041)
(2)
% Difficult-to-Pronounce
0.0125**
(0.0058)
(3)
% Difficult-to-Pronounce
0.0114*
(0.0062)
(4)
% Difficult-to-Pronounce
0.0423**
(0.0193)
Herfindahl
-0.2852***
(0.0588)
-0.2785***
(0.0819)
-0.1506***
(0.0439)
-0.2944***
(0.0859)
Log Sales
-0.0120**
(0.0049)
0.0070
(0.0103)
-0.0411***
(0.0152)
0.0471**
(0.0190)
N
Number of Groups
R2
9052
84
0.24
10570
98
0.19
9534
98
0.14
10570
98
0.07
Self-Serve Stores After Change
Dependent variable is percent sales that are difficult to pronounce defined by guidance on the menu.
Regressions include category-store fixed effects (differenced out) and 107 monthly fixed effects.
Unit of observation is the store-category-month.
Robust standard errors clustered by category-store pair in parentheses.
* significant at 10%; ** significant at 5%; *** significant at 1%.
2.4
Alternative Explanations Unrelated to Social Frictions
The results presented above could be explained by factors other than social transaction
costs. For example, the assignment of stores in the experiment may not have been
independent of an increasing sales trend for difficult-to-pronounce products, which would
then bias our results. To address this concern, we verify that the sales of difficult-topronounce products did not rise in the treatment stores relative to the control stores
prior to the format change. In particular, Figure 5 shows the estimated coefficient
of a regression of the fraction of sales that are difficult to pronounce on being in the
treatment group, quarter by quarter. The results show a sharp increase in the share of
difficult-to-pronounce products after the format change.
17
Figure 5: Coefficient of regression of fraction difficult-to-pronounce on being in treatment group
over time. Specification resembles Column (1) of Table 4. Coefficients provided in App. Table 4.
More broadly, some other unobserved factor that is correlated with pronunciation
difficulty may drive sales in the self-service format relative to behind-the-counter. For
example, consumers may be unfamiliar with foreign products, and therefore a lack of
familiarity, rather than any difficulty with pronouncing their names, causes the sales
of difficult-to-pronounce products to increase as consumers become aware of obscure
products while browsing the store’s shelves. Although controlling for the Herfindahl
index partly addresses this concern about the underlying popularity of products influencing sales, it does not address the interaction between familiarity and foreignness. To
do so, we consider alternative specifications in columns (4), (7), (8), and (9) of Table
4. Column (4) shows that difficulty-of-pronunciation still has a significant effect when
controlling for the proportion of domestic products sold (though this may understate
18
the overall effect because domestic products are less likely to be difficult to pronounce).
Furthermore, Column (7) shows robustness to a sample restricted to products from
France, the country with the largest number of difficult-to-pronounce products.
A related concern is that the results might be explained by difficult-to-pronounce
products being difficult to remember. While we cannot definitively rule out this possibility in the absence of an explicit memory test, our results are nevertheless robust to
considering only products with shorter names, which may be easier to recall from memory (Baddeley et al. 1975). In particular, Column (8) shows robustness to restricting
the sample to products with 20 or fewer characters and column (9) shows robustness to
restricting the sample to French products with 20 or fewer characters.9
Another possible explanation is that consumers do not order difficult-to-pronounce
products verbally because they do not want to be misunderstood by the sales clerk.
While we cannot definitively reject this possibility, we still interpret it as a type of
social transaction cost, albeit one unrelated to embarrassment. In other words, it is still
the social nature of the interaction that influences behavior, whether out of frustration,
impatience, or embarrassment.
Finally, we may overstate the magnitude of the effect if consumers who plan to
buy difficult-to-pronounce items choose to go to the self-service stores specifically to
avoid ordering from a sales clerk. We believe this is an unlikely explanation because
Systembolaget is a monopoly retailer that deliberately selected geographically isolated
stores to address this issue.
Overall, we interpret the results presented in this section as evidence that personal
interactions have a meaningful impact on the sales of particular types of products: consumers are less likely to buy a product when they want to avoid a difficult pronunciation
(or at least the need to point to it on a menu). We argue that this social transaction
9 Furthermore, the sales of very large bottles (1.5L or greater) experience a disproportionately large increase at
self-service stores, even after controlling for difficult-to-pronounce and French products. A social friction similar to
the one inhibiting orders with excessive calories in the pizza section below may explain this result (i.e., consumers
are reluctant to purchase excessive amounts of alcohol when ordering directly from a sales clerk), which is robust to
alternative explanations such as search or recall.
19
cost is likely related to the potential for embarrassment, but we cannot rule out the
possibility that it is explained by a consumer’s desire to avoid misunderstandings and
the frustration that comes with them. Furthermore, the store-level data make it difficult
to estimate the effect of these social frictions on welfare given consumers’ heterogeneous
tastes. As such, we turn next to an alternative setting where we document a similar
result, and also calculate its impact on welfare.
3
Online Ordering at a Pizza Delivery Restaurant
3.1
Data and Setting
To continue examining how social interaction affects consumers, this section uses data
from a franchised pizza delivery restaurant operating in a mid-size metropolitan area.10
The franchise is similar to prominent chains such as Domino’s and Papa John’s, but
has a narrower regional presence. The store’s menu is standard, offering pizza with
traditional toppings, breadsticks, baked subs, wings, and salads. The store also sells
beverages, but its distribution agreement prohibits the sharing of any beverage sales
data and we therefore exclude beverages from our analysis.
The store’s customers can place their orders over the phone, at the counter, or, since
January 2009, through the franchise’s website, shown in an anonymous format in Figure
6. By our own (admittedly casual) comparison of the store’s website to larger national
chains’, it is less sophisticated and offers only basic functionality; it has no search
capabilities, no consumer ratings, no recommendations, no online-specific promotions,
and no saved order list. The store’s rudimentary website is a virtue for identification
because it closely resembles the layout of physical menus distributed to customers by
the store, suggesting that consumers are unlikely to alter their behavior based on any
particular feature of the website.
10 Due to a confidentiality agreement required to access the data, many specific details related to both the franchise
and store are omitted.
20
KWWSVKXQJU\KRZLHVKXQJHUUXVKFRPRUGBVSHFLDOVDVS[
,ŽŵĞ KƌĚĞƌKŶůŝŶĞ
DLJĐĐŽƵŶƚͮ ^ŝŐŶKƵƚ
ƵƐƚŽŵŝnjĞzŽƵƌΨϱ͘ϵϵ^ŵĂůůϭƚŽƉKE>/E
ффďĂĐŬƚŽŵĞŶƵ
KZZ^hDDZz
hƐĞ>ĂƐƚKƌĚĞƌ͍ůŝĐŬ,ĞƌĞ
ƵƐƚŽŵŝnjĞzŽƵƌŚĞĞƐĞWŝnjnjĂ
ĞƐĐƌŝƉƚŝŽŶ
ƌĞĂƚĞLJŽƵƌŽǁŶƉŝnjnjĂ͊^ƚĂƌƚǁŝƚŚĐŚĞĞƐĞĂŶĚĂĚĚƚŚĞƚŽƉƉŝŶŐƐŽĨLJŽƵƌĐŚŽŝĐĞ͊
KƌĚĞƌĞƚĂŝůƐ͗
EŽ/ƚĞŵƐĞůĞĐƚĞĚ
^ƚĞƉϭ͗ŚŽŽƐĞzŽƵƌ^ƚLJůĞΘ^ŝnjĞ
zŽƵĂƌĞŽƌĚĞƌŝŶŐĨƌŽŵ͗
WůĞĂƐĞ^ĞůĞĐƚƚŚĞƚLJƉĞŽĨ^ƚLJůĞĨŽƌLJŽƵƌWŝnjnjĂĂŶĚƚŚĞŶƐĞůĞĐƚŽŶĞŽĨƚŚĞĂǀĂŝůĂďůĞƐŝnjĞƐ͘
ZĞŐ
dŚŝŶ
,ƵŶŐƌLJ,ŽǁŝĞΖƐηϬϬϲϭϮ
ϭϴϭϰKďĞƌůŝŶZŽĂĚ
ZĂůĞŝŐŚ͕EϮϳϲϬϴ
WŚŽŶĞ͗;ϵϭϵͿϳϴϵͲϬϬϬϭ
^ŵ
^ƚĞƉϮ͗WůĞĂƐĞ^ĞůĞĐƚĂ&ůĂǀŽƌĞĚƌƵƐƚ
ĐŚĂŶŐĞůŽĐĂƚŝŽŶ
KƌĚĞƌdLJƉĞ͗
a6(/(&7a
a6(/(&7a
a6(/(&7a
ĞůŝǀĞƌLJ
WŝĐŬhƉ
ŽƵƉŽŶ͗
ΎΎΎKƌŝŐŝŶĂůƌƵƐƚΎΎΎ5HPRYH
ŶƚĞƌŽĚĞ
^ƚĞƉϯ͗WůĞĂƐĞ^ĞůĞĐƚ
9DOLGDWH
>ĂƐƚKƌĚĞƌ͗;ǀŝĞǁͿ
DŽĚŝĨLJLJŽƵƌWŝnjnjĂĨƌŽŵƚŚĞůŝƐƚďĞůŽǁ͘ůŝĐŬŽŶĞĂĐŚƚŽƉƉŝŶŐƚŽƌĞŵŽǀĞŝƚ͘
a6(/(&7a
a6(/(&7a
a6(/(&7a
ϰyĂĐŽŶ5HPRYH
^ƚĞƉϰ͗^ƉĞĐŝĂů/ŶƐƚƌƵĐƚŝŽŶƐ
/ƚĞŵEŽƚĞ͗
ΞϮϬϭϮ
WƌŝǀĂĐLJWŽůŝĐLJ
Figure
6: Screenshot of the store’s website (stripped of identifying content), and the drop-down
menu for toppings.
For phone and counter orders, an employee enters instructions through a touchscreen
point-of-sales terminal which are then transmitted to a display in the food preparation
KWWSVKXQJU\KRZLHVKXQJHUUXVKFRPRUGBVSHFLDOVDVS[
area. For website orders, a customer clicks on a link for a particular base item and then
configures it through a series of drop-down menus; the order then goes directly to the
food preparation display. For all channels, customers may either pick up their orders at
the store, or have them delivered for a fee plus an optional gratuity.
The dataset used for our analysis includes all food items from orders made between
July 2007 and December 2011.11 The store anonymized the data before releasing it and
11 To preserve the confidentiality of sensitive competitive information, the store did not release data for orders over
$50 (typically large institutional orders) or for promotional orders under $3.49, the price of the least-expensive food
21
assigned a unique identifier to all households through a third-party proprietary system.
Because the store’s identifier is at the household level, we use the terms household
and customer interchangeably. Figure 7 provides a sample order made by a customer
containing two base items placed over the phone for delivery.
The measure of complexity in this paper refers to the number of instructions a
customer provides for each base item in his order. For example, we define a large pizza
as having a complexity equal to 1, a large pepperoni pizza as equal to 2, a large pizza with
half pepperoni and half sausage as equal to 3, and so on. Thus, the minimum complexity
for any base item is 1, while the maximum in the data is 21. This store, like most pizza
franchises, also offers “specialty” pizzas that have preconfigured toppings, such as a
“veggie” pizza with seven toppings. We code specialty pizzas to have a complexity
equal to 1 unless the customer provides instructions to add or remove toppings. Under
this definition, the order in Figure 7 has a maximum base item complexity of 6 and a
mean base item complexity of 4. The mean complexity comes from having two base
items and a total of 8 instructions, which includes the base of 1 for each item.
The store also provided information for the number of calories in each item. As a
benchmark, a large cheese pizza has 2080 calories, whereas a small garden salad with
no dressing has 40 calories. In the data, the mean and maximum number of calories for
the base items within an order are constructed in an equivalent manner to the measures
for complexity. Using the example in Figure 7, the mean base item has 2521 calories
and the maximum base item has 2779.
Finally, we measure popularity based on the number of times an item has been
ordered at the store. For instance, a large pizza is the most popular item, having been
ordered 95,846 times. For our order-level regressions, we use the proportion of items in
an order among the store’s top ten most popular to connect a consumer’s choices to the
store’s sales distribution, which will then allow us to study the effect of social frictions
on the long tail.
item.
22
Date:
Order Number:
Order Type:
Order Time:
03/12/2010
50
Delivery
05:17 PM
1
1
Taken By: David Robison
Table:
Lg Create Your Own Pizza
***Butter Chz Crust***
Lg Create Your Own Pizza
Pepperoni
Sausage
Green Peppers
Mushrooms
***Butter Chz Crust***
Customer:
9.99
9.99
1.49
1.49
1.49
1.49
Subtotal
Delivery Fee
Tax
Tip
Rows with
25.94
2.00
2.44
5.00
“1”
in
Figure 7: Sample order from the store’s sales terminal.
a
the leftmost column
Total
contain base items. The rows below a base item represent instructions
to35.38
alter the base item above
them (e.g., add a topping).
The dataset comprises 160,168 orders made by 56,283 unique customers, with summary statistics reported in Table 6. Of the store’s orders, 6.7% have been placed online
and notable differences exist between these and non-Web orders. Customers using the
Web spend $0.61 more, on average, though they order slightly fewer base items; this
disparity stems from online customers ordering more toppings. The mean base item is
15.0% more complex and has 6.1% more calories in an online order, while the maximum
base item is 16.9% more complex and has 7.2% more calories. In terms of popularity,
the average online order contains 9 percentage points fewer top-ten items.
The average customer has made 2.8 orders since the store’s opening, with a range
from 1 to 88. Of all customers, 4,582 (8.1% of total) purchased from the store both
before and after online ordering became available. Among this group, 700 (1.2% of
total) made an order both during the pre-Web time period and through the website
after the introduction of online ordering. These customers will be crucial for identifying
the causal effects of Web use, as observing orders across both regimes makes it possible
to difference out unobserved heterogeneity that might drive selection into the online
channel.
The store frequently offers promotions, with the average customer using a coupon in
23
Table 6: Descriptive statistics for pizza data.
Full Sample
Web Comparison
Std. Dev. Min.
Max.
Web Mean Non-Web Mean t-stat
Web Order
0.25
0
1
0
1
Order Price
6.829
3.49
49.99
15.46
14.85
9.04
1.99
2.02
3.27
Items in Order
1.156
1
17
Complexity – Mean Order Item
1.217
1
21
3.06
2.66
27.08
Complexity – Max Order Item
1.399
1
21
3.81
3.26
32.62
1798.84
1695.60
15.92
Calories – Mean Order Item
607.077
110
6010.84
Calories – Max Order Item
625.991
110
6010.84
2154.81
2009.20
21.74
0.39
0.48
30.54
Order Items in Top Ten
0.325
0
1
N
160168
10693
104804
Summary statistics from the full dataset of orders, excluding beverages, appear on the left-hand side and from orders
made in the post-Web period on the right-hand side. The unit of observation is an individual order. The variable
“Web Order” is an indicator variable equal to one if the order was made through the website. The variable “Order
Price” is the total price of the food items within an order before tax, delivery, and gratuity. The variable “Items in
Order” is the total number of base items (pizzas, breadsticks, baked subs, wings, and salads) within an order. The
variable “Complexity – Mean Order Item” is the average number of instructions provided per item within an order,
with a base complexity of 1. The variable “Complexity – Max Order Item” is the maximum number of instructions
provided for the items within an order, with a base complexity of 1. The variable “Order Items in Top Ten” is the
proportion of items within an order that are among the store’s top ten most ordered items.
Variable
Mean
0.067
14.702
2.036
2.646
3.273
1694.613
2022.724
0.475
54.3% of his orders. All promotions are available across all channels, and Web customers
are slightly less likely to use a promotion. Because physical coupons come affixed to
menus, any customer using a promotion can easily access the full list of the store’s
products, an institutional detail exploited as a robustness check below.
3.2
Online Orders and the Concentration of Sales
The store’s online orders exhibit a significantly less concentrated sales distribution even
though product selection, prices, and search capabilities remain fixed. To establish
the significance of this result, we compare the sales distribution of the store’s 69 items
(i.e., the five base items, specialty pizzas, and toppings) across the Web and non-Web
channels. Throughout, we consider distributions that do and do not distinguish items
by size (e.g., whether a large pizza is considered distinct from a medium pizza). We
drop any item purchased fewer than 500 times, a conservative restriction given the more
dispersed nature of online sales.
As in our analysis of the alcohol setting, we use a Herfindahl index to provide a concise
measure of the sales concentration: it is 0.0429 for the pre-Web period, 0.0403 for non-
24
Web sales in the post-Web period, and 0.0308 for Web sales. Using the percentage
of total sales generated by the bottom 80% of products as an alternative measure of
concentration, the share for pre-Web orders is 32.2%; the share for non-Web orders in
the post-Web period is 32.3%; and the share for Web orders is 38.7%. Thus, the share
of the bottom 80% of products is 6.4 percentage points greater for Web orders compared
to non-Web orders during the same time period, which resembles the 4 percentage point
difference documented by Brynjolfsson et al. (2011) for online and catalog clothing sales.
Finally, the top ten products comprise 52.6% of sales pre-Web, 52.1% of non-Web sales
in the post-Web period, and 45.4% of online sales.
To establish that the difference in sales concentrations across channels is statistically
significant, we consider a regression similar to Equation (1) where the dependent variable is a Herfindahl index for the sales channel in a given month and “Web Orders”
is an indicator variable equal to one for online sales. Table 7 presents the results from
these regressions, and all specifications show that online sales are significantly less concentrated. For Columns (1) and (2), the sales distribution is approximately 26% less
concentrated online, treating different sizes of the same item as distinct; adding a time
trend does not affect the main parameters. For Column (3), the sales distribution is
approximately 33% less concentrated online, treating different sizes of the same item as
equivalent; adding a time trend in Column (4) moves the decline to 36%. Across all
specifications, restricting the sample only to months in the post-Web period does not
affect the qualitative results.
Consistent with the results found for alcohol sales in the previous section, these
regressions establish that the store’s online orders have a significantly less concentrated
sales distribution. While other online markets also exhibit this pattern, the underlying
cause of the shift is unlikely to be the same here as in previous studies — the selection
of available products remains constant and search capabilities change little. As an
alternative explanation, we next consider the role of social transactions costs.
25
Table 7: Online orders have a less concentrated sales distribution.
Items Distinguished by Size
Items Not Distinguished by Size
(1)
Herfindahl
-0.0107***
(0.0006)
(2)
Herfindahl
-0.0107***
(0.0006)
(3)
Herfindahl
-0.0279***
(0.0008)
(4)
Herfindahl
-0.0292***
(0.0008)
Constant
0.0414***
(0.0004)
0.0412***
(0.0009)
0.0836***
(0.0005)
0.0801***
(0.0011)
Month Trend
N
Number of months
R2
No
92
56
0.7608
Yes
92
56
0.7611
No
92
56
0.9317
Yes
92
56
0.9458
Web Orders
Unit of observation is the channel-month.
Robust standard errors clustered by month in parentheses.
* significant at 10%; ** significant at 5%; *** significant at 1%.
3.3
Online Orders and Items Affected by Social Frictions
As we did for alcohol sales in Section 2, we now consider whether the impersonal nature
of online transactions can partly explain why online orders have a less-concentrated
sales distribution. Specifically, we show that consumers who place orders through the
store’s website are more likely to make choices that might otherwise be inhibited by
social frictions. Following an extensive literature in social psychology that has shown
individuals alter their behavior when others observe them eating excessively or unconventionally, we examine two order attributes that consumers may wish to keep private:
calories and complexity. For example, Polivy et al. (1986) show from an experiment
that subjects eat less when they believe others will be aware of their consumption.
At the extreme, studies of bulimia also find that binge eating occurs less often in the
presence of others (Waters et al. 2001, Herman & Polivy 1996). Moreover, excessive
complexity may cause embarrassment if customers fear appearing eccentric by ordering
an unconventional combination of items, which relates to sociological and psychological
theories of impression management (Goffman 1959, Banaji & Prentice 1994). To this
point, Roth et al. (2001) provide experimental evidence that subjects adhere to norms
for “appropriate” eating behavior around others. In keeping with these ideas, moving
26
orders online, and thus removing a layer of social interaction, may lead consumers to
purchase a different mix of items.
To test this theory, we consider a series of regressions that take the form
Yij = α + βXij + γW ebij + δi + εij ,
(2)
with Yij ∈ {complexity, calories} for order j by customer i; Xij includes order-specific
characteristics such as the day of the week, the time of day, a customer’s past order
count, and a time trend; W ebij is equal to one if the order was made online; and δi is
a customer-level fixed effect.
Table 8 presents the results from 16 different linear regressions based on Equation
(2) that use various dependent variables. For the regressions in Columns (1)–(12), we
also restrict the sample to customers who have made at least 10 orders and have ordered
during both the pre-Web and post-Web periods; this restriction rules out householdlevel selection into the sample based on the availability of Web ordering and therefore
more cleanly identifies the causal effect. We cluster all standard errors by household.
27
28
N
Number of Groups
R2
48446
2030
0.383
48446
2030
0.353
48446
2030
0.231
(6)
Complexity
Double Topping
0.0328***
(0.0679)
2708
1972
0.902
2708
1972
0.951
Six+ Item Orders
(15)
(16)
Complexity
Calories
Mean Item
Mean Item
-0.008
-168.18
(0.1345)
(105.58)
48446
2030
0.306
(5)
Complexity
Half Topping
0.107***
(0.00812)
25590
1993
0.395
(7)
Complexity
Mean Item
0.415***
(0.0689)
25590
1993
0.402
25590
1993
0.333
Coupon Orders
(8)
(9)
Complexity
Calories
Max Item
Mean Item
0.462***
117.95***
(28.61)
(34.52)
25590
1993
0.368
(10)
Calories
Max Item
148.25***
Each column represents an OLS regression based on Equation (2). All regressions include controls for the day of the week and time of day an order
was made, a customer’s past order count, a monthly time trend, and customer fixed effects. Columns (1) - (12) are restricted to customers who have
made (i) at least ten orders, (ii) at least one order during the pre-Web period, and (iii) at least one order during the post-Web period. Columns (7) (10) are restricted further to those customers who used a coupon for their order. Columns (11) - (12) are restricted to those customers who ordered
only one base item. Columns (13) - (14) are restricted to those customers who ordered only one small pizza. Columns (15) - (16) are restricted to
those customers who ordered at least six base items.
7556
4890
0.839
Small Pizza Orders
(13)
(14)
Complexity
Calories
Mean Item
Mean Item
0.514**
4.10
(0.2429)
(24.26)
48446
2030
0.334
All Orders
(3)
(4)
Calories
Calories
Mean Item
Max Item
51.52**
71.62***
(23.296)
(0.0148)
N
18437
18437
7556
Number of Groups
1880
1880
4890
R2
0.500
0.456
0.871
Standard errors clustered by household in parentheses.
* p < 0.10, ** p < 0.05, *** p < 0.01
Web Order
48446
2030
0.378
Web Order
(0.0466)
(2)
Complexity
Max Item
0.465***
(21.24)
One Item Orders
(11)
(12)
Complexity
Calories
Mean Item
Mean Item
0.463***
81.81**
(0.0827)
(40.27)
(1)
Complexity
Mean Item
0.386***
(0.0515)
Table 8: Regression results of order characteristics potentially influenced by social interaction among online orders.
The first two regressions show that consumers make more complicated orders online.
Using the mean complexity of the order’s base items as the dependent variable in Column (1), online orders are approximately 14.6% more complex than the sample mean.
Similarly, in Column (2) where the maximum complexity of the order’s base items is
the dependent variable, online orders are 14.2% more complex.
A customer may also experience embarrassment if others observe him making an
order with excessive calories (Allen-O’Donnell et al. 2011). To test this theory, Column
(3) uses the mean calories of the order’s base items as the dependent variable. Here, the
mean base item within an online order has 3.0% more calories compared to the sample
mean. Using the maximum calories as the dependent variable in Column (4), online
orders have 3.5% higher calories.
Collectively, these regressions suggest that customers make choices with less potential
for embarrassment when a transaction requires more social interaction. To conclude that
these findings stem from a social friction rather than some other unobserved factor, we
next show that several alternative theories unrelated to embarrassment do not fully
explain the differences among online orders.
3.4
Alternative Explanations Unrelated to Social Frictions
While the findings discussed above are robust to customer-level fixed effects and conservative sample restrictions, we now present additional evidence to support our claim
that the inhibiting effects of social frictions best explain our results.
Information About Available Items
One potential explanation for the long tail
of online orders is that customers without access to a menu may be more likely to
order prominent items. That is, without information about the full menu of products, a
customer may simply order a pepperoni pizza because he recalls that item more readily,
not because social frictions inhibit ordering complicated items verbally. And because
online customers necessarily have access to the full menu, this may lead to a long-tail
29
sales distribution as they become more aware of less prominent items. Several pieces of
supporting evidence suggest that this is not a primary explanation for our results.
First, this setting is a familiar one for most customers and the store’s menu is typical;
anyone who has ordered from another pizza delivery restaurant presumably could surmise most of the full menu. Moreover, the estimation sample contains only customers
who purchased from the store before online ordering became available, which suggests
that they have familiarity with the store’s offerings from previous transactions. As such,
customers having better information about available items is unlikely to generate the
substantial changes we observe for online orders.
Second, consider the results from the regression of topping size on online ordering
presented in Columns (5) and (6). Here, the dependent variable is equal to one if the
order has a customized topping instruction of a half or double portion, respectively. In
this case, any customer who knows that a topping is available is also likely to know the
topping is available in different amounts. And because Web customers are more likely
to alter the size of their toppings, especially for larger portions, it seems unlikely that
information about product offerings is responsible for the greater complexity among
online orders.
Third, consider Columns (7)–(10) which present results from a sample restricted
to customers who used a coupon. Because coupons come affixed to menus for this
store, any customer who uses one plausibly has access to the same information about
products as those who order online. All results are robust to this more conservative
sample restriction.
Fourth, previous studies have shown that consumers with better access to nutritional
information may consume fewer calories (Bollinger et al. 2011). Because the store’s
website has more prominent information about nutrition, the results pertaining to the
impact of online ordering on the number of calories per item are conservative along this
dimension.
Finally, custumers do not exhibit behavior consistent with learning after ordering
30
online. If a lack of information about product offerings leads consumers to order moreprominent items over the phone, then becoming aware of less-prominent items after using
the website should result in customers altering their behavior for subsequent phone
orders. Based on a comparison of Web and non-Web orders for customers following
their first online purchase, no such change occurs: customers continue to purchase more
popular items (as well as items with fewer instructions and calories) in their subsequent
phone orders, suggesting that the website does not make them more aware of lessprominent items.12
Ease-of-Use and Order Accuracy
Another potential explanation for the long tail
of online orders is that complex orders are easier to make on a website; that is, the results
may be driven entirely by an easy-to-use online interface. We contend that ease-of-use
does not explain our results for two primary reasons. First, an ease-of-use explanation
also would apply to the number of base items within an order, as the mechanics of
the website that would facilitate customized topping instructions also would facilitate
ordering more base items. Recall from Table 6, however, that the average online order
actually contains slightly fewer base items. Second, the store’s employees likely have
greater facility with the ordering system than any customer could possibly have with the
website; they are simply more adept at using the store’s sales terminal than a customer
is at navigating the website. This is especially true for complex orders that require
multiple button clicks online but could be entered quickly on the store’s touchscreen
sales terminals.
Related to the ease-of-use explanation, consumers may avoid making complex orders
over the phone to reduce the potential for misunderstandings. While in the alcohol
setting we could not rule out a fear of miscommunication as an explanation for why
the self-service format affected sales of difficult-to-pronounce items, three institutional
details in the pizza setting suggest that social frictions, and not concerns over miscom12 Summary
statistics reported in Appendix Table 6.
31
munication, best explain customers’ choices.13
First, recall from Table 8 that customers order double portions of toppings more often
online. Although it is as trivial for a customer to say, for example, “double bacon” over
the phone as it is for him to click through the online drop-down topping menu twice,
double and triple bacon orders increase more than ten times as much as double and
triple orders for vegetable toppings.
Second, for customers’ concerns about order accuracy to confound our results, consumers would have to believe that employees make fewer mistakes fulfilling online orders.
It may well be the case, for instance, that an employee taking an order over the phone
in a loud restaurant might not understand a customer’s instructions and mistakenly
deliver the wrong items. For this point, we have a (somewhat noisy) measure of mistakes: “voided” items that occur when an order changes during a call, either because
the employee makes a mistake or because the customer alters his order after the fact. To
determine if such mistakes prompt customers to place future orders online, we compare
customers who had voided items in their orders during the pre-Web period to those
who did not. Customers with voided items in the pre-Web period are not more likely
to eventually use the Web, suggesting that concerns over the accuracy of complicated
orders due to previous bad experiences does not explain Web use.
Third, and relatedly, those who made the most complex orders during the pre-Web
period are not more likely to switch to ordering online. These customers are unlikely to
be embarrassed about making complicated orders — they have done so before — but
they would benefit the most from switching to online ordering if it were easier to make
complicated orders through the website or to ensure that the correct items are delivered.
Group Size Another potential confound for our results is that we do not observe the
size of the group making the order. Related to the ease-of-use explanation above, a
complicated order for a large group may be easier to make online in the sense that each
13 Regression
results in this section are presented in the Appendix Table 8.
32
person can individually input his instructions on the website rather than having one
person relay several complicated instructions for the entire group over the phone. To
this point, first note that online orders have the same number of base items, on average,
suggesting that large groups do not disproportionately use the website. Second, consider
Columns (11)-(12) of Table 8 that restrict the estimation sample to those customers
who ordered only one base item. These orders are presumably more likely to come
from a single individual, and so will not be affected by any group dynamics. In this
case, all results are robust. Similarly, Columns (13)-(14) restrict the sample to orders
for a single small pizza (though without the other sample restrictions because only 62
Web orders were made for a single small pizza among this group) and the results for
complexity remain robust while those for calories do not. Finally, Columns (15)-(16)
consider orders for six or more base items — these orders are more likely to be made by
a large group, and hence the social interaction among group members may overwhelm
any disinhibition effect from the website. The results are consistent with this hypothesis,
as online orders become statistically indistinguishable from phone orders.
Selection Bias
Consumers who order online may differ systematically from those who
do not (Zentner et al. 2012). For instance, those more likely to use the Internet (e.g.,
teenagers) may also prefer to order complicated items for reasons unrelated to social
frictions (e.g., teenagers have different preferences than adults). While we control for
this confound directly by using individual-level fixed effects and conservative sample
restrictions, we also provide further evidence that selection bias does not undermine our
results in the appendix. Notably, customers who eventually order online make similar
choices during the pre-Web period as those who never order online.
Discussion
Given that the results on complexity and calories do not appear to be
driven entirely by information, ease-of-use, order accuracy, or selection bias, we argue
that the impersonal nature of Internet transactions is the most likely explanation for
the different sales patterns across the online and offline channels. Next, we estimate the
33
welfare effects that stem from such social transaction costs.
3.5
The Welfare Effects of Reducing Social Interaction
In contrast to the alcohol setting, the individual-level data from pizza orders allow us
to estimate the welfare consequences of removing a layer of social interaction, both for
consumers and the firm.
Consumer Surplus
Because a number of customers switched to online ordering when
given the choice, a straightforward revealed preference argument suggests that their
welfare has increased. These potential welfare gains may derive from several sources.
For one, some consumers may simply find ordering over the Internet more convenient.
Moreover, the lack of social interaction may free consumers to configure their orders
in a way that increases utility. On the other hand, some consumers may find ordering
online more cumbersome, or even that complicated orders are easier to make in person.
In light of such heterogeneity, this section outlines a random coefficients discrete choice
model to quantify the gains in consumer surplus attributable to online ordering.
In the model, let consumer i choose among k discrete complexity options and m
methods of ordering for each of his orders, o. In this case, k indexes the mean number
of instructions for the base items within an order, rounded to the nearest integer such
that k ∈ {1, . . . , 6}, which captures 99% of orders. Furthermore, let m ∈ {W eb, N onW eb} represent the chosen method of ordering. The utility a customer derives from an
order with a mean of k instructions through method m is then
Uikmo = βip P riceikmo + βic Complexikmo + βiw W ebikmo + βie F rictionikmo + εikmo , (3)
where P riceikmo is the price associated with an order of mean complexity k; Complexikmo ∈
{0, . . . , 6} is the mean complexity of the order’s base items associated with k (Complex =
0 is the outside option of no purchase), while βic represents the utility consumer i de-
34
rives from each unit of instruction; W ebikmo is an indicator variable equal to one if
the order was made online, while βiw represents the “cost” of ordering online — this
estimated coefficient will be negative to rationalize why the majority of orders do not
occur through the website; F rictionikmo is an indicator variable equal to one if the
method of ordering m was not online and the mean complexity of the order’s base items
was k ∈ {4, 5, 6} — βie then represents the disutility of making a complex, potentially
embarrassing or frustrating order in the presence of others;14 and εikmo is an unobserved error term that is identically and independently distributed extreme value and
independent of {P riceikmo , Complexikmo , W ebikmo , F rictionikmo } and βi . Finally, the
outside option of not ordering has a utility normalized to zero. Estimation follows Train
(2003).
The sample for estimation is restricted to the 2030 customers (i) who have made at
least 10 orders, (ii) who ordered in both the pre- and post-Web period, and (iii) who
have a mean base item complexity of six or less. The period spans 56 months and the
counterfactual price is taken to be the average price across the sample period.
The results from a random coefficients logit appear in Column (3) of Table 9. The
coefficients suggest that the mean “cost” of using the website has an implicit price of
nearly $8.90, with considerable heterogeneity around this mean. In addition, customers
derive greater average utility from providing more instructions per item, holding price
constant — about $0.85 per instruction, on average. This preference varies considerably
throughout the sample, however, as the standard deviation of the coefficient on complexity is more than twice as large as the mean effect. Finally, and most importantly,
social interaction has a meaningful and heterogeneous effect on order choices: for orders
that may be embarrassing or frustrating due to their complexity, social frictions have
an average implicit price of $2.75, while those customers two standard deviations above
the mean have a price equivalent to $5.92. Characterizing social transaction costs based
on excessive calories yields qualitatively similar results.
14 Approximately
20 percent of orders have a mean item complexity of 4 or higher.
35
Table 9: Coefficient estimates of the structural demand model.
Mean Price
(1)
-0.763***
(0.00245)
(2)
-0.778***
(0.00194)
(3)
-0.579***
(0.0217)
0.390***
(0.01118)
-3.019***
(0.0226)
-3.007***
(0.0226)
-5.154***
(0.276)
3.187***
(0.3286)
0.377***
(0.00734)
0.431***
(0.00613)
0.491***
(0.0701)
1.083***
(0.03829)
-0.667***
(0.0225)
-0.751***
(0.0187)
-1.595***
(0.164)
2.592***
(0.1062)
Std. Dev. Price
Mean Web
Std. Dev. Web
Mean Complex
Std. Dev. Complex
Mean Friction
Std. Dev. Friction
Constant
1.623***
(0.00446)
Observations
3702720
3702720
LL
-384061.69
-376992.4
Robust standard errors in parentheses
* p < 0.10, ** p < 0.05, *** p < 0.01
Covariance
Price
Price
0.1524
Web
Web
0.2464
10.16
Complex
-0.4085
-1.0954
Complex
3702720
-208119.25
Friction
1.1728
Friction
0.7318
3.1945
-2.3106
6.7167
This table presents the estimated coefficients from the
discrete choice model in Equation (3). “Friction”
is defined as highly complex requests ordered offline.
Column (1) contains the results from a logit specification.
Column (2) contains the results from a fixed-effects logit.
Column (3) contains the results from a mixed logit.
A full covariance matrix also was estimated for the parameters in the random coefficient logit, as shown at the bottom of Table 9. Our measure of social frictions is
positively related to price sensitivity and the cost of Web use, though negatively related
to the utility of providing more instructions per item.
Importantly, the random coefficients model permits a calculation of a consumer’s
willingness to pay for certain order attributes. Following Train (1998), Train (2003),
36
and Revelt & Train (1998), the change in consumer surplus for a given β is
Cio =
ln
P P
k
m
exp(βxikmo ) − ln
βp
P P
k
l
exp(βxiklo )
,
(4)
where l indexes a counterfactual choice setting without online ordering. The compensating variation for consumer i and order o is then
Z
CVio =
Cio (β)f (β|θ)dβ,
(5)
where θ represents the true parameters.
The average compensating variation constitutes the average of CVio taken over all
orders by all consumers in the sample. Based on 1000 Monte Carlo simulations and 1%
tail truncation, consumer surplus has increased 5.4% due to online ordering as consumers
avoid social transaction costs while making more-complex orders. These gains resemble
those of Brynjolfsson et al. (2003) who estimate that consumer welfare increased by up
to 4.2% due to a larger selection of products available at online booksellers.15 In this
sense, freeing consumers to choose their most-preferred item configuration without the
need for social interaction increases utility by an amount similar to having access to a
greater selection of products over the Internet.
Producer Surplus Because an item’s price is non-decreasing in its complexity, the
store stands to gain by reducing social frictions through Web ordering. And the store
does benefit, in that customers spend roughly $0.45 more when they order online, based
on a regression with the same controls and restrictions as Equation (2). Notably, this
increase in spending occurs on the intensive margin, so the store’s per-item margin of
approximately 66% applies. That is, conditional on an order occurring, the store earns
approximately $0.29 in additional profits by allowing customers to order on the Web
to the extent that other costs do not change (e.g., labor costs do not increase because
15 Brynjolfsson
et al. (2003) estimate a consumer welfare gain between $731 million to $1.03 billion in 2000 relative
to overall book sales of $24.59 billion.
37
orders have become more complex).
To account for the full effect of online ordering on the store’s profits, note that
customers using the Web would have made 0.416 orders per month, on average, but
their spending increases by $0.45. In addition, Web users increase their order frequency
by 0.072 orders per month and spend, on average, $15.46 per order. Thus, the store’s
average monthly gain from each Web customer is $1.30, or 21.4%. As Web customers
now constitute roughly 17% of the store’s total sales, the store earns 3.6% more annually
than it would in a counterfactual setting without online ordering. Note, however, that
an absence of information about competitors restricts us to providing only a short-run
approximation of the incremental profits the store earns each year from online orders.
These gains may seem underwhelming given the received wisdom that online platforms “disrupt” markets; however, online orders typically come from pre-existing customers — the store would reap a majority of these orders through traditional channels
anyway, and thus a counterfactual estimate of the incremental benefits from online ordering must account for any cannibalized sales. In this sense, the findings here resemble
the relatively modest counterfactual gains attributable to the Internet’s diffusion documented elsewhere (Greenstein & McDevitt 2011).
Summary
Overall, our calculations suggest that the frictions associated with social
interaction have a substantial impact on welfare in this setting. For consumer surplus,
the gain resembles prior estimates of the impact from online stores’ larger selection of
products. For producer surplus, the increase, while modest, nevertheless rationalizes
the firm’s decision to implement online ordering.
3.6
Social Transaction Costs and the Long Tail Phenomenon
As shown in Table 7, the store’s online orders have a significantly less concentrated
sales distribution than its phone and counter orders. Previous theories for why a long
tail characterizes online sales — namely, greater product selection and better search
38
capabilities — are unlikely to apply to pizza orders, however, as the menu remains
constant and consumers search similarly across channels. Instead, the distinguishing
feature of online pizza orders is that they require less social interaction. As such,
we directly explore the impact of reducing social frictions by considering a series of
regressions that use the fraction of items in an order that are among the top ten most
popular products as the dependent variable and that include the same controls and
restrictions as Equation (2); the results appear in Table 10.
Table 10: Regression results of orders influenced by social interaction and the long tail.
Covariate →
(1)
% Top Ten Items
Web Order
-0.0781***
(0.0103)
(2)
% Top Ten Items
Extreme Complex
-0.0684***
(0.0095)
(3)
% Top Ten Items
Extreme Calories
-0.0773***
(0.0129)
(4)
% Top Ten Items
Extreme Comp./Cal.
-0.0802***
(0.0083)
Observations
R2
48446
0.408
48446
0.407
48446
0.407
48446
0.408
Each column represents an OLS regression based on Equation (2). Dependent variable is the proportion of items
within an order among the store’s top ten most ordered items. Includes controls for the day of the week and time
of day an order was made, a customer’s past order count, a monthly time trend, and customer fixed effects. Sample
restricted to customers who have made (i) at least ten orders, (ii) at least one order during the pre-Web period,
and (iii) at least one order during the post-Web period. “Extreme” orders are defined to be approximately in
the top 2% in terms of complexity or calories. Unit of observation is an order. Standard errors clustered by household in parentheses. * significant at 10%; ** significant at 5%; *** significant at 1%.
Column (1) links online orders to the long tail. In this specification, those who
order online have 7.8 percentage points fewer items among the top ten most popular, as
would be expected given the results from Table 7. Columns (2)-(4) then directly show
how social frictions impact the sales distribution: for all specifications, those customers
who make extreme choices (defined as top 2%) in terms of complexity or calories also
purchase fewer items among the store’s most popular. As online orders are more likely
to have an extreme number of calories or instructions, and these orders are more likely
to be less concentrated, the long-tail effect thus prevails among the store’s online orders.
39
4
Conclusions
We have documented that, in two different retail settings, social interactions have a substantial effect on the types of products purchased by consumers. First, using data from a
field experiment in which stores changed formats from behind-the-counter to self-service,
we showed that difficult-to-pronounce products experienced a disproportionately large
increase in sales. Second, we showed that the addition of an online ordering channel increased the sales of high-calorie and complex items at a pizza delivery restaurant, which
increased consumer surplus by a proportion similar to that estimated by Brynjolfsson
et al. (2003) for the greater selection of products available at online bookstores.
Together, these results suggest that personal interactions may inhibit certain kinds of
economic activity, perhaps because customers wish to avoid the potential for embarrassment. While a prior literature in psychology, sociology, and medicine has documented
that individuals behave differently in sexually-charged or health-related settings that
involve personal interactions, our results suggest that the phenomenon is broader and
applies even to relatively mild social frictions, such as mispronouncing the name of a
product or making a complex pizza order.
We hasten to note, however, that our empirical settings have certain limitations that
limit the scope of our conclusions. First, we analyze just two settings. And though
these settings are common, their applicability to other markets, particularly beyond
retail, remains speculative. Second, while the lack of competition in our alcohol setting
is an advantage in terms of cleanly linking the change in sales format to the change in
sales patterns, our welfare analysis in the pizza setting is necessarily limited in that it
does not take into account competitors’ responses; thus, our estimate of the impact on
welfare is necessarily a short-run approximation. Third, while we have attempted to
eliminate other possible interpretations for our results, we have simply documented that
contexts with different levels of social interaction yield different outcomes — we cannot
definitively conclude that this change is due to a social friction such as embarrassment.
40
Thus, a more cautious interpretation of our results is that they simply demonstrate the
importance of a transaction’s context on the transaction itself, while leaving unsettled
which particular mechanism affects consumers. In our case, we emphasize the role of
social frictions because other explanations, such as consumers’ recall of products from
memory, are unlikely to explain our results across both empirical settings.
Despite these limitations, documenting similar outcomes across two distinct empirical
settings, each with their own strengths and weaknesses, highlights the extent to which
social interactions can inluence consumers. As such, our results provide a new explanation for the prevalence of long-tail sales distributions in online markets: impersonal
transactions lead consumers to purchase a different mix of products than they would
in settings where social interactions might act as an impediment. Our results are also
consistent with recent economic models of privacy, especially Daughety & Reinganum
(2010), that frame privacy as an individual’s desire for others to perceive her choices in
a positive light. Consistent with Goffman (1959) and others, our results suggest that
personal interactions are an important aspect in enhancing this desire. Thus, our results
identify why online settings, which are devoid of personal interactions, lead consumers
to alter their behavior and establish an important perceived benefit of online commerce
not previously mentioned in the economics literature (Scott Morton 2006).
Overall, our results build on the recent work in economics that examines the effect of emotions and social cues on behavior (Card & Dahl 2011, Ifcher & Zarghamee
2011, Li et al. 2010, Akerlof & Kranton 2000, Rabin 1993, Daughety & Reinganum
2010, DellaVigna et al. 2012). Our results suggest that social interactions may inhibit
economic activity, leading to reductions in consumer surplus and overall welfare. Speculatively, as a larger share of transactions move online, the prevalence of what was
previously embarrassing economic activity will continue to increase.
41
References
Ahmad, F., Hogg-Johnson, S., Stewart, D., Skinner, H., Glazier, R. & Levinson, W.
(2009), ‘Computer-assisted risk screening for intimate partner violence: A randomized
controlled trial’, Annals of Internal Medicine 151(2), 93–102.
Akerlof, G. A. & Kranton, R. E. (2000), ‘Economics and identity’, Quarterly Journal of
Economics 115(3), 715–753.
Akerlof, G. A. & Kranton, R. E. (2008), ‘Identity, supervision, and work groups’, American Economic Review Papers and Proceedings 98(2), 212–217.
Allen-O’Donnell, M., Cottingham, M., Nowak, T. & Snyder, K. (2011), ‘Impact of group
settings and gender on meals purchased by college students’, Journal of Applied Social
Psychology 41(9), 2268–2283.
Anderson, C. (2004), ‘The long tail’, Wired Magazine 12(10), 170–177.
Ariely, D. & Levav, J. (2000), ‘Sequential choice in group settings: Taking the road less
traveled and less enjoyed’, Journal of Consumer Research 27(3), 279–290.
Baddeley, A. D., Thomson, N. & Buchanan, M. (1975), ‘Word length and the structure
of short-term memory’, Journal of Verbal Learning and Verbal Behavior 14(6), 575–
589.
Banaji, M. & Prentice, D. (1994), ‘The self in social contexts’, Annual Review of Psychology 45(1), 297–332.
Bertrand, M., Duflo, E. & Mullainathan, S. (2004), ‘How much should we trust
differences-in-differences estimates?’, Quarterly Journal of Economics 119(1), 249–
275.
Bollinger, B., Leslie, P. & Sorensen, A. (2011), ‘Calorie posting in chain restaurants’,
American Economic Journal: Economic Policy 3(1), 91–128.
Brynjolfsson, E., Hu, Y. J. & Smith, M. (2003), ‘Consumer surplus in the digital economy: Estimating the value of increased product variety at online booksellers’, Management Science 49(11), 1580–1596.
Brynjolfsson, E., Hu, Y. & Simester, D. (2011), ‘Goodbye pareto principle, hello long
tail: The effect of search costs on the concentration of product sales’, Management
Science 57(8), 1373–1386.
Card, D. & Dahl, G. B. (2011), ‘Family violence and football: The effect of unexpected
emotional cues on violent behavior’, Quarterly Journal of Economics 126, 103–143.
Chapple, A., Ziebland, S. & McPherson, A. (2004), ‘Qualitative study of men’s perceptions of why treatment delays occur in the uk for those with testicular cancer’, The
British Journal of General Practice 54(498), 25.
Coopersmith, J. (2000), ‘Pornography, videotape, and the internet’, IEEE Technology
and Society Magazine 19(1), 27–34.
42
Dahl, D., Gorn, G. & Weinberg, C. (1998), ‘The impact of embarrassment on condom
purchase behavior’, Canadian Journal of Public Health 89(6), 368–370.
Daughety, A. & Reinganum, J. (2010), ‘Public goods, social pressure, and the
choice between privacy and publicity’, American Economic Journal: Microeconomics
2(2), 191–221.
De los Santos, B. I., Hortacsu, A. & Wildenbeest, M. (2012), ‘Testing models of consumer
search using data on web browsing and purchasing behavior’, American Economic
Review Forthcoming.
DellaVigna, S., List, J. A. & Malmendier, U. (2012), ‘Testing for altruism and social
pressure in charitable giving’, Quarterly Journal of Economics 127(1), 1–56.
Edelman, B. (2009), ‘Red light states: Who buys online adult entertainment?’, Journal
of Economic Perspectives 23(1), 209–220.
Fehr, E., Kirchsteiger, G. & Riedl, A. (1993), ‘Does fairness prevent market clearing?
an experimental investigation’, Quarterly Journal of Economics 108(2), 437–459.
Gackenbach, J. (2007), Psychology and the Internet: Intrapersonal, Interpersonal, and
Transpersonal Implications, Academic Press.
Goffman, E. (1956), ‘Embarrassment and social organization’, American Journal of
Sociology 62(3), 264–271.
Goffman, E. (1959), The Presentation of Self in Everyday Life, Garden City, NY: Doubleday Anchor Books.
Greenstein, S. & McDevitt, R. (2011), ‘The broadband bonus: Estimating broadband
internet’s economic value’, Telecommunications Policy 35(7), 617–632.
Griffiths, M. D. (2001), ‘Sex on the internet: Observations and implications for internet
sex addiction’, The Journal of Sex Research 38(4), 333–342.
Herman, C. & Polivy, J. (1996), ‘What does abnormal eating tell us about normal
eating?’, Food Choice, Acceptance, and Consumption pp. 207–238.
Ifcher, J. & Zarghamee, H. (2011), ‘Happiness and time preference: The effect of positive
affect in a random-assignment experiment’, American Economic Review 101, 3109–
3129.
Keltner, D. & Buswell, B. N. (1997), ‘Embarrassment: Its distinct form and appeasement functions’, Psychological Bulletin 122, 250–270.
Klass, E. T. (1990), Guilt, shame, and embarrassment: Cognitive behavioral approaches,
in H. Leitenberg, ed., ‘Handbook of Social and Evaluation Anxiety’, Plenham, New
York, pp. 385–414.
Lee, A. & Goldman, M. (1979), ‘Effect of staring on normal and overweight students’,
The Journal of Social Psychology 108(2), 165–169.
43
Lerman, C., Rimer, B., Trock, B., Balshem, A. & Engstrom, P. (1990), ‘Factors
associated with repeat adherence to breast cancer screening’, Preventive Medicine
19(3), 279–290.
Li, H., Rosenzweig, M. & Zhang, J. (2010), ‘Altruism, favoritism, and guilt in the
allocation of family resources: Sophie’s choice in Mao’s mass send-down movement’,
Journal of Political Economy 118(1), 1–38.
Lindner, E. G. (2001), ‘Humiliation and the human condition: Mapping a minefield’,
Human Rights Review 2(2), 46–63.
McDevitt, R. & Roberts, J. (2011), ‘Market Structure and Gender Disparity in
Health Care: Preferences, Competition, and Quality of Care’. Mimeo, University
of Rochester.
Meischke, H., Eisenberg, M. S., Schaeffer, S. M., Damon, S. K., Larsen, M. P. & Henwood, D. K. (1995), ‘Utilization of emergency medical services for symptoms of acute
myocardial infarction’, Heart and Lung 24, 11–18.
Niemi, R. (1976), ‘Costs of voting and nonvoting’, Public Choice 27, 115–119.
Polivy, J., Herman, C., Hackett, R. & Kuleshnyk, I. (1986), ‘The effects of self-attention
and public attention on eating in restrained and unrestrained subjects.’, Journal of
personality and social psychology 50(6), 1253.
Pozzi, A. (forthcoming), ‘Shopping cost and brand exploration in online grocery’, American Economic Journal: Microeconomics .
Rabin, M. (1993), ‘Incorporating fairness into game theory and economics’, American
Economic Review Papers and Proceedings 83(5), 1281–1302.
Revelt, D. & Train, K. (1998), ‘Mixed logit with repeated choices: Households’ choices
of appliance efficiency level’, Review of Economics and Statistics 80(4), 647–657.
Rosman, K. (2012), ‘Books women read when no one can see the cover’, The Wall Street
Journal .
Roth, D., Herman, C., Polivy, J. & Pliner, P. (2001), ‘Self-presentational conflict in
social eating situations: A normative perspective’, Appetite 36(2), 165–171.
Scott Morton, F. (2006), ‘Consumer benefit from use of the internet’, Innovation Policy
and the Economy 6, 67–90.
Seim, K. & Waldfogel, J. (2012), ‘Public Monopoly and Economic Efficiency: Evidence
from the Pennsylvania Liquor Control Boards Entry Decisions’, American Economic
Review forthcoming.
Skog, O. (2000), ‘An experimental study of a change from over-the-counter to selfservice sales of alcoholic beverages in monopoly outlets’, Journal of Studies on Alcohol
61(1), 95–100.
44
Suler, J. (2004), ‘The online disinhibition effect’, CyberPsychology & Behavior 7(3), 321–
326.
Train, K. (1998), ‘Recreation demand models with taste differences over people’, Land
economics pp. 230–239.
Train, K. (2003), Discrete Choice Methods with Simulation, Cambridge University Press.
Waters, A., Hill, A. & Waller, G. (2001), ‘Internal and external antecedents of binge
eating episodes in a group of women with bulimia nervosa’, International Journal of
Eating Disorders 29(1), 17–22.
Zentner, A., Smith, M. & Kaya, C. (2012), ‘Bricks, clicks, blockbusters, and long tails:
How video rental patterns change as consumers move online’. Mimeo, Carnegie Mellon.
45


![” ⊙ Prohibited Substances [1] Anabolic-Androgenic Steroids](http://cdn1.abcdocz.com/store/data/000006330_2-6488874179c020189ebf4ca4aba01440-250x500.png)


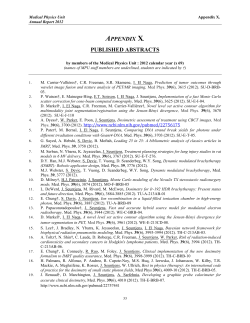


© Copyright 2026