
Briefing European Parliamentary Research Service
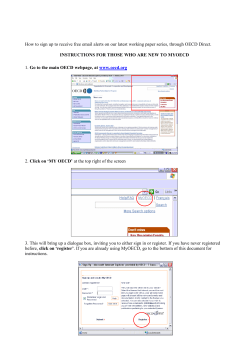
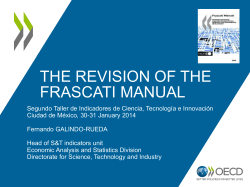
Economic significance of trade in services Background to negotiations on a Trade in Services Agreement (TiSA) IN-DEPTH ANALYSIS EPRS | European Parliamentary Research Service Author: Wilhelm Schöllmann Members' Research Service February 2015 — PE 549.000 EN The share of services in total trade does not reflect the importance of services in overall economic activity. This paper discusses the reasons for this imbalance: lower tradability of (some) services, statistical under-reporting of the importance of services to overall trade and barriers to trade in services. It also gives an overview on data availability on trade in services. The paper serves as background to the current negotiations towards a Trade in Services Agreement (TiSA) PE 549.000 ISBN 978-92-823-6587-8 doi: 10.2861/782184 QA-04-15-125-EN-N Original manuscript, in English, completed in February 2015. Disclaimer The content of this document is the sole responsibility of the author and any opinions expressed therein do not necessarily represent the official position of the European Parliament. It is addressed to the Members and staff of the EP for their parliamentary work. Reproduction and translation for non-commercial purposes are authorised, provided the source is acknowledged and the European Parliament is given prior notice and sent a copy. © European Union, 2015. Photo credits: © Sondem / Fotolia. [email protected] http://www.eprs.ep.parl.union.eu (intranet) http://www.europarl.europa.eu/thinktank (internet) http://epthinktank.eu (blog) Economic significance of trade in services Page 1 of 13 EXECUTIVE SUMMARY Fifty-one members of the World Trade Organization (WTO): Australia, Canada, Chile, Chinese Taipei, Colombia, Costa Rica, Hong Kong, Iceland, Israel, Japan, Liechtenstein, Mexico, New Zealand, Norway, Pakistan, Panama, Paraguay, Peru, South Korea, Switzerland, Turkey and the United States, together with the European Union and its 28 Member States – have been trying to find a way to break the deadlock in the Doha Round on liberalising trade in services since March 2013. These countries together represent over two thirds of global trade in services. The services sector accounts for more than 70% of GDP in the EU and in other developed economies, as well as for a substantial share of GDP in emerging economies. The sector is also the largest employer in the EU and other advanced economies. Yet the proportion of services trade in total international trade lags well behind its importance in overall economic activity. Reasons for the low share of services in overall trade include lower tradability of (some) services, under-reporting of the importance of services for overall trade in the balance of payments, and barriers to trade in services. Policy-makers intervene in the services trade to enhance consumer protection, counter market failures and secure a beneficial equity position. At the same time, governmentimposed barriers to trade can reduce the efficiency and range of services provided. As services are instrumental in ensuring the smooth running of the economy, and play an increasing role in facilitating international trade in goods, restrictions imposed on the services trade may lower the international competitiveness of an economy. Calculating equivalent tariffs for non-tariff measures and compiling indices on the restrictiveness of the services trade help to enable comparison of non-tariff measures across countries and serve as a reference point for governments and negotiators when considering renegotiating the framework governing international trade in services. Economic significance of trade in services Page 2 of 13 TABLE OF CONTENTS 1. Introduction................................................................................................................ 3 2. Tradability of services ................................................................................................ 4 3. The GATS modes of supply......................................................................................... 5 4. Data availability on trade in services ......................................................................... 6 5. Trade in services as a share of total trade ................................................................. 9 6. Why do governments intervene in services markets?............................................. 10 7. Non-tariff measures in the services trade ............................................................... 11 8. Ways to measure and compare non-tariff measures .............................................. 12 9. Main references ....................................................................................................... 13 List of main acronyms used BOP: Balance of payments FATS: Foreign Affiliates Statistics GATS: General Agreement on trade in services NTBs: Non-tariff barriers NTMs: Non-tariff measures OECD: Organisation for Economic Co-operation and Development PMR: Product market regulation (by OECD) TiSA: Trade in services agreement TiVA: Trade in Value Added (compiled by OECD and WTO) TRAINS: Trade Analysis and Information System (by UNCTAD) UNCTAD: United Nations Conference on Trade and Development WTO: World Trade Organization Economic significance of trade in services Page 3 of 13 1. Introduction Fifty-one WTO members: Australia, Canada, Chile, Chinese Taipei, Colombia, Costa Rica, Hong Kong, Iceland, Israel, Japan, Liechtenstein, Mexico, New Zealand, Norway, Pakistan, Panama, Paraguay, Peru, South Korea, Switzerland, Turkey, the United States, together with the European Union and its 28 Member States1 – have been trying to find a way to break the deadlock in the Doha Round on liberalising trade in services since March 2013. These countries together represent over two thirds of global trade in services. Table 1: Global services trade leaders (excluding intra-EU trade) Exporters EU-27 United States China India Japan Singapore Hong Kong SAR South Korea Switzerland Canada Share (%) of world services exports Country Share (%) of world services imports 24.6 EU-27 20.0 18.3 United States 12.7 5.7 China 8.8 4.4 Japan 5.4 4.2 India 3.9 4.0 Singapore 3.7 3.8 Canada 3.3 3.3 South Korea 3.3 2.6 Russia 3.2 2.3 Brazil 2.4 Source: World Trade Organization, World Trade Report 2013, p. 37. The sector is also the largest employer in the EU and other advanced economies, providing jobs to more than 70% of the workforce. Likewise, this sector employs a smaller, yet increasing percentage of the workforce in developing and emerging countries, such as China (36%) and India (28%).2 The services sector accounts for more than 70% of GDP in the EU and in other developed economies, as well as for a substantial share of GDP in emerging economies, such as China (46%), India (57%) and Turkey (64%).3 In the EU, retail, transport accommodation and food services as well as public administration, defence, education health and social work make up the biggest share of economic activity within the services sector (table 2).4 1 The EU has been a member of the WTO since 1995, alongside its 28 Members States, who are WTO members in their own right. 2 See Trade and Investment 2014 / European Commission, Brussels, p.8 and World Development Indicators 2014, / Indicator: SL.SRV.EMPL.ZS, World Bank, Washington, 2014. 3 See National Accounts and GDP / Eurostat Yearbook 2014, table 3, Indicator: nama_nace10_c, Eurostat, Luxembourg, 2014 and World Development Indicators 2014, / Indicator: NV.SRV.TETC.ZS, World Bank, Washington, 2014. 4 Agriculture, hunting, forestry and mining contribute to total value added in the EU by 1.7%, industry by 19.1% and construction by 5.7%. Economic significance of trade in services Page 4 of 13 Table 2: Share of services sectors as percentage of total value added, EU 28 Distributive trade, transport, accommodation and food services 19 Information and communication 4.5 Financial and insurance activities 5.4 Real estate activities 11.2 Professional, scientific, technical, administrative and support services 10.4 Public administration, defence, education, human health and social work activities 19.4 Arts, entertainment and recreation, other services 3.6 Source: Eurostat 2014, table 3. 2. Tradability of services Trade in goods rather than trade in services has long been at the centre of attention of both policy-makers and the academic world. Part of the reason for this interest may have been that trade in services is far less intuitive than trade in goods. Imagining how commodities and manufactured goods are shipped all over the world is not difficult. Trucks carrying merchandise from abroad congest our roads and bring international trade in goods into our daily life. However, when we speak of trade in services, it may be more difficult to envision exactly what this means because of the intangible nature of services. Most services cannot be stored or traded in bulk. Services are highly differentiated – not only do they differ from one firm to the next, they are also often customised to meet the needs of individual purchasers. Services often have to be produced and consumed in the same time and space, which implies that for trade to take place, either the service-provider must move to the premises of the customer, or the other way around. In economic literature, services used to be considered as a non-tradable sector – tradable signifying a good or service that can be sold in a location distant from where it was produced. Different goods have differing levels of tradability: the higher the cost of transportation and the more easily perishable, the less a good can be said to be tradable. A haircut is a classic example of a non-tradable service, but also services such as office cleaning, physical therapy or taxi-driving cannot be provided at a distance. They will be sold in the location in which they are produced and do not directly compete with services produced in other places. However, because of a broad range of technological changes (e.g. improvements in information technology and the ability to digitise knowledge) many services are now more easily delivered at a distance than in the past. Falling telecommunications and travel costs and the decreasing prices of information and communications technology have contributed to rendering services more tradable.5 Hence, when it is possible to digitise some or most of the service (e.g. architectural designs, many financial and insurance services), we are more likely to see a regional concentration of production of services, which are then distributed via channels of electronic communication. 5 See e.g. J.B. Jensen (2011), pp. 30-36. Economic significance of trade in services Page 5 of 13 Different degrees of tradability exist: 1. 2. 3. 4. perfectly tradable services which can be produced in one country and sold in another; essentially tradable services which only need a commercial presence in order to facilitate their sales; hardly tradable services which require the movement of staff for the delivery; non-tradable services which can be developed only by the creation of local establishments.6 3. The GATS modes of supply To cover all relevant aspects, the General Agreement on Trade in Services (GATS), in force since 1995, provides a rather broad definition of what constitutes trade in services. According to the GATS, there are four ways in which services can be traded, known as 'modes of supply': 1. Mode 1: Cross-border provision; 2. Mode 2: Consumption abroad; 3. Mode 3: Commercial presence abroad; 4. Mode 4: Temporary movement of natural persons. Mode 1 refers to pure cross-border trade in services in which the producer and consumer do not meet in person. It is very similar to trade in goods. Examples are the downloading of software products, the provision of online-banking or of book-keeping services delivered via the internet by a foreign provider. Under Mode 2 the customer moves to the producer’s location in order to consume the service. Typical examples are tourism and participation in training activities or healthcare abroad. Mode 3 includes a direct investment by a foreign service-provider in the consumer’s country. Sales by that subsidiary are counted as exports by the service-provider’s home country to the consumer’s country. An example is the establishment of a local branch by a foreign bank, restaurant chain or business consultancy. In services trade under Mode 4, the supplier temporarily moves to the consumer’s country in order to provide the service, as with information technology specialists who are sent temporarily from their home to the consumer’s country in order to install a new computer network. Under the GATS definition all services are, at least in principle, tradable via one of the four modes of supply. A haircut at the local barber shop still remains non-tradable, but when a Japanese hair-stylist flies to Paris to work on a French movie set, this is trade in services under GATS Mode 4. When an Italian chain of hairdressers opens a store in the US or Japan, sales by its foreign affiliate are considered to be trade in services under GATS Mode 3. 6 P.-Y. Leo & J. Philippe (2014), p. 48. Economic significance of trade in services Page 6 of 13 Some examples of trade in services The following people all export services: A secretary at a law firm answering a call from a foreign client; A taxi-driver who drives a foreign businessman to the airport; A doctor operating on a foreign patient; An engineer designing a bridge to be built in another country; A caterer preparing a meal to be served at a foreign embassy. The following persons all import services A student attending a foreign university; A businessman who extracts information from a foreign database; An investor who buys shares at a foreign stock exchange; A traveller who uses a credit card issued by a foreign bank; A consumer who has a camera repaired abroad. adapted from Jensen (2011), p. 29. 4. Data availability on trade in services Balance of payments data contain information on total trade in services, and different sub-categories, such as transport services (i.e. carriage of passengers and goods performed by residents of one economy for those of another), travel (i.e. goods and services acquired by people visiting foreign countries for health, education, business and other purposes) and other services, including construction, insurance, financial, computer and information, business services, personal, cultural and recreational services as well as royalties and licence fees.7 'Commercial services' equals total services minus services provided by government. The EU is the world's largest trader in commercial services. According to Eurostat, services exports grew between 2012 and 2013 by 3.4% for the EU as a whole, and by 5.5% for the euro area.8 Overall, EU international trade in services has witnessed substantial growth over the past decade. EU services exports to the rest of the world increased from €367 billion in 2004 to €684 billion in 2013, while imports rose from €321 billion to €511 billion.9 As exports have grown more strongly than imports, the trade surplus increased almost fourfold between 2004 and 2013, from €45 billion to €173 billion. Worldwide, trade in services has grown faster than trade in goods since the 1980s. According to estimates by the United Nations Conference on Trade and Development (UNCTAD), in 2013 global services exports reached US$4.7 trillion, and grew at a rate of 5% that year.10 7 For further discussion of methodological issues concerning trade in services, see WTO (2014), pp. 157-159. 8 see International Trade in Services / Eurostat Yearbook 2014, table 1, Indicator: bop_its_det, Eurostat, Luxembourg, 2014. 9 Eurostat News Release 100/2014 / Eurostat, Luxembourg, 2014. 10 Statistics at a glance / UNCTAD, Geneva 14 April 2014. Economic significance of trade in services Page 7 of 13 In 2012, six categories of commercial services accounted for 88% of EU exports. These were: transportation (22%), travel (14%), financial services (8%), computer and information services (7%), royalties and licence fees (6%) and other business services (e.g. consultancy and management services) (31%). Table 3: EU28 trade in services with the rest of the world, 2012 (billion euros) Exports Total services Transportation Travel Other services Communication services Construction services Insurance services Financial services Computer & information Royalties & license fees Other business services Personal, cultural, recreational services Government services Imports 661.9 508.4 143.7 117.5 95.4 90.6 422.7 281.2 21.2 17.8 16.6 7.9 23.9 10.9 53.4 21.6 43.5 17.8 40.0 48.1 208.4 144.7 8.4 6.3 7.3 6.2 Source: Eurostat 2013. The main destinations for EU service exports, as well as the sources from which EU services imports came, were the USA, followed by Switzerland, China, Russia and Japan. Figure 1: EU exports of services by main partner Source: Eurostat 2014. The EU recorded surpluses in trade in services with all of its main partners. The highest surpluses were observed with: Switzerland (€21 billion), Russia (€15 billion), the US and China (€12 billion each), Japan (€9 billion), Brazil (€8 billion) and Canada (€6 billion). Economic significance of trade in services Page 8 of 13 Figure 2: EU imports of services by main partner Source: Eurostat 2014. For the time being, balance of payments statistics do not separate the modes of supply. Still they can serve as a basis to derive estimates for trade in services under Modes 1 and 2.11 Mode 3 and Mode 4 statistics are more difficult to obtain. As foreigncontrolled affiliates are resident in their host countries, their sales in these countries are not recorded in the BOP, as the latter only covers transactions between a country's residents and non-residents. To bridge this gap, a new statistical framework, Foreign Affiliates Statistics (FATS) has been developed. These statistics cover the economic activities of enterprises producing goods and services, in which foreign investors own more than 50% of the voting power. They distinguish between incoming FATS, i.e. activities by foreign-controlled affiliates in the compiling country – and outgoing FATS, i.e. activities by foreign affiliates of the compiling country abroad. FATS are mainly available for OECD and a smaller number of non-OECD economies. As they constitute a new statistical concept, FATS may not always be fully comparable across countries as yet. Table 4: Foreign affiliates trade in services, in US$ billion, 2011 Inward FATS United States EU (extra-EU) Hong Kong China Japan Norway Israel India New Zealand 741.6 662.7 155.4 134 85.6 39.5 13 8.7 5.8 Outward FATS EU (extra-EU) United States Canada Norway Japan Australia Israel 1297 1195 135.6 36.7 37.9 23.3 3.7 Source: WTO International Trade Statistics 2014p. 46. 11 See Measuring Trade in Services / World Trade Organization, Geneva, November 2010. Economic significance of trade in services Page 9 of 13 Some countries only report incoming, some only outgoing, FATS. Supplies under Mode 3 can be approximated through the value of output (or supply) by foreigncontrolled affiliates.12 According to Maurer and Magdeleine, 'reliable and internationally comparable information for ... trade in services (Mode 4) is lacking'.13 The international statistical community is working to resolve this.14 Maurer and Magdeleine suggest a comprehensive approach to evaluate Mode 4 services trade. They arrive at an approximation of less than 5% of total international supply of services (all four modes) being delivered under Mode 4. 15 5. Trade in services as a share of total trade Nevertheless, for all the importance of the services sector in overall economic activity, and despite the remarkable growth in services trade, the latter constitutes only around a quarter of total EU trade as recorded by balance of payments statistics. This is also true for other major economies, where the share of trade in services in total trade mostly oscillates between 10% and 25%. For a sector that accounts for a significant share of GDP in almost all countries in the world, and for more than 70% of GDP in the EU and in other advanced economies, this is a rather low proportion. Table 5: Trade in goods and services as a share of total trade Trade in goods Trade in services Total trade Share services % of GDP % of GDP % of GDP % of total trade EU-28 (extra-EU) 26.7 9 35.7 25 Australia 33.1 7.5 40.6 18 Brazil 21.1 5.4 26.5 20 Canada 51.1 10.1 61.2 17 China 46.2 5.7 51.9 11 India 41.8 14.3 56.1 25 Indonesia 43.1 6.5 49.6 13 Japan 28.3 5.4 33.7 16 Mexico 63.4 3.9 67.3 6 43 8.2 51.2 16 Saudi Arabia 76.5 11.9 88.4 13 South Africa 55 8.5 63.5 13 South Korea 94.5 19.4 113.9 17 Turkey 49.5 8 57.5 14 United States 23.9 6.6 30.5 22 Russia Source: Eurostat - the EU in the world, Table 7.1, p. 92, author's calculations. 12 see WTO (2014) p. 159. 13 A. Maurer and J. Magdeleine (2011), p. 142. 14 e.g. by establishing the UN "Technical subgroup on the movement of persons - Mode 4". 15 A. Maurer and J. Magdeleine (2011), p. 171. Economic significance of trade in services Page 10 of 13 One reason behind these figures is that records on trade in goods can be overstated if imported intermediate goods contained in exports are not duly subtracted from export values.16 Furthermore, the services-related content of exported goods is not adequately recorded in the balance of payments (BOP), which leads to underestimation of the value of trade in services.17 The OECD-WTO database on 'Trade in Value Added' (TiVA) aims to remedy the situation by taking into account the value of services as inputs in overall international trade. Here, services account for almost 50% of all value added in exports across the OECD.18 This is still considerably below the above-70% share of services in overall value added in OECD countries, which reflects different degrees of service tradability, the shortcomings of traditional statistics when measuring services (see above), and the importance of barriers to trade in services. 6. Why do governments intervene in services markets? Governments usually intervene in services markets to protect their consumers, for equity considerations, and to counter market failures.19 In cases of asymmetric information, where it can be difficult for a client to judge whether the service being delivered is of a reasonable quality and price, governments often intervene to prevent suppliers from exploiting the client's inexperience. Therefore, service-providers may be required to disclose certain information to consumers. Moreover, service suppliers may be subject to qualification or licensing obligations that seek to ensure the competence of the supplier and thus the quality of the services they provide. Imperfect competition is often characteristic of services delivered through networks. Some of the most prominent examples of such services are telecommunications, postal services, electricity distribution and rail transport. Standardised services provided via such infrastructure or distribution networks often entail such large economies of scale that the market is most economically served by a single firm or a small number of firms. Unregulated, these markets may lead to overpricing and/or poor service quality. Government intervention is thus called for, and this may imply imposition of price controls or enabling competition, for instance through unbundling services and regulating access to essential facilities. Moreover, there is a legitimate case for regulating financial services to ensure systemic stability. Government intervention in service industries may also be inspired by equity considerations, as is the case with health and education services. Also, in the audiovisual, telecommunications, transport, energy and water services, unregulated markets risk depriving certain geographical areas or groups of consumers of affordable prices or adequate supply. 16 See e.g. How the iPhone widens the US trade deficit with the PR of China / Xing Y. and Detert N., Asian Development Bank Institute, Working Paper No. 257, Tokyo, December 2010 and Made in Sweden? / National Board of Trade, Stockholm, 2011. 17 See e.g. Thinking in a box: A 'Mode 5' approach to service trade / L. Cernat and Z. Kutlina-Dimitrova, European Commission DG Trade, Chief Economist Note, Issue 1, March 2014. 18 OECD (2014) figure 1, p. 1. 19 For a more thorough discussion on why governments intervene in services markets, please refer to World Trade Organization (2012) pp. 74–76. Economic significance of trade in services Page 11 of 13 7. Non-tariff measures in the services trade Conversely, regulation may increase the cost, and reduce the choice, of services provided, especially when it is outdated and not adapted to the latest economic developments.20 Services are important for the economy to thrive and state-of-the-art services are necessary to ensure competitiveness. Moreover, services and trade in goods are increasingly correlated – a services market which functions well is therefore instrumental for the export of goods to flourish.21 Governments usually intervene in the services trade through 'non-tariff measures' (NTMs), also known as 'non-tariff barriers' (NTBs). These are non-price, regulatory measures that comprise all kinds of interventions other than tariffs to control trade flows. They may specifically discriminate against foreign suppliers – either against their entry, or against the nature and range of their operations once they have become established in the market. Alternatively, they may protect existing service-providers by discriminating against all new suppliers, domestic or foreign. The economic effects of NTBs are much more difficult to grasp than those of tariffs.22 Tariff levels are published in schedules, whereas NTMs are much more opaque, diverse in nature and prone to changing more quickly. UNCTAD maintains and periodically updates a Trade Analysis and Information System (TRAINS) which contains data about over 100 different types of NTMs. The WTO maintains a database on technical barriers to trade to support the implementation of the transparency provisions laid out in the Technical Barriers to Trade Agreement. Barriers to trade are also subject to WTO scrutiny within the framework of the Trade Policy Review Mechanism. The OECD indicators of product market regulation (PMR) assess how far government policy supports a country's competitiveness. The Office of the United States Trade Representative publishes a yearly National Trade Estimate Report on Foreign Trade Barriers encountered by US industry. On this side of the Atlantic, the European Commission maintains a market access database on trade barriers reported by Member States and EU businesses – and on EU activities to have those barriers removed. The Commission also presents an annual Trade and Investment Barrier Report to the Council. As a result of the public consultation on TiSA, the Commission also summarises the barriers encountered by European businesses in countries participating in the negotiations.23 20 Hummels et al. show for the shipping industry how shipping companies charge higher prices when facing fewer competitors. This in turn may lead to lower trade and income in countries with highly regulated transport industries, see The trade reducing effects of market power in international shipping, Hummels, D. et al., NBER Working Paper Nr. 12914, Washington, 2007. 21 See e.g. Producer Services, Manufacturing Linkeages and Trade / Journal of Industry, Competition and Trade, December 2008 and Servicification of Swedish manufacturing / National Board of Trade, Stockholm, March 2010. 22 See e.g. The trade effects of non-tariff measures and services measures / in World Trade Report 2012, pp. 143-153. 23 Results of the Public Survey on the Trade in Services Agreement / European Commission, DG Trade, tradedoc 152464, Brussels, 2014. Economic significance of trade in services Page 12 of 13 8. Ways to measure and compare non-tariff measures Nevertheless, different methods exist to increase NTM transparency and comparability across countries and thereby help policy-makers and negotiators acquire the information and measurement tools they need for negotiating international trade agreements. This can also help governments single out best practices and focus domestic reform efforts. One way of achieving this is to compute tariff equivalents by estimating a tariff which would restrict trade in the same way as an NTM. Evidently, the outcome depends very much on the estimation technique applied, but can nevertheless at least give a qualitative indication of the magnitudes involved. 24 Hufbauer et al. have converted the barriers imposed on the services trade by 21 countries into equivalent tariffs, and have arrived at quite high figures for a number of emerging economies, some of which are party to TiSA (see figure 3). Figure 3: Tariff equivalents of barriers imposed on services by 21 countries (in %) Source: Hufbauer, Cary Clyde, Jeffrey J. Schott and Woan Foong Wong, 2010, table B.2. Another method is to convert NTMs into indices that can be compared across countries. Both the OECD and World Bank have undertaken such research. The World Bank Services Trade Restrictions Database provides information on trade policy measures for 103 countries: 79 developing and 24 OECD economies, and distils that information into a Services Trade Restrictions Index. 25 The World Bank's index covers five sectors: telecommunications, finance, transport, retail and professional services, further divided into 19 sub-sectors. The OECD Services Trade Restrictiveness Index covers 40 countries – the 34 OECD members as well as Brazil, China, India, Indonesia, Russia and South Africa. The OECD indices take a value from 0 to 1, where 0 is completely open and 1 is completely closed. 24 For methodological issues on tariff equivalents, please refer to World Trade Organization (2012) pp. 136–140; for a more general discussion on quantifying the effect of NTMs, please see UNCTAD (2013) pp. 17–26. 25 Guide to the Services Trade Restrictions Database / Borchert I. et al., World Bank Policy Research Working Paper Nr. 6108, Washington, 2012. Economic significance of trade in services Page 13 of 13 They are calculated on the basis of information in the STRI database, which reports on the regulations currently in force. Country and sector notes summarise results for various economic sectors, ranging from accounting to television and broadcasting, in the 40 countries covered by the database.26 9. Main references Policy barriers to international trade in services / I. Borchert et al., World Bank, 2012. A compendium of barriers to services trade / P. Dee, Canberra, 2005. The tradability of services / A. Gervais & J. B. Jensen, US Census Bureau, Discussion Paper CES 14-03, Washington, 2014. Global trade in services / J. B. Jensen, Peterson Institute, Washington, 2011. Payoff from the World Trade Agenda 2013 / G. Hufbauer and G. Schott, Washington 2013. Figuring out the Doha Round / G. C. Hufbauer et al., Peterson Institute, Washington 2010. International service tradability / P.-Y. Leo & J. Philippe, in UN ECLAC (2014), pp. 39-57. The Genesis of the GATS / J. A. Marchetti & P. C. Mavroidis, The European Journal of International Law (2011), Vol. 22 no. 3 pp. 689-721. International tradability indices for services / E. van de Marel, B. Shepherd, World Bank Policy Research Working Paper No. 6712, Washington, 2013. Measuring trade in services in Mode 4 / A. Maurer and J. Magdeleine, in P. Sauvé et al. (eds), Tokyo 2011, pp. 141-173. Looking Beyond Tariffs / OECD, Paris 2005. Services Trade Restrictiveness Index: Policy Brief / OECD, Paris 2014. Service Sector Reforms / P. Sauvé et al (eds.), ADB Institute, Tokyo, 2011. Non-tariff measures to trade / UNCTAD, Geneva 2013. Latin America's emergence in global services / UN ECLAC, Santiago (Chile), 2014. Measuring Trade in Services / World Trade Organization, Geneva 2010. World Trade Report 2012 / World Trade Organization, Geneva 2012. International Trade Statistics 2014 / World Trade Organization, Geneva 2014. 26 Services Trade Restrictiveness Index: Scoring and Waiting / Geloso Grosso, OECD Trade Policy Papers No. 177, OECD, Paris 2015. Although services account for around 70% of GDP in the EU and other developed economies, their share in trade is nowhere near as high. A number of reasons are put forward for this situation, including lower tradability of (some) services, statistical under-reporting of services for overall trade, and barriers to trade in services. In view of the negotiations on TiSA, this paper presents background on the situation of services trade for the EU. This is a publication of the Members' Research Service Directorate-General for Parliamentary Research Services, European Parliament PE 549.000 ISBN 978-92-823-6587-8 doi: 10.2861/782184 QA-04-15-125-EN-N Breaking the deadlock on reaching a global agreement to remove barriers to international trade is at the heart of the negotiations on a 'Trade in Services Agreement' (TiSA). The EU and its Member States, together with two dozen other major WTO members are currently negotiating towards such a new accord.


© Copyright 2026