
Mapping irrigation potential from renewable groundwater in Africa
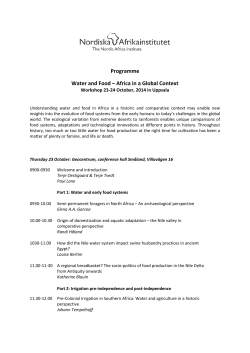
Hydrol. Earth Syst. Sci., 19, 1055–1067, 2015
www.hydrol-earth-syst-sci.net/19/1055/2015/
doi:10.5194/hess-19-1055-2015
© Author(s) 2015. CC Attribution 3.0 License.
Mapping irrigation potential from renewable groundwater
in Africa – a quantitative hydrological approach
Y. Altchenko1,2,3 and K. G. Villholth1
1 International
Water Management Institute, Pretoria, South Africa
de l’Agriculture, de l’Agroalimentaire et de la Forêt, Paris, France
3 Laboratoire METIS, UMR 7619 UPMC/CNRS, Université Pierre et Marie Curie, Paris, France
2 Ministère
Correspondence to: Y. Altchenko ([email protected])
Received: 15 April 2014 – Published in Hydrol. Earth Syst. Sci. Discuss.: 10 June 2014
Revised: 3 October 2014 – Accepted: 29 October 2014 – Published: 26 February 2015
Abstract. Groundwater provides an important buffer to climate variability in Africa. Yet, groundwater irrigation contributes only a relatively small share of cultivated land, approximately 1 % (about 2 × 10⁶ hectares) as compared to
14 % in Asia. While groundwater is over-exploited for irrigation in many parts in Asia, previous assessments indicate an
underutilized potential in parts of Africa. As opposed to previous country-based estimates, this paper derives a continentwide, distributed (0.5◦ spatial resolution) map of groundwater irrigation potential, indicated in terms of fractions of
cropland potentially irrigable with renewable groundwater.
The method builds on an annual groundwater balance approach using 41 years of hydrological data, allocating only
that fraction of groundwater recharge that is in excess after
satisfying other present human needs and environmental requirements, while disregarding socio-economic and physical
constraints in access to the resource. Due to high uncertainty
of groundwater environmental needs, three scenarios, leaving
30, 50 and 70 % of recharge for the environment, were implemented. Current dominating crops and cropping rotations
and associated irrigation requirements in a zonal approach
were applied in order to convert recharge excess to potential
irrigated cropland. Results show an inhomogeneously distributed groundwater irrigation potential across the continent,
even within individual countries, mainly reflecting recharge
patterns and presence or absence of cultivated cropland. Results further show that average annual renewable groundwater availability for irrigation ranges from 692 to 1644 km3 depending on scenario. The total area of cropland irrigable with
renewable groundwater ranges from 44.6 to 105.3 × 10⁶ ha,
corresponding to 20.5 to 48.6 % of the cropland over the con-
tinent. In particular, significant potential exists in the semiarid Sahel and eastern African regions which could support
poverty alleviation if developed sustainably and equitably.
The map is a first assessment that needs to be complimented
with assessment of other factors, e.g. hydrogeological conditions, groundwater accessibility, soils, and socio-economic
factors as well as more local assessments.
1
Introduction
Irrigation expansion is seen as a significant leverage to food
security, livelihoods, rural development, and agricultural and
broader economic development in Africa, especially in subSaharan Africa (SSA). National and regional (CAADP, 2009;
NEPAD, 2003) policies and plans stress irrigation development, and more broadly sustainable land and water management, as a key component to poverty alleviation and gains in
food productivity.
FAO (2005) assessed the potential for irrigation development1 in Africa to be 42.5 × 10⁶ ha, corresponding to 20.1 %
of the cultivated area or 5.7 % of the cultivable land. While
still playing a secondary and minor role in national and re1 Definition of irrigation potential in FAO (2005): area of land
(ha) which is potentially irrigable. Country/regional studies assess
this value according to different methods – for example some consider only land resources suitable for irrigation, others consider land
resources plus water availability, and others include in their assessment economic aspects (such as distance and/or difference in elevation between the suitable land and the available water) or environmental aspects, and so forth.
Published by Copernicus Publications on behalf of the European Geosciences Union.
1056
Y. Altchenko and K. G. Villholth: A quantitative hydrological approach
gional plans, groundwater is increasingly included as a viable
and suitable supplementary or sole source to develop for irrigation along with traditional surface water resources (MoAC,
2004; MoFA and GIDA2 , 2011; MoFED, 2010; MoIWD,
2005; MoWEA, 2013). This is explained by evidence that
farmers progressively embrace groundwater irrigation (GWI)
spontaneously and with own investments where conditions
permit (Villholth, 2013) and the notion that the groundwater
resources in Africa generally are plentiful as well as underutilized (MacDonald et al., 2012).
Groundwater irrigation presently covers around 2 × 10⁶ ha
in Africa, equivalent to 1 % of the cultivated land3 (Siebert
et al., 2010). In Asia, similar figures amount to 38 × 106 ha
or 14 % of cultivated land (Siebert et al., 2010). Hence, it
is fair to assume that there is appreciable scope for further developing GWI in the continent. Barriers to an expansion of groundwater-based irrigation in Africa, and in particular SSA, include lack of knowledge of the resource and
best options for sustainable development. So, while present
levels of development are comparatively low and most development occurs in the informal sector (Villholth, 2013),
progress towards greater and long-term benefits need to be
informed by estimations of upper limits for sustainable development and most appropriate geographic areas for development. The need for qualified estimates of groundwater irrigation potential (GWIP) is recognized at the national (MoFA
and GIDA, 2011; Awulachew et al., 2010) as well as regional
scale (MacDonald et al., 2012). Qualitative, relative groundwater potential was mapped for Ethiopia by MacDonald et
al. (2001), however, with no specific focus on the potential
for irrigation. You et al. (2010) estimated the potential contribution from small-scale irrigation (including ponds, small
reservoirs, rainwater harvesting, and groundwater) in Africa
to be 0.3 to 16 × 106 ha based on a continental distributed
mainly economic multi-criteria analysis at a 5 min. resolution. Pavelic et al. (2012, 2013) afforded a relatively simple water balance approach to provide country or catchment
scale estimates, respectively, of gross GWIP in terms of irrigable cropland, taking into consideration the crop irrigation water needs and disregarding existing irrigation development. Water available for irrigation was constrained by renewable groundwater resources, priority demands from domestic, livestock, industrial uses as well as environmental
requirements. They determined the GWIP of 13 semi-arid
countries in SSA to be in the range of 13.5 ± 6.0 × 10⁶ ha,
or between 0.1–3.9 × 10⁶ ha per country. While the previous
estimations of GWIP in Africa were continental (You et al.,
2010), national (Pavelic et al., 2013), or sub-national (Pavelic
2 In the Ghana National Irrigation Policy, groundwater irrigation
falls under the category “informal irrigation”.
3 Cultivated land and cropland are here used interchangeably,
to mean the combined arable land area and the area under permanent crops (http://www.fao.org/nr/water/aquastat/data/glossary/
search.html?lang=en).
Hydrol. Earth Syst. Sci., 19, 1055–1067, 2015
et al., 2012) in scope, the present paper builds on the latter
approach providing a fully distributed and consistent assessment of the gross GWIP for the entire continent at a grid
scale of 0.5◦ . The concept of the approach is to map crop area
that can be irrigated with locally renewable groundwater resources at a continental and distributed scale. By doing so, regional differences across the continent become conspicuous
and variability within the countries also becomes apparent.
The extent and distribution of GWIP is subsequently compared with the existing GWI extent and distribution across
Africa to determine net GWIP, i.e. areas and regions with
high and low residual GWIP. Finally, the limitations and uncertainties related to the methodology are assessed and discussed.
2
Methodology
Following the approach of Pavelic et al. (2013), the methodology assumes groundwater as the sole source of irrigation water and hence gives an estimate of the area that
could potentially be irrigated by groundwater disregarding
any existing irrigation, whether from groundwater or surface
water. Importantly, the method considers sustainable GWI
from a resource perspective, i.e. the use of only renewable
groundwater for human needs (including irrigation) while
partially satisfying environmental requirements from this renewable resource. As a consequence, non-renewable (fossil) groundwater is not considered available, preventing longterm aquifer depletion.
The water balance assessment is based on a GIS analysis
and mapping with a final resolution of 0.5◦ assuming each
cell (about 50 km × 50 km) to be homogeneous and independent of other cells, i.e. no lateral groundwater or irrigation
water flows occur between cells. For each cell, the GWIP
[L2 ] is calculated as the potential cropland area that the available groundwater resource can irrigate (Supplement):
GWIP =
GW Available
,
Irrig. Water Demandmax
(1)
where groundwater availability [L3 T−1 ] is calculated as any
excess of groundwater recharge, considering other groundwater demands from humans (domestic uses, livestock, industry) and the environment:
GW Available = GW Recharge − Human GW Demand
− Environ. GW Req.
(2)
The gross irrigation water demand [L T−1 ], which represents
the groundwater abstraction needed to satisfy the deficit rainwww.hydrol-earth-syst-sci.net/19/1055/2015/
Y. Altchenko and K. G. Villholth: A quantitative hydrological approach
fall and the irrigation losses, is determined by
Irrig. Water Demand
nP
=
n
i=1
hP
i
m (Crop Water Demand − Green Water) × [% of Area]
i
j
j =1
Irrig. Efficiency
o
.
(3)
The crop water demand [L T−1 ], which represent the
monthly amount of water needed by the crop to grow optimally during the months of its growing period, independently
of the water source and considering water as the only limiting
factor for optimal growth (FAO, 1986), is determined by:
Crop Water Demandj = Kc × E0,maxj .
(4)
The equation parameters are given as follows:
– E0,max [L] is the maximum reference evapotranspiration
for each calendar month.
– Kc [–] is the crop coefficient.
– Green Water [L T−1 ] is the water available for plants
naturally and indirectly from the rainfall through soil
moisture.
– % of Area [–] is the areal fraction of a specific crop
relative to the total crop area within a grid cell.
– n [–] is the number of crops grown within the grid cell.
– m [–] is the number of months of the year (12).
– Irrig. Efficiency [–] is the irrigation efficiency coefficient. It is used to express the fraction of groundwater
abstracted that is not lost along the water transport from
the abstraction point to the crop (FAO, 1989). The extracted groundwater quantity does not reach fully the
crops because of transport losses or losses in the field.
– GW Recharge [L3 T−1 ] is the net groundwater recharge.
It corresponds to the total quantity of water from rainfall which reaches the aquifer as diffuse recharge. Return flows from surface water irrigation and other forms
of artificial recharge as well as focused or induced
recharge from water surface bodies are disregarded.
– Human GW Demand [L3 T−1 ] is the groundwater use
for anthropogenic activities, such as domestic and industrial water supply and livestock watering. Domestic
and industrial water requirement are assumed to come
partly from groundwater while livestock watering is assumed to be fully supplied by groundwater (see also
Sect. 3.3).
– Environ. GW Req. [L3 T−1 ] is the quantity of water
coming from groundwater, which is directly linked to
the environment for maintaining ecosystems. This includes river baseflow and groundwater influx to wetlands.
www.hydrol-earth-syst-sci.net/19/1055/2015/
1057
The proposed approach, taking annual water balances, yields
an estimate of GWIP with respect to historic hydrology when
considering the assessment over a number of years with varying rainfall and recharge over the continent. This is described
in more detail in the next section.
3
3.1
Data sources and preparation
Hydrological data
Data on recharge (GW Recharge, Eq. 2) and green water
(Green Water, Eq. 3) derive from model outputs from the
PCR-GLOBWB global hydrological model (Van Beek et al.,
2011; Wada et al., 2011). Data for Africa from a global simulation with 0.5◦ spatial resolution for a recent 41-year period
(January 1960 to December 2000) have been used (including
Madagascar, but excluding the smaller islands of Comoros,
Mauritius, Seychelles and Cape Verde). The model calculates for daily time steps the water storage in two vertically
stacked soil layers and an underlying groundwater layer, as
well as the water exchange between the layers and between
the top layer and the atmosphere (rainfall, evaporation and
snow melt). The model also calculates canopy interception
and snow storage. During the simulation period, land cover
changes are not taken into consideration. For the green water
availability, the sum of the simulated actual transpiration of
the two soil layers under non-irrigation conditions (i.e. natural vegetation and rainfed crops) was used (Van Beek et al.,
2011). This conservative approach, effectively reducing precipitation for surface runoff, percolation, soil evaporation and
interception, gives a measure of easily available soil moisture for the plants, and ensures that the availability of water for the crops is not overestimated. This approach is in
agreement with the green water definition by Savenije (2004)
and the productive green water definition by Falkenmark and
Rockström (2006), who define transpiration as the productive
component of the green water, which is involved in biomass
production in terrestrial ecosystems as opposed to the unproductive part attributable to soil evaporation (Supplement).
3.2
Crop and irrigation data
The necessary crop data to calculate irrigation water demand
(Irrig. Water Demand, Eq. 3) relate to the crop distribution
across the continent, the crop calendar over the year, encompassing one or a maximum of two crops per year for any area,
and the annually accumulated monthly crop water demand
for each crop in each cell. For the crop distribution, data for
the 2000 crop distribution have been used (Monfreda et al.,
2008; Ramaunkutty et al., 2008). Figure 1 shows the cropland (217 × 106 ha) distribution in Africa. This includes the
cultivated (i.e. harvested) cropland and non-cultivated cropland in 2000.
Six major irrigated crop groups, accounting for an average of 84 % of the total harvested cropland in 2000
Hydrol. Earth Syst. Sci., 19, 1055–1067, 2015
1058
Y. Altchenko and K. G. Villholth: A quantitative hydrological approach
Table 1. Areal proportion of crop groups cultivated in Africa for the
year 2000, adapted from Monfreda et al. (2008).
Type of crop
Cereals
Oils
Roots
Pulses
Vegetables
Sugar crops
Fruit
Forage
Fiber
Tree nuts
Other crops
Total
Figure 1. Proportion of cropland per cell (0.5 x 0.5 degree) in 2000
(Ramankutty et al., 2008).
(165.7 × 10⁶ ha) over the continent, were considered (Table 1).
These include: cereals, oil crops, roots, pulses, vegetables
and sugar crops (sugarcane mostly in Africa). The proportion of the land area occupied by the different crop groups is
shown in Fig. 2. It is assumed that the cropping pattern is not
influenced by introduction of groundwater. While it is known
that smallholder GWI may preferentially be applied to higher
value crops (like vegetables) in SSA (Villholth, 2013) and
that the dominant crops in irrigated and rainfed agriculture
differ from region to region in Africa (Portmann et al., 2010),
no data on the larger scale and distributed impact of crop pattern change as a result of GWI exist.
In certain areas, the aggregated crop group areas accounted
for more than 84 % of the harvested cropland. This is because
double cropping occurs. Hence, in order to ensure that double
cropping does not entail exaggerated cropland areas, the crop
group areas were downscaled by cell-by-cell factors, making
the aggregated crop group area for those cells equal to 84 %
of the harvested cropland.
For the crop calendar, Africa can be divided into 23 irrigation cropping pattern zones, within which crop calendar,
irrigation method and cropping intensity can be assumed to
be homogeneous within the cropland (FAO, 1997) (Fig. 3).
This subdivision is applied in this study.
The crop calendar data have been extracted from the FAO
crop calendar4 and other sources (FAO, 1992, 1986) and
compiled into a calendar per crop group done for each irrigation cropping pattern zone. The calendar indicates the specific crops present in the group for each irrigation cropping
pattern zone (Supplement). Up to two specific crops from the
4 http://www.fao.org/agriculture/seed/cropcalendar/welcome.do
(last access: 31 March 2014).
Hydrol. Earth Syst. Sci., 19, 1055–1067, 2015
Area (106 ha)
Proportion ( %)
79.4
19.6
17.8
16.3
4.4
1.4
8.4
3.7
4.2
1.3
9.2
47.92
11.83
10.74
9.84
2.66
0.84
5.07
2.23
2.53
0.78
5.56
165.7
100 %
same crop group can be cultivated per year on the same cropland and allows year-round cropping and an annual cropping
rotation.
The monthly crop water demand for each crop group is determined by Eq. (4), using the maximum monthly reference
evapotranspiration for each calendar month over the period
1960–2000 and crop coefficient (Kc ) as determined in the
Supplement. Growth periods and corresponding Kc values
for the various crops are extracted from the literature (FAO,
1992, 1986) and are assumed to be constant over the 41-year
period while the reference evapotranspiration data are extracted from inputs to the PCR-GLOBWB global hydrological model. Since the crop calendar includes entries with more
than one specific crop for a crop group (e.g. millet/wheat for
cereals) and they have similar, but not equal monthly water
demands (Supplement), a conservative approach is applied,
whereby the larger figure for the crops has been applied, unless the difference between them is equal to or more than
0.05 and 0.1, in which case the larger coefficient is reduced
by 0.01 or 0.02, respectively. The reason for applying the
conservative approach is to ensure that the GWIP is not overestimated.
The irrigation efficiency (Irrig. Efficiency, Eq. 3) takes into
consideration the water lost during the irrigation path from
the water abstraction point to the water reaching the plants.
Water losses occur mainly during water transport (i.e. pipe
leakage or evaporation/leakage in open canals) and in the
field (i.e. water running off the surface or percolating past
the root zone). Each irrigation cropping pattern zone has an
irrigation efficiency coefficient based on figures found in the
literature, type of crops irrigated and intensification level of
the irrigation techniques (FAO, 1997) (Table 2). The coefficient is mainly based on surface water irrigation and it is
here assumed applicable to GWI. This assumption implies
a conservative estimate of GWIP as open canal water transport from rivers or lakes is typically found to be less efficient
www.hydrol-earth-syst-sci.net/19/1055/2015/
Y. Altchenko and K. G. Villholth: A quantitative hydrological approach
1059
Figure 2. Proportion of crop group area per cell (0.5◦ × 0.5◦ ) cultivated in 2000 of the six largest crop groups (adapted from Ramankutty et
al., 2008).
than groundwater, which is abstracted more locally and in a
distributed fashion (Foster and Perry, 2010).
3.3
Figure 3. Delineation of the 23 irrigation cropping pattern zones in
Africa (based on FAO, 1997; http://www.fao.org/geonetwork/srv/
en/main.home, last access: 1 April 2014).
www.hydrol-earth-syst-sci.net/19/1055/2015/
Other groundwater uses
Irrigation is only one of the groundwater uses and it is necessary to take into account the other anthropogenic and environmental groundwater uses. They are divided into four categories: domestic, industrial, and livestock demands as well
as environmental requirements. Irrigation from groundwater
is possible only after the groundwater demands of these uses
have been satisfied.
Groundwater demand of anthropogenic activities is calculated for each cell using the density map of population and
livestock from 2000 (FAO, 2007a, b) and data in Table 3.
Domestic, industrial and livestock water demand is assumed
constant over the period 1960–2000.
The environmental groundwater requirement remains
highly uncertain. To account for this, three scenarios have
been applied: with environmental groundwater requirements
representing 70 % (Scenario 1), 50 % (Scenario 2), and 30 %
(Scenario 3) of the recharge, respectively over the continent
(Pavelic et al., 2013).
Hydrol. Earth Syst. Sci., 19, 1055–1067, 2015
1060
Y. Altchenko and K. G. Villholth: A quantitative hydrological approach
Table 2. Irrigation efficiency dependent on irrigation cropping pattern zone (FAO, 1997).
Zone name
Irrigation
cropping
pattern zone
Number
1
2
3
4
5
6
7
8
9
10
11
12
13
14
15
16
17
18
19
20
21
22
23
Mediterranean coastal zone
Sahara oases
Semi-arid to arid savanna West-East Africa
Semi-arid/arid savanna East Africa
Niger/Senegal rivers
Gulf of Guinea
Southern Sudan
Madagascar tropical lowland
Madagascar highland
Egyptian Nile and Delta
Ethiopian highlands
Sudanese Nile area
Shebelli–Juba river area in Somalia
Rwanda – Burundi – Southern Uganda highland
Southern Kenya – Northern Tanzania
Malawi – Mozambique – Southern Tanzania
West and Central African humid areas
Central African humid areas below equator
Rivers effluents on Angola/Namibia/Botswana border
South Africa – Namibia – Botswana desert & steppe
Zimbabwe highland
South Africa – Lesotho – Swaziland
Awash river area
Table 3. Other groundwater uses (adapted from Pavelic et al., 2013).
Daily water
need
(L)
Portion assumed
to come from
groundwater (%)
Inhabitant
Inhabitant
50
25
75
75
Big ruminant
40
100
Small ruminant
Pig
Poultry
20
30
0.2
100
100
100
Uses/unit
Domestic
Industrial
Livestock
4
Calculation of groundwater irrigation potential
The GWIP (Eq. 1) is calculated using the maximum annual
estimate of irrigation water demand (Irrig. Water Demand)
over the 1960–2000 period for each cell. Hence, a conservative estimate of the irrigation potential is obtained. However,
rather than equally using the maximum values of groundwater availability (GW Available), a constant averaged annual value of this parameter was used. This in essence corresponds to smoothing out the variability in groundwater availability (and recharge) and accounting for the buffering efHydrol. Earth Syst. Sci., 19, 1055–1067, 2015
Irrigation
efficiency
(%)
60
70
50
50
45
50
50
50
50
80
50
80
50
50
50
45
45
45
50
65
60
60
50
fect of the resource. Hence, in low groundwater availability
years, regular water availability is assumed. If the average
GW Available is negative in a cell (due to persistent low
recharge years or high human and environmental demand),
the availability is set to zero for that cell.
For the Irrig. Water Demand (Eq. 3), annual values were
processed from aggregated monthly data of crop water demand for the individual crop groups within each cell, after
reducing by available green water for each particular month.
The share of each crop group within the crop group area is
accounted for (% of Area, Eq. 3). Since for each crop group,
up to two specific crops can be grown in rotation on the
same area but never concurrently (Supplement), the number
of crops (n, Eq. 3) in this case refers to the number of crop
groups, rather than specific crops. Similarly, the Crop Water
Demand refers to the sum of the crop water demand of the
actually grown crops in the crop group.
5
Results
The net irrigation water demand (Irrig. Water Demand × Irrig. Efficiency) is shown in Fig. 4. It is seen
(Fig. 4a) that the irrigation demand reflects primarily the
density of cropland (Fig. 1) and the aridity of the regions
(Fig. 4b). It also reflects the green water availability, which is
www.hydrol-earth-syst-sci.net/19/1055/2015/
Y. Altchenko and K. G. Villholth: A quantitative hydrological approach
1061
Figure 4. Estimated average net irrigation water demand (1960–2000) for the cropland in Fig. 1: (a) expressed in 106 m3 year−1 cell−1
(0.5◦ × 0.5◦ ) and (b) in mm year−1 .
higher in the equatorial regions, except in East Africa (Supplement).
The groundwater available for irrigation is the surplus
recharge after satisfying human and environmental groundwater needs (Eq. 1). This varies according to the three scenarios (Fig. 5). The total renewable groundwater availability for irrigation across the continent ranges from 692 (Scenario 1) to 1644 km3 year−1 (Scenario 3). Not surprisingly,
the availability is greater along an equatorial band across the
continent where rainfall and recharge are highest. It is also
seen that large parts of northern and southern Africa are devoid of excess recharge to enable irrigation from renewable
groundwater resources.
Converting the groundwater availability into GWIP in
terms of irrigable area, a similar pattern is found (Fig. 6).
The white areas in central Africa with zero potential correspond to areas with no cropland, essentially areas covered
by permanent forest. Appreciable hydrological potential exists for GWI across much of Africa, except for the most arid
regions and in the most southern part where demand from
other sectors compete with GWI (data not shown). Hence,
most regions in the Sahel and the eastern tract of the continent, from Ethiopia down to Zimbabwe, may provide significant unexploited opportunities for groundwater development
for agriculture, with up to all cropland, and sometimes more,
being irrigable from renewable groundwater. This benefit accrues from mostly supplementary GWI in the wet season as
well as mostly full GWI in the dry season. The maps also
indicate that relatively large disparities in GWIP exist within
individual countries, e.g. Ethiopia, Mozambique, Angola and
Tanzania. Potential hotspot areas should be further explored
in terms of other factors governing the potential for GWI development. Aggregating the GWIP across the continent, values range from 44.6 × 10⁶ ha to 105.3 × 10⁶ ha for the three
scenarios, corresponding to 20.5 to 48.5 % of the cropland.
www.hydrol-earth-syst-sci.net/19/1055/2015/
The GWIP for the 13 countries estimated by Pavelic et
al. (2013) (13.5 × 10⁶ ha) is here calculated to 17.1 × 10⁶ ha,
showing good correspondence between the methods, though
the present method does indicate the distributed extent of
GWIP across the countries and for the whole continent. In
Table 4, the GWIP for the individual countries in Africa are
given. The results show that the GWI area in Africa can
safely be expanded by a factor of 20 or more, based on the
conservative renewability and environmental requirements of
the resource and the present human demands, possibly with
wide livelihood benefits for smallholder farmers in many Sahel and semi-arid regions of eastern Africa. Comparing the
GWIP with the overall irrigation potential of 42.5 × 10⁶ ha
estimated by FAO (2005), it is clear that groundwater can
play a significant role in food production and food security
in large parts of Africa. While in such comparison, figures for
irrigation potential may not be simply additive due to overlap
of the resources and lack of cropland or other constraints, it is
clear that opportunities exist in the concurrent development
of both sources and some benefits are achievable in planning
schemes that are conjunctive (Evans et al., 2012).
Some blue areas with very high potential relative to the
cropland area (Fig. 6i), as seen in arid parts of South Africa,
Mali and Sudan can be explained by very small cropland
areas relative to the cell size. Hence, accumulated recharge
over the cell, albeit low in nominal terms, may be sufficient
to irrigate these areas.
In order to further analyse the GWIP, and explore the untapped part of the potential, the results are compared with
existing data on the present development of GWI across
Africa (Fig. 7). The map in Fig. 7a presents the best available
continent-wide data for areas equipped for GWI (Siebert et
al., 2010), while Fig. 7b shows the relative GWIP (in terms
of area) in Scenario 2 (the environmental groundwater requirements represent 50 % of recharge), expressed as the percentage of the data from Siebert. While this approach only
Hydrol. Earth Syst. Sci., 19, 1055–1067, 2015
1062
Y. Altchenko and K. G. Villholth: A quantitative hydrological approach
Figure 5. Average groundwater availability for irrigation (1960–2000), expressed in 106 m3 year−1 cell−1 (0.5◦ × 0.5◦ ), for various levels
of environmental groundwater requirements as a fraction of recharge: (a) Scenario 1: 70 %, (b) Scenario 2: 50 %, (c) Scenario 3: 30 %.
Figure 6. (I) Total area irrigable with groundwater inside a cell (0.5◦ × 0.5◦ ) in 103 ha and (II) proportion of cropland irrigable with groundwater, for various levels of environmental groundwater requirements as a fraction of recharge: (a) Scenario 1: 70 %, (b) Scenario 2: 50 %, (c)
Scenario 3: 30 %.
captures and compares areas having non-negative values for
present GWI development, it gives a clear indication of the
contrast across the continent with respect to the areas with
and without further GWIP (the non-red areas versus the red
areas). In northern and southern Africa the untapped development potential is very limited or patchy, while in western Africa and the eastern belt, still appreciable GWI development potential exists. These results also indicate that
presently GWI is mostly developed in regions with limited
Hydrol. Earth Syst. Sci., 19, 1055–1067, 2015
potential, and significantly in areas where groundwater is
non-renewable (like in northern Africa) or where limited uncommitted renewable groundwater resources exist. In fact,
the method also gave indications of where groundwater is
already over-allocated, based only on the human needs (let
alone irrigation and the environment) relative to the recharge.
This is generally not the case, but occurrences appear in
arid high-density livestock or populated parts of northeastern South Africa and southeastern North Sudan (data not
www.hydrol-earth-syst-sci.net/19/1055/2015/
Y. Altchenko and K. G. Villholth: A quantitative hydrological approach
1063
Table 4. Gross groundwater irrigation potential and cultivated area per country in Africa.
Algeria
Angola
Benin
Botswana
Burkina Faso
Burundi
Cameroon
Central African Republic
Chad
Côte d’Ivoire
Democratic Republic of Congo
Djibouti
Egypt
Equatorial Guinea
Eritrea
Ethiopia
Gabon
Gambia
Ghana
Guinea
Guinea-Bissau
Kenya
Lesotho
Liberia
Libya
Madagascar
Malawi
Mali
Mauritania
Morocco
Mozambique
Namibia
Niger
Nigeria
Republic of Congo
Rwanda
Senegal
Sierra Leone
Somalia
South Africa
South Sudan
Sudan
Swaziland
Tanzania
Togo
Tunisia
Uganda
Western Sahara
Zambia
Zimbabwe
Area of cropland
irrigable with
groundwatera (103 ha)
Siebert et
al. (2010)
FAO –
AQUASTATb
Scenario (Percentage
of groundwater
for environmental
requirements)
Area equipped
for irrigation
irrigated with
groundwater (103 ha)
Cultivated
land (103 ha)
362.1
16.0
2.2
0.7
3.0
0.0
1.0
0.0
6.0
0.0
0.0
1.0
331.9
0.0
16.2
2.6
0.0
0.0
12.0
0.5
4.9
1.0
0.1
0.0
464.0
0.0
0.0
1.0
4.8
677.2
0.6
1.6
1.4
66.8
0.0
0.1
10.2
0.2
10.0
127.3
0.2
69.0
1.0
17.5
0.1
257.0
0.1
0.0
6.7
20.0
8465
5190
3150
287
6070
1450
7750
1880
4932
7400
7810
2
3612
180
692
16 488
495
445
7400
3700
550
6130
285
710
2055
4110
3885
7011
411
9403
5950
809
16 000
41 700
600
1432
3415
1897
1129
12 413
2760c
13 893c
190
16 650
2850
5249
9150
4c
3836
4100
1 (30 %)
2 (50 %)
3 (70 %)
140
7032
518
66
268
214
7019
6961
566
2920
23 060
5
2
634
10
4336
5884
24
1426
2751
176
512
21
2238
26
6753
640
787
52
145
2171
98
19
6287
7420
148
382
1551
51
270
3042
429
21
3007
300
26
571
0
3952
370
94
5016
368
46
188
149
5005
4969
401
2078
16 450
3
2
453
7
3064
4202
17
1010
1962
125
355
15
1597
18
4814
454
559
37
97
1546
70
12
4446
5295
102
271
1107
35
181
2164
299
15
2135
213
17
399
0
2818
259
49
3001
218
27
108
84
2990
2978
237
1236
9840
2
1
271
4
1793
2520
10
594
1172
75
199
8
956
10
2875
268
331
22
49
921
41
6
2606
3170
56
160
662
20
95
1286
169
8
1263
126
9
228
0
1684
148
a Errors up to 35 % for small countries (due to the cell size, the projection used in GIS and the shape of the countries, i.e. Gambia);
b http://www.fao.org/nr/water/aquastat/countries_regions/index.stm; c estimated.
www.hydrol-earth-syst-sci.net/19/1055/2015/
Hydrol. Earth Syst. Sci., 19, 1055–1067, 2015
1064
Y. Altchenko and K. G. Villholth: A quantitative hydrological approach
Figure 7. (a) Area irrigated with groundwater in 2005 expressed in ha. per cell adapted from Siebert et al. (2010) and (b) groundwater
irrigation potential for Scenario 2 (the environmental groundwater requirements represent 50 % of the recharge) for the year 2000 expressed
as the percentage of the area irrigated with groundwater in 2005.
Table 5. Comparison of estimations of groundwater recharge for
selected African countries.
Country
Burkina Faso
Ethiopia
Ghana
Kenya
Malawi
Mali
Mozambique
Niger
Nigeria
Rwanda
Tanzania
Uganda
Zambia
6.1
Recharge (mm year−1 )
FAO,
AQUAStat (2009)a
Döll and
Fiedler (2008)b
This
paperc
34.6
18.1
110.3
6.0
21.1
16.1
21.3
2.0
94.2
265.8
31.7
122.9
62.4
39
39
105
46
164
22
104
12
163
68
93
95
108
39
80
127
29
170
23
82
4
154
78
90
50
117
a http://www.fao.org/nr/water/aquastat/main/index.stm (last accessed: 2 April 2014).
b Data as provided in Margat and Gun (2013). c Data calculated from the
PCR-GLOBWB model (Van Beek et al., 2011).
shown). An apparent artefact is discernible in the horn of
Africa. Here, appreciable GWI exists (Fig. 7a), while Fig. 1
shows no cropland. The explanation could be that areas in
this region are mostly irrigated pasture land, or pasture land
converted into irrigated cropland after the 2000 map of cropland (Fig. 1) was produced.
Hydrol. Earth Syst. Sci., 19, 1055–1067, 2015
6
Discussion
Uncertainty and variability of recharge and
environmental requirements
In assessing the confidence of the methodology presented,
the uncertainty and temporal variability of recharge as well
as the uncertainty of the environmental requirements need to
be taken into consideration. Table 5 summarizes estimations
of groundwater recharge for a number of African countries
from different sources. It shows that the annual recharge estimation from the hydrological model PCR-GLOBWB (this
paper) is quite similar to the one estimated from the WaterGAP Global Hydrology Model (WGHM) (Döll and Fiedler,
2008) while there is more discrepancy with the FAO data set.
Since the GWIP is strongly dependent on the recharge, this
uncertainty will be reflected in the GWIP.
The maps in Fig. 8 present the average annual recharge
(Fig. 8a) and the coefficient of variation of the recharge
(Fig. 8b) of the 41-year simulation period. The coefficient
of variation shows clearly that the areas where the recharge
is smaller (say less than 50 mm per year) also have the highest variability over the years. In these areas, recharge can vary
from zero to double of the average recharge (dark red colour).
The results indicate that where groundwater recharge is sufficient to support GWI in these areas, it is likely to be a very
strategic resource in buffering seasonal and inter-annual climate variability. Secondly, the actual buffering capacity of
groundwater, which is governed by the longer-term storage
capacity of the aquifers, more so than the recharge, becomes
equally important in these areas and needs to be addressed
in further and more detailed assessments. In the present approach, buffering of the groundwater is only considered by
using the long-term average GW Available in Eq. (1), as explained in the Sect. 4. Similarly, the buffering capacity of
www.hydrol-earth-syst-sci.net/19/1055/2015/
Y. Altchenko and K. G. Villholth: A quantitative hydrological approach
1065
Figure 8. Average annual recharge (mm year−1 ) and (b) its coefficient of variation (%), both over the period 1960–2000 (data from Van
Beek et al., 2011).
Table 6. Aggregated groundwater available (km3 year−1 ) for the three environmental scenarios.
Scenario 1
Min.∗
442.2
Average
692.1
Scenario 2
Max.∗
990.1
Min.
751.1
Average
1168.3
Scenario 3
Max.
1664.9
Min.
1006.1
Average
1644.5
Max.
2339.7
∗ Min. and Max. refers to minimum and maximum annual values over the 41 years.
groundwater in a spatial sense was applied in assuming that
all recharge in a cell can be captured anywhere in that cell.
The uncertainty associated with the environmental requirements relates to the lack of knowledge of the location and functioning of ecosystems dependent on groundwater throughout Africa and their groundwater requirements in
quantitative terms. Such ecosystems and their requirements
may depend on the hydrogeological setup of an area, the
scale of the aquifers, and the climate (Tomlinson, 2011).
However, in the absence of better understanding and tested
approaches, the three scenarios approach was used (Pavelic
et al., 2013). When comparing the uncertainty related to the
scenarios in terms of the GW Available (Table 6) (about
480 km3 year−1 , as calculated from the difference between
the averages of Scenario 2 and 1, and Scenario 2 and 3,
respectively), and the uncertainty related to the recharge
(estimated from the range between the average and min.
and average and max. annual GW Available for Scenario 2,
which is 417 and 496 km3 ) it is apparent that the uncertainty
on groundwater availability related to the environmental requirements is of the same order of magnitude as the effect of
the temporal variability of recharge.
6.2
Limitations of approach
The water balance approach considers locally renewable
groundwater availability as the major controlling parameter
for GWIP and assumes non-limiting conditions in terms of
www.hydrol-earth-syst-sci.net/19/1055/2015/
other fundamental physical properties, e.g. soil and water
quality, terrain slope, and groundwater accessibility (as determined by e.g. depth of the usable aquifer, storage available for recharge, and well yields) for the implementation of
GWI. Considering an average landholding size of 1 ha with
a single well, or alternatively 1 well per hectare for landholdings larger than 1 ha, over the continent and the gross
irrigation water demand per year varying between 235 and
3000 mm per year, with the cropping pattern applied in the
present study, an average cropping season of 240 days of
daily irrigation for 8 h, this translates into a required well
yield varying from 0.3 to 4.3 L s−1 . Comparing this with
continental-wide maps of well yields (MacDonald et al.,
2012), it is evident that in certain geological formations, like
the basement rock aquifers, that occupy 34 % of the continent
(Adelana and MacDonald, 2008), the yield of the geological
substrata may in places be limiting for larger scale or very
intensive GWI development.
The GWIP was conceived strictly in terms of the quantitative availability of renewable groundwater. Possible constraints related to hydrogeology as well as water quality
and socioeconomic conditions, such as infrastructure (roads,
markets, energy/electricity) or intuitional/farmer capacities
may further reduce this potential or hamper its realization
as will be further analysed in a companion paper. Rapid assessment of borehole yields indicated a possible limitation
Hydrol. Earth Syst. Sci., 19, 1055–1067, 2015
1066
Y. Altchenko and K. G. Villholth: A quantitative hydrological approach
due to the hydrogeological transmitting properties in certain
regions.
Furthermore, climate trends and progressive water demands from growing human and livestock populations have
not been considered. For these reasons, it is suggested to
apply the most conservative estimates (i.e. Scenario 1) for
a robust estimate of hydrological GWIP. Likewise, historic
and potential future changes in cropping patterns and irrigation efficiencies have not been considered though they could
significantly enhance the groundwater availability, through
increasing the green water availability (by shifting the unproductive part to productive), and hence the potential for
irrigation. In essence, the method is a snapshot continental
distributed view of present or most recent GWIP, based on
averaged hydrological conditions and best available most recent coherent data sets. However, the influence of cropping
choice was clearly demonstrated in Pavelic et al. (2013).
They showed that going from a 1000 mm year−1 irrigation
demand to a 100 mm year−1 crop, everything else being
equal, entailed an order of magnitude higher GWIP.
7
Conclusions
The present study has estimated the extent and distribution of groundwater irrigation potential (GWIP) across the
African continent (0.5◦ resolution), based on the hydrologically available and renewable groundwater over a 41-year
recent historic period and using crop and cropland data from
the beginning of the century. The GWIP is assessed to be between 44.6 × 10⁶ ha and 105.3 × 10⁶ ha, depending on the
proportion of recharge assumed allocated preferentially to
the environment (30–70 %), while assuming constant human
needs for groundwater. This is a gross estimate, disregarding
existing groundwater irrigation (GWI). However, with the
present GWI area amounting to approximately 2 × 10⁶ ha,
the difference between net and gross potential is small. However, comparing GWIP to existing maps of GWI, it is clear
that present GWI has been primarily developed in northern
and southern Africa where the development potential is relatively limited, and where it is governed by abstraction from
non-renewable or already stressed resources, from recharge
from larger rivers like the Nile, or return flows from surface
water schemes, while the rest of the continent (except for the
Sahara region) still has appreciable potential, especially and
most relevantly for smallholder and less intensive GWI in the
semi-arid Sahel and east Africa regions. This could significantly increase the food production and productivity in the
region from a reliable and renewable resource.
The Supplement related to this article is available online
at doi:10.5194/hess-19-1055-2015-supplement.
Hydrol. Earth Syst. Sci., 19, 1055–1067, 2015
Acknowledgements. Rens Van Beek, Geosciences – Utrecht
University, kindly provided data from the PCR-GLOBWB model.
Agnès Ducharne, Laboratoire METIS – Université Pierre et Marie
Curie – Paris, provided critical view, specifically on Crop Water
Demand. The work has been partially funded by the French
Ministry of Agriculture and by USAID (Enhanced Regional Food
Security through Increased Agricultural Productivity to Sustainably
Reduce Hunger project of the USAID Southern Africa Feed The
Future (FTF) programme (2012–2013)). It was also supported
by CGIAR Strategic Research Program on Water, Land and
Ecosystems (WLE).
Edited by: M. Vanclooster
References
Adelana, S. M. A. and MacDonald, A. M.: Groundwater research issues in Africa, in: Applied Groundwater Studies in Africa, edited
by: Adelana, S. M. A. and MacDonald, A. M., IAH Selected Papers on Hydrogeology, no. 13, Ch. 1, CRC Press, Taylor & Francis Group, London, UK, 507 pp., 2008.
Awulachew, S. B., Erkossa, T., and Namara, R. E.: Irrigation Potential in Ethiopia – Constraints and Opportunities for
Enhancing the System, International Water Management Institute, available at: http://www.ata.gov.et/wp-content/uploads/
Ethiopia-Irrigation-Diagnostic-July-2010.pdf (last access: 20
May 2014), 59 pp., 2010.
CAADP (Comprehensive African Agriculture Development Programme): Sustainable Land and Water Management, The
CAADP Pillar I Framework, available at: http://www.caadp.net/
pdf/CAADPPillar1Framework.pdf (last access: 21 May 2014),
76 pp., 2009.
Döll, P. and Fiedler, K.: Global-scale modeling of groundwater recharge, Hydrol. Earth Syst. Sci., 12, 863–885,
doi:10.5194/hess-12-863-2008, 2008.
Evans, W. R., Evans, R. S., and Holland, G. F.: Conjunctive use and
management of groundwater and surface water within existing irrigation commands: the need for a new focus on an old paradigm.
Thematic Paper 2. Groundwater Governance: A Global Framework for Country Action, GEF ID 3726, 48 pp, 2012.
Falkenmark, M. and Rockström, J.: The new blue and green water paradigm: Breaking new ground for water resources planning
and management, J. Water Resour. Plann. Manage., 132, 129–
132, 2006.
FAO: Irrigation Water Management: Irrigation Water Need, Training Manual no. 3, edited by: Brouwer, C. and Heibloem, M.,
Food and Agriculture Organization of United Nations, Rome,
Italy, 102 pp., 1986.
FAO: Irrigation Water Management: Irrigation Scheduling, Training
Manual no. 4, edited by: Brouwer, C., Prins, K., and Heibloem,
M., Food and Agriculture Organization of United Nations, Rome,
Italy, Land and Water Development Division, 66 pp., 1989.
FAO: Crop Water Requirements, FAO Irrigation and Drainage Paper
no. 24, edited by: Doorenbos, J., Pruitt, 5 W. O., Aboukhaled, A.,
Damagnez, J., Dastane, N. G., Van den Berg, C., Rijtema, P. E.,
Ashford, O. M., and Frere, M., Food and Agriculture Organization of United Nations, Land and Water Development Division,
Rome, Italy, 144 pp., 1992.
www.hydrol-earth-syst-sci.net/19/1055/2015/
Y. Altchenko and K. G. Villholth: A quantitative hydrological approach
FAO: Irrigation Potential in Africa: a Basin Approach, FAO Land
and Water Bulletin 4, Food and Agriculture Organization of
United Nations, Land and Water Development Division, Rome,
Italy, 177 pp., 1997.
FAO: Irrigation in Africa in Figures, AQUASTAT Survey – 2005,
FAO Water Reports no. 29, Food and Agriculture Organization of the United Nations, Rome, available at: ftp://ftp.fao.org/
agl/aglw/docs/wr29_eng.pdf (last access: 20 May 2014), 74 pp.,
2005.
FAO: Population density (persons/km2), available at:
http://www.fao.org/geonetwork/srv/en/resources.get?id=
30586&fname=poprecl_ASCII.zip&access=private (last access: 31 March 2014), 2007a.
FAO: Gridded livestock of the world, available at: http://www.fao.
org/ag/againfo/resources/en/glw/GLW_dens.html (last access:
31 March 2014), 2007b.
Foster, S. and Perry, C.: Improving groundwater resource accounting in irrigated areas: a prerequisite for promoting sustainable
use, Hydrogeol. J., 18, 291–294, 2010.
MacDonald, A. M., Calow, R. C., Nicol, A. L., Hope, B., and
Robins, N. S.: Ethiopia: water security and drought, Technical
Report WC/01/02, British Geological Survey, Nottingham, available at: http://nora.nerc.ac.uk/501045/1/Ethiopia_map.pdf (last
access: 20 May 2014), 2001.
MacDonald, A. M., Bonsor, H. C., Dochartaigh, B. É. Ó., and
Taylor, R. G.: Quantitative maps of groundwater resources
in Africa, Environ. Res. Lett., 7, 024009, doi:10.1088/17489326/7/2/024009, 2012.
Margat, J. and Van der Gun, J.: Groundwater Around the World: a
Geographic Synopsis, CRC Press, Taylor & Francis Group, London, UK, 376 pp., 2013.
MoAC (Ministry of Agriculture and Co-operatives): The Republic of Zambia: National Agriculture Policy 2004/2015, 54 pp.,
available at: http://www.gafspfund.org/sites/gafspfund.org/files/
Documents/5.Zambia_strategy.pdf (last access: 4 April 2014),
2004.
MoFED (Ministry of Finance and Economic Development): The
Federal Democratic Republic of Ethiopia: Growth and Transformation Plan (GTP) 2010/11–2014/15 Draft, September 2010,
Addis Ababa, 85 pp., 2010.
MoFA and GIDA (Ministry of Food and Agriculture and Ghana
Irrigation Development Authority): National Irrigation Policy,
Strategies and Regulatory Measures, GIDA, Accra, available at: http://mofa.gov.gh/site/wp-content/uploads/2011/07/
GHANA-IRRIGATION-DEVELOPMENT-POLICY1.pdf (last
access: 20 May 2014), 37 pp., 2011.
MoIWD (Ministry of Irrigation and Water Development):
The Republic of Malawi: National Water Policy, Lilongwe,
available
at:
http://www.moafsmw.org/KeyDocuments/
NationalWaterPolicyFINAL.pdf (last access: 4 April 2014),
2005.
MoWEA (Ministry of Water and Environmental Affairs):
The Republic of South Africa: National Water Resource
Strategy, Department of Water Affairs, available at:
http://www.dwaf.gov.za/nwrs/LinkClick.aspx?fileticket=u_
qFQycClbI%3d&tabid=91&mid=496 (last access: 4 April
2014), 2013.
www.hydrol-earth-syst-sci.net/19/1055/2015/
1067
Monfreda, C., Ramankutty, N, and Foley, J. A.: Farming the planet:
2. Geographic distribution of crop areas, yields, physiological
types, and net primary production in the year 2000, Global Biogeochem. Cy., 22, GB1022, doi:10.1029/2007GB002947, 2008.
NEPAD (New Partnership for Africa’s Development): Comprehensive Africa Agriculture Development Programme, available
at: http://www.nepad.org/system/files/caadp.pdf (last access: 20
May 2014), 102 pp., 2003.
Pavelic, P., Smakhtin, V., Favreau, G., and Villholth, K. G.: Waterbalance approach for assessing potential for smallholder groundwater irrigation in Sub-Saharan Africa, Water SA, 38, 399–406,
doi:10.4314/wsa.v38i3.5, 2012.
Pavelic, P., Villholth, K. G., Smakhtin, V., Shu, Y., and Rebelo, L.
M.: Smallholder groundwater irrigation in Sub-Saharan Africa:
country-level estimates of development potential, Water Int., 38,
392–407, doi:10.1080/02508060.2013.819601, 2013.
Portmann, F. T., Siebert, S. and Döll1, P.: MIRCA2000 – Global
monthly irrigated and rainfed crop areas around the year
2000: A new high-resolution data set for agricultural and
hydrological modelling, Global Biochem. Cy., 24, GB1011,
doi:10.1029/2008GB003435, 2010.
Ramankutty, N., Evan, A., Monfreda, C., and Foley, J.: Farming the planet: 1. Geographic distribution of global agricultural
lands in the year 2000, Global Biogeochem. Cy., 22, GB1003,
doi:10.1029/2007GB002952, 2008.
Savenije, H. H. G.: The importance of interception and why we
should delete the term evapotranspiration from our vocabulary,
Hydrol. Process., 18, 1507–1511, 2004.
Siebert, S., Burke, J., Faures, J. M., Frenken, K., Hoogeveen, J.,
Döll, P., and Portmann, F. T.: Groundwater use for irrigation
– a global inventory, Hydrol. Earth Syst. Sci., 14, 1863–1880,
doi:10.5194/hess-14-1863-2010, 2010.
Tomlinson, M.: Ecological Water Requirements of Groundwater
Systems: a Knowledge and Policy Review, Waterlines Report Series No. 68, National Water Commission, Canberra, Australia,
December 2011, 134 pp., 2011.
Van Beek, L. P. H., Wada, Y., and Bierkens, M. F. P.: Global monthly
water stress: I. Water balance and water availability, Water Resour. Res., 47, W07517, doi:10.1029/2010WR009791, 2011.
Villholth, K. G.: Groundwater irrigation for smallholders in
Sub-Saharan Africa – a synthesis of current knowledge
to guide sustainable outcomes, Water Int., 38, 369–391,
doi:10.1080/02508060.2013.821644, 2013.
Wada, Y., Van Beek, L, Viviroli, D., Dürr, H., Weingartner, R., and
Bierkens, M.: Global monthly water stress: 2. Water demand
and severity of water stress, Water Resour. Res., 47, W07517,
doi:10.1029/2010WR009792, 2011.
You, L., Ringler, C., Nelson, G., Wood-Sichra, U., Robertson, R.,
Wood, S., Guo, Z., Zhu, T., and Sun, Y.: What Is the Irrigation Potential for Africa? A Combined Biophysical and Socioeconomic Approach, IFPRI Discussion Paper 00993, June
2010, IFPRI, available at: http://www.ifpri.org/sites/default/files/
publications/ifpridp00993.pdf (last access: 20 May 2014), 2010.
Hydrol. Earth Syst. Sci., 19, 1055–1067, 2015


© Copyright 2026