
Compression algorithms reduce the redundancy in
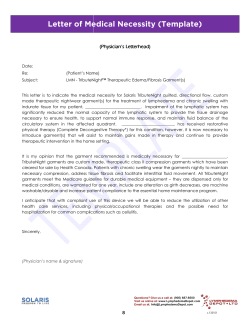
CHAPTER –I
INTRODUCTION
1.1 INTRODUCTION
Compression algorithms reduce the redundancy in data representation to decrease the
storage required for that data. Data compression offers an attractive approach to reduce
communication costs by using available bandwidth effectively. Over the last decade, there
has been an unprecedented explosion in the amount of digital data transmitted via the
Internet. The advent of office automation systems and newspaper, journal and magazine
repositories have brought the issue of maintaining archival storage for the search and retrieval
to the forefront of research. As an example, the Text REtrieval Conference (TREC) data base
holds around 800 million static pages having 6 trillion bytes of plain text equal to the size of a
million books. Text compression is concerned with techniques for representing the digital
data in alternative representations that take less space. It not only helps to conserve the
storage space for archival and online data, but also it helps system performance by using less
secondary storage access and improves network transmission bandwidth utilization by
reducing the transmission time.
Data compression methods are generally classified into Lossless and Lossy [22][72].
Lossless compression allows the original data to be recovered exactly [117][58]. The
Lossless compressions are useful in special classes of images such as medical imaging,
fingerprint data, astronomical images and database containing mostly vital numerical data,
tables and texts used for video, audio and still image applications. The deterioration of the
quality of Lossy images is usually not detectable by human perceptual system, and the
compression exploits this by process called “Quantization” to achieve compression by a
factor of ten to a factor of couple hundreds. Understanding the importance of Lossless
methods for both Lossy and Lossless compression application, Lossy algorithm may use
them at the final stage of the encoding.
One of the main aims of the computational complexity theory is to determine upper
and lower bounds on the amount of resources required to solve a computational problem. The
resources considered most commonly are time and space. However, several agents are
required to arrive at an answer to a problem which also requires the distribution of the input
1
among them. The amount of computation often required to determine the solution becomes
efficient, only when it evaluates the computational complexity. When the compression
algorithm does not satisfy ability, the factors like Compression Ratio, Compression Factor
and Saving Percentage need to be considered. Various parameters which are used to measure
the performance and ability of data compression algorithms are discussed in this chapter. The
purpose of this thesis is to reexamine the selected algorithms like (Huffman coding, Lempel
Ziv 77 (LZ77), Run length encoding (RLE), Arithmetic Coding and Lempel Ziv Welch
(LZW)), and the performance is evaluated on the basis of parameters like Compression Ratio,
Compression Factor and Saving Percentage. From this reexamination, the LZW data
compression algorithm is found best. This thesis presents the novel approach to optimal
reduction in computational complexity of LZW algorithm. This chapter of the thesis briefly
explains the compression types, compression measuring parameters, the dataset used for the
experimentation and basic concepts of data compression theory.
1.2 OBJECTIVE OF THESIS
Objective of thesis is discussed as below:
To study in detail the famous Lossless data compression algorithms
To analyze problem of existing compression algorithms, various parameters used and
tested.
To analyze the computational complexity of LZW, all famous data structures are used
for experimentation in the LZW architecture.
To improve the performance of Binary search, a new algorithm is proposed called
Binary insertion sort.
To improve the performance of Data structures, a new clustering algorithm is
designed and proposed.
To design and develop a new algorithm to reduce the computational complexity of
LZW, the proposed clustering algorithm and multiple dictionaries are combined.
2
1.3 INFORMATION THEORY AND BACKGROUND
The Lossy and Lossless data compression algorithms applied key role in information
technology, especially in data transfer through networks and memory utilization.
1.3.1 HISTORY OF DATA COMPRESSION
Morse code[5], invented in 1838 for use in telegraphy, is an early example of data
compression based on using shorter code words for letters such as "e" and "t" that are more
common in English. Modern work on data compression began in the late 1940s with the
development of information theory. In 1949, Claude Shannon [103] and Robert Fano [27]
devised a systematic way to assign code words based on probabilities of blocks. An optimal
method for doing this was found by David Huffman in 1951 [41]. Early implementations
were typically done in hardware, with specific choices of code words made as compromises
between compression and error correction. In the mid-1970s, this idea emerged from
dynamically updating code words for Huffman encoding, based on the actual data
encountered. In the late 1970s, online storage of text files became common, software
compression programs began to develop, and almost all based on adaptive Huffman coding.
In 1977, Abraham Lempel and Jacob Ziv suggested the basic idea of pointer-based encoding.
In the mid-1980s, [44] following the work of Terry Welch [121], the work is called LZW
[121] algorithm rapidly became the method of choice for most general-purpose compression
systems. It was used in the program PKZip (Phil Katz), and in hardware devices such as
modems. In the late 1980s, digital images became more common, and standards for
compressing them emerged. In the early 1990s, Lossy compression methods (to be discussed
in the next section of this chapter) also began to be used widely. Current image compression
standards include: FAX CCITT 3 (Facsimile International Telegraph and Telephone
Consultative Committee), RLE (Run-Length Encoding) with code words determined by
Huffman coding from a definite distribution of run lengths; Graphics Interchange Format
(GIF) (LZW); JPEG (Lossy discrete cosine transform, Huffman or arithmetic coding);
BitMaP (Run-Length Encoding, etc.); Tagged Image File Format (TIFF) (FAX, Joint
Photographic Experts Group (JPEG), GIF, etc.). Typical compression ratios currently
achieved for text are around 3:1, for line diagrams and text images around 3:1, and for
photographic images around 2:1 Lossless, and 20:1 Lossy. The Mathematical notations used
throughout the thesis are described in definition 1.
3
DEFINITION 1
The following may be assumed as the input sequence = , … . The
sequence length is denoted by n or|| , i.e., a total number of elements in X. denotes the
element of X. The element belongs to the finite ordered set = , … that
is called an alphabet with the corresponding probabilities = , … . The number
of elements in is the size of the alphabet denoted by, the elements of the alphabet are
called symbols or characters. Let be the weight, or probability of . The sequence after
compression is = , … where or || is the length of input sequence. =
̅ , ̅ … ̅
is the sequence after decompression, the size of the sequence is || and the time
taken is denoted by. ((||)) represent Minimum time taken by the algorithm for
encode |X| and ((||)) represents Maximum time taken by the algorithm for encode
|X|. ((||)) Represent Minimum time taken by the algorithm for decode |C| and
((||)) represents Maximum time taken by the algorithm for decode |C|. D is used to
represent the dictionary with the size |D|, when the algorithm uses many dictionaries, then
number of dictionaries is denoted by m i.e., 1 to M. The length of each dictionary |# | =
where = 1,2, … , and∑
* = '() ∑
*|# | = |+|. ,Indicate empty or null
dictionary, initially each|+ | = ,, and m is the number of non-empty dictionary. Only non-
empty dictionaries are considered to measure computational cost. K indicates number of
clusters, where indicates Cluster and ranges from 1 to K, - indicates the Index cluster and is ranges from 1 to K, where each cluster size is denoted by| |.
1.4 DATA COMPRESSION
In general, data compression consists of taking a stream of symbols in X and
transforming them into codes. If the compression is effective, the resulting stream of codes is smaller than the original symbols i.e.,|| < || [117][58][3][72]. The decision to generate
an output of a certain code or certain symbols or a set of symbols is based on a model. The
model is simply the collection data rules used to process input symbols and determines which
code to be transformed. A program uses the model to accurately define the probabilities for
each symbols and coder to produce an appropriate code based on those probabilities P.
Decompression is a process of transforming the code C to , in other words representing the
codes to the original. The figure 1.1 shows the statistical model of encoder and decoder:
4
Figure 1.1 Statistical Models of Encoder and Decoder.
1.5 CLASSIFICATION OF DATA COMPRESSION ALGORITHMS.
The classification of data compression algorithms is purely based on the amount of
data lost during decoding [72]. Primary classification of compression algorithm is listed
below.
•
Lossless compression
•
Lossy compression
The Lossless algorithm can be classified into three broad categories: statistical
methods, dictionary methods, and transform based methods. The classification of algorithms
is shown in figure 1.2.
1.5.1 LOSSLESS DATA COMPRESSION ALGORITHM
Lossless data compression is a class of data compression algorithm that allows the
exact original data to be reconstructed from the compressed data. The term Lossless is in
contrast to Lossy data compression, which only allows constructing an approximation of the
original data, in exchange for better compression rates.
Lossless data compression is used in many applications. For example, it is used in the
ZIP file format, and in the UNIpleXed Information and Computing System (UNIX) tool Gnu
ZIP (GZIP). It is often used as a component within Lossy data compression technologies (e.g.
Lossless mid/side joint stereo preprocessing by the LAME MP3 encoder and other Lossy
audio encoders).
5
Figure 1.2 Data Compression Classification Chart
Lemma 1: The compression is Lossless thenD(̅ , ) = 0
Proof: Function D is used to calculate the difference between |X| and||, where =
1,2 … and |X|1|| = 0 . Then2(̅ 1 ) 3 (̅ 1 ) 3 ⋯ 3 (̅
1 )5 = 0, as the
percentage of loss is nil, these algorithms come under Lossless data compression.
Lossless compression is used in cases where it is important that the original and the
decompressed data are to be identical, or where deviations from the original data could be
deleterious. Typical examples are executable programs, text documents, and source code.
Some image file formats, like Portable Network Graphics (PNG) or GIF, use only Lossless
6
compression, while others like TIFF may use either Lossless or Lossy method. Lossless audio
formats are most often used for archiving or production purposes, with smaller Lossy audio
files are being typically used on portable players and in other cases where storage space is
limited or exact replication of the audio is unnecessary.
1.5.1.1 DICTIONARY BASED DATA COMPRESSION ALGORITHM
A dictionary coder[72], also sometimes known as a substitution coder, is a class of
Lossless data compression algorithms which operate by searching for matches between the
text to be compressed and a set of strings contained in a data structure (called the 'dictionary')
maintained by the encoder. When the encoder finds such a match, it substitutes a reference to
the string's position in the data structure.
Some dictionary coders use a 'static dictionary', one whose full set of strings is
determined before coding begins and does not change during the coding process. This
approach is most often used when the message or set of messages to be encoded is fixed and
large. For instance, an application that stores the contents of the Bible in the limited storage
space of a Personal Digital Assistant (PDA) generally builds a static dictionary from a
concordance of the text and then uses that dictionary to compress the verses. This scheme of
using Huffman coding to represent indices into a concordance is called “Huff word”.
Most common methods of the dictionary start with some predetermined state;
however the contents change during the encoding process, based on the data that have already
been encoded. Both the Lempel Ziv 77 (LZ77) and Lempel Ziv 78 (LZ78) algorithms work
on this principle. In LZ77, a data structure called the "sliding window" is used to hold the last
N bytes of data processed; this window serves as the dictionary, effectively storing every
substring that appeared in the past N bytes as dictionary entries. Instead of a single index
identifying a dictionary entry, two values are needed: the length indicates the length of the
matched text, and the offset (also called the distance) indicates that the match is found in the
sliding window starting offset bytes before the current text.
LZ78 uses a more explicit dictionary structure. At the beginning of the encoding
process, the dictionary only needs to contain entries for the symbols of the alphabet used in
the text to be compressed, but the indexes are numbered so as to leave spaces for many more
entries. At each step of the encoding process, the longest entry in the dictionary that matches
7
the text is found, its index is written to the output, and the combination of that entry and the
character that followed it in the text is then added to the dictionary as a new entry. Lossless
compression algorithms usually exploit statistical redundancy in such a way as to represent
the sender's data more concisely, but nevertheless perfectly. Lossless compression is possible
because most real-world data has statistical redundancy. For example, in English text, the
letter 'e' is more common than the letter 'z', and the probability that, the letter 'q' will be
followed by the letter 'z' is very less.
1.5.1.2 STATISTICAL BASED DATA COMPRESSION ALGORITHM
The other type is called statistical based data compression algorithm [3][72].
Statistical algorithm uses a static table of probabilities. For example, Huffman tree considered
significant, so it was frequently performed. Instead, representative blocks of data analyzed
once, giving table of character frequency counts. Huffman encoding / decoding trees then
built and stored. Compression programs had access to this static model and would compress
data using it. Using a universal static model has limitations. If an input stream X does not
match well with the previously accumulated statistics, the compression ratio will be degraded
– possibly to the point where the output stream C becomes larger than the input stream X.
Building static table for each file to be compressed has its own advantages. As the table is
uniquely adapted to that particular file, it will give better compression than the universal
table. But there may be some additional overhead since the table (or the statistics used to
build the table) has to be passed to the decoder ahead of the compressed code stream.
For an order- 0 compression table, the actual statistics used to create the table may
take up as little as 256 bytes – not a very large amount of overhead. But tracing to achieve
better compression through use of a higher order table will make the statistics that need to be
passed to the decoder at an alarming rate. One model can be boosted to the statistics table
from 256 to 65536 bytes. The compression ratio will undoubtedly improve when moving to
order-1, the overhead of passing the statistics table will probably wipe the gains. For this
reason, compression research in the last 10 years has concentrated on adaptive models. The
most famous statistical coders are Huffman coding and Shannon-Fano coding, etc.
8
1.5.1.3 TRANSFORMATION BASED DATA COMPRESSION ALGORITHM
The word “transform” is used to describe this method because the X undergoes some
transformation, which performs permutations of the each in the X, so that X having the
similar lexical context will be clustered together in the output. Given the X, the forward,
Burrows-Wheeler Transformation (BWT) [13] forms all cyclic rotation of in the X in the
form of matrix M, whose rows are lexicographically stored (which specify ordering of
symbols in X). The last column L of this sorted M and an index r of the row, where the
original text in this M is output as transform. The X is divided into blocks or the entire X
could be considered as one block. The transformation is applied to individual blocks
separately, by this reason this type of algorithms referred as block sorting [29].
The
repetition of the same character in the block may slow the sorting process. To avoid this, Run
Length Encoding step may precede the transform. The Bzip2 algorithm based on the
transformation uses the following steps: the output of BWT algorithm undergoes a final
transformation using Move To Front (MTF) encoding or Distance Coding (DC) [9], which
exploits the clustering of character in the BWT output to generate a sequence of numbers
dominated by small values. This sequence sends to entropy coder (Huffman or Arithmetic)
to obtain the final compressed form. The inverse operation of recovering from the C proceeds
by decoding the inverse of the entropy decoder, the inverse of MTF or DC, and then the
inverse of BWT. The inverse of BWT obtains || where = ||.
1.5.2 LOSSY DATA COMPRESSION ALGORITHM
In Lossy data compression, the decompressed data need not be exactly same as the
original data. Often, it suffices to have a reasonably close approximation. A distortion
measure is a mathematical entity which specifies exactly how close the approximation is
[103]. Generally, it is a function which assigns to any two letters and ̅ in the alphabet, a
non-negative number, denoted as
#(, ̅ ) ≥ 0
(1.1)
Here, is the original data, 8 is the approximation, and #(, ̅ ) is the amount of
distortion between and̅ . The most common distortion measures are the Hamming
distortion measures:
9
#(, ̅ ) = 9
0: = ̅ 1: ≠ ̅
(1.2)
Lossy data compression is contrasted with Lossless data compression. In these
schemes, some loss of information is acceptable. Depending upon the application, details can
be dropped from the data to save storage space. Generally, Lossy data compression schemes
are guided by research on how people perceive the data in question. For example, the human
eye is more sensitive to subtle variations in luminance than in color. JPEG image
compression works in part by "rounding off" less-important visual information. There is a
corresponding trade-off between information lost and size reduction. A number of popular
compression formats exploit these perceptual differences, including those used in music files,
images, and video.
Lossy image compression can be used in digital cameras, to increase storage
capacities with minimal degradation of picture quality. Similarly, Digital Video Discs
(DVDs) use the Lossy Motion Picture Experts Group (MPEG)-2 Video codec for video
compression. In Lossy audio compression, methods of psychoacoustics are used to remove
non-audible (or less audible) components in the signal. Compression of human speech is
often performed with even more specialized techniques, so that "speech compression" or
"voice coding" is sometimes distinguished as a separate discipline from "audio compression".
Different audio and speech compression standards are listed under audio codes. Voice
compression is used in Internet telephony. For example, while audio compression is used for
Compactable Disk (CD) ripping and it is decoded by audio players.
Lemma 2: The compression is Lossy D(̅ , ) ≠ 0
Proof: Function D is used to calculate the difference |X| and||, where = 1,2 … and
|X|1|| may or may not be zero. Then2(̅ 1 ) 3 (̅ 1 ) 3 ⋯ 3 (̅
1 )5 < 0() >
0. As the percentage of loss of original symbols is not nil, these algorithms come under Lossy
data compression.
1.6 PARAMETERS TO MEASURE THE PERFORMANCE OF COMPRESSION ALGORITHMS
Depending on the nature of the application there are various criteria to measure the
performance of a compression algorithm. When measuring the performance, the main
10
concern would be the space efficiency. The time efficiency is another factor. Since the
compression behavior depends on the redundancy of the symbols in X, it is difficult to
measure the performance of a compression algorithm in general. The performance depends
on the type and the structure of the input source. Additionally the compression behavior
depends on the category of the compression algorithm: Lossy or Lossless. If a Lossy
compression algorithm is used to compress a particular source file, the space efficiency and
time efficiency would be higher than Lossless compression algorithm. Thus measuring a
general performance is difficult and there should be different measurements to evaluate the
performances of those compression families. Following are some measurements used for
evaluating the performance of Lossless algorithms.
COMPRESSION RATIO - Data compression ratio [42], also known as compression power, is a
computer-science term used to quantify the reduction in data-representation size produced by
a data compression algorithm. The data compression ratio is analogous to the physical
compression ratio used to measure physical compression of substances, and is defined in the
same way, as the ratio between the compressed size and the uncompressed size.
(1.3)
|@|
()=>>( ?( = |A|
Thus a representation that compresses a 10 MB file to 2 MB has a compression ratio
of 2/10 = 0.2, often notated as an explicit ratio, 1:5 (read "one to five"), or as an implicit ratio,
1/5. Note that this formulation applies equally for compression, where the uncompressed size
is that of the original; and for decompression, where the uncompressed size is that of the
reproduction.
COMPRESSION FACTOR -Compression Factor is the inverse of the compression ratio, i.e., the
ratio between the size of the source file and the size of the compressed file:
()=>>( CD() =
(1.4)
|E|
|@|
SAVING PERCENTAGE - Saving Percentage calculates the shrinkage of the source file as a
percentage:
GH I=)D= I= = 1 1
11
||
|X|
(1.5)
COMPRESSION
AND DECOMPRESSION
TIME - All the above methods evaluate the
effectiveness of compression algorithms using file sizes. There are some other methods to
evaluate the performance of compression algorithms. Compression time, computational
complexity and probability distribution are also used to measure the effectiveness. Time
taken for the compression and decompression should be considered separately. In some
applications like transferring compressed video data, the decompression time is more
important. In some cases both compression and decompression time are equally important. If
the compression and decompression time of an algorithm is less or acceptable level, it implies
that the algorithm is acceptable with respective to the time factor. With the development of
high speed computer accessories this factor may give very small values and those may
depend on the performance of computers, where (|X|) #(||) represent time taken for
encoding and decoding respectively. In real, the time taken for a process is not constant
during in all execution, and the average is not a correct term to represent the time taken. It
always lies between the minimum time required () for a process and maximum time
()requires for a process. The time taken per bit for encoding and decoding is calculated
as follows:
L==)MN=(O D(# I) =
(|A|)
|A|
(1.6)
L==)MN=(#=D(# I) =
(|@|)
|@|
(1.7)
ENTROPY - Shannon has borrowed the definition of entropy from statistical physics to capture
the notion how much information is contained in A and their probabilities. For a set of
possible messages A, Shannon has defined entropy [58] as,
R() = ∑WXY () log V(W)
(1.8)
Where () is the probability of message. The definition of Entropy is very similar
to that of statistical physics. In physics, S is the set of possible states, a system can be in ()
is the probability in state A. The second law of thermodynamics basically says that the
entropy of a system and its surroundings can only increase. Getting back to messages,
considering the individual messages[, Shannon has defined the notion of the selfinformation of a message as.
12
(>) = log
V(W)
(1.9)
This self-information represents the number of bits of information contained in it and,
roughly speaking, the number of bits should use to send that message. The equation says that
messages with higher probability will contain less information (e.g., a message saying that it
will be sunny out in LA tomorrow is less informative than one saying that it is going to
snow).
The entropy is simply a weighted average of the information of each message. Larger
entropies represent more information, and perhaps counter-intuitively, the more random a set
of messages (the more even the probabilities) the more information they contain on average.
CODE EFFICIENCY - Average code length is the average number of bits required to
represent a single code word. If the source and the length of the code words are known, the
average code length can be calculated using the following equation:
]̅ = ∑
^* ^
(1.10)
where ^ is the occurrence probability of jth symbol of the source message, _^ is the
length of the particular code word for that symbol and ` = _1, _2, … . ` .Code Efficiency
is the ratio in percentage between the entropy of the source and the average code length and it
is defined as follows:
O(, `) =
a(Y)
b(V,c)
(1.11)
Where, E (P, L) is the code efficiency, H (P) is the entropy and l (P, L) is the average
code length. The above equation is used to calculate the code efficiency as a percentage. It
can also be computed as a ratio. The code is said to be optimum, if the code efficiency value
is equal to 100% (or 1.0). If the value of the code efficiency is less than 100%, that implies
that the code words can be optimized than the current situation.
1.7 BIG O NOTATION
Big O notation is used in Computer Science to describe the performance or
complexity of an algorithm. Big O specifically describes the worst-case scenario, and can be
used to describe the execution time required or the space used (e.g. in memory or on disk) by
an algorithm. Big O notation also called Landau’s symbol, is a symbolism used in complexity
13
theory, computer science and mathematics to describe the asymptotic behavior of functions.
For example, when analyzing some algorithm, one may find that the time t (or the number of
steps) is taken to complete the problem of size n is given by ( ) = 4
1 2 3 2 . After
ignoring the constants and slower going terms, it can be said that ( ) grows at the order
and writesd(
).
1.7.1 TYPES OF ORDER
Table 1.1 Types of Order
Notation
d(1)
d(_(I( ))
d(_(I(_(I( ))
(( )
d( )
d( _(I( ))
d( 2)
d( 3)
d( D)
d(D )
d( !)
Name
Constant
Logarithmic
Double logarithmic (iterative logarithmic)
Sub linear
Linear
Log linear, Line arrhythmic, Quasi linear or Supra linear
Quadratic
Cubic
Polynomial (different class for each c > 1)
Exponential (different class for each c > 1)
Factorial
The table 1.1 is a list of common types of orders and their names:
f(g) - An algorithm that always executes in the same time (or space) regardless of the size
of the input data set.
f(h) - An algorithm whose performance will grow linearly and in direct proportion to the
size of the input data set. The example below also demonstrates how Big O favors the worstcase performance scenario; a matching string may be found during any iteration of the for
loop and the function will return early, but Big O notation always assumes the upper limit
where the algorithm will performs the maximum number of iterations.
14
f(hi) 1 represents the performance directly proportional to the square of the input data set
size. This is common with algorithms that involve nested iterations over the data set. Deeper
nested iterations will result in f(hj), f(hk) etc.
Properties of Big O
• d( 3 N) = d() 3 d(N) 1 Distributivepropertyoveraddition
• d( ∗ N) = d() ∗ d(N) 1Distributive property over multiplication
1.7.2 COMPUTATIONAL COMPLEXITY AND LOGARITHMS
Binary search is a technique used to search sorted data sets. It works by selecting the
middle element of the data set, essentially the median, and compares it against a target value
[90]. If the values match it return success. If the target value is higher than the value of the
probe element, it takes the upper half of the data set and performs the same operation against
it. Likewise, if the target value is lower than the value of the probe element, it performs the
operation against the lower half. It continues to halve the data set with every iterations until
the value is found or until it no longer splits the data set.
Table 1.2 Time Complexity and Speed
Complexity
10
20
50
100
1 000
10 000
100 000
d(1)
<1s
<1s
<1s
<1s
<1s
<1s
<1s
d(_(I( ))
<1s
<1s
<1s
<1s
<1s
<1s
<1s
d( )
<1s
<1s
<1s
<1s
<1s
<1s
<1s
d( ∗ _(I( ))
<1s
<1s
<1s
<1s
<1s
<1s
<1s
d(
)
<1s
<1s
<1s
<1s
<1s
2s
3-4 min
d(
z
)
<1s
<1s
<1s
<1s
20 s
5 hours
231 days
d(2
)
<1s
<1s
260 days hangs
hangs
hangs
hangs
d( !)
<1s
hangs
hangs
hangs
hangs
hangs
hangs
d(
3-4 min hangs
hangs
hangs
hangs
hangs
hangs
)
This type of algorithm is described asd(_(I'). The iterative halving of data sets
described in the binary search example produces a growth curve that peaks at the beginning
15
and slowly flattens out as the size of the data sets increase. For instance, an input data set
containing 10 items takes one second to complete, a data set containing 100 items takes two
seconds, and a data set containing 1000 items takes three seconds. Doubling the size of the
input data set has little effect on its growth as after a single iteration of the algorithm the data
set halved and therefore on par with an input data set half the size. This makes algorithms
like binary search extremely efficient when dealing with large data sets. The time complexity
and its speed [5] is shown in table 1.2.
1.8 BENCH MARK FILES
The types of bench mark files used for the experimentation are given below:
•
The Canterbury Corpus
•
The Artificial Corpus
•
The Large Corpus
•
The Miscellaneous Corpus
•
The Calgary Corpus
The Canterbury Corpus -
This collection is the main benchmark for comparing
compression methods. The Calgary collection is provided for historic interest, the Large
corpus is useful for algorithms that cannot "get up to speed" on smaller files, and the other
collections may be useful for particular file types. This collection was developed in 1997 as
an improved version of the Calgary corpus. The files were chosen because their results on
existing compression algorithms are "typical", and so it is hoped that this also be true for new
methods. There are 11 files in this corpus shown in the table 1.3.
Table 1.3 The Canterbury Corpus
File
alice29.txt
asyoulik.txt
cp.html
fields.c
grammar.lsp
kennedy.xls
lcet10.txt
plrabn12.txt
ptt5
Sum
xargs.1
Abbrev
Text
Play
Html
Csrc
List
Excel
Tech
Poem
Fax
SPRC
Man
Category
English text
Shakespeare
HTML source
C source
LISP source
Excel Spreadsheet
Technical writing
Poetry
CCITT test set
SPARC Executable
GNU manual page
16
Size (bytes)
152089
125179
24603
11150
3721
1029744
426754
481861
513216
38240
4227
The Artificial Corpus -
This collection contains files for which the compression
methods may exhibit pathological or worst-case behavior-files containing little or no
repetition (e.g. random.txt), files containing large amounts of repetition (e.g. alphabet.txt), or
very small files (e.g. a.txt). As such, "average" results for this collection will have little or no
relevance, as the data files are designed to detect outliers. Similarly, time for "trivial" files
will be negligible, and should not be reported. There are 4 files in this corpus. They are
shown in the table1.4:
Table 1.4 The Artificial Corpus
File
Abbrev
Category
a
The letter'a'
aaa
The letter 'a', repeated 100,000 times
100000
alphabet.txt
alphabet
100000
random.txt
random
alphabet
Enough repetitions of the
alphabet to fill 100,000 characters
random
100,000 characters, randomly
selected from [a-z|A-Z|0-9|!| ] (alphabet size 64)
a.txt
aaa.txt
Size (bytes)
1
100000
The Large Corpus - This is a collection of relatively large files. While most compression
methods can be evaluated satisfactorily on smaller files, some requires very large amounts of
data to get good compression, and some are so fast that the larger size makes speed
measurement (Computational Complexity) more reliable. New files can be added to this
collection. There are 3 files in this corpus shown in table 1.5:
Table 1.5 The Large Corpus
Abbrev
Category
Size (bytes)
E.coli
E.coli
Complete genome of the E. Coli bacterium
4638690
bible.txt
bible
The King James version of the bible
4047392
world192.txt
world
The CIA world fact book
2473400
File
The Miscellaneous Corpus - This is a collection of "miscellaneous" files that are designed to
be added by researchers and others willing to publish compression results using their own
files shown in table 1.6.
17
Table 1.6 The Miscellaneous Corpus
File
Abbrev
Category
Size (bytes)
pi.txt
Pi
The first million digits of pi
1000000
The Calgary Corpus- This was developed in the late 1980s, and during the 1990s became
something of a de facto standard for Lossless compression evaluation. The collection is now
rather dated, but it is still reasonably reliable as a performance indicator. It is still available so
that older results can be compared. The collection may not be changed, although there are
four files (paper3, paper4, paper5 and paper6) that have been used in some evaluations but
are no longer in the corpus because they do not add to the evaluation (the Calgary Corpus
collection are shown in table 1.7 .
Table 1.7 The Calgary Corpus
File
Abbrev
Category
Size (bytes)
Bib
Bib
Bibliography (refer format)
111261
book1
book1
Fiction book
768771
book2
book2
Non-fiction book (troff format)
610856
Geo
Geo
Geophysical data
102400
News
News
USENET batch file
377109
obj1
obj1
Object code for VAX
21504
obj2
obj2
Object code for Apple Mac
246814
paper1
paper1
Technical paper
53161
paper2
paper2
Technical paper
82199
Pic
Pic
Black and white fax picture
513216
Progc
Progc
Source code in "C"
39611
Progl
Progl
Source code in LISP
71646
Progp
Progp
Source code in PASCAL
49379
Trans
Trans
Transcript of terminal session
93695
18
1.9 TIME COMPLEXITY EVALUATOR TOOL
The focus of this research is mainly to study the computational complexity of Data
Compression Algorithm. There are some other methods to evaluate the performance of
compression algorithms. Compression time, computational complexity and probability
distribution are also used to measure the effectiveness. Time taken for the compression and
decompression should be considered separately [43]. In some applications like transferring
compressed video data, the decompression time is more important, while in some other
applications both compression and decompression time are equally important. But the time
taken by the same algorithm is different during each execution. So time taken is not constant
or not average and also it is constant or average time taken by an algorithm is not fair in the
calculation of time, because the execution time is varies of an algorithm from
()(() during several iterations, to find the minimum time () and
Maximum time () which need more execution of an algorithm on the same file (To
find () and () an algorithm is executed hundred time on same file). Manually
performing this operation is very tedious as there is so far no tool is available for the same. A
tool which is developed to define this task is called compression time complexity evaluator
shown in the figure 1.3. The proposed tool is designed in Visual Basic 6.0. This tool is
capable of executing algorithms designed in .java or .exe type. The tool is very useful to fetch
the time taken of algorithm on multiple files. They can also define the number of execution of
an algorithm on the same file (No iteration in the figure 1.3). The tool results the Min and
Max time taken by an algorithm on the different files separately. There are three types of
graph which can plot with this tool (i.) Plot a graph for time taken by an algorithm on single
file during each execution. (ii.) Plot a graph for time taken an algorithm with different files.
(iii.) Plot a graph for time taken by different algorithm on different files. The newly designed
tool is very useful when analyzing the performance based on computational complexity of
different algorithms. Time which is recorded by the tool is in nanoseconds.
19
Figure 1.3 Compression Time Complexity Evaluator
1.10 EXPERIMENTAL SETUP
All experiments have been done on a 2.20 GHz Intel (R) Celeron (R) 900 Central
Processing Unit (CPU) equipped with 3072 KB L2 cache and 2GB main memory. As the
machine does not have any other significant CPU tasks running, only a single thread of
execution is used. The Operating System is Windows XP SP3 (32 bit). All programs have
been compiled using java version jdk1.6.0_13. The times have been recorded in nanoseconds.
The time taken by each algorithm has been calculated using the tool compression time
complexity evaluator, major graph plotted with the same tool and sum graphs are plotted
using MS Excel. All data structures reside in main memory during computation.
1.10 FRAME WORK OF THIS THESIS.
This thesis consists of eleven chapters. The initial chapter is introductory in nature,
containing the thesis statement and objectives of the study, and list of parameters to measure
the performance of Compression algorithm.
CHAPTER II The second chapter deals with the literature survey of the study on LZW Data
compression. The computational complexity of the LZW Encoding algorithm is large. Hence
20
the study of LZW compression algorithm techniques is essential to reduce the Computational
complexity of LZW without affecting the performance of the algorithm.
CHAPTER III This chapter re-examines and explains the famous lossless data compression
algorithm like Huffman Coding, RLE, Arithmetic Coding, LZ77, and LZW. The selected
algorithm is tested against the Compression ratio, Compression Factor, Saving percentage,
and time taken for encoding and decoding.
CHAPTER IV This chapter proposes and explains a simple sorting algorithm called Binary
Insertion Sort (BIS). This algorithm is developed by exploiting the concept of Binary search.
The enhanced BIS uses one comparison per cycle, average case, Best Case, and worst case
analysis of BIS is done in this chapter.
CHAPTER V This chapter experiments and explains how BST, Linear array, Chained Hash
Table, and BIS are played a key role to determine the computational complexity of LZW
encoding Algorithm. Each data structure and algorithm employed in LZW and its
computational are analyzed.
CHAPTER VI Multiple Dictionary LZW or Parallel Dictionary LZW encoding algorithms is
the simple and best approach to reduce the computational cost of LZW. So in this chapter
explained and experimented MDLZW architecture and how the computational complexity is
reduced while comparing conventional LZW and its various data structure implementations.
The computational cost of each data structure is implemented and tested.
CHAPTER VII The computational cost is purely related with Data structures and employed in
LZW. So to optimize the performance of data structure and algorithm, a novel data mining
approach is proposes, implements and tested called Indexed K Nearest Twin Neighbor
algorithm (IKNTN). The computational complexity is analyzed and tested before and after
BST, Linear Search, Chained Hash Table and BIS with Binary Search.
CHAPTER VIII The computation Cost of LZW is reduced by clubbing the features of IKNTN
with LZW. The enhanced implementation is tested with BIS, Chained Hash Table, BST, BIS,
and Linear array.
CHAPTER IX Two novel approaches are proposed and explained, the enhancement is done by
combining the features of MDLZW and IKNTN_LZW. The first approach clusters each
21
dictionary into clusters and the second enhancement is done by grouping each cluster into
dictionary.
CHAPTER X The penultimate chapter deals with the results of various implementations of
LZW which will give optimum reduction of Computational cost. The results are presented in
tables and graphs. Various parameters are used for calculation.
CHAPTER XI The final chapter sums up the details of the research work carried out. The
limitations of the present study also have been mentioned along with a recommendation of
enhancements for future applications.
22


© Copyright 2026