
Explaining the Decline in the Number of Banks since the Great
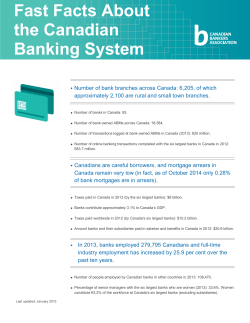
March 2015, EB15-03
Economic Brief
Explaining the Decline in the Number of Banks
since the Great Recession
By Roisin McCord, Edward Simpson Prescott, and Tim Sablik
The financial crisis of 2007–08 was a major shock to the U.S. banking sector.
From 2007 through 2013, the number of independent commercial banks
shrank by 14 percent—more than 800 institutions. Most of this decrease was
due to the dwindling number of community banks. While some of this decline
was caused by failure, most of it was driven by an unprecedented collapse in
new bank entry. The rate of new-bank formation has fallen from an average
of about 100 per year since 1990 to an average of about three per year since
2010. If this change persists, it will have a large impact on the composition
of the banking sector as well as the flow of credit in the economy.
The financial crisis of 2007–08 significantly
altered the banking landscape. From 2007
through 2013, the number of commercial banks
in the United States fell by more than 800, a 14
percent decline. This drop was highly concentrated among small community banks (banks
with less than $50 million in assets), which saw
their numbers shrink by 41 percent.1 Although
many banks failed during the crisis and its aftermath, this decline was driven largely by a lack of
new banks. The number of newly formed banks
(called de novo banks) has fallen sharply since
2010. In 2012, there were no de novos, and in
2013 there was only one: Bank of Bird-in-Hand,
formed in Lancaster County, Pa., to serve the
Amish community.
This collapse in new bank entry has no precedent
during the past 50 years, and it could have significant economic repercussions. In particular, the
decline in new bank entry disproportionately decreases the number of community banks because
EB15-03 - Federal Reserve Bank of Richmond
most new banks start small. Since small banks
have a comparative advantage in lending to small
businesses, their declining number could affect
the allocation of credit to different sectors in the
economy.2 This Economic Brief compares recent
events to historical trends and explores some
possible explanations for the sharp decline in
new community banks.
Historical Trends
For most of U.S. history, banks were barred
from opening branches across state lines, and
some states even prohibited intrastate branching. These policies led to a banking system
composed largely of thousands of small, independent banks. From 1960 to 1980, there were
between 12,000 and 13,000 independent banks
in the United States.3
Starting in the 1970s, however, states began
relaxing branching restrictions. This process
continued throughout the 1980s and early
Page 1
1990s, culminating in the Riegle-Neal Interstate
Banking and Branching Efficiency Act of 1994, which
removed most of the remaining restrictions on interstate branching.4 As a result, the number of banks in
the system declined, as weaker or smaller banks were
acquired by stronger or larger institutions and banks
took advantage of economies of scale. By 2000, the
number of independent commercial banks had
fallen to less than 7,000. (See Figure 1.)
Despite this trend, however, the industry has historically been highly dynamic. Institutions regularly
merge or fail, others grow or shrink, and—at least
in the past—new banks join the system. Indeed,
periods of accelerated bank exits are also typically
marked by increased bank entries, as layoffs increase
the supply of experienced bankers available to start
new institutions.5 At first glance, the past five years
do not appear markedly different from previous periods. The decline in the total number of banks could
be viewed as a continuation of the trend that began
in the 1980s, and exit rates do not differ sharply from
previous periods. (See Figure 2.) Indeed, despite
the severity of the financial crisis, the exit rate did
not significantly change from the pre-crisis period,
although more banks did exit due to failure than
merger or acquisition. However, a closer examination
reveals a striking decline in new bank entry not seen
in previous periods: From 2009 through 2013, entry
falls to almost zero.
A Stark Picture of Bank Entry
Breaking down bank entry by type provides an even
bleaker picture of the past five years. There are three
principle ways a new bank enters the system. First, a
savings and loan institution, savings bank, or credit
union can become a commercial bank by converting
its charter. Second, a bank that was formerly part of
a holding company can spin off into an independent
entity. Finally, there is a de novo entrant, which is a
newly formed bank. The first two types of entrants
do not represent “new blood” in the system because
a charter conversion is to a large extent a relabeling
of an existing institution and a spinoff is a reorganization of existing assets and employees. De novo
entries represent wholly new institutions, and focusing on this category provides a starker picture of the
collapse in bank entry since 2010. (See Figure 3.)
From 2011 through 2013, there were only four de
novo banks total, compared to a yearly average of
more than 100 from 2002 through 2008. The only
period since 1960 that comes close to such a sharp
decline was 1993–94, when de novos fell to 28 and
Figure 1: Number of Independent Banks in the United States
14,000
12,000
10,000
8,000
6,000
4,000
2,000
1960
1970
1980
1990
2000
2010
Source: Authors’ calculations based on data from the Federal Reserve’s National Information Center
Note: The authors treat all commercial bank charters and bank holding companies under a single bank holding company as one independent bank.
Page 2
25, respectively. But even that brief decline quickly
reversed in subsequent years.
In order to get a better sense of the overall impact
of the recent drop in de novo entries, two of the
authors of this Economic Brief (McCord and Prescott)
created a simulation to estimate how the banking
landscape would have looked under more typical
conditions.6 They find that while there still would
have been fewer banks in 2013 than in 2007, the
total would have declined by only 269 banks rather
than the 836 drop actually observed. They estimate
that the weak entry during this period accounts for
more than two-thirds of the decline in total commercial banks. They also find that weak entry accounts
for a similar proportional decline in the number of
community banks.
What Accounts for the Lack of Entry?
There are a number of factors that correlate with
bank entry. Not surprisingly, research has found that
entry is more likely in fast-growing, profitable markets.7 One might expect, therefore, that weak economic conditions during the recession of 2007–09
and the subsequent recovery reduced incentives for
new banks to enter the system. In a recent working paper, Robert Adams and Jacob Gramlich of the
Federal Reserve Board of Governors argue that the
decline in new bank entry is due in large part to low
bank profitability.8
An important factor in bank profitability is the net
interest margin, or the spread between deposit rates
and lending rates. The Fed’s policy of keeping the
federal funds rate near zero since 2008 has pushed
lending rates down, which has kept the net interest
margin relatively small. Adams and Gramlich estimate that this low interest rate environment coupled
with weak demand for banking services accounts for
as much as 80 percent of the decline in bank entry in
recent years. However, a literal interpretation of their
model would predict that even if the net interest
margin and economic conditions recovered to 2006
levels, there still would be almost no new bank entry,
suggesting that other factors are also important for
explaining the recent decline.
Indeed, the net interest margin in the current period
may not differ significantly from previous recoveries.
Charles Morris and Kristen Regehr of the Kansas City
Fed compare net interest income—the revenue from
interest on loans after factoring out expenses—in
the recent recovery to previous recoveries.9 They find
that while net interest income is at historically low
Figure 2: Bank Entries and Exits as Percentages of Total Banks
4
2
Percentage
0
2
4
Exits
Entries
6
8
1961
1971
1981
1991
2001
2011
Source: Authors’ calculations based on data from the Federal Reserve’s National Information Center
Note: Exits include failures and mergers. Entries include newly created banks (de novos), charter conversions, and spinoffs.
Page 3
levels, it is similar to net interest income observed
during the recovery from the 2001 recession, and it
is actually higher than during the recovery from the
1981–82 recession. Even so, entry rates were much
higher during each of these earlier recoveries.
Banking scholars also have found that new entries
are more likely when there are fewer regulatory restrictions.10 After the financial crisis, the number
of new banking regulations increased with the passage of legislation such as the Dodd-Frank Act. Such
regulations may be particularly burdensome for
small banks that are just getting started.
Hester Peirce, Ian Robinson, and Thomas Stratmann
of George Mason University’s Mercatus Center
surveyed community bankers and found that the
median compliance staff for respondents doubled
from one to two in the three years following enactment of Dodd-Frank.11 Survey respondents cited
devoting more time and resources to compliance,
and more than 80 percent estimated that such costs
had risen more than 5 percent since 2010. However,
it is unclear whether compliance costs are a driving
factor for the lack of new bank entry. According to
data from the Reports on Condition and Income (or
“Call Reports”), the ratio of non-interest expenses to
assets for banks with less than $1 billion in assets did
not change significantly from 2007 through 2013.
This finding does not completely rule out the possibility, however, that compliance costs increased. Call
Reports do not distinguish between compliance and
non-compliance costs, so it is possible that non-compliance costs decreased during this period, masking
any increases in compliance costs.12
Some of the costs related to regulatory burdens may
be specific to starting a de novo bank. For example,
in 2009 the Federal Deposit Insurance Corporation
increased the length of time—from three to seven
years—during which newly insured depository institutions are subject to higher capital requirements and
more frequent examinations. Additionally, anecdotal
evidence suggests that the application process for
new banks may have become more rigorous following the 2007–09 recession. Organizers of the only de
novo bank in 2013 reported that the process was
significantly longer and more intensive than it had
been in the past.13
Looking Ahead
The current decline in commercial banks appears
to be driven largely by the complete collapse of
new bank entry. If entry remains weak and the
Figure 3: Numbers of Newly Created Banks (De Novos)
350
300
250
200
150
100
50
1961
1971
1981
1991
2001
2011
Source: Authors’ calculations based on data from the Federal Reserve’s National Information Center
Note: Numbers of newly created banks (de novos) do not include charter conversions or spinoffs.
Page 4
exit rate remains constant, the number of banks
overall, as well as the number of community banks,
will continue to fall. Whether or not the entry rate
recovers will depend on what is driving current low
levels. If de novos are absent due to the low interest rate environment and weak economic recovery,
then entry should increase as the economy improves and the Fed raises interest rates. If regulatory costs are the driving force behind low entry
rates, then future entry will depend on how those
costs change over time.
Roisin McCord is a research associate, Edward
Simpson Prescott is a senior economist and vice
president, and Tim Sablik is an economics writer
in the Research Department at the Federal Reserve
Bank of Richmond.
Endnotes
1
2
In order to compare bank size across years, size measures
reported in this Economic Brief are relative to 2010 dollars.
Data in other years are scaled by the change in total bank
assets between those years and 2010. For an explanation
of the advantages of scaling this way, see McCord, Roisin,
and Edward Simpson Prescott, “The Financial Crisis, the Collapse of Bank Entry, and Changes in the Size Distribution
of Banks,” Federal Reserve Bank of Richmond Economic
Quarterly, First Quarter 2014, vol. 100, no. 1, pp. 23–50.
See Berger, Allen N., and Gregory F. Udell, “Small Business
Credit Availability and Relationship Lending: The Importance
of Bank Organisational Structure,” Economic Journal, February 2002, vol. 112, no. 477, pp. F32–F53.
3
The authors treat all commercial bank charters and bank
holding companies under a single bank holding company
as one independent bank. For more details, see McCord and
Prescott (2014).
4
See Janicki, Hubert P., and Edward Simpson Prescott,
“Changes in the Size Distribution of U.S. Banks: 1960–2005,”
Federal Reserve Bank of Richmond Economic Quarterly, Fall
2006, vol. 92, no. 4, pp. 291–316; and Jayaratne, Jith, and
Philip E. Strahan, “The Benefits of Branching Deregulation,”
Federal Reserve Bank of New York Economic Policy Review,
December 1997, pp. 13–29.
5
See Keeton, William R., “Are Mergers Responsible for the Surge
in New Bank Charters?” Federal Reserve Bank of Kansas City
Economic Review, First Quarter 2000, vol. 85, pp. 21–41; and
Berger, Allen N., Seth D. Bonime, Lawrence G. Goldberg, and
Lawrence J. White, “The Dynamics of Market Entry: The Effects
of Mergers and Acquisitions on Entry in the Banking Industry,”
Journal of Business, 2004, vol. 77, no. 4, pp. 797–834.
6
See McCord and Prescott (2014).
7
See Dunham, Constance R., “New Banks in New England,” Federal Reserve Bank of Boston New England Economic Review,
January/February 1989, pp. 30–41; and Moore, Robert R., and
Edward C. Skelton, “New Banks: Why Enter When Others Exit?”
Federal Reserve Bank of Dallas Financial Industry Issues, First
Quarter 1998, pp. 1–6.
8
Adams, Robert M., and Jacob P. Gramlich, “Where Are All the
New Banks? The Role of Regulatory Burden in New Charter
Creation,” Federal Reserve Board Finance and Economics Discussion Series No. 2014-113, December 16, 2014.
9
See Morris, Charles S., and Kristen Regehr, “What Explains Low
Net Interest Income at Community Banks?” Federal Reserve
Bank of Kansas City Economic Review, Second Quarter 2014,
pp. 59–87.
10
See Ladenson, Mark L., and Kenneth J. Bombara, “Entry in
Commercial Banking, 1962–78,” Journal of Money, Credit and
Banking, May 1984, vol. 16, no. 2, pp. 165–174; and Lindley,
James T., James A. Verbrugge, James E. McNulty, and Benton
E. Gup, “Investment Policy, Financing Policy, and Performance
Characteristics of De Novo Savings and Loan Associations,”
Journal of Banking and Finance, April 1992, vol. 16, no. 2,
pp. 313–330.
11
Peirce, Hester, Ian Robinson, and Thomas Stratmann, “How
Are Small Banks Faring Under Dodd-Frank?” Mercatus Center
George Mason University Working Paper No. 14-05, February
2014.
12
Beginning in 2008, Call Reports did add some subcategories
of expenses, including costs related to legal fees, auditing,
consulting, and advisory expenses. Presumably some of these
costs are related to costs of complying with regulations. As a
percentage of assets, these costs did increase for small banks
between 2008 and 2011, but this category of expenses is
relatively small, so any increase is unlikely to have a sizable
impact on bank profitability.
13
See Peters, Andy, “Amish Bank Charter to Set Standard for
Future Applications,” American Banker, December 4, 2013.
This article may be photocopied or reprinted in its
entirety. Please credit the authors, source, and the
Federal Reserve Bank of Richmond, and include the
italicized statement below.
Views expressed in this article are those of the authors
and not necessarily those of the Federal Reserve Bank
of Richmond or the Federal Reserve System.
FEDERAL RESERVE BANK
OF RICHMOND
Richmond Baltimore Charlotte
Page 5


© Copyright 2026