
Proposed US 36 Service Plan
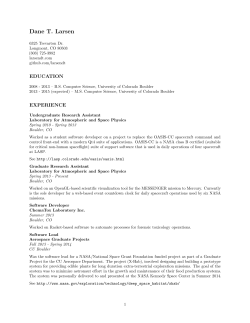
Proposed US 36 Service Plan March, 2015 Proposed US 36 BRT Service Plan TABLE OF CONTENTS 1 Introduction ..................................................................................................... 5 2 1.1 Background ............................................................................................... 5 1.2 Information Sources .................................................................................... 5 Existing Conditions ........................................................................................... 6 2.1 Corridor Description .................................................................................... 6 2.2 Current Bus Service .................................................................................... 6 2.2.1 Route Descriptions................................................................................ 6 2.2.2 Service Levels ...................................................................................... 9 2.2.3 Ridership ........................................................................................... 11 2.2.4 Productivity ....................................................................................... 18 2.3 Stations .................................................................................................. 19 2.4 Load Analysis by Route and Station ............................................................ 20 2.5 Travel Time Savings: Express vs. Local ........................................................ 24 2.5.1 Eastbound Travel Time Analysis ........................................................... 25 2.5.2 Westbound Travel Time Analysis .......................................................... 25 2.6 3 4 5 Current Resources .................................................................................... 26 Service Levels and Enhancements ..................................................................... 27 3.1 Established Minimum Service Levels ............................................................ 27 3.2 Enhancements and Investments .................................................................. 28 Framework and Guiding Principles..................................................................... 29 4.1 Reduce Travel Times ................................................................................. 29 4.2 Improve Service Reliability ......................................................................... 30 4.3 Increase Customer Comprehension/Ease of Use ............................................ 30 4.4 Match Service Levels with Ridership Demand ............................................... 30 Proposed Service Plan ..................................................................................... 30 5.1 BRT Service Patterns ................................................................................ 30 5.2 BRT Service Levels ................................................................................... 33 5.2.1 All-Station Denver-Boulder ................................................................... 33 5.2.2 Denver-Westminster-Broomfield (DWB) .................................................. 33 5.2.3 Express ............................................................................................. 34 5.2.4 Boulder-Anschutz (DM) ....................................................................... 34 5.2.5 Boulder Junction at Depot Square-Civic Center (BJCC)............................. 34 5.3 Local & Other Services .............................................................................. 39 5.3.1 3/2/2015 US 36 & Table Mesa Park-n-Ride .......................................................... 39 2 Proposed US 36 BRT Service Plan 6 5.3.2 US 36 & McCaslin Park-n-Ride ............................................................. 39 5.3.3 US 36 & E Flatiron Center Park-n-Ride ................................................... 39 5.3.4 US 36 & Broomfield Park-n-Ride ........................................................... 39 5.3.5 US 36 & Church Ranch Park-n-Ride ....................................................... 39 5.3.6 US 36 & Westminster Center Park-n-Ride............................................... 39 5.3.7 Other Services ................................................................................... 40 5.4 Estimated ridership ................................................................................... 40 5.5 Proposed Resources .................................................................................. 41 Process & other issues .................................................................................... 42 6.1 Process ................................................................................................... 42 6.2 Changes After Implementation ................................................................... 43 6.3 Issues Raised in the Public Input Process ..................................................... 43 3/2/2015 3 Proposed US 36 BRT Service Plan TABLE OF FIGURES Figure 1 - Existing US 36 Service Patterns by Route .................................................... 7 Figure 2 - Existing Route & Stop Patterns - US 36 Corridor ........................................... 8 Figure 3 - Total Weekday Trips by Time Period (January 2014 Schedule) ....................... 9 Figure 4 - Weekday Route Frequencies by Time of Day (January 2014 Schedule) .......... 10 Figure 5 - Saturday Trips per Time Period (January 2014 Schedule) ............................. 11 Figure 6 - Sunday Trips per Time Period (January 2014 Schedule) ............................... 11 Figure 7 - Total Weekday Boardings per Route .......................................................... 13 Figure 8 - AM Peak Ridership Map .......................................................................... 15 Figure 9 - PM Peak Ridership Map........................................................................... 16 Figure 10 - Weekday Boardings per Time Period........................................................ 17 Figure 11 - Average Weekday Boardings per Route ................................................... 17 Figure 12 - Average Weekday Boardings per Trip ...................................................... 18 Figure 13 - Average Weekday Boardings per Revenue Hour ........................................ 19 Figure 14 - US 36 Corridor Station Access/Attributes ................................................ 20 Figure 15 - AM Peak Eastbound Boardings (Weekday) ............................................... 22 Figure 16 - AM Peak Eastbound Loads (Weekday) ..................................................... 22 Figure 17 - Westbound Boardings (Weekday) ........................................................... 24 Figure 18 - PM Peak Westbound Loads (Weekday) .................................................... 24 Figure 19 - Weekday Travel Time Savings Eastbound ................................................ 26 Figure 20 - Current Service Resources ..................................................................... 27 Figure 21 - MCC Memo Peak Service Levels (Weekday) ............................................. 28 Figure 22 - Proposed Service Patterns ..................................................................... 31 Figure 23 - Proposed Frequencies (Weekday)............................................................ 31 Figure 24 - Service Pattern Schematic ..................................................................... 32 Figure 25 - Proposed Weekday Schedule Eastbound .................................................. 35 Figure 26 - Proposed Weekday Schedule Westbound ................................................. 36 Figure 27 - Proposed Saturday Schedule .................................................................. 37 Figure 28 - Proposed Sunday Schedule .................................................................... 38 Figure 29 - Estimated 2016 Flatiron Flyer Weekday Boardings .................................... 41 Figure 30 - Proposed Services Resources ................................................................. 42 3/2/2015 4 Proposed US 36 BRT Service Plan 1 INTRODUCTION 1.1 BACKGROUND The US 36 corridor has a notable history of providing commute-oriented transit service. From 1908 to 1926, passengers could travel between Denver and Boulder on the Denver & Interurban Railroad (D&I) commuter rail line. Interurban train travel was eventually replaced by bus service and consolidated under the Regional Transportation District (RTD). Today, RTD operates a number of Regional and Express services on the US 36 corridor. The Denver region has experienced considerable population and employment growth in recent years which has had an impact on the corridor. Traffic congestion continues to increase, leading to longer travel times and a greater demand for more efficient public transit. The US 36 Managed Lanes/Bus Rapid Transit (BRT) Project seeks to address US 36 traffic congestion issues through physical highway improvements and transit service enhancements. The project involves physical improvements such as the partial reconstruction of US 36 and the addition of two managed lanes. These managed lanes will extend the existing HOV lane for high-occupancy vehicles and will also allow singleoccupancy vehicles to utilize the lanes by paying a toll. The construction project also adds queue jump lanes at interchanges that serve the bus stations. The managed lanes and queue jump lanes will improve BRT operations by incrementally reducing travel times and increasing service reliability. The project will also include improvements to the existing US 36 bus stations, such as the construction of new shelters, and added RTD operational funding; all to further enhance regional transit service along the US 36 corridor between Denver and Boulder. 1.2 INFORMATION SOURCES The majority of the ridership data is from the January-May 2014 which precedes the opening of Denver Union Station (DUS) on May 9, 2014 which replaced Market Street Station as a terminal in downtown Denver. All routes that had previously served Market Street Station were rerouted to serve the new facility. Additionally, RTD implemented Free MetroRide, a free downtown distributor connecting DUS and Civic Center. This data is the most recent, complete set of data that provides the information necessary for analyzing boardings, alightings, and passenger loads. In this dataset, Market Street Station is the primary terminal in downtown Denver. The schedules reflect the opening of DUS and were used to determine current service levels, patterns, and travel times. Information on the existing and proposed changes to the US 36 corridor came primarily from the following sources: US 36 Corridor Final Environmental Impact Statement Colorado Department of Transportation Roadway Layout Plans US 36 Mayors/Commissioners Coalition Service Level Memo US 36 Managed Lane Concept of Operations US 36 2014 Fact Sheet RTD 2014 ridership data and schedules 3/2/2015 5 Proposed US 36 BRT Service Plan 2 EXISTING CONDITIONS 2.1 CORRIDOR DESCRIPTION The US 36 corridor connects Boulder and downtown Denver via six stations along US Highway 36: Westminster Center, Church Ranch, Broomfield, Flatiron, McCaslin, and Table Mesa. These stations are accessible using highway on-ramps, off-ramps, or bus only lanes. Denver Union Station (DUS) is the primary terminal for routes in downtown Denver. Downtown Denver features a high-occupancy vehicle (HOV) flyover ramp which allows transit vehicles to access the corridor via Interstate 25. The HOV ramp is a one-way, reversible lane that is available heading eastbound towards downtown Denver from 5:00 AM to 10:00 AM and heading westbound towards Boulder from 12:00 PM to 3:00 AM. During off-peak periods when the flyover is closed, buses utilize Park Avenue and Wewatta Street to access Interstate 25. Regional transit services have a few configurations for travelling through Boulder after Table Mesa. Most routes on the corridor will terminate at Boulder Transit Center via Table Mesa Drive and Broadway Street with a connection to the University of Colorado Boulder. A second, peak period only travel path, involves buses continuing westbound on US 36 traveling to East Boulder via 28th Avenue. 2.2 CURRENT BUS SERVICE 2.2.1 Route Descriptions The US 36 corridor is currently served by a total of thirteen routes: AB, BF, BMX, BV, BX, DD, DM, HX, L, LX, S, T, and 86X (see Figure 1 - Existing US 36 Service Patterns by Route). All of these routes operate with high capacity, highway coaches, except for the 86X which utilizes high capacity, articulated buses. Routes AB, L, and LX will not be a part of the service plan recommendations but are evaluated as part of the existing conditions analysis. The four B routes, BV, BF, BMX, BX, each represent a different pattern between Boulder Transit Center and Denver Union Station. BV is the all-stop service, providing a connection to each of the six stations as well the local stops between Table Mesa and Boulder Transit Center. BV operates all day and is oriented towards the reverse-commute, heading westbound to Boulder in the AM peak and eastbound to Denver in the PM peak. BMX and BX are express services that serve Boulder Transit Center, Table Mesa, and McCaslin (BMX). These routes supplement BV service with each route operating a 15 minute frequency during the peak periods. BF is a short-line route that connects Broomfield, Church Ranch, and DUS. BF is a peak period service that operates in the peak direction, eastbound to Denver in the AM peak and westbound to Broomfield in the PM peak. Route 86X operates between Westminster Center and DUS. This route provides frequent, peak only service, travelling eastbound during the AM peak and westbound towards Westminster during the PM peak. Routes S and HX are the only two routes that currently serve East Boulder. Route S provides reverse-commute, peak period service between DUS and East Boulder while 3/2/2015 6 Proposed US 36 BRT Service Plan Route HX offers passengers a peak-direction, alternative connection into downtown Denver, terminating at Civic Center Station. This is the only route on the US 36 corridor that serves Civic Center Station. Routes DD, DM, and T are low frequency, peak period routes with unique terminals outside of downtown Denver. Route DD serves Colorado Boulevard, Route DM serves the Anschutz Medical Campus, and Route T serves the Denver Tech Center. Routes L and LX connect Denver and Longmont. These primarily peak-oriented services access the corridor via the stations at Westminster, Broomfield, and DUS. Route AB provides SkyRide service to Denver International Airport (DIA) from Boulder Transit Center serving Table Mesa, McCaslin, Broomfield, and Westminster. The large number of routes complicates the corridor, making transit more difficult for passengers to understand. Figure 2 - Existing Route & Stop Patterns - US 36 Corridor presents the routes and their alignments. Passengers need to invest additional time in order to understand the 13 routes and identify which services meet their mobility needs. Figure 1 - Existing US 36 Service Patterns by Route 3/2/2015 X X X X X X X X X X X X X X X X X X X X X 7 X X X X X X X X X X X X X X X X X X Longmont X X East Boulder X Boulder Transit Center X Table Mesa X X X X McCaslin X X X X Flatiron Broomfield Westminster Center Church Ranch AB BF BMX BV BX DD DM HX L LX S T 86X Denver Union Station Route Civic Center Existing US 36 Service Patterns by Route X X X X X X X X Proposed US 36 BRT Service Plan Figure 2 - Existing Route & Stop Patterns - US 36 Corridor 3/2/2015 8 Proposed US 36 BRT Service Plan 2.2.2 Service Levels Transit on the US 36 corridor is largely commute-based with a large number of eastbound and westbound weekday trips taking place during the AM peak (6:00 AM – 8:59 AM) and PM peak (3:00 PM – 5:59 PM). Many of these trips emphasize the peak direction, heading eastbound towards downtown Denver during the AM peak, and westbound towards Boulder during the PM peak (see Figure 3 - Total Weekday Trips by Time Period (January 2014 Schedule)). The B routes account for about 65 percent of the total weekday trips along the corridor. During the midday (9:00 AM – 2:59 PM) the number of trips is nearly half of the number of trips during each peak period. As expected, the early AM period (5:00 AM – 5:59 AM) has the least amount of trips. During the PM evening (6:00 PM – 7:59 PM) period there are more trips operating compared to the PM late period (8:00 PM – 10:59 PM). Figure 3 - Total Weekday Trips by Time Period (January 2014 Schedule) Total Weekday Trips by Time Period 120 110 103 100 Trips 80 60 60 34 40 20 24 19 0 AM Early AM Peak Midday PM Peak PM Evening PM Late Time Period The majority of the peak period routes operate a limited number of trips while the B routes and Route 86X operate at more consistent service levels (see Figure 4 - Weekday Route Frequencies by Time of Day (January 2014 Schedule)). Route BV supports the westbound reverse-commute operating a 10 minute frequency to Boulder and a 30 minute frequency to Denver during the AM peak. This pattern is reversed during the afternoon peak. BMX and BX provide additional capacity along the corridor with a 10-15 minute frequency during the peak and 60 minute service during the midday in both directions. Route 86X operates a 10 minute frequency between Westminster and DUS in the peak period and peak direction. The remaining services run less frequently. 3/2/2015 9 Proposed US 36 BRT Service Plan Figure 4 - Weekday Route Frequencies by Time of Day (January 2014 Schedule) Weekday Route Frequencies by Time of Day (headways shown in minutes unless noted) Route AB BF BMX BV BX DD DM HX L LX S T 86X Westbound to Boulder AM PM Midday Peak Peak 60 60 60 10 15 60 10 10 30 30 15 2 trips 2 trips 30 15 45 5 trips 30 2 trips 45 3 trips 10 Eastbound to Denver AM Midday PM Peak Peak 60 60 60 10 15 20 30 30 10 15 60 20 2 trips 30 15 30 4 trips 60 3 trips 30 3 trips 10 Figure 5 - Saturday Trips per Time Period (January 2014 Schedule) and Figure 6 - Sunday Trips per Time Period (January 2014 Schedule) detail the weekend service levels by time period. Routes AB, BMX, and BV are the only routes that currently provide weekend service on the US 36 corridor. All three routes operate on Saturday while AB and BV operate on Sunday. The majority of weekend service is allocated to the midday period. During this time, Routes BV and BMX run every 30 and 60 minutes, respectively. Route AB operates 60 minute service all day. RTD currently schedules Route BMX and BV trips back-to-back in the eastbound direction. These trips depart within one minute of each other from their terminals. Route BV also operates during the early AM and late PM hours at a 60 minute frequency. 3/2/2015 10 Proposed US 36 BRT Service Plan Figure 5 - Saturday Trips per Time Period (January 2014 Schedule) Trips Saturday Trips per Time Period 50 45 40 35 30 25 20 15 10 5 0 45 24 13 13 14 2 AM Early AM Peak Midday PM Peak PM Evening PM Late Time Period Figure 6 - Sunday Trips per Time Period (January 2014 Schedule) Sunday Trips per Time Period 33 35 30 Trips 25 18 20 15 11 9 10 5 11 1 0 AM Early AM Peak Midday PM Peak PM Evening PM Late Time Period 2.2.3 Ridership 2.2.3.1 Weekday Routes serving the US 36 corridor generate more than 10,000 average weekday boardings (see Figure 7 - Total Weekday Boardings per Route). The B routes, which provide all-day, frequent service, account for 55 percent of this total. No other route besides Route AB contributes more than 10 percent of the total ridership. Route 86X and its high frequency, peak direction service contributes about 9 percent of the ridership. 3/2/2015 11 Proposed US 36 BRT Service Plan Route HX has experienced an increase in ridership following the opening of DUS. This shift in ridership may be the result of passengers wanting to preserve a one seat ride to destinations between Union Station and Civic Center Station. The chart below does not reflect this recent increase in ridership, but RTD scheduled two additional Route HX trips August, 2014. RTD will continue to monitor changes in ridership activity as passengers 3/2/2015 12 Proposed US 36 BRT Service Plan acclimate to this transition and make adjustments as needed. Figures 8 and 9 depict AM and PM peak ridership along the corridor. Figure 7 - Total Weekday Boardings per Route 3/2/2015 13 Proposed US 36 BRT Service Plan Total Weekday Boardings per Route 4,000 3,500 Boardings 3,000 2,500 2,000 1,500 1,000 500 0 BV BMX AB 86X L BX HX Route 3/2/2015 14 BF DM S T DD LX Proposed US 36 BRT Service Plan Figure 8 - AM Peak Ridership Map 3/2/2015 15 Proposed US 36 BRT Service Plan Figure 9 - PM Peak Ridership Map 3/2/2015 16 Proposed US 36 BRT Service Plan The ridership patterns on the US 36 corridor by time of day emphasize transit’s current role as a commuter service (see Figure 10 - Weekday Boardings per Time Period and Figure 11 - Average Weekday Boardings per Route ). The majority of boardings along the corridor occur during the peak periods, accounting for 62 percent of the total boardings. Figure 10 - Weekday Boardings per Time Period Figure 11 - Average Weekday Boardings per Route Average Weekday Boardings per Route - By Time Period Route AM Early AM Peak Midday PM Peak PM Evening PM Late AB 49 298 462 270 142 131 BF 248 211 BMX 28 515 114 789 139 28 BV 201 642 1,004 779 336 346 BX 326 240 163 42 DD 27 19 41 DM 61 124 146 13 HX 52 311 270 16 L 59 253 212 291 74 16 LX 37 42 S 98 105 T 58 29 59 86X 569 502 35 Total 535 3,469 2,032 3,668 797 521 Total 1,352 459 1,613 3,308 771 87 344 649 905 79 203 146 1,106 11,022 RTD keeps service levels fairly consistent throughout the day on weekends. Weekend passenger activity reflects this decrease in commute-oriented service; more than 35 percent of the Saturday boardings occur during the midday. 3/2/2015 17 Proposed US 36 BRT Service Plan 2.2.4 Productivity Productivity is an important metric for comparing performance across routes. Overall, the range of boardings per trip is fairly compact. Figure 12 - Average Weekday Boardings per Trip details the boardings per trip by route. Routes AB, BV, HX, LX, and 86X have the highest productivity, generating more than 34 boardings per trip. Routes T and DD are on the opposite end of the productivity spectrum with fewer than 25 boardings per trip. These two routes have destinations other than Downtown Denver terminating at the Denver Tech Center and Colorado Boulevard, respectively; lower frequencies and limited demand for service to these areas adversely impact their performance. Route BX, which offers the express service between Boulder and downtown Denver, generates the fewest boardings per trip amongst the B routes, reflecting slightly lower usage for the longest distance trips. Figure 12 - Average Weekday Boardings per Trip Average Weekday Boardings per Trip 45 40 40 36 Boardings 35 35 35 34 30 29 30 29 29 27 26 25 24 22 20 15 10 5 0 LX AB BV 86X HX BMX L S DM BF BX T DD Route Boardings per revenue hour provide another perspective for understanding productivity and route performance (see Figure 13 - Average Weekday Boardings per Revenue Hour). It measures ridership generated per unit of service, making it possible to compare the performance of routes with greatly differing ridership and service levels. By this productivity measure, performance varies significantly by pattern. Route 86X is the most productive route on the US 36 corridor. Route 86X generates boardings that are comparable to Routes BV and BMX, but in a much shorter amount of time. The regional routes with destinations other than DUS have significantly lower productivity when accounting for revenue hours. There is an opportunity to improve performance on the corridor by reallocating less productive resources. 3/2/2015 18 Proposed US 36 BRT Service Plan Figure 13 - Average Weekday Boardings per Revenue Hour Average Weekday Boardings per Revenue Hour 90 85 80 Boardings 70 56 60 50 40 33 33 32 31 30 29 24 22 21 20 18 13 12 T DD 10 0 86X BF BMX BV HX LX BX AB S L DM Route 2.3 STATIONS The US 36 corridor connects Boulder and downtown Denver with service to six stations. Figure 14 - US 36 Corridor Station Access/Attributes details how these stations differ in their services, amenities, and transit needs and usage. Routes serving the corridor vary in their terminal locations, but the primary hubs in downtown Denver and Boulder are DUS, Civic Center Station, and Boulder Transit Center. A transit center at 33rd and Pearl is currently under construction in East Boulder and is anticipated to be open when the US 36 Corridor BRT service commences in early 2016. 3/2/2015 19 Proposed US 36 BRT Service Plan Figure 14 - US 36 Corridor Station Access/Attributes Parking Utilization Bike Racks & Lockers Local First/Last Mile Services Boulder Transit Center Table Mesa McCaslin Flatiron Broomfield Church Ranch HX BF, BMX, BX, BV, DD DM, L , LX S, 86X AB, BV DD,D M, L, S T, 86X BF BV DD AB, BF, BV DD, DM, L LX, S, T BV DD HX AB,BMX , BV, DD, DM HX, S, T AB, BMX BV, BX DD, DM HX, S, T AB, BMX BX, BV, DD, DM 122 3,028 1,342 260 761 259 668 754 716 20 288 234 121 213 124 242 269 232 0 0 1,310 396 940 264 466 824 0 69% 27% 51% 30% 86% 59% 8 30 88 - 206, 209, DASH 204, 205, 206, 208, 225, BOLT, DASH, HOP, JUMP, N, Y US 36 Corridor Routes Average Weekday Boardings Average Weekday Trips Parking Spaces Westminster Center Market Street Station* Station Civic Center Station US 36 Corridor Station Access/Attributes - - 53 12 17 0L, 3L, 8, 16, 16L, 47X, 79L, 83L, 87X, 100X, 116X, 122X,CS,C VCX ES, EV, EX, R, RC, RX MallRide MetroRide 0, 6, 20, 31X, 32, 40X, 55X, 72X, 80X, 86X, 104X, 120X, AF, LNX, LSX MallRide MetroRide 31, 51, 92, 100, 104 104 76, 112, 120, 128, 225, 228, Broomfield & InterlockenWestmoor Call-n-Rides 228, Louisville Call-nRide *Market Street Station data, but hub has moved to Denver Union Station 2.4 LOAD ANALYSIS BY ROUTE AND STATION Analyzing the passenger loads of the existing US 36 services is essential for understanding capacity issues and effectively allocating resources to meet actual demand. There are two charts that comprise the load analysis for Routes BV, BMX, BX, BF, HX, and 86X (services that generate some of the highest boardings on the corridor). The bar charts below present the total number of boardings and maximum load per trip. While the seated capacity of the bus is 57, a maximum scheduled capacity of 50 is used as a threshold to afford a small, but reasonable buffer to accommodate daily variability in passenger loading and traffic perturbations without incurring standees. The load analysis evaluates corridor activity to understand how passengers use the US 36 services and determines where loads are the highest by station and time of day. The line charts below present average load calculated for each route and stop representing boardings and alightings as they occur along the 3/2/2015 20 Proposed US 36 BRT Service Plan route. The distance between station stops is scaled proportionally and an increase in the line at a station represents a net load increase where boardings were greater than alightings, and conversely for a decrease. These data help identify trips and time periods where bus capacity is an issue. An analysis of Figure 15 - AM Peak Eastbound Boardings (Weekday) trips in time order and Figure 16 - AM Peak Eastbound Loads (Weekday) for the AM peak eastbound direction leads to the following observations: The maximum load measurement is used to assess utilization on a trip-by-trip basis. A pattern of higher loads indicates a potential need for additional capacity. The corridor currently features sufficient capacity: only one out of more than 200 trips averaged a maximum load above seated capacity. No trip was subject to overload issues during the AM peak heading eastbound. On average, no route experiences a maximum load above the seating capacity Route 86X experiences a significant amount of sustained passengers activity throughout the AM Peak, thus its capacity should be maintained. Route BV experiences the greatest amount of seat turnover throughout the corridor. Route BF ridership is greatest on the first trip of the AM Peak at 6:15 AM, which is likely due to the fact that there are fewer B trips overall operating during this time Even though Routes BV and 86X both go express to downtown Denver from Westminster station, people may be choosing the latter route due to its higher frequency service. Stations stops located further away from downtown Denver experience significantly higher ridership on the routes that provide faster, more express services. Riders at Table Mesa and McCaslin prefer the faster service resulting in lower BV ridership at these stations (BV also operates less frequently, which also contributes to the lower ridership during this time). At the local stops in Boulder the passenger load is greater on BX which has one less stop than BMX. 3/2/2015 21 Proposed US 36 BRT Service Plan Figure 15 - AM Peak Eastbound Boardings (Weekday) Total Weekday Boardings and Max Load by Trip: AM Peak Eastbound BV Total Boardings BX Total Boardings BMX Total Boardings BF Total Boardings 86X Total Boardings HX Total Boardings Max Load 70 60 50 Seating Capacity Schedule Guideline Capacity 40 30 20 10 0 Figure 16 - AM Peak Eastbound Loads (Weekday) Weekday Loads Along Corridor: AM Peak Eastbound 40 35 Passenger Load 30 86X 25 BMX 20 BX 15 BF 10 BV 5 0 0 5 10 15 20 25 30 Trips heading westbound to Boulder during the AM Peak are considered reverse-commute trips and an analysis of similar charts leads to the following observations. There are fewer boardings than the peak direction and the trips average 30 boardings per trip, none coming close to reaching seating capacity of 57. Routes BMX and BX average approximately 25 boardings per trip; on average, these express trips carry less than half a bus load. Similar 3/2/2015 22 Proposed US 36 BRT Service Plan to the eastbound direction, passengers traveling further distances select the faster routes. Ridership on Route BV increases at each subsequent station until reaching Table Mesa where alightings begin to outpace boardings. During the midday, heading eastbound to Denver, service alternates between BV and BX with a frequency of approximately every 30 minutes. No trips are at seating capacity. Route BV experiences significantly higher ridership than BX and max load figures show that there is significant seat turnover on Route BV which indicates the route’s role as an intra-corridor connector. Riders take the first bus that arrives at their stop. Routes BV, BX, and BMX provided midday service westbound towards Boulder, with BV operating a 30 minute frequency supplemented by 60 minute service on either BX or BMX. The two BX trips average 20 boardings per trip making the service underutilized. Route BV experiences high seat turnover, generating its highest ridership volumes during this time period. Loads are similar between Routes BMX and BV leaving downtown Denver; Route BX loads are small leaving downtown Denver. Service in the PM Peak heading eastbound to Denver is split between Routes BV, BX, and BMX. Route BV has especially high ridership in the hour between 3:00 PM and 5:00 PM; the 4:30 PM trip generates more than 70 boardings and its max load is close to seating capacity. Routes BX and BMX trips do not come close to reaching the maximum seating capacity of the bus. The majority of passengers on Route BV are using the service to access intervening stations and not downtown Denver; passengers are using Routes BMX and BX very similarly. Figure 17 - Westbound Boardings (Weekday) and Figure 18 - PM Peak Westbound Loads (Weekday) depict ridership during the westbound PM peak direction to Boulder, leading to the following observations: Ridership in the PM Peak heading out to Boulder is high with loads exceeding seating capacity on one 86X trip that departs around 5:00 PM (See Figure 17 Westbound Boardings (Weekday)) Ridership is lowest on Route BF which duplicates most of Route BV’s alignment towards Broomfield Routes BV and 86X should have no discernible travel time difference between downtown Denver and Westminster since they have the same stop configuration, however, Route 86X has a substantially higher average load (See Figure 36) o This continues to demonstrate the importance of frequency on the US 36 corridor o Riders prefer the 86X since this route maintains the more predictable schedule with a consistent 10 minute frequency Route BMX and BV share similar loads from downtown Denver before reaching their first stops Route BF is a lower frequency service and averages the lowest load among the B routes The ridership and load patterns indicate that there is demand for express service at Broomfield, McCaslin, and Table Mesa during the PM peak 3/2/2015 23 Proposed US 36 BRT Service Plan Figure 17 - Westbound Boardings (Weekday) Total Weekday Boardings and Max Load by Trip: PM Peak Westbound BV Total Boardings BMX Total Boardings BF Total Boardings 86x Total Boardings HX Total Boardings Max Load 70 60 Seating Capacity 50 Schedule Guideline Capacity 40 30 20 10 - Figure 18 - PM Peak Westbound Loads (Weekday) Weekday Loads Along Corridor: PM Peak Westbound 40 Passenger Load 35 30 25 86X 20 BMX 15 BV 10 BF 5 0 0 5 10 15 20 25 30 2.5 TRAVEL TIME SAVINGS: EXPRESS VS. LOCAL Overall travel time and reliability is an important part of maintaining a competitive transit service. This is one of several components of the passenger experience that can help attract and maintain ridership. 3/2/2015 24 Proposed US 36 BRT Service Plan 2.5.1 Eastbound Travel Time Analysis In the AM peak, heading eastbound to DUS from Boulder Transit Center, Route BV has an average scheduled running time of 60 minutes (see Figure 19 - Weekday Travel Time Savings Eastbound). The average running time of Route BV was calculated without the two minute hold at Broomfield, which has been removed in the final service plan recommendations. This route serves all stations on the US 36 corridor. Route BMX and BX, the regional services between Boulder and Denver that by-pass selected stops, have average scheduled run times of 48 and 44 minutes, respectively. Riders that select Route BMX or BX at Boulder, Table Mesa, or McCaslin save more than 12 minutes of travel time compared to Route BV. The difference in run time between Route BMX and BX is four minutes with one additional stop for Route BMX. The four minute difference in travel time between Route BMX and BX is expected to be less when the McCaslin slip ramps are constructed for the BRT service. The difference in run time between Route BF and BV to and from Broomfield and downtown Denver is negligible with a one minute difference resulting from the additional stop at Westminster Center on Route BV. These trends continue during the midday and PM peak. Due to the current non-bidirectional HOV lanes, travel times for all routes are longer in the PM peak as compared to the AM peak and midday time periods. Riders that select either Route BMX or BX at the northernmost stations during the PM peak experience a travel time savings of over 11 minutes in comparison with Route BV. 2.5.2 Westbound Travel Time Analysis A similar analysis shows the scheduled savings in travel time heading westbound toward Boulder is less significant when compared to routes heading eastbound. Riders that select either Route BMX or BX to travel to the northernmost stations during the AM peak are scheduled to save an average of five minutes to twelve minutes compared to Route BV. Riders that select Route BMX to reach Boulder during the PM peak save eight minutes. Overall, the differences in running time between a Express and all-stop service from Boulder to downtown Denver is significant, but the differences in running time between similar patterns, Route BX/BMX and Route BV/BF, may not be significant enough to warrant four different patterns. Additionally, while there is value in Express service and shorter travel times, route frequency will be another factor in passenger decision making. Passengers will have less incentive to specifically choose a Express service over the allstop service at lower frequencies. Any reductions in travel time savings may be offset by increases in out-of-vehicle wait times. 3/2/2015 25 Proposed US 36 BRT Service Plan Figure 19 - Weekday Travel Time Savings Eastbound Average Weekday Travel Time: AM Peak Eastbound (Two minute hold at Broomfield is not shown) 1:10 Travel Time 1:00 BV 1:00 BF 0:50 0:59 0:48 0:44 BMX 0:40 BX 0:30 0:20 0:10 0:00 0 5 10 15 20 25 30 2.6 CURRENT RESOURCES Resources are determined using the following cost-related components for current services: revenue hours, revenue miles, trips, and peak vehicles (Figure 20 - Current Service Resources). 3/2/2015 26 Proposed US 36 BRT Service Plan Figure 20 - Current Service Resources Current Services Resources In-Service Annualized One-Way Hours Hours* Trips Weekday BV/BX/BMX/BF DD DM HX S T 86X Total Saturday BV/BMX Sunday BV Annual Total *Includes deadhead. 244 9 25 25 11 13 28 354 62,110 2,248 6,375 6,371 2,763 3,332 7,166 90,364 200 4 12 19 7 6 32 280 100 5,210 84 69 3,984 99,557 56 3 SERVICE LEVELS AND ENHANCEMENTS 3.1 ESTABLISHED MINIMUM SERVICE LEVELS In a 2012 memo to the US 36 Mayors/Commissioners Coalition (MCC), RTD established the minimum weekday peak and off-peak service levels that each station will receive when the BRT corridor opens (see Figure 21 - MCC Memo Peak Service Levels (Weekday)). These levels were established for four stations including Boulder (from Table Mesa Station), McCaslin, Broomfield, and Westminster Center. 3/2/2015 27 Proposed US 36 BRT Service Plan Figure 21 - MCC Memo Peak Service Levels (Weekday) Weekday Peak Service Levels from MCC Memo 1 Existing Direction 2015 2020 2030 (2012) 14 bus/hr 15 bus/hr 16 bus/hr 20 bus/hr Boulder – Denver Eastbound AM Peak 0F McCaslin – Denver Broomfield – Denver Westminster – Denver Westbound PM Peak Denver – Westminster Denver – Broomfield Denver – McCaslin Denver – Boulder 2035 24 bus/hr (4.3 min) (4 min) (3.75 min) (3 min) (2.5 min) 11 bus/hr 14 bus/hr 16 bus/hr 20 bus/hr 24 bus/hr (5.5 min) (4.3 min) (3.75 min) (3 min) (2.5 min) 5 bus/hr 8 bus/hr 10 bus/hr 12 bus/hr 16 bus/hr (12 min) (7.5 min) (6 min) (5 min) (3.75 min) 8 bus/hr 8 bus/hr 10 bus/hr 12 bus/hr 16 bus/hr (7.5 min) (7.5 min) (6 min) (5 min) (3.75 min) 5 bus/hr 5 bus/hr 6 bus/hr 8 bus/hr 12 bus/hr (12 min) (12 min) (10 min) (7.5 min) (5 min) 5 bus/hr 5 bus/hr 6 bus/hr 8 bus/hr 12 bus/hr (12 min) (12 min) (10 min) (7.5 min) (5 min) 8 bus/hr 10 bus/hr 12 bus/hr 20 bus/hr 24 bus/hr (7.5 min) (6 min) (5 min) (3 min) (2.5 min) 9 bus/hr 11 bus/hr 12 bus/hr 20 bus/hr 24 bus/hr (7 min) (5.5 min) (5 min) (3 min) (2.5 min) The existing service levels developed for the MCC Memo were based on the conditions in 2012. Since that time, a number of changes have been made to service levels on the US 36 corridor. This service plan updates the existing service levels outlined in the memo to reflect today’s conditions in 2014. The 2014 service levels account for the opening of DUS and include Routes BF, BMX, BV, BX, DD, DM, HX, S, T, and 86X. Routes AB, L, and LX were not included in the service level calculations as service plan recommendations will not be provided for these routes. 3.2 ENHANCEMENTS AND INVESTMENTS The US 36 BRT Project will include the partial reconstruction of US 36 and the addition of two new high-occupancy vehicle (HOV/HOT) lanes between Table Mesa and Pecos/Westminster. These managed lanes will extend the existing HOV lane, reducing travel times and increasing service reliability from Pecos/Westminster to Table Mesa. Since the Managed Lanes are located on the left side of the highway, they will be used for Express routes. Buses will be allowed to use the 12 foot right shoulder lanes during congested periods when highway speeds in the general lanes are less than 35 miles per hour. The maximum allowable speed for buses operating on the shoulder is 15 miles per hour above the traveling speed of traffic in the general lanes, up to a maximum of 35 mph. Use of the 1 Routes used to inform the service levels include Routes BF, BMX, BV, BX, DD, DM, HX, S, T, and 86X 3/2/2015 28 Proposed US 36 BRT Service Plan right Shoulder Lanes will create a more efficient and reliable schedule and will improve safety by reducing the need for buses to merge across congested lanes of traffic. Broomfield and McCaslin will have bus only slip ramps that give transit vehicles dedicated access for re-entering the highway, which reduces station stop delay. Buses serving the Westminster, Church Ranch, and Flatiron stations must exit and re-enter the highway with general traffic. The project will also include the reconfiguration of the existing US 36 bus stop stations, construction of new shelters, and addition of queue jump lanes. RTD will purchase 59 new over-the-road buses with a 57 seat per bus capacity for the US 36 corridor. 4 FRAMEWORK AND GUIDING PRINCIPLES The customer experience is a key element of service design and delivery. In order for transit to successfully generate ridership on the corridor, RTD must be able to offer a service that is convenient, easy to understand, and easy to use. RTD can positively shape the passenger experience with improved travel times, service reliability, and marketability. The proposed service plan directs RTD’s resources for the corridor in a manner that maximizes benefits for the agency and its customers. Ridership growth will come from current customers making new trips; improved retention of current customers; and new customers from emerging markets who are attracted to the improved services. The proposed service plan will fulfill RTD’s commitments to the corridor. 4.1 REDUCE TRAVEL TIMES Passenger travel times consist of two components: out-of-vehicle wait time and in-vehicle travel time. Both of these aspects are critical determinants for growing ridership and should be viewed as complimentary pieces. Industry experiences have shown that out-of-vehicle wait times are quite important to passengers. RTD will implement spontaneous use headways where supported by existing or potential ridership volumes. With spontaneous use frequencies, customers know that service is frequent enough that they can simply arrive at a transit stop to board the next bus without needing to consult the schedule. At lower frequencies, passengers typically schedule their arrival at the stop; they attempt to minimize uncertainty by arriving at a bus stop earlier than they would for a higher frequency service. Industry best practices have established 15 minute frequencies as the outer threshold for spontaneous use service with 10 minutes or better being the ultimate goal. In-vehicle travel time is dependent on a number of factors which include operating speed, traffic congestion, and dwell time. Operating speeds are expected to incrementally improve with the managed and shoulder lanes as well as the enhanced station access/egress along US Highway 36. Dwell times will be reduced by eliminating any scheduled holds for BRT service on the corridor; the regional service should not hold at stations for local routes. The local routes should be coordinated with the regional service. The service plan will aim to provide frequent service that minimizes the impact of out-of-vehicle wait times. Additionally, the service plan seeks to streamline service patterns based on impact to ridership and dwell times. 3/2/2015 29 Proposed US 36 BRT Service Plan 4.2 IMPROVE SERVICE RELIABILITY Reliability is a key attribute in retaining ridership. In addition to improving travel times, the lane treatments and enhanced station access/egress being provided on the corridor will also improve reliability. Use of the managed lanes and shoulder lanes will improve overall schedule reliability by reducing variance in the travel times. With improved frequencies on the corridor, buses will have more flexibility in responding to unforeseen incidents. If a disruption in service occurs, an improved frequency will mean that customers will have less time to wait for the next bus to arrive. 4.3 INCREASE CUSTOMER COMPREHENSION/EASE OF USE RTD will be offering a high level of service on the corridor when the BRT project is implemented. However, the agency will need to effectively communicate both the quantity and the quality of this service. RTD can accomplish this by making the system more marketable and easier to understand. Ease of use encompasses multiple aspects of the system from the service patterns to the fare structure. There are presently 13 existing routes providing regional transit service along the US 36 corridor with each route possessing a unique pattern of station stops. This configuration is difficult to understand for first-time or occasional customers seeking to use the system. Service on the corridor should be easy to understand; unproductive, infrequent patterns should be consolidated or discontinued. Consolidating routes will make the transit system easier to navigate and will help to reduce customer confusion. 4.4 MATCH SERVICE LEVELS WITH RIDERSHIP DEMAND Transit on the US 36 corridor is currently oriented towards downtown Denver commutes. As the shape and density of development along the corridor continue to change, RTD will need a flexible US 36 plan that can respond to the evolving marketplace. More specifically, RTD will need to better match service levels with ridership demand to ensure that the US 36 BRT service is successful and financially sustainable. The service evaluation identified that there was a significant difference in productivity by route and pattern. The proposed plan will use the findings from the service evaluation to identify high performing patterns that warrant additional investment as well as lower demand patterns that warrant adjustments in frequency. 5 PROPOSED SERVICE PLAN 5.1 BRT SERVICE PATTERNS The current service configuration is difficult to understand for new or occasional passengers. The immediate strategy is to simplify the corridor by minimizing the number of different services while providing spontaneous-use frequency where supported by market demand. As a result, the resources for Routes BF, BMX, BV, BX, DD, S, T, and 86X have been consolidated into five routes branded as the Flatiron Flyer: All Station Denver-Boulder 3/2/2015 30 Proposed US 36 BRT Service Plan TC (All Station); Express Denver-Boulder TC (Ltd); Denver-Westminster-Broomfield (DWB); Boulder TC-Anschutz (DM); and Boulder Junction-Civic Center (BJCC). See Figure 22 Proposed Service Patterns, Figure 23 - Proposed Frequencies (Weekday) and Figure 24 Service Pattern Schematic. The BJCC supplements the All Station service among Broomfield, Westminster Center and DUS, while the Express provides speedier long distance service among DUS, McCaslin, Table Mesa, and Boulder TC stations. The Boulder Junction at Depot Square service will offer 15 minute, bi-directional service during the peak periods to support the new development in east Boulder. Boulder-Anschutz (Route DM) will remain unchanged from its present operation. The routes in the proposed service plan each have a unique role and generate enough demand to warrant their inclusion on the corridor. Figure 25 - Proposed Weekday Schedule Eastbound through Figure 28 Proposed Sunday Schedule detail the span and frequencies for each proposed service. Figure 22 - Proposed Service Patterns X Broomfield Flatiron X X X X X X X X X X X X X X X X X X Boulder Junction at Depot Square Church Ranch X Boulder Transit Center Boulder TC-Anschutz X Table Mesa Denver-Westminster-Broomfield X McCaslin Express Denver-Boulder TC Westminster Center X X X All Station Denver-Boulder TC Boulder Junction-Civic Center Denver Union Station BRT Route Civic Center Proposed US 36 Service Patterns by Route X Figure 23 - Proposed Frequencies (Weekday) Proposed Weekday Frequencies by Time Period Westbound to Boulder Eastbound to Denver BRT Route AM PM AM Midday Midday PM Peak Peak Peak Peak 15 15 15 15 15 15 All-Station Denver-Boulder TC 10 10 10 10 Express Denver-Boulder TC 15 15 Denver-Westminster-Broomfield 30 30 Boulder TC-Anschutz 15 15 15 15 Boulder Junction-Civic Center 3/2/2015 31 Proposed US 36 BRT Service Plan Figure 24 - Service Pattern Schematic 3/2/2015 32 Proposed US 36 BRT Service Plan 5.2 BRT SERVICE LEVELS 5.2.1 All-Station Denver-Boulder Previously referred to as Route BV, the all-station service will operate with 15 minute, bidirectional frequencies along the US 36 corridor, serving all of the US 36 stations (See Figure 25 - Proposed Weekday Schedule Eastbound and Figure 26 - Proposed Weekday Schedule Westbound). The 15 minute frequencies will foster all-day, spontaneous use. The routing of the new all-station service will remain unchanged from the existing Route BV service. This route will be the spine of the corridor, providing passengers with a spontaneous use, all day service in both directions. Passengers will know that this route will connect them to any station on the corridor. This will set RTD up for success as the demand for intra-corridor connectivity increases. The all-station service is expected to utilize the Managed Lanes between Westminster Center and DUS as well as between Cherryvale and McCaslin. At all other times, the allstation service will travel in the general lanes and will utilize the Shoulder Lanes when traffic has slowed to less than 35 miles per hour. Weekend service on the corridor will be provided exclusively by more frequent all-station service since the market for express-stop service is reduced on the weekend (See Figure 27 - Proposed Saturday Schedule and Figure 28 - Proposed Sunday Schedule). All-station service will operate at 15 minute frequencies during the midday on Saturday and at 30 minute frequencies during the midday on Sunday. The all station buses serve local stops between Boulder Transit Center and Table Mesa. While these stops may add ridership, they also increase travel time and operating costs. RTD and the City of Boulder will examine ridership along Table Mesa Drive and Broadway to identify the costs and benefits of improved stop spacing and other transit priority measures. 5.2.2 Denver-Westminster-Broomfield (DWB) The corridor will also feature additional trips between Broomfield, Westminster Center, and DUS during the peak periods in place of Routes 86X and BF. These short trips will operate 15 minute frequencies in the AM peak heading eastbound towards downtown Denver and 15 minute frequencies in the PM peak heading westbound towards Broomfield. Combined with the All-Station and BJCC services, Westminster Center and Broomfield will average 12 trips per hour or service every 5 minutes during peak periods in the peak direction. Route 86X is currently the most productive route on the corridor. This connection between Westminster and DUS will be maintained but the resources for this service will be rebranded to unify the corridor. Integration with local bus service and Call-n-Ride service will be essential to provide for improved connectivity at the station stops. Station stops at Westminster Center and Broomfield possess the most local bus service on the US 36 corridor. Broomfield operates 3/2/2015 33 Proposed US 36 BRT Service Plan on a pulse-based system with departures occurring at 5 and 35 minutes after the hour. In order to improve operating speeds, the BRT service should not hold at any station. The corridor will offer frequent service that will minimize out-of-vehicle wait times and local services will be tailored to meet the BRT service, if necessary. At Westminster Center, local routes currently share the same stop with Express and Regional routes. The local routes will be reconfigured to utilize the space in the parking lot or on the street, adjacent to the US 36 station stop, for passenger boardings and alightings. This configuration would reduce traffic at the BRT station stop and would facilitate a better flow of BRT vehicles through the stations, thereby reducing potential delays and improving overall travel times while maintaining transfer proximity for the connecting local services. 5.2.3 Express The Express route will connect DUS and Boulder Transit Center via McCaslin and Table Mesa. This service will take on the role that is currently being filled by Routes BMX and BX. An analysis of the existing conditions concluded that the ridership trends did not support operating the two separate patterns. The express route will provide 10 minute, bidirectional service during the AM and PM peaks. Express buses will use the new HOV/HOT managed lanes between Table Mesa and Pecos/Westminster and the existing HOV/HOT lanes from there to Union Station. Under free-running conditions the bus operator may choose to use the general purpose lanes between Table Mesa and McCaslin. 5.2.4 Boulder-Anschutz (DM) There are no proposed service pattern changes to Route DM. The route will remain unchanged and will operate a 30 minute frequency in the peak direction only. 5.2.5 Boulder Junction at Depot Square-Civic Center (BJCC) The Boulder Junction at Depot Square-Civic Center route (a combination of existing Routes HX and S) will now also serve Westminster and Broomfield with 15 minute, bi-directional service during the peak periods along the current HX routing on 28th Street in Boulder and 19th /20th Streets in Denver. Additional trips aim to serve demonstrated growth on the HX and potential demand from land use development in Boulder. These service levels will be monitored closely after service opens to determine if additional service is warranted, as the current and potential demand is not sufficient to support higher frequency or broader service span for opening day. The Flatiron and Church Ranch Station stops are the least active stations on the US 36 corridor and are not proposed stops for opening day. 3/2/2015 34 Proposed US 36 BRT Service Plan Figure 25 - Proposed Weekday Schedule Eastbound AM Early AM Peak Midday PM Peak PM Evening PM Late Other 4:00 - 5:00 am 30 2 5:00 - 6:00 am 15 4 6:00 - 7:00 am 15 4 15 7:00 - 8:00 am 15 4 8:00 - 9:00 am 15 4 9:00 - 10:00 am 15 4 10:00 - 11:00 am 15 4 11:00 - 12:00 pm 15 4 12:00 - 1:00 pm 15 4 1:00 - 2:00 pm 15 4 2:00 - 3:00 pm 15 4 3:00 - 4:00 pm 15 4:00 - 5:00 pm Trips (per hour) Boulder Anschutz Headway (min) Trips (per hour) Boulder Junction at Depot Square Civic Center 15 4 30 2 15 4 4 10 6 30 2 15 4 15 4 10 6 30 2 15 4 15 4 10 6 15 4 4 10 6 15 4 15 4 10 6 15 4 5:00 - 6:00 pm 15 4 10 6 15 4 6:00 - 7:00 pm 15 4 7:00 - 8:00 pm 15 4 8:00 - 9:00 pm 15 4 9:00 - 10:00 pm 30 2 10:00 - 11:00 pm 30 2 11:00 - 12:00 am 30 2 12:00 - 1:00 am 60 1 1:00 - 2:00 am 3/2/2015 Express Denver Boulder Headway (min) Trips (per hour) Headway (min) Span Trips (per hour) Time Period Denver Westminster Broomfield Headway (min) Eastbound to Denver All-Station Denver Boulder Headway (min) Trips (per hour) Weekday – EASTBOUND TO DENVER 35 Proposed US 36 BRT Service Plan Figure 26 - Proposed Weekday Schedule Westbound Weekday – WESTBOUND TO BOULDER AM Early AM Peak Midday PM Peak PM Evening PM Late Other 3/2/2015 Headway (min) Trips (per hour) Boulder Anschutz Trips (per hour) Express Trips (per hour) Headway (min) Trips (per hour) Headway (min) Span Denver Westminster Broomfield Headway (min) Time Period Headway (min) Trips (per hour) Westbound to Boulder All-Station Denver Boulder Boulder Junction at Depot Square Civic Center 4:00 - 5:00 am 60 1 5:00 - 6:00 am 15 4 6:00 - 7:00 am 15 4 10 6 15 4 7:00 - 8:00 am 15 4 10 6 15 4 8:00 - 9:00 am 15 4 10 6 15 4 9:00 - 10:00 am 15 4 10:00 - 11:00 am 15 4 11:00 - 12:00 pm 15 4 12:00 - 1:00 pm 15 4 1:00 - 2:00 pm 15 4 2:00 - 3:00 pm 15 4 3:00 - 4:00 pm 15 4 15 4 10 6 30 2 15 4 4:00 - 5:00 pm 15 4 15 4 10 6 30 2 15 4 5:00 - 6:00 pm 15 4 15 4 10 6 30 2 15 4 6:00 - 7:00 pm 15 4 15 4 15 4 7:00 - 8:00 pm 15 4 8:00 - 9:00 pm 15 4 9:00 - 10:00 pm 30 2 10:00 - 11:00 pm 30 2 11:00 - 12:00 am 30 2 12:00 - 1:00 am 30 2 1:00 - 2:00 am 60 1 36 Proposed US 36 BRT Service Plan Figure 27 - Proposed Saturday Schedule Saturday – BOTH DIRECTIONS All-Station Denver Saturday Boulder Midday PM Peak PM Evening PM Late Other Trips (per hour) AM Peak Headway (min) AM Early Trips (per hour) Time Period 5:00 - 6:00 am 60 1 6:00 - 7:00 am 60 1 60 1 7:00 - 8:00 am 30 2 30 2 8:00 - 9:00 am 15 4 30 2 9:00 - 10:00 am 15 4 15 4 10:00 - 11:00 am 15 4 15 4 11:00 - 12:00 pm 15 4 15 4 12:00 - 1:00 pm 15 4 15 4 1:00 - 2:00 pm 15 4 15 4 2:00 - 3:00 pm 15 4 15 4 3:00 - 4:00 pm 15 4 15 4 4:00 - 5:00 pm 15 4 15 4 5:00 - 6:00 pm 15 4 15 4 6:00 - 7:00 pm 30 2 30 2 7:00 - 8:00 pm 30 2 30 2 8:00 - 9:00 pm 30 2 30 2 9:00 - 10:00 pm 30 2 30 2 10:00 - 11:00 pm 30 2 30 2 11:00 - 12:00 am 30 2 30 2 12:00 - 1:00 am 60 1 60 1 1:00 - 2:00 am 60 1 60 1 60 1 Span 4:00 - 5:00 am 2:00 – 3:00 am 3/2/2015 Westbound Headway (min) Eastbound All-Station Denver Boulder 37 Proposed US 36 BRT Service Plan Figure 28 - Proposed Sunday Schedule Sunday – BOTH DIRECTIONS All-Station Denver Sunday Boulder Midday PM Peak PM Evening PM Late Other Trips (per hour) AM Peak Headway (min) AM Early Trips (per hour) Time Period 6:00 - 7:00 am 60 1 7:00 - 8:00 am 60 1 60 1 8:00 - 9:00 am 60 1 60 1 9:00 - 10:00 am 60 1 60 1 10:00 - 11:00 am 30 2 60 1 11:00 - 12:00 pm 30 2 30 2 12:00 - 1:00 pm 30 2 30 2 1:00 - 2:00 pm 30 2 30 2 2:00 - 3:00 pm 30 2 30 2 3:00 - 4:00 pm 30 2 30 2 4:00 - 5:00 pm 30 2 30 2 5:00 - 6:00 pm 30 2 30 2 6:00 - 7:00 pm 60 1 30 2 7:00 - 8:00 pm 60 1 60 1 8:00 - 9:00 pm 60 1 60 1 9:00 - 10:00 pm 60 1 60 1 10:00 - 11:00 pm 60 1 60 1 11:00 - 12:00 am 60 1 60 1 12:00 - 1:00 am 60 1 60 1 60 1 Span 4:00 - 5:00 am 5:00 - 6:00 am 1:00 - 2:00 am 3/2/2015 Westbound Headway (min) Eastbound All-Station Denver Boulder 38 Proposed US 36 BRT Service Plan 5.3 LOCAL & OTHER SERVICES With the implementation of US 36 BRT, the following adjustments to local and other services are proposed, grouped by Park-n-Rides as well as the new Boulder Junction at Depot Square within the City of Boulder. 5.3.1 US 36 & Table Mesa Park-n-Ride 5.3.1.1 Route 206 Pearl/Manhattan/Fairview High School Discontinue the route segment between Boulder Junction at Depot Square (BJDS) and Boulder Transit Center due to low ridership averaging 8 passengers per service hour or 1.5 passengers per trip and duplicative service provided by Routes 205 and HOP. Increase the frequency between BJDS and Flatiron Business Park to 15 minutes in the peaks with a timed connection with Route BJCC. Boulder Junction at Depot Square will be the new western terminal for this route. This is part of the recently revised Boulder Transportation Master Plan. 5.3.2 US 36 & McCaslin Park-n-Ride When the planned development for both Superior Town Center and the area of South Boulder Road and 96th Street occurs, RTD will consider changes to local services. 5.3.3 US 36 & E Flatiron Center Park-n-Ride No local route changes are proposed. 5.3.3.1 Route AB Boulder/Denver International Airport Route AB will become SkyRide service from Boulder Transit center/Louisville/Superior directly to Denver International Airport and not a US 36 BRT route. The route will operate hourly via US 36 to US 36 & Flatiron Center Station East, NW Parkway/E-470, Pena Blvd to Denver International Airport (DIA) (peak CU demand will be accommodated as now with supplemental trips). The ABA is discontinued—Stapleton and Airport/40th will be served by the A-Line when opened in 2016. 5.3.4 US 36 & Broomfield Park-n-Ride No local route changes are proposed. Since the AB is discontinued from this station, customers can take the Flatiron Flyer to Flatiron Station connecting to the AB to DIA (takes slightly less travel time than currently). Development is scheduled to occur within the area of this PnR, both on the east and west side of US 36, as well as within the Interlocken Business Park. When this occurs, RTD will consider service changes as appropriate and warranted. 5.3.5 US 36 & Church Ranch Park-n-Ride No local route changes are proposed. 5.3.6 US 36 & Westminster Center Park-n-Ride No local route changes are proposed. Since the AB is discontinued from this station, customers can take the NW Rail (or the Flatiron Flyer until the rail line opens) to Union Station connecting to the A-Line to DIA (takes slightly longer travel time than currently). 3/2/2015 39 Proposed US 36 BRT Service Plan 5.3.7 Other Services 5.3.7.1 Boulder Junction at Depot Square Boulder Junction at Depot Square is a new RTD facility that will be one of the termini within the City of Boulder for US 36 BRT services. Routes HX and S will be consolidated into the Route BJCC and will be rerouted and extended into Boulder Junction at Depot Square from their current terminals at Pearl Street/ 29th Street for route HX, and Pearl Street/49th Street for route S. 5.3.7.2 70th Avenue & Broadway Park-n-Ride When the Routes DD and T are discontinued (alternative connecting routes will be available), no regional routes will continue to serve this location. It is proposed to close this Park-n-Ride with the opening of US 36 BRT due to very low usage on these routes averaging a combined 15 passengers per day. Service connections for Routes 8, 31X and 72 will be provided on-street at the intersection of 70th Avenue and Broadway. 5.4 ESTIMATED RIDERSHIP Figure 29 - Estimated 2016 Flatiron Flyer Weekday Boardings presents estimates of ridership at the station level that would be expected to be achieved in the first year of service. These estimates are based on August-December 2015 boardings and vehicle trips by station and time period. Because of the consolidation of routes, ridership by route is not easily estimated and RTD will closely monitor customer travel patterns and adjust service frequencies as warranted. These estimates are based on a higher than normal ridership response to frequency improvements to also account for anticipated improvements in speed and reliability. These estimates are somewhat conservative because demand induced by new reverse direction and off-peak services was not estimated; however, these services are not constrained by capacity. Note that the current boardings are different from those in Figure 14 because they are from a different time period and do not include Routes AB/ABA and L/LX. Total boardings are expected to increase approximately 1,600 per weekday or about 28%. 3/2/2015 40 Proposed US 36 BRT Service Plan Figure 29 - Estimated 2016 Flatiron Flyer Weekday Boardings Station Current* Estimated Boulder Transit Center 527 648 Boulder Junction 67 108 Table Mesa 505 594 McCaslin 464 610 Flatiron 246 346 Broomfield 505 758 Church Ranch 192 219 Westminster 1,025 1,581 Union Station 2,105 2,326 Civic Center 127 194 Total 5,763 7,384 *Routes: 86X, BF, BMX, BV, BX, DD, DM, HX, S, T 5.5 PROPOSED RESOURCES The proposed service plan resources (see Figure 30 - Proposed Services Resources) results in an increase of 10,429 annualized hours, or 10.5% more than current service. Estimated peak vehicle requirements of 41 are well within the 59 vehicles (including spares) being purchased, allowing for additional services as warranted. Actual resources will be refined when schedules are produced. 3/2/2015 41 Proposed US 36 BRT Service Plan Figure 30 - Proposed Services Resources Proposed Services Resources Service Anualized One-Way Peak Hours Hours* Trips Vehicles Weekday All Station 168 46,182 145 10 Denver-Westminster-Broomfield 24 6,597 24 4 Limited 84 23,091 88 12 Boulder Junction-Civic Center 66 18,143 56 9 DM 25 6,375 12 6 Subtotal 367 100,387 325 41 Saturday All Station 109 6,110 109 Sunday All Station 56 3,488 56 Annual Total 109,986 * Includes deadhead. 6 PROCESS & OTHER ISSUES 6.1 PROCESS RTD is developing this service plan in concert with state, county, municipal and other transportation stakeholders and customer and public input on the following schedule: Proposed US 36 Service Plan – January 8, 2015 COMPLETE Stakeholder meetings to review proposed service plan – January 9 - February 10, 2015 COMPLETE Review Proposed US 36 Service Plan with RTD Board Operations Committee – February 10, 2015 COMPLETE Revised Proposed US 36 Service Plan – March 9, 2015 COMPLETE Conduct public meetings on Proposed US 36 Service Plan – March 16 - April 30, 2015 Revised Proposed Service Plan based on public input – May 31, 2015 Board approval of Final US 36 Service Plan – June 16, 2015 Implement service plan – January 2016 (estimated) This schedule provides time for substantial review and comment. The plan will be made available on RTD’s website for the widest possible access. In addition RTD staff will be available to make presentations to groups as a forum for detailed discussions. To request a presentation please contact Nataly Erving at [email protected] or 303-2992059. Email comments should be sent to [email protected] with subject line “US 36 Service Plan.” 3/2/2015 42 Proposed US 36 BRT Service Plan 6.2 CHANGES AFTER IMPLEMENTATION With the implementation of major service changes such as this, RTD closely monitors ridership response and operations to detect and remedy problems as soon as possible. Trips that are overloaded or unable to make their schedule are typically addressed immediately by supervisory staff with standby buses and within days with schedule adjustments. Ridership and service patterns settle down in about 6 to 9 months after implementation and RTD will recommend changes to take effect about one year after opening. 6.3 ISSUES RAISED IN THE PUBLIC INPUT PROCESS To be determined. 3/2/2015 43


© Copyright 2026