
Annual Report 2014
Annual Report 2014 Contents The Company 2Foreword 6 Report of the Supervisory Board 12 Delivering on our strategy 26 Management Board Our business units Laundry & Home Care Our top brands + 4.6 % Group management report 28 29 50 55 63 88 100 108 109 Group management report subindex Corporate governance Shares and bonds Fundamental principles of the Group Economic report Business units Risks and opportunities report Forecast Subsequent events Consolidated financial statements 110Consolidated financial statements subindex 112Consolidated statement of financial position 114 Consolidated statement of income 115Consolidated statement of comprehensive income 115Consolidated statement of changes in equity 116 Consolidated statement of cash flows 117Notes to the consolidated financial statements 175Independent Auditor’s Report 179Responsibility statement by the Personally Liable Partner 180Corporate management bodies of Henkel AG & Co. KGaA organic sales growth Beauty Care Our top brands + 2.0 % organic sales growth Adhesive Technologies Our top brands Further information 184 Quarterly breakdown of key financials 185 Multi-year summary 186 Index of tables and graphs 188 Glossary 191 Credits 192Contacts Financial calendar + 3.7 % organic sales growth Key financials Laundry & Home Care 4 4,319 2011 4,304 4.8 % 2012 4,556 13.3 % – 1.6 pp 2013 4,580 16.2 % 0.6 pp 2014 4,626 2013 2014 +/– 4,580 4,626 1.0 % Operating profit (EBIT) 682 615 – 9.8 % Adjusted 1 operating profit (EBIT) 714 749 Return on sales (EBIT) 14.9 % Adjusted 1 return on sales (EBIT) 15.6 % pp = percentage points 1 Adjusted for one-time charges/gains and restructuring charges. Key financials Beauty Care 0 6 3,399 3.5 % 2012 3,542 11.9 % – 1.6 pp 2013 3,510 15.3 % 0.3 pp 2014 3,547 +/– 1.0 % Operating profit (EBIT) 474 421 – 11.2 % Adjusted 1 operating profit (EBIT) 525 544 Return on sales (EBIT) 13.5 % Adjusted 1 return on sales (EBIT) 15.0 % pp = percentage points 1 Adjusted for one-time charges/gains and restructuring charges. Key financials Adhesive Technologies 0 8 2014 +/– 2,000 8,000 7 4,000 6,000 8,000 Sales Adhesive Technologies 9 in million euros 2010 7,306 2011 7,746 Sales 8,117 8,127 0.1 % Operating profit (EBIT) 1,271 1,345 5.9 % Adjusted 1 operating profit (EBIT) 1,370 1,402 2.3 % 2012 8,256 Return on sales (EBIT) 15.7 % 16.6 % 0.9 pp 2013 8,117 Adjusted 1 return on sales (EBIT) 16.9 % 17.2 % 0.3 pp 2014 8,127 pp = percentage points 1 Adjusted for one-time charges/gains and restructuring charges. 6,000 in million euros 2011 2014 3,547 4,000 Sales Beauty Care 3,269 2013 3,510 2013 2,000 2010 in million euros Sales 5 in million euros 2010 in million euros Sales in million euros Sales Laundry & Home Care 0 2,000 4,000 6,000 8,000 Highlights 2014 Sales EBIT EPS Dividend + 3.4 % 15.8 % 4.38 euros 1.31 euros organic sales growth adjusted 1 return on sales (EBIT): up 0.4 percentage points adjusted 1 earnings per preferred share (EPS): up 7.6 percent dividend per preferred share 2 Key financials 1 2010 2011 2012 2013 2014 in million euros +/– 2013 – 2014 15,092 15,605 16,510 16,355 16,428 0.4 % Operating profit (EBIT) 1,723 1,765 2,199 2,285 2,244 – 1.8 % Adjusted 1 operating profit (EBIT) 1,862 2,029 2,335 2,516 2,588 2.9 % Sales Return on sales (EBIT) in % 11.4 11.3 13.3 14.0 13.7 – 0.3 pp Adjusted 1 return on sales (EBIT) in % 12.3 13.0 14.1 15.4 15.8 0.4 pp Net income 1,143 1,191 1,526 1,625 1,662 2.3 % – 25 – 30 – 46 – 36 – 34 – 5.6 % 1,118 1,161 1,480 1,589 1,628 2.5 % – Attributable to non-controlling interests – Attributable to shareholders of Henkel AG & Co. KGaA Earnings per preferred share in euros 2.59 2.69 3.42 3.67 3.76 2.5 % Adjusted 1 earnings per preferred share in euros 2.82 3.14 3.63 4.07 4.38 7.6 % Adjusted 1 earnings per preferred share in euros (2012 before IAS 19 revised) 3.70 Return on capital employed (ROCE) in % 14.9 15.8 18.7 4.07 20.5 4.38 19.0 7.6 % – 1.5 pp Dividend per ordinary share in euros 0.70 0.78 0.93 1.20 1.29 2 7.5 % Dividend per preferred share in euros 0.72 0.80 0.95 1.22 1.31 2 7.4 % pp = percentage points 1 Adjusted for one-time charges/gains and restructuring charges. 2 Proposal to shareholders for the Annual General Meeting on April 13, 2015. 2 Sales by business unit Beauty Care 22 % Corporate 1 % 3 Sales by region J apan / Australia / New Zealand North America 2 % 28 % Corporate = sales and services not assignable to the individual business units. 1 % Emerging markets ¹ 44 % 18 % 2014 Laundry & Home Care Corporate 2014 Adhesive Technologies 49 % Western Europe 35 % 1 Eastern Europe, Africa/Middle East, Latin America, Asia (excluding Japan). Annual Report 2014 our vision A global leader in brands and technologies. our values We put our customers at the center of what we do. We drive excellent sustainable financial performance. We value, challenge and reward our people. We are committed to leadership in sustainability. We build our future on our family business foundation. our targets 2016 Outperform Leverage potential in categories Globalize Focus on regions with high potential A global leader in brands and technologies Simplify Drive operational excellence 20 bn € sales 10 bn € sales in emerging markets 10 % annual growth in earnings per share 1 Inspire Strengthen our global team 1 Average annual growth in adjusted earnings per preferred share (compound annual growth rate / CAGR). Including continuous portfolio optimization. 2 Henkel Annual Report 2014 Kasper Rorsted Chairman of the Management Board “In 2014, we achieved our financial targets, made very good progress with our strategy implementation and laid a strong foundation to achieve our targets for 2016.” Henkel Annual Report 2014 3 In 2014, we made very good progress in implementing our strategy and delivering on our financial targets. Guided by our long-term vision to become a global leader in brands and technologies, a set of shared values, a clear strategy and ambitious targets for the period up to 2016, we were able to navigate our company through a challenging, volatile global environment. In 2014, the global economy achieved only moderate growth. The conflict between Russia and Ukraine impacted the overall economic situation beyond Eastern Europe, in particular during the second half of the year. While emerging markets continued to grow faster than mature markets, their momentum slowed during the year. This development was accentuated by the ongoing devaluation of many emerging market currencies as well as continued unrest in the Middle East. In the mature markets, the eurozone still did not return to stable growth, while Germany benefited from rising employment numbers and modest economic growth. The US economy improved during the year on the back of lower energy costs, higher employment and improving business dynamics. Excellence in execution and our continued cost focus helped us to meet our financial targets for fiscal 2014 and make progress toward our financial targets for the period up to 2016: 20 billion euros sales, 10 billion euros emerging markets sales and 10 percent compound annual growth (CAGR) in adjusted earnings per preferred share (EPS). At the beginning of 2014, the Henkel family extended its share-pooling agreement, which covers around 61 percent of the ordinary voting shares. The agreement was concluded for an indefinite term and can now first be terminated as of December 31, 2033. As the Management Board, we welcome and appreciate the family’s long-term commitment to the company and the trust they put into Henkel’s strategy and future growth potential. Good business performance in 2014 In 2014, Henkel reported Group sales of 16,428 million euros, representing solid organic growth of 3.4 percent. Reported sales were slightly above previous-year level. Adjusted 1 earnings before interest rates and taxes (EBIT) grew by 2.9 percent to 2,588 million euros compared to 2,516 million euros in 2013. Adjusted 1 return on sales climbed to 15.8 percent, a strong increase over the 15.4 percent in the previous year. Adjusted 1 earnings per preferred share (EPS) grew 7.6 percent to 4.38 euros. All three business units contributed with profitable organic growth to this good performance. As in previous years, emerging markets were the main growth drivers for Henkel. They reported very strong organic growth of 7.8 percent, while on a reported basis sales were slightly above the level of the previous year, mainly due to negative exchange rates. In mature markets, organic sales were up slightly. We generated cash flow from operating activities of 1,914 million euros and invested substantially in strengthening our business. Capital expenditures (excluding acquisitions) rose to 517 million euros after 436 million euros in the previous year. In addition, we closed a number of sizeable acquisitions to strengthen all three business units with a total volume of 1.8 billion euros. At the Annual General Meeting on April 13, 2015, we will propose to our shareholders a dividend payment of 1.31 euros per preferred share. This represents an increase of 7.4 percent compared to the 1.22 euros paid out in 2014. + 3.4 % organic sales growth. 15.8 % adjusted 1 return on sales. + 7.6 % adjusted 1 earnings per preferred share. 1 Adjusted for one-time charges / gains and restructuring charges. 4 Henkel Annual Report 2014 “We will outperform our competition as a globalized company with simplified operations and a highly inspired team.” By focusing on this strategy, combined with high flexibility and fast response to changing market conditions, we were able to make 2014 another successful year for Henkel. Outperform our competition 59 % of sales generated by top 10 brands. We continued to strengthen our top brands in 2014. The share of sales generated by our top 10 brands further increased from 57 percent to 59 percent of total sales. Our top three brands, Persil, Schwarzkopf and Loctite, generated around 5 billion euros. This is a result of our ongoing investments in innovation and brand equity. Strong, recognized brands generate higher margins and drive our performance in highly competitive global markets. Successful innovations are key in all our business units. Over the past years, we have continuously expanded existing research and development centers and opened new ones, especially in emerging markets such as India, South Africa and South Korea. In 2014, we generated more than 45 percent of sales in our Laundry & Home Care and Beauty Care businesses with products launched within the last three years. In our Adhesive Technologies business, the share of sales from products launched within the last five years increased to more than 30 percent. We continued to strengthen the close relationships with our major retail and industrial customers. This commitment to customer focus helped us to generate a growing share of sales with them. Globalize our company 44 % of sales generated in emerging markets. In 2014, the share of emerging market sales amounted to 44 percent, at the level of the previous year, as a number of emerging market currencies declined. Despite higher volatility and adverse currency developments in these countries, we are firmly committed to further strengthening our market positions, expanding into new segments and selectively entering new markets. In mature markets, we reported organic growth slightly above the previous year. We benefited from our established strong market positions across a broad range of categories as well as the overall positive economic development in our home market Germany. In the US market, however, we were not able to capture the full growth potential. We enhanced our global footprint in 2014 through a number of targeted acquisitions: The acquisition of the Spotless Group will strengthen the position of our Laundry & Home Care business in Western Europe. We also bought three US hair professional companies, making Henkel one of the top three companies in the world’s largest hair professional market. With the acquisition of The Bergquist Company in the USA, we will be able to market Bergquist’s leading thermal management technologies to our customers on a global scale, both in mature and emerging markets. Simplify our operations We are convinced that digitization can create important competitive advantages for our company. Consequently, we have progressed the development of standardized, scalable business platforms to become faster and more efficient. This includes the start of the rollout of our integrated SAP platform in Europe after its successful launch in Asia in 2013. In addition, we converted over 45,000 users at Henkel to a new digital workplace environment which will enable better collaboration and networking for our employees around the world. Henkel Annual Report 2014 5 In 2014, we began to combine our supply chain and sourcing activities into an integrated global supply chain organization and expanded our network of global sourcing hubs. Inspire our global team Only a strong global team can drive excellent performance – especially in a challenging business environment. We put particular emphasis on attracting, developing and retaining talents especially in emerging markets, through specifically designed programs. At the same time, we aim to continuously improve and strengthen our leadership team and foster a unique performance culture at Henkel. We are proud that we were also able to promote around 1,150 employees over the course of the year. For a global company, a diverse workforce that unites different cultural backgrounds and work experience is an important success factor. We actively manage diversity and have made significant progress over the past years. In 2014, the share of employees in emerging markets was around 57 percent and the share of female managers increased to around 33 percent (excluding acquisitions). Around 33 % of our managers are women. Creating more value at a reduced footprint Henkel has had a long-standing commitment to sustainability. We have defined a longterm strategy for our company, aiming at becoming three times more efficient by 2030 than in the base year 2010 – we want to improve by “Factor 3.” We made very good progress toward these highly ambitious targets in 2014. We have already achieved the intermediate targets we set for 2015 in four out of our six sustainability focal areas. This strong performance has been recognized externally. We again achieved leading positions in the Dow Jones Sustainability Index as well as in several other rankings and indices. Well on track to achieving our targets 2014 was a successful year for Henkel in many respects. We achieved our financial targets, made very good progress with our strategy implementation and laid a strong foundation to achieve our targets for 2016. On behalf of the Management Board, I would like to thank all Henkel employees for their dedication and contribution to our business performance. I would also like to thank our supervisory bodies for their extremely valuable advice. On behalf of Henkel, I would like to especially thank you, our shareholders, for your trust and support. We also thank our customers around the world for their confidence in our company, people, brands and technologies. Everyone at Henkel is fully committed to our strategy and targets. We are well on track and will continue relentlessly to implement our strategy globally and to deliver excellent performance. Düsseldorf, January 30, 2015 Sincerely, Kasper Rorsted Chairman of the Management Board Factor 3 6 Report of the Supervisory Board Dr. Simone Bagel-Trah Chairwoman of the Shareholders’ Committee and the Supervisory Board Henkel Annual Report 2014 “Henkel is well equipped for the challenges of the year ahead, and we are confident that we will reach our goals.” Henkel Annual Report 2014 In a difficult environment characterized by high volatility in our markets, the conflict between Russia and Ukraine, and continued political unrest in the Middle East, the company ended fiscal 2014 in an encouraging position. All of our business units recorded organic sales growth and contributed to the significant increase in our earnings. On behalf of the Supervisory Board, I would like to thank all of our employees for their exceptional commitment. Thanks are equally due to the members of the Management Board who have steered the company successfully through these challenging times. We are also grateful to our employee representatives and Works Councils for their continuous and constructive support in moving our company forward. Finally, I would like to thank you, our shareholders, for your continued confidence in our company this past fiscal year. Ongoing dialog with the Management Board Again in fiscal 2014, we diligently discharged our duties as the Supervisory Board in accordance with the legal statutes, Articles of Association and rules of procedure governing our actions. In particular, we carefully and regularly monitored the work of the Management Board, advising and supporting it in its stewardship, in the strategic further development of the company, and in decisions relating to matters of major importance. The Management Board and the Supervisory Board continued to cooperate in 2014 through extensive dialog founded on mutual trust and confidence. The Management Board kept us regularly and extensively informed of all major issues affecting the corporation’s business and our Group companies with prompt written and oral reports. Specifically, the Management Board reported on the business situation, operational development, business policy, profitability issues, our short-term and long-term corporate, financial and personnel plans, as well as capital expenditures and organizational measures. Quarterly reports focused on the sales and profits of Henkel Group as a whole, with further analysis by business unit and region. All members of the Supervisory Board had sufficient opportunity to critically review and address the issues raised by each of these reports. Report of the Supervisory Board Outside of Supervisory Board meetings, the Chairman of the Audit Committee and I, as Chairwoman of the Supervisory Board, remained in regular contact with the Chairman of the Management Board. This procedure ensured that we were constantly aware of current business developments and significant events at all times. The other members were informed of major issues by no later than the next Supervisory Board or committee meeting. The Supervisory Board and the Audit Committee each held four regular meetings in fiscal 2014. Attendance at the Supervisory Board and committee meetings averaged 97 percent and 88 percent respectively in the year under review. No member took part in fewer than half of the Supervisory Board and committee meetings. There were no indications of conflicts of interest involving Management Board or Supervisory Board members which had to be disclosed to the Super visory Board and reported to the Annual General Meeting. Major issues discussed at Supervisory Board meetings In each of our meetings, we discussed the reports submitted by the Management Board, conferring with it on the development of the corporation and on strategic issues. We also discussed the overall economic situation and Henkel’s business performance. In our meeting on February 28, 2014, we focused on approving the annual and consolidated financial statements for 2013, including the risk report and corporate governance report, the 2014 Declaration of Compliance, and our proposals for resolution by the 2014 Annual General Meeting. We also discussed the results of the Supervisory Board’s efficiency audit. A detailed report of this was included in our last Annual Report. The establishment of an independent supply chain company was also addressed at this meeting. 7 8 Report of the Supervisory Board In addition to the general business performance in the first months of the year and the development of our businesses in North America, our meeting on April 4, 2014 focused on the performance of our business units in the Africa/Middle East region. We extensively discussed the p riorities and initiatives of the business units based on our four strategic priorities: Outperform, Globalize, Simplify and Inspire. Our meeting on September 19, 2014 focused on future projects and their implementation in our new unit, Integrated Business Solutions, which combines our IT organization and our shared services. These pro jects are aimed at further improving process quality and transparency through ongoing standardization of technologies, strategies, and processes. For example, we discussed master data and supplier management and reviewed IT system standardization that will result in a substantial simplification of our system architecture. We also discussed business performance at this meeting and the priorities and measures being taken by our business units in Eastern Europe. The political developments in Ukraine and Russia and their impact were an important part of these discussions. Our meeting on December 12, 2014 focused on the expected figures for 2014 and on our assets and financial planning for fiscal 2015, including the associated budgets of our business units, which we discussed in detail based on comprehensive documentation. We also reviewed our sustainability strategy and progress with our three strategic principles: products, partners, and people. Henkel Annual Report 2014 Supervisory Board committees In order to efficiently comply with the duties incumbent upon us according to legal statute and our Articles of Association, we have established an Audit Committee and a Nominations Committee. The Audit Committee was chaired in the year under review by Prof. Dr. Theo Siegert, who complies with the statutory requirements of impartiality and expertise in the fields of accounting or auditing. For more details on the responsibilities and composition of these committees, please refer to the corporate governance report on pages 29 to 37 and the membership lists on page 181. Committee activities Pursuant to its appointment by the 2014 Annual General Meeting, the Audit Committee mandated the external auditor to audit the annual financial statements and the consolidated financial statements, and to review the interim financial reports for 2014. The audit fee and focus areas of the audit were also established. The Audit Committee obtained the necessary validation of auditor independence for the performance of these tasks. The auditor has informed the Audit Committee that there are no circumstances that might give rise to a conflict of interest in the execution of its duties. The Audit Committee met four times in the year under review. The meetings and resolutions were prepared through the provision of reports and other information by the Management Board. The Chair of the Committee reported promptly and in full to the plenary Supervisory Board on the content and results of each of the Committee meetings. Henkel Annual Report 2014 All Audit Committee meetings focused on the company and Group accounts, including the interim (quarterly and half-year) financial reports, with all matters arising being duly discussed with the Management Board. The three meetings at which we discussed and approved the interim financial reports were attended by the auditor. The latter reported on the results of the reviews and on all the main issues and occurrences relevant to the work of the Audit Committee. There were no objections raised in response to these reports. The Audit Committee also closely examined the accounting process and the efficacy and further development of the internal Group-wide control and risk management system. In addition, the Audit Committee received the status reports of the General Counsel & Chief Compliance Officer and the H ead of Internal Audit, and approved the audit plan put forward by Internal Audit, which extends to examining the functional efficiency and efficacy of the internal control system and our compliance organization. At its meeting on March 2, 2015, attended by the auditor, the Audit Committee discussed the annual and consolidated financial statements for fiscal 2014, including the audit reports, the associated proposal for appropriation of profits, and the risk report. It submitted to the Supervisory Board corresponding proposals for resolution by the Annual General Meeting. The Committee further made its recommendation to the Supervisory Board regarding the latter’s proposal for resolution by the Annual General Meeting relating to the appointment of the external auditor for fiscal 2015. A declaration from the auditor asserting its independence was again duly received, accompanied by details pertaining to non-audit services rendered in fiscal 2014 and those envisioned for fiscal 2015. There was no evidence of any bias or partiality on the part of the auditor. As in previous years, other members of the Supervisory Board also took part as guests in this specifically accountingrelated meeting of the Audit Committee. Report of the Supervisory Board Corporate governance and declaration of compliance The Supervisory Board again dealt with questions of corporate governance in fiscal 2014. Details on Henkel’s corporate governance can be found in the corporate governance report (on pages 29 to 37) with which we fully acquiesce. At our meeting on March 2, 2015, we discussed and approved the joint Declaration of Compliance of the Management Board, the Shareholders’ Committee and the Supervisory Board with respect to the German Corporate Governance Code (DCGK) for 2015. The full wording of the current and previous declarations of compliance can be found on the company website. Annual and consolidated financial statements / Audit The annual financial statements and management report of Henkel AG & Co. KGaA have been prepared by the Management Board in accordance with the provisions of the German Commercial Code [HGB]. The consolidated financial statements and the Group management report have been prepared by the Management Board in accordance with International Financial Reporting Standards (IFRS) as endorsed by the European Union (EU), and in accordance with the supplementary German statutory provisions pursuant to Section 315a (1) HGB. The consolidated financial statements in their present form exempt us from the requirement to prepare consolidated financial statements in accordance with German law. 9 10 Report of the Supervisory Board The auditor appointed for 2014 by the last Annual General Meeting – KPMG – has examined the 2014 annual financial statements of Henkel AG & Co. KGaA and the 2014 consolidated financial statements, including the management reports. KPMG conducted the audit in accordance with Section 317 HGB and the German generally accepted standards for the audit of financial statements promulgated by the Institut der Wirtschaftsprüfer (Institute of Public Auditors in Germany), and in supplementary compliance with International Standards on Auditing (ISA). The annual financial statements and the consolidated financial statements were certified without qualification. KPMG reports that the annual financial statements give a true and fair view of the net assets and financial position of Henkel AG & Co. KGaA on December 31, 2014, as well as the results of operations for the fiscal year ended on this date, in accordance with German generally accepted accounting principles. The consolidated financial statements give a true and fair view of the net assets and financial position of Henkel Group on December 31, 2014, as well as the results of operations for the fiscal year ended on this date, in compliance with International Financial Reporting Standards as endorsed by the EU and the supplementary German statutes pursuant to Section 315a (1) HGB. The annual financial statements and management report, consolidated financial statements and Group management report, the audit reports of KPMG and the recommendations by the Management Board for the appropriation of the profit made by Henkel AG & Co. KGaA were presented in good time to all members of the Supervisory Board. We examined these documents and discussed them at our meeting of March 2, 2015. This was attended by the auditor, which reported Henkel Annual Report 2014 on its main audit findings. We received the audit reports and declared our acquiescence therewith. The Chair of the Audit Committee provided the plenary session of the Supervisory Board with a detailed account of the treatment of the annual and the consolidated financial statements by the Audit Committee. Having received the final results of the review conducted by the Audit Committee and concluded our own examination, we see no reason for objection to the aforementioned documents. We have agreed to the results of the audit. The assessment by the Management Board of the position of the company and the Group coincides with our own appraisal. At our meeting of March 2, 2015, we concurred with the recommendations of the Audit Committee and therefore approved the annual financial statements, the consolidated financial statements and the management reports as prepared by the Management Board. Additionally, we discussed and approved the proposal by the Management Board to pay out of the unappropriated profit of Henkel AG & Co. KGaA a dividend of 1.29 euros per ordinary share and of 1.31 euros per preferred share, and to carry the remainder and the amount attributable to the treasury shares held by the company at the time of the Annual General Meeting forward to the following year. This proposal takes into account the financial and earnings position of the company, its medium-term financial and investment planning, and the interests of our shareholders. In our meeting on March 2, 2015, we also ratified our proposal for resolution by the Annual General Meeting relating to the appointment of the external auditor for the next fiscal year, based on the recommendations of the Audit Committee. Henkel Annual Report 2014 Risk management Risk management issues were examined not only by the Audit Committee but also the plenary Supervisory Board, with emphasis on the risk management system in place at Henkel and any major individual risks of which we needed to be notified. There were no identifiable risks that might jeopardize the continued existence of the c orporation as a going concern. The structure and function of the risk early warning system were also integral to the audit performed by KPMG, which found no cause for reservation. It is our considered opinion t hat the risk management system corresponds to the statutory requirements and is fit for the purpose of early identification of developments that could endanger the continuation of the corporation as a going concern. Changes in the Supervisory Board and Management Board There were no changes in the Supervisory Board or Management Board in the year under review. The year ahead will again present challenges to all of our employees and our management. Based on what we have achieved, Henkel is well equipped for these challenges, and we are confident that we will reach our goals. We thank you for your ongoing trust a nd support. Düsseldorf, March 2, 2015 On behalf of the Supervisory Board Dr. Simone Bagel-Trah (Chairwoman) Report of the Supervisory Board 11 12 Outperform Henkel Annual Report 2014 In 2014, we continued to focus on our top brands such as Loctite, Persil and Schwarzkopf to capture the full potential for accelerated organic growth and increased profitability in our categories. Together, these three brands generated around 5 billion euros in sales. Around €2 bn sales Loctite is the leading brand within our Adhesive Technologies business and globally one of the most trusted brands for adhesives, sealants and coating solutions. Around €1 bn sales Henkel’s high-performance detergent Persil has been the leading brand in our Laundry & Home Care business for more than 100 years. Around €2 bn sales Schwarzkopf is the global hair expert in both the retail and professional businesses. Based on winning innovations, Schwarzkopf has continuously gained market shares in all categories. Henkel Annual Report 2014 Outperform 13 Outperform Top brands, powerful innovations and a strong focus on customers In 2014, our top 10 brands generated 59 percent of total Group sales globally. We kept our innovation rates high across all business units. By actively engaging with our customers and consumers, we were able to differentiate and drive business success in highly competitive and volatile global markets. As part of our Strategy 2016, we aim to “Outperform” our competition. We will leverage our full potential in our product categories in order to gain market share. We will actively manage our portfolio, strengthen our top brands, launch powerful innovations, and focus on customers and consumers. Strengthening our top brands In 2014, our focus on strengthening our top brands led to remarkable results: Our top 10 brands now account for 59 percent of our total Group sales globally, up from 57 percent in the previous year. Thanks to our commitment to innovation and investments in brand equity, we have established a range of strong and successful brands that generate above-average sales, growth and profitability. Our high-performance detergents from Persil, which has been the leading brand for our Laundry & Home Care business for more than 100 years, reached sales of around one billion euros in 2014. This is a result of continuous product innovation and a focus on quality as well as the ongoing brand internationalization. Persil is now available in more than 50 mature and emerging markets worldwide and continues to gain market shares year after year. Schwarzkopf is one of the leading hair care brands globally and the biggest brand of our Beauty Care business. Schwarzkopf has stood for outstanding innovations, quality, passion and competence – since 1898. Offering winning solutions in both retail and profes- sional markets, Schwarzkopf achieved sales of around two billion euros in 2014. Schwarzkopf products are available in more than 60 markets around the world. Loctite is the leading brand within our Adhesive Technologies business and globally one of the most trusted brands for adhesives, sealants and coating solutions. With a history of almost 60 years, the Loctite brand has steadily increased sales to around two billion euros in 2014. Today, Loctite products are used in a wide range of different industries including aerospace, automotive, electronics, industrial assembly and repair, as well as in consumer applications, in more than 130 markets around the world. Powerful innovations In highly competitive markets, we strive for a flow of innovations that meet the needs of our customers and consumers around the world. By investing in new research and development centers and expanding existing ones, we have strengthened our innovation capacities, especially in emerging markets. In 2014, we again achieved high innovation rates in all three business units. In both Laundry & Home Care and Beauty Care, the innovation rate – the share of products launched within the last three years – was more than 45 percent. In Adhesive Technologies, the share of sales from products launched within the last five years increased to more than 30 percent. For more information on innovations in all three business units, please see pages 82 to 85 and 88 to 99. 59 % of sales generated by top 10 brands. 14 Outperform Henkel Annual Report 2014 Outperform Focus on customers Digitization drives competitive advantage We put our customers at the center of what we do – this is one of our values at Henkel. We are strongly committed to customer focus across the entire company. In order to understand our customers’ needs and expectations, and to be able to anticipate future requirements, our Management Board regularly engages in “top-to-top” exchanges with our largest customers. These help us to better align our business activities and generate a growing share of sales with them. Digitization offers competitive advantages for our company. Internally, the standardization and digitization of processes will enable higher efficiency and flexibility. Externally, digital platforms will gain importance as tools for engaging with customers and consumers and capturing growth opportunities. Already more than 100 global key customers and strategic partners have witnessed our strong brands and innovation power while visiting the Beauty Care Lighthouse in Düsseldorf. This venue holistically demonstrates our Beauty Care competence and sets the benchmark for customer interaction. Our Laundry & Home Care Global Experience Center in Düsseldorf opened at the beginning of 2015. Here, customers and visitors will experience Laundry & Home Care’s innovation capabilities through cutting- edge technology, live demonstrations and opportunities for interaction across more than 1,000 square meters. Actively managing our portfolio In 2014, we continued investing in our business to drive both organic and inorganic growth. We increased capital expenditures, excluding acquisitions, from 436 million euros to 517 million euros. We also invested around 1.8 billion euros in a number of acquisitions in both mature and emerging markets. These acquisitions will strengthen the market positions of all three business units (for more information, see table on page 57). In our Beauty Care business, we successfully launched a comprehensive range of digital initiatives to intensify relationships with our customers and consumers. From brand communication to digital advisory services and e-commerce, we have significantly enhanced the digital consumer experience. One example is the viral video “Schwarzkopf – A declaration of love,” which has been viewed over 15 million times on YouTube. Another example is the launch of our leading 3D Schwarzkopf hair advisor app that enables consumers to virtually color and style their hair – either directly at the point of sale or on a smartphone at home. Additional product information is immediately accessible and products can be purchased directly online. In our Laundry & Home Care business, we also substantially expanded digital interaction with consumers in 2014. One example was a viral campaign built around a music video for Henkel’s innovative WC rim blocks. The campaign reached around 10 million users on social platforms such as YouTube, an unparalleled success for a digital campaign in this home care product category. In our Adhesive Technologies business, we continued the global roll-out of our e-commerce platform “Henkel POD,” primarily for adhesives products, which generated over 500 million euros in sales in 2014. The platform offers customers the ability to place orders around-the-clock and provides personalized access to ordering status, invoices, product pricing and availability as well as technical documents. Henkel Annual Report 2014 Outperform Digital platforms will become increasingly important to engage with our customers and consumers. With the first Schwarzkopf 3D color advisor app for smartphones and tablets, Beauty Care offers personalized consultancy – either in-store or at home. The app allows consumers to virtually test new hair colors and the latest styles on their own image with just a few clicks – and supports the purchasing decision. 295 top 3 positions worldwide With leading market positions across the globe, our Beauty Care business continues to leverage our sustainable and strong brand values to secure our position as a top player in the beauty industry. Over €500 m sales Our Adhesive Technologies business has been successful with its “Henkel POD” e-commerce platform, which offers customers product information as well as p ersonalized access to orders and invoices. 70 No. 1 positions worldwide With strong brands and powerful innovations, our Laundry & Home Care business has reached 70 number one positions in various categories worldwide. 15 16 Globalize Henkel Annual Report 2014 Close collaboration with our customers in emerging markets helps us to better understand local requirements and to support our customers. In our Adhesive Technologies business, Key Account Manager Alfredo Franco (left) discusses the use of our solutions with Jorge Mendoza, a Volkswagen Process Manager, at the car production site in Puebla, Mexico. 6,500 22.5 in-house specialists worldwide from our Adhesive Technologies business work closely together with customers. Our Laundry & Home Care business achieved significant growth in the Africa/Middle East region. Our business has seen double-digit growth in this region for more than five years. % organic sales growth No.3 position in Chinese hair cosmetics market The successful development of Beauty Care in China, one of the f astest-growing emerging markets, is based on the strong development of our brands Schwarzkopf and Syoss. Henkel Annual Report 2014 Globalize Globalize Growing in emerging and mature markets In 2014, we continued our very strong growth in emerging markets. We expanded our footprint by investing in R&D, in manufacturing and in our teams, and gained market shares. In mature markets, we leveraged our leading positions and continued to deliver growth. We also made targeted acquisitions to strengthen all business units. Henkel’s strategic priority “Globalize” is based on capturing growth opportunities in both emerging and mature markets through differentiated regional strategies. We aim to expand our footprint in emerging markets while leveraging our strong positions in mature markets. In 2014, we delivered very strong organic growth in emerging markets, where we see significant growth potential for the future. The share of sales generated in these markets reached 44 percent, driven by a strong performance across all three business units. In mature markets, sales were positive overall, despite a persistently difficult economic environment, especially in Western Europe, and intense competition. In the course of 2014, we invested in total around 1.8 billion euros across all three business units to acquire brands and technologies in both emerging and mature markets that will complement and reinforce our portfolio. Strong performance in emerging markets In 2014, emerging markets again delivered an aboveaverage contribution to growth, with total organic sales growth of 7.8 percent. The Asia-Pacific region (excluding Australia and Japan) recorded very strong organic growth while the Latin America region reported solid organic growth. Despite the serious conflicts in parts of Eastern Europe, our businesses continued to grow in this region and reported 4.5 percent organic growth. The Africa/Middle East region was also affected by continued political and social unrest in some countries, yet we managed to deliver double-digit organic sales growth. We further expanded our current positions and gained market shares in emerging markets across all business units. The share of employees in emerging markets increased to around 57 percent (excluding acquisitions). We closed several acquisitions in emerging markets in 2014, thus further strengthening our presence and market position. In February, we completed the acquisition of a Polish laundry and home care business, including predominantly detergents and fabric softeners of the “E” brand, and other smaller brands. In May, we completed the acquisition of the hair cosmetics brand Pert in Latin America. Our Adhesive Technologies business continued to grow at an above-average rate in emerging markets. We benefit from our global reach and proximity to the technical design centers and manufacturing hubs of major customers in different industries. By moving innovation capabilities closer to our growing customer base in emerging markets, we are able to provide local solutions while leveraging global technologies and expertise. We opened a new technology center in Seoul, South Korea, to focus on the advanced materials and new process needs of producers of mobile devices and display screens. The Transport and Metal business performed successfully, particularly due to close partnerships with customers, for example by providing customized solutions for the automotive industry. 17 18 Globalize Henkel Annual Report 2014 Globalize Our Laundry & Home Care business further continued its successful performance in emerging markets with very strong growth. In the Africa/Middle E ast region, Laundry & Home Care delivered double-digit growth, also thanks to successful product innovations developed in the new R&D center in Dubai, which are specifically tailored to consumer needs in the region. Mexico likewise reported strong growth, while in South Korea, Henkel’s leading detergent brand Persil achieved market leadership just five years after its launch. We also expanded production capacities for toilet rim blocks, one of the fastest growing product categories for Laundry & Home Care, with the opening of a new production line in Kruševac, Serbia. This new line supplies more than 20 European markets. Our Beauty Care business continued to develop successfully, especially in China, where we now hold a leading position in the hair cosmetics category. Also, Turkey recorded double-digit growth rates. In addition to reinforcing current strongholds in emerging markets, Beauty Care entered new markets and categories where we see potential for further growth. Henkel is now present in Sub-Saharan Africa with the innovation Schwarzkopf Smooth ’N Shine, creating a platform for further growth and leveraging our lab and test salon for afro-textured hair in Johannesburg. Beauty Care also reinforced R&D capabilities for Asian hair care innovations with the strengthening of our competence center in Shanghai. These R&D hubs address the wide range of specific consumer needs in emerging markets with tailored innovations. Investing in key categories in mature markets Henkel holds leading positions in many mature markets across all business units. Mature markets will continue to play an important role for Henkel. Overall, we saw positive development in Western Europe, especially driven by solid growth in Germany with all business units contributing. Our performance in North America was impacted by intense competition, and we were not able to capture the full growth potential in this market. In 2014, Henkel acquired a number of leading brands and technologies and further expanded its strong market positions in mature markets. In June, Henkel completed the acquisition of three US hair professional companies – Sexy Hair, Alterna and Kenra. They strengthen the hair professional portfolio of our Beauty Care business in the USA, especially in the categories of Hair Care and Styling. This acquisition makes Henkel one of the top three players in the world’s largest hair professional market. As one of the fastest growing players in Europe, Beauty Care expanded its market position in Germany with a focused portfolio of strong, leading brands and super ior innovations. Also in June, Henkel agreed upon and signed the acquisition of the French company Spotless Group SAS, which operates in the categories of laundry aids, insect control and household care in Western Europe and holds leading market positions in established European markets such as France, Italy, Spain and the UK. This acquisition is part of Henkel’s strategy to invest in attractive country category positions. In September, Henkel acquired The Bergquist Company in the USA, a supplier of thermal management solutions for electronic applications. This acquisition strengthens the position of our Adhesive Technologies business as a global market and technology leader and is in line with our strategy to invest in complementary leading technologies, which we market to customers on a global scale. At our headquarters in Düsseldorf, Germany, we opened our largest automated storage facility, which has capacity for more than 25 million packages of laundry and home care products. This warehouse supplies Germany and neighboring European countries. We also commenced the production of Vernel Soft & Oils fabric softener in Düsseldorf. These investments underpin our commitment to our home market Germany, overall the second biggest national market for Henkel globally. Henkel Annual Report 2014 Globalize Acquisitions will strengthen our market position and enlarge our footprint in both emerging and mature markets. With the acquisition of the Spotless Group with brands such as Eau Ecarlate, we now offer the full product range for laundry care in Western Europe. Around €280 m sales The Spotless portfolio consists of brands with leading positions in complementary categories in Laundry & Home Care and offers the opportunity to close “white spots.” €130 m Around sales This sales volume was generated by Bergquist in fiscal 2013 and now adds to the Adhesive Technologies sales. 3 US hair professional businesses acquired With the acquisition of Sexy Hair, Alterna and Kenra, Beauty Care has become one of the top three players in the world’s largest hair professional market. 19 20 Simplify Henkel Annual Report 2014 As part of our strategic priority “Simplify,” a new platform was rolled out throughout the Henkel world. Delker Vardilos, Corporate Communications Manager at Henkel in North America, and her colleagues use the new digital workplace environment for more efficient cross-functional collaboration. More than 45,000 users transferred to the new digital workplace environment. More than 2,600 employees work in shared services. 23 % eSourcing share of total spend. Henkel Annual Report 2014 Simplify Simplify Driving operational excellence In 2014, we progressed key initiatives to build a scalable business platform: We continued to standardize our processes, integrate our IT landscape, expand our global shared services organization and began to combine our global supply chain across all business units with global purchasing. As part of our strategic priority “Simplify,” we aim to drive operational excellence and continuously improve our competitiveness by standardizing, digitizing and accelerating processes, focusing on end-to-end optimization and increased cost efficiency. Strong focus on IT Digitization is becoming a key competitive factor for businesses around the world. The move toward a standardized and fully integrated business platform facilitates the acceleration of processes and increased efficiency. This platform provides real-time information which will allow for valuable insights into market developments, better decision-making and faster reaction. We have already consolidated 21 different IT systems in the Asia-Pacific region into one global SAP platform. In 2014, we started its roll-out in Europe, with the remaining regions to follow. Our objective is to further simplify and therefore reduce the number of internal processes from around 2,200 globally in 2012 to around 800 by 2016. This will reduce complexity, allow us to better manage our global business processes and lead to improved cost efficiency. In 2014, we also enhanced the digital workplaces for all employees globally and transferred more than 45,000 users to the new platform. This will facilitate the exchange of knowledge and digital cooperation within virtual international teams. During the introductory phase, we have made a wide range of training resources available, including online tutorials, webinars and live consulting sessions. Best-in-class processes Over the past years, we have continuously expanded our global shared services, which work in close cooperation with global IT as part of our Integrated Business Solutions (IBS) organization. In 2014, we opened new shared service centers in Cairo, Egypt, to serve the Africa/Middle East region and in Shanghai, China, for Greater China. In total, more than 2,600 employees in six shared service centers around the world manage standardized end-to-end processes. Leading supply chain and sourcing As part of our “Sourcing@Best” initiative, we continued to improve cost efficiency and increase the flexibility of our global sourcing processes in 2014. We are consolidating our sourcing operations into global hubs, ranging from São Paulo, Brazil, and Dubai, United Arab Emirates, to Shanghai, China, and Rocky Hill, USA. We are increasingly leveraging our eSourcing platform to further digitize, standardize and optimize our sourcing processes. In 2014, the share of eSourcing continued to grow and climbed to 23 percent of total spend. In parallel, we began the integration of our global supply chain across all business units with our sourcing activities into one global supply chain organization to increase our efficiency and competitiveness. In 2014, we successfully completed the preparation of this process and started the implementation in the first pilot countries. 21 22 Inspire Henkel Annual Report 2014 As part of our strategic r elationship with six top MBA schools, Henkel offers a wide range of activities for top talents. MBA student Diana Min (right) from China Europe International Business School (CEIBS) in Shanghai takes part in a recruiting event with Yvonne Qian, Employer Branding Manager at Henkel in China. Around 35,000 students have participated in the international student competition Henkel Innovation Challenge since 2007. 1,150 33 Around Around % employees promoted. of our managers are women (excluding 2014 acquisitions). Henkel Annual Report 2014 Inspire Inspire Strengthening our global team In 2014, we implemented our Leadership Principles in order to strengthen our global leadership team. We placed special emphasis on attracting, developing and retaining talents, especially in emerging markets, while fostering diversity across our organization. As part of our strategic priority “Inspire,” we are focusing on three areas: strong leadership, developing talent and rewarding performance, and increasing the diversity of our workforce. Strong leadership Leading diverse and increasingly virtual teams in times of ongoing change, increasing globalization and complexity is one of the biggest leadership challenges. Our Leadership Principles provide a clear framework and guidance for our managers and leaders to manage their teams successfully. In order to deepen the understanding of these principles, we developed with the Harvard Business School a Leadership Forum for all our senior leaders. This program combines knowledge exchange between Henkel’s top managers and peers with insights from renowned Harvard professors. One third of our senior leadership team participated in the pilot program in August 2014; the remainder will take part in 2015. Especially for talent development in emerging markets, we designed and successfully launched the EXCEED program. It aims to strengthen our pipeline of strong leaders to support our growth ambitions. Thanks to the interaction with top management and peers in the program, EXCEED allows the participants to build diverse networks for their future leadership career. Focus on talent and performance In 2014, Henkel was again recognized as a highly attractive employer. We were ranked among leading companies in several employer ratings such as “Top Employer 2014” in Europe and in the Middle East. In order to further strengthen our local management teams in emerging markets, we started a customized and focused initiative with six top international MBA schools that have a high share of students from these markets. We provide these schools with exclusive insights into Henkel’s businesses in order to attract the best talents at an early stage. Our annual Development Round Table (DRT) has become an integral part of talent development and performance management at Henkel over the past six years. At the DRT, we evaluate in one integrated process the performance and development potential of all managers worldwide, around 10,250 individuals. This allows us to identify talents with strong development potential and to actively manage their careers within Henkel. In 2014, we promoted around 1,150 employees. Diverse teams We are convinced that diversity fosters the creativity and innovation required for success in a globalized and dynamic environment. Our strong focus on diversity and inclusion helps to capture new business, fuel innovation and attract and retain the best employees. We systematically encourage female career development and provide the corresponding framework and opportunities. As a result, we increased the share of female managers to around 33 percent of our global leadership team by the end of 2014 (excluding acquisitions). 23 24 Sustainability Henkel Annual Report 2014 We drive higher efficiency – along the entire value chain: Peter Jessen (left) and his c olleague Andy Jarosch work on the optimization of the operations in the combined heat and power plant in Düsseldorf. Since the early 1980s, Henkel has implemented extensive measures to increase efficiency and reduce emissions in this power plant. 90 % efficiency in generating steam and electricity in our power plant in Düsseldorf. 28 % improvement of our overall efficiency by creating more value while reducing the environmental footprint of our business operations. More than 3,800 employees around the world have qualified as Sustainability Ambassadors since 2012. Henkel Annual Report 2014 Sustainability 25 Sustainability More value at a reduced footprint We are committed to leadership in sustainability – this is one of our values at Henkel. “Achieving more with less” is the core of our long-term strategy with ambitious goals by 2030. In 2014, we made significant progress and reached important targets ahead of schedule. Maintaining a balance between economic success, protection of the environment and social responsibility has been fundamental to our corporate culture for decades. As sustainability leaders, we aim to pioneer new solutions for sustainable development while continuing to shape our business responsibly and increase our economic success. This ambition guides all of our company’s activities – along the entire value chain. We believe that sustainability will continue to gain importance for the success of our business. By 2050, the global population is expected to climb to 9 billion. This growth will go hand in hand with the changing consumption patterns of a growing, more affluent middle class in emerging markets. At the same time, natural resources such as fossil fuels and water, which are already stretched, will be even more limited. These developments will shape our future business environment. Our targets for 2030 If we are to meet such needs with limited resources, we must become five times more efficient by 2050. As a result, we have defined our ambitious long-term target for 2030: Compared to our base year 2010, we want to triple the value we create in relation to the environmental footprint of our products and services. This means we will have to improve our efficiency by an average of 5 to 6 percent each year. For the first five-year period from 2011 up to 2015, we set interim targets for all our focal areas, aiming at a 30-percent overall improvement. In all our business units, we have implemented a range of projects and measures covering the different requirements of our production locations. We have already made significant progress. In 2014, we reached our end-of-2015 targets in four focal areas: • improvement in energy efficiency by 20 percent • reduction in water usage by 19 percent • and an 18-percent reduction in waste per production unit • as well as a 25-percent reduction in our worldwide accident rate compared to 2010, the base year. Our approach for sustainable business processes In order to successfully implement our sustainability strategy, we have defined three strategic principles: our products, our partners and our people. We integrate these into all processes and activities – ranging from innovation to sales. We continuously engage, train and support our employees with initiatives such as our global Sustainability Ambassador program. The program was developed in 2012 and trains our employees on how to better convey the importance of sustainability to their coworkers, suppliers, customers as well as to consumers and schoolchildren. By the end of 2014, more than 3,800 Henkel employees had qualified as Sustainability Ambassadors, including the entire Management Board and top management. Through the program, we educated more than 36,000 schoolchildren in 37 countries on sustainable consumption. Detailed information can be found in our Sustainability Report. www.henkel.com/ sustainabilityreport 26 Management Board Henkel Annual Report 2014 Focused on strategy execution In 2014, everyone at Henkel focused on the execution of the strategic priorities for the period up to 2016 in order to deliver on our ambitious targets. Kasper Rorsted Chairman of the Management Board Born in Aarhus, Denmark on February 24, 1962; with Henkel since 2005. Carsten Knobel Kathrin Menges Executive Vice President Finance (CFO) / Purchasing / Integrated Business Solutions Executive Vice President Human Resources / Infrastructure Services Born in Marburg / Lahn, Germany on January 11, 1969; with Henkel since 1995. Born in Pritzwalk, Germany on October 16, 1964; with Henkel since 1999. Henkel Annual Report 2014 Management Board Jan-Dirk Auris Hans Van Bylen Executive Vice President Adhesive Technologies Executive Vice President Beauty Care Born in Cologne, Germany on February 1, 1968; with Henkel since 1984. Born in Berchem, Belgium on April 26, 1961; with Henkel since 1984. Bruno Piacenza Executive Vice President Laundry & Home Care Born in Paris, France on December 22, 1965; with Henkel since 1990. 27 28 Group management report Henkel Annual Report 2014 Group management report 29 Corporate governance 29 Corporate governance / Corporate management report 35Statutory and regulatory situation 38 Remuneration report 50 Shares and bonds 52 53 53 53 54 Henkel represented in all major indices International shareholder structure Employee share program Henkel bonds Pro-active capital market communication 55 Fundamental principles of the Group 55 Operational activities 55Overview 55Organization and business units 56 Strategy and financial targets 2016 56 Financial targets 2016 57 Strategic priorities in summary 59 Sustainability strategy 2030 62 Management system and performance indicators 62 Cost of capital 69 Net assets and financial position 69 Acquisitions and divestments 70 Capital expenditures 71 Net assets 72 Financial position 72 Financing und capital management 73 Key financial ratios 74 Employees 77 Procurement 79 Production 81 Research and development 85 Marketing and distribution 88 Business units 88Laundry & Home Care 92 Beauty Care 96 Adhesive Technologies 100 Risks and opportunities report 100Risks and opportunities 100Risk management system 102Major risk categories 106Major opportunity categories 107Risks and opportunities in summary 108 Forecast 63 Economic report 63Macroeconomic and industry-related conditions 64 Review of overall business performance 65 Results of operations 65 Sales and profits 67 Comparison between actual business performance and guidance 68 Expense items 68 Other operating income and charges 68 Financial result 68 Net income and earnings per share (EPS) 69 Dividends 69 Return on capital employed (ROCE) 69 Economic Value Added (EVA®) 108Macroeconomic development 108Sector development 109Outlook for the Henkel Group 2015 109 Subsequent events 29 Group management report 100 Risks and opportunities report 108 Forecast 109 Subsequent events Corporate governance at Henkel AG & Co. KGaA The Management Board, the Shareholders’ Committee and the Supervisory Board are committed to ensuring that the management and stewardship of the corporation are conducted in a responsible and transparent manner aligned to achieving a long-term increase in shareholder value. With this in mind, they have pledged themselves to the following three principles: • Value creation as the foundation of our management approach • Sustainability achieved through the application of socially responsible management principles • Transparency supported by an active and open information policy Corporate governance / Corporate management report The German Corporate Governance Code (DCGK) was introduced in order to promote confidence in the management and oversight of listed German corporations. It sets out the nationally and internationally recognized regulations and standards of responsible corporate management applicable in Germany. The DCGK is aligned to the statutory provisions applicable to a German joint stock corporation (“Aktiengesellschaft” [AG]). It is applied analogously by H enkel AG & Co. KGaA (the corporation). For a better understanding of Henkel’s situation, this report describes the principles underlying the management and control structure of the corporation. It also outlines the special features distinguishing us from an AG which derive from our specific legal form and our Articles of Association. The primary rights of shareholders of Henkel AG & Co. KGaA are likewise explained. The report takes into account the recommendations of the DCGK and contains all disclosures and explanations required according to Sections 289 (4), 289a and 315 (4) of the German Commercial Code [HGB]. Legal form / Special statutory features of Henkel AG & Co. KGaA Henkel is a “Kommanditgesellschaft auf Aktien” [KGaA]. A KGaA is a company with a legal identity (legal entity) in which at least one partner has unlimited liability with respect to the company’s creditors (personally liable partner). The other partners’ liability is limited to their shares in the capital stock and they are thus not liable for the company’s debts (lim- ited partners per Section 278 (1) German Stock Corporation Act [AktG]). In terms of its legal structure, a KGaA is a mixture of a joint stock corporation [AG] and a limited partnership [KG], with a leaning toward stock corporation law. The difference with respect to an AG is primarily as follows: The duties of the executive board of an AG are performed at Henkel AG & Co. KGaA by Henkel Management AG – acting through its Management Board as the sole Personally Liable Partner (Sections 278 (2) and 283 AktG in conjunction with Article 11 of our Articles of Association). The rights and duties of the supervisory board of a KGaA are more limited compared to those of the supervisory board of an AG. Specifically, the supervisory board is not authorized to appoint personally liable partners, preside over the partners’ contractual arrangements, impose procedural rules on the management board, or rule on business transactions. A KGaA is not required to appoint a director of labor affairs, even if, like Henkel, the company is bound to abide by Germany’s Codetermination Act of 1976. The general meeting of a KGaA essentially has the same rights as the shareholders’ meeting of an AG. Additionally, it votes on the adoption of the annual financial statements of the corporation and formally approves the actions of the personally liable partner(s). In the case of Henkel, it also elects and approves the actions of the members of the Shareholders’ Committee. Resolutions passed in general meeting require the approval of the personally liable partner(s) where they involve matters which, in the case of a partnership, require the authorization of the personally liable partners and also that of the limited partners (Section 285 (2) AktG) or relate to the adoption of annual financial statements (Section 286 (1) AktG). According to the Articles of Association, in addition to the Supervisory Board, Henkel also has a standing Shareholders’ Committee comprising a minimum of five and a maximum of 10 members, all of whom are elected by the Annual General Meeting (Article 27 of the Articles of Association). The Shareholders’ Committee is required in particular to perform the following functions (Section 278 (2) AktG in conjunction with Sections 114 and 161 HGB, and Articles 8, 9 and 26 of the Articles of Association): • It acts in place of the Annual General Meeting in guiding the business activities of the corporation. • It decides on the appointment and dismissal of the Personally Liable Partner(s). Group management report 29 Corporate governance 50 Shares and bonds 55 Fundamental principles of the Group 63 Economic report 30 Group management report • I t holds both the power of representation and executive powers over the legal relationships prevailing between the corporation and Henkel Management AG, the Personally Liable Partner. • It exercises the voting rights of the corporation in the Annual General Meeting of Henkel Management AG, thereby choosing its three-member Supervisory Board which, in turn, appoints and dismisses the members of the Management Board. • It issues rules of procedure incumbent upon Henkel Management AG. Capital stock denominations / Shareholder rights The capital stock of the corporation amounts to 437,958,750 euros. It is divided into a total of 437,958,750 bearer shares of no par value, of which 259,795,875 are ordinary bearer shares (nominal proportion of capital stock: 259,795,875 euros or 59.3 percent) and 178,162,875 are preferred bearer shares (nominal proportion of capital stock: 178,162,875 euros or 40.7 percent). All shares are fully paid in. Multiple share certificates for shares may be issued. In accordance with Art. 6 (4) of the Articles of Association, there is no right to individual share certificates. Each ordinary share grants to its holder one vote (Art. 21 (1) of the Articles of Association). The preferred shares grant to their holders all shareholder rights apart from the right to vote (Section 140 (1) AktG). The preferred shares carry the following preferential right in the distribution of unappropriated profit (Section 139 (1) AktG in conjunction with Art. 35 (2) of the Articles of Association) unless otherwise resolved by the Annual General Meeting: • The holders of preferred shares receive a preferred dividend in the amount of 0.04 euros per preferred share.If the profit to be distributed in a fiscal year is insufficient for payment of a preferred dividend of 0.04 euros per preferred share, the arrears are paid without interest from the profit of the following years, with older arrears to be paid in full before more recent arrears and the preferred dividend from the profit of a particular fiscal year paid only after the clearance of all arrears. The holders of ordinary shares then receive a preliminary dividend from the remaining unappropriated profit of 0.02 euros per ordinary share, with the residual amount being distributed to the holders of ordinary and preferred shares in accordance with the proportion of the capital stock attributable to them. • If the preferred dividend is not paid out either in part or in whole in a year, and the arrears are not paid off in the following year together with the full Henkel Annual Report 2014 preferred share dividend for that second year, the holders of preferred shares are accorded voting rights until such arrears are paid (Section 140 (2) AktG). Cancellation or limitation of this preferred dividend requires the consent of the holders of preferred shares (Section 141 (1) AktG). There are no shares carrying multiple voting rights, preference voting rights, maximum voting rights or special controlling rights. The shareholders exercise their rights in the Annual General Meeting as per the relevant statutory provisions and the Articles of Association of Henkel AG & Co. KGaA. In particular, they may exercise their right to vote – either personally, by postal vote, through a legal representative or through a proxyholder nominated by the company (Section 134 (3) and (4) AktG in conjunction with Art. 21 (2 and 3) of the Articles of Association) – and are also entitled to submit motions on the resolution proposals of management, speak on agenda items, and raise pertinent questions and motions (Section 126 (1), Section 131 AktG in conjunction with Art. 23 (2) of the Articles of Association). The ordinary Annual General Meeting usually takes place within the first four months of the fiscal year. Shareholders whose shares jointly represent at least one twentieth of the capital stock, corresponding to 21,897,938 ordinary or preferred shares or a combination of both, may request that a general meeting of shareholders be called. If their proportionate amount of the capital stock jointly amounts to 500,000 euros – corresponding to 500,000 ordinary or preferred shares or a combination of both – they may request that items be placed on the agenda and published (Section 122 (1 and 2) AktG). In addition, shareholders whose combined share of the capital stock amounts to 100,000 euros or more may, subject to certain conditions, request that a special auditor be appointed by the court to examine certain matters (Section 142 (2) AktG). Unless otherwise mandated by statute or the Articles of Association, the resolutions of the Annual General Meeting are adopted by simple majority of the votes cast. If a majority of capital is required by statute, resolutions are adopted by simple majority of the voting capital represented (Art. 24 of the Articles of Association). This also applies to changes in the Articles of Association. However, modifications to the object of the corporation require a three-quarters’ majority (Section 179 (2) AktG). The Supervisory Board 31 Group management report 29 Corporate governance 50 Shares and bonds 55 Fundamental principles of the Group 63 Economic report 100 Risks and opportunities report 108 Forecast 109 Subsequent events and Shareholders’ Committee have the authority to resolve purely formal modifications of and amendments to the Articles of Association (Art. 34 of the Articles of Association). Approved capital / Share buy-back According to Art. 6 (5) of the Articles of Association, there is an authorized capital limit. Acting within this limit, the Personally Liable Partner is authorized, subject to the approval of the Supervisory Board and of the Shareholders’ Committee, to increase the capital stock of the corporation in one or several acts until April 18, 2015, by up to a total of 25,600,000 euros through the issue for cash of new preferred shares with no voting rights. All shareholders are essentially assigned pre-emptive rights. However, these may be set aside in three cases: (1) in order to dispose of fractional amounts; (2) to grant to creditors/holders of bonds with warrants or conversion rights or a conversion obligation issued by the corporation or one of the companies dependent upon it, pre-emptive rights corresponding to those that would accrue to such creditors/bondholders following exercise of their warrant or conversion rights or on fulfillment of their conversion obligations; or (3) if the issue price of the new shares is not significantly below the quoted market price at the time of issue price fixing. In addition, the Personally Liable Partner is authorized to purchase ordinary and/or preferred shares of the corporation at any time until April 18, 2015, up to a maximum nominal proportion of the capital stock of 10 percent. This authorization can be exercised for any legal purpose. To the exclusion of the pre-emptive rights of existing shareholders, treasury shares may, in particular, be transferred to third parties for the purpose of acquiring entities or participating interests in entities. Treasury shares may also be sold to third parties against payment in cash, provided that the selling price is not significantly below the quoted market price at thetime of share disposal. The shares may likewise be used to satisfy warrants or conversion rights granted by the corporation. The Personally Liable Partner has also been authorized, with the approval of the Shareholders’ Committee and of the Supervisory Board, to cancel treasury shares without the need for further resolution by the Annual General Meeting. Insofar as shares are issued or used to the exclusion of pre-emptive rights, the proportion of capital stock represented by such shares shall not exceed 10 percent. Restrictions with respect to voting rights or the transfer of shares A share-pooling agreement has been concluded between members of the families of the descendents of company founder Fritz Henkel which contains restrictions with respect to transfers of the ordinary shares covered (Art. 7 of the Articles of Association). Henkel preferred shares acquired by employees through the Employee Share Program, including bonus shares acquired without additional payment, are subject under civil law to a company-imposed lock-up period of three years, which begins on the first day of the respective participation period. Essentially, the shares should not be sold before the end of this period. If employee shares are sold during the lock-up period, the bonus shares are forfeited. Contractual agreements also exist with members of the Management Board governing lock-up periods for Henkel preferred shares which they are required to purchase as part of their variable annual cash remuneration (for additional information, please see the remuneration report on pages 38 to 49). Major shareholders According to notifications received by the corporation on November 3, 2014, a total of 60.84 percent of the voting rights are held by members of the Henkel family share-pooling agreement. No other direct or indirect investment in capital stock exceeding 10 percent of the voting rights has been reported to us or is known to us. Management Board The Supervisory Board of Henkel Management AG is responsible for the appointment and dismissal of members of the Management Board of Henkel Management AG (Management Board). The appointments are for a maximum tenure of five years. A reappointment or extension of the tenure is permitted for a maximum period of five years in each case (Section 84 AktG). The Management Board is composed of at least two members in accordance with Art. 7 (1) of the Articles of Association of Henkel Management AG. The Supervisory Board is also responsible for determining the number of members on the Management Board. The Supervisory Board can appoint a member of the Management Board as Chairperson. 60.84 % of the voting rights are held by members of the Henkel family share- pooling agreement. 32 Group management report As the executive body of the Group, the Management Board is bound to uphold the interests of the business and is responsible for ensuring a sustainable increase in shareholder value. The members of the Management Board are responsible for managing Henkel’s business operations in their entirety. The individual Management Board members are assigned – in accordance with a business distribution plan – areas of competence for which they bear lead responsibility. The members of the Management Board cooperate closely as colleagues, informing one another of all major occurrences within their areas of competence and conferring on all actions that may affect several such areas. Further details relating to cooperation and the division of operational responsibilities within the Management Board are regulated by the rules of procedure issued by the Supervisory Board of Henkel Management AG. The Management Board reaches its decisions by a simple majority of the votes cast. In the event of a tie, the Chairperson has the casting vote. It is the duty of the Management Board to prepare the annual financial statements of Henkel AG & Co. KGaA and the consolidated financial statements for each quarter, half year and year. It is responsible for management of the overall business including planning, coordination, allocation of resources, financial control, and risk management. It must also ensure compliance with legal provisions, regulatory requirements and internal company guidelines, and take steps to ensure that Group companies observe them. Further information on corporate management can be found in the section “Principles of corporate management/Compliance” on page 35. For information on the remuneration of Management Board members and the contractual provisions entered into with them, including any severance payments, please refer to the remuneration report on pages 38 to 49. The composition of the Management Board is shown on page 183. Interaction between Management Board, Supervisory Board and Shareholders’ Committee The Management Board, Supervisory Board and Shareholders’ Committeework in close cooperation for the benefit of the corporation. The Management Board agrees the strategic direction of the company with the Shareholders’ Committee and discusses with it the status of strategy implementation at regular intervals. Henkel Annual Report 2014 In keeping with good corporate management practice, the Management Board informs the Supervisory Board and the Shareholders’ Committee regularly, and in a timely and comprehensive fashion, of all relevant issues concerning business policy, corporate planning, profitability, the business development of the corporation and its major affiliated companies, and also matters relating to risk exposure and risk management. For transactions of fundamental significance, the Shareholders’ Committee has established a right of veto in the procedural rules governing the actions of Henkel Management AG in its function as sole Personally Liable Partner (Art. 26 of the Articles of Association). This covers, in particular, decisions or measures that materially change the net assets, financial position or results of operations of the corporation. The Management Board complies with these rights of consent of the Shareholders’ Committee and also duly submits to the decision authority of the corporation’s Annual General Meeting. Supervisory Board and Shareholders’ C ommittee; other committees It is the responsibility of the Supervisory Board to advise and supervise the Management Board in the performance of its business management duties. It reviews the annual financial statements of Henkel AG & Co. KGaA and the Group’s consolidated financial statements, taking into account the audit reports submitted by the auditor. It also submits to the Annual General Meeting a proposal indicating its recommendation for the appointment of the external auditor. As a general rule, the Supervisory Board meets four times per year. It passes resolutions by a simple majority of the votes cast. In the event of a tie, the Chairperson has the casting vote. The Supervisory Board has established an Audit Committee and a Nominations Committee. The Audit Committee is made up of three shareholder and three employee representative members of the Supervisory Board. Each member is elected by the Supervisory Board based on nominations of their fellow shareholder or fellow employee representatives on the Supervisory Board. The Chairperson of the Audit Committee is elected based on a proposal of the shareholder representative members on the Supervisory Board. It is a statutory requirement that the Audit Committee includes an independent mem- 33 Group management report 29 Corporate governance 50 Shares and bonds 55 Fundamental principles of the Group 63 Economic report 100 Risks and opportunities report 108 Forecast 109 Subsequent events ber of the Supervisory Board with expertise in the fields of accounting or auditing. The Chairperson of the Audit Committee in 2014, Prof. Dr. Theo Siegert, who is not the Chairperson of the Supervisory Board nor a present or former member of the Management Board, satisfies these requirements. The Audit Committee, which generally meets four times a year, prepares the proceedings and resolutions of the Supervisory Board relating to the adoption of the annual financial statements and the consolidated financial statements, and also the auditor appointment proposal to be made to the Annual General Meeting. It issues audit mandates to the auditor and defines the focal areas of the audit as well as deciding on the fee for t he audit and other advisory services provided by the auditor. It monitors the independence and qualifications of the auditor, requiring the latter to submit a declaration of independence which it then evaluates. Furthermore, the Audit Committee monitors the accounting process and assesses the effectiveness of the Internal Control System, the Risk Management System and the Internal Auditing and Review System. It is likewise involved in compliance issues. It discusses with the Management Board, with the external auditor in attendance, the quarterly reports and the financial report for the half year, prior to their publication. The Nominations Committee comprises the Chairperson of the Supervisory Board and two further shareholder representatives elected by the Supervisory Board based on nominations of the shareholders’ representatives. The Chairperson of the Supervisory Board is also Chairperson of the Nominations Committee. The Nominations Committee prepares the resolutions of the Supervisory Board on election proposals to be presented to the Annual General Meeting for the election of members to the Super visory Board (shareholder representatives). The Shareholders’ Committee generally meets six times per year and holds a joint conference with the Management Board lasting several days. The Shareholders’ Committee reaches its decisions by a simple majority of the votes cast. It has established Finance and Human Resources Subcommittees that likewise meet six times per year, as a rule. Each subcommittee comprises five of its members. The Finance Subcommittee deals primarily with financial matters, questions of financial strategy, financial position and structure, taxation and accounting policy, as well as risk management within the corporation. It also performs the necessary preparatory work for decisions to be made by the Shareholders’ Committee in matters for which decision authority has not been delegated to it. The Human Resources Subcommittee deals primarily with personnel matters relating to members of the Management Board, issues pertaining to human resources strategy, and with remuneration. It performs the necessary preparatory work for decisions to be made by the Shareholders’ Committee in matters for which decision authority has not been delegated to it. The Subcommittee also addresses issues concerned with succession planning and management potential within the individual business units, taking into account relevant diversity aspects. At regular intervals, the Supervisory Board and the Shareholders’ Committee hold an internal review to determine the efficiency with which they and their committees/subcommittees carry out their duties. This self-assessment is performed on the basis of an extensive checklist, whereupon points relating to corporate governance and improvement opportunities are also discussed. Conflicts of interest must be disclosed in an appropriate manner to the Supervisory Board or Shareholders’ Committee, particularly those that may arise as the result of a consultancy or committee function performed in the service of customers, suppliers, lenders or other business partners. Members encountering material conflicts of interest that are not of a merely temporary nature are required to resign their mandate. Some members of the Supervisory Board and of the Shareholders’ Committee are or were in past years holders of senior managerial positions in other companies. If and when Henkel pursues business activities with these companies, the same arm’s length principles apply as those applicable to transactions with and between unrelated third parties. In our view, such transactions do not affect the impartiality of the members in question. For more details on the composition of the Super visory Board and the Shareholders’ Committee or the (sub)committees established by the Supervisory Board and Shareholders’ Committee, please refer to pages 180 to 182. Details of compensation can be found in the remuneration report on pages 38 to 49. 34 Group management report Objectives regarding Supervisory Board composition Around 44 % female membership on the Supervisory Board. In consideration of the specific situation of the corporation, the Supervisory Board has established the objectives described below with respect to its composition. These objectives will be taken into account by the Supervisory Board when proposing election candidates to the Annual General Meeting for all reelectable and ad hoc replacement Supervisory Board positions: • The members of the Supervisory Board should, generally speaking, offer the knowledge, skills and relevant experience necessary in order to properly perform their duties. In particular, experience and expertise are required in one or several of the fields of corporate management, accounting, financial control/risk management, corporate governance/ compliance, research and development, production/engineering, and marketing/sales/distribution, as is knowledge of the industrial or consumer businesses and of the primary markets in which Henkel is active. Members of the Supervisory Board should also have sufficient time at their disposal in order to carry out their mandate. • The international activities of the corporation should be appropriately reflected in the composition of the Supervisory Board. Thus, it aims to include several members with an international background. The mix of candidates proposed for election should also contain an appropriate number of women. Here, a proportion of at least 30 percent is essentially regarded as appropriate. Efforts will therefore be made to maintain or, if possible, increase this proportion for upcoming new and ad hoc replacement elections. • In addition, the Supervisory Board should have an appropriate number of independent members. Specifically, the Supervisory Board should contain no more than two former members of the Management Board, no persons who perform board or committee functions or act as consultants for major competitors, and no persons whose relationship with the corporation or members of the Management Board could give rise to material conflicts of interest that are not of a temporary nature. Assuming that the pure exercise of their Supervisory Board mandate by the employee representatives does not give rise to doubts as to whether the independence criteria as defined by item 5.4.2 of the DCGK are fulfilled, the Supervisory Board should include at least 13 members who are independent as defined by the DCGK. Consistent with the corporation’s tradition as an open family busi- Henkel Annual Report 2014 ness, possession of a controlling interest or attribution of a controlling interest due to membership in the Henkel family share-pooling agreement is not viewed as a circumstance that creates a conflict of interest in the meaning above. However, irrespective of this, at least three of the shareholder representatives on the Supervisory Board should, as a rule, be neither members of the Henkel family share-pooling agreement nor members of the Shareholders’ Committee nor members of the Supervisory Board of Henkel Management AG. Further, no persons shall be proposed for election at the Annual General Meeting who, at the time of the election, have already reached their 70th birthday. Objectives attainment status The objectives listed above have been achieved in full. Overall, the Supervisory Board has at its disposal the knowledge, skills and technical abilities needed to properly and effectively perform its duties. In addition, there are several members within the Supervisory Board offering international business experience or other international expertise. No individual on the Supervisory Board exceeds the specified maximum age. Currently, seven of the 16 Supervisory Board members are women, a ratio of around 44 percent. None of the Supervisory Board members elected by the Annual General Meeting is a former Management Board member, or performs board or committee functions or acts as a consultant for major competitors, and none are persons whose relationship with the corporation or members of the Management Board could give rise to material conflicts of interest that are not of a merely temporary nature. Four of the eight shareholder representatives are not members of the Henkel family share-pooling agreement, and seven of the eight shareholder representatives are neither members of the Shareholders’ Committee nor members of the Supervisory Board of Henkel Management AG. Transparency / Communications An active and open communication policy ensuring prompt and continuous information dissemination is a major component of the value-based management approach at Henkel. Hence shareholders, shareholder associations, participants in the capital market, financial analysts, the media and the public at large are kept informed of the current situation and major business changes relating to the Henkel 35 Group management report 29 Corporate governance 50 Shares and bonds 55 Fundamental principles of the Group 63 Economic report 100 Risks and opportunities report 108 Forecast 109 Subsequent events Group, with all stakeholders being treated equally. All such information is also promptly made available on the internet. Up-to-date information is likewise incorporated in the regular financial reporting undertaken by the corporation. The dates of the major recurring publications, and also the dates for the press conference on the preceding fiscal year and the Annual General Meeting, are announced in our financial calendar, which is also available on the internet. The company’s advancements and targets in relation to the environment, safety, health and social responsibility are published annually in our Sustainability Report. Shareholders, the media and the public at large are provided with comprehensive information through press releases and information events, while occurrences with the potential to materially affect the price of Henkel shares are communicated in the form of ad hoc announcements. Our internal standards are geared to ensuring compliance with statutory regulations and the safety of our manufacturing facilities and products. The associated requirements have been incorporated within, and implemented throughout, our management systems, and are subject to a regular audit and review regime. This includes monitoring and evaluating relevant statutory and regulatory requirements and changes in a timely fashion. Principles of corporate management / Compliance The members of the Management Board conduct the corporation’s business with the care of a prudent and conscientious business director in accordance with legal requirements, the Articles of Association of Henkel Management AG and the Articles of Association of Henkel AG & Co. KGaA, the rules of procedure governing the actions of the Management Board, the provisions contained in the individual contracts of employment of its members, and also the compliance guidelines and resolutions adopted by and within the Management Board. Statutory and regulatory situation Our business is governed by national rules and regulations and – within the European Union (EU) – increasingly by harmonized pan-European laws. In addition, some of our activities are subject to rules and regulations derived from approvals, licenses, certificates or permits. Our manufacturing operations are bound by rules and regulations with respect to the registration, evaluation, usage, storage, transportation and handling of certain substances and also in relation to emissions, wastewater, effluent and other waste. The construction and operation of production facilities and other plant and equipment are governed by framework rules and regulations – including those relating to the decontamination of soil. Product-specific regulations of relevance to us relate in particular to ingredients and input materials, safety in manufacturing, the handling of products and their contents, and the packaging and marketing of these items. The control mechanisms include statutory material-related regulations, usage prohibitions or restrictions, procedural requirements (test and inspection, identification marking, provision of warning labels, etc.), and product liability law. Corporate management principles which go beyond the statutory requirements are derived from our vision and our values. For our company to be successful, it is essential that we share a common approach to entrepreneurship. The company’s vision provides its management and employees worldwide with both direction and a primary objective. It reaffirms our ambition to meet the highest ethical standards in everything we do. Our vision: • A global leader in brands and technologies. Our vision provides the foundation for building a company with a common ethic. Our values: • W e put our customers at the center of what we do. • We value, challenge and reward our people. • We drive excellent sustainable financial performance. • We are committed to leadership in sustainability. • We build our future on our family business foundation. These values guide our employees i n all the day-today decisions they make, providing a compass for their conduct and actions. 36 Group management report Henkel is committed to ensuring that all business transactions are conducted in an ethically irreproachable, legal fashion. Consequently, Henkel expects all its employees not only to respect the company’s internal rules and all relevant laws, but also to avoid conflicts of interest, to protect Henkel’s assets and to respect the social values of the countries and cultural environments in which the company does business. The Management Board has therefore issued a series of Group-wide codes and standards with precepts that are binding worldwide. These regulatory instruments are p eriodically reviewed and amended as appropriate, evolving in step with the changing legal and commercial conditions that affect Henkel as a globally active corporation. The Code of Conduct and the Henkel Social Standards support our employees in ethical and legal issues. The Leadership Principles define the scope of responsibilities for managers. The Code of Corporate Sustainability describes the principles that drive our sustainable, socially responsible approach to business. These codes also enable Henkel to meet the commitments derived from the United Nations Global Compact. Ensuring compliance in the sense of adherence to laws and regulations is an integral component of our business processes. Henkel has established a Groupwide compliance organization with locally and regionally responsible compliance officers led by a globally responsible General Counsel & Chief Compliance Officer (CCO). The General Counsel & CCO, supported by the Corporate Compliance Office and the interdisciplinary Compliance & Risk Committee, manages and controls compliance-related activities undertaken at the corporate level, coordinates training courses, oversees fulfillment of both internal and external regulations, and supports the corporation in the further development and implementation of the associated standards. The local and regional c ompliance officers are responsible for organizing and overseeing the training activities and implementation measures tailored to the specific requirements of their locations. They report to the C orporate Compliance Office. The General Counsel & CCO reports regularly to the Management Board and to the Audit Committee of the Supervisory Board on identified compliance violations. Henkel Annual Report 2014 The issue of compliance is also a permanent item in the target agreements signed by all managerial staff of Henkel. Due to their position, it is particularly incumbent on them to set the right example for their subordinates, to effectively communicate the compliance rules and to ensure that these are obeyed through the implementation of suitable organizational measures. The procedures to be followed in the event of complaints or suspicion of malpractice also constitute an important element of the compliance policy. In addition to our internal reporting system and complaint registration channels, employees may also, for the purpose of reporting serious violations to the Corporate Compliance Office, anonymously use a compliance hotline operated by an external service provider. The Head of the Corporate Compliance Office is mandated to initiate the necessary follow-up procedures. Our corporate compliance activities are focused on matters of safety, health and the environment, antitrust law and the fight against corruption. In our Code of Conduct, the corporate guidelines based upon it, and other publications, the Management Board clearly expresses its rejection of all violations of the principles of compliance, particularly antitrust violations and corruption. We do not tolerate such violations in any way. For Henkel, bribery, anticompetitive agreements, or any other violations of laws are no way to conduct business. A further compliance-relevant area relates to capital market law. Supplementing the legal provisions, internal codes of conduct have been put in place to regulate the treatment of information that has the potential to affect share prices. The company has an Ad Hoc Committee comprised of representatives from various departments. In order to ensure that all insider information is handled as required by law, this Committee reviews developments and events for their possible effect on share prices, determining the need to issue reports to the capital markets on an ad hoc basis. There are also rules that go beyond the legal requirements, governing the behavior of the members of the Management Board, the Supervisory Board and the Shareholders’ Committee, and also employees of the corporation who, due to their function or involvement in projects, have access to insider information. An insider register is kept of the people involved. 37 Group management report 29 Corporate governance 50 Shares and bonds 55 Fundamental principles of the Group 63 Economic report 100 Risks and opportunities report 108 Forecast 109 Subsequent events Further information on corporate governance and the principles guiding our corporate stewardship can be found on our website at www.henkel.com/ir or in our Sustainability Report. Henkel also complies with all the suggestions (“may/should” provisions) of the DCGK in keeping with our legal form and the special statutory features anchored in our Articles of Association. Application of the German Corporate Governance Code The corresponding declarations of compliance together with the reasons for deviations from recommendations can be found on our website at The Government Commission made no changes or additions to the German Corporate Governance Code (DCGK) in 2014. The clarifications of the model tables in the Appendix to the DCGK for disclosing Management Board members’ remuneration, which were published on September 30, 2014, are reflected in the tables found in the remuneration report. Taking into account the special features arising from our legal form and Articles of Association, Henkel AG & Co. KGaA complies with the recommendations (“shall” provisions) of the DCGK, latest edition, with one exception: In order to protect the legitimate interests and privacy of the members of the corporate management bodies who are also members of the Henkel family, their shareholdings are not disclosed unless required by law. The DCGK requires disclosure of shareholdings upward of one percent. In accordance with the Declaration of Compliance, the following information is reported concerning the aggregate shareholdings of all members of a corporate body, taking the relevant provisions for attribution into account: The aggregate holdings of the members of the Supervisory Board and of the members of the Shareholders’ Committee exceed in each case one percent of the shares issued by the company. The members of the Management Board together hold less than one percent of the shares issued by the company. www.henkel.com/ir Directors’ dealings In accordance with Section 15a of the German Securities Trading Act [WpHG] (Directors’ Dealings), members of the Management Board, the Supervisory Board and the Shareholders’ Committee, and parties related to same, are obliged to disclose notifiable transactions involving shares in Henkel AG & Co. KGaA or their derivative financial instruments where the value of such transactions by the member, and parties related to the member, attains or exceeds 5,000 euros in a calendar year. The transactions reported to the corporation in the past fiscal year were properly d isclosed and can be seen on the website www.henkel.com/ir 38 Group management report Henkel Annual Report 2014 Remuneration report This remuneration report provides an outline of the compensation system for the Management Board, Henkel Management AG as the Personally Liable Partner, the Supervisory Board and the Shareholders’ Committee of Henkel AG & Co. KGaA, and the Supervisory Board of Henkel Management AG; it also explains the level and structure of the remuneration paid. The report takes into account the recommendations of the German Corporate Governance Code (DCGK) and contains all disclosures and explanations pursuant to the provisions of the German Commercial Code [HGB], including compliance with the German Accounting Standard No. 17 (DRS 17), and in accordance with International Financial Reporting Standards (IFRS). The associated information has not therefore been additionally disclosed in the notes to the consolidated financial statements at the end of this Annual Report. 1. Management Board remuneration Regulation, structure and amounts The compensation for members of the Management Board of Henkel Management AG is set by the Supervisory Board of Henkel Management AG in consultation with the Human Resources Subcommittee of the Shareholders’ Committee. The Supervisory Board of Henkel Management AG is comprised of three members of the Shareholders’ Committee. The structure and amounts of Management Board remuneration are aligned to the size and international activities of the corporation, its economic and financial position, its performance and future prospects, the normal levels of remuneration encountered in comparable companies, and also the general compensation structure within the corporation. The compensation package is further determined on the basis of the functions, responsibilities and personal performance of the individual executives, and the performance of the Management Board as a whole. The variable annual remuneration components have been devised such that they take into account both positive and negative developments. The overall remuneration mix is designed to be internationally competitive while also providing an incentive for sustainable business development and a sustainable increase in shareholder value in a dynamic environment. Members of the Management Board receive remuneration consisting of variable, performance-related components and non-performance-related components. The non-performance-related compensation is made up of their fixed remuneration together with various in-kind and other benefits (other emoluments). The performance-related compensation has two parts. The first is a variable annual cash payment (short-term incentive or “STI”), 60 percent of which is short-term variable cash remuneration and 40 percent of which is long-term variable cash remuneration in the form of an investment financed by the recipient in Henkel preferred shares (share deferral). The second is a variable cash payment based on the long-term 10 Remuneration structure Long-term incentive Performance parameters: Increase in adjusted EPS Share deferral (40 % of STI) Variable annual remuneration (STI) Performance parameters: ROCE, EPS, adjusted in each case; individual targets Short-term variable cash remuneration (60 % of STI) Fixed salary and other emoluments Non-performancerelated components Performance-related components, short-term Performance-related components, long-term 39 Group management report 29 Corporate governance 50 Shares and bonds 55 Fundamental principles of the Group 63 Economic report 100 Risks and opportunities report 108 Forecast 109 Subsequent events erformance of the business (long-term incentive or p “LTI”). The remuneration targeting long-term performance thus consists of the share deferral and the LTI. Pension benefits also form part of the remuneration package. In addition, the Supervisory Board of Henkel Management AG may, at its discretion and after due consideration, grant a special payment in recognition of exceptional achievements. The Supervisory Board of Henkel Management AG regularly reviews the compensation system as well as the appropriateness of the compensation. The components in detail: In determining the STI, the Supervisory Board of Henkel Management AG also takes into account the apparent sustainability of the economic performance delivered in the course of the year, and the performance levels of the Management Board members. The total amount of the STI is subject to a cap. Short-term and long-term components of the variable annual cash remuneration The STI is paid annually in arrears in the full amount in cash once the corporation’s annual financial statements have been approved by the Annual General Meeting. Non-performance-related compensation Fixed salary The fixed remuneration takes into account the assigned function and responsibility and the market conditions. It is paid out monthly as salary and amounts to 1,050,000 euros per year for the Chairman of the Management Board and 700,000 euros per year for the other Management Board members. Other emoluments The members of the Management Board also receive other emoluments, primarily in the form of costs associated with, or the cash value of, in-kind benefits and other fringe benefits such as standard commercial insurance policies, reimbursement of accommodation / moving costs, costs associated with preventive medical examinations, and provision of a company car or use of a car service, including any taxes on same. All members of the Management Board are entitled, in principle, to the same emoluments, whereby the amounts vary depending on personal situation. Performance-related compensation Variable annual cash remuneration The performance criteria governing the variable annual cash remuneration (STI) are primarily return on capital employed (ROCE) and earnings per preferred share (EPS) in the relevant fiscal year, adjusted in each case for exceptional items. The application of these performance parameters ensures that profitable growth is duly rewarded by Henkel. Further factors used in establishing the STI payable to the Management Board members are the Group results and the results of the relevant business unit, the quality of management demonstrated in those business units, and the individual contribution made by the Management Board member concerned. The recipients can dispose of around 60 percent of this payment as they wish. This constitutes their short-term variable cash remuneration. The members of the Management Board invest the remaining amount, corresponding to about 40 percent, in Henkel preferred shares which they purchase on the stock exchange at the price prevailing at the time of acquisition. This constitutes their long-term variable cash remuneration, known as the share deferral. These shares are placed in a blocked custody account with a drawing restriction. The lock-up period in each case expires on December 31 of the third year following purchase. This share deferral ensures that the members of the Management Board participate through a portion of their compensation in the longterm performance of the corporation. Long-term incentive (LTI) The long-term incentive is a variable cash payment based on the long-term performance of the corporation, the amount payable being dependent on the future increase registered in EPS over three consecutive years (the performance period). On completion of the performance period, target achievement is ascertained by the Supervisory Board of Henkel Management AG on the basis of the increase in EPS attained. The EPS of the fiscal year preceding the year of payment is compared to the EPS of the second fiscal year following the year of payment. The amounts included in the calculation of the increase are, in each case, the earnings per preferred share adjusted for exceptional items, as disclosed in the certified and approved consolidated financial statements of the relevant fiscal years. The total amount of the long-term incentive is subject to a cap. 40 Group management report Henkel Annual Report 2014 11 Caps on remuneration Fixed salary Short-term variable cash remuneration Long-term variable cash remuneration (share deferral) Long-term incentive, conditional entitlement Total compensation minimum Total compensation maximum 1,050,000 0 to 3,294,600 0 to 2,196,400 0 to 918,000 1,050,000 7,459,000 700,000 0 to 1,938,000 0 to 1,292,000 0 to 540,000 700,000 4,470,000 in euros Chairman of the Management Board Ordinary member of the Management Board Special payments In addition to the remuneration components described above, the Supervisory Board of Henkel Management AG may, at its discretion and after due consideration, grant a special payment in recognition of exceptional achievements. The amount of a special payment is limited to an amount equating to the respective Management Board member’s fixed salary; the maximum compensation level – as determined by remuneration for a fiscal year if the caps on STI and LTI are reached – may not be exceeded as a result of such payment. plus variable annual compensation). The percentage is the same for all members of the Management Board. The annual contributions depend to a certain degree on changes in the cash compensation, with minimum and maximum limits (caps) for the allocation. The annual pension component is arrived at by multiplying the amount of 3 percent of the current pension threshold by the age-based pension factor. Any vested pension rights earned within the corporation prior to the executive’s joining the Management Board are taken into account as start-up units. The defined contribution pension system ensures an appropriate, performance-based retirement pension. Caps on remuneration Taking into account the above-mentioned caps for the performance-related components of remuneration, the table above shows the minimum and maximum remuneration amounts that result for a fiscal year (excluding other emoluments and pension expenses). Pension benefits (retirement pensions and survivors’ benefits) The active members of the Management Board have a defined contribution pension plan. Once a covered event occurs, the beneficiaries receive a superannuation lump-sum payment combined with a continuing basic annuity. The superannuation lump-sum payment comprises the total of annual contributions calculated on the basis of a certain percentage of the cash compensation paid in the fiscal year in question (fixed An entitlement to pension benefits arises on retirement, on termination of the employment relationship on or after attainment of the statutory retirement age, in the event of death, or in the event of permanent incapacity for work. If a member of the Management Board has received no pension benefits prior to their death, the superannuation lump sum accumulated up to time of death is paid out to the surviving spouse or surviving children. In addition, the executive’s surviving spouse receives pension payments amounting to 60 percent and each dependent child receives benefit payments amounting to 15 percent of the executive’s pension entitlement – up to a maximum of 100 percent for all beneficiaries. Surviving child benefit is generally paid until each child’s 18th birthday or until completion of their professional training, but only up to their 27th birthday. 41 Group management report 29 Corporate governance 50 Shares and bonds 55 Fundamental principles of the Group 63 Economic report 100 Risks and opportunities report 108 Forecast 109 Subsequent events Provisions governing termination of position on the Management Board In the event of retirement, active members of the Management Board who were first appointed prior to 2009 are entitled to continued payment of their fixed compensation for a further six months, but not beyond their 65th birthday. In the event of death in service, the payments are made to the surviving spouse or entitled dependent children. In the event that a member’s position on the Management Board is terminated prematurely without good cause or reason, the executive contract provides for a severance settlement amounting to the remuneration for the remaining contractual term (fixed remuneration plus variable annual remuneration for single or multiple years) in the form of a discounted lump-sum payment. These severance payments are limited to two years’ compensation (severance payment cap) and may not extend over a period that exceeds the residual term of the executive contract. In the event that the sphere of responsibility / executive function is altered or restricted to such an extent that it is no longer comparable to the position prior to the change or restriction, the affected members of the Management Board are entitled to resign from office and request premature termination of their contract. In such case, members are entitled to severance payments amounting to not more than two years’ compensation. Upon an executive’s departure from the Management Board, the STI is paid on a time-proportion basis on the ordinary payment date after the end of the fiscal year in which the appointment ends. If not already expired, lock-up periods for the share deferral end six months after departure. This applies accordingly to entitlements under the LTI. However, any entitlements from any tranche whose performance period has not yet ended at the date of departure are forfeited without replacement if the departure is based on good cause or reason that would have justified revocation of the appointment or termination of the employment contract. In addition, the executive contracts include a postcontractual non-competition clause with a term of up to two years. The associated discretionary payment can be up to 50 percent of annual compensation after allowing for any severance payments. Equally, any earnings from new extra-contractual activities during the non-competition period shall be offset against this discretionary payment to the extent that such earnings and discretionary payment together exceed the actual compensation paid in the last fully ended fiscal year by 10 percent or more. No entitlements exist in the event of premature termination of executive duties resulting from a change in control. Other provisions The corporation maintains directors and officers insurance (D&O insurance) for directors and officers of the Henkel Group. For members of the Management Board there is a deductible amounting to 10 percent per loss event, subject to a maximum for the fiscal year of one and a half times their annual fixed remuneration. Remuneration for 2014 Excluding pension entitlements, the total compensation paid to members of the Management Board for the performance of their duties for and on behalf of Henkel AG & Co. KGaA and its subsidiaries during the year under review amounted to 27,404,426 euros (previous year: 26,944,135 euros). Fixed salaries accounted for 4,550,000 euros (previous year: 4,550,000 euros), other emoluments for 319,926 euros (previous year: 167,160 euros), short-term variable cash remuneration for 12,576,000 euros (previous year: 12,391,485 euros), long-term variable cash remuneration (share deferral) for 8,384,000 euros (previous year: 8,260,990 euros), and the long-term incentive for 1,574,500 euros (previous year: 1,574,500 euros). In accordance with legal regulations, the value of the long-term incentive granted for 2014, which is payable in 2017 contingent on the achievement of performance objectives, is recognized here based on the target amount that would be paid assuming a 30-percent increase in EPS within the performance period. Compensation for the reporting period granted to members of the Management Board serving in 2014, separated into the above-mentioned components, is shown in the table overleaf: 42 Group management report Henkel Annual Report 2014 12 Remuneration of Management Board members who served in 2014 in euros 1. Fixed salary 1 2. Other emoluments 1 3. Short-term variable cash remuneration 1 Single-year remuneration (Total of 1 to 3) Kasper Rorsted (Chairman) Jan-Dirk Auris (Adhesive Technologies) Carsten Knobel (Finance) Kathrin Menges (Human Resources) Bruno Piacenza (Laundry & Home Care) Hans Van Bylen (Beauty Care) Member of the Management Board since 4/1/2005 Member of the Management Board since 1/1/2011 Member of the Management Board since 7/1/2012 Member of the Management Board since 10/1/2011 Member of the Management Board since 1/1/2011 Member of the Management Board since 7/1/2005 Total 2014 1,050,000 700,000 700,000 700,000 700,000 700,000 4,550,000 2013 1,050,000 700,000 700,000 700,000 700,000 700,000 4,550,000 2014 65,252 51,276 53,072 43,126 59,236 47,964 319,926 2013 53,333 22,501 26,928 15,745 21,259 27,394 167,160 2014 3,216,000 1,872,000 1,872,000 1,872,000 1,872,000 1,872,000 12,576,000 2013 3,168,735 1,844,550 1,844,550 1,844,550 1,844,550 1,844,550 12,391,485 2014 4,331,252 2,623,276 2,625,072 2,615,126 2,631,236 2,619,964 17,445,926 2013 4,272,068 2,567,051 2,571,478 2,560,295 2,565,809 2,571,944 17,108,645 4. Long-term variable cash remuneration (share deferral) 1 2014 2,144,000 1,248,000 1,248,000 1,248,000 1,248,000 1,248,000 8,384,000 2013 2,112,490 1,229,700 1,229,700 1,229,700 1,229,700 1,229,700 8,260,990 5. Long-term incentive 2 2014 399,500 235,000 235,000 235,000 235,000 235,000 1,574,500 2013 399,500 235,000 235,000 235,000 235,000 235,000 1,574,500 Multi-year remuneration (Total of 4 and 5) 2014 2,543,500 1,483,000 1,483,000 1,483,000 1,483,000 1,483,000 9,958,500 2013 2,511,990 1,464,700 1,464,700 1,464,700 1,464,700 1,464,700 9,835,490 Total remuneration (Total of 1 to 5) 2014 6,874,752 4,106,276 4,108,072 4,098,126 4,114,236 4,102,964 27,404,426 2013 6,784,058 4,031,751 4,036,178 4,024,995 4,030,509 4,036,644 26,944,135 1 The payout is reported pursuant to HGB / IFRS. 2 Target amount pursuant to HGB / IFRS, based on a 30-percent increase in adjusted earnings per preferred share within the performance period of three years. LTI payout for 2014 occurs in 2017; LTI payout for 2013 occurs in 2016. In the year under review, no member of the Management Board was granted non-standard benefits by the company in connection with premature termination of their tenure, nor were any such entitlements or arrangements modified. No member of the Management Board was pledged payments from third parties in respect of their duties as executives of the company, nor were any such payments granted in the reporting period. 13 Structure of Management Board remuneration Components of single-year remuneration Components of multi-year remuneration Fixed salary Other emoluments Short-term v ariable cash remuneration Long-term variable cash remuneration (share deferral) Long-term incentive Total remuneration 4,550,000 319,926 12,576,000 8,384,000 1,574,500 27,404,426 16.6 % 1.2 % 45.9 % 30.6 % 5.7 % 100 % 4,550,000 167,160 12,391,485 8,260,990 1,574,500 26,944,135 16.9 % 0.6 % 46.0 % 30.7 % 5.8 % 100 % in euros Total Total 2014 2013 43 Group management report 29 Corporate governance 50 Shares and bonds 55 Fundamental principles of the Group 63 Economic report 100 Risks and opportunities report 108 Forecast 109 Subsequent events Pension benefits The pension benefits accruing to the members of the Management Board as of the reporting date, and contributions to the pension scheme made in 2014, are shown in the following table: 14 Pension benefits Superannuation lump sum Basic annuity Total lump sum 2014 Addition to lump sum 2014 Kasper Rorsted 4,435,470 648,090 2,078 127 Jan-Dirk Auris 1,278,270 391,050 719 156 Carsten Knobel 839,610 391,050 408 162 Kathrin Menges 961,560 391,050 474 136 Bruno Piacenza 1,278,270 391,050 642 141 Hans Van Bylen 3,004,964 391,050 1,911 123 in euros Total Addition to basic annuity basic annuity 2014 The figures calculated in accordance with International Accounting Standard (IAS) 19 for service cost for entitlements acquired in the reporting year and the present value of total pension benefits accruing to the end of the fiscal year are shown in the following table: 15 Service cost / Present value of pension benefits Service cost for pension benefits in the reporting year Present value of pension benefits as of December 31 2014 650,059 5,849,341 2013 589,203 4,380,841 2014 394,602 2,495,849 in euros Kasper Rorsted Jan-Dirk Auris Carsten Knobel Kathrin Menges Bruno Piacenza Hans Van Bylen Total 2013 386,169 1,661,066 2014 399,364 2,002,885 2013 228,357 1,198,018 2014 397,958 1,661,415 2013 237,127 1,029,716 2014 393,045 1,465,545 2013 383,672 953,417 2014 392,994 5,346,432 2013 389,976 4,024,577 2014 2,628,022 18,821,467 2013 2,214,504 13,247,635 For pension obligations to former members of the Management Board and the former management of Henkel KGaA, as well as the former management of its legal predecessor and surviving dependents, 108,218,489 euros (previous year: 95,956,228 euros) is deferred. Amounts paid to such recipients during the year under review totaled 7,138,469 euros (previous year: 7,626,894 euros). 44 Group management report Henkel Annual Report 2014 Disclosures in accordance with the German Corporate Governance Code (DCGK) In accordance with the recommendations of the DCGK, the following tables show a)the benefits granted for fiscal 2014, including the maximum and minimum achievable compensation for variable compensation components, and b)the allocation in or for fiscal 2014. Pursuant to DCGK, payments / benefits granted for the reporting year to members of the Management Board serving in 2014 1. Fixed salary 1 2. Other emoluments 1 Total (1 and 2) 3. Shortterm variable cash remuneration 2 4. Longterm variable cash remuneration (share deferral) 2 5. Longterm incentive 3 Total (1 to 5) 6. Service cost Total remuneration pursuant to DCGK (Total of 1 to 6) 1,050,000 65,252 1,115,252 3,135,150 2,090,100 399,500 6,740,002 650,059 7,390,061 1,050,000 65,252 1,115,252 0 0 0 1,115,252 650,059 1,765,311 1,050,000 65,252 1,115,252 3,294,600 2,196,400 918,000 7,524,252 650,059 8,174,311 in euros Kasper Rorsted 2014 (Chairman) 2014 (Min) Member of the Management Board 2014 (Max) since 4/1/2005 Jan-Dirk Auris (Adhesive Technologies) Member of the Management Board since 1/1/2011 2013 1,050,000 53,333 1,103,333 3,089,250 2,059,500 399,500 6,651,583 589,203 7,240,786 2014 700,000 51,276 751,276 1,836,300 1,224,200 235,000 4,046,776 394,602 4,441,378 2014 (Min) 700,000 51,276 751,276 0 0 0 751,276 394,602 1,145,878 2014 (Max) 700,000 51,276 751,276 1,938,000 1,292,000 540,000 4,521,276 394,602 4,915,878 700,000 22,501 722,501 1,809,300 1,206,200 235,000 3,973,001 386,169 4,359,170 700,000 53,072 753,072 1,836,300 1,224,200 235,000 4,048,572 399,364 4,447,936 700,000 53,072 753,072 0 0 0 753,072 399,364 1,152,436 700,000 53,072 753,072 1,938,000 1,292,000 540,000 4,523,072 399,364 4,922,435 700,000 26,928 726,928 1,809,300 1,206,200 235,000 3,977,428 228,357 4,205,785 700,000 43,126 743,126 1,836,300 1,224,200 235,000 4,038,626 397,958 4,436,584 700,000 43,126 743,126 0 0 0 743,126 397,958 1,141,084 700,000 43,126 743,126 1,938,000 1,292,000 540,000 4,513,126 397,958 4,911,084 2013 700,000 15,745 715,745 1,809,300 1,206,200 235,000 3,966,245 237,127 4,203,372 2014 700,000 59,236 759,236 1,836,300 1,224,200 235,000 4,054,736 393,045 4,447,781 2013 Carsten Knobel 2014 (Finance) 2014 (Min) Member of the Management Board 2014 (Max) since 7/1/2012 2013 Kathrin Menges 2014 (Human Resources) 2014 (Min) Member of the Management Board 2014 (Max) since 10/1/2011 Bruno Piacenza (Laundry & Home Care) Member of the Management Board since 1/1/2011 16 2014 (Min) 700,000 59,236 759,236 0 0 0 759,236 393,045 1,152,281 2014 (Max) 700,000 59,236 759,236 1,938,000 1,292,000 540,000 4,529,236 393,045 4,922,281 2013 700,000 21,259 721,259 1,809,300 1,206,200 235,000 3,971,759 383,672 4,355,431 700,000 47,964 747,964 1,836,300 1,224,200 235,000 4,043,464 392,994 4,438,458 Hans Van Bylen 2014 (Beauty Care) 2014 (Min) Member of the Management Board 2014 (Max) since 7/1/2005 2013 700,000 47,964 747,964 0 0 0 747,964 392,994 1,140,958 700,000 47,964 747,964 1,938,000 1,292,000 540,000 4,517,964 392,994 4,910,958 700,000 27,394 727,394 1,809,300 1,206,200 235,000 3,977,894 389,976 4,367,870 1 Payment amount. 2 Pursuant to DCGK, expected amount based on an average probability scenario (not the a ctual amount paid out). 3 Target amount pursuant to DCGK, based on a 30-percent increase in adjusted earnings per preferred share within the performance p eriod of three years. LTI payout for 2014 occurs in 2017; LTI payout for 2013 occurs in 2016. 45 Group management report 29 Corporate governance 50 Shares and bonds 55 Fundamental principles of the Group 63 Economic report 100 Risks and opportunities report 108 Forecast 109 Subsequent events Pursuant to DCGK, payments / benefits allocated in or for the reporting yearto members of the Management Board serving in 2014 17 5. Long-term incentive 3 1. Fixed salary 1 2. Other emoluments 1 Total (1 and 2) 3. Shortterm variable cash remuneration 2 2012 2011 4. Longtranche tranche term vari(term (term able cash remunera- 1/1/2012 – 1/1/2011 – tion (share 12/31/2014) 12/31/2013) deferral) 2 2014 1,050,000 65,252 1,115,252 3,216,000 2,144,000 2013 1,050,000 53,333 1,103,333 3,168,735 2,112,490 2014 700,000 51,276 751,276 1,872,000 1,248,000 2013 700,000 22,501 722,501 1,844,550 1,229,700 2014 700,000 53,072 753,072 1,872,000 1,248,000 2013 700,000 26,928 726,928 1,844,550 1,229,700 2014 700,000 43,126 743,126 1,872,000 1,248,000 2013 700,000 15,745 715,745 1,844,550 1,229,700 2014 700,000 59,236 759,236 1,872,000 1,248,000 2013 700,000 21,259 721,259 1,844,550 1,229,700 2014 700,000 47,964 747,964 1,872,000 1,248,000 2013 700,000 27,394 727,394 1,844,550 1,229,700 in euros Kasper Rorsted (Chairman) Member of the Management Board since 4/1/2005 Jan-Dirk Auris (Adhesive Technologies) Member of the Management Board since 1/1/2011 Carsten Knobel (Finance) Member of the Management Board since 7/1/2012 Kathrin Menges (Human Resources) Member of the Management Board since 10/1/2011 Bruno Piacenza (Laundry & Home Care) Member of the Management Board since 1/1/2011 Hans Van Bylen (Beauty Care) Member of the Management Board since 7/1/2005 536,637 487,821 315,669 325,214 157,834 – 268,318 69,108 315,669 325,214 315,669 325,214 Total (1 to 5) 6. Service Total remucost neration pursuant to DCGK (Total of 1 to 6) 7,011,889 650,059 7,661,948 6,872,379 589,203 7,461,582 4,186,945 394,602 4,581,547 4,121,965 386,169 4,508,134 4,030,906 399,364 4,430,270 3,801,178 228,357 4,029,535 4,131,444 397,958 4,529,402 3,859,103 237,127 4,096,230 4,194,905 393,045 4,587,950 4,120,723 383,672 4,504,395 4,183,633 392,994 4,576,627 4,126,858 389,976 4,516,834 1P ayment amount. 2 Pursuant to DCGK, based on the payment amount of the remuneration components granted for the relevant fiscal year; actual allocation occurs in the following year. 3 Pursuant to DCGK, based on the payment amount of those tranches for which the plan term of three years ended in the relevant fiscal year; actual allocation occurs in the following year. 46 Group management report 2. Remuneration of Henkel Management AG for assumption of personal liability, and reimbursement of expenses to same For assumption of personal liability and management responsibility, Henkel Management AG in its function as Personally Liable Partner receives an annual payment of 50,000 euros (= 5 percent of its capital stock) plus any value-added tax (VAT) due, said fee being payable irrespective of any profit or loss made. Henkel Management AG may also claim reimbursement from or payment by the corporation of all expenses incurred in connection with the management of the corporation’s business, including the remuneration and pensions paid to its corporate management bodies. 3. Remuneration of the Supervisory Board and of the Shareholders’ Committee of Henkel AG & Co. KGaA Regulation, structure and amounts The remuneration for the Supervisory Board and the Shareholders’ Committee is determined by the Annual General Meeting; the corresponding provisions are contained in Articles 17 and 33 of the Articles of Association. Each member of the Supervisory Board and of the Shareholders’ Committee receives a fixed fee of 70,000 euros and 100,000 euros per year, respectively. The Chairs of the Supervisory Board and the Shareholders’ Committee each receive double this amount, and the Vice Chair in each case one and a half times the aforementioned amount. Members of the Shareholders’ Committee who are also members of one or more subcommittees of the Shareholders’ Committee each receive additional remuneration of 100,000 euros; if they chair one or more subcommittees, they receive 200,000 euros. Henkel Annual Report 2014 Members of the Supervisory Board who are also members of one or more committees each receive additional remuneration of 35,000 euros; if they chair one or more committees, they receive 70,000 euros. Activity in the Nominations Committee is not remunerated separately. The higher remuneration allocated to the members of the Shareholders’ Committee as compared to the Supervisory Board takes into account that, under the Articles of Association, the Shareholders’ Committee participates in the management of the corporation. Other provisions The members of the Supervisory Board or a committee receive an attendance fee amounting to 1,000 euros for each meeting in which they participate. If several meetings take place on one day, the attendance fee is only paid once. In addition, the members of the Supervisory Board and of the Shareholders’ Committee are reimbursed expenses incurred in connection with their positions. The members of the Supervisory Board are also reimbursed the value-added tax (VAT) payable on their total remunerations and reimbursed expenses. The corporation maintains directors and officers insurance for directors and officers of the Henkel Group. For members of the Supervisory Board and Shareholders’ Committee there is a deductible amounting to 10 percent per loss event, subject to a maximum for the fiscal year of one and a half times their annual fixed remuneration. 47 Group management report 29 Corporate governance 50 Shares and bonds 55 Fundamental principles of the Group 63 Economic report 100 Risks and opportunities report 108 Forecast 109 Subsequent events Remuneration for 2014 Total remuneration paid to the members of the Supervisory Board for the year under review (fixed fee, attendance fee, remuneration for committee activity) amounted to 1,562,000 euros plus VAT (previous year: 1,529,589 euros plus VAT). Of this amount, fixed fees accounted for 1,225,000 euros, attendance fees for 71,000 euros, and remuneration for committee activity (including associated attendance fees) for 266,000 euros. Total remuneration paid to the members of the Shareholders’ Committee for the year under review (fixed fee and remuneration for subcommittee activity) amounted to 2,350,000 euros (previous year: 2,350,000 euros). Of this amount, fixed fees were 1,150,000 euros and remuneration for subcommittee activity 1,200,000 euros. In the year under review, no compensation or benefits were paid or granted for personally performed services, including in particular advisory or intermediation services. The remuneration of the individual members of the Supervisory Board and of the Shareholders’ Committee, broken down according to the above-mentioned components, are presented in the tables on the following pages. 4. Remuneration of the Supervisory Board of Henkel Management AG According to Article 14 of the Articles of Association of Henkel Management AG, the members of the Supervisory Board of Henkel Management AG are each entitled to receive annual remuneration of 10,000 euros. However, those members of said Supervisory Board who are also and simultaneously members of the Supervisory Board or the Shareholders’ Committee of Henkel AG & Co. KGaA do not receive this remuneration. As the members of the Supervisory Board of Henkel Management AG are also members of the Share holders’ Committee, no remuneration was paid in respect of this Supervisory Board in the year under review. 48 Group management report Henkel Annual Report 2014 18 Supervisory Board remuneration Components of total remuneration Fixed fee Attendance fee Fee for committee activity 1 Total remuneration 2 182,000 in euros Dr. Simone Bagel-Trah 3, Chair 2014 140,000 4,000 38,000 2013 140,000 4,000 38,000 182,000 Winfried Zander 3, Vice Chair 2014 105,000 4,000 39,000 148,000 2013 105,000 4,000 39,000 148,000 Jutta Bernicke 2014 70,000 5,000 – 75,000 2013 70,000 5,000 – 75,000 2014 70,000 5,000 – 75,000 Dr. Kaspar von Braun Boris Canessa Ferdinand Groos Béatrice Guillaume-Grabisch 2013 70,000 5,000 – 75,000 2014 70,000 5,000 – 75,000 2013 70,000 5,000 – 75,000 2014 70,000 4,000 – 74,000 2013 70,000 5,000 – 75,000 2014 70,000 5,000 – 75,000 2013 70,000 5,000 – 75,000 Peter Hausmann 3 (since April 15, 2013) 2014 70,000 3,000 38,000 111,000 2013 49,863 2,000 27,932 79,795 Birgit Helten-Kindlein 3 2014 70,000 4,000 39,000 113,000 Prof. Dr. Michael Kaschke 3 2013 70,000 4,000 39,000 113,000 2014 70,000 3,000 38,000 111,000 2013 70,000 3,000 39,000 112,000 Barbara Kux (since July 3, 2013) 2014 70,000 5,000 – 75,000 2013 34,904 2,000 – 36,904 Mayc Nienhaus 2014 70,000 5,000 – 75,000 75,000 2013 70,000 5,000 – Thierry Paternot (until January 14, 2013) 2014 – – – – 2013 2,685 – – 2,685 Andrea Pichottka 2014 70,000 5,000 – 75,000 2013 70,000 5,000 – 75,000 2014 70,000 5,000 – 75,000 Dr. Martina Seiler Prof. Dr. Theo Siegert 3 2013 70,000 4,000 – 74,000 2014 70,000 4,000 74,000 148,000 2013 70,000 4,000 74,000 148,000 2014 70,000 5,000 – 75,000 2013 70,000 5,000 – 75,000 Michael Vassiliadis 3 (until April 15, 2013) 2014 – – – – 2013 20,137 2,000 11,068 33,205 Total 2014 1,225,000 71,000 266,000 1,562,000 2013 1,192,589 69,000 268,000 1,529,589 Edgar Topsch 1R emuneration for service on the Audit Committee, including attendance fee; there is no separate remuneration payable for service on the Nominations Committee. 2 Figures do not include VAT. 3 Member of the Audit Committee. Audit Committee Chair: Prof. Dr. Theo Siegert. 49 Group management report 29 Corporate governance 50 Shares and bonds 55 Fundamental principles of the Group 63 Economic report 100 Risks and opportunities report 108 Forecast 109 Subsequent events 19 Shareholders’ Committee remuneration Components of total remuneration Fixed fee Fee for subcommittee activity Total remuneration 200,000 200,000 400,000 in euros Dr. Simone Bagel-Trah, Chair (Chair Human Resources Subcommittee) 2014 2013 200,000 200,000 400,000 Dr. Christoph Henkel, Vice Chair (Chair Finance Subcommittee) 2014 150,000 200,000 350,000 2013 100,000 200,000 350,000 Prof. Dr. Paul Achleitner (Member Finance Subcommittee) 2014 100,000 100,000 200,000 2013 100,000 100,000 200,000 Johann-Christoph Frey (Member HR Subcommittee) 2014 100,000 100,000 200,000 2013 100,000 100,000 200,000 Stefan Hamelmann (Vice Chair Finance Subcommittee) 2014 100,000 100,000 200,000 2013 100,000 100,000 200,000 Prof. Dr. Ulrich Lehner (Member Finance Subcommittee) 2014 100,000 100,000 200,000 2013 100,000 100,000 200,000 Dr. Norbert Reithofer (Member Finance Subcommittee) 2014 100,000 100,000 200,000 2013 100,000 100,000 200,000 Jean-François van Boxmeer (since April 15, 2013) (Member HR Subcommittee) 2014 100,000 100,000 200,000 2013 71,233 71,233 142,466 Konstantin von Unger (Vice Chair HR Subcommittee) 2014 100,000 100,000 200,000 2013 100,000 100,000 200,000 Karel Vuursteen (until April 15, 2013) (Member HR Subcommittee) 2014 – – – 2013 28,767 28,767 57,534 Werner Wenning (Member HR Subcommittee) 2014 100,000 100,000 200,000 2013 100,000 100,000 200,000 Total 2014 1,150,000 1,200,000 2,350,000 2013 1,150,000 1,200,000 2,350,000 50 Group management report Henkel Annual Report 2014 Shares and bonds + 6.1 % increase in Henkel preferred share price. + 6.3 % increase in Henkel ordinary share price. €36.8 bn market capitalization. Index. On December 11, Henkel preferred shares reached an all-time high of 90.45 euros. The ordinary shares also recorded their highest price ever, 80.44 euros, on December 29, 2014. Henkel shares showed very positive performance in 2014. Over the course of the year, the DAX rose by 2.7 percent to 9,805.55 points. The index for consumer goods stocks – the Dow Jones Euro Stoxx Consumer Goods – increased 5.9 percent, closing at 532.68 points. In this market environment, the price of Henkel preferred shares increased significantly, by 6.1 percent to 89.42 euros. The ordinary shares also showed a strong gain and closed at a record level of 80.44 euros, 6.3 percent higher on a year-on-year basis. Our shares therefore outperformed both the DAX and other shares representing the consumer goods sector. The preferred shares traded at an average premium of 11.2 percent over the ordinary shares in 2014. Year on year, the trading volume (Xetra) of preferred shares increased. Each trading day saw an average of around 614,000 preferred shares changing hands (2013: around 554,000). The average volume for our ordinary shares declined to around 81,000 shares per trading day (2013: 118,000). Due to very positive share price developments, the market capitalization of our ordinary and preferred shares increased from 34.7 billion euros to 36.8 billion euros. Henkel shares largely tracked the overall market in the course of the year, although initially performing below their benchmark indices. After a notable decline in share prices in the third quarter, the overall market embarked on a substantial upward trend starting in the middle of the fourth quarter, with Henkel shares performing even better than both the DAX and the Dow Jones Euro Stoxx Consumer Goods Henkel shares remain an attractive investment for long-term investors. Shareholders who invested the equivalent of 1,000 euros when Henkel preferred shares were issued in 1985, and re-invested the dividends received (before tax deduction) in the stock, 20 Key data on Henkel shares 2010 to 2014 2010 2011 2012 2013 2014 Ordinary share 2.57 2.67 3.40 3.65 3.74 Preferred share 2.59 2.69 3.42 3.67 3.76 Ordinary share 38.62 37.40 51.93 75.64 80.44 Preferred share 46.54 44.59 62.20 84.31 89.42 Ordinary share 40.30 41.10 52.78 75.81 80.44 Preferred share 48.40 49.81 64.61 84.48 90.45 Ordinary share 30.31 30.78 37.25 50.28 67.00 Preferred share 35.21 36.90 44.31 59.82 72.64 Ordinary share 0.70 0.78 0.93 1.20 1.29 2 Preferred share 0.72 0.80 0.95 1.22 1.31 2 in euros Earnings per share Share price at year-end 1 High for the year 1 Low for the year 1 Dividends Market capitalization 1 in bn euros 18.3 17.6 24.6 34.7 36.8 Ordinary shares in bn euros 10.0 9.7 13.5 19.7 20.9 Preferred shares in bn euros 8.3 7.9 11.1 15.0 15.9 1 Closing share prices, Xetra trading system. 2 Proposal to shareholders for the Annual General Meeting on April 13, 2015. 51 Group management report 29 Corporate governance 50 Shares and bonds 55 Fundamental principles of the Group 63 Economic report 100 Risks and opportunities report 108 Forecast 109 Subsequent events Henkel share performance versus market January through December 2014 21 in euros 95 Dec. 30, 2014: 89.42 euros 90 85 80 Dec. 30, 2013: 84.31 euros 75 70 January February March April May June July August September October November December Henkel preferred share Henkel ordinary share (indexed) DJ Euro Stoxx Consumer Goods (indexed) DAX (indexed) Henkel share performance versus market 2005 through 2014 22 in euros 90 Dec. 30, 2014: 89.42 euros 75 60 45 30 Dec. 30, 2004: 21.33 euros 15 2005 2006 2007 Henkel preferred share Henkel ordinary share (indexed) DJ Euro Stoxx Consumer Goods (indexed) DAX (indexed) 2008 2009 2010 2011 2012 2013 2014 52 Group management report Henkel Annual Report 2014 had a portfolio value of 29,271 euros at the end of 2014. This represents an increase in value of 2,827 percent or an average yield of 12.2 percent per year. Over the same period, the DAX provided an annual yield of 7.6 percent. Over the last five and ten years, the Henkel preferred share has shown an average yield of 21.4 and 17.4 percent per year, respectively, offering a significantly higher return than the average DAX returns of 10.5 percent and 8.7 percent per year for the same periods. Henkel represented in all major indices Henkel shares are traded on the Frankfurt Stock Exchange, predominantly on the Xetra electronic trading platform. Henkel is also listed on all regional stock exchanges in Germany. In the USA, investors are able to invest inHenkel preferred and ordinary shares by way of stock ownership certificates obtained through the Sponsored Level I ADR (American Depositary Receipt) program. The number of ADRs outstanding for ordinary and preferred shares at the end of the year was about 2.5 million (2013: 3.7 million). The international importance of Henkel preferred shares derives not least from their inclusion in many leading indices that serve as important indicators for capital markets, and benchmarks for fund managers. Particularly noteworthy in this respect are the MSCI World, the Dow Jones Euro Stoxx, and the FTSE World Europe indices. Henkel’s inclusion in the Dow Jones Titans 30 Personal & Household Goods Index makes it one of the 30 most important corporations in the personal and household goods sector worldwide. As a DAX stock, Henkel is one of the 30 most important exchange-listed companies in Germany. 23 Share data Preferred shares Security code no. ISIN code Stock exch. symbol Number of shares Ordinary shares 604843 604840 DE0006048432 DE0006048408 HEN3.ETR HEN.ETR 178,162,875 259,795,875 24 ADR data Preferred shares CUSIP ISIN code ADR symbol Ordinary shares 42550U208 42550U109 US42550U2087 US42550U1097 HENOY HENKY Once again our advances and achievements in sus tainable management earned recognition from external experts in 2014. Henkel’s standing was confirmed in a variety of national and international sustainabil ity ratings and indices. As one of the industry lead ers in the household products sector, Henkel was again listed in the Dow Jones Sustainability Indices (DJSI World and DJSI Europe). Henkel has been represented in the ethics index FTSE4Good since 2001, and in the Stoxx Global ESG Leaders index family since its launch by Deutsche Börse in 2011. Our membership in the Ethibel Pioneer Investment Register was confirmed and we were also included in the sustainability indices Euronext Vigeo World 120, Europe 120, and Eurozone 120. As one of only 50 companies worldwide, Henkel was also confirmed once again in 2014 as a member of the Global Challenges Index. At year-end 2014, the market capitalization of the preferred shares included in the DAX index was 15.9 billion euros, putting Henkel in 18th place among DAX companies (2013: 18th). In terms of trading volume, Henkel ranked 21st (2013: 26th). Our DAX weighting declined to 1.65 percent (2013: 1.83 percent). 53 Group management report 29 Corporate governance 50 Shares and bonds 55 Fundamental principles of the Group 63 Economic report 100 Risks and opportunities report 108 Forecast 109 Subsequent events International shareholder structure Our preferred shares are the significantly more liquid class of Henkel stock. Apart from the treasury shares, they are entirely in free float. A large majority are owned by institutional investors whose portfolios are usually broadly distributed internationally. According to notices received by the company, members of the Henkel family share-pooling agreement owned a majority of the ordinary shares amounting to 60.84 percent as of November 3, 2014. We have received no other notices indicating that a shareholder holds more than 3 percent of the voting rights (notifiable ownership). Treasury stock as of December 31, 2014 amounted to 3.7 million shares. Shareholder structure: institutional investors holding Henkel shares 25 Investing in Henkel shares through participation in our share program has proven to be very beneficial for our employees in the past. Employees who invested 100 euros each month in Henkel shares since the program was first launched, and waived interim payouts, held portfolios valued at 68,462 euros at the end of 2014. This represents an increase in value of around 339 percent or an average yield of around 12 percent per year. Henkel bonds 60.84 % Henkel is represented in the international bond markets by one bond with a total nominal volume of 1.3 billion euros. of voting rights are held by members of the Henkel family share-pooling agreement. Further detailed information on this bond, current bond price movements and the risk premium (credit margin) can be found on our website: www.henkel.com/creditor-relations 26 Bond data France Germany Rest of world 6 % USA 31 % 11 % 12 % Hybrid bond Due date 11/25/2104 1 Volume 1.3 bn euros Nominal coupon 5.375% Couponpayment date Nov. 25 Listing Rest of Europe 19% UK 21 % Luxembourg Securitycode no. ISIN code A0JBUR XS0234434222 1 First call option for Henkel onNovember 25, 2015. At December 31, 2014 Source: Thomson Reuters. Employee share program Since 2001, Henkel has offered an employee share program (ESP). For each euro invested in 2014 by an employee (limited to 4 percent of salary up to a maximum of 4,992 euros per year), Henkel added an additional 33 eurocents. Around 11,500 employees in 54 countries purchased Henkel preferred shares under this program in 2014. At year-end, some 14,500 employees held a total of close to 3 million shares, representing approximately 1.6 percent of total preferred shares outstanding. The lock-up period for newly acquired ESP shares is three years. 54 Group management report Henkel Annual Report 2014 Pro-active capital market communication Henkel is covered by numerous financial analysts at an international level. Around 30 equity and debt analysts regularly publish reports and commentaries on the current performance of the company. Henkel places great importance on dialog with investors and analysts. At 32 capital market conferences and roadshows held in Europe, North America and Asia, institutional investors and financial analysts had an opportunity to engage with the company and, in many instances, directly with the top management. We also conducted regular telephone conferences and numerous one-on-one meetings. One highlight was our Investor and Analyst Day for the Beauty Care business unit on June 4, 2014 in Düsseldorf. At this event, the management team presented its strategy and the latest trends and developments in the cosmetic and personal care markets. Retail investors can obtain all relevant information on request or via the Investor Relations website at www.henkel.com/ir. This also serves as the portal for the live broadcast of telephone conferences and parts of the Annual General Meeting (AGM). The AGM offers all shareholders the opportunity to directly obtain extensive information about the company. 27 Analyst recommendations Sell 7 % Hold 45 % At December 31, 2014 Basis: 31 equity analysts. Buy 48 % The quality of our capital market communication was again evaluated in 2014 by various independent rankings. Once again, our Investor Relations team took leading positions compared to European corporations in the Home & Personal Care sector and other DAX companies – including second place in the Household Products & Personal Care sector in the Thomson Extel Pan-European Awards. In the Institutional Investor ranking, Henkel was chosen by financial analysts as having the best Investor Relations team in the European Household & Personal Care Products sector. Based on an assessment of over 30,000 articles from German and selected international media by the media analysis company UNICEPTA, Henkel ranked first among DAX companies in terms of media image in 2014. The quality of our communication and our performance with respect to non-financial indicators (environmental, social and governance themes) was reflected in continuous positive assessments by various rating agencies and further confirmed by our inclusion in major sustainability indices as described above. A financial calendar with all important dates is provided on the inside back coverof this Annual Report. 55 Group management report 29 Corporate governance 50 Shares and bonds 55 Fundamental principles of the Group 63 Economic report 100 Risks and opportunities report 108 Forecast 109 Subsequent events Fundamental principles of the Group Henkel is organized into three businessunits: • Laundry & Home Care • Beauty Care • Adhesive Technologies Operational activities Overview enkel was founded in 1876. Therefore, the year H under review marks the 138th in our corporate history. Today, Henkel employs around 49,750 people worldwide, and we occupy globally leading market positions in our consumer and industrial businesses. Organization and business units enkel AG & Co. KGaA is operationally active as well H as being the parent company of the Henkel Group. It is responsible for defining and pursuing Henkel’s corporate objectives and also for the management, control and monitoring of Group-wide activities, including risk management and the a llocation of resources. Henkel AG & Co. KGaA performs its tasks within the legal scope afforded to it as part of the Henkel Group, with the affiliated companies otherwise operating as legally independent entities. Operational management and control is the responsibility of the Management Board of Henkel Management AG in its function as sole Personally Liable Partner. The Management Board is supported in this by the corporate functions. Our product range in the Laundry & Home Care business unit comprises h eavy-duty detergents, specialty detergents and cleaning products. The portfolio of the Beauty Care business unit encompasses hair cosmetics, products for body, skin and oral care, and products for the hair salon business. The Adhesive Technologies business unit provides customer-specific solutions worldwide with adhesives, sealants and functional coatings in two business areas: Industry, and Consumers, Craftsmen and Building. Laundry & Home Care, Beauty Care, and Adhesive Technologies are managed on the basis of globally responsible strategic business units. These are supported by the corporate functions of Henkel AG & Co. KGaA in order to ensure optimum utilization of corporate network synergies. One key driver in this regard is our further expansion of shared services. Implementation of the strategies at a c ountry and regional level is the responsibility of the national affiliated companies whose operations are supported and coordinated by regional centers. The executive bodies of these national affiliates manage their businesses in line with the relevant statutory regulations, supplemented by their own articles of association, internal procedural rules and the principles incorporated in our globally applicable management standards, codes and guidelines. 28 Henkel around the world: regional centers Düsseldorf, Germany Global Headquarters Vienna, Austria Regional Center Rocky Hill, Connecticut, USA Regional Center Scottsdale, Arizona, USA Regional Center Mexico City, Mexico Regional Center São Paulo, Brazil Regional Center Dubai, United Arab Emirates Regional Center Shanghai, China Regional Center 1876 Year of foundation. 56 Group management report Strategy and financial targets 2016 In November 2012, we presented our Strategy 2016 based on thorough analysis of the long-term megatrends that are relevant for Henkel, and of Henkel’s individual business units. As a result, we see considerable potential, both for further organic growth and for enhanced profitability in all three business units. Three megatrends played a key role in the definition of our financial targets: 1. We expect progressive consolidation among our competitors, customers and suppliers. Size will become an increasingly important factor in our ability to compete over the long term. As such, increasing our sales is essential to allow us to continue to operate successfully in our markets in the future. 2. The shift of economic growth to the emerging markets of Eastern Europe, Africa/Middle East, Latin America and Asia (excluding Japan) will continue.This will require Henkel to steadily expand its position in these important markets and further increase sales in emerging markets. 3. T he speed and volatility of our markets will remain high and may even increase further. This requires processes and structures that are more flexible and more efficient, to enable us to respond to changes fasterthan our competitors. We therefore want to continuously improve our operational excellence and deliver outstanding financial performance. This is why • absolute sales of the corporation as a whole, • sales in emerging markets, and • growth in earnings per preferred share (EPS) form the cornerstones of our financial targets through to 2016. Financial targets 2016 By the end of 2016, we aim to generate net sales of 20 billion euros in order to further strengthen our position in the competitive global market environment. The setting of our target reflects the growing importance of emerging markets. We aim to continue achieving above-average growth in these markets and to generate net sales of 10 billion euros there by the end of 2016. Henkel Annual Report 2014 We intend to continue our outstanding financial performance through a balanced combination of growth and increasing profitability. Consequently, we aim to increase adjusted earnings per preferred share by an average of 10 percent per year (CAGR: compound annual growth rate) between 2013 and 2016. The definition of our financial targets up to the end of 2016 assumes not only that we will constantly adapt our structures to market conditions, but also that we will strive to continuously optimize our portfolio. This will encompass both smaller and mid-sized acquisitions as well as divestments or the discontinuation of non-strategic activities (representing total sales of around 500 million euros in the period between 2013 and 2016). Potential major acquisitions or divestments are not accounted for in the financial targets. We have defined clear selection criteria for possible acquisitions to make sure they fit our strategy, both in terms of financial attractiveness and implement ability. The focus in Laundry & Home Care and Beauty Care will center on strengthening our categories in the respective regions, while the focus in Adhesive Technologies will primarily be on advancing technology leadership. Progress in fiscal 2014: • Sales growth in fiscal 2014 was again adversely influenced by foreign exchange effects. As a result, despite another solid increase in organic sales of 3.4 percent, sales were only slightly higher than the prior-year level at 16,428 million euros. Financial targets 2016 29 20 bn € sales 10 bn € sales in emerging markets 10 % annual growth in earnings per share 1 1 Average annual growth in adjusted earnings per preferred share (compound annual growth rate / CAGR). Including continuous portfolio optimization. 57 Group management report 29 Corporate governance 50 Shares and bonds 55 Fundamental principles of the Group 63 Economic report 100 Risks and opportunities report 108 Forecast 109 Subsequent events • S ales in our emerging markets matched the very strong performance of previous years with organic growth coming in at 7.8 percent. Nominal sales amounted to 7,249 million euros. The share of Group sales from emerging markets remained constant at 44 percent, largely due to negative foreign exchange effects. • In this difficult environment, we increased adjusted earnings per preferred share by 7.6 percent in 2014 compared to the level of 2013. • We also invested 1,758 million euros in acquisitions, allowing us to effectively strengthen our position in all three business units. Outperform Globalize Leverage potential in categories Focus on regions with high potential A global leader in brands and technologies invested in acquisitions. Simplify Strategic priorities in summary Outperform: leverage potential in categories In addition to this active portfolio management, we intend to leverage the potential of our categories by concentrating on three key areas: strengthening our top brands, innovations, and focusing on customers and consumers. By 2016, we intend to have increased the share of sales attributable to our top 10 brands to Inspire Drive operational excellence In order to outperform our competitorsin our individual business units, we will leverage the growth potential in our product categories even more. In our core categories, we will make investments that further strengthen and expand our leading positions. In our growth categories, we will also make targeted investments, including the development of new segments. In our value categories, we will tap existing earnings potential by making suitable investments while at the same time actively adjusting our portfolio. Between 2013 and 2016, we expect to discontinue or divest businesses and operations representing total sales of 500 million euros. €1.8 bn Strengthen our global team around 60 percent. A substantial portion of this will come from our rigorous customer orientation and particular focus on innovations. We are also planning to open and/or significantly expand seven research and development sites in emerging markets around the world in order to underpin our claim to innovation leadership while benefiting from the proximity to our customers and consumers in these strategically important markets. Progress in fiscal 2014: • In 2014 we were able to further raise the share of sales attributable to our top 10 brands by 2 percentage points to 59 percent. Consistent implementation of our umbrella brand strategy again contributed to this.As a result, we came a significant step closer to our goal of around 60 percent. 30 Acquisitions completed in fiscal 2014 Key countries Contract signed on Completion on Annual sales Laundry and home care brands “E” in Eastern Europe Poland Feb. 20, 2013 Feb. 14, 2014 ~ 60 53 69 – 70, 89 – 90, 120 – 121 Hair styling brand in Latin America Pert Mexico May 30, 2014 May 30, 2014 ~ 25 24 69 – 70, 93 – 94, 120 – 121 Three hair professional companies in North America Sexy Hair, Kenra, USA Alterna May 31, 2014 June 30, 2014 ~ 140 274 69 – 70, 93 – 94, 120 – 121 Spotless Group – laundry, home care, and insect control products in Western Europe Eau Ecarlate, Dylon, Catch France, Italy, Spain June 5, 2014 Oct. 14, 2014 ~ 280 940 1 69 – 70, 89 – 90, 120 – 121 USA Sep. 17, 2014 Oct. 31, 2014 ~ 130 467 69 – 70, 97 – 98, 120 – 121 in million euros Key brands The Bergquist Company – Sil-Pad, thermal management solutions Gap Pad, for electronic applications Thermal Clad 1 Purchase price including debt. Purchase price For further information, see pages 59 % of sales generated by top 10 brands. 58 Group management report • N umerous innovations strengthened our business performance: We expanded and opened research and development centers in India, Russia, South Africa, South Korea and the United Arab Emirates in 2013 to increase our innovative strength in the emerging markets. In 2014, these centers acted as hubs for innovative solutions targeted specifically at the needs of customers in these regions. For examples, please refer to the “Research and development” section on pages 81 to 85. organic sales growth in emerging markets. production sites through to the end of 2016. In addition, we aim to keep our net working capital relative to sales at the low level already achieved. Globalize: focus on regions with high potential Plans for the future also include further optimization of our purchasing processes, and expansion of our shared services. Between 2013 and 2016, we want to reduce the number of global suppliers by around 40 percent, and increase the number of employees working in our shared service centers to more than 3,000. We also plan to establish two more shared service centers during this period. We will continue the successful globalization of our company in previous years and concentrate on regions and countries offering particularly high growth potential. In addition to further expanding our strong p ositions in mature markets, we specifically want to focus on further building our existing positions in emerging markets and on accelerating growth. We also plan to enter n ew markets on a selective basis. Overall, we intend to raise our investments by more than 40 percent to around 2 billion euros between 2013 and 2016. Investments in IT infrastructure will be one key lever for optimizing our processes. These will increase between 2013 and 2016. We intend to reduce the complexity of our IT systems and significantly decrease the number of processes. By the end of 2016, we plan to have increased sales in emerging markets to 10 billion euros. We expect twelve countries from the emerging markets to rank among our top 20 countries with the highest sales by 2016. At the same time, we want to take full advantage of our strong positions and potential in mature markets to increase our earning power compared to 2012 and to achieve more top positions. 7.8 % Henkel Annual Report 2014 Progress in fiscal 2014: • The emerging markets again made an above-average contribution to growth with very strong organic sales expansion. Growth was particularly stimulated by the Africa/Middle East region with a double-digit increase, and Asia (excluding Japan), which recorded a very strong increase. • Acquisitions enabled us to expand our portfolio in both the mature and emerging markets in 2014 and thereby to considerably strengthen our position in attractive segments, particularly in the mature markets. Progress in fiscal 2014: • In 2014, the number of employees in shared service centers grew to more than 2,600. • We opened two new shared service centers – in Cairo and Shanghai – and are therefore now ideally positioned to service the North Africa/Middle East region and the greater China region. • Although higher than the prior-year figure, net working capital as a percentage of sales remained low at 4.2 percent, despite adverse influences from foreign exchange rates and acquisitions. • We have started to consolidate the production and logistics activities of all business units, with the involvement of our purchasing operations, into one global supply chain organization. This organization commenced operations in early November 2014 and will be steadily expanded in the years to come. Inspire: strengthen our global team Further strengthening our global team will be a key element in the successful development of Henkel. Simplify: drive operational excellence We will continuously improve our operational excellence to enable us to respond to the increasing speed and persisting volatility in our markets. To this end, we intend to further s tandardize our processes, invest in information technology (IT) to make these processes faster and more efficient, and improve our cost efficiency and reduce the ratio of administrative costs to total sales. We also plan to further optimize our global presence by continuing to consolidate our We will adopt an even more active approach to competing internationally for talented professionals to ensure Henkel’s continued ability to recruit the best possible candidates around the world and promote their development within the corporation. One key driver of this will be the rigorous alignment of shortterm and long-term remuneration components to individual performance and overall company performance. The diversity of our teams is also vital to our economic success. 59 Group management report 29 Corporate governance 50 Shares and bonds 55 Fundamental principles of the Group 63 Economic report 100 Risks and opportunities report 108 Forecast 109 Subsequent events Progress in fiscal 2014: • The clear Leadership Principles established in 2013 strengthen the roles and responsibilities of our managers. Additionally, we established a new training program in collaboration with Harvard Business School in 2014 to strengthen our common understanding of leadership based on these principles. • Our global “Inclusion” campaign in 2014 highlighted the importance of diversity and an appreciative company culture. • We have increased the share of women in management positions to around 33 percent. 1 Sustainability strategy 2030 Our corporate values as the foundation Commitment to leadership in sustainability is one of our core corporate values. Maintaining a balance between economic success, protection of the environment, and social responsibility has been fundamental to our corporate culture for decades. We aim to pioneer new solutions for sustainable development while continuing to shape our business responsibly and increase our economic success. This ambition encompasses all of our company’s activities – along the entire value chain. Achieving more with less Our goal for 2030: triple our efficiency Our long-term goal reflects the global challenges of sustainable development. We will have to significantly improve our efficiency in order to reconcile people’s desire to live well with the resource limits of the planet and to allow us to build on our economic success. Therefore, compared to 2010 as the base year, we want to triple the value we create through our business operations in relation to the environmental footprint of our products and services by 2030. This means we want to be three times more efficient. We call this goal “Factor 3.” One way to achieve it is to triple the value we create while leaving the footprint at the same level. Or we can reduce the environmental footprint to one third of today’s level, and achieve our “Factor 3” improvement in efficiency by delivering the same value. To reach this goal by 2030, we will have to improve our efficiency by an average of 5 to 6 percent each year. We have therefore set concrete interim targets for our focal areas for the five years between 2011 and 2015 (see chart on the next page). For the period up to 2015, we intend to improve the relationship between the value we create and the environmental f ootprint of our business activities by 30 percent overall. We are facing immense challenges: The global human footprint is already greater today than the planet’s resources can bear. By the year 2050, the world’s population is expected to grow to 9 billion. The simultaneous increase in global economic output will lead to rising consumption and resource needs. The pressure on available resources will thus intensify even further in the coming decades. This is why the idea at the heart of our sustainability strategy is to achieve more with less. We want to create more value – for our customers and consumers, for the communities we operate in, and for our company – while at the same time reducing our environmental footprint. To accomplish this, we need innovations, products and technologies that can enhance quality of life while using less input materials. Building on our decades of experience in sustainable development, we aim to work together with our customers and consumers to develop and implement viable solutions for the future. By doing so, we will be contributing both to sustainable development and to our company’s economic success. 1 Excluding acquisitions in 2014. Our ambition is to become three times more efficient by 2030. We call this “Factor 3.” This means tripling the value we create through our business operations in relation to the environmental footprint of our products and services. Factor 3 60 Group management report Henkel Annual Report 2014 Our contributions in six focal areas To successfully implement our strategy, we are concentrating on six focal areas that reflect the key challenges of sustainable d evelopment as they relate to our operations. In each of these focalareas, we drive progress along the entire value chain through our prod ucts and processes in two dimensions: “more value” and “reduced footprint.” Three focal areas therefore represent the value we want to deliver to our customers, shareholders and our company, for example in the form of enhanced occupational health and safety, and contributions to social progress. The three other focal areas describe the ways in which we want to reduce our environmental footprint, for instance through reduced water and energy use and less waste. Our products deliver more value for our customers and consumers. We achieve this through innovation and information, and through products that offer better performance with a smaller environmental footprint, thus reducing resource use and negative environmental impacts. Our partners are key to driving sustainability along our value chains and in all areas of business and daily life. We support them with our products and expertise. And we work together with selected vendors so that they can supply us with raw materials offering an improved environmental footprint. At the other end of the chain, we help our customers and consumers reduce their own environmental footprint. Our approach for sustainable business processes In order to successfully establish our strategy and reach our goals, they must be ever-present in the minds and day-to-day actions of our employees and mirrored in our business processes. We have defined three strategic principles to achieve this: products, partners, and people. Our people make the difference – through their dedication, skills and knowledge. They make their own contributions to sustainable development, both in their daily business lives and as members of society. They interface with our customers and make innovation possible, develop successful strategies and give our company its unique identity. Our focal areas and targets for the five-year period from 2011 to 2015 31 + 10 % More value more net sales per production unit More value for our customers and more value for Henkel + 20 % More social progress and better quality of life Social Progress Energy and Climate Less energy used and less greenhouse gases Safer workplaces and better health & hygiene Performance Deliver more value at a reduced footprint Safety and Health – 15 % Water and Wastewater Less water used and less water pollution Materials and Waste less water per production unit – 15 % Less resources used and less waste generated Reduced footprint safer per million hours worked less waste per production unit – 15 % less energy per production unit 61 Group management report 29 Corporate governance 50 Shares and bonds 55 Fundamental principles of the Group 63 Economic report 100 Risks and opportunities report 108 Forecast 109 Subsequent events Organization Progress in fiscal 2014 The Management Board bears overall responsibility for our sustainability strategy and objectives, and their implementation in the corporation. Henkel’s Sustainability Council steers our global sustainability activities in collaboration with the individual business units and functions, and our regional and national affiliated companies. • W e have made considerable progress toward our targets for 2015 and have already achieved them ahead of schedule in four areas. Compared to 2010 as the base year, we have improved occupational safety by 25 percent, our energy efficiency by 20 percent, our water usage by 19 percent, and our waste volume by 18 percent, or 22 percent when excluding construction and demolition waste. • In order to identify and assess improvement potentials in the sustainability profiles of our products right at the development stage, we have continued to integrate assessment tools such as our “Henkel Sustainability#Master®” into our innovation process. • Since mid-2012, we have trained some 3,800 employees around the world as Sustainability Ambassadors. This program has helped to educate around 36,000 schoolchildren in 37 countries. • Together with the other founding companies, we have further expanded the “Together for Sustainability” initiative and gained six new members. A total of 1,000 self-assessments and more than 140 audits were performed to monitor compliance among our suppliers with our requirements in the areas of safety, health, environment, quality, human rights, labor standards and the fight against corruption. • Henkel’s leading role in sustainability has been confirmed once again by many different national and international sustainability ratings and indices. Our understanding of responsible behavior has been specified and communicated to our employees worldwide in our Code of Conduct and Code of Corporate Sustainability. From these codes are derived our more detailed internal standards governing safety, health and environmental protection, the Henkel Social Standards and our Group purchasing standards. Compliance with these rules is regularly monitored throughout the Group by internal audits performed at our production and administrative sites, and increasingly also at our toll and contract manufacturers and logistics centers. By joining the United Nations Global Compact in July 2003, we also publicly underscored our commitment to respect human rights, fundamental labor standards and environmental protection, and to work against all forms of corruption. Stakeholder dialog Viable solutions for promoting sustainability can only be developed in dialog with all relevant social groups. These include our employees, shareholders, customers, suppliers, civil authorities, politicians, associations, governmental and non-governmental organizations, academia, and the public at large. We view dialog with our stakeholders as an opportunity to identify the requirements of our different markets at an early stage and to define the directions which our activities should take. Our dialog with various stakeholder groups enables us to access new ideas for our company, which flow continuously into our strategy development and reporting. We use a wide range of communication instruments in order to meet the specific information requirements of our stakeholders, ranging from our own publications and technical articles to events and direct dialog. More details and background reading on the subject of sustainability can be found in our Sustainability Report. In this we document the high priority sustainability has in our company, while at the same time satisfying the reporting requirements laid down in the United Nations Global Compact. Further information, reports, background details and the latest news on sustainable development at Henkel can be found on the following website: www.henkel.com/sustainability Sustainability Report 2014 Detailed information and background read ing on the subject of sustainability can be found in our Sustainability Report – available in both print and online versions. www.henkel.com/ sustainabilityreport 28 % more efficient than in 2010: We are creating more value while at the same time reducing our environmental footprint. 62 Group management report Management system and performance indicators Henkel manages the company based on the strategy and the financial targets for 2016. As defined and described in the section “Strategy and financial targets 2016,” our financial targets are as follows: For 2016 we aim to generate net sales of 20 billion euros. We recognize the increasing importance of the emerging markets of Eastern Europe, Africa/Middle East, Latin America and Asia (excluding Japan) by targeting above-average growth in these regions. Here we intend to generate net sales of 10 billion euros in 2016. Furthermore, we aim to increase adjusted 1 earnings per preferred share by an average of 10 percent per year through to 2016. The financial targets for 2016 are our most important performance indicators. For efficient management of the Group, we have transferred the Henkel Group strategy into strategic plans for the three business units, Laundry & Home Care, Beauty Care, and Adhesive Technologies, as well as for their respective business areas. The financial targets are represented together with the businesses in both the year and the medium-term plans. A regular comparison of these plans with current developments and reporting of expected figures enables focused management of the company based on the described performance indicators. Group WACC before tax in fiscal 2014. We apply different WACC rates depending on the business unit involved. These are based on business unitspecific beta factors determined from a peer group benchmark. For the reporting year, we applied a WACC before tax of 8.5 percent (6.0 percent after tax) for both Laundry & Home Care and Beauty Care, and of 11.0 percent before tax (7.75 percent after tax) for Adhesive Technologies. In 2015 we will again use a weighted average cost of capital (WACC) of 8.5 percent before tax (6.0 percent after tax) for the Laundry & Home Care and Beauty Care business units. For the Adhesive Technologies business unit, we will be applying a WACC of 10.5 percent before tax (7.5 percent after tax) starting in 2015. 2014 2.75 % 2.00 % Market risk premium 5.5 % 5.5 % Beta factor 0.71 0.86 Cost of equity after tax 1 6.7 % 6.7 % Cost of debt capital before tax Tax shield (30 %) Cost of debt capital after tax 1 3.6 % 2.7 % – 1.1 % – 0.8 % 2.5 % 1.9 % Share of equity 2 85 % 85 % Share of debt capital 2 15 % 15 % WACC after tax 1 Tax rate WACC before tax 1 Moreover, we report further key performance indicators, such as net working capital as a percentage of sales, and the return on capital employed (ROCE). WACC before tax by business unit 1 Adjusted for one-time charges/gains and restructuring charges. from 2015 Risk-free interest rate 1 Rounded. 2 At market values. The cost of capital is calculated as a weighted average of the cost of equity and debt capital (WACC). In fiscal 2014, we applied a WACC of 8.5 percent before tax and 6.0 percent after tax. We regularly review our cost of capital in order to reflect changing market conditions. From 2015 onward, we will be applying an unchanged WACC of 8.5 percent before tax and 6.0 percent after tax. 32 Weighted average cost of capital (WACC) Our management system is supplemented by additional key financials relevant to the capital market – primarily, adjusted return on sales (EBIT). Cost of capital 8.5 % Henkel Annual Report 2014 6.0 % 30 % 8.5 % 6.0 % 30 % 8.5 % 33 2014 from 2015 Laundry & Home Care 8.5 % 8.5 % Beauty Care 8.5 % 8.5 % 11.0 % 10.5 % Adhesive Technologies 63 Group management report 29 Corporate governance 50 Shares and bonds 55 Fundamental principles of the Group 63 Economic report 100 Risks and opportunities report 108 Forecast 109 Subsequent events Economic report acroeconomic and industry-related M conditions Overview: moderate growth while general economic conditions remain difficult In 2014, the global economy 1 showed only moderate growth versus the previous year. Gross domestic product expanded by around 2 percent around the world. The mature markets grew by only around 1.5 percent, while the emerging markets achieved an increase of approximately 3.5 percent. This trend reflects the ongoing heterogeneous development encountered in the European economy and the continuing slow-down of growth in the emerging markets. Continuing political turmoil in the region of Africa/Middle East and the conflict between Russia and Ukraine also had an adverse impact. Industry and consumption: industry shows solid growth With an increase of approximately 4 percent, industrial production recorded stronger expansion than private consumption, which rose by approximately 2 percent. While the export-dependent industries in particular posted stronger increases, growth in consumer-related sectors was markedly subdued. Regions: mature markets moderate, emerging markets robust Over the year as a whole, the North American economy grew by around 2 percent. Western Europe showed only moderate growth of around 1 percent, while the economy in Japan stagnated. The emerging markets of Asia (excluding Japan) and Africa/Middle East registered comparatively robust economic growth. Asia (excluding Japan) grew by 5.5 percent, driven by China. At around 3 percent, growth in the Africa/Middle East region was higher than in the previous year. Eastern Europe was impacted by the conflict between Russia and Ukraine, registering only moderate growth of approximately 1 percent. Latin America grew by only 0.5 percent and thus below the rate of the previous year. Direct materials: prices slightly above prior-year level Overall, prices for externally sourced materials and services (direct materials) were slightly higher than the previous year. On average, raw material prices in 2014 were also slightly above the level of the prior 1 Source for data on the global economy, industry and consumption: Feri EuroRating Services, January 2015. period. Input materials, which are used in the production of direct materials, were again characterized by fluctuating prices in 2014. The price movements varied by region and type of input material. Prices for packaging and purchased goods showed a similar trend and also rose slightly. Currencies: devaluation against the euro Taking the average for the year, important currencies for Henkel in the emerging markets experienced substantial depreciation versus the euro compared to the previous year. The development of the US dollar varied in the course of the year: In the first half of the year, the euro occasionally reached 1.39 US dollars. During the second half of the year, the euro drifted steadily lower to around 1.29 US dollars before ending the year at 1.21 US dollars. Changes in the exchange rates of the currencies of relevance to Henkel are indicated in the following table: Average rates of exchange versus the euro 2013 34 2014 Chinese yuan 8.16 8.19 Mexican peso 16.97 17.66 Russian ruble 42.34 50.87 Turkish lira 2.53 2.91 US dollar 1.33 1.33 Source: ECB daily foreign exchange reference rates. Inflation: moderate rise in global price levels Global inflation was around 3 percent. Consumer prices increased by approximately 5 percent in the emerging markets while recording only a slight rise in the mature markets. The overall trend differed by region and country. Inflation declined in Western Europe – including Germany – while increasing slightly in North America and significantly in Japan. In Eastern Europe and Asia, prices increased slightly while rising significantly in Latin America and Africa/Middle East. Unemployment: unchanged year on year around the world Global unemployment was on a par with the prior year at approximately 7 percent. The unemployment rate in North America improved versus the previous year to around 6 percent, while unemployment in Western Europe remained flat at approximately 10 percent. 64 Group management report +3.4 % organic sales growth. Henkel Annual Report 2014 Year on year, the unemployment rate in Germany was unchanged at approximately 6.5 percent. It improved slightly in Eastern Europe and Latin America, and was unchanged versus the previous year in Asia (excluding Japan). Review of overall business performance Development by sector: minor increase in global consumption Henkel’s business development was impacted by the prevailing global macroeconomic conditions as described above. The economic environment was particularly impacted by the conflict between Russia and Ukraine, political and social unrest in Africa/ Middle East, and slowing growth in the emerging markets. In addition, currencies important to Henkel weakened further against the euro. Growth in private consumer spending remained subdued at approximately 2 percent. Consumer spending in mature markets increased by approximately 1.5 percent year on year. Consumers in North America increased their spending by approximately 2.5 percent. In Western Europe, consumer spending grew by approximately 1 percent compared to the previous year. The emerging markets demonstrated a higher propensity to spend, with consumption increasing by approximately 3 percent. Industry with solid growth Industrial production expanded at a rate of approximately 4 percent in 2014, which was again faster than the economy as a whole. Growth in 2014 was driven by export-dependent sectors such as electronics, metal processing, automotive, and transport. Developments in industrial production differed from one region to the next. Manufacturing expanded in North America by 3.5 percent, in Western Europe by 1.5 percent, and in the mature markets of Asia by approximately 2 percent. In the emerging markets, industrial production grew at a slightly slower pace versus the previous year, impacted in particular by Latin America and Asia (excluding Japan). A particularly important customer sector for Henkel, the transport industry, saw production expand by around 4 percent. Output in the electronics sector rose by 5 percent. Within the electronics sector, the market for basic products such as electrical systems and semiconductor units developed positively, resulting in solid growth. Accelerated growth in comparison to 2013 was seen in the metal industry, which expanded by approximately 4.5 percent. Growth was subdued in consumer-related sectors, such as the global packaging industry, which recorded only a moderate increase of approximately 2 percent. In 2014, production in the construction industry increased by around 3 percent. The economic environment in 2014 was challenging. Nevertheless, Henkel continued the success of the previous year with a robust performance. Henkel generated sales of 16,428 million euros in 2014, only slightly above the prior-year figure due to negative exchange rate effects. Organically we achieved a sales increase of 3.4 percent despite the challenging market environment. The solid increase in organic sales was particularly driven by the very strong performance of our businesses in the emerging markets. There, Henkel was able to increase its organic sales by 7.8 percent. The share of Group sales from emerging markets remained at the prior-year level of 44 percent (2013: 44 percent). In the mature markets, we were able to generate a slight increase in organic sales overall. Prices for direct materials (raw materials, packaging, and purchased goods and services) rose slightly in fiscal 2014. Adjusted 1 gross margin declined by 0.5 percentage points to 47.5 percent. We were able to partially offset the effects of slightly higher prices for direct materials and significantly higher promotional activity mainly through savings derived from cost-reduction measures, improvements in production and supply chain efficiency, and selective price increases. As a result of the continuous adjustment of our structures to our markets and customers and further reductions in our overhead achieved by expanding shared services and optimizing our production network, we were able to further improve our profitability compared to the prior year. In 2014, we achieved for the first time an adjusted return on sales of 15.8 percent (2013: 15.4 percent). All business units contributed to this success. Adjusted earnings per preferred share grew to 4.38 euros, a substantial increase of 7.6 percent over the 2013 figure of 4.07 euros. 1 Adjusted for one-time charges/gains and restructuring charges. 65 Group management report 29 Corporate governance 50 Shares and bonds 55 Fundamental principles of the Group 63 Economic report 100 Risks and opportunities report 108 Forecast 109 Subsequent events Despite the negative effects of foreign exchange and acquisitions, our net working capital as a percentage of sales once again reached a low level of 4.2 percent, although this was higher than in the previous year. We generated free cash flow of 1,333 million euros. Impacted by the acquisitions of 2014, the net financial position closed the year at –153 million euros (2013: 959 million euros). We achieved a solid increase in organic sales in each of our business units, further expanding our share in our relevant markets. The Laundry & Home Care business unit recorded organic sales growth of 4.6 percent. Sales in the Beauty Care business unit grew organically by 2.0 percent and Adhesive Technologies achieved organic sales growth of 3.7 percent. 37 Price and volume effects Results of operations Sales and profits Sales in fiscal 2014 were slightly higher than in the previous year, at 16,428 million euros. The depreciation of important currencies in the emerging markets in particular reduced sales by 4.0 percent. Adjusted for foreign exchange effects, sales grew by 4.4 percent. With growth of 3.4 percent, organic sales, i.e. adjusted for foreign exchange and acquisitions/divestments, showed a solid rate of increase. This was driven by both price and volume. Sales 35 in million euros 2010 15,092 2011 15,605 2012 16,510 2013 16,355 2014 16,428 0 5,000 Organic sales growth of which price of which volume Laundry & Home Care 4.6 – 0.5 5.1 Beauty Care 2.0 0.0 2.0 Adhesive Technologies 3.7 1.0 2.7 Henkel Group 3.4 0.4 3.0 in percent 10,000 15,000 Sales development 1 in percent Change versus previous year Foreign exchange In a market environment that continues to be highly competitive, we were able to increase our sales in the Western Europe region by 2.6 percent to 5,724 million euros. Organically sales grew by 1.7 percent. We were therefore able to compensate for the effects of the recessionary developments in Southern Europe. The share of sales from the region increased slightly to 35 percent. Sales in the Eastern Europe region decreased year on year to 2,854 million euros due to significant devaluation of the Russian ruble and other currencies in the region, and the impact of the conflict between Russia and Ukraine. Organically, however, we were able to increase sales by 4.5 percent, primarily driven by our businesses in Turkey and Russia. The share of sales from the region declined to 17 percent. 20,000 36 2014 0.4 – 4.0 Adjusted for foreign exchange 4.4 Acquisitions/divestments 1.0 Organic 3.4 of which price 0.4 of which volume 3.0 1 Calculated on the basis of units of 1,000 euros. We recorded organic sales growth in nearly all of our regions: Despite negative foreign exchange effects and the political and social unrest in some countries, our sales in the Africa/Middle East region increased nominally by 4.9 percent to 1,133 million euros. Organically we were able to grow sales by 16.9 percent. All of our business units made an important contribution to this performance. The share of sales from the region remained stable at 7 percent. 66 Group management report 44 % of our sales generated in emerging markets. Henkel Annual Report 2014 Our business in the North America region was negatively impacted primarily by fierce price and promotional competition in our consumer goods businesses. At 2,884 million euros, sales in the region were 1.5 percent below the figure of the previous year. Organically sales declined by 2.9 percent. The share of sales from the region remained unchanged at 18 percent. At 1,029 million euros, sales in the Latin America region were below the previous year due to negative currency effects. Organically, however, we increased sales by 4.4 percent, driven particularly by our performance in Mexico. The share of sales from the region remained unchanged at 6 percent. Sales in the Asia-Pacific region increased year on year by 6.0 percent to 2,676 million euros. Organically we were able to grow sales by 8.2 percent. This very strong performance was driven especially by doubledigit growth in China and very strong growth in India. The share of sales from the Asia-Pacific region rose versus the previous year from 15 to 16 percent. Due to negative foreign exchange effects, sales in the emerging markets of Eastern Europe, Africa/Middle East, Latin America and Asia (excluding Japan) increased only slightly year on year, to 7,249 million euros. We achieved a very strong increase in organic sales of 7.8 percent, driven by all three business units. Thus the emerging markets again made an above-average contribution to organic sales growth in 2014. The share of sales from the emerging markets remained constant at 44 percent. In order to continuously adapt our structures to our markets and customers, we spent 213 million euros on restructuring (previous year: 159 million euros). We further expanded our shared services and optimized our production footprint. The following explanations relate to the results adjusted for one-time charges/gains and restructuring charges, in order to provide a more transparent presentation of operational performance: 38 Adjusted operating profit (EBIT) in million euros 2013 2014 +/– EBIT (as reported) 2,285 2,244 – 1.8 % – 10 – 28 One-time gains One-time charges Restructuring charges Adjusted EBIT 82 159 159 213 2,516 2,588 2.9 % 39 Key financials by region 1 Western Europe Eastern Europe in million euros Africa/ Middle East North America Latin America AsiaPacific Total regions Corporate Henkel Group Sales 2 2014 5,724 2,854 1,133 2,884 1,029 2,676 16,300 128 16,428 Sales 2 2013 5,580 3,034 1,080 2,928 1,061 2,524 16,207 148 16,355 Change from previous year 2.6 % – 5.9 % 4.9 % – 1.5 % – 3.0 % 6.0 % 0.6 % – 0.4 % Adjusted for foreign exchange 2.6 % 5.8 % 16.6 % – 0.6 % 4.8 % 8.2 % 4.6 % – 4.4 % 4.5 % 16.9 % Organic 1.7 % 8.2 % 3.6 % – 3.4 % – 2.9 % 4.4 % Proportion of Group sales 2014 35 % 17 % 7 % 18 % 6 % 16 % 99 % 1 % 100 % Proportion of Group sales 2013 34 % 19 % 7 % 18 % 6 % 15 % 99 % 1 % 100 % Operating profit (EBIT) 2014 1,046 378 121 420 73 343 2,381 – 137 2,244 Operating profit (EBIT) 2013 1,021 459 34 497 74 340 2,426 – 141 2,285 Change from previous year 2.4 % – 17.7 % 250.2 % – 15.4 % – 1.5 % 0.8 % – 1.9 % – Adjusted for foreign exchange 2.3 % – 5.6 % 270.6 % – 15.0 % 12.3 % 3.0 % 1.5 % – 0.6 % Return on sales (EBIT) 2014 18.3 % 13.2 % 10.7 % 14.6 % 7.1 % 12.8 % 14.6 % – 13.7 % Return on sales (EBIT) 2013 18.3 % 15.1 % 3.2 % 17.0 % 7.0 % 13.5 % 15.0 % – 14.0 % 1 Calculated on the basis of units of 1,000 euros. 2 By location of company. – 1.8 % 67 Group management report 29 Corporate governance 50 Shares and bonds 55 Fundamental principles of the Group 63 Economic report 100 Risks and opportunities report 108 Forecast 109 Subsequent events We were able to increase adjusted operating profit (adjusted EBIT) to 2,588 million euros, a rise of 2.9 percent on the prior-year figure of 2,516 million euros. All three business units contributed to this positive development. We improved adjusted return on sales (adjusted EBIT margin) for the Group by 0.4 percentage points to 15.8 percent. In our consumer businesses, we were able to benefit from our successful innovations and continued measures to reduce costs and improve efficiency. The improvement in profitability in the Laundry & Home Care business unit was very strong, with an increase to 16.2 percent (previous year: 15.6 percent). Beauty Care posted a solid increase in adjusted return on sales to 15.3 percent (previous year: 15.0 percent). The Adhesive Technologies business unit also generated a solid improvement in margin with an increase from 16.9 to 17.2 percent. The adjusted return on sales in the segment of Adhesives for Consumers, Craftsmen and Building declined, mainly due to significant devaluation of important currencies against the euro. This development was more than offset by a very strong margin improvement in the segment of Industrial Adhesives, supported among other things by the ongoing further development of our portfolio as well as by cost reductions and efficiency improvements. Further explanations relating to our business performance can be found in the description of the business units starting on page 88. Comparison between actual business performance and guidance In our 2014 reports, we published guidance for fiscal 2014 indicating that we expected to achieve organic sales growth between 3 and 5 percent. We furthermore expected a slight increase in the share of sales from our emerging markets. We expected adjusted return on sales (EBIT) to increase versus the previous year to just under 16 percent and an increase in adjusted earnings per preferred share in the high single digits. Our organic growth of 3.4 percent is within the guidance corridor. At 44 percent, our share of sales from the emerging markets remained at the level of the previous year. Due to the negative effects of foreign exchange, the expected slight rise could not be achieved. At Group level, we posted a strong increase in adjusted return on sales from 15.4 to 15.8 percent, as well as a 7.6 percent improvement in adjusted earnings per preferred share, increasing the figure to 4.38 euros (2013: 4.07 euros). Hence, we delivered on our earnings guidance. Prices for direct materials (raw materials, packaging, and purchased goods and services) rose slightly compared to the previous year, but less than the moderate increase in our forecast due to lower than expected price levels of relevant input materials, such as butadiene and crude oil. Our restructuring expenses totaled 213 million euros, and were thus at the expected level of approximately 200 million euros. This reflects our ongoing efforts to adjust our structures promptly to changing market conditions. We invested 517 million euros in property, plant and equipment and intangible assets, which also corresponds to our forecast of approximately 500 million euros. 40 Guidance versus performance 2014 Guidance for 2014 1 Performance in 2014 Henkel Group: 3–5 percent Henkel Group: 3.4 percent Laundry & Home Care: 3–5 percent Beauty Care: approximately 2 percent Adhesive Technologies: 3–5 percent Laundry & Home Care: 4.6 percent Beauty Care: 2.0 percent Adhesive Technologies: 3.7 percent Percentage of sales from emerging markets Slight increase At prior-year level: 44 percent Adjusted return on sales (EBIT) Increase to just under 16 percent Increase to 15.8 percent Adjusted earnings per preferred share Increase in the high single digits Increase of 7.6 percent Prices for direct materials Moderate increase Slight increase Restructuring charges Approximately 200 million euros 213 million euros Investments in property, plant and equipment and intangible assets Approximately 500 million euros 517 million euros Organic sales growth 1 Updated November 11, 2014. 15.8 % adjusted return on sales (EBIT), up 0.4 percentage points. 68 Group management report Henkel Annual Report 2014 41 Reconciliation from sales to adjusted operating profit 1 2013 % 2014 % Change Sales 16,355 100.0 16,428 100.0 0.4 % Cost of sales – 8,497 – 52.0 – 8,630 – 52.5 1.6 % Gross profit 7,858 48.0 7,798 47.5 – 0.8 % in million euros Marketing, selling and distribution expenses – 4,199 – 25.7 – 4,103 – 25.0 – 2.3 % Research and development expenses – 414 – 2.6 – 410 – 2.5 – 1.0 % Administrative expenses – 749 – 4.5 – 733 – 4.5 – 2.1 % Other operating income/charges 20 0.2 36 0.3 – Adjusted operating profit (EBIT) 2,516 15.4 2,588 15.8 2.9 % 1 Calculated on the basis of units of 1,000 euros; figures commercially rounded. Expense items The following explanations relate to our operating expenses adjusted for one-time charges/gains and restructuring charges. The reconciliation statement and the allocation of the restructuring charges between the various expense items of the consolidated statement of income can be found on page 114. €1,662 m net income. Cost of sales at 8,630 million euros was above the level of the previous year. Gross profit decreased by 0.8 percent to 7,798 million euros. Gross margin declined by 0.5 percentage points to 47.5 percent. We were able to partially offset the effects of slightly higher prices for direct materials and significantly increased promotional activity through selective price increases, savings from cost-reduction measures, and improvements in production and supply chain efficiency. At 4,103 million euros, marketing, selling and distribution expenses were below the prior-year figure of 4,199 million euros. Their ratio to sales declined by 0.7 percentage points to 25.0 percent. This reflects both a shift in marketing activities toward price promotions as a result of increased pricing pressure in our consumer goods businesses, and a reduction in selling and distribution expenses. We spent a total of 410 million euros on research and development, representing a ratio to sales of 2.5 percent, which was slightly below the prior-year level. Administrative expenses declined to 733 million euros (2013: 749 million euros). The ratio to sales remained flat at 4.5 percent. ment in net interest result. The improvement in net interest result was due in part to the repayment of our senior bonds in June 2013 and March 2014, as well as interest rate fixings maturing in March 2014. Net income and earnings per share (EPS) Income before tax increased by 23 million euros to 2,195 million euros. Taxes on income amounted to 533 million euros. The tax rate of 24.3 percent was lower than the previous year (2013: 25.2 percent). The adjusted tax rate declined by 1.1 percentage points to 24.0 percent. Net income increased by 2.3 percent, from 1,625 million euros to 1,662 million euros. After deducting 34 million euros attributable to non-controlling interests, net income attributable to shareholders of Henkel AG & Co. KGaA amounted to 1,628 million euros, which was 2.5 percent higher than the prior-year figure (2013: 1,589 million euros). Adjusted net income after deducting non-controlling interests was 1,896 million euros compared to 1,764 million euros in fiscal 2013. A summary of the annual financial statements of the parent company of the Henkel Group – Henkel AG & Co. KGaA – can be found on page 178. Net income 42 in million euros 2010 1,143 2011 1,191 2012 1,526 2013 1,625 2014 1,662 Other operating income and charges At 36 million euros, the balance of adjusted other operating income and charges continued to remain at a low level (2013: 20 million euros). Financial result The financial result improved by 64 million euros to –49 million euros, mainly attributable to an improve- 0 500 1,000 1,500 2,000 69 Group management report 29 Corporate governance 50 Shares and bonds 55 Fundamental principles of the Group 63 Economic report 100 Risks and opportunities report 108 Forecast 109 Subsequent events Earnings per preferred share (EPS) rose from 3.67 euros to 3.76 euros. Earnings per ordinary share increased from 3.65 euros to 3.74 euros. Adjusted earnings per preferred share rose by 7.6 percent to 4.38 euros (previous year: 4.07 euros). Return on capital employed (ROCE) Adjusted earnings per preferred share Economic Value Added (EVA®) 43 in euros 2010 2.82 2011 3.14 2012 3.63 2013 4.07 2014 4.38 At 19.0 percent, return on capital employed (ROCE) decreased year on year. The result was impacted by higher restructuring charges, expenses for provisions relating to proceedings by antitrust authorities in Europe, and the capital effect of acquisitions. + 7.6 % increase in adjusted earnings per preferred share. Economic Value Added (EVA®) declined by 14.1 percent to 1,071 million euros due to the aforementioned impacts. Net assets and financial position 0.0 Acquisitions and divestments 2.0 1.0 3.0 Effective February 14, 2014, we concluded the takeover of a laundry and home care business in Poland, together with its associated brands. The transaction includes detergents and fabric softeners under the “E” brand as well as other smaller brands. The acquisition is aimed at further strengthening our presence in the emerging market of Eastern Europe. 4.0 Dividends According to our dividend policy, future dividend payouts of Henkel AG & Co. KGaA shall, depending on the company’s asset and profit positions as well as its financial requirements, amount to 25 percent to 35 percent of net income after non-controlling interests, and adjusted for exceptional items. Accordingly, we will propose to the Annual General Meeting an increased dividend compared to the previous year: 1.31 euros per preferred share and 1.29 euros per ordinary share. The payout ratio would then be 30.0 percent. Preferred share dividends 44 in euros 2010 0.72 2011 0.80 2012 0.95 2013 1.22 2014 1.31 1 0.0 Effective March 31, 2014, we concluded the sale in the USA of our non-core rolling oil business in the Adhesive Technologies business unit. Effective May 30, 2014, we completed the acquisition of the hair care brand Pert in Latin America. The acquisition is part of our strategy to further strengthen our presence in emerging markets. Effective June 30, 2014, we acquired full ownership of three hair professional companies in the USA, Sexy Hair Concepts LLC, Alterna Holdings Corporation and Kenra Professional LLC. This acquisition is part of our global strategy to invest in attractive country category positions in mature markets. Effective October 14, 2014, we acquired all shares of Spotless Group SAS, Neuilly-sur-Seine, France. The Spotless Group SAS mainly operates in the areas of laundry aids, insect control and household care in Western Europe, with leading brands including Eau Ecarlate, Dylon and Catch. The acquisition is part of our global strategy to invest in attractive country category positions in mature markets. 0.5 1.0 1 Proposal to shareholders for the Annual General Meeting on April 13, 2015. 1.5 25 – 35 % future dividend payout ratio. 70 Group management report Henkel Annual Report 2014 Financial structure 45 in million euros Assets of which in % 19,344 Non-current assets thereof: Intangible assets/ property, plant and equipment Current assets thereof: Cash and cash equivalents 20,961 59 68 54 62 41 32 5 6 2013 2014 Effective October 31, 2014, we acquired all shares of The Bergquist Company based in Chanhassen, Minnesota, USA. This acquisition strengthens the position of Adhesive Technologies as a leading solution provider for adhesives, sealants and functional coatings worldwide. Additional disclosures relating to the acquisitions and divestments can be found on pages 120 to 122 of the notes to the consolidated financial statements. Neither the acquisitions and divestments nor other measures undertaken resulted in any changes in our business and organizational structure. For detailed information on our organization and business activities, please refer to the disclosures on page 55. Our long-term ratings remain at “A flat” (Standard & Poor’s) and “A2” (Moody’s). These are also our target ratings. Looking forward, we intend not to jeopardize these when assessing possible acquisitions. Capital expenditures €517 m investments in property, plant and equipment and intangible assets. Capital expenditures (excluding acquisitions) in fiscal 2014 amounted to 517 million euros. Capital expenditures on property, plant and equipment for continuing operations totaled 452 million euros, following 404 million euros in 2013. We invested 65 million euros in intangible assets (previous year: 32 million euros). The majority of these capital expenditures was attributable to the Adhesive Technologies and Laundry & Home Care business units. More than twothirds of our total capital expenditures went into Equity and liabilities of which in % 20,961 19,344 56 53 Equity 18 6 7 16 4 7 Non-current liabilities thereof: Pension obligations thereof: Borrowings 26 2 31 6 Current liabilities thereof: Borrowings 2014 2013 expansion projects and rationalization measures. The main focus was on structural optimizations in production, and capital expenditures on production plants for the manufacture of innovative product lines (Laundry & Home Care and Beauty Care). The focus in the Adhesive Technologies business unit was on consolidating production sites and expanding production capacities in emerging markets. The major projects of 2014 were as follows: • Construction of an automated high-bay warehouse as the central storage facility for Germany in Düsseldorf (Laundry & Home Care) • Expansion of production capacity for liquid and powder detergents in Toluca, Mexico (Laundry & Home Care) • Expansion of WC rim block production in Kruševac, Serbia (Laundry & Home Care) • Installation of a filling line for innovative packaging for hair colorants in Viersen, Germany (Beauty Care) • Consolidation of our production footprint and expansion of production capacities in Shanghai, China (Adhesive Technologies) • Building of a factory for the manufacture of construction products in Marusino, Russia (Adhesive Technologies) • Consolidation and optimization of our IT system architecture for managing business processes I n regional terms, capital expenditures on continuing operations focused primarily on Europe, AsiaPacific and North America. 71 Group management report 29 Corporate governance 50 Shares and bonds 55 Fundamental principles of the Group 63 Economic report 100 Risks and opportunities report 108 Forecast 109 Subsequent events 46 Capital expenditures by business unit Corporate Beauty Care Adhesive Technologies 2 % 41 % 15 % Laundry & Home Care 42 % Corporate = sales and services not attributable to the individual business units. The first-time consolidation of subsidiaries resulted in additions to intangible assets and property, plant and equipment in the amount of 1,697 million euros. Details of these additions can be found on pages 128 to 132 of the notes to the consolidated financial statements. 47 Capital expenditures 2014 in million euros Intangible assets Continuing operations Acquisitions Total 65 1,651 1,716 Property, plant and equipment 452 46 498 Total 517 1,697 2,214 Current assets declined from 8.0 billion euros to 6.8 billion euros. On one hand, inventories and trade accounts receivable increased this figure, while other financial assets decreased as a result of the partial sale of our securities and time deposits. Cash and cash equivalents rose by 177 million euros in the reporting period. Equity including non-controlling interests increased to 11,644 million euros. The movements are shown in detail in the consolidated statement of changes in equity on page 115. The equity ratio increased compared to the previous year by 3.1 percentage points to 55.6 percent. Non-current liabilities rose by 0.6 billion euros to 3.7 billion euros. Our pension obligations increased significantly compared to the end of fiscal 2013 as a consequence of lower discount rates. Current liabilities decreased by 0.5 billion euros to 5.6 billion euros. The decline is attributable to the repayment of our 1.0 billion euro senior bond that matured in March 2014. The repayment was partially financed through our commercial paper program. Effective December 31, 2014, our net financial position 1 amounted to – 153 million euros (December 31, 2013: 959 million euros) and was mainly affected by dividends paid and payments for acquisitions. Net financial position 48 Net assets in million euros Compared to year-end 2013, total assets rose by 1.7 billion euros to 21 billion euros. 2010 – 2,066 2011 – 1,392 2012 – 85 Under non-current assets, intangible assets increased as a result of our acquisitions and foreign exchange effects. Assets in property, plant and equipment rose slightly, with capital expenditures of 452 million euros partially offset by depreciation of 289 million euros. 2013 959 2014 – 153 1 Borrowings less cash and cash equivalents and less readily monetizable financial instruments classified as “available for sale” or using the “fair value option,” less positive and plus negative fair values of hedging transactions (calculated on the basis of units of 1,000 euros). 72 Group management report Henkel Annual Report 2014 Net financial position 49 in million euros – 1,719 Payments for acquisitions – 548 Dividends paid – 87 Allocation to pension funds 1,333 Free cash flow – 91 Other 959 At Dec. 31, 2013 Financial position €1,333 m free cash flow. At 1,914 million euros, cash flow from operating activities in fiscal 2014 was below the high level of the previous year (2,116 million euros). Only slightly lower EBIT and lower outflows for inventories were offset by higher outflows from trade accounts receivable and lower inflows from trade accounts payable. Net working capital 1 relative to sales increased year on year by 1.9 percentage points to 4.2 percent. Net working capital positions we acquired and the negative effects of foreign exchange contributed to this increase. The cash outflow in cash flow from investing activities (–2,231 million euros) was higher in 2014 than in the previous year (–381 million euros) due to increased investments in subsidiaries and other business units. Despite the redemption of our 1.0 billion euro senior bond that matured in March 2014 and higher dividend payments, the cash inflow in cash flow from financing activities amounted to 447 million euros for the reporting period (previous year: –1,849 million euros). This was mainly affected by cash inflows from the partial sale of our securities and time deposits reported under other financing transactions, and by the issue of commercial paper. 1 Inventories plus payments on account, receivables from suppliers and trade accounts receivable, less trade accounts payable, liabilities to customers, and current sales provisions. – 153 At Dec. 31, 2014 Cash and cash equivalents rose compared to December 31, 2013, by 177 million euros to 1,228 million euros. Free cash flow of 1,333 million euros represented a decline versus the previous year (1,616 million euros), mainly due to lower cash flow from operating activities and higher capital expenditures. Financing and capital management Financing of the Group is centrally managed by Henkel AG & Co. KGaA. Funds are, as a general rule, obtained centrally and distributed within the Group. We pursue a conservative and flexible investment and borrowings policy with a balanced investment and financing portfolio. The primary goals of our financial management are to secure the liquidity and creditworthiness of the Group, together with ensuring access at all times to the capital market, and to generate a sustainable increase in shareholder value. Measures deployed in order to achieve these aims include optimization of our capital structure, adoption of an appropriate dividend policy, equity management, acquisitions, divestments, and debt reduction. Our capital needs and capital procurement activities are coordinated to ensure that requirements with respect to earnings, liquidity, security and independence are taken into account and properly balanced. 73 Group management report 29 Corporate governance 50 Shares and bonds 55 Fundamental principles of the Group 63 Economic report 100 Risks and opportunities report 108 Forecast 109 Subsequent events In the reporting period, Henkel paid a higher dividend for both ordinary and preferred shares compared to the previous year. Cash flows not required for capital expenditures, dividends and interest payments are used for improving our net financial position, allocations to pension funds, and for financing acquisitions. We cover our short-term financing requirement primarily through commercial paper and bank loans. Our multi-currency commercial paper program is additionally secured by a syndicated credit facility. Our financial management is based on the financial ratios defined in our financial strategy (see table of key financial ratios). Due to the international orientation of our businesses, a variety of regional statutory and regulatory provisions must be adhered to. The current status and amendments to these provisions are centrally monitored and any changes are taken into account in our capital management. Our credit rating is regularly assessed by the rating agencies Standard & Poor’s and Moody’s. As in the previous year, we are rated “A flat”/“A–1” (Standard & Poor’s) and “A2”/“P1” (Moody’s). Hence, both Standard & Poor’s and Moody’s continue to rate Henkel as investment grade, which is the best possible category. 50 Credit ratings Long-term Standard & Poor’s Moody’s A flat A2 Outlook Stable Stable Short-term A–1 P1 At December 31, 2014 As of December 31, 2014, our non-current borrowings amounted to 1,354 million euros. Included in this figure is the hybrid bond issued in November 2005 with a nominal value of 1.3 billion euros. Our current borrowings – meaning those with maturities of less than 12 months – amounted to 390 million euros as of the reporting date and consist mainly of our commercial paper. We partly used the cash flow from operating activities generated in earlier periods to repay our senior bond that matured in March 2014. The hybrid bond is treated as 50 percent equity by both Standard & Poor’s and Moody’s. This treatment benefits the rating-specific debt ratios of the Group (see table of key financial ratios). Henkel’s financial risk management activities are explained in the risks and opportunities report on pages 100 to 107. Further detailed information on our financial instruments can be found in the financial instruments report on pages 150 to 162 of the notes to the consolidated financial statements. Key financial ratios Due to our low net borrowings, operating debt coverage in the reporting period was well above the target of 50 percent. Our interest coverage ratio (EBITDA divided by net interest expense) also improved further – aided by higher EBITDA and lower interest expense. The further improved equity ratio similarly reflects the high financial strength of the Group. 51 Key financial ratios 2013 Operating debt coverage 1 (net income + amortization and depreciation, impairment and write-ups + interest element of pension obligations) / net borrowings and pension obligations not relevant 2 2014 274.8 % Interest coverage ratio (EBITDA / interest result including interest element of pension obligations) 23.9 48.4 Equity ratio (equity / total assets) 52.5 % 55.6 % 1 Hybrid bond included on 50-percent debt basis. 2 Figure not relevant due to the positive balance of our net financial position and pension obligations. 74 Group management report Henkel Annual Report 2014 Employee engagement Left: The “Germany in Dialog” series allows employees to engage in discussion at their work sites, here in Düsseldorf, with senior management. Right: A poster illustrating our global initiative in 2014 aimed at strengthening diversity and pro moting an inclusive corporate culture. Employees At the end of 2014, Henkel employed around 49,750 people worldwide (annual average: 47,800). The growth compared to the previous year’s figure of 46,850 employees is the result of both acquisitions and an organic increase – for example in the emerging markets where we have continued to strengthen our teams. Personnel expenses amounted to 2,598 million euros. We continued our progress in all key areas of human resources management in fiscal 2014: • We reinforced our reputation as an employer of choice through numerous initiatives and targeted programs to recruit and retain the best talent for our company. • We supported the professional and personal development of our employees through an extensive offering of training and apprenticeships, including a plan for lifelong learning. Through these programs, we focused particularly on promoting our Leadership Principles and on fostering the next generation of executives in emerging markets. Employees by region Latin America 7 % Africa/ Middle East 10 % North America 13 % Asia-Pacific 20 % At December 31, 2014 52 Western Europe 30 % Eastern Europe 20 % • W e further strengthened our performance-based culture through our globally uniform performance appraisal process for managerial staff, and through competitive compensation programs also aligned to our medium-term financial targets. • We further increased diversity in our company and expanded flexible work opportunities. This also contributed to the increase of the share of women in management positions. • Finally, through our established programs in the area of corporate citizenship, we supported and encouraged our employees to engage in volunteer activities and social projects. Employer of choice for applicants As in previous years, our focus in attracting potential job applicants was very much on online channels. In total, more than 525,000 people now follow our career pages in social media channels such as LinkedIn, Facebook and, in China, Weibo. In addition to our collaboration with universities around the world, we launched a new model in 2014 aligned to cooperation with six top MBA business schools. The eighth edition of the “Henkel Innovation Challenge” – 53 Employees by business unit Functions 14 % Beauty Care 15 % Laundry & Home Care 18 % At December 31, 2014 Adhesive Technologies 53 % 75 Group management report 29 Corporate governance 50 Shares and bonds 55 Fundamental principles of the Group 63 Economic report 100 Risks and opportunities report 108 Forecast 109 Subsequent events 54 Employees by activity Research and development 6 % Administration 14 % Production and engineering 49 % 55 Employees by age group 16–29 years 18 % 50–65 years 20 % Marketing, selling and distribution 31 % 40–49 years 28 % At December 31, 2014 At December 31, 2014 the innovation competition for students – was launched in the fall of 2014. Around 35,000 students from across the world have participated in this competition since its inception. Executives from all business units actively provide guidance as mentors to the participants in 2 8 countries. Extensive training and apprenticeship opportunities Taken as a whole, these various initiatives have helped to position Henkel even more effectively as an employer of choice among our target groups, resulting in a steady rise in qualified applications. 30–39 years 34 % In Germany, Henkel offers more than 20 apprenticeship professions. We took on around 150 apprentices again in 2014, including students taking part in our dual-track study program. Currently, around 500 apprentices and students are learning a profession at Henkel. We support professional development for all our employees and have expanded the offerings available within the “Henkel Global Academy” accordingly. In addition to offering training programs that are available for all employees, we cooperate with internationally renowned business schools to further develop selected executives in the areas of management and leadership. We also developed a new program in 2014 in collaboration with Harvard Business School in the USA. Our aim is to further prepare our top executives for the strategic challenges of a global environment. One-third of the designated group has already successfully completed this “Leadership Forum.” 56 Employees 2010 % 2011 % 2012 % 2013 % 2014 % Western Europe 16,250 34.0 15,350 32.5 14,600 31.3 14,400 30.7 14,900 30.0 Eastern Europe 8,600 18.0 8,850 18.7 9,150 19.7 9,600 20.5 10,000 20.1 Africa/Middle East 5,200 10.9 5,300 11.3 5,100 11.0 4,800 10.2 4,850 9.7 North America 5,450 11.4 5,250 11.1 5,200 11.1 5,150 11.0 6,200 12.5 Latin America 3,700 7.7 3,700 7.8 3,650 7.8 3,750 8.0 3,650 7.3 Asia-Pacific 8,650 18.0 8,800 18.6 8,900 19.1 9,150 19.6 10,150 20.4 47,850 100.0 47,250 100.0 46,600 100.0 46,850 100.0 49,750 100.0 (At December 31) Total Basis: permanent employees excluding apprentices; figures rounded. 76 Group management report To promote lifelong learning, various programs based on individual needs have been developed for all employees worldwide. In 2014, our staff in middle management had the opportunity of using a new digital platform for collaborative learning and discussion with their colleagues around the world, and also experts from respected universities, on the topic of leadership. Our long-term program for human resources development combines a variety of approaches to ensure that each employee can continue to grow individually, based on their needs. Motivating performance-based culture In 2014, we completed our sixth Development Round Table (DRT) for some 10,250 management employees worldwide. The DRT is a globally standardized process for evaluating performance and development potential. Promotion of around 1,150 employees in management positions is proof of the strength of our talent pool. An important component of our performance-based culture is competitive compensation. Both individual achievement and corporate success are rewarded, particularly through our incentive system for all managers. The incentives are aligned to the attainment of our medium-term financial targets, inspiring outstanding performance while also reflecting individual levels of achievement. Diversity and flexibility Around 33 % of our managers are women. 1 We are committed to increasing the diversity of our company and creating an inclusive environment in which the contributions of each individual are valued. Our approach in promoting “Diversity & Inclusion” is all-embracing. In support of creativity and innovation in our company, we endeavor to integrate all dimensions of diversity – different generations, genders, cultures and experiences. Among other things, 2014 therefore saw us pursue a global campaign to sensitize our employees to the issue of “Diversity & Inclusion” and foster a corporate culture in which diversity is positively valued. The key Henkel Annual Report 2014 message of this campaign was “Inclusion starts with I.” To us, this means that each individual can contribute to diversity and inclusion through their own behavior. Related events and activities took place in June 2014 as part of the Diversity Weeks held at our sites worldwide. Henkel has already implemented a variety of alternative work models such as flexible working hours, part-time work, the expanded use of mobile devices, and a set of rules for home office working. These models benefit all participants – the company, the managers as well as employees who have the ability under these rules to plan their time more effectively based on their specific needs. Flexible work options are also an important element in the competition for top talent, representing an attractive way of accommodating the various demands of private and professional life. In 2012, our Management Board and all our top management sent out a clear signal by signing a global Work-Life Flexibility Charter. We expect our executives to regard the basic principles of the Charter as part of their management responsibility. The promotion of international experience through work abroad continues to be an important component of personnel development. Our employees gain valuable experience in a new work environment while broadening their intercultural understanding. The support for, and requirement of, this mobility early in their professional lives is an important aspect of career planning for our employees. Henkel also promotes career development for female managers. Our share of women in management positions increased once again, by nearly 1 percentage point. At the end of 2014, it stood at around 33 percent 1. This commitment has been recognized, for example in South Korea, where we were distinguished for the second time as a “Great Place to Work for Women.” 1 Excluding acquisitions in 2014. 77 Group management report 29 Corporate governance 50 Shares and bonds 55 Fundamental principles of the Group 63 Economic report 100 Risks and opportunities report 108 Forecast 109 Subsequent events Acting responsibly An integral part of our understanding of responsible behavior, extending beyond our business activities, is our social engagement – also referred to as corporate citizenship. Reflecting this spirit, more than 50 employees – with Henkel’s support and encouragement – volunteered to accompany athletes with intellectual disabilities to the Special Olympics in Düsseldorf in early 2014. In addition to support for the voluntary engagement of our employees and retirees in over 2,200 projects worldwide, our corporate citizenship activities also include various other forms of social engagement by the company and its individual business units, as well as the provision of international emergency relief. Last year again, Henkel responded quickly and unbureaucratically to provide aid in the wake of a number of natural disasters. For example, we sent immediate financial assistance and product donations after the devastating floods in the Balkans, and also following the severe hurricanes that struck the USA and Mexico. In total, we donated more than 8 million euros worldwide in 2014. The significant involvement of our employees is not only a success factor in the area of corporate citizenship, it is also fundamental to the successful implementation of our sustainability strategy. In 2014, therefore, we further reinforced the importance of sustainability in our internal communications and specifically integrated it in our current training and education programs. We also promote the involvement of our employees through our Sustainability Ambassadors program. Our ambassadors promote sustainability among colleagues, suppliers, customers, and students. By the end of 2014, more than 3,800 employees had successfully taken part in this program, including the entire Management Board and all senior management around the world, with our ambassadors also reaching out to 36,000 elementary school children in 37 countries. Procurement We use externally sourced materials (raw materials, packaging and purchased goods) and services to produce our finished products. These items all fall under the general category of direct materials. Examples include washing-active substances (surfactants), adhesive components, cardboard boxes and external filling services. Aside from supply and demand, the prices of direct materials are mainly determined by the prices of the input materials used to manufacture them. As in the previous years, 2014 was characterized by fluctuating raw material prices. The situation differed sharply by both region and type of input material. The average crude oil price was lower than in the prior year, but severe price fluctuations occurred over the course of the year. The price for palm kernel oil was high during the first six months of the year but settled back to a normal level during the second half, at prices similar to the second half of the previous year. Prices for butadiene declined steadily from one quarter to the next. Ethylene prices rose in the USA and Asia while remaining moderately below the prior-year level in Europe. Overall, prices for direct materials in 2014 were slightly higher than the previous year. Year on year, direct material expenditures remained unchanged at 7.3 billion euros. Despite our acquisitions, the absolute expenditure stayed at the same level. This is mainly due to foreign exchange effects and savings from cost-reduction measures, but also to improvements in production and supply chain efficiency. Our five most important groups of raw materials within the direct materials category are raw materials for use in hotmelt adhesives, washing-active substances (surfactants), raw materials for polyurethane-based adhesives, inorganic raw materials and water- and acrylic-based adhesive raw materials. These account for around 34 percent of our total direct material expenditures. Our five largest suppliers account for around 13 percent of purchasing volume in direct materials. Purchases made in the general category of indirect materials and services are not directly used in the production of our finished products. Examples include maintenance materials, and logistics, marketing and IT services. We were able to more than compensate for the slight increases in gross prices in these areas in 2014 through our global procurement €7.3 bn expenditures on direct materials. 78 Group management report Henkel Annual Report 2014 strategy and structural cost reduction measures. At 4.6 billion euros, expenditure on indirect materials and services for 2014 was slightly below the prioryear level. In order to improve efficiency and secure material supplies, we continuously optimize our value chain while ensuring that we maintain our level of quality. In addition to negotiation of new, competitive contract terms, our ongoing initiative to lower total procurement expenses is a major factor in the success of our purchasing strategy. Together with the three business units, Purchasing works continuously on reducing product complexity, optimizing the raw materials mix and further standardizing packaging and raw materials. To ensure innovation and optimization of manufacturing costs and logistics processes, we enter into long-term business relationships with selected suppliers, while taking the necessary measures to avoid the risk of supply shortages. We also agree on individual targets with our strategic suppliers to strengthen our negotiating position and give us greater flexibility to consolidate our supplier base. Last year, even though we completed several acquisitions, we succeeded in further reducing the number of suppliers by 11 percent. operations into eight global purchasing centers as part of our “Sourcing@Best” initiative. We have also started to integrate our production and logistics activities across all business units with our purchasing operations into one global supply chain organization. This began operations in November 2014. Given the uncertainties with respect to raw material price changes and ensuring supply in the procurement markets, risk management is an important part of our purchasing strategy. The emphasis is on reducing price and supply risks while maintaining uniformly high quality. As part of our active price management approach, we employ strategies to safeguard prices over the long term, both by means of contracts and, when appropriate and possible, through financial hedging instruments. In order to minimize the risk of supplier default, we stipulate supplier default clauses and perform detailed risk assessments of suppliers to determine their financial stability. With the aid of an external, independent financial services provider, we continuously monitor important suppliers whose financial situation is seen as critical. If a high risk of supplier default is identified, we systematically prepare back-up plans in order to ensure uninterrupted supply. We were able to increase the efficiency of our purchasing activities by further standardizing, automating and centralizing our procurement processes. In addition to making greater use of eSourcing tools to support our purchasing operations, we have also already pooled large portions of our administrative purchasing activities – such as order processing, price data maintenance, and reporting activities – within our shared service centers. Furthermore, we are consolidating our global strategic procurement We expect our suppliers and business partners to conduct themselves in a manner consistent with our own corporate ethics and values. The basic requirements in this regard are set out in our purchasing standards, valid across the Group, and our safety, health and environmental standards formulated in 1997, through which we have long acknowledged our responsibility for the entire supply chain. Consequently, in selecting and developing our suppliers and business partners, we take into account their Material expenditures by business unit Material expenditures by type Beauty Care Laundry & Home Care 18 % 57 Adhesive Technologies 51 % Purchased goods and services 17 % Packaging 31 % 20 % 58 Raw materials 63 % 79 Group management report 29 Corporate governance 50 Shares and bonds 55 Fundamental principles of the Group 63 Economic report 100 Risks and opportunities report 108 Forecast 109 Subsequent events performance in terms of sustainable development. We use the cross-industry Code of Conduct published by the German Federal Association of Materials Management, Purchasing and Logistics [BME] as a globally applicable supplier code, and the basis for our multi-stage Responsible Supply Chain Process. The objective of this process is to ensure supplier compliance with these standards and to improve the sustainability standards of our supply chain together with our strategic suppliers. A global training program ensures that the requirements regarding the sustainability profile of our suppliers are understood and properly applied by our employees in Purchasing. Systematic expansion of our supplier audit programs will be a major focus in this regard in the coming years. We plan not only to increase the number of supplier audits but also to improve their transparency and efficiency. In collaboration with five other companies from the chemical industry under the initiative “Together for Sustainability,” Henkel has standardized the procedure for evaluating sustainability and auditing criteria, and established an online training program for suppliers. The results of audits and assessments are shared among the members of the initiative, producing valuable synergies when evaluating what are – in many cases – common suppliers. Last year, we were able to further extend recognition and awareness of the “Together for Sustainability” initiative, for example through information events such as a suppliers’ conference in Shanghai, or reports of best practice in trade publications. As a result, membership has increased from the original six companies in 2011 to 12 currently. Production We further optimized our production sites in fiscal 2014. As part of our Strategy 2016, we also initiated the process of further standardizing our production and logistics activities across all business units, and consolidating them with our purchasing activities into a global supply chain organization. The new organization started operations in November 2014. In 2014, Henkel manufactured products of a total weight of 7.9 million metric tons at 169 sites in 54 countries. Our largest production facility is in Düsseldorf, Germany. Here we manufacture not only detergents and household cleaners but also adhesives for consumers and craftsmen, and products for our industrial customers. Cooperation with toll manufacturers is an integral component of our production strategy, enabling us to optimize our production and logistics structures when entering new markets or when volumes are still small. We currently purchase around 10 percent in additional production tonnage from toll manu facturers each year. 59 Number of production sites Laundry & Home Care 2013 2014 27 28 8 8 Adhesive Technologies 129 133 Total 164 169 Beauty Care In the Laundry & Home Care business unit, the number of production sites increased from 27 to 28 with acquisition of the Spotless Group. Our plant in Düsseldorf continues to be the largest production site for this business unit. Here we predominantly manufacture powdered and liquid detergents, fabric softeners, liquid cleaning products and dishwasher tabs. In 2014, we again implemented numerous measures to systematically further improve the operational excellence of our plants. We also continually invest in capacity expansion, with particular focus on innovations and emerging markets. We successfully renewed the external certification of Group headquarters and all our plants, confirming our compliance with international quality, environmental, safety and energy management standards. Continuous improvements in sustainability enabled us to make significant progress in our focal areas of 80 Group management report safety and resource conservation, helped, not least, by the centralized real-time system introduced by the business unit to measure total resource use around the world and systematically evaluate the findings. In March 2014, the Laundry & Home Care business unit was honored in Germany with the “Lean and Green Award” in recognition of its sustainable approach to transportation and logistics. This award, presented for the first time, serves to recognize companies that implement specific sustainability measures to verifiably reduce the carbon dioxide footprint of their logistics processes. Our goal is reduce the carbon dioxide footprint of our logistics processes by at least 20 percent within five years. Specific measures that we have successfully implemented include reducing transportation mileage by building a new, automated central detergent warehouse at our Düsseldorf site, and converting our transportation vehicles to the Euro-6 emission standard. In 2014, our Beauty Care business unit focused on expanding the production site that we acquired in Russia in 2013. In keeping with our production strategy, we are investing in technologies at this site that will enable us to supply the Eastern European and Russian markets from a regional source. In addition to the specific capital expenditures at European sites, we also made investments in non-European sites to support and expand our organic growth. We successfully improved efficiency and further enhanced our flexibility in these fiercely competitive markets. Within the framework of our “Total Productive Management Plus” program aligned to a focused investment strategy, the motivation of our employees to continuously optimize processes again enabled us to increase productivity while further lowering energy consumption and waste and wastewater volumes. In keeping with its international standardization strategy, Henkel Beauty Care rolled out a new IT solution for managing production in Western Europe. This Manufacturing Execution System (MES) will produce further improvements in efficiency as well as specifically standardizing and transferring bestpractice processes. Henkel Annual Report 2014 The production strategy pursued by our Adhesive Technologies business unit is primarily aimed at the growing demand in emerging markets and the resultant growth in business. At the same time, we are focusing on continuously improving the efficiency of our production structures to benefit from economies of scale and cost advantages in product manufacturing. In 2014, we primarily expanded our production capacities in Eastern Europe and Asia to enable our products to be manufactured close to the customers of those regions. Establishing multi-technology sites is a key requirement for using a shared – and therefore cost-efficient – site infrastructure for different production technologies. Henkel’s largest adhesives factory worldwide was designed on the basis of this concept. It is located in Shanghai and commenced operations in 2013. During the year under review, we identified further sites in various regions that we have now started to expand. We actively manage our global production network to enable adjustment of our supply capacity to current and future demand. Due to the acquisition of The Bergquist Company, the number of production sites increased from 129 to 133. We made further progress with the ongoing improvement and standardization of our production processes and workflows during the year under review, thus laying the foundations for a standardized production system the world over. Lean teams set up specifically for this task draw on the knowledge and experience of our employees in order to improve the efficiency of our production processes. Standardized processes and investments in optimized IT systems enable us to continuously improve our delivery services to customers. As an important aspect in our promise of quality, our optimization efforts in all three business units aim to reduce the environmental footprint of our production activities. We focus in particular on cutting energy use, thereby contributing to climate protection, reducing material input and waste volume, and limiting water usage and wastewater pollution. New warehouse concepts and the production of packaging materials directly on-site where filling takes place reduce transport mileage and thus also contribute to climate protection. 81 Group management report 29 Corporate governance 50 Shares and bonds 55 Fundamental principles of the Group 63 Economic report 100 Risks and opportunities report 108 Forecast 109 Subsequent events Overall, our global programs in 2014 resulted in 66 percent of our sites reducing their energy use, 74 percent decreasing their water usage, and 54 percent lowering their waste footprint. Keeping our “Factor 3” goal in mind for the year 2030, we have set concrete interim targets for our production sites that we intend to reach by the end of 2015: Sustainability targets for 2015 and current status 60 Environmental indicators per ton of production volume Target Status Energy used – 15 % – 20 % Water used – 15 % – 19 % Waste generated – 15 % – 18 % 1 Occupational accidents 2 – 20 % – 25 % 1 Excluding construction and demolition waste: – 22 %. 2 Per million hours worked. Base year: 2010 By the end of 2014, we had achieved significant progress in all four areas, and reached our targets ahead of time. While continuing our efforts to further improve our performance in these areas, we are also working on defining new medium-term targets as we move toward our long-term goal of “Factor 3.” For further details on our sustainability targets, please see pages 59 to 61 and our Sustainability Report on our website at www.henkel.com/sustainabilityreport Our standards for safety, health and the environment, and the Henkel Social Standards, apply to all our sites worldwide. Using a clearly defined process consisting of communication, training and audits, we ensure compliance with these standards, especially at the production level. We have the environmental management systems at our sites externally certified wherever this is recognized by our partners in the respective markets. By the end of 2014, around 93 percent of our production volume came from sites certified to ISO 14001, the internationally recognized standard for environmental management systems. Research and development Expenditures by the Henkel Group for research and development (R&D) in the reporting period amounted to 413 million euros (adjusted for restructuring expenses: 410 million euros) compared to 415 million euros (adjusted: 414 million euros) in 2013. As a percentage of sales, we spent 2.5 percent (adjusted: 2.5 percent) on research and development (2013: 2.6 percent, adjusted: 2.6 percent). In 2014, personnel expenses accounted for approximately 60 percent of total R&D spending. Our research and development costs were fully expensed; no product- or technology-related development costs were capitalized in accordance with International Financial Reporting Standards (IFRS). R&D expenditures 1 61 (in million euros) 2010 391 2011 410 2012 408 2013 415 2014 413 0 100 200 300 400 1 Including restructuring charges of: 8 million euros (2010), 14 million euros (2011), 2 million euros (2012), 1 million euros (2013), 3 million euros (2014). 62 R&D expenditures by business unit Beauty Care 16 % Laundry & Home Care 24 % Adhesive Technologies 60 % 2.5 % R&D expenditures in percent of sales. 82 Group management report Henkel Annual Report 2014 63 Selected research and development sites Düsseldorf, Germany Hamburg, Germany Vienna, Austria Madison Heights, USA Bridgewater, USA Rocky Hill, USA Dublin, Ireland Moscow, Russia Irvine, USA Scottsdale, USA Dubai, United Arab Emirates Shanghai, China Seoul, South Korea Yokohama, Japan Pune, India Toluca, Mexico Johannesburg, South Africa On an annual average, around 2,650 employees worked in research and development (2013: 2,600). This corresponds to around 6 percent of the total workforce. Our teams are composed of natural scientists – predominantly chemists – as well as material scientists, engineers and technicians. 64 Key R&D figures 2010 2011 2012 2013 2014 R&D expenditures 1 (in million euros) 383 396 406 414 410 R&D expenditures 1 (in % of sales) 2.5 2.5 2.6 2.6 2.5 2,650 2,650 2,650 2,600 2,650 Employees 2 (annual average) 1 Adjusted for restructuring charges. 2 Figures rounded. Our capital expenditures and the capabilities of our highly qualified employees form the foundation on which the success of our R&D activities is built. Moreover, our Group-wide cooperation models, successful project outsourcing as part of our Open Innovation strategy, and the relocation of resources in the direction of emerging markets all demonstrate our ongoing focus on innovation and our concerted efforts to continuously reduce our resource consumption while maintaining or improving performance. Strengthening research and development together The research and development experts in the three business units align their project portfolios to the specific needs of their individual businesses. They work together on fundamental processes, basic innovation, and on evaluating partners for innovation and sustainability. The Research and Development Committee is responsible for Group-wide coordination. An example of common processes is the improved innovation management approach, which was developed and introduced by the Adhesive Technologies business unit as a pilot project. Basic innovations in common areas of knowledge are continually exchanged between the business units, through both formal and informal channels. This is particularly relevant to all surface-modifying technologies such as surfactants, multifunctional polymers and silicones. The documentation of advances in sustainability made within the research projects has also been standardized across the three business units. Open innovation Our innovations come from both internal and external sources. Therefore, the concept of Open Innovation continues to hold great significance for us. Accordingly, we have intensified our efforts to involve external partners such as universities, research institutes and suppliers in many of our development projects. 83 Group management report 29 Corporate governance 50 Shares and bonds 55 Fundamental principles of the Group 63 Economic report 100 Risks and opportunities report 108 Forecast 109 Subsequent events The following examples demonstrate the success achieved with our Open Innovation concept: • BASF was honored by Henkel with the “Best Innovation Contributor Award 2014” for partnering with us in the development of an innovative active care ingredient for fabric softeners that offers considerably enhanced performance. The newly developed formula combines for the first time esthetic transparency, exceptional laundry softness and premium fragrant oils. The fragrant appeal is noticeably enhanced by the lingering presence of the premium perfumes on the laundry. • Working closely with Wacker – experts in silicone chemistry – we were able for the first time to boost our hair care products with reactive silicones, which adhere semi-permanently to the surface of the hair. The lamination effect enhances shine and makes the hair easier to comb. This innovative lamination technology was successfully launched under the “Million Gloss” range of Gliss Kur hair care products, and also won the “Best Innovation Contributor Award 2014.” • In recognition of our close and successful collaboration, we presented our “Supplier Innovation Award” to Kaneka, a Japanese company that provides a broad range of polymers for a variety of industrial applications. Kaneka gives Henkel early access to its latest development results and supplies us with polymers specifically tailored to our needs for use, for example, in high-performance engine gaskets in the automotive industry. Research and development worldwide In addition to its central research laboratories, Henkel maintains regional research and development sites around the world as hubs for innovative problem-solving. Worldwide research and development activity is managed globally by the business units. Research-intensive basic technologies are developed at a central location with optimal access to external resources. These basic technologies are applied in the regional research and development sites to customer- and market-specific innovations. At the same time, the research and development staff in the regional sites identify specific problems for the next generation of innovations in close contact with markets and customers. The new basic technologies needed for these are again developed centrally. The following examples illustrate the contribution made by our regional research and development laboratories: • The innovation center set up in 2013 by the Laundry & Home Care business unit in Dubai, United Arab Emirates, enables our development work to be targeted even more closely to the needs of customers in the emerging markets in the Africa/ Middle East region. This serves to further strengthen our innovation leadership and market position. Persil Black Oud, for example, is a liquid detergent developed in Dubai specifically for the Arab markets, which has enabled Henkel to considerably expand its market leadership in this segment with a double-digit gain in market share. This product is particularly innovative due to the first-time combination of the advanced Persil Black formula with the unique fragrance of oud. This scent is derived from the natural extracts of tropical wood and is particularly typical of Arab perfume tradition. • The growing importance of the emerging markets also impacts the R&D strategy of the Beauty Care business unit. The research and development center in Shanghai, China, was expanded in 2014. In 2013, we opened a new center, including a laboratory and test salon, in Johannesburg, South Africa, to develop products specifically tailored to afrotextured hair. Schwarzkopf Smooth ʼN Shine is a new range of hair care products, including innovative hair smoothing products, developed specifically in response to the conditioning needs of afrotextured hair. • The Adhesive Technologies business unit provides its expertise and solutions locally through global technology centers located in direct proximity to its customers. In early 2014, it opened a technology center in Seoul, South Korea, to focus on the new materials and new processes needed by the producers of mobile devices and display screens. Our experts have developed a new generation of optically transparent liquid adhesives for the fastgrowing flat screen market. Our combined expertise in product development, processes and technology allows our customers to test new product concepts quickly and efficiently. 84 Group management report Contributing to sustainability Worldwide, growth and quality of life need to be decoupled from resource use and emissions. Our contribution lies in the development of innovative products and processes that use less resources while offering the same or better performance. It is therefore both our duty and our desire to ensure that all new products contribute to sustainable development in at least one of our six defined focal areas. These are systematically integrated within our innovation process. Early on, our researchers must demonstrate the specific advantages of their project in regard to product performance, added value for our customers, resource efficiency, and social progress. We therefore focus our R&D efforts on innovations that combine product performance and quality with social and environmental responsibility. Life cycle analyses, profiles of potential raw materials and packaging options, and our many years of experience in sustainable development help us to identify and evaluate improvement opportunities right from the start of the product development process. A key tool in this respect is our “Henkel Sustainability#Master®.” This evaluation system centers around a matrix based on the individual links in our value chains and on our six focal areas. It shows which areas are most relevant from a sustainability perspective, and allows a transparent and quantifiable comparison to be made between two products or processes. Our scientists again made valuable contributions to the company’s success through their innovations in 2014. A selection of particularly outstanding research projects is provided in the examples below: • In the Laundry & Home Care business unit, an innovative base formula for automatic dishwashing products was rolled out globally under the Somat 10 and Somat Gold brands. The enhanced performance produces cleaner dishes while using less water and energy and thus improves the contribution to sustainability significantly. The innovation is based on the use of a technology that is common in the pharmaceutical industry and which makes Somat 10 and Somat Gold dissolve more quickly than all other tabs before them. • For the relaunch of Taft Power, an innovative formulation platform for hairsprays and gels was developed containing highly efficient combinations of film-forming polymers. These innovative polymer combinations contribute to sustainability in three ways: The consumer enjoys improved product performance from strong hold and a natu- Henkel Annual Report 2014 ral, lightweight style, while the environment benefits from less polymer content, which reduces both raw material consumption and the carbon footprint. • The Adhesive Technologies business unit underlined its leading role in the area of sustainability through innovative adhesive technologies and provision of associated expertise in the field of food safe packaging. The unit offers its customers in the packaging industry solutions that take into account growing consumer demands for safe food. In Europe, for example, we introduced a solventfree, two-component polyurethane adhesive system for a new form of high-quality food packaging with a barrier function. Fritz Henkel Award for Innovation Each year we select a number of outstanding developments for our Fritz Henkel Award for Innovation. In 2014, the innovation award went to three international, interdisciplinary project teams for the realization and successful commercialization of the following concepts: • With Pril against Grease + Crust, Henkel Research has succeeded for the first time in formulating a stable liquid hand dishwashing product that uses high-performance enzymes in addition to surfactants. The specially developed patent-pending formula not only acts powerfully on grease, it also uses low-temperature enzymes that can split starch molecules efficiently and dissolve even dried food residue such as pasta, potatoes, and rice. Thanks to these enzymes and their innovative stabilization in a highly effective formula, Henkel can achieve better product performance while reducing surfactant content, and save more than 10,000 metric tons of carbon dioxide emissions per year. • With Schwarzkopf Essence Ultîme, Henkel launched the first-ever range of hair care products created exclusively in collaboration with beauty icon Claudia Schiffer. Schwarzkopf’s hair expertise was combined with the insider knowledge of one of the best known and most successful models to develop an entirely new range of hair care products. The highly effective formulas containing luxurious pearl essence and specific repair agents rebuild and protect the inner and outer substance of even severely damaged hair. Hair is strengthened from within, giving it a new resilience. Restoring the protective lipid layer smooths the outer structure, making hair shiny and supple. Since the formulas are both economical in their use of materials and particularly effective, the 85 Group management report 29 Corporate governance 50 Shares and bonds 55 Fundamental principles of the Group 63 Economic report 100 Risks and opportunities report 108 Forecast 109 Subsequent events 65 Fritz Henkel Award for Innovation 2014 www.pril.de www.essence-ultime.de www.henkel.com/automotive products make positive contributions to sustainability in respect of performance, energy, climate, materials and waste. • Research experts at Henkel have succeeded in developing innovative technologies for substituting synthetic polymers, such as PVC or rubber, with renewable raw materials. A combination of natural oils – such as rapeseed or linseed oil – allows specific adaptation of, for example, the properties of damping materials used to reduce noise and vibration in vehicles. This innovative technology toolbox is used for various materials, such as Teroson liquid-applied sound deadeners (LASD), and also sealants or underbody coatings, to support the trend toward lightweight vehicle construction. With these new, sustainable solutions developed by Henkel, manufacturers can cut the weight of acoustic dampeners by up to 30 percent versus synthetic products while maintaining or even improving performance. Marketing and distribution We hold more than 8,000 patents to protect our technologies around the world. Around 5,100 patents are currently pending. And we have registeredover 1,500 design patents to protect our designs. In addition to traditional advertising, digital marketing is playing an increasingly important role in reaching consumers through creative and innovative campaigns. Digital campaigns, which include the use of social media, are developed centrally and rolled out. Further information on our research and development activities can be found on our website at www.henkel.com/innovation We put our customers at the center of what we do. Hence we align our marketing and distribution activities in our business units to the requirements of each specific audience and target group. In the Laundry & Home Care business unit, aligning our marketing activities to our markets and customers, and continuously optimizing them, form the core elements of our strategy. We focus on the global management of our international brands. This enables us to adopt more efficient decision-making processes, accelerate the market launch and further commercialization of our innovations, and further advance the use of new media for distribution and promotion purposes. Close cooperation between our global and local marketing units ensures that local market conditions and consumer habits are taken into account throughout the marketing process. 86 Group management report Sales activities are planned on a country-specific basis, taking into account regional synergy effects. Coordination at the global level ensures the systematic incorporation of local experience and harmonization of selling and distribution processes. Strengthening our shopper marketing activities has also helped to further improve our relationships with our retail customers. These measures, together with the latest results of customer satisfaction studies, confirm our leading role in developing and leveraging category potential. In the Beauty Care business unit, we develop marketing and sales strategies for both our Branded Consumer Goods and our Hair Salon businesses on a global scale, and then implement them at the local level. In the Branded Consumer Goods business, we focus on strategic partnerships while aiming for above-average growth with our top customers. The “Beauty Care Lighthouse” in Düsseldorf acts as the center of innovations and customer focus, where customers can experience Beauty Care’s expertise firsthand and interactively, and can digitally immerse themselves in the world of innovation. In addition to traditional advertising and point-of-sale activities, digital marketing is a key element of our marketing strategy. We are focusing, in particular, on developing direct consumer interaction through social media. 6,500 specialists serving our Adhesive Technologies customers. In the Hair Salon business, we also rely on collaborating closely in partnership with our customers. As an additional service, our globally established Schwarzkopf Academies offer state-of-the-art specialist seminars and ongoing training programs with the focus increasingly on the hair salon as an enterprise. In parallel, our Schwarzkopf sales force ensures that our partners receive comprehensive advice at the local level to continuously enhance the technical skills and commercial success of our salon partners. Closeness to customers and consumers in both the Branded Consumer Goods and Hair Salon businesses ensures the continued ability of the Beauty Care business unit to successfully bring innovation to market. Henkel Annual Report 2014 Marketing in our consumer goods businesses is focused on the needs of the consumer. Our marketing organization initiates innovation processes and uses knowledge gained from market research and observation. Our marketing teams develop and execute media strategies and advertising formats that specifically address consumers. To support our strong brands and continue the successful marketing of our innovations, we manage our marketing activities and investments using clear priorities set according to category and region. Our primary direct customer group is the grocery retail trade with distribution channels in the form of supermarkets, large-scale mass merchandisers / hypermarkets and discount stores. In Europe, drug stores are also important. Wholesalers and distributors continue to account for a large proportion of our sales in markets outside Europe and North America. Our sales organization offers a full range of skills and services to support our trade customers. In response to the growing importance of e-commerce, we have entered into partnership with various online retailers. As a leading solution provider for adhesives, sealants and functional coatings worldwide, the Adhesive Technologies business unit covers virtually the entire spectrum of the global adhesives market with its specialized market sectors. We offer a comprehensive portfolio of solutions tailored to the needs of our industrial customers, as well as high-quality brand products for consumers, craftsmen and customers in the building industry. Our businesses in the industrial sector are Packaging and Consumer Goods Adhesives, Transport and Metal, General Industry, and Electronics. With our 6,500 in-house specialists, we foster longterm contact with our customers and have acquired an in-depth understanding of their various areas of application. We have around 130,000 direct industry and retail customers who are generally serviced by our own sales teams. Our retail customers, in turn, service the needs of private users, craftsmen and smaller industrial customers more efficiently than would be the case through direct channels. 87 Group management report 29 Corporate governance 50 Shares and bonds 55 Fundamental principles of the Group 63 Economic report 100 Risks and opportunities report 108 Forecast 109 Subsequent events Our global teams of experts work closely with our industrial customers. These direct relationships, most of which have been ongoing for many years, give us unique and very detailed insight into their areas of work. This expertise forms an important basis on which to develop strong innovations that generate sustainable added value for our customers. In light of the significant complexity of many of our solutions and technologies, first-rate technical customer service and thorough user training are of key importance. Our global presence enables us to provide technical services to customers worldwide as well as in-depth product training on site. In the year under review, we opened a new technology center in South Korea, thus further expanding our global network. At these competence centers for multi-technology development, the various applications of our technologies are demonstrated in practical examples and tested for compliance with specific customer requirements. We develop our marketing strategies at both the global and regional level. The measures derived from our planning are then implemented locally. Our strong, internationally established brands are a central element in the range of products and services we offer. In our brand strategy, we consistently rely on Henkel as our manufacturer brand to further strengthen the five global technology cluster brands in the industrial markets and our four brand platforms in the consumer business. We are steadily increasing the use of digital media communication to reach our target groups, with particular focus on e-commerce to promote our multichannel strategy. We continue to use conventional media advertising and supporting measures at the point of sale to appeal to private consumers. The importance of sustainability in our relationships with customers and consumers continues to grow. Our customers expect their suppliers to ensure compliance with global environmental, safety, and social standards. Our standards and management systems, our many years of experience in sustainability reporting, and excellent appraisals by external rating agencies all help us to convince our audience of our credentials in this domain. Moreover, the credible implementation of our sustainability strategy strengthens both our brands and the reputation of our company in the marketplace. With our decades of experience in aligning our activities to sustainable development, we are able to position ourselves as a leader in the field and as a partner capable of offering our customers future-viable solutions. And we cooperate closely with our customers in trade and industry in the development and implementation of viable concepts. In order to convey to our customers and consumers the added value of our innovations – best possible performance combined with responsibility toward people and the environment – we use direct product communication supported by more detailed information provided in new media such as electronic newspapers and online platforms, as well as events and campaigns implemented together with our partners. We intend to increase our involvement in the development of appropriate measurement and assessment methods in order to facilitate effective, credible communication of our contributions to sustainability. To this end, we have developed a variety of tools, which are integrated within our “Henkel Sustainability#Master®.” We have launched various projects in collaboration with selected partners to improve and standardize viable measurement and assessment methods. For further information on the products and brands of our three business units, please go to our website at www.henkel.com/brands-and-solutions 88 Group management report Henkel Annual Report 2014 Laundry & Home Care Highlights Sales growth Adjusted 1 operating profit Adjusted 1 return on sales + 4.6 % €749 m 16.2 % organic sales growth adjusted 1 operating profit (EBIT): up 4.8 percent adjusted 1 return on sales (EBIT): up 0.6 percentage points Pril Kraft-Gel Persil Duo-Caps Brightness Plus Vernel Soft & Oils Pril Kraft-Gel is the first dishwashing liquid offering efficacy not only against grease but also starchy residues. The new formula contains enzymes that cut through starch molecules, dissolving even stubborn baked-on residue from pasta, potatoes and rice. New Pril Kraft-Gel was introduced in Western and Eastern Europe, and in Africa/Middle East. Persil Duo-Caps with an improved brightness-plus formula leaves colors brighter and laundry more sparkling clean than before, even at temperatures as low as 20 degrees Celsius. The new formula of Persil Duo-Caps Color also offers even better protection against discoloration of garments. New Persil Duo-Caps was launched in Western and Eastern Europe. www.persil.de Vernel Soft & Oils is the first fabric softener that offers precious essential oils, exceptional freshness and deep-down laundry care with improved softness. The products in this line feature an innovative transparent formula plus a new highquality packaging design. Vernel Soft & Oils was launched in Western and Eastern Europe. www.pril.de 66 Key financials * 2013 in million euros Sales 4,580 Proportion of Henkel sales 2014 4,626 28 % Operating profit (EBIT) 682 Adjusted operating profit (EBIT) 714 +/– 1.0 % 28 % 615 749 Sales development * in percent Change versus previous year Foreign exchange – 9.8 % 4.8 % 1.8 Organic of which price Adjusted return on sales (EBIT) 15.6 % 16.2 % of which volume Return on capital employed (ROCE) 29.4 % 23.4 % – 6.0 pp 507 391 – 22.9 % pp = percentage points * Calculated on the basis of units of 1,000 euros; figures commercially rounded. 1 Adjusted for one-time charges/gains and restructuring charges. 1.0 – 5.4 6.4 13.3 % – 1.6 pp Economic Value Added (EVA ) 2014 Acquisitions / divestments 14.9 % 0.6 pp 67 Adjusted for foreign exchange Return on sales (EBIT) ® www.vernel.de * Calculated on the basis of units of 1,000 euros. 4.6 – 0.5 5.1 89 Group management report 29 Corporate governance 50 Shares and bonds 55 Fundamental principles of the Group 63 Economic report 100 Risks and opportunities report 108 Forecast 109 Subsequent events Economic environment and market position In 2014, the relevant world market for laundry and home care overall remained at the level of the previous year and was characterized by price and promotional competition of further increasing intensity. Nevertheless, our growth significantly outpaced the relevant market again in 2014. As a result, we were able to further strengthen our leadership positions and expand share in our relevant markets. This solid performance was supported in particular by the successful global introduction of our innovations and the success of our strong brands. The mature markets of North America and Europe were particularly strained by fierce price compe tition. The markets in both regions declined, with the submarkets of Western Europe showing widely disparate developments. While the countries of South-West Europe registered strong declines, the markets in France and Germany experienced a slight degree of growth. In this difficult market environment, the Laundry & Home Care business unit successfully defended its overall market share in the mature markets. The trend in the emerging markets was impacted by a difficult political and economic environment in certain regions, and intense price competition. With growth in the mid-single digits, Africa/Middle East in particular was unable to match the level achieved in the previous year due to sustained political unrest. Although the pace of growth in Eastern Europe also remained low, it did improve year on year. Growth in the Latin America market was significantly slower with figures in the low single digits. Overall, we were able to increase our market shares in the emerging markets. Business activity and strategy The Laundry & Home Care business unit is globally active in the laundry and home care Branded Consumer Goods business. The Laundry Care business includes not only heavy-duty and specialty detergents but also fabric softeners, laundry performance enhancers, and other fabric care products. The product portfolio of our Home Care business encompasses hand and automatic dishwashing products, c leaners for bathroom and WC applications, and household, glass and specialty cleaners. We also offer air fresheners and insect control products for household applications in selected regions. Top brands Our aim is to continue generating profitable growth through expansion of our continuing operations and targeted acquisitions. We intend to pursue continuous gains in market share accompanied by improvements to margin. Based on our leading positions in the profitable mature markets, we plan to further expand the share of sales generated from emerging markets, particularly Eastern Europe, Africa/Middle East and Latin America. We intend to leverage the dynamics of these regions in order to drive sustained growth in our Laundry & Home Care business unit. Our goal is to further increase our market share in the emerging markets, and raise profitability to the higher level of the mature markets. Strong brands and innovations that offer added value for consumers provide the basis for our strategy of profitable growth. Accordingly, successful product launches again contributed substantially to our positive business performance in the year under review. Our innovation rate 1 rose above 45 percent in 2014. Through central and efficient management of our innovation process and incisive insights into the purchasing habits of consumers, we are able to identify and respond to consumer trends early on, and convert these into new products more quickly. Prioritizing categories and centrally steering our global brand portfolio helps us to direct our investments specifically toward those segments that offer growth and profitability, enabling us to generate above-average growth with our most important brands and market segments. In 2014, we generated 82 percent of our sales with our top 10 brand clusters. A brand cluster comprises individual global and local brands that share a common brand positioning internationally. By adopting this approach, we generate synergies in our marketing mix. Acquisitions are part of our global strategy. Our aim is to invest in attractive category positions to accelerate our growth in profitable segments. Pursuing this strategy, we strengthened our business in 2014 with the acquisition of a Polish laundry and home care business. The transaction includes detergents and 1 Percentage share of sales generated with new products launched onto the market within the last three years. Over 45 % innovation rate 1. 90 Group management report Henkel Annual Report 2014 fabric softeners under the “E” brand as well as other smaller brands. The business extends mainly across Poland but also includes operations in Russia and other Eastern European countries. Additionally, with our acquisition of the Spotless Group in France, we acquired brands with leading positions in the areas of laundry aids, insect control and household care in established European markets such as France, Italy, Spain and the United Kingdom. In the laundry aids category, the acquisition includes the brands Eau Ecarlate and Dylon, while the Catch brand offers effective solutions in the insect control category. Registering a double-digit increase in sales, the emerging markets were once again the biggest growth driver for Laundry & Home Care in 2014. The Eastern Europe region delivered a solid sales performance in the face of increasing competitive intensity in individual countries. We once again achieved a double-digit increase in sales in the Africa/Middle East region, despite growing political uncertainty and the continuing civil war in Syria. Sales in the Latin America region showed very strong growth, greatly benefiting from the successful performance of the Persil brand, which was introduced there in 2011. Sales in the Asia-Pacific region also registered a very strong increase. Sales and profits Sales 68 in million euros 2010 4,319 2011 4,304 2012 4,556 2013 4,580 2014 4,626 0 + 4.6 % organic sales growth. 1,000 2,000 3,000 4,000 5,000 The Laundry & Home Care business unit achieved solid organic sales growth and a very strong increase in adjusted return on sales in the reporting period, and thus continued its profitable growth trend again in 2014. Organically (i.e. adjusted for foreign exchange and acquisitions/divestments), sales increased by 4.6 percent. This was significantly above the flat overall performance of the relevant markets. Due to the competitive intensity of the market, organic growth was driven by volume. In the following, we comment on our organic sales performance in the regions. Sales in the mature markets remained slightly below the level of the previous year, with performance varying by region. Sales in the North America region decreased in a market environment affected by intense price and promotional competition. Solid sales growth in the Western Europe region compensated for this decline. Adjusted operating profit (EBIT) rose by 4.8 percent, from 714 million euros to 749 million euros. Adjusted return on sales improved by 0.6 percentage points from 15.6 percent in 2013 to an all-time high of 16.2 percent in 2014. Ongoing measures to reduce costs and enhance production and supply chain efficiency enabled us to partially offset the effects on our gross margin exerted by continued strong price and promotional competition and a slight increase in prices for direct materials. Although above the level of the previous year, net working capital as a percentage of sales was again low at –6.6 percent. Return on capital employed (ROCE) decreased versus the prior year to 23.4 percent. The result was impacted by higher restructuring charges, expenses for provisions relating to proceedings by antitrust authorities in Europe, and the capital effect of acquisitions. Economic Value Added (EVA®) came in at 391 million euros, declining versus the previous year by 116 million euros as a result of the aforementioned impacts. 91 Group management report 29 Corporate governance 50 Shares and bonds 55 Fundamental principles of the Group 63 Economic report 100 Risks and opportunities report 108 Forecast 109 Subsequent events Business areas In the following, we comment on the organic sales performance of our business areas. Laundry Care The Laundry Care business posted a solid sales performance in 2014, with our core category of heavy-duty detergents generating the greatest growth momentum. In the strategically important category of premium heavy-duty detergents, we generated particularly dynamic growth through the ongoing success of our innovative pre-dosed liquid detergent capsules. This growth was supported by our new Persil Duo-Caps with brightness-plus formula. The gel capsules release their cleaning power at water temperatures as low as 20 degrees Celsius and better protect clothes against discoloration. The introduction of Duo-Caps under the Losk brand in Russia and Ukraine also proved to be a strong growth driver. These are the first and only laundry capsules available in either market in the mid-price segment. For price-conscious consumers in the value-formoney segment, we successfully launched Purex No Sort, a new detergent variant in North America, which is more effective in preventing color bleeding in loads with mixed colors. The concept was also introduced under other brands in Europe. The specialty detergents category profited from the launch of new Perwoll with ReNew+ Effect in Western Europe. With this innovative formula, new Perwoll not only protects colors from fading but also restores brightness to colors that are already faded. The innovative formula is also more powerful against stains and smoothes rough fibers with every wash. In fabric softeners, growth was stimulated by inno vative Vernel Soft & Oils featuring precious essential oils and a new translucent formula with oil substances. It offers not just improved softness but exceptional fabric care as well. Also contributing to the business unit’s solid performance was the relaunch of the Vernel Aroma Therapy product line and its variants for a freshness that lasts up to eight weeks. Home Care The Home Care business once gain posted very strong sales performance in 2014, primarily attributable to the ongoing success of our WC products. Hand and automatic dishwashing products posted positive performance. In WC products, the success story of Bref Power Aktiv – known in Germany under the WC Frisch brand – continued with the launch of Bref Blue Aktiv. Power balls color the toilet water blue while ensuring hygienic cleanliness and a fresh scent – even between flushes. Bref Blue Aktiv is also tough on limescale deposits. In hand dishwashing products, we strengthened our market position with the introduction of new lines such as Pril Duo-Power and Pril Kraft-Gel Ultra Plus. Both variants feature a new formula with self-activating enzymes that are not only especially powerful on grease, but also more effective in dissolving stubborn crust. Pril Kraft-Gel Ultra Plus also offers stronger, more efficient dissolving power. It effortlessly removes even dried-on food residues without tedious soaking. In automatic dishwashing products, growth was stimulated by the European roll-out of our innovative gel capsules under the Pril and Somat brands, and the introduction of new Somat Gold. The Somat Gold formula is based on innovative enzyme technology and removes all kinds of tough starchy crust. Somat Gold also contains a new ingredient to protect automatic dishwasher filters. Capital expenditures In 2014, we increased capital expenditures for property, plant and equipment to 201 million euros from 153 million euros in the previous year, with the focus on expanding capacity. We committed a disproportionate level of investment to our emerging markets. At our plant in Hungary, for example, we expanded production capacity in anticipation of planned innovations. The biggest single investment in our mature markets was made at our Düsseldorf site in the form of Henkel’s largest automated high-bay warehouse worldwide. 92 Group management report Henkel Annual Report 2014 Beauty Care Highlights Sales growth Adjusted 1 operating profit Adjusted 1 return on sales + 2.0 % €544 m 15.3 % organic sales growth adjusted 1 operating profit (EBIT): up 3.5 percent adjusted 1 return on sales (EBIT): up 0.3 percentage points Schwarzkopf Essence Ultîme BC Bonacure Diadermine N°110 High-performance formulas with luxuriant pearl essence combine the expert knowledge of beauty icon Claudia Schiffer with the outstanding hair expertise of Schwarzkopf. Essence Ultîme repairs the interior of the hair cells to restore their natural elasticity. Schwarzkopf Professional’s BC Bonacure professional hair care treatment with patented Cell Perfector technology fully replenishes damaged hair from within, for 100 percent elasticity, strength and resilience – a new level of hair perfection . The first anti-aging line from Diadermine, which celebrates 110 years of dermatological expertise. The key ingredient in all products is 110 drops of an advanced concentrate designed to activate 11 signs of younger skin – for a radiant, youthful look. www.essence-ultime.co.uk www.schwarzkopf-professional.com 69 Key financials * 2013 in million euros Sales 3,510 Proportion of Henkel sales 2014 3,547 21 % Operating profit (EBIT) 474 Adjusted operating profit (EBIT) 525 +/– 1.0 % 22 % 421 544 Sales development * in percent Change versus previous year Foreign exchange – 11.2 % 3.5 % 2.3 Organic 2.0 of which price Adjusted return on sales (EBIT) 15.0 % 15.3 % of which volume Return on capital employed (ROCE) 23.6 % 18.3 % – 5.3 pp 323 226 – 30.2 % pp = percentage points * Calculated on the basis of units of 1,000 euros; figures commercially rounded. 1 Adjusted for one-time charges/gains and restructuring charges. 1.0 – 3.3 4.3 11.9 % – 1.6 pp Economic Value Added (EVA ) 2014 Acquisitions / divestments 13.5 % 0.3 pp 70 Adjusted for foreign exchange Return on sales (EBIT) ® www.diadermine.com * Calculated on the basis of units of 1,000 euros. – 2.0 93 Group management report 29 Corporate governance 50 Shares and bonds 55 Fundamental principles of the Group 63 Economic report 100 Risks and opportunities report 108 Forecast 109 Subsequent events Economic environment and market position In 2014, growth in the relevant world cosmetics market slowed once again. Important markets stagnated or declined, and were characterized by intensified crowding-out competition. Despite this difficult and highly competitive market environment, the Beauty Care business unit was able to secure further market share gains and continued to strengthen its leadership position in its relevant markets. Our Branded Consumer Goods business encountered particular market weakness in Western Europe and North America. In Western Europe, persistently difficult economic conditions led to an environment marked by even more intense promotional activity, increased price pressure, and lower average prices. Despite this challenging market environment, we nonetheless succeeded in outperforming the market overall, enabling us to gain market share. The emerging markets in Africa/Middle East and Asia (excluding Japan) continued to grow, but at a slower pace. The markets in Latin America stagnated in the reporting year. In Eastern Europe, markets posted moderate growth, impacted by difficult underlying conditions and further intensified crowding-out competition. Thanks to the successful international launch of several product innovations, we were able to generate above-average growth in the emerging markets and achieve significant gains in market share. In the Hair Salon business, continued customer restraint led to further market decline. In this difficult environment, we outperformed the markets relevant to us and strengthened our position as the world number three in the hair salon market. Business activity and strategy The Beauty Care business unit is active in the Branded Consumer Goods business area with Hair Cosmetics, Body Care, Skin Care and Oral Care, as well as in the professional Hair Salon business area. In the Branded Consumer Goods business, we want to continue expanding our innovation leadership in the mature markets in order to further grow our share. To this end, we pursue a consistent, pro-active innovation strategy, accompanied by strict cost management to allow us to step up our market investments and increase profitability. We are driving business development in our emerging markets by expanding our portfolio. In the Hair Salon business, we are continuing our globalization strategy, with particular focus on stimulating our emerging markets. Top brands Organic growth is at the center of our growth strategy. We drive this strategy by focusing on our top brands, ensuring the rapid international launch of innovations with above-average profitability, and by selectively pursuing regional expansion. Further key success factors include strong support for our top brands through focused media and promotional activities. We regularly analyze our businesses and brands as part of our pro-active portfolio management approach. In our Branded Consumer Goods business, our focus is on the international expansion of our core businesses of Hair Cosmetics, Body Care, Oral Care and Skin Care. Our growth strategy is aligned to continuously strengthening our top brands. Based on the specific steps we have taken, we were able to further strengthen our top 10 brands. In 2014, they grew at a faster rate than the overall portfolio, and once again accounted for more than 90 percent of sales. In addition to strengthening our top brands, we focus particularly on the growth potential available in our key accounts. We also continue to expand our Hair Salon business through product innovations and efficient sales and distribution structures while taking advantage of new regional opportunities. Through our concerted innovation strategy and consistent strengthening of our top brands, we want to continue generating dynamic, profitable growth. In 2014, we again set new standards in the market with our innovation rate 1 of over 45 percent. And we are developing additional growth potential through the expansion of strategic partnerships with our customers. 1 Percentage share of sales generated with new products launched onto the market within the last three years. Over 45 % innovation rate 1. 94 Group management report Henkel Annual Report 2014 We supplement organic growth with acquisitions. In line with our strategy, we have expanded our portfolio in attractive categories. We acquired the hair cosmetics brand Pert in Latin America in the Branded Consumer Goods business. With the acquisition of US companies Sexy Hair, Kenra and Alterna, we have effectively further expanded our position in the North American market. Sales and profits Sales 71 in million euros 2010 3,269 2011 3,399 2012 3,542 2013 3,510 2014 3,547 0 + 2.0 % organic sales growth. 1,000 2,000 3,000 4,000 The Beauty Care business unit achieved solid organic sales growth and a solid increase in adjusted return on sales in the reporting period, thus continuing to build on the profitable growth of the previous years. Organically (i.e. adjusted for foreign exchange and acquisitions/divestments), sales increased by 2.0 percent. Organic growth was again considerably higher than growth in our relevant markets, and was achieved through volume increases. Despite fiercer crowding-out competition driven by price and promotional pressure, we were able to hold our prices stable. As in previous years, our strong innovation program provided the foundation for this success. Despite political instability, we posted very strong growth in the Africa/Middle East region and solid growth in the Eastern Europe region. Sales declined in the Latin America region, primarily due to the difficult market situation in Venezuela. Organic sales were slightly lower in the mature markets. In the Western Europe region, we were able to post a positive sales performance despite market stagnation and, in some cases, market contraction. However, sales in the mature markets of the AsiaPacific and North America regions fell short of the previous year’s level. Adjusted operating profit increased in the reporting period by 3.5 percent versus the prior year, to 544 million euros, our highest earnings figure to date. Adjusted return on sales rose by 0.3 percentage points to 15.3 percent, likewise a new high. Our innovation initiatives and ongoing measures to reduce costs and enhance production and supply chain efficiency enabled us to partially offset the effects on our gross margin exerted by increasingly intense promotional competition. Prices for direct materials stabilized at the level of the previous year. Meanwhile, ongoing optimization of our cost structures contributed to the increase in profitability. Although higher than in the previous year, net working capital as a percentage of sales remained low at 1.3 percent. Return on capital employed (ROCE) decreased versus the prior year to 18.3 percent. The result was impacted by higher restructuring charges, expenses for provisions relating to proceedings by antitrust authorities in Europe, and the capital effect of acquisitions. Economic Value Added (EVA®) came in at 226 million euros, declining versus the previous year by 97 million euros as a result of the aforementioned impacts. Business areas In the following, we comment on our organic sales performance in the regions. From a regional perspective, business performance was particularly strong in the emerging markets. Asia (excluding Japan) matched the successes of previous years, achieving double-digit growth driven to a significant degree by our business in China. In the following, we comment on the organic sales performance of our two business areas. Branded Consumer Goods Our Branded Consumer Goods business posted another solid increase in sales in 2014. The Hair Cosmetics business performed especially well, with 95 Group management report 29 Corporate governance 50 Shares and bonds 55 Fundamental principles of the Group 63 Economic report 100 Risks and opportunities report 108 Forecast 109 Subsequent events above-average sales growth and another high mark in market share. Growth was driven, in particular, by successful innovations under our Schwarzkopf and Syoss brands. our first high-performance antiperspirant for sensitive skin that combines five essential benefits. The innovative formula detects sweat as it appears, and protects for up to 72 hours. In Hair Colorants, we were able to reach new audiences with Schwarzkopf Nectra Color as our first permanent caring hair colorant without ammonia to feature floral nectar, botanical oils and an exclusive floral scent. This innovation offers intense color and exceptional care resulting in up to 90 percent less hair breakage. The nourishing, ammonia-free color of Palette Perfect Gloss provides optimal gray coverage, maximum color intensity, and glossy color reflection for up to eight weeks. In the Skin Care business, we generated strong sales momentum with the Diadermine brand, thanks to innovations in the anti-aging segment. The key driver was Diadermine N°110, an anti-aging line that underscores the brand’s 110 years of dermatological expertise. Each product contains 110 drops of an advanced elixir made from 11 anti-aging ingredients, and activates 11 signs of youthful skin. In the Hair Care business, the introduction of the Essence Ultîme brand was a major growth driver. This brand was exclusively developed with beauty icon Claudia Schiffer. The new high-performance formulas with luxurious pearl essence repair the interior of the hair cells, restoring the hair’s natural elasticity. The Gliss Kur brand generated momentum with the successful launch of Gliss Kur Million Gloss – our first hair repair treatment for up to 10 days of radiant shine with millions of vibrant reflections. Syoss Keratin Hair Perfection and Style Perfection provided further proof of the professional performance that comes with Syoss. These products contain 80 percent more keratin for optimum hair strengthening and repair. In the Hair Styling business, Taft Invisible Power was introduced as the first Taft product offering a unique combination of invisible styling and mega-strong hold for up to 24 hours. The new Got2b rise ’n shine line combines unique textures with volume and shine. Under the brand Smooth ’N Shine, Schwarzkopf launched its first line of care, styling and relaxer products developed specifically for the needs of afrotextured hair. The Body Care business benefited from strong innovations. Under the Fa brand, we introduced the Fa Floral Protect line of antiperspirants with appealing floral fragrances and strong, 48-hour protection. We also created Fa Vitalize & Power, a line of shower gels with vitamins for an especially refreshing feeling. The vitamin concept was also introduced under the Dial brand. With Right Guard Protect 5, we launched In Oral Care, new Theramed 2in1 Complete Plus provides everything needed for teeth and gums. The innovative formula remineralizes tooth enamel and helps prevent cavities, plaque and tartar. Meanwhile, the formula found in Vademecum Full Mouth Protect is enhanced with eucalyptus and green tea to clean the entire mouth. Hair Salon Although sales in our Hair Salon business were lower year on year due to the persistently difficult market situation, we nevertheless outperformed the market of relevance to us. We were therefore able to further strengthen our position as number three in the world. Schwarzkopf Professional once again added stimulus to the hair care market with the relaunch of BC Bonacure. Our patented Cell Perfector technology fills damaged areas in the hair surface, closing the gap to hair perfection. For textured looks, Schwarzkopf Professional introduced Osis+ Wax Dust, a high- performance styling product with a unique powderto-wax consistency that creates a matte texture while leaving a pleasant, natural feel to the hair. Capital expenditures Investments in property, plant and equipment amounted to 68 million euros compared to 63 million euros in the previous year. The investments focused on new high-speed production facilities and colorant lines at our plants in Germany and Slovenia. The new production site in Russia was further expanded, and we also invested in building a new research and development center in Slovenia. 96 Group management report Henkel Annual Report 2014 Adhesive Technologies Highlights Sales growth Adjusted 1 operating profit + 3.7 % €1,402 m 17.2 % organic sales growth adjusted 1 operating profit (EBIT): up 2.3 percent adjusted 1 return on sales (EBIT): up 0.3 percentage points Bonderite magnesium coating New technology platform Loctite TAF Henkel has developed a protective electroceramic coating for magnesium that can be used, for example, to coat light metals in mobile devices. This innovative technology offers outstanding protection against corrosion, friction and wear. It also enables product weight savings and efficiency improvements in the manufacturing process. An innovative technology toolbox enables synthetic polymers to be replaced by renewable raw materials. This allows a variety of materials such as liquid applied sound deadeners from Teroson to be specifically tailored to each application. These acoustic solutions weigh up to 30 percent less than synthetic dampening products while providing the same or better vehicle performance. The flexible heat-absorbing films from the Loctite TAF series lower the processor and housing temperature of mobile devices by more than 3 degrees Celsius. They therefore improve design flexibility and device performance while enhancing user comfort. www.henkel-adhesives.com Adjusted 1 return on sales www.henkel.com/electronics www.henkel-adhesives.com 72 Key financials * 2013 in million euros Sales 8,117 Proportion of Henkel sales 2014 8,127 49 % 50 % Operating profit (EBIT) 1,271 Adjusted operating profit (EBIT) +/– 0.1 % 1,345 Sales development * in percent Change versus previous year Foreign exchange 5.9 % Adjusted for foreign exchange Acquisitions / divestments 1,370 1,402 2.3 % Organic 73 2014 0.1 – 3.5 3.6 – 0.1 3.7 Return on sales (EBIT) 15.7 % 16.6 % 0.9 pp of which price 1.0 Adjusted return on sales (EBIT) 16.9 % 17.2 % 0.3 pp of which volume 2.7 Return on capital employed (ROCE) 18.8 % 19.8 % 1.0 pp Economic Value Added (EVA ) ® 562 597 6.2 % pp = percentage points * Calculated on the basis of units of 1,000 euros; figures commercially rounded. 1A djusted for one-time charges/gains and restructuring charges. * Calculated on the basis of units of 1,000 euros. 97 Group management report 29 Corporate governance 50 Shares and bonds 55 Fundamental principles of the Group 63 Economic report 100 Risks and opportunities report 108 Forecast 109 Subsequent events Economic environment and market position The economic environment for the Adhesive Technologies business unit was characterized by moderate growth in our relevant markets. Economic growth was lower than initially forecasted, particularly in the emerging markets but also in the mature markets of North America and Western Europe. Performance in the relevant industrial segments also remained below expectations. Private demand weakened slightly versus the previous year. In these difficult underlying conditions, the Adhesive Technologies business unit exceeded overall growth in the markets of relevance, thus extending its leading position in the world market. Business activity and strategy The Adhesive Technologies business unit is a leading solution provider worldwide for adhesives, sealants and functional coatings in two business segments: Industry, and Consumers, Craftsmen and Building. Through our comprehensive technology portfolio, a global team of experts with close contact to our customers, and our global presence, we provide tailormade solutions that create sustainable value for our customers. Our scale enables us to leverage our technologies, structures, and systems across all regions and business areas, facilitating efficient creation and delivery of our customized solutions. Based on these strong synergies, the acquisition of leading technologies that complement our portfolio represents an attractive option for further profitable business expansion. Our recent acquisitions demonstrate our ability to consistently integrate newly acquired businesses quickly and successfully on the basis of our standardized business processes. In the Packaging and Consumer Goods Adhesives business area, we work with major international customers to develop innovative solutions for the production of food packaging and consumer goods. Our customers benefit from our comprehensive applications expertise made available globally through our technical customer service. Strategic partnerships along the value chain make a significant contribution to creating more value for our customers. In the Transport and Metal business area, we provide the automotive, aircraft, and metal processing industries with outstanding system solutions and special- ized technical services. Our customers are major international manufacturers and suppliers. Through our early involvement in our customers’ design and development processes, we are able to provide innovative, customized solutions to new challenges – for example, in lightweight construction. Our tailormade products and services are based on our comprehensive technology portfolio and global applications expertise along our customers’ entire value chain. In the General Industry business area, we offer a comprehensive portfolio of products for the manufacture and maintenance of durable goods. Our customers range from household appliance manufacturers through to operators of large-scale industrial plant, and service specialists operating in all branches of industry. In addition to providing direct support for our industrial customers, we can also tap into a strong global network of trained distribution partners. Regular training programs for users and the joint development of new adhesive solutions are important drivers of growth and differentiation. Our Electronics business area offers customers from the electronics industry worldwide a comprehensive portfolio of innovative high-technology adhesives and materials for the manufacture of microchips and electronic assemblies. We combine our expertise with substantial investments in our technology portfolio to develop innovative solutions for both current and future product generations. Our global presence enables us to collaborate closely with development centers of major electronics firms while providing intensive support for production processes. Our Adhesives for Consumers, Craftsmen and Building business area markets a wide range of brand-name products for private, trade and construction users. We offer innovative products and specialized system solutions based on our strong brand platforms, quickly and efficiently converting the latest technological developments from our industrial business into corresponding products for consumers, craftsmen and the building industry. Our distribution networks are aligned to the different target groups. Active portfolio management plays a central role in continuing our profitable growth, with targeted resource investments based on defined strategic priorities. We invest primarily in strengthening organic growth in particularly attractive emerging markets, but also in growth through acquisitions. Top brands 98 Over Group management report 30 % innovation rate 1. + 3.7 % organic sales growth. Henkel Annual Report 2014 We drive organic growth by continuing to expand our innovation and technology leadership. In 2014, we increased the proportion of sales from products successfully launched onto the market in the last five years to over 30 percent. Our innovation strategy, which we continued to develop in the reporting period, plays an important role in delivering our business objectives and includes specially developed programs, processes, and people initiatives. The innovation program includes a systematic search for new technologies and business opportunities, targeted development of new business ideas, and close collaboration with strategic suppliers. Sustainability is also an important driver of growth and innovation. Working closely with our customers and suppliers is the key to advancing sustainability along the entire value chain. Sales and profits We drive the globalization of our businesses through accelerated expansion of the strong positions we hold in emerging markets. We accomplish this by continuously investing in capacity expansion, and by strengthening our teams both quantitatively and qualitatively in order to provide our customers with outstanding service at the local level. In the mature markets of North America and Europe, we primarily aim to strengthen our leading market positions and further leverage economies of scale. Adhesive Technologies continued its profitable growth path again in 2014, achieving a solid increase in organic sales and a solid improvement in adjusted return on sales. Organically (i.e. adjusted for foreign exchange and acquisitions / divestments), sales grew by 3.7 percent overall, outperforming the market as a whole. This was achieved through increases in both price and volume. Our active portfolio management, leverage of scale economies, strong position in emerging markets, and strict cost management contributed to this performance. We are maintaining our rigorous focus on our strong brands. The consolidation of our brand portfolio is nearly complete. We have structured our industrial business under the brands Loctite, Bonderite, Technomelt, Teroson and Aquence – each of which represents a group of specific technologies and applications – to facilitate customer navigation through our portfolio. The consumer business is arranged around our four brand platforms: Loctite, Pritt, Pattex and Ceresit. In 2014, sales generated by our top 10 brands represented 80 percent of total revenues. As part of our acquisition strategy, we further strengthened our portfolio in 2014 with the purchase of The Bergquist Company and expanded our strong positions in the growing electronics market. Sales 74 in million euros 2010 7,306 2011 7,746 2012 8,256 2013 8,117 2014 8,127 0 2,500 5,000 7,500 10,000 In the following, we comment on our organic sales performance in the regions. In the emerging markets, we were able to generate another strong sales increase over the previous year. The highest rate of growth among these markets was achieved by the Africa/Middle East region with a double-digit rise in sales. Sales growth in Asia (excluding Japan) was very strong, accompanied by a strong increase in sales in the Latin America region. Performance in the Eastern Europe region was also solid overall, despite the difficult political situation and subsequent deterioration in the economic conditions prevailing in parts of the region. Sales performance in the mature markets was positive as a whole. While sales in the North America region fell short of the previous year’s level, the mature markets of the Asia-Pacific region achieved solid growth and our business performance in the Western Europe region was positive. 1 Percentage share of sales generated with new products launched onto the market within the last five years. 99 Group management report 29 Corporate governance 50 Shares and bonds 55 Fundamental principles of the Group 63 Economic report 100 Risks and opportunities report 108 Forecast 109 Subsequent events Adjusted operating profit increased to 1,402 million euros, its highest level ever. Adjusted return on sales reached a new annual high of 17.2 percent with an increase by 0.3 percentage points year on year, driven by a very strong margin improvement in the segment Industrial Adhesives. Adjusted return on sales in the segment Adhesives for Consumers, Craftsmen and Building declined mainly due to significant devaluation of important currencies against the euro. Although rising prices for direct materials burdened the business unit’s gross margin, these effects were partly offset by price adjustments as well as ongoing measures to reduce costs and enhance production and supply chain efficiency. Although above the level of the previous year, net working capital as a percentage of sales remained low at 12.2 percent. Return on capital employed (ROCE) improved again, by 1.0 percentage points to 19.8 percent. Economic Value Added (EVA®) reached 597 million euros, increasing by 35 million euros over the prior year. Business areas In the following, we comment on the organic sales performance of our business areas. Industrial Adhesives The Packaging and Consumer Goods Adhesives business area posted another increase in sales versus the previous year, with business performance solid overall. Our adhesives for furniture and building components provided strong momentum, as did adhesives for the production of flexible laminates. Our food safe packaging initiative – previously limited to Europe and now extended to North America – contributed to this performance. We likewise posted a solid increase in sales in our Transport and Metal business area. The highest rates of growth were generated by our solutions for the automotive industry. Close cooperation with our customers and the innovations resulting from this were once again key drivers of growth. For example, in cooperation with automobile manufacturer Ford, we developed a tailor-made solution for the surface treatment of the Ford F150 auto body. The new technology makes it possible to use a much higher ratio of aluminum in the car body, supporting the trend toward lightweight construction. We achieved our highest revenue growth in the General Industry business area. Sales here showed a very strong increase year on year, due mainly to business involving customers in the industrial assembly markets and also the vehicle repair and maintenance sector. We were able to generate innovation-led momentum with the global market launch of a new hybrid adhesive under the Loctite brand that combines the key features of structural and instant adhesives in a single product. Sales in the Electronics business area also increased year on year. Drivers of our solid business performance here included strong growth in products for semiconductor manufacturing and increased sales to customers in the consumer electronics industry. We achieved additional growth through the introduction of new customer-specific solutions for mobile devices – such as the flexible TAF heat-absorbing films from Loctite. Adhesives for Consumers, Craftsmen and Building Sales performance in the Adhesives for Consumers, Craftsmen and Building business area was solid year on year. Business with the building industry and with products for household and repair applications registered above-average growth. Contributors to this positive performance included relevant innovations under our top brand Pritt that also served to reaffirm our leading role in sustainability. Capital expenditures In 2014, our capital expenditures for property, plant and equipment amounted to 176 million euros following 181 million euros in the previous year. The focus remained on further expanding our manufacturing capacity and increasing production efficiency. Investments in the reporting period centered on the construction and expansion of our multi-technology sites in China and Turkey. 100 Group management report Risks and opportunities report Risks and opportunities In the pursuit of our business activities, Henkel is exposed to multiple risks inherent in the global market economy. We deploy an array of effective monitoring and control systems aligned to identifying risks at an early stage, evaluating the exposure, and introducing effective countermeasures. We have incorporated these instruments within a risk management system as described below. Entrepreneurial activity also involves identifying and exploiting opportunities as a means of securing and extending the corporation’s competitiveness. The reporting aspect of our risk management system, however, does not encompass entrepreneurial opportunity. Early and regular identification, analysis and exploitation of opportunities is performed at the Group level and within the individual business units. This is a fundamental component of our strategy. We perform in-depth analysis of the markets and our competitors, and study the relevant cost variables and key success factors. Risk management system The risk management system at Henkel is integrated into the comprehensive planning, controlling, and reporting systems used in the subsidiaries, in the business units, and at Group level. Our early warning system and Internal Audit function are also important components of our risk management system. Within the corporate governance framework, our internal control and compliance management systems support our risk management capability. The risk reporting system encompasses the systematic identification, evaluation, documentation and communication of risks. We have defined the principles, processes and responsibilities relating to risk management in a corporate standard that is binding on the Henkel Group. With the continuous development of our corporate standards and systems, we take into account updated findings. Within our risk strategy framework, the assumption of calculated risk is an intrinsic part of our business. Henkel Annual Report 2014 However, risks that endanger the existence of the company must be avoided. When it is not possible to avoid these critical risks, they must be reduced or transferred, for example through insurance. Risks are controlled and monitored at the level of the subsidiaries, the business units, and the Group. Risk management is thus performed with a holistic, integrative approach to the systematic handling of risks. We understand risks as potential future developments or events that could lead to negative deviations from our guidance. Risks with a probability of occurrence of over 50 percent are taken into account in our guidance and short-term planning. As a rule, we estimate risks for the one-year forecast period. The annual risk reporting process begins with identifying material risks using checklists based on defined operating (for example procurement and production) and functional (for example information technology and human resources) risk categories. We evaluate the risks in a two-stage process according to the probability of occurrence and potential loss. Included in the risk report are risks with a loss potential of at least 1 million euros or 10 percent of the net external sales of a country, where the probability of occurrence is considered greater than zero. We initially determine the gross risk and subsequently the net risk after taking countermeasures into account. Initially, risks are compiled on a decentralized, percountry basis, with the assistance of regional coordinators. The locally collated risks are then analyzed by experts in the business units and corporate functions. In particular areas such as Corporate Treasury, risks are determined with the support of sensitivity analyses including value-at-risk computations. Risk analyses are then prepared for the respective executive committees of the business units and corporate functions, and finally assigned to an area-specific risk inventory. The risk situation is subsequently reported to our Compliance & Risk Committee, the Management Board and the various supervising boards. Material unforeseen changes are reported immediately to the CFO and the Compliance & Risk Committee. Corporate Accounting is responsible for coordinating the overall process and analyzing the inventoried exposures. 101 Group management report 29 Corporate governance 50 Shares and bonds 55 Fundamental principles of the Group 63 Economic report 100 Risks and opportunities report 108 Forecast 109 Subsequent events The risk reporting process is supported by a web-based database which ensures transparent communication throughout the entire Group. Our Internal Audit function regularly reviews the quality and function of our risk management system. Within the framework of the 2014 audit of our annual financial statements, our external auditor examined the structure and function of our risk early warning system in accordance with Section 317 (4) of the German Commercial Code [HGB] and confirmed its compliance. The following describes the main features of the internal control and risk management system in relation to our accounting processes, in accordance with Section 315 (2) no. 5 HGB. Corresponding with the definition of our risk management system, the objective of our accounting processes lies in the identification, evaluation and management of all risks that jeopardize the regulatory preparation of our annual and consolidated financial statements. Accordingly, the internal control system’s function is to implement relevant principles, procedures and controls so as to ensure the financial statement closing process is regulatory compliant. Within the organization of the internal control system, the Management Board assumes overriding responsibility at Group level. The duly coordinated subsystems of the internal control system lie within the responsibility of the Corporate Accounting, Controlling, Corporate Treasury, Compliance and Regional Finance functions. Within these functions, there are a number of integrated monitoring and control levels. These are assessed by regular and comprehensive effectiveness tests performed by our Internal Audit function. Of the multifaceted control processes incorporated into the accounting process, several are important to highlight. The basis for all our accounting processes is provided by our corporate standard “Accounting,” which contains detailed accounting and reporting instructions covering all material circumstances, including clear procedures for inventory valuation or how transfer prices applicable for intra-group transactions should be determined. This corporate standard is binding on the entire Group and is regularly updated and approved by the CFO. The local Presidents and Heads of Finance of all consolidated subsidiaries must confirm their compliance with such corporate standards on an annual basis. Further globally binding procedural instructions affecting our accounting practice are contained in our corporate standards “Treasury” and “Investments.” Through appropriate organizational measures in conjunction with restrictive access to our information systems, we ensure segregation of duties in our accounting systems between transaction entry on the one hand, and checking and approval on the other. Documentation relating to the operational accounting and closing processes ensures that important tasks – such as the reconciliation of receivables and payables on the basis of account balance confirmations – are clearly assigned. Additionally, binding authorization regulations exist governing the approval of contracts, credit notes and the like, with strict adherence to the principle of dual control as a mandatory requirement. This is also stipulated in our Group-wide corporate standards. The significant risks for Henkel and the corresponding controls with respect to the regulatory preparation of our annual and consolidated financial statements are collated in a central documentation pack. This documentation is reviewed and updated annually by the respective process owners. The established systems are regularly reviewed with regard to their improvement and optimization potential. We consider these systems to be appropriate and effective. The accounting activities for subsidiaries included in the consolidated financial statements are performed either locally by the subsidiary or through a shared service center, taking the corporate standards into account. The individual subsidiaries’ financial statements are transferred to our central consolidation system and checked at corporate level for correctness. After all consolidation steps have been completed, the consolidated financial statements are prepared by Corporate Accounting in consultation with the specialist departments. Preparation of the Group management report is coordinated by Investor Relations in cooperation with each business unit and corporate function. The Management Board then compiles the Group management report and consolidated financial statements, as well as the management report and annual financial statements of Henkel AG & Co. KGaA, and subsequently presents these documents to the Supervisory Board for approval. 102 Group management report Henkel Annual Report 2014 75 Major risk categories Risk category Probability Potential financial impact Operating risks Procurement market risks Low Major Production risks Moderate Major Macroeconomic and sector-specific risks High Major Credit risk Low Major Liquidity risk Low Minor Currency risk Moderate Major Interest rate risk Moderate Minor Risks from pension obligations High Minor Legal risks Low Major IT risks Low Major Personnel risks High Minor Risks in connection with our brand image or reputation of the company Low Major Environmental and safety risks Low Major Moderate Moderate Functional risks Financial risks Business strategy risks Classification of risks in ascending order 76 Probability Low Moderate High 1 – 9 % 10 – 24 % ≥ 25 % Potential financial impact Minor 1 – 49 million euros Moderate 50 – 99 million euros Major ≥ 100 million euros passed on in full, we see risks arising beyond the forecasted stability in relation to important raw materials and packaging materials. The segments in the industrial goods sector are affected to a greater extent by these price risks than the individual segments in the consumer goods sector. Additional price and supply risks exist due to possible demand or production-related shortages in the procurement markets. In particular, continued unrest in the Africa/Middle East region, and the conflict between Russia and Ukraine, could lead to rising material prices and supply shortages. Major risk categories Risks are presented from a net perspective, where their respective mitigation measures are taken into account. Operating risks Procurement market risks Description of risk: We expect the prices for direct materials to remain essentially stable in our procurement markets in 2015. However, due to geopolitical, global economic, and climatic uncertainties, we expect prices to fluctuate in the course of the year. As a result of this uncertainty as it relates to the development of raw material prices that cannot always be Measures: The measures taken include active supplier portfolio management through our globally engaged, cross-divisional sourcing capability, together with strategies aimed at securing price and volume both through contracts and, where appropriate and possible, through financial hedging instruments. Furthermore, we work in interdisciplinary teams within Research and Development, Supply Chain Management and Purchasing on devising alternative formulations and packaging forms so as to be able to respond flexibly to unforeseen fluctuations in raw material prices. We also avoid becoming dependent on individual suppliers so as to better secure the constant supply of the goods and services that we require. Finally, close collaboration with our 103 Group management report 29 Corporate governance 50 Shares and bonds 55 Fundamental principles of the Group 63 Economic report 100 Risks and opportunities report 108 Forecast 109 Subsequent events strategic suppliers plays an exceptionally important role in our risk management. Further details regarding the assessment of supplier financial stability can be found in the section on “Procurement” on pages 77 to 79. The basis for our risk management approach is a comprehensive procurement information system aimed at ensuring permanent transparency with respect to our purchasing volumes. Impact: Low probability rating, possible major impact on our earnings guidance. Production risks Description of risk: Henkel faces production risks in the event of low capacity utilization due to volume decreases and unplanned operational interruptions, especially at our single-source sites. Measures: We can offset the negative effects of possible production outages through flexible production control and, where economically viable, insurance policies. Such production risks are minimized by ensuring high employee qualification, clearly defined safety standards, and regular plant and equipment maintenance. Capital expenditure decisions on property, plant and equipment are made in accordance with defined, differentiated responsibility procedures and approval processes. They incor porate all relevant specialist functions and are regulated in an internal corporate standard. Investments are analyzed in advance on the basis of detailed risk aspects. Further auditing accompanying projects provides the foundation for project management and risk reduction. Impact: Moderate probability rating, possible major impact on our earnings guidance. Macroeconomic and sector-specific risks Description of risk: We remain exposed to macroeconomic risks emanating from the uncertainties of the current geopolitical and economic environment. We currently see geopolitical risk emanating particularly from the Eastern Europe region as a result of the conflict between Russia and Ukraine, and from the Africa/Middle East region. A decline in the macroeconomic environment poses a risk to the industrial sector in particular. A downturn in consumer spending is relevant for the consumer goods segments. A further significant risk is posed by an increasingly competitive environment, as this could result in stronger price and promotional pressures in the consumer goods sector. As consolidation in the retail sector continues and private labels occupy a growing share of the market, crowding-out competition in the consumer goods sector could intensify. The risk of product substitution inherent in this could, in principle, affect all business units. Measures: We focus on continuously strengthening our brands (see separate risk description on pages 105 and 106) and consistently developing further innovations. We consider innovative products to be a significant success factor for our company, enabling us to differentiate ourselves from the competition. Furthermore, we also pursue specific sales and marketing initiatives, for example advertising and promotional activities. In addition, we have the capability to react quickly to potential sales declines through flexible production control. Impact: High probability rating, possible major impact on our sales and earnings guidance. 104 Group management report Functional risks Financial risks Description of risk: Henkel is exposed to financial risk in the form of credit risks, liquidity risks, currency risks, interest rate risks, and risks arising from pension obligations. For the description of credit risks, liquidity risks, currency risks and interest rate risks, please refer to the notes to the consolidated financial statements on pages 157 to 162. For the risks arising from our pension obligations, please see pages 144 and 145. Measures: Risk-mitigating measures and the management of these risks are also described in the notes to the consolidated financial statements on the pages mentioned. Impact: We classify financial risks as follows: • Credit risk with a low probability of a major impact on our earnings guidance • Liquidity risk with a low probability of a minor impact on our earnings guidance • Currency risk with a moderate probability of a major impact on our earnings guidance • Interest rate risk with a moderate probability of a minor impact on our earnings guidance • Risks arising from our pension obligations with a high probability of a minor impact on our earnings guidance, and with a high probability of a major impacton our equity Legal and regulatory risks Description of risk: As a globally active corporation we are exposed, in the course of our ordinary business activities, to a range of risks relating to litigations and other actions, including government agency proceedings in which we are currently involved or may become involved in the future. These risks arise, in particular, in the fields of product liability, product deficiency, competition and cartel law, infringement of proprietary rights, patent law, tax law, environmental protection and soil contamination. We cannot rule out the likelihood of negative rulings on current litigations and further litigations being initiated in the future. Our business is subject to various national rules and regulations and – within the European Union (EU) – increasingly to harmonized pan-European laws. In addition, some of our operations are subject to rules and regulations derived from approvals, licenses, certificates or permits. Our manufacturing operations are Henkel Annual Report 2014 bound by rules and regulations with respect to the registration, evaluation, usage, storage, transportation and handling of certain substances and also in relation to emissions, wastewater, effluent and other waste. The construction and operation of production facilities and other plant and equipment are governed by framework rules and regulations, including those relating to the decontamination of soil. Violation of such regulations may lead to legal proceedings or compromise our future business activities. Measures: Our internal standards, guidelines, codes of conduct, and training measures are geared to ensuring compliance with statutory regulations and, for example, the safety of our manufacturing facilities and products. These requirements have also been incorporated into our management systems and are regularly audited. Ensuring compliance with laws and regulations is an integral component of our business processes. This includes the early monitoring and evaluation of relevant statutory and regulatory requirements and changes. Henkel has established a Group-wide compliance organization with locally and regionally responsible compliance officers led by a globally responsible General Counsel & Chief Compliance Officer (for detailed information, see the corporate governance report on pages 29 to 37). In addition, our corporate legal department maintains constant contact with local counsel. Current proceedings and potential risks are recorded in a separate reporting system. For certain legal risks, we have concluded insurance policies that are standard for the industry and that we consider to be appropriate. However, the outcome of proceedings is inherently difficult to foresee, especially in cases in which the claimant is seeking substantial or unspecified damages. In view of this, we are unable to predict what obligations may arise from such litigations. Consequently, major losses may result from litigations and proceedings that are not covered by our insurance policies or provisions. Impact: Low probability rating, possible major impact on our earnings guidance. Information technology risks Description of risk: Information technology has strategic significance for Henkel. Our business processes rely to a great extent on IT services, applications, networks, and infrastructure systems. The failure or disruption of critical IT services and the loss of confidential data constitute material risks for Henkel. The failure of computer networks or disruption of important IT applications can impair critical 105 Group management report 29 Corporate governance 50 Shares and bonds 55 Fundamental principles of the Group 63 Economic report 100 Risks and opportunities report 108 Forecast 109 Subsequent events business processes. The loss of confidential data, for example formulations, customer data or price lists, could benefit our competition. Henkel’s reputation could also be damaged by such loss. Measures: Henkel’s information security strategy is based on the international standards ISO 27001 and 27002. Major components include the classification of information, business processes, IT applications, and IT infrastructure safeguards with respect to confidentiality, availability, integrity, and data protection requirements, as well as measures for avoiding risk. Our critical business processes operate through redundantly configured systems designed for high availability. Our data backup procedures reflect stateof-the-art technology and practice. We regularly review our restore and disaster-recovery processes. We develop our systems using proven project management and p rogram modification procedures. Access to buildings and areas containing IT systems, access to computer networks and applications, as well as user authorizations for our information systems, are strictly limited to the minimum level necessary. For critical business processes, the required segregation of duties is enforced by technological means. context, we are acutely aware of the effects of demographic change in many of our markets. The change exposes us to the risk of losing valuable employees or being unable to recruit relevant qualified professionals and executives. Measures: We combat the risk of losing valuable employees through specifically devised personnel development programs and incentive systems. Supporting this is an established, thorough annual review process from which we derive individually tailored and future-viable qualification programs as well as performance-related remuneration systems. We also provide a health management and consultation service on a global scale for our employees, aligned to their age and circumstances. We reduce the risk of not being able to recruit qualified professionals and executives by expanding our employer branding initiatives and through targeted cooperation with colleges and universities in all regions where we conduct business. Our attractiveness as an employer is reinforced by our focus on promoting talent and specialized development programs. Further information relating to our employees can be found on pages 74 to 77. Our networks are protected against unauthorized external access where economically viable. Operating systems and anti-virus software are automatically updated to their latest version on a continual basis. Impact: High probability rating, possible minor impact on our earnings guidance. We inform and instruct our employees in the proper and secure use of information systems as part of their regular duties. Description of risk: As a globally active corporation, Henkel is exposed to potential damage to its image in the event of negative reports in the media – including social media – regarding Henkel’s corporate brand or individual product brands, particularly in the consumer goods sector. These could lead to a negative impact on sales. The implementation of our security measures is continually reviewed by our Internal Audit function, other internal departments, and independent third parties. Impact: Low probability rating, possible major impact on our earnings guidance. Personnel risks Description of risk: The motivation and the qualification of our employees are key drivers of Henkel’s business success. Therefore, it is strategically important to recruit highly qualified professionals and executives and ensure they stay with the company. In selecting and employing talent, we compete globally for qualified professionals and executives. In this Risks in connection with brand image or reputation of the company Measures: We minimize these risks through the measures described under legal and regulatory risks (see page 104) and pro-active public relations management. The former are designed to ensure that our production facilities and products are safe. The latter reinforces our corporate brand and individual product brands. These measures are supported by a global communication network, and international and local crisis management systems with regular training sessions and crisis response planning. 106 Group management report Impact: Low probability rating, possible major impact on our sales and earnings guidance. Environmental and safety risks Description of risk: Henkel is a global manufacturing corporation and is therefore exposed to risks pertaining to the environment, safety, health, and social standards, manifesting in the form of personal injury, physical damage to goods, and reputational damage. Soil contamination and the associated remediation expense as well as leakage or other technical failures could give rise to direct costs for the corporation. Furthermore, indirect costs such as fines, claims for compensation or reputational damage may also be incurred. Measures: We minimize these risks through the measures described under legal and regulatory risks (see page 104), and through our auditing, advisory, and training activities. We update these preventive measures continuously in order to ensure that our facilities, assets, and reputation are properly safeguarded. We ensure compliance with high technical standards, rules of conduct, and relevant statutory requirements as a further means of preserving our assets and values. Impact: Low probability rating, possible major impact on our earnings guidance. Business strategy risks Description of risk: Business strategy risks can arise from the expectations we set for internal projects, acquisitions, and strategic alliances failing to materialize. The associated capital expenditures may not be recouped. Individual projects could also be delayed or even halted by unforeseen events. Measures: We combat these risks through comprehensive project management. We limit exposure through financial viability assessments in the review, decision, and implementation phases. These assessments are performed by specialist departments, supported by external consultants where appropriate. Project transparency and control are supported by our management systems. Impact: Moderate probability rating, possible moderate impact on our earnings guidance. Henkel Annual Report 2014 Major opportunity categories Entrepreneurial opportunities are identified and evaluated at Group level and in the individual business units, and duly incorporated into the strategy and planning processes. We understand the opportunities presented in the following as potential future developments or events that could lead to a positive deviation from our guidance. We also assess the probabilities of price-related procurement market and financial opportunities. Macroeconomic and sector-specific opportunities Description of opportunities: Additional business opportunities would arise if the uncertain geopolitical and macroeconomic situation in some regions such as Eastern Europe or Africa/Middle East or the economic conditions in individual sectors develop substantially better than expected. Impact: The opportunities described could have a major impact on our sales and earnings guidance. Procurement market opportunities Description of opportunities: Countervailing the procurement market risks listed on pages 102 and 103, opportunities may also arise in which the influencing factors described in this section develop in a direction that is advantageous to Henkel. Impact: Low probability rating, possible major impact on our earnings guidance. Financial opportunities Description of opportunities: Countervailing the currency and interest risks indicated under financial risks, and the risks arising from pension obligations as described on page 104, opportunities may also arise in which the influencing factors described in this section develop in a direction that is advantageous to Henkel. Impact: We classify financial opportunities as follows: • Currency opportunities with a moderate probability of a major impact on our earnings guidance • Interest rate opportunities with a moderate probability of a minor impact on our earnings guidance 107 Group management report 29 Corporate governance 50 Shares and bonds 55 Fundamental principles of the Group 63 Economic report 100 Risks and opportunities report 108 Forecast 109 Subsequent events • O pportunities arising from our pension obligations with a low probability of a minor impact on our earnings guidance, and with a high probability of a major impact on our equity Acquisition opportunities Description of opportunities: Acquisitions are an essential component of our strategy. Impact: Large acquisitions could have a major impact on our earnings guidance. Research and development opportunities Description of opportunities: Opportunities arising from our predominantly continuous innovation process are an essential component of our strategy and are already accounted for in our guidance. There are additional opportunities in the event of product introductions that exceed our expectations of market acceptance, and in the development of exceptional innovations that have not yet been taken into account. Impact: Innovations arising from future research and development could have a major impact on our sales and earnings guidance. Risks and opportunities in summary At the time this report was prepared, there were no identifiable risks related to future developments that could endanger the existence either of Henkel AG & Co. KGaA, or a material subsidiary included in the consolidation, or the Group, as a going concern. As we have no special-purpose entities or investment vehicles, there is no risk that might originate from such a source. Compared to the previous year, our expectation of the likelihood and/or o f the possible financial impact of individual risk and opportunity categories has changed slightly. Nevertheless, the overall risk and opportunities situation has not changed to any significant degree. The system of risk categorization adopted by Henkel continues to indicate that the most significant exposure currently relates to the impact of macroeconomic and sector uncertainty and financial risks, to which we are responding with the countermeasures described above. The Management Board remains confident that the earning power of the Group forms a solid foundation for future business development and provides the necessary resources to leverage our opportunities. 108 Group management report Forecast Macroeconomic development Overview: moderate gross domestic product growth of approximately 3 percent We expect global economic growth to again remain moderate in 2015. Based on figures published by Feri EuroRating Services, we expect gross domestic product to increase by approximately 3 percent. Henkel Annual Report 2014 Inflation: moderate rise in global price levels According to data provided by Feri EuroRating Services, global inflation is predicted to be around 2 percent in 2015. While we can continue to expect a high degree of price stability for the mature markets, with a rise of approximately 1 percent, the inflation rate in the emerging regions is likely to average approximately 5 percent. Sector development We expect the mature markets to grow by around 2 percent. The North American economy is likely to grow by around 3 percent, Japan’s economy is expected to expand by approximately 1 percent. We expect economic growth in Western Europe of around 1 percent. The emerging markets will once again achieve comparatively strong economic growth of around 4 percent in 2015, but developments will vary widely between individual regions and countries. We expect economic output to increase by around 6 percent in Asia (excluding Japan) and by around 4 percent in the Africa/Middle East region. In the case of Latin America, however, we expect an increase of only approximately 1 percent. In light of the continuing conflict between Russia and Ukraine, we see stagnation occurring in Eastern Europe in 2015. Direct materials: price level stable We anticipate stable prices overall for direct materials in 2015. In light of the geopolitical and global economic uncertainties, we expect volatility in the procurement markets to increase further. Limited capacities in some supply areas may lead to shortages. Currencies: overall appreciation against the euro Overall, we anticipate the currencies relevant to Henkel to appreciate against the euro. In particular, we anticipate a stronger average US dollar rate for 2015 compared to the previous year. By contrast, major currencies in the emerging markets may weaken. Due to the ongoing political crisis between Russia and Ukraine, we expect the Russian ruble, which has already lost significant value compared to its average for 2014, to remain exposed to continued devaluation pressure. Consumption and the retail sector: growth of approximately 3 percent Based on data provided by Feri EuroRating Services, we anticipate that worldwide private consumption will rise by approximately 3 percent in 2015. In the mature markets, consumers are likely to spend around 2 percent more than in the previous year. The emerging markets should again demonstrate a somewhat higher propensity to spend, with a rise of approximately 4 percent in 2015. Industry: growth of around 4 percent According to figures provided by Feri EuroRating Services, industry will again grow globally by around 4 percent compared to the previous year and, as such, faster than the overall economy. We expect the transport and metal industries to expand production by around 4 percent. Production in the electronics sector will grow by approximately 5 percent. Within the electronics industry, the growth of basic products relevant for Henkel, such as electrical systems and semiconductor units, will be slightly weaker than in the previous year. Development in consumer-related sectors, such as the global packaging industry, will be similar to the previous year, with growth again in the low single-digit range according to our estimates. We expect global construction to expand by around 2 percent. 109 Group management report 29 Corporate governance 50 Shares and bonds 55 Fundamental principles of the Group 63 Economic report 100 Risks and opportunities report 108 Forecast 109 Subsequent events Outlook for the Henkel Group 2015 We expect the Henkel Group to generate organic sales growth of 3 to 5 percent in fiscal 2015. Our expectation is that the Adhesive Technologies and Laundry & Home Care business units will each generate organic sales growth within this range. In the Beauty Care business unit, we expect growth of approximately 2 percent. Furthermore, we have the following expectations for 2015: • Stable prices for raw materials, packaging, and purchased goods and services • Restructuring charges of 150 to 200 million euros • Investments in property, plant and equipment and intangible assets of between 550 and 600 million euros Dividends We furthermore expect a stable development in the share of sales from our emerging markets. The starting point for our expected organic sales growth is our strong competitive position. We have consolidated and further developed this in recent years through our innovative strength, strong brands and leading market positions, as well as the quality of our portfolio. In recent years we have introduced a number of measures that have had a positive effect on our cost structure. Also in this year, we intend to continue adapting our structures to constantly changing market conditions and to maintain our strict cost discipline. Through optimization and standardization of processes and continued expansion of our shared services, we can pool activities and thus further improve our efficiency while simultaneously enhancing the quality of our customer service. Moreover, the optimization of our production and logistics networks will contribute to improving our cost structures. These factors, together with the expected increase in sales, will have a positive effect on our earnings performance. We expect our adjusted return on sales (EBIT) to increase versus the previous year to around 16 percent, and that all business units will contribute to this improvement. We expect an increase in adjusted earnings per preferred share of approximately 10 percent. In accordance with our dividend policy – and depending on the company’s asset and profit positions as well as its financial requirements – we expect a dividend payout by Henkel AG & Co. KGaA in the range of 25 percent to 35 percent of net income after non-controlling interests, and adjusted for exceptional items. Capital expenditures We are planning to increase our investments in property, plant and equipment and intangible assets to approximately 550 to 600 million euros in fiscal 2015. We intend to allocate the biggest share of our budget to expanding our businesses in emerging markets. Considerable investments are planned in the Laundry & Home Care and Beauty Care business units for optimizing and expanding production in Europe. In the Adhesive Technologies business unit, the focus in 2015 will be on further expanding our production capacity in the emerging markets of Asia and Eastern Europe. In addition, investments in IT infrastructure will contribute substantially to optimizing our processes. Subsequent events On January 28, 2015, we signed the contract governing the sale of our chemical additives business serving the processing industry in the USA. The assets were included in assets held for sale as of December 31, 2014. 110 Consolidated financial statements Henkel Annual Report 2014 Consolidated financial statements 112Consolidated statement of financial position 114 Consolidated statement of income 115 Consolidated statement of comprehensive income 115 Consolidated statement of changes in equity 116 Consolidated statement of cash flows 117 Notes to the consolidated financial statements –Group segment report by business unit 118 Notes to the consolidated financial statements – Key financials by region 119 Notes to the consolidated financial statements – Accounting principles and methods applied in preparation of the consolidated financial statements 128Notes to the consolidated financial statements – Notes to the consolidated statement of financial position 128 Intangible assets 131 Property, plant and equipment 133 Other financial assets 133 Other assets 134 Deferred taxes 134 Inventories 134 Trade accounts receivable 135 Cash and cash equivalents 135 Assets and liabilities held for sale 135 Issued capital 136 Capital reserve 136 Retained earnings 136 Other components of equity 137 Non-controlling interests 137 Pension obligations 146 Income tax provisions and other provisions 148 Borrowings 149 Other financial liabilities 149 Other liabilities 149 Trade accounts payable 150 Financial instruments report Consolidated financial statements 163 Sale proceeds and principles of income recognition 163 Cost of sales 163 Marketing, selling and distribution expenses 163Research and development expenses 163 Administrative expenses 164 Other operating income 164 Other operating charges 164 Financial result 165 Taxes on income 167 Non-controlling interests 168Notes to the consolidated financial statements – Other disclosures 168 Payroll cost and employee structure 168 Share-based payment plans 169Group segment report 171 Earnings per share 172 Consolidated statement of cash flows 172 Contingent liabilities 172 Other unrecognized financial commitments 173Voting rights / Related party disclosures 173 Exercise of exemption options 173 Remuneration of the corporate management bodies 174Declaration of compliance with the German Corporate Governance Code (DCGK) 174 Subsidiaries and other investments 174Auditor’s fees and services 175 Independent Auditor’s Report 177 Recommendation for the approval of the annual financial statements and the appropriation of the profit of Henkel AG & Co. KGaA 178 Annual financial statements of Henkel AG & Co. KGaA (summarized) 179 Responsibility statement by the Personally Liable Partner 180 Corporate management bodies of Henkel AG & Co. KGaA Consolidated financial statements 163Notes to the consolidated financial statements – Notes to the consolidated statement of income 111 112 Consolidated financial statements Henkel Annual Report 2014 Consolidated statement of financial position Assets 77 2013 % 2014 % Intangible assets 1 8,189 42.3 10,590 50.5 Property, plant and equipment 2 2,295 11.9 2,461 11.8 Other financial assets 3 148 0.8 114 0.5 6 – 7 – 116 0.6 140 0.7 in million euros Note Income tax refund claims Other assets 4 Deferred tax assets 5 Non-current assets 606 3.1 838 4.0 11,360 58.7 14,150 67.5 Inventories 6 1,494 7.7 1,671 8.0 Trade accounts receivable 7 2,370 12.3 2,747 13.1 Other financial assets 3 2,664 13.8 676 3.2 128 0.7 174 0.8 Income tax refund claims Other assets 4 241 1.2 284 1.4 Cash and cash equivalents 8 1,051 5.4 1,228 5.9 Assets held for sale 9 36 0.2 31 0.1 7,984 41.3 6,811 32.5 19,344 100.0 20,961 100.0 Current assets Total assets Consolidated financial statements 112 Consolidated statement of financial position 114 Consolidated statement of income 115 Consolidated statement of comprehensive income 115 Consolidated statement of changes in equity 116 Consolidated statement of cash flows 113 117 Group segmentreport by business unit 118 Key financials by region 119 Accounting principles and methods applied in preparation of the consolidated financial statements 128 Notes to the consolidated statement of financial position 163 Notes to the consolidated statement of income 168 Other disclosures 175 Independent Auditor’s Report 177 Recommendation for the approval of the annual financial statements and the appropriation of the profit of Henkel AG & Co. KGaA 178 Annual financial statements of Henkel AG & Co. KGaA (summarized) 179 Responsibility statement by the Personally Liable Partner 180 Corporate management bodies of Henkel AG & Co. KGaA 77 Equity and liabilities in million euros Note Issued capital 10 Capital reserve 11 Treasury shares 2013 % 2014 % 438 2.3 438 2.1 652 3.4 652 3.1 – 91 – 0.5 – 91 – 0.4 Retained earnings 12 10,561 54.5 11,396 54.4 Other components of equity 13 – 1,516 – 7.8 – 887 – 4.3 10,044 51.9 11,508 54.9 114 0.6 136 0.7 10,158 52.5 11,644 55.6 Equity attributable to shareholders of Henkel AG & Co. KGaA Non-controlling interests 14 Equity Pension obligations 15 820 4.2 1,262 6.0 Income tax provisions 16 78 0.4 84 0.4 Other provisions 16 335 1.7 380 1.8 Borrowings 17 1,386 7.2 1,354 6.5 Other financial liabilities 18 2 – 1 – Other liabilities 19 14 0.1 13 0.1 Deferred tax liabilities 5 Non-current liabilities 457 2.4 628 3.0 3,092 16.0 3,722 17.8 Income tax provisions 16 172 1.0 251 1.2 Other provisions 16 1,454 7.5 1,513 7.2 Borrowings 17 1,230 6.4 390 1.9 Trade accounts payable 20 2,872 14.8 3,046 14.4 Other financial liabilities 18 87 0.4 117 0.6 Other liabilities 19 230 1.2 268 1.3 20 0.1 10 – 29 0.1 – – 6,094 31.5 5,595 26.6 19,344 100.0 20,961 100.0 Income tax liabilities Liabilities held for sale Current liabilities Total equity and liabilities 9 114 Consolidated financial statements Henkel Annual Report 2014 Consolidated statement of income 78 Note in million euros 2013 % 2014 % Change Sales 22 16,355 100.0 16,428 100.0 Cost of sales 1 23 – 8,546 – 52.3 – 8,712 – 53.0 1.9 % 7,809 47.7 7,716 47.0 – 1.2 % Gross profit 0.4 % Marketing, selling and distribution expenses 1 24 – 4,242 – 25.9 – 4,151 – 25.3 – 2.1 % Research and development expenses 1 25 – 415 – 2.6 – 413 – 2.5 – 0.5 % Administrative expenses 1 26 – 842 – 5.1 – 852 – 5.2 1.2 % Other operating income 27 122 0.7 109 0.7 – 10.7 % Other operating charges 28 – 147 – 0.8 – 165 – 1.0 12.2 % 2,285 14.0 2,244 13.7 – 1.8 % Operating profit (EBIT) 36 0.2 39 0.2 8.3 % Interest expense 2 – 94 – 0.6 – 48 – 0.2 – 48.9 % Other financial result 2 – 55 – 0.3 – 46 – 0.3 – 16.4 % – 6 – – 0.7 – 49 – 0.3 2,172 13.3 2,195 13.4 1.1 % – 547 – 3.4 – 533 – 3.3 – 2.6 % 1,625 9.9 1,662 10.1 2.3 % – 36 – 0.2 – 34 – 0.2 – 5.6 % 1,589 9.7 1,628 9.9 2.5 % Interest income 2 Investment result – Financial result 29 Income before tax Taxes on income 30 Tax rate in % – 113 24.3 25.2 Net income – Attributable to non-controlling interests 31 – Attributable to shareholders of Henkel AG & Co. KGaA – – 56.6 % Earnings per ordinary share – basic and diluted in euros 3.65 3.74 2.5 % Earnings per preferred share – basic and diluted in euros 3.67 3.76 2.5 % Additional voluntary information 79 2013 in million euros EBIT (as reported) 2,285 One-time gains One-time charges Restructuring charges 1 Adjusted EBIT 2014 2,244 Change – 1.8 % – 10 – 28 3 – 82 159 4 – 159 213 2,516 2,588 – 2.9 % Adjusted return on sales in % 15.4 15.8 0.4 pp Adjusted tax rate in % 25.1 24.0 – 1.1 pp Adjusted net income – Attributable to shareholders of Henkel AG & Co. KGaA 1,764 1,896 7.5 % Adjusted earnings per ordinary share in euros 4.05 4.36 7.7 % Adjusted earnings per preferred share in euros 4.07 4.38 7.6 % 1 Restructuring charges 2014: 213 million euros (2013: 159 million euros), of which: cost of sales 82 million euros (2013: 49 million euros); m arketing, selling and distribution expenses 48 million euros (2013: 43 million euros); research and development expenses 3 million euros (2013: 1 million euros); a dministrative expenses 80 million euros (2013: 66 million euros). 2 Comparable figures shown for the previous year (see notes on page 125). 3 Includes 25 million euros for impairment reversal from reclassification of assets held for sale (see notes on page 135). 4 Includes 109 million euros for provisions related to antitrust proceedings in Europe and 39 million euros related to optimization of our IT system architecture for managing business processes. Consolidated financial statements 115 112 Consolidated statement of financial position 114 Consolidated statement of income 115 Consolidated statement of comprehensive income 115 Consolidated statement of changes in equity 116 Consolidated statement of cash flows 117 Group segmentreport by business unit 118 Key financials by region 119 Accounting principles and methods applied in preparation of the consolidated financial statements 128 Notes to the consolidated statement of financial position 163 Notes to the consolidated statement of income 168 Other disclosures 175 Independent Auditor’s Report 177 Recommendation for the approval of the annual financial statements and the appropriation of the profit of Henkel AG & Co. KGaA 178 Annual financial statements of Henkel AG & Co. KGaA (summarized) 179 Responsibility statement by the Personally Liable Partner 180 Corporate management bodies of Henkel AG & Co. KGaA Consolidated statement of comprehensive income See Notes 15 and 21 for further explanatory information 80 in million euros 2013 2014 Net income 1,625 1,662 – 544 627 17 15 1 1 95 – 266 Components to be reclassified to income: Exchange differences on translation of foreign operations Gains from derivative financial instruments (hedge reserve per IAS 39) Gains/losses from financial instruments in the available-for-sale category (Available-for-sale reserve) Components not to be reclassified to income: Remeasurements from defined benefit plans Other comprehensive income (net of taxes) – 431 377 Total comprehensive income for the period 1,194 2,039 – Attributable to non-controlling interests – Attributable to shareholders of Henkel AG & Co. KGaA 22 48 1,172 1,991 Consolidated statement of changes in equity See Notes 10 to 14 for further explanatory information 81 Issued capital Other components of equity Ordinary Preferred shares shares Capital reserve Treasury shares Retained earnings Currency translation in million euros At January 1, 2013 Hedge AvailableShare- Non-conreserve for-sale holders trolling per reserve of Henkel interests IAS 39 AG & Co. KGaA Total 260 178 652 – 91 9,381 – 806 – 199 1 9,376 135 9,511 Net income – – – – 1,589 – – – 1,589 36 1,625 Other comprehensive income – – – – 95 – 530 17 1 – 417 – 14 – 431 Total comprehensive income for the period – – – – 1,684 – 530 17 1 1,172 22 1,194 Dividends – – – – – 407 – – – – 407 – 25 – 432 Sale of treasury shares – – – – – – – – – – – Changes in ownership interest with no change in control – – – – – 95 – – – – 95 – 18 – 113 Other changes in equity – – – – – 2 – – – – 2 – – 2 At December 31, 2013 / January 1, 2014 260 178 652 – 91 10,561 – 1,336 – 182 2 10,044 114 10,158 Net income – – – – 1,628 – – – 1,628 34 1,662 Other comprehensive income – – – – – 266 613 15 1 363 14 377 Total comprehensive income for the period – – – – 1,362 613 15 1 1,991 48 2,039 Dividends – – – – – 525 – – – – 525 – 23 – 548 Sale of treasury shares – – – – – – – – – – – Changes in ownership interest with no change in control – – – – – 2 – – – – 2 – 2 – 4 Other changes in equity – – – – – – – – – – 1 – 1 At December 31, 2014 260 178 652 – 91 11,396 – 723 – 167 3 11,508 136 11,644 116 Consolidated financial statements Henkel Annual Report 2014 Consolidated statement of cash flows See Note 36 for further explanatory information 82 in million euros 2013 2014 Operating profit (EBIT) 2,285 2,244 Income taxes paid – 534 – 567 Amortization/depreciation/impairment/write-ups of intangible assets and property, plant and equipment 1 420 416 Net gains/losses on disposal of intangible assets and property, plant and equipment, and from divestments – 35 – 1 Change in inventories – 128 – 103 Change in trade accounts receivable – 101 – 184 Change in other assets Change in trade accounts payable – 6 3 342 55 Change in other liabilities and provisions – 127 51 Cash flow from operating activities 2,116 1,914 Purchase of intangible assets and property, plant and equipment, including payments on account – 436 – 531 – 31 – 1,719 – – Acquisition of subsidiaries and other business units Purchase of associated companies and joint ventures held at equity Proceeds on disposal of subsidiaries and other business units 24 6 Proceeds on disposal of intangible assets and property, plant and equipment 62 13 Cash flow from investing activities – 381 – 2,231 Dividends paid to shareholders of Henkel AG & Co. KGaA – 407 – 525 Dividends paid to non-controlling shareholders – 25 – 23 Interest received 235 202 – 286 – 203 Interest paid Dividends and interest paid and received Repayment of bonds – 483 – 549 – 1,000 – 1,030 Other changes in borrowings – 59 275 Allocation to pension funds – 62 – 87 Other changes in pension obligations – 75 – 62 Purchase of non-controlling interests with no change of control – 69 – 12 – 101 1,912 – 1,849 447 – 114 130 Other financing transactions 2 Cash flow from financing activities Net change in cash and cash equivalents – 63 37 – 177 167 Cash and cash equivalents at January 1 1,238 1,061 3 Cash and cash equivalents at December 31 1,061 3 1,228 Effect of exchange rates on cash and cash equivalents Change in cash and cash equivalents 1 Of which: Impairment in fiscal 2014: 35 million euros (fiscal 2013: 33 million euros). 2 Other financing transactions in fiscal 2014 include payments of – 941 million euros for the purchase of short-term securities and time deposits as well as provision of financial collateral (fiscal 2013: – 1,482 million euros). 3 Cash and cash equivalents at January 1, 2014 include cash and cash equivalents of 10 million euros which are reported in the statement of financial position as held for sale and result in the amount shown of 1,051 million euros. Additional voluntary information Reconciliation to free cash flow 83 in million euros 2013 2014 Cash flow from operating activities 2,116 1,914 Purchase of intangible assets and property, plant and equipment, including payments on account – 436 – 531 Proceeds on disposal of intangible assets and property, plant and equipment Net interest paid Other changes in pension obligations Free cash flow 62 13 – 51 – 1 – 75 – 62 1,616 1,333 Notes to the consolidated financial statements 112 Consolidated statement of financial position 114 Consolidated statement of income 115 Consolidated statement of comprehensive income 115 Consolidated statement of changes in equity 116 Consolidated statement of cash flows 117 117 Group segmentreport by business unit 118 Key financials by region 119 Accounting principles and methods applied in preparation of the consolidated financial statements 128 Notes to the consolidated statement of financial position 163 Notes to the consolidated statement of income 168 Other disclosures 175 Independent Auditor’s Report 177 Recommendation for the approval of the annual financial statements and the appropriation of the profit of Henkel AG & Co. KGaA 178 Annual financial statements of Henkel AG & Co. KGaA (summarized) 179 Responsibility statement by the Personally Liable Partner 180 Corporate management bodies of Henkel AG & Co. KGaA Group segment report by business unit 1 84 Laundry & Home Care Beauty Care in million euros Sales 2014 Proportion of Henkel sales Sales 2013 4,626 28 % 4,580 3,547 22 % 3,510 Adhesives for Consumers, Craftsmen and Building 1,858 11 % 1,924 Industrial Adhesives Total Operating Adhesive business Techno units total logies 6,269 8,127 38 % 6,193 49 % 8,117 16,300 99 % 16,207 Corporate 128 1 % 148 Henkel Group 16,428 100 % 16,355 Change from previous year 1.0 % 1.0 % – 3.4 % 1.2 % 0.1 % 0.6 % Adjusted for foreign exchange 6.4 % 4.3 % 2.8 % 3.8 % 3.6 % 4.6 % – 4.4 % Organic 4.6 % 2.0 % 3.0 % 3.9 % 3.7 % 3.6 % – 3.4 % – 13.3 % 0.4 % EBIT 2014 615 421 280 1,066 1,345 2,381 – 137 2,244 EBIT 2013 682 474 286 985 1,271 2,426 – 141 2,285 Change from previous year – 9.8 % – 11.2 % – 2.3 % 8.2 % 5.9 % – 1.9 % – Return on sales (EBIT) 2014 13.3 % 11.9 % 15.0 % 17.0 % 16.6 % 14.6 % – – 1.8 % 13.7 % Return on sales (EBIT) 2013 14.9 % 13.5 % 14.9 % 15.9 % 15.7 % 15.0 % – 14.0 % Adjusted EBIT 2014 749 544 293 1,109 1,402 2,694 – 106 2,588 Adjusted EBIT 2013 714 525 311 1,059 1,370 2,609 – 93 2,516 4.8 % 3.5 % – 5.9 % 4.7 % 2.3 % 3.2 % – 2.9 % Adjusted return on sales (EBIT) 2014 16.2 % 15.3 % 15.7 % 17.7 % 17.2 % 16.5 % – 15.8 % Adjusted return on sales (EBIT) 2013 15.6 % 15.0 % 16.2 % 17.1 % 16.9 % 16.1 % – 15.4 % Change from previous year Capital employed 2014 2 2,631 2,296 865 5,941 6,806 11,733 57 11,790 Capital employed 2013 2 2,321 2,007 922 5,830 6,752 11,080 59 11,138 Change from previous year 13.4 % 14.4 % – 6.1 % 1.9 % 0.8 % 5.9 % – 5.8 % Return on capital employed (ROCE) 2014 23.4 % 18.3 % 32.3 % 17.9 % 19.8 % 20.3 % – 19.0 % Return on capital employed (ROCE) 2013 29.4 % 23.6 % 31.0 % 16.9 % 18.8 % 21.9 % – 20.5 % 122 61 41 180 221 404 12 416 26 1 1 6 7 34 1 35 2 2 7 Amortization/depreciation/impairment/write-ups of intangible assets and property, plant, equipment 2014 of which impairment losses 2014 of which write-ups 2014 Amortization/depreciation/impairment/write-ups of intangible assets and property, plant, equipment 2013 of which impairment losses 2013 5 Capital expenditures (excl. financial assets) 2013 – – 7 121 56 43 182 225 402 18 420 16 1 7 8 15 32 1 33 1 4 5 5 of which write-ups 2013 Capital expenditures (excl. financial assets) 2014 – – – – 5 1,201 370 82 553 635 2,206 8 2,214 158 101 72 126 198 457 8 465 16,852 Operating assets 2014 3 4,507 3,390 1,375 7,166 8,541 16,438 414 Operating liabilities 2014 1,708 1,294 562 1,696 2,258 5,260 357 5,617 Net operating assets 2014 3 2,799 2,096 813 5,469 6,283 11,178 57 11,235 16,301 Operating assets 2013 3 4,111 3,164 1,434 7,105 8,538 15,813 488 Operating liabilities 2013 1,626 1,355 562 1,696 2,259 5,240 429 5,669 Net operating assets 2013 3 2,484 1,809 871 5,408 6,279 10,573 59 10,632 1 Calculated on the basis of units of 1,000 euros. 2 Including goodwill at cost prior to any accumulated impairment in accordance with IFRS 3.79 (b). 3 Including goodwill at net book value. 118 Notes to the consolidated financial statements Henkel Annual Report 2014 Key financials by region 1 85 Western Europe Eastern Europe in million euros Africa/ Middle East North America Latin America AsiaPacific Total Regions Corporate Henkel Group Sales 2 2014 5,724 2,854 1,133 2,884 1,029 2,676 16,300 128 16,428 Sales 2 2013 5,580 3,034 1,080 2,928 1,061 2,524 16,207 148 16,355 Change from previous year 2.6 % – 5.9 % 4.9 % – 1.5 % – 3.0 % 6.0 % 0.6 % – 0.4 % Adjusted for foreign exchange 2.6 % 5.8 % 16.6 % – 0.6 % 4.8 % 8.2 % 4.6 % – 4.4 % 4.5 % 16.9 % Organic 1.7 % 8.2 % 3.6 % – 3.4 % – 2.9 % 4.4 % Proportion of Group sales 2014 35 % 17 % 7 % 18 % 6 % 16 % 99 % 1 % 100 % Proportion of Group sales 2013 34 % 19 % 7 % 18 % 6 % 15 % 99 % 1 % 100 % Operating profit (EBIT) 2014 1,046 378 121 420 73 343 2,381 – 137 2,244 Operating profit (EBIT) 2013 1,021 459 34 497 74 340 2,426 – 141 2,285 Change from previous year 2.4 % – 17.7 % 250.2 % – 15.4 % – 1.5 % 0.8 % – 1.9 % – Adjusted for foreign exchange 2.3 % – 5.6 % 270.6 % – 15.0 % 12.3 % 3.0 % 1.5 % – – 1.8 % 0.6 % Return on sales (EBIT) 2014 18.3 % 13.2 % 10.7 % 14.6 % 7.1 % 12.8 % 14.6 % – 13.7 % Return on sales (EBIT) 2013 18.3 % 15.1 % 3.2 % 17.0 % 7.0 % 13.5 % 15.0 % – 14.0 % 1 Calculation on the basis of units of 1,000 euros. 2 By location of company. In 2014, the affiliated companies domiciled in Germany, including Henkel AG & Co. KGaA, generated sales of 2,280 million euros (previous year: 2,247 million euros). Sales realized by the affiliated companies domiciled in the USA amounted to 2,672 million euros in 2014 (previous year: 2,700 million euros). In f iscal 2013 and 2014, no individual customer accounted for more than 10 percent of total sales. Of the total non-current assets disclosed for the Henkel Group at December 31, 2014 (excluding financial instruments and deferred tax assets) amounting to 13,203 million euros (previous year: 10,611 million euros), 1,479 million euros (previous year: 1,156 million euros) was attributable to the affiliated companies domiciled in Germany, including Henkel AG & Co. KGaA. The non-current assets (excluding financial instruments and deferred tax assets) recognized in respect of the affiliated companies domiciled in the USA amounted to 6,404 million euros at December 31, 2014(previous year: 5,438 million euros). Notes to the consolidated financial statements 112 Consolidated statement of financial position 114 Consolidated statement of income 115 Consolidated statement of comprehensive income 115 Consolidated statement of changes in equity 116 Consolidated statement of cash flows 117 Group segmentreport by business unit 118 Key financials by region 119 Accounting principles and methods applied in preparation of the consolidated financial statements 128 Notes to the consolidated statement of financial position 119 163 Notes to the consolidated statement of income 168 Other disclosures 175 Independent Auditor’s Report 177 Recommendation for the approval of the annual financial statements and the appropriation of the profit of Henkel AG & Co. KGaA 178 Annual financial statements of Henkel AG & Co. KGaA (summarized) 179 Responsibility statement by the Personally Liable Partner 180 Corporate management bodies of Henkel AG & Co. KGaA Accounting principles and methods applied in preparation of the consolidated financial statements General information Scope of consolidation The consolidated financial statements of Henkel AG & Co. KGaA, Düsseldorf, as of December 31, 2014 have been prepared in accordance with International Financial Reporting Standards (IFRS) and the relevant interpretations of the International Financial Reporting Interpretations Committee (IFRIC), as adopted per Regulation number 1606/2002 of the European Parliament and the Council, on the application of international accounting standards in the European Union, and in compliance with Section 315a of the German Commercial Code [HGB]. In addition to Henkel AG & Co. KGaA as the ultimate parent company, the consolidated financial statements at December 31, 2014 include eight German and 197 non-German companies in which Henkel AG & Co. KGaA has a dominating influence over financial and operating policy, based on the concept of control. The Group has a dominating influence on a company when it is exposed, or has rights, to variable returns from its involvement with the company and has the ability to affect those returns through its power over the company. The individual financial statements of the companies included in the consolidation are drawn up on the same accounting date, December 31, 2014, as that of Henkel AG & Co. KGaA. The following table shows the changes to the scope of consolidation in fiscal 2014: Members of the KPMG organization or other independent firms of auditors instructed accordingly have audited the financial statements of the material companies included in the consolidation. The Management Board of Henkel Management AG – which is the Personally Liable Partner of Henkel AG & Co. KGaA – compiled the consolidated financial statements on January 30, 2015 and approved them for forwarding to the Supervisory Board and for publication. Scope of consolidation The consolidated financial statements are based on the principle of historical cost with the exception that certain financial instruments are accounted for at their fair values, and pension obligations are measured using the projected unit credit method. The functional currency of Henkel AG & Co. KGaA and the reporting currency of the Group is the euro. Unless otherwise indicated, all amounts are shown in million euros.In o rder to improve the clarity and informative value of the consolidated financial statements,certain items are combined in the consolidated statement of financial position, the consolidated statement of income and the consolidated statement of comprehensive income,and then shown separately in the notes. The scope of consolidation expanded in fiscal 2014 as a result of acquisitions. Further details can be found in the section “Acquisitions and divestments” on pages 120 to 122. At January 1, 2014 86 174 Additions 43 Mergers – 1 Disposals – 10 At December 31, 2014 206 Subsidiaries which are of secondary importance to the Group and to the presentation of a true and fair view of our net assets, financial position and results of operations due to their inactivity or low level of activity are generally not included in the consolidated financial statements. The total assets of these companies represent less than 1 percent of the Group’s total assets; their total sales and income (net of taxes) are also less than 1 percent of the Group totals. 120 Notes to the consolidated financial statements Acquisitions and divestments Acquisitions Effective February 14, 2014, we concluded the takeover of a laundry and home care business in Poland, together with its associated brands. The transaction includes detergents and fabric softeners under the “E” brand as well as other smaller brands. The purchase price paid was 53 million euros and primarily covered trademarks and other rights with indefinite useful lives. No goodwill was recognized. Effective May 30, 2014, we completed the acquisition of the hair care brand Pert in Latin America. The purchase price paid was 24 million euros. Goodwill was recognized in an amount of 18 million euros. Effective June 30, 2014, we acquired full ownership of three hair professional companies in the USA, Sexy Hair Concepts LLC, Alterna Holdings Corporation and Kenra Professional LLC. The purchase price was 274 million euros. This acquisition is part of our global strategy to invest in attractive country category positions in mature markets. Effective October 14, 2014, we acquired all shares of Spotless Group SAS, Neuilly-sur-Seine, France, in the Laundry & Home Care business unit. The purchase price, including debt assumed, was 940 million euros. This acquisition is part of our global strategy to invest in attractive country category positions in mature markets. Henkel Annual Report 2014 Effective October 31, 2014, we acquired all shares of The Bergquist Company based in Chanhassen, Minnesota, USA. The purchase price was 467 million euros. This acquisition strengthens the position of Adhesive Technologies as a leading solution provider for adhesives, sealants and functional coatings worldwide. Because the acquisitions were completed over the course of the year, the allocation of the purchase prices for the latter three acquisitions mentioned above to the acquired assets and liabilities in accordance with IFRS 3 “Business combinations” is provisional. The purpose of the purchase price allocation, which has not yet been completed, is to allocate the acquisition costs to the fair values of the assets and liabilities. It also takes into account the fair values of previously unrecognized intangible assets of acquired activities, such as customer relationships, technologies and brands. The carrying amounts of the acquired assets and liabilities are determined by the contracts and our opening balances on each respective acquisition date. The recognition and measurement principles adopted by the Henkel Group were applied. If the acquired companies had been included from January 1, 2014, sales for the Henkel Group for the reporting period January 1 to December 31, 2014 would be higher by 576 million euros and income (net of taxes) would be higher by 46 million euros. The actual contributions of the companies were 146 million euros to sales and 3 million euros to income (net of taxes). Capitalized goodwill of around 180 million euros is tax-deductible. Notes to the consolidated financial statements 112 Consolidated statement of financial position 114 Consolidated statement of income 115 Consolidated statement of comprehensive income 115 Consolidated statement of changes in equity 116 Consolidated statement of cash flows 121 117 Group segmentreport by business unit 118 Key financials by region 119 Accounting principles and methods applied in preparation of the consolidated financial statements 128 Notes to the consolidated statement of financial position 163 Notes to the consolidated statement of income 168 Other disclosures 175 Independent Auditor’s Report 177 Recommendation for the approval of the annual financial statements and the appropriation of the profit of Henkel AG & Co. KGaA 178 Annual financial statements of Henkel AG & Co. KGaA (summarized) 179 Responsibility statement by the Personally Liable Partner 180 Corporate management bodies of Henkel AG & Co. KGaA 87 Reconciliation of the purchase price to provisional difference 2014 in million euros Sexy Hair Concepts LLC, Alterna Holdings Corporation and Kenra Professional LLC, effective June 30, 2014 274 Purchase price – 4 Adjustment based on purchase agreement 270 Adjusted purchase price in cash 16 Carrying amount of the acquired assets and liabilities Provisional difference 254 Spotless Group SAS, effective October 14, 2014 940 Purchase price – 241 Less financial liabilities redeemed 19 Adjustment based on purchase agreement 718 Adjusted purchase price in cash 67 Carrying amount of the acquired assets and liabilities Provisional difference 651 The Bergquist Company, effective October 31, 2014 467 Purchase price 2 Adjustment based on purchase agreement 469 Adjusted purchase price in cash 79 Carrying amount of the acquired assets and liabilities Provisional difference 390 88 Acquisitions Sexy Hair Concepts LLC, Alterna Holdings Corporation and Kenra Professional LLC, effective June 30, 2014 Spotless Group SAS, effective Oct. 14, 2014 The Bergquist Company, effective Oct. 31, 2014 Others Fair value Fair value Fair value Fair value Total Provisional goodwill 159 675 289 18 1,141 Other intangible assets 104 256 90 60 510 2 7 37 – 46 11 16 – – 27 276 954 416 78 1,724 in million euros Property, plant and equipment Other non-current assets Non-current assets Inventories 22 36 20 – 78 Trade accounts receivable 15 76 34 – 125 20 Other current assets 9 8 3 – Liquid funds 6 37 12 – 55 52 157 69 – 278 Total assets 328 1,111 485 78 2,002 Net assets 270 718 467 78 1,533 Non-current liabilities 25 282 1 2 – 309 Other current provisions / liabilities 24 61 10 – 95 9 50 6 – 65 33 111 16 – 160 328 1,111 485 78 2,002 Current assets Trade accounts payable Current liabilities Total equity and liabilities 1 Includes redeemed financial liabilities of 241 million euros. 122 Notes to the consolidated financial statements Divestments Effective March 31, 2014, we concluded the sale in the USA of our non-core rolling oil business in the Adhesive Technologies business unit. The net assets, financial position and results of operations of the company were not materially impacted by divestments in fiscal 2014. Consolidation methods The financial statements of Henkel AG & Co. KGaA and of the subsidiaries included in the consolidated financial statements were prepared on the basis of uniformly valid principles of recognition and measurement, applying the standardized year-end date adopted b y the Group. Such entities are included in the consolidated f inancial statements as of the date on which the Group acquired control. All receivables and liabilities, sales, income and expenses, as well as intra-group profits on transfers of non-current assets or inventories, are eliminated on consolidation. The purchase method is used for capital consolidation. With business combinations, therefore, all hidden reserves and hidden charges in the entity acquired are revalued at the time of acquisition, and fully reflected at fair value, and all identifiable intangible assets are separately disclosed if they are clearly separable or if their recognition arises from a contractual or other legal right. Any difference arising between the acquisition cost and the (share of) net assets after purchase price allocation is recognized as goodwill. The goodwill of subsidiaries is measured in the functional currency of the subsidiary. Entities acquired are included in the consolidation for the first time as subsidiaries by offsetting the carrying amount of the respective parent company’s investment in them against their assets and liabilities. Contingent consideration is recognized at fair value as of the date of first-time consolidation. Subsequent changes in value do not result in an adjustment to the valuation at the time of acquisition. (Incidental) costs related to the acquisition of subsidiaries are not included in the purchase price. Instead, they are recognized through profit or loss in other operating charges in the period in which they occur. In the recognition of acquisitions of less than 100 percent, non-controlling interests are measured at the fair value of the share of net assets that they represent. We do not apply the option of measuring non-controlling interests at their fair value ( full goodwill method). Henkel Annual Report 2014 In subsequent years, the carrying amount of the Henkel AG & Co. KGaA investment is eliminated against the current (share of) equity in the subsidiary entities concerned. Changes in the shareholdings of subsidiary companies resulting in a decrease or an increase in the participating interests of the Group without loss of control are recognized within equity as changes in ownership without loss of control. As soon as the control of a subsidiary is relinquished, all the assets and liabilities and the non-controlling interests, and also the accumulated currency translation gains or losses, are derecognized. In the event that Henkel continues to own non-controlling interests in the non-consolidated entity, these are measured at fair value. The result of deconsolidation is recognized under other operating income or charges. Companies recognized by the equity method Associated companies and joint ventures are recognized by the equity method. An associated company is a company over which the Group can exercise material influence on the financial and operating policies without controlling it. Material influence is generally assumed when the Group holds 20 percent or more of the voting rights. Where a Group company conducts transactions with an associated company or a joint venture, the resulting profits or losses are eliminated in accordance with the share of the Group in that company. The Group consolidates Dekel Investment Holdings Ltd. using the equity method. The carrying amount of the shareholding at December 31, 2014 was 5 million euros (previous year: 5 million euros). Notes to the consolidated financial statements 112 Consolidated statement of financial position 114 Consolidated statement of income 115 Consolidated statement of comprehensive income 115 Consolidated statement of changes in equity 116 Consolidated statement of cash flows 123 117 Group segmentreport by business unit 118 Key financials by region 119 Accounting principles and methods applied in preparation of the consolidated financial statements 128 Notes to the consolidated statement of financial position Currency translation The annual financial statements of the consolidated companies, including the hidden reserves and hidden charges of Group companies recognized by the purchase method, and also goodwill arising on consolidation, are translated into euros using the functional currency method outlined in International Accounting Standard (IAS) 21 “The Effects of Changes in Foreign Exchange Rates.” The functional currency is the currency in which a foreign company predominantly generates funds and makes payments. As the functional currency for all the companies included in the consolidation is generally the local currency of the company concerned, assets and liabilities are translated at closing rates, while income and expenses are translated 163 Notes to the consolidated statement of income 168 Other disclosures 175 Independent Auditor’s Report 177 Recommendation for the approval of the annual financial statements and the appropriation of the profit of Henkel AG & Co. KGaA 178 Annual financial statements of Henkel AG & Co. KGaA (summarized) 179 Responsibility statement by the Personally Liable Partner 180 Corporate management bodies of Henkel AG & Co. KGaA at the average rates for the year as an approximation of the actual rates at the date of the transaction. Equity items are recognized at historical exchange rates. The differences arising from using average rather than closing rates are taken to equity and shown as other components of equity or non-controlling interests, and remain neutral in respect of net income until the shares are divested. In the subsidiaries’ annual financial statements, transactions in foreign currencies are converted at the rates prevailing at the time of the transaction. Financial assets and liabilities in foreign currencies are measured at closing rates through profit or loss. For the main currencies in the Group, the following exchange rates have been used based on 1 euro: 89 Currencies Average exchange rate Exchange rate on December 31 ISO code 2013 2014 2013 Chinese yuan CNY 8.16 8.19 8.35 2014 7.54 Mexican peso MXN 16.97 17.66 18.07 17.87 Polish zloty PLN 4.20 4.18 4.15 4.27 Russian ruble RUB 42.34 50.87 45.32 72.34 Turkish lira TRY 2.53 2.91 2.96 2.83 US dollar USD 1.33 1.33 1.38 1.21 124 Notes to the consolidated financial statements Henkel Annual Report 2014 Recognition and measurement methods 90 Summary of selected measurement methods Financial statement figures Measurement method Assets Goodwill Lower of carrying amount and recoverable amount (“impairment only” method) Other intangible assets with indefinite useful lives Lower of carrying amount and recoverable amount (“impairment only” method) with definite useful lives (Amortized) cost less any impairment losses Property, plant and equipment (Depreciated) cost less any impairment losses Financial assets (categories per IAS 39) “Loans and receivables” (Amortized) cost using the effective interest method “Available for sale” Fair value with gains or losses recognized directly in equity 1 “Held for trading” Fair value through profit or loss “Fair value option” Fair value through profit or loss Other assets (Amortized) cost Inventories Lower of cost and fair value less costs to sell Assets held for sale Lower of cost and fair value less costs to sell 1 Apart from permanent impairment losses and effects arising from measurement in a foreign currency. Liabilities Provisions for pensions and similar obligations Present value of future obligations (projected unit credit method) Other provisions Settlement amount Financial liabilities (categories per IAS 39) “Measured at amortized cost” (Amortized) cost using the effective interest method “Held for trading” Fair value through profit or loss Other liabilities Settlement amount The methods of recognition and measurement, which are basically unchanged from the previous year, are described in detail in the notes relating to the individual items of the statement of financial position on these pages. Also provided as part of the report on our financial instruments (Note 21 on pages 150 to 162) are the disclosures relevant to International Financial Reporting Standard (IFRS) 7 showing the breakdown of our financial instruments by category, our methods for fair value measurement, and the derivative financial instruments that we use. Changes in the methods of recognition and measurement arising from revised and new standards are applied retrospectively, provided that the effect is material and there are no alternative regulations that supersede the standard concerned. The c onsolidated statement of income from the previous year and the opening balance of the consolidated statement of financial position for this comparative period are adjusted as if the new methods of recognition and measurement had always been applied. Notes to the consolidated financial statements 112 Consolidated statement of financial position 114 Consolidated statement of income 115 Consolidated statement of comprehensive income 115 Consolidated statement of changes in equity 116 Consolidated statement of cash flows 117 Group segmentreport by business unit 118 Key financials by region 119 Accounting principles and methods applied in preparation of the consolidated financial statements 128 Notes to the consolidated statement of financial position Accounting estimates, assumptions and discretionary judgments Preparation of the consolidated financial statements is based on a number of accounting estimates and assumptions. These have an impact on the reported amounts of assets, liabilities and contingent liabilities at the reporting date and the disclosure of income and expenses for the reporting period. The actual amounts may differ from these estimates. The accounting estimates and their underlying assumptions are based on past experience and are continually reviewed. Changes in accounting estimates are recognized in the period in which the change takes place where such change exclusively affects that period. A change is recognized in the period in which it occurs and in later periods where such change affects both the reporting period and subsequent periods. The judgments of the Management Board regarding the application of those IFRSs which have a significant impact on the consolidated financial statements are presented in particular in the explanatory notes on taxes on income (Note 30 on pages 165 to 167), intangible assets (Note 1 on pages 128 to 131), pension obligations (Note 15 on pages 137 to 145), income tax provisions and other provisions (Note 16 on pages 146 and 147), financial instruments (Note 21 on pages 150 to 162) and share-based payment plans (Note 33 on page 168). Essentially, discretionary judgments are made in respect of the following two areas: • The US dollar liabilities of Henkel of America, Inc., Wilmington, USA, are set off against sureties of Henkel US LLC, Wilmington, USA, as the deposit and the loan are with the same lender and of the same maturity, there is a legal right to set off these sums, and the Group intends to settle net. • The demarcation of the cash-generating units as explained in Note 1 on pages 128 to 131. 125 163 Notes to the consolidated statement of income 168 Other disclosures 175 Independent Auditor’s Report 177 Recommendation for the approval of the annual financial statements and the appropriation of the profit of Henkel AG & Co. KGaA 178 Annual financial statements of Henkel AG & Co. KGaA (summarized) 179 Responsibility statement by the Personally Liable Partner 180 Corporate management bodies of Henkel AG & Co. KGaA Application of IAS 8 to accounting policies In application of IAS 8 paragraph 28 ff., the following information is reported: We have changed the method of calculation for discount rates in the eurozone effective December 31, 2014. For obligations denominated in euros, Supranational Bonds – such as ESM, EFSF or EUROFIMA issues – have been excluded for the first time as such issues are generally regarded in the market as state-financing in nature. The discount rates are derived from yields of corporate bonds with an issue volume of over 250 million euros and a rating of at least AA– to AA+ by one of the three ratings agencies, Fitch, Moody’s or Standard & Poor’s. Pension obligations at the reporting date would have been higher by 180 million euros if they had been valued using a discount rate determined by the previous year’s method. The change in method has an effect on the net interest component for the coming fiscal year of 0 million euros. As a further improvement to the view of our net assets, financial position and results of operations, we have implemented a voluntary change in the presentation of our financial result in accordance with IAS 8.29. Under other financial result, we show the interest result from pension obligations, currency results, and sundry financial items. Comparable figures are shown for the previous year. 126 Notes to the consolidated financial statements Henkel Annual Report 2014 New international accounting regulations according to International Financial Reporting Standards (IFRSs) Accounting methods applied for the first time in the year under review 91 Significance IFRS 10 “Consolidated Financial Statements” relevant IFRS 11 “Joint Arrangements” relevant IFRS 12 “Disclosure of Interest in Other Entities” relevant IFRS 10 (Amendment), IFRS 11 (Amendment) and IFRS 12 (Amendment) “Transition Guidance” relevant IAS 28 (Amendment) “Investments in Associates and Joint Ventures” relevant IAS 32 (Amendment) “Offsetting Financial Assets and Liabilities” relevant IAS 36 (Amendment) “Recoverable Amount Disclosures for Non-Financial Assets” relevant IAS 39 (Amendment) “Novation of Derivatives and Continuation of Hedge Accounting” relevant • I n May 2011, the International Accounting Standards Board (IASB) published the new standards IFRS 10 “Consolidated Financial Statements,” IFRS 11 “Joint Arrangements,” and IFRS 12 “Disclosure of Interest in Other Entities,” as well as amendments to IAS 28 “Investments in Associates and Joint Ventures.” Under the new concept of IFRS 10, control exists when the potential parent company holds decision power over the potential subsidiary based on voting rights or other rights, it is exposed to positive and negative variability in returns from the subsidiary, and these returns may be affect ed by the decision power held by the parent. Under the new concept of IFRS 11, a distinction is made in a joint arrangement as to whether it is a joint operation or a joint venture. In a joint operation, the individual rights and obligations are accounted for proportionately in the consolidated financial statements. In contrast, joint ventures are represented in the consolidated financial statements using the equity method. As part of the adoption of IFRS 11, adjustments were also made to IAS 28. The new IFRS 12 expands the disclosure requirements for interests in other entities. The amendments relate to clarifications and additional changes to ease transition to IFRS 10, IFRS 11, and IFRS 12. The new standards and the amendments to standards must be applied beginning January 1, 2014. The amendments had no impact on the scope of consolidation. • In December 2011, the IASB published amendments to IAS 32 “Financial Instruments: Presentation.” The amendment to IAS 32 explains and clarifies the criteria for offsetting financial assets and financial liabilities in the statement of financial position. The amendments had no material impact on the consolidated financial statements. • As a consequential amendment resulting from IFRS 13, a new disclosure requirement concerning goodwill impairment testing in accordance with IAS 36 was introduced for 2013: Previously, the recoverable amount of the cash gener ating unit had to be disclosed regardless of whether an impairment had been recognized. Since this note had been introduced unintentionally, it was removed through this amendment in May 2013 for 2014. Conversely, the amendment now results in additional disclosures if an impairment has actually been recognized and the recoverable amount was determined on the basis of fair value. The amendments had no material impact on the consolidated financial statements. • With the amendment to IAS 39 in June 2013, a derivative maintains its designation as a hedging instrument under hedge accounting even if it is novated to a central counterparty as the result of legal requirements, provided certain criteria are met. The amendments had no material impact on the consolidated financial statements. The first-time application of the amended standards had no material impact on the presentation of our consolidated financial statements. Notes to the consolidated financial statements 112 Consolidated statement of financial position 114 Consolidated statement of income 115 Consolidated statement of comprehensive income 115 Consolidated statement of changes in equity 116 Consolidated statement of cash flows 127 117 Group segmentreport by business unit 118 Key financials by region 119 Accounting principles and methods applied in preparation of the consolidated financial statements 128 Notes to the consolidated statement of financial position Accounting regulations not applied in advance of their effective date In fiscal 2014, the IASB issued the following standards and amendments to existing standards of relevance to Henkel, which still have to be adopted into EU law (endorsement mechanism) before they become applicable: Accounting regulations not yet adopted into EU law 92 Mandatory for fiscal years beginning on or after General standard “Improvements to IFRS 2011–2013” 178 Annual financial statements of Henkel AG & Co. KGaA (summarized) 179 Responsibility statement by the Personally Liable Partner 180 Corporate management bodies of Henkel AG & Co. KGaA Accounting regulations not yet adopted into EU law The following standards and amendments to existing standards of possible relevance to Henkel, which have been adopted into EU law (endorsement mechanism) but are not yet mandatory, have not been applied early: Accounting regulations not applied in advance of their effective date 163 Notes to the consolidated statement of income 168 Other disclosures 175 Independent Auditor’s Report 177 Recommendation for the approval of the annual financial statements and the appropriation of the profit of Henkel AG & Co. KGaA January 1, 2015 • A s part of the IFRS annual improvement project, amendments were made to four standards. Adjustments to the w ording of individual IFRSs are intended to clarify existing regulations. The following standards are affected: IFRS 1, IFRS 3, IFRS 13 and IAS 40. The amendments are applicable for the first time for fiscal years beginning on or after January 1, 2015. These new standards and amendments to existing standards will be applied by Henkel from fiscal 2015 or later. Unless otherwise indicated, we expect the future application of the aforementioned regulations not to have a significant impact on the presentation of the financial statements. 93 Mandatory for fiscal years beginning on or after IAS 1 (Amendment) “Notes” IAS 19 (Amendment) “Defined Benefit Plans: Employee Contributions” January 1, 2016 July 1, 2014 IAS 16 and IAS 38 (Amendment) “Clarification of Acceptable Methods of Depreciation and Amortisation” January 1, 2016 IFRS 9 “Financial Instruments” January 1, 2018 IFRS 10 and IAS 28 (Amendment) “Sale or Contribution of Assets bet ween an Investor and its Associate or Joint Venture” January 1, 2016 IFRS 11 (Amendment) “Acquisition of an Interest in a Joint Operation” January 1, 2016 IFRS 15 “Revenue from Contracts with Customers” January 1, 2017 IFRIC 21 “Levies” January 1, 2014 General standard “Improvements to IFRS 2010–2012” July 1, 2014 General standard “Improvements to IFRS 2012–2014” January 1, 2016 These standards and amendments to existing standards will be applied by Henkel starting in fiscal 2015 or later. 128 Notes to the consolidated financial statements Henkel Annual Report 2014 Notes to the consolidated statement of financial position The measurement and recognition policies for financial statement items are described in the relevant note. Non-current assets The following unchanged, standardized useful lives a re applied: All non-current assets with definite useful lives are depreciated or amortized exclusively using the straight-line method on the basis of estimated useful lives. The useful life estimates are reviewed annually. If facts or circumstances indicate the need for impairment, the recoverable amount is determined. It is measured as the higher of the fair value less costs to sell (net realizable value) and the value in use. Impairment losses are recognized if the recoverable amounts of the assets are lower than their carrying amounts, and are charged to the relevant functions. Useful life 94 in years Intangible assets with definite useful lives 3 to 20 Residential buildings 50 Office buildings 40 Research and factory buildings, workshops, stores and staff buildings 25 to 33 Plant facilities 10 to 25 Machinery 7 to 10 Office equipment 10 Vehicles 5 to 20 Factory and research equipment 2 to 5 1 Intangible assets Cost 95 Trademarks and other rights Assets with indefinite useful lives Assets with definite useful lives in million euros At January 1, 2013 Internally Intangible assets generated in development intangible assets with definite useful lives Goodwill Total 9,651 1,242 1,537 200 – 6,672 Acquisitions – 1 – – 11 12 Divestments – – – – – 2 – 2 Additions – 9 23 – – 32 Disposals – – 22 – 5 – – – 27 – 5 – 5 Reclassifications to assets held for sale – – – Reclassifications – 3 1 – – 4 – 47 – 79 – 4 – – 309 – 439 Translation differences 1,195 1,449 215 – 6,367 9,226 Acquisitions At December 31, 2013 / January 1, 2014 434 74 2 – 1,141 1,651 Divestments – – – – – – Additions – 8 5 52 – 65 Disposals – – 5 – 5 – – 1 – 11 Reclassifications to assets held for sale – – 16 – – – 4 – 20 33 – 31 – 4 11 2 11 Translation differences 158 27 7 1 580 773 At December 31, 2014 1,820 1,506 220 64 8,085 11,695 Reclassifications Notes to the consolidated financial statements 112 Consolidated statement of financial position 114 Consolidated statement of income 115 Consolidated statement of comprehensive income 115 Consolidated statement of changes in equity 116 Consolidated statement of cash flows 129 117 Group segmentreport by business unit 118 Key financials by region 119 Accounting principles and methods applied in preparation of the consolidated financial statements 128 Notes to the consolidated statement of financial position 163 Notes to the consolidated statement of income 168 Other disclosures 175 Independent Auditor’s Report 177 Recommendation for the approval of the annual financial statements and the appropriation of the profit of Henkel AG & Co. KGaA 178 Annual financial statements of Henkel AG & Co. KGaA (summarized) 179 Responsibility statement by the Personally Liable Partner 180 Corporate management bodies of Henkel AG & Co. KGaA 96 Accumulated amortization / impairment Trademarks and other rights Assets with indefinite useful lives Assets with definite useful lives Goodwill Total 13 861 121 – – – – 11 1,006 – – – 5 – – – – – – 5 Scheduled amortization – Impairment losses 8 81 20 – – 101 – – – 5 Disposals – 13 – 21 – 5 – – – 26 Reclassifications to assets held for sale – Reclassifications – – – – – 2 – 2 – 1 1 – – Translation differences – – – 48 – 2 – – – 50 1,037 in million euros At January 1, 2013 Divestments Write-ups At December 31, 2013 / January 1, 2014 Internally Intangible assets generated in development intangible assets with definite useful lives 16 872 135 – 14 Divestments – – – – – Write-ups – – – – – 3 1 – 3 99 – Scheduled amortization – 79 20 – – Impairment losses – – 1 – – 1 Disposals – – 6 – 6 – – – 12 – 10 Reclassifications to assets held for sale – – 10 – – – Reclassifications – – 2 2 – – – Translation differences – – 12 5 – – – 7 At December 31, 2014 16 921 157 – 11 1,105 1 See Note 9 “Assets and liabilities held for sale” on page 135. Net book values 97 Trademarks and other rights Assets with indefinite useful lives Assets with definite useful lives At December 31, 2014 1,804 585 63 At December 31, 2013 1,179 577 80 in million euros Goodwill represents the future economic benefit of assets that are acquired through business combinations and not individually identifiable and separately recognized, as well as expected synergies, and is recognized at cost. Trademarks and other rights acquired for valuable consideration are stated at purchase cost, while internally generated software is stated at development cost. Additions to internally generated intangible assets mostly reflect investments in consolidating and optimizing our IT system architecture for managing business processes. Internally Intangible assets generated in development intangible assets with definite useful lives Goodwill Total 64 8,074 10,590 – 6,353 8,189 The change in goodwill resulting from acquisitions and divestments made in the fiscal year is presented in the section “Acquisitions and divestments” on pages 120 to 122. Goodwill as well as trademarks and other rights with indefinite useful lives are subjected to an impairment test at least once a year and also when indicators of impairment are present (“impairment only” approach). Amortization and impairment of trademarks and other rights are recognized as selling expenses. Amortization and impairment of other intangible assets are allocated to the relevant functions in the consolidated statement of income. 130 Notes to the consolidated financial statements Henkel Annual Report 2014 In the course of our annual impairment test, we reviewed the carrying amounts of goodwill. The following table shows the cash-generating units together with the associated goodwill at book value at the reporting date. The description of the cash-generating units can be found in the notes to the consolidated financial statements, Note 34 on pages 169 and 170 and in the Group management report on pages 88 to 99. Book values – Goodwill 98 December 31, 2013 December 31, 2014 Goodwill Goodwill Laundry Care 653 1,070 Home Care 753 1,186 Total Laundry & Home Care 1,406 2,256 Branded Consumer Goods 1,026 1,149 Cash-generating units (summarized) in million euros 98 284 Total Beauty Care 1,124 1,433 Industrial Adhesives 3,452 4,012 Hair Salon Business Adhesives for Consumers, Craftsmen and Building Total Adhesive Technologies 371 373 3,823 4,385 We assess goodwill impairment according to the fair-value-lesscosts-to-sell approach on the basis of future estimated cash flows which are obtained from corporate budgets. The determination of fair value (before deduction of costs to sell) is allocated to valuation level 3 of the fair value hierarchy (see Note 21 on pages 150 to 162). The assumptions upon which the essential planning parameters are based reflect experience gained in the past, aligned to current information provided by external sources. Budgets are prepared on the basis of a financial planning horizon of three years. For the period after that, a growth rate in a range between 1 and 2 percent in the cash flows is assumed for the purpose of impairment testing. The US dollar to euro exchange rate applied is 1.35. Taking into account specific tax effects, the cash flows in all cash-generating units are discounted at different rates reflecting the weighted average cost of capital (WACC) in each business unit: 6 .00 percent after tax for both Laundry & Home Care and Beauty Care, and 7.50 percent after tax for Adhesive Technologies. The reportable segment Industrial Adhesives is comprised of the business areas Packaging and Consumer Goods Adhesives, Transport and Metal, General Industry and Electronics. Goodwill at our Packaging, Consumer Goods and C onstruction Adhesives businesses in fiscal 2014 amounted to 1,886 million euros (previous year: 1,782 million euros), while goodwill at Transport and Metal, General Industry and Electronics had a value of 2,126 million euros in 2014 (previous year: 1,670 million euros). In the Laundry & Home Care business unit, we have assumed an increase in sales during the three-year detailed forecasting horizon of 3 to 4 percent per year, with a slight increase in market share. Sales growth in the Beauty Care business unit over the three-year forecasting horizon is budgeted at around 3 percent per annum. Here, too, we expect a slight increase in market share. Sales in the Adhesive Technologies business unit are expected to grow by around 6 percent per annum on average over the detailed three-year forecasting horizon, and thus above the market average. In all the business units, we assume that a future increase in the cost of raw materials can be extensively offset by cost reduction measures in purchasing and by passing the increase on to our customers, as well as through the implementation of efficiency improvement measures. Given our continued pro-active management of the portfolio, we anticipate achieving at least stable gross margins in all our business units. The impairment tests revealed sufficient impairment buffers so that, as in the previous year, no impairment of goodwill was required. Trademarks and other rights with indefinite useful lives are presented in the following table. Book values – Trademarks and other rights 99 December 31, 2013 December 31, 2014 Trademarks and other rights with indefinite useful lives Trademarks and other rights with indefinite useful lives Laundry Care 359 652 Home Care 234 342 Total Laundry & Home Care 593 994 Branded Consumer Goods 442 502 13 109 455 611 80 135 by business area (summarized) in million euros Hair Salon Business Total Beauty Care Industrial Adhesives Adhesives for Consumers, Craftsmen and Building Total Adhesive Technologies 51 64 131 199 We assess impairment of trademarks and other rights with indefinite useful lives according to fair-value-less-costs-to-sell approach at the level of the cash-generating unit, which consists of either the global business unit (Adhesive Technologies) or regionally strategic business units. We base the approach on future estimated cash flows which are obtained from business Notes to the consolidated financial statements 112 Consolidated statement of financial position 114 Consolidated statement of income 115 Consolidated statement of comprehensive income 115 Consolidated statement of changes in equity 116 Consolidated statement of cash flows 131 117 Group segmentreport by business unit 118 Key financials by region 119 Accounting principles and methods applied in preparation of the consolidated financial statements 128 Notes to the consolidated statement of financial position 163 Notes to the consolidated statement of income 168 Other disclosures 175 Independent Auditor’s Report 177 Recommendation for the approval of the annual financial statements and the appropriation of the profit of Henkel AG & Co. KGaA 178 Annual financial statements of Henkel AG & Co. KGaA (summarized) 179 Responsibility statement by the Personally Liable Partner 180 Corporate management bodies of Henkel AG & Co. KGaA lion euros) are established in their markets and will continue to be intensively promoted. Moreover, there are no other statutory, regulatory or competition-related factors that limit our usage of our brand names. The value of trademarks and other rights with indefinite useful lives attributable to our Industrial Adhesives segment i s composed of 46 million euros (previous year: 40 million euros) for our Packaging, Consumer Goods and Construction Adhesives businesses, and 89 million euros (previous year:40 million euros) for our Transport and Metal, General Industry, and Electronics businesses. budgets. The calculation of fair value (before deduction of costs to sell) is allocated to valuation level 3 of the fair value hierarchy (see Note 21 on pages 150 to 162). The assumptions upon which the essential planning parameters are based reflect experience gained in the past, aligned to current information provided by external sources. Budgets are prepared on the basis of a financial planning horizon of three years. For the period after that, a growth rate in a range between 0.2 and 5 percent in the cash flows is assumed for the purpose of impairment testing. The US dollar to euro exchange rate applied is 1.35. Taking into account specific tax effects, the cash flows in all cash- generating units are discounted at different rates, with a range between 7.5 and 16 percent applied as the applicable weighted average cost of capital (WACC) to each cash-generating unit. The impairment tests revealed sufficient impairment buffers so that no impairment of trademarks and other rights with indefinite useful lives was required. Our annual impairment tests on trademarks and other rights with indefinite useful lives required impairment losses of 0 million euros (previous year: 8 million euros) in the Laundry & Home Care business unit. No impairment reversals were made in fiscal 2014. The company also intends to continue using the brands disclosed as having definite useful lives. No impairment losses were registered with respect to trademarks and other rights with definite useful lives in 2014. The trademarks and other rights with indefinite useful lives with a net book value of 1,804 million euros (previous year: 1,179 mil- 2 Property, plant and equipment Cost in million euros At January 1, 2013 100 Land, land rights and buildings Plant and machinery Factory and office equipment Assets in the course of construction Total 5,966 2,038 2,763 949 216 Acquisitions 10 6 – 1 17 Divestments – 8 – 15 – 4 – – 27 Additions 21 86 61 236 404 Disposals – 37 – 92 – 91 – 4 – 224 – 2 Reclassifications to assets held for sale – 2 – – – Reclassifications 44 109 30 – 188 – 5 – 66 – 80 – 31 – 10 – 187 5,942 Translation differences 2,000 2,777 914 251 Acquisitions At December 31, 2013 / January 1, 2014 20 19 4 3 46 Divestments – 11 – 37 – 1 – – 49 Additions 22 104 61 265 452 Disposals – 7 – 74 – 55 – 1 – 137 – 28 – 47 – 4 1 – 78 Reclassifications 56 105 35 – 207 – 11 Translation differences 36 25 19 – 2 78 At December 31, 2014 2,088 2,872 973 310 6,243 Reclassifications to assets held for sale 132 Notes to the consolidated financial statements Henkel Annual Report 2014 in million euros 101 Accumulated depreciation / impairment Land, land rights and buildings Plant and machinery Factory and office equipment Assets in the course of construction Total 954 1,977 721 – 3,652 – 4 – 12 – 3 – – 19 – – – – – 57 152 82 – 291 At January 1, 2013 Divestments Write-ups Scheduled depreciation Impairment losses Disposals Reclassifications to assets held for sale 3 13 4 – 20 – 27 – 89 – 89 – – 205 – 2 – 2 – – – – – 1 1 – – – 20 – 48 – 21 – 1 – 90 At December 31, 2013 / January 1, 2014 961 1,992 695 – 1 3,647 Divestments – 11 – 37 – 1 – – 49 – – 2 – 1 – 1 – 4 55 154 80 – 289 Reclassifications Translation differences Write-ups Scheduled depreciation Impairment losses 17 17 – – 34 Disposals – 5 – 70 – 53 – – 128 – 24 – 41 – 3 1 – 67 1 – – 1 – – Translation differences 14 29 17 – 60 At December 31, 2014 1,008 2,042 733 – 1 3,782 Net book values Reclassifications to assets held for sale Reclassifications in million euros 102 Land, land rights and buildings Plant and machinery Factory and office equipment Assets in the course of construction Total At December 31, 2014 1,080 830 240 311 2,461 At December 31, 2013 1,039 785 219 252 2,295 Additions are stated at purchase or manufacturing cost. The latter includes direct costs and appropriate proportions of necessary overheads. Interest charges on borrowings are not included, as Henkel does not currently hold any qualifying assets in accordance with IAS 23 “Borrowing Costs.” A qualifying asset is an asset that necessarily takes a substantial period of time to get ready for its intended use. Cost figures are shown net of investment grants and allowances. Incidental acquisition costs incurred in order to make the asset ready for the intended use are capitalized. An overview of the primary investment projects undertaken during the fiscal year can be found on pages 70 and 71 in the Group management report. At December 31, 2014, property, plant and equipment with a carrying amount of 0 million euros had been pledged as collateral for existing liabilities. The periods over which the assets are depreciated are based on their estimated useful lives as set out on page 128. Scheduled depreciation and impairment losses recognized are allocated to the relevant functions in t he consolidated statement of income. Of the impairment losses amounting to 34 million euros, production optimization measures attributable to the Laundry & Home Care business unit accounted for 24 million euros. In the Adhesive Technologies business unit, impairment losses of 7 million euros were recognized as a result of production optimization measures. Notes to the consolidated financial statements 112 Consolidated statement of financial position 114 Consolidated statement of income 115 Consolidated statement of comprehensive income 115 Consolidated statement of changes in equity 116 Consolidated statement of cash flows 133 117 Group segmentreport by business unit 118 Key financials by region 119 Accounting principles and methods applied in preparation of the consolidated financial statements 128 Notes to the consolidated statement of financial position 163 Notes to the consolidated statement of income 168 Other disclosures 175 Independent Auditor’s Report 177 Recommendation for the approval of the annual financial statements and the appropriation of the profit of Henkel AG & Co. KGaA 178 Annual financial statements of Henkel AG & Co. KGaA (summarized) 179 Responsibility statement by the Personally Liable Partner 180 Corporate management bodies of Henkel AG & Co. KGaA 3 Other financial assets 103 Analysis December 31, 2013 December 31, 2014 Non-current Current Total Non-current Current Receivables from associated companies – – – – 1 1 Financial receivables from third parties 15 17 32 14 20 34 Derivative financial instruments 95 57 152 51 37 88 5 – 5 5 – 5 18 – 18 21 – 21 in million euros Investments accounted for using the equity method Other investments Total Receivable from Henkel Trust e.V. – 120 120 – 226 226 Securities and time deposits – 2,380 2,380 – 301 301 19 Financial collateral provided Sundry financial assets Total – 26 26 – 19 15 64 79 23 72 95 148 2,664 2,812 114 676 790 Sundry non-current financial assets include, among others, receivables from employees. The sundry current financial assets include the following: • Receivables from sureties and guarantee deposits amounting to 29 million euros (previous year: 34 million euros) • Receivables from suppliers amounting to 13 million euros ( previous year: 9 million euros) • Receivables from employees amounting to 14 million euros (previous year: 11 million euros) With the exception of investments, derivatives, securities and time deposits, other financial assets are measured at amortized cost. The receivable from Henkel Trust e.V. relates to pension payments made by Henkel AG & Co. KGaA to retirees, for which reimbursement can be claimed from Henkel Trust e.V. Included under securities and time deposits are monies deposited as part of our short-term financial management arrangements. The securities involved are fixed-interest and floating-interest bonds. All the bonds are publicly listed and can be sold at short notice. 4 Other assets 104 Analysis December 31, 2013 December 31, 2014 in million euros Non-current Current Total Non-current Current Total Tax receivables 3 136 139 – 156 156 Payments on account – 17 17 1 14 15 Overfunding of pension obligations 3 – 3 25 – 25 Reimbursement rights related to employee benefits 89 7 96 97 8 105 Accruals 20 59 79 16 69 85 1 22 23 1 37 38 116 241 357 140 284 424 Sundry other assets Total 134 Notes to the consolidated financial statements 5 Deferred taxes Deferred taxes are recognized for temporary differences between the valuation of an asset or a liability in the financial statements and its tax base, for tax losses carried forward, and for unused tax credits. This also applies to temporary differences in valuation arising through acquisitions, with the exception of goodwill. Deferred tax liabilities on taxable temporary differences related to shares in subsidiaries are recognized to the extent that a reversal of this difference is expected in the foreseeable future. Changes in the deferred taxes in the statement of financial position result in deferred tax expenses or income unless the underlying item is directly recognized in equity. For items recognized directly in other comprehensive income, the associated deferred taxes are also recognized in other comprehensive income. The valuation, recognition and breakdown of deferred taxes in respect of the various items in the statement of financial position are disclosed under Note 30 (“Taxes on income”) on pages 165 to 167. 6 Inventories In accordance with IAS 2, reported under inventories are those assets that are intended to be sold in the ordinary course of business (finished products and merchandise), those in the process of production for such sale (work in progress) and those to be utilized or consumed in the course of manufacture or the rendering of services (raw materials and supplies). Payments on account made for the purpose of purchasing inventories are likewise disclosed under the inventories heading. Inventories are measured at the lower of cost and net realizable value. Inventories are measured using either the “first in, first out” (FIFO) or the average cost method. Manufacturing cost includes not only the direct costs but also appropriate portions of necessary overheads (for example goods-in department, raw material storage, filling, costs incurred through to the finished goods warehouse), production-related administrative expenses, the costs of the retirement pensions of people who are employed in the production process, and production-related amortization /depreciation. The overhead add-ons are calculated on the basis of average capacity utilization. Not included, however, are interest expensesincurred during the manufacturing period. Henkel Annual Report 2014 The net realizable value is determined as an estimated selling price less costs yet to be incurred through to completion, and necessary selling and distribution costs. Write-downs to the net realizable value are made if, at year-end, the carrying amounts of the inventories are above their realizable fair values. The resultant valuation allowance amounted to 129 million euros (previous year: 125 million euros). The carrying amount of inventories recognized at fair value less costs to sell amounted to 378 million euros. The carrying amount of inventories pledged as security for liabilities amounted to 32 million euros. 105 Analysis of inventories in million euros Raw materials and supplies December 31, 2013 December 31, 2014 431 491 56 67 1,000 1,110 Work in progress Finished products and merchandise 7 3 1,494 1,671 Payments on account for merchandise Total 7 Trade accounts receivable Trade accounts receivable amounted to 2,747 million euros (previous year: 2,370 million euros). They are all due within one year. Valuation allowances have been recognized in respect of specific risks as appropriate. Overall, we recognized total valuation allowances of 20 million euros (previous year: 17 million euros). Trade accounts receivable in million euros Trade accounts receivable, gross December 31, 2013 December 31, 2014 2,468 2,855 less: cumulative valuation allowances on t rade accounts receivable Trade accounts receivable, net 98 108 2,370 2,747 Development of valuation allowances on trade accounts receivable in million euros Valuation allowances at January 1 Additions 106 107 2013 2014 109 98 13 14 Derecognition of receivables – 20 – 6 Currency translation effects – 4 2 Valuation allowances at December 31 98 108 Notes to the consolidated financial statements 112 Consolidated statement of financial position 114 Consolidated statement of income 115 Consolidated statement of comprehensive income 115 Consolidated statement of changes in equity 116 Consolidated statement of cash flows 117 Group segmentreport by business unit 118 Key financials by region 119 Accounting principles and methods applied in preparation of the consolidated financial statements 128 Notes to the consolidated statement of financial position 8 Cash and cash equivalents Recognized under cash and cash equivalents are liquid funds, sight deposits and other financial assets with an original term of not more than three months. In accordance with IAS 7, also recognized under cash equivalents are shares in money market funds which, due to their first-class credit rating and investment in extremely short-term money market securities, undergo only minor value fluctuations and can be readily converted within one day into known amounts of cash. Utilized bank overdrafts are recognized in the statement of financial position as liabilities to banks. The volume of cash and cash equivalents increased compared to the previous year from 1,051 million euros to 1,228 million euros. Of this figure, 716 million euros (previous year: 873 million euros) relates to cash and 512 million euros (previous year: 178 million euros) to cash equivalents. The change is shown in the consolidated statement of cash flows. eld for sale 9 Assets and liabilities h Assets held for sale are assets that can be sold in their current condition and whose sale is very probable. Disposal must be expected within one year from the time of reclassification as held for sale. Such assets may be individual assets, groups of assets (disposal groups) or business operations (discontinued operations). Assets held for sale are no longer subject to scheduled depreciation and amortization and are instead recognized at the lower of carrying amount a nd fair value less costs to sell (level 3), which is determined by the current price negotiations with potential buyers. Compared to December 31, 2013, assets held for sale declined by 5 million euros to 31 million euros. There are no longer any liabilities held for sale (December 31, 2013: 29 million euros). Due to the change in the overall political environment, we have decided not to further pursue the planned sale of our Iranian companies. We have therefore reclassified the associated asset and liability items back to their respective categories in the consolidated statement of financial position. This resulted in a reversal of the impairment recognized in the previous year in the amount of 25 million euros, which has been recognized as income in the consolidated statement of income. In addition, our assets held for sale declined when we successfully completed the sale of a non-core activity in the Adhesive Technologies business unit and transferred the assets to the buyer. Counteracting this reduction was the reclassification of our administration building for sale in Spain and our chemical additives business for the processing industry for sale in the Adhesive Technologies business unit. 135 163 Notes to the consolidated statement of income 168 Other disclosures 175 Independent Auditor’s Report 177 Recommendation for the approval of the annual financial statements and the appropriation of the profit of Henkel AG & Co. KGaA 178 Annual financial statements of Henkel AG & Co. KGaA (summarized) 179 Responsibility statement by the Personally Liable Partner 180 Corporate management bodies of Henkel AG & Co. KGaA 108 Assets and liabilities held for sale December 31, 2014 in million euros 25 Intangible assets and property, plant and equipment Inventories and trade accounts receivable 2 Cash and cash equivalents – Other assets 4 Provisions – Borrowings – – Other liabilities Net assets 31 10 Issued capital 109 Issued capital December 31, 2013 December 31, 2014 Ordinary bearer shares 260 260 Preferred bearer shares 178 178 Capital stock 438 438 in million euros Comprising: 259,795,875 ordinary shares, 178,162,875 non-voting preferred shares. All shares are fully paid in. The ordinary and preferred shares are bearer shares of no par value, each of which represents a nominal proportion of the capital stock amounting to 1 euro. The liquidation proceeds are the same for all shares. The number of ordinary shares issued remained unchanged from the previous year. The number of preferred shares in circulation increased slightly from the previous year and amounted to 174,482,311 shares at December 31, 2014. According to Art. 6 (5) of the Articles of Association, the Personally Liable Partner is authorized – with the approval of the Shareholders’ Committee and of the Supervisory Board – to increase the capital of the corporation in one or more installments at any time until April 18, 2015, by as much as 25.6 million euros (25.6 million shares) in total by issuing new non-voting preferred shares to be paid up in cash (authorized capital). All shareholders are essentially assigned pre-emptive rights. However, these may be set aside where necessary in order to grant to holders of bonds with warrants or conversion rights issued by the corporation, or one of the companies dependent upon it, pre-emptive rights to new shares corresponding to those that would accrue to such bondholders following the exercise of their warrant or conversion rights, or if the issue price of the new shares is not significantly below the quoted market price at the time of issue price fixing. Preemptive rights may also be set aside where necessary in order to dispose of fractional amounts. 136 Notes to the consolidated financial statements On April 19, 2010, the Annual General Meeting of Henkel AG & Co. KGaA resolved to authorize the Personally Liable Partner to acquire, by April 18, 2015, ordinary or preferred shares of the corporation representing a nominal proportion of the capital stock of not more than 10 percent. This authorization can be exercised for any legal purpose. To the exclusion of the preemptive rights of existing shareholders, treasury shares may be transferred to third parties for the purpose of acquiring companies or investing in companies. Treasury shares may also be sold to third parties against payment in cash, provided that the selling price is not significantly below the quoted market price at the time of share disposal. The shares may likewise be used to satisfy warrants or conversion rights granted by the corporation. The Personally Liable Partner has also been authorized – with the approval of the Shareholders’ Committee and of the Supervisory Board – to cancel treasury shares without the need for further resolution by the Annual General Meeting. The proportion of capital stock represented by treasury shares issued or sold on the basis of these authorizations must not exceed a total of 10 percent. Also to be taken into account in this restriction are shares used to service bonds with warrants or conversion rights or a conversion obligation, issued by the corporation or one of the companies dependent upon it, where these bonds were or are issued with the pre-emptive rights of existing shareholders excluded. Treasury shares held by the corporation at December 31, 2014 amounted to 3,680,564 preferred shares. This represents 0.84 percent of the capital stock and a proportional nominal value of 3.7 million euros. The number of treasury shares de clined in 2014 by 6 shares due to the exercise of subscription rights. This represents 0.0 percent of the capital stock and a proportional nominal value of 0 million euros. The gain on the sale was 0 million euros. See also the explanatory notes on pages 30 to 32 of the Group management report. Henkel Annual Report 2014 11 Capital reserve The capital reserve comprises the amounts received in previous years in excess of the nominal value of preferred shares and convertible warrant bonds issued by Henkel AG & Co. KGaA. 12 Retained earnings Recognized in retained earnings are the following: • Amounts allocated in the financial statements of Henkel AG & Co. KGaA in previous years • Amounts allocated from consolidated net income less those amounts attributable to non-controlling interests • Buy-back of treasury shares by Henkel AG & Co. KGaA at cost and the proceeds from their disposal • Actuarial gains and losses recognized in equity • The acquisition or disposal of ownership interests in subsidiaries with no change in control For details on the acquisition of ownership interests in subsidiaries with no change in control in fiscal 2014, please see the section “Acquisitions and divestments” on pages 120 to 122. 13 Other components of equity Reported under this heading are differences reported in equity arising from the currency translation of annual financial statements of foreign subsidiaries and also the effects arising from the valuation in total comprehensive income of financial assets in the “Available for sale” category and of derivative financial instruments for which hedge accounting is used. The latter are derivatives used in connection with cash flow hedges or hedges of a net investment in a foreign entity. Due in particular to the appreciation of the US dollar versus the euro, the negative difference attributable to shareholders of Henkel AG & Co. KGaA arising from currency translation declined compared to the figure at December 31, 2013, by 613 million euros to –723 million euros. Notes to the consolidated financial statements 112 Consolidated statement of financial position 114 Consolidated statement of income 115 Consolidated statement of comprehensive income 115 Consolidated statement of changes in equity 116 Consolidated statement of cash flows 117 Group segmentreport by business unit 118 Key financials by region 119 Accounting principles and methods applied in preparation of the consolidated financial statements 128 Notes to the consolidated statement of financial position 14 Non-controlling interests Recognized under non-controlling interests are equity shares held by third parties measured on the basis of the proportion of net assets. 15 Pension obligations Description of the pension plans Employees in companies included in the consolidated financial statements have entitlements under company pension plans which are either defined contribution or defined benefit plans. These take different forms depending on the legal, financial and tax regime of each country. The level of benefits provided is based, as a rule, on the length of service and on the income of the person entitled. Details on pension benefits for members of the Management Board are provided in the r emuneration report on pages 38 to 49. In defined benefit plans, the liability for pensions and other post-employment benefits is calculated at the present value of the future obligations (projected unit credit method). This actuarial method of calculation takes future trends in wages, salaries and retirement benefits into account. The majority of the r ecipients of pension benefits are located in Germany and the USA. The pension obligations are primarily financed via various external trust assets that are legally independent of Henkel. Active employees of Henkel in Germany participate in a defined contribution system, “Altersversorgung 2004 (AV 2004),” which was newly formed in 2004. AV 2004 is an employer-financed pension plan that reflects the personal income development of employees during their career at H enkel and thus provides a defined benefit pension. Henkel guarantees a minimum return on the company’s contributions. The benefit essentially consists of an annuity payable upon attainment of the retirement age plus a lump-sum payment if the annuity threshold is exceeded in the employee’s service period. In addition to age and disability pensions, the plan benefits include surviving spouse and surviving child benefits. 137 163 Notes to the consolidated statement of income 168 Other disclosures 175 Independent Auditor’s Report 177 Recommendation for the approval of the annual financial statements and the appropriation of the profit of Henkel AG & Co. KGaA 178 Annual financial statements of Henkel AG & Co. KGaA (summarized) 179 Responsibility statement by the Personally Liable Partner 180 Corporate management bodies of Henkel AG & Co. KGaA Employees who started at Henkel after April 1, 2011, participate in the pension plan “Altersversorgung 2011 (AV 2011).” AV 2011 is an employer-financed, fund-linked retirement plan funded by contributions based on the income development of the employee. Henkel ensures its employees that a principal amount is available upon retirement which is at least equivalent to the level of principal contributions made by Henkel. Henkel makes the pension contribution to an investment fund established for the purpose of the company pension plan. Upon attaining retirement age, the employee can choose between an annuity through transfer of the superannuation lump sum to a pension fund, or a one-time payment. To provide protection under civil law of the pension entitlements of future and current pensioners of Henkel AG & Co. KGaA against insolvency, we have transferred the proceeds of the bond issued in 2005 and certain other assets to Henkel Trust e.V. The trustee invests the cash with which it has been entrusted in the capital market in accordance with investment policies laid down in the trust agreement. In addition, we also subsidize medical benefits for retired employees resident mainly in the USA. Under these programs, retirees are reimbursed for a certain percentage of their medical expenses. We build provisions during the employees’ service period and pay the promised benefits when they are claimed. The defined contribution plans are structured in such a way that the corporation pays contributions to public or private sector institutions on the basis of statutory or contractual terms or on a voluntary basis and has no further obligations regarding the payment of benefits to employees. The contributions for defined contribution plans, excluding multi-employer plans, for the reporting period amounted to 95 million euros (previous year: 85 million euros). In 2014, we paid 47 million euros to public sector institutions (previous year: 46 million euros) and 48 million euros to private sector institutions (previous year: 39 million euros). No extraordinary events occurred in the reporting period. Multi-employer plans 138 Notes to the consolidated financial statements Henkel Annual Report 2014 average. The mortality rates used are based on published statistics and experience relating to each country. In Germany, the assumptions are based on the “Heubeck 2005G” mortality table. In the USA, the assumptions are based on the modified “RP 2014” mortality table. The amended mortality table in the USA resulted in an actuarial loss of 9 million euros. The valuation of pension obligations in Germany was based essentially on the assumption of a 2-percent increase in retirement benefits (previous year: 2 percent). Henkel provides defined pension benefits that are financed by more than one employer. The following multi-employer plans are treated as defined contribution plans because, due to the limited share of the contribution volume in the plans, the information available for each of the financing companies is insufficient for defined benefit accounting. In the Henkel Group, benefits from multi-employer plans are provided for employees primarily in the USA and Japan. Withdrawal from our multi- employer plans at the present time would incur a one-time expense of around 25 million euros (previous year: around 25 million euros). Payments into multi-employer plans in fiscal 2014 amounted to 2 million euros (previous year: 2.2 million euros). We expect contributions of around 2 million euros in fiscal 2015. The discount rate is based on yields in the market for high- ranking corporate bonds on the respective date. The currency and term of the underlying bonds are aligned with the currency and expected maturities of the post-employment pension obligation. Assumptions Group-wide, the obligations from our pension plans are valued by an independent external actuary at the end of the fiscal year. The calculations at the end of the fiscal year are based on the actuarial assumptions below. These are given as the weighted 110 Actuarial assumptions in percent 2013 2014 2 2013 2014 2013 Discount rate 3.00 1.70 4.90 4.10 3.50 2.60 Income trend 3.25 3.25 4.25 3.40 3.25 2.60 – – 7.50 7.30 3.00 3.30 Germany Expected increases in costs for medical benefits USA Other countries 1 2014 in years Life expectancy at age 65 as of the valuation date for a person c urrently 65 years old 20.8 20.9 21.0 22.0 23.5 23.1 40 years old 24.0 24.1 21.0 23.0 26.0 25.4 1 Weighted average. 2 See notes on page 125, “Application of IAS 8 to accounting policies.” Notes to the consolidated financial statements 112 Consolidated statement of financial position 114 Consolidated statement of income 115 Consolidated statement of comprehensive income 115 Consolidated statement of changes in equity 116 Consolidated statement of cash flows 139 117 Group segmentreport by business unit 118 Key financials by region 119 Accounting principles and methods applied in preparation of the consolidated financial statements 128 Notes to the consolidated statement of financial position 163 Notes to the consolidated statement of income 168 Other disclosures 175 Independent Auditor’s Report 177 Recommendation for the approval of the annual financial statements and the appropriation of the profit of Henkel AG & Co. KGaA 178 Annual financial statements of Henkel AG & Co. KGaA (summarized) 179 Responsibility statement by the Personally Liable Partner 180 Corporate management bodies of Henkel AG & Co. KGaA 111 Present value of pension obligations at December 31, 2013 Germany in million euros At January 1, 2013 2,684 USA Other countries 1,226 940 Total 4,850 Changes in the Group – – – – Translation differences – – 38 – 25 – 63 Actuarial gains (–)/losses (+) – 97 1 – 109 11 of which: from changes in demographic assumptions 1 – 23 – 23 of which: from changes in financial assumptions 2 – 120 13 – 105 – 1 – 12 – 2 – 15 44 19 30 93 Employee contributions to pension funds 3 – 2 5 Gains (–)/losses (+) arising from the termination and curtailment of plans – – – 1 – 1 of which: from experience adjustments Current service cost Interest expense Retirement benefits paid out of plan assets / out of reimbursement rights Employer’s payments for pension obligations At December 31, 2013 of which: unfunded obligations of which: funded obligations of which: obligations covered by reimbursement rights 78 44 30 152 – 118 – 156 – 41 – 315 – 18 – 24 – 13 – 55 2,674 962 933 4,569 83 267 103 453 2,591 648 830 4,069 – 47 – 47 1 Other countries not calculated due to materiality; figures reported based on financial assumptions. Fair value of plan assets at December 31, 2013 112 in million euros At January 1, 2013 Germany USA Other countries Total 2,373 822 705 3,900 Changes in the Group – – – – Translation differences – – 30 – 16 – 46 28 – 34 62 3 – 2 5 – 118 – 149 – 41 – 308 72 29 23 124 – – 3 – – 3 57 – 21 – 18 18 2,415 648 689 3,752 Employer contributions to pension funds Employee contributions Retirement benefits paid out of plan assets Interest income on plan assets Plan administration costs Remeasurements in equity At December 31, 2013 Fair value of reimbursement rights at December 31, 2013 113 Germany USA Other countries Total At January 1, 2013 – 89 – 89 Changes in the Group – – – – Translation differences – – 4 – – 4 Employer contributions – 8 – 8 Employee contributions – – – – Retirement benefits paid out of reimbursement rights – – 7 – – 7 Interest income on plan assets – 4 – 4 Remeasurements in equity – 6 – 6 At December 31, 2013 – 96 – 96 in million euros 140 Notes to the consolidated financial statements Net liability from pension obligations at December 31, 2013 in million euros At January 1, 2013 Henkel Annual Report 2014 114 Germany USA Other countries Total 311 409 240 960 44 19 30 93 – – – 1 – 1 Recognized through profit or loss Current service cost Gains (–)/losses (+) arising from the termination and curtailment of plans Plan administration costs – 3 – 3 Interest expense 6 11 7 24 Recognized in equity in other comprehensive income 1 – 109 11 – 97 – 57 21 18 – 18 Interest income on reimbursement rights – – 6 – – 6 Change in effect of asset ceiling – – – 2 – 2 – 125 Actuarial gains (–)/losses (+) Interest income on plan assets Other items recognized in equity Employer’s payments – 46 – 32 – 47 Changes in the Group – – – – Translation differences – – 4 – 9 – 13 Past service cost – – 5 1 – 4 Change in effect of asset ceiling for pensions including reimbursement rights – 7 – 1 6 259 314 247 820 Recognized provision for pension obligations at December 31, 2013 Present value of pension obligations at December 31, 2014 in million euros At January 1, 2014 115 Germany USA Other countries Total 2,674 962 933 4,569 Changes in the Group – – 40 40 Translation differences – 136 29 165 585 89 125 799 10 9 – 9 10 562 82 156 800 Actuarial gains (–)/losses (+) of which: from changes in demographic assumptions of which: from changes in financial assumptions of which: from experience adjustments 13 – 2 – 22 – 11 Current service cost 45 16 21 82 Employee contributions to pension funds 10 – 1 11 Gains (–)/losses (+) arising from the termination and curtailment of plans – 1 – – 1 – 2 Interest expense Retirement benefits paid out of plan assets / out of reimbursement rights Employer’s payments for pension obligations At December 31, 2014 of which: unfunded obligations of which: funded obligations of which: obligations covered by reimbursement rights 78 46 30 154 – 126 – 51 – 33 – 210 – 11 – 24 – 8 – 43 3,254 1,174 1,137 5,565 103 296 109 508 3,151 824 1,028 5,003 – 54 – 54 Notes to the consolidated financial statements 112 Consolidated statement of financial position 114 Consolidated statement of income 115 Consolidated statement of comprehensive income 115 Consolidated statement of changes in equity 116 Consolidated statement of cash flows 117 Group segmentreport by business unit 118 Key financials by region 119 Accounting principles and methods applied in preparation of the consolidated financial statements 128 Notes to the consolidated statement of financial position 141 163 Notes to the consolidated statement of income 168 Other disclosures 175 Independent Auditor’s Report 177 Recommendation for the approval of the annual financial statements and the appropriation of the profit of Henkel AG & Co. KGaA 178 Annual financial statements of Henkel AG & Co. KGaA (summarized) 179 Responsibility statement by the Personally Liable Partner 180 Corporate management bodies of Henkel AG & Co. KGaA Fair value of plan assets at December 31, 2014 in million euros At January 1, 2014 116 Germany USA Other countries Total 2,415 648 689 3,752 Changes in the Group – – 37 37 Translation differences – 95 26 121 Employer contributions to pension funds 28 38 21 87 Employee contributions 10 – 1 11 – 126 – 51 – 33 – 210 76 32 22 130 – – – – 243 53 104 400 2,646 815 867 4,328 Retirement benefits paid out of plan assets Interest income on plan assets Plan administration costs Remeasurements in equity At December 31, 2014 Fair value of reimbursement rights at December 31, 2014 117 Germany USA Other countries Total At January 1, 2014 – 96 – 96 Changes in the Group – – – – Translation differences – 13 – 13 Employer contributions – – – – Employee contributions – – – – Retirement benefits paid out of reimbursement rights – – 10 – – 10 Interest income on plan assets – 5 – 5 Remeasurements in equity – 1 – 1 At December 31, 2014 – 105 – 105 in million euros Net liability from pension obligations at December 31, 2014 118 Germany USA Other countries Total 259 314 247 820 Current service cost 45 16 21 82 Gains (–)/losses (+) arising from the termination and curtailment of plans – 1 – – 1 – 2 in million euros At January 1, 2014 Recognized through profit or loss Plan administration costs – – – – Interest expense 2 9 8 19 Recognized in equity in other comprehensive income 585 89 125 799 – 243 – 53 – 104 – 400 Interest income on reimbursement rights – – 1 – – 1 Change in effect of asset ceiling – – – – Employer’s payments – 39 – 62 – 29 – 130 Changes in the Group – – 3 3 Translation differences – 41 3 44 Change in past service cost – – – – Change in effect of asset ceiling for pensions including reimbursement rights – 14 14 28 608 367 287 1,262 Actuarial gains (–)/losses (+) Interest income on plan assets Other items recognized in equity Recognized provision for pension obligations at December 31, 2014 142 Notes to the consolidated financial statements The total present value (defined benefit obligation – DBO) is comprised of: • 1,967 million euros for active employees, • 880 million euros for former employees with vested benefits, and • 2,718 million euros for retirees. The average weighted duration of pension obligations is 16 years for Germany, nine years for the USA and 20 years for other countries. In determining net liability, we take into account amounts that are not recognized due to asset ceiling restrictions. If the fair value of the plan asset item exceeds the obligations arising from the pension benefits, an asset is recognized only if the reporting entity can also derive economic benefit from these assets, for example in the form of return flows or a future reduction in contributions (“Asset Ceiling” per IAS 19.58 ff.). In the reporting period, we recorded an amount of 0 million euros as an asset ceiling (previous year: 0 million euros). Henkel Annual Report 2014 Within our consolidated statement of income, current service costs are allocated on the basis of cost of sales to the respective function. Only the net of interest expense for the present value of obligations and interest income from plan assets is reported in the interest result. All gains/losses from the termination and curtailment of plans have been recognized in other operating income/charges. The employer’s contributions in respect of state pension provisions are included as “Social security contributions and staff welfare costs” under Note 32, page 168. In 2014, payments into the plan assets amounted to 87 million euros (previous year: 62 million euros). The reimbursement rights covering a portion of the pension obligations in the USA are assets that do not fulfill the definition of plan assets as stated in IAS 19. The reimbursement rights indicated are available to the Group in order to cover the expenditures required to fulfill the respective pension obligations. Reimbursement rights and the associated pension obligations must, according to IAS 19, be shown unnetted in the statement of financial position. Payments into pension funds in fiscal 2015 are expected to total 32 million euros. Notes to the consolidated financial statements 112 Consolidated statement of financial position 114 Consolidated statement of income 115 Consolidated statement of comprehensive income 115 Consolidated statement of changes in equity 116 Consolidated statement of cash flows 143 117 Group segmentreport by business unit 118 Key financials by region 119 Accounting principles and methods applied in preparation of the consolidated financial statements 128 Notes to the consolidated statement of financial position 163 Notes to the consolidated statement of income 168 Other disclosures 175 Independent Auditor’s Report 177 Recommendation for the approval of the annual financial statements and the appropriation of the profit of Henkel AG & Co. KGaA 178 Annual financial statements of Henkel AG & Co. KGaA (summarized) 179 Responsibility statement by the Personally Liable Partner 180 Corporate management bodies of Henkel AG & Co. KGaA 119 Analysis of plan assets December 31, 2013 No quotation on active markets Total Quotation on a ctive markets No quotation on active markets Total in million euros Shares December 31, 2014 Quotation on active markets 1,038 – 1,038 1,130 – 1,130 Europe 454 – 454 456 – 456 USA 167 – 167 205 – 205 Others 417 – 417 469 – 469 2,410 – 11 2,399 2,891 – 2 2,889 Bonds and hedging instruments 739 – 739 1,006 – 1,006 1,671 – 1,671 1,885 – 1,885 – – 11 – 11 – – 2 – 2 3 151 154 – 171 171 Government bonds Corporate bonds Derivatives Alternative investments Cash – 71 71 – 123 123 Liabilities 1 – – 120 – 120 – – 226 – 226 – 210 210 – 241 241 3,451 301 3,752 4,021 307 4,328 Other assets Total 1 Liability to Henkel AG & Co. KGaA from the takeover of pension payments for Henkel Trust e.V. 120 Plan assets by country 2014 USA 19 % Germany 61 % 121 Classification of bonds by rating 2014 Non-investment grade 4 % Investment grade 96 % Other countries 20 % The objective of the investment strategy for the global plan assets is the long-term security of pension payments. This is ensured by comprehensive risk management that takes into account the asset and liability portfolios of the defined benefit pension plans. Henkel pursues a liability-driven investment (LDI) approach in order to achieve the investment objective. This approach takes into account the structure of the pension obligations and manages the cover ratio of the pension plans. In order to improve the funding ratio, Henkel invests plan assets in a diversified portfolio for which the expected longterm yield is above the interest costs of the pension obligations. In order to cover the risks arising from trends in wages, salaries and life expectancies, and to close the potential deficit between plan assets and pension obligations over the long term, additional investments are made in a return-enhancing portfolio as an add-on instrument that contains assets such as equities, private equity, commodities and real estate. In principle, the target portfolio structure of the plan assets is determined in asset-liability studies. These studies are conducted regularly with the help of external advisors who assist Henkel in the investment of plan assets. They examine the actual portfolio structure, taking into account current capital market conditions, investment principles and the obligation structure, and can suggest adjustments be made to the portfolio. The expected long-term yield for individual plan assets is derived from the target portfolio structure and the expected long-term yields for the individual asset classes. 144 Notes to the consolidated financial statements Major plan assets are administered by external fund managers in Germany and the USA. These countries pursue the above investment strategies and are monitored centrally. At December 31, 2014, other assets making up the plan assets included the present value of a non-current receivable of 69 million euros (previous year: 47 million euros) relating to claims pertaining to a hereditary building lease assigned by Henkel AG & Co. KGaA to Henkel Trust e.V. Also shown here is a claim of 140 million euros against BASF Personal Care & Nutrition GmbH (formerly Cognis GmbH) for indemnification of pension obligations (previous year: 132 million euros). This claim represents the nominal value, which is equivalent to the market price. In the reporting year, as in the previous year, we held no direct investments and no treasury shares with respect to plan assets in the portfolio. Risks associated with pension obligations Our internal pension risk management monitors the risks of all pension plans Group-wide in compliance with local legal regulations. As part of the monitoring process, guidelines on the control and management of risks are adopted and continuously developed; these guidelines mainly govern external funding, portfolio structure and actuarial assumptions. The objective of the financing strategy within the Group is to ensure that plan assets cover 90 to 100 percent of the present value of the funded pension obligations. The contributions and investment strategies are intended to ensure nearly complete coverage of the plans for the duration of the pension obligations. Henkel’s pension obligations are exposed to various market risks. These risks are counteracted by the degree of external funding and the structure of pension benefits. The risks relate primarily to changes in market interest rates, inflation, and life expectancy, as well as general market fluctuations. Pension obligations based on contractual provisions in Germany generally entail lifelong benefits payable in the event of death or disability or when the employee reaches retirement age. In order to reduce the risks arising from the payment of lifelong benefits as well as inflation, pension benefits have been gradually converted since 2004 to what are known as modular benefits with a pension option in which the benefit is initially divided into an annuity and lump-sum benefit portion. Newly hired employees since 2011 receive a commitment based primarily on the lump-sum benefit. Generally, lump-sum benefits may also be paid out as an annuity through a pension fund. All Henkel Annual Report 2014 benefits in Germany are financed through a provident fund (Vorsorgefonds) established for the purpose of the occupational pension plan. Benefits for new employees since 2011 as well as a portion of the entitlements vested since 2004 are linked to the performance of this provident fund, resulting in a reduction in overall risk to the Group. The described adjustments reduce the financial risk from pension commitments within the pension structure. By linking the benefit to the capital investment, the net risk is also largely eliminated. An increase in the long-term inflation assumption would mainly affect the expected increase in pensions and the expected increase in pension-eligible salaries. The pension obligations in the USA are based primarily on three retirement plans that are all closed to new employees. New employees receive pension benefits based on a defined contribution plan. The pension benefits generally have a lump-sum option which is usually exercised. When a pension becomes payable, the amount of the lump-sum payment is determined on the basis of current market interest rates. As a result, the impact of a change to the interest rate used in the calculation is low compared to pension commitments entailing lifelong benefits. Additionally, in the USA, pensions paid once are not adjusted by amount, thus there are no direct risks during the pension payment period arising from pending adjustments. Inflation risks therefore result mainly from the salary adjustments awarded. In addition to the pension obligation risks already presented, there are specific risks associated with multi-employer plans. In the Henkel Group, these essentially relate to the USA. The contributions to these plans are raised mainly through an allocation process based on the pension-eligible income of active employees. Restructuring contributions may also be made in order to close gaps in coverage. The risks of such plans arise largely from higher future contributions to close coverage gaps or through discontinuation by other companies obligated to make contributions. The impact of changes to assumptions in medical benefits for employees and retirees in the USA is shown in the sensitivities analysis. The analysis of our Group-wide pension obligations revealed no extraordinary risks. Notes to the consolidated financial statements 112 Consolidated statement of financial position 114 Consolidated statement of income 115 Consolidated statement of comprehensive income 115 Consolidated statement of changes in equity 116 Consolidated statement of cash flows 145 117 Group segmentreport by business unit 118 Key financials by region 119 Accounting principles and methods applied in preparation of the consolidated financial statements 128 Notes to the consolidated statement of financial position Cash flows and sensitivities In the next five financial years, the following payments from pension plans are expected: 122 Future payments for pension benefits Germany USA Other countries Total 2015 145 127 33 305 2016 133 100 25 258 2017 132 97 25 254 2018 131 94 27 252 2019 135 92 27 254 in million euros 163 Notes to the consolidated statement of income 168 Other disclosures 175 Independent Auditor’s Report 177 Recommendation for the approval of the annual financial statements and the appropriation of the profit of Henkel AG & Co. KGaA 178 Annual financial statements of Henkel AG & Co. KGaA (summarized) 179 Responsibility statement by the Personally Liable Partner 180 Corporate management bodies of Henkel AG & Co. KGaA The future level of the funded status and thus of the pension obligations depends on the development of the discount rate, among other factors. Companies based in Germany and the USA account for 80 percent of our pension obligations. The medical costs for employees of our subsidiaries in the USA which are incurred after retirement are also recognized in the pension obligations for defined benefit plans. A rate of increase of 7.3 percent (previous year: 7.5 percent) was assumed for the medical costs. We expect this rate of increase to fall gradually to 4.5 percent by 2028 (previous year: 4.5 percent by 2028). The effects of a change in material actuarial assumptions for the present value of pension obligations are as follows: Sensitivities – Present value of pension obligations at December 31, 2014 123 Germany USA Other countries Total 3,254 1,174 1,137 5,565 Increase in the discount rate by 0.5 pp 3,017 1,127 1,029 5,173 Reduction of the discount rate by 0.5 pp 3,510 1,226 1,259 5,995 Rise in future income increases by 0.5 pp 3,255 1,180 1,161 5,596 Reduction of future income increases by 0.5 pp 3,253 1,170 1,112 5,535 Rise in retirement benefits increases by 0.5 pp 3,423 1,175 1,195 5,793 Reduction of retirement benefits increases by 0.5 pp 3,100 1,175 1,090 5,365 Rise in medical costs by 0.5 pp 3,255 1,179 1,135 5,569 Reduction of medical costs by 0.5 pp 3,255 1,172 1,135 5,562 in million euros Present value of obligations in the event of pp = percentage points The extension of life expectancy in Germany by one year would increase the present value of pension obligations by 4 percent. This would have a more limited effect in the USA because a significant share of the pension plans is based on lump-sum benefits. It should be noted with respect to the sensitivities presented that, due to mathematical effects, the percentage change is not and does not need to be linear. Thus the percentage increases and decreases do not vary with the same absolute amount. Each sensitivity is independently calculated and is not subject to scenario analysis. 146 Notes to the consolidated financial statements Henkel Annual Report 2014 Income tax provisions and other provisions 16 124 Development in 2014 Initial balance January 1, 2014 Other changes Utilized Released Added End balance December 31, 2014 250 14 87 23 181 335 78 – 6 16 28 84 172 14 81 7 153 251 Restructuring provisions 240 – 3 108 15 126 240 of which: non-current 88 – 7 12 2 28 95 152 4 96 13 98 145 1,549 80 1,014 108 1,146 1,653 247 – 3 17 6 64 285 1,302 83 997 102 1,082 1,368 2,039 91 1,209 146 1,453 2,228 413 – 10 35 24 120 464 1,626 101 1,174 122 1,333 1,764 in million euros Income tax provisions of which: non-current of which: current of which: current Sundry provisions of which: non-current of which: current Total of which: non-current of which: current Provisions are recognized for obligations toward third parties where the outflow of resources is probable and the expected obligation can be reliably estimated. Provisions are measured to the best estimate of the expenditures required in order to meet the current obligation as of the reporting date. Price increases expected to take place prior to the time of performance are included in the calculation. Provisions in which the interest effect is material are discounted to the reporting date at a pre-tax interest rate. For obligations in Germany, we have applied interest rates of between 0.3 and 2.4 percent. Provisions for obligations in the personnel sphere essentially cover expenditures likely to be incurred by the Group for variable, performance-related remuneration components. Provisions for obligations in the production and engineering sphere relate primarily to provisions for warranties. in million euros The income tax provisions comprise accrued tax liabilities and amounts set aside for the outcome of external tax audits. Sales of which: non-current of which: current Other provisions include identifiable contingent obligations toward third parties. They are measured at total cost. Other changes in provisions include changes in the scope of consolidation, movements in exchange rates, compounding effects, and adjustments to reflect changes in maturity as time passes. Payroll The provisions for obligations arising from our sales activities cover expected burdens in the form of subsequent reductions in already generated revenues, and risks arising from pending transactions. 125 December 31, 2013 December 31, 2014 623 688 10 10 613 678 517 517 of which: non-current 140 169 of which: current 377 348 41 38 of which: non-current 21 21 of which: current 20 17 368 410 Production and engineering Various sundry obligations of which: non-current Provisions are recognized in respect of restructuring measures, provided that work has begun on the implementation of a detailed, formal plan or such a plan has already been communicated. Additions to the restructuring provisions are related to the continued expansion of our shared services and to the further optimization of production and process structures in all business units. Analysis of sundry provisions by function of which: current Total of which: non-current of which: current 76 85 292 325 1,549 1,653 247 285 1,302 1,368 Notes to the consolidated financial statements 112 Consolidated statement of financial position 114 Consolidated statement of income 115 Consolidated statement of comprehensive income 115 Consolidated statement of changes in equity 116 Consolidated statement of cash flows 117 Group segmentreport by business unit 118 Key financials by region 119 Accounting principles and methods applied in preparation of the consolidated financial statements 128 Notes to the consolidated statement of financial position Risks arising from legal disputes and proceedings Provisions have been made for risks arising from legal disputes in the amount of probable claims plus associated procedural costs. Other provisions include a low triple-digit million amount in euros for claims in connection with various antitrust proceedings in Europe. These relate to infringements, some of which occurred more than ten years ago. Henkel has cooperated with the authorities in all such actions. On December 8, 2011, the French antitrust authorities imposed fines totaling around 360 million euros on several international detergent manufacturers on account of antitrust violations in France in the period from 1997 to 2004. Henkel received a fine of around 92 million euros which was paid in 2012. The action we filed against the French antitrust authorities’ decision relating to the fine imposed on Henkel was turned down by the court of first instance on January 30, 2014. We have decided not to appeal this ruling. On December 18, 2014, in another action relating to infringements between 2003 and 2006, the French antitrust authorities imposed fines amounting to around 951 million euros in total against various international companies in the cosmetic and detergent industries. Henkel received a fine of around 109 million euros. We will pay the amount in 2015 and file an action against the decision of the French antitrust authorities with regard to the amount of the fine. 147 163 Notes to the consolidated statement of income 168 Other disclosures 175 Independent Auditor’s Report 177 Recommendation for the approval of the annual financial statements and the appropriation of the profit of Henkel AG & Co. KGaA 178 Annual financial statements of Henkel AG & Co. KGaA (summarized) 179 Responsibility statement by the Personally Liable Partner 180 Corporate management bodies of Henkel AG & Co. KGaA In addition to other retail companies and manufacturers, Henkel is involved in an antitrust proceeding involving consumer goods (cosmetics and detergents) in Belgium relating to violations in the period from 2004 to the beginning of 2007. The action relates to a possible collusion between various Belgian retail companies to raise consumer prices (including prices for products in Henkel’s portfolio) with the involvement of Henkel. Henkel has received a corresponding statement of objections. A conclusive assessment of the outcome of the litigation and amount of the fine is not possible. Provisions have been set up as a precaution to cover the outcome of these proceedings. Henkel and its Group companies are also defendants in or parties to other judicial, arbitrational, and official proceedings. The course and outcomes of legal disputes are inherently uncertain and unpredictable. Based on the knowledge currently available, no negative future impact, material or otherwise, on the net assets, financial position and results of operations of the corporation is expected. 148 Notes to the consolidated financial statements Henkel Annual Report 2014 17 Borrowings 126 Borrowings December 31, 2013 in million euros Bonds December 31, 2014 Non-current Current Total Non-current Current Total 1,383 1,078 2,461 1,342 7 1,349 Commercial paper 1 – 35 35 – 288 288 Liabilities to banks 2 – 117 117 9 95 104 Other borrowings 3 – 3 3 – 3 1,386 1,230 2,616 1,354 390 1,744 Total 1 From the euro and US dollar commercial paper program (total volume 2 billion US dollars and 1 billion euros). 2 Obligations with floating rates of interest or interest rates pegged for less than one year. Issuer Type Nomi- Carrying amounts Market values nal excluding accrued excluding accrued value interest interest 1 Bond 1,000 in million euros Henkel AG & Co. KGaA Interest rate swap (3-month Euribor +2.02 %) 5 127 Bonds Market values including accrued interest 1 Interest rate 2 Interest fixing 2013 2014 2013 2014 2013 2014 2013 2014 1,004 – 1,008 – 1,044 – 4.6250 – to 2014 3 Receiver swap 1,000 5 – 5 – 41 – 2.2955 – 3 months Hybrid bond 1,300 1,383 1,342 1,379 1,343 1,386 1,350 5.3750 5.3750 to 2015 4 Interest rate swap (3-month Euribor +1.80 %) 5 Receiver swap 650 39 20 39 20 41 23 2.0172 1.8812 3 months Interest rate swap (1-month Euribor +0.955 %) 5 Receiver swap 1.1133 0.9597 1 month Henkel AG & Co. KGaA 650 51 25 51 25 54 28 Total bonds 2,300 2,387 1,342 2,387 1,343 2,430 1,350 Total interest rate swaps 2,300 95 45 95 45 136 51 1 Market value of the bonds derived from the stock market price at December 31. 2 Interest rate on December 31. 3 Fixed-rate interest of bond coupon: 4.625 percent, converted using interest rate swaps into a floating interest rate; no further interest fixing (fair value hedge). 4 Fixed-rate interest of bond coupon: 5.375 percent, converted using interest rate swaps into a floating interest rate; interest rate fixed on January 26, 2015 (previous year: January 27, 2014) (fair value hedge). 5 Not including the valuation allowance in the amount of 2 million euros to provide for counterparty credit risk (previous year: 2 million euros). The five-year bond issued in 2009 by Henkel AG & Co. KGaA for 1 billion euros with a coupon of 4.625 percent matured in March 2014 and has been redeemed. The 1.3 billion euro subordinated hybrid bond issued by Henkel AG & Co. KGaA in November 2005 to finance a large part of the pension obligations in Germany matures in 2104. Under the terms of the bond, the coupon for the first 10 years is 5.375 percent. The earliest bond redemption date is November 25, 2015. If it is not redeemed, the bond interest will be based on the 3-month Euribor interest rate plus a premium of 2.85 percentage points. The bond terms also stipulate that if there is a “cash flow event,” Henkel AG & Co. KGaA has the option or the obligation to defer the interest payments. A cash flow event is deemed to have occurred if the adjusted cash flow from operating activities is below a certain percentage of the net liabilities (20 percent for optional interest deferral, 15 percent for mandatory interest deferral); see Section 3 (4) of the bond terms and conditions for more details. On the basis of the cash flow calculated at December 31, 2014, the percentage was 185.46 percent (previous year: 123.11 percent). The US dollar liabilities of Henkel of America, Inc., Wilmington, USA, in the amount of 1,524 million euros are set off against the deposit of 1,302 million euros of Henkel US LLC, Wilmington, USA, and financial collateral of 218 million euros. The net amount shown in the statement of financial position under borrowings is 4 million euros. Notes to the consolidated financial statements 112 Consolidated statement of financial position 114 Consolidated statement of income 115 Consolidated statement of comprehensive income 115 Consolidated statement of changes in equity 116 Consolidated statement of cash flows 149 117 Group segmentreport by business unit 118 Key financials by region 119 Accounting principles and methods applied in preparation of the consolidated financial statements 128 Notes to the consolidated statement of financial position 163 Notes to the consolidated statement of income 168 Other disclosures 175 Independent Auditor’s Report 177 Recommendation for the approval of the annual financial statements and the appropriation of the profit of Henkel AG & Co. KGaA 178 Annual financial statements of Henkel AG & Co. KGaA (summarized) 179 Responsibility statement by the Personally Liable Partner 180 Corporate management bodies of Henkel AG & Co. KGaA 18 Other financial liabilities Analysis December 31, 2013 in million euros Non-current Current 128 December 31, 2014 Total Non-current Current Total Liabilities to non-consolidated affiliated companies and associated companies – 15 15 – 9 9 Liabilities to customers – 30 30 – 35 35 Derivative financial instruments – 34 34 – 43 43 Sundry financial liabilities 2 8 10 1 30 31 Total 2 87 89 1 117 118 Of the liabilities to non-consolidated a ffiliated companies and associated companies, 8 million euros relates to non-consolidated affiliated companies and 1 million euros relates to associated companies. Sundry financial liabilities include payments owed to the Pensionssicherungsverein mutual insurance association amounting to 4 million euros (previous year: 5 million euros). 19 Other liabilities Analysis December 31, 2013 129 December 31, 2014 Non-current Current Total Non-current Current Total Other tax liabilities – 94 94 – 108 108 Liabilities to employees 1 17 18 – 25 25 Liabilities relating to employee deductions – 60 60 – 61 61 Liabilities in respect of social security 1 21 22 1 22 23 Sundry other liabilities 12 38 50 12 52 64 Total 14 230 244 13 268 281 in million euros The sundry other liabilities primarily comprise various accruals and deferrals amounting to 16 million euros (previous year: 14 million euros) and payments on account received in the amount of 4 million euros (previous year: 4 million euros). 20 Trade accounts payable Trade accounts payable increased from 2,872 million euros to 3,046 million euros. In addition to purchase invoices, they also relate to accruals for invoices outstanding in respect of goods and services received. They are due within one year. 150 Notes to the consolidated financial statements Henkel Annual Report 2014 130 21 Financial instruments report Financial instruments Financial assets Amortized cost Financial liabilities Statement of income Loans and receivables Amortized cost Fair value Held to maturity Fair value option Held for trading Other compre hensive income Equity Fair value Fair value option Cost Held for trading Available for sale Categories used by Henkel Financial instruments explained by category Within the Henkel Group, financial instruments are reported under trade accounts receivable, trade accounts payable, borrowings, other financial assets, other financial liabilities, and cash and cash equivalents within the statement of financial position. which are not measured using the equity method, both part of other financial assets in the statement of financial position, are categorized as “Available for sale.” Only the derivative financial instruments held by the Henkel Group which are not included in hedge accounting are designated as “Held for trading.” We recognize all other financial instruments including the financial assets categorized as “Loans and receivables” at amortized cost using the effective interest method. The measurement category “Held to maturity” is not used within the Henkel Group. Financial instruments are recognized once Henkel becomes a party to the contractual provisions of the financial instrument. The recognition of financial assets takes place at the settlement date, with the exception of derivative financial instruments, which are recognized on the transaction date. All financial instruments are initially reported at their fair value. Incidental acquisition costs are only capitalized if the financial instruments are not subsequently remeasured to fair value through profit or loss. For subsequent remeasurement, financial instruments are divided into the following classes in accordance with IAS 39: • Financial instruments measured at amortized cost • Financial instruments measured at fair value The financial instruments in the measurement category “Loans and receivables” are non-derivative financial instruments. They are characterized by fixed or determinable payments and are not traded in an active market. Within the Henkel Group, this category is mainly comprised of trade accounts receivable, cash and cash equivalents, and other financial assets with the exception of investments, derivatives, securities and time deposits. The carrying amounts of the financial instruments categorized as“Loans and receivables” closely approximate their fair value due to their predominantly short-term nature. If there are doubts as to the realizability of these financial instruments, they are recognized at amortized cost less appropriate valuation allowances. Different valuation categories are allocated to these two classes. Financial instruments assigned to the valuation categories “Fair value option,” “Available for sale” and “Held for trading” are generally measured at fair value. In the fair value option, we include fixed-interest bonds, which are recognized in other financial assets under securities and time deposits and for which we have concluded interest rate swaps in order to convert the fixed interest rate into a floating interest rate. Other securities and time deposits as well as other investments Financial instruments are recognized in the “Fair value option” if this classification conveys more relevant information by eliminating or significantly reducing inconsistencies in the measurement or in the recognition that result from the valuation of assets or liabilities or the recognition of gains and losses on a different basis. Financial instruments classified in the fair value option are recognized at fair value through profit or loss. A financial instrument is any contract that gives rise to a financial asset of one entity and a financial liability or equity instrument of another entity. Notes to the consolidated financial statements 112 Consolidated statement of financial position 114 Consolidated statement of income 115 Consolidated statement of comprehensive income 115 Consolidated statement of changes in equity 116 Consolidated statement of cash flows 117 Group segmentreport by business unit 118 Key financials by region 119 Accounting principles and methods applied in preparation of the consolidated financial statements 128 Notes to the consolidated statement of financial position Financial instruments in the category “Available for sale” are non-derivative financial assets and are recognized at fair value, provided that this is reliably determinable. If the fair value cannot be reliably determined, they are recognized at cost. Value changes between the reporting dates are essentially recognized in equity through comprehensive income (revaluation reserve) without affecting profit or loss, unless the cause lies in permanent impairment. Impairment losses are recognized through profit or loss. When the asset is derecognized, the amounts recognized in the revaluation reserve are released through profit or loss. In the Henkel Group, the securities and time deposits recognized under other financial assets, and not classified under the fair value option, and also other investments, are categorized as “Available for sale.” The fair values of the securities and time deposits are based on quoted market prices, or derived from market data. As the fair values of the financial investments not recognized using the equity method cannot be reliably determined, they are measured at amortized cost. The shares in Ten Education Ltd. and Ten Lifestyle Holdings Ltd., recognized in other investments, were sold during the reporting year with a gain of 6 million euros. On the date these shares were derecognized, their carrying amount was less than 1 million euros. Further sales or disposals of financial instruments recognized in other investments are currently not intended. 151 163 Notes to the consolidated statement of income 168 Other disclosures 175 Independent Auditor’s Report 177 Recommendation for the approval of the annual financial statements and the appropriation of the profit of Henkel AG & Co. KGaA 178 Annual financial statements of Henkel AG & Co. KGaA (summarized) 179 Responsibility statement by the Personally Liable Partner 180 Corporate management bodies of Henkel AG & Co. KGaA The derivative financial instruments that are not included in a designated hedging relationship are categorized as “Held for trading” and recognized at their fair value. All fair value changes are recognized through profit or loss. Hedge accounting is applied in individual cases – where possible and economically sensible – in order to avoid profit and loss variations arising from fair value changes in derivative financial instruments. Depending on the type of underlying and the risk being hedged, fair value and cash flow hedges are designated within the Group. Details relating to the hedging contracts transacted within the Group and how the fair values of the derivatives are determined are provided on pages 154 to 157. All financial liabilities – with the exception of derivative financial instruments – are essentially recognized at amortized cost using the effective interest method. Borrowings for which a hedging transaction has been concluded that meets the requirements of IAS 39 with respect to hedge accounting are recognized in hedge accounting. In addition to the disclosures provided in this note with respect to offsetting financial assets and financial liabilities for derivatives (see pages 158 and 159), further offsetting disclosures can be found in Note 17 (“Borrowings”) on page 148. 152 Notes to the consolidated financial statements Henkel Annual Report 2014 131 Carrying amounts and fair values of financial instruments Valuation according to IAS 39 December 31, 2013 in million euros Carrying amount December 31 Amortized cost Fair value, through other comprehensive income Fair value, through profit or loss Fair value December 31 Assets Loans and receivables Trade accounts receivable 3,652 3,652 – – 3,652 2,370 2,370 – – 2,370 231 231 231 – – Receivables from associated companies – – – – – Financial receivables from third parties 32 32 – – 32 120 120 – – 120 79 79 – – 79 1,051 1,051 – – 1,051 Other financial assets Receivables from Henkel Trust e.V. Sundry financial assets Cash and cash equivalents 619 – – 619 619 619 – – 619 619 Fixed-interest securities (level 1) 245 – – 245 245 Fixed-interest securities (level 2) 374 – – 374 374 1,805 18 1,787 – 1,805 Other financial assets 1,805 18 1,787 – 1,805 Other investments 18 18 – – 18 1,720 – 1,720 – 1,720 Floating-interest securities (level 2) 22 – 22 – 22 Fixed-interest securities (level 1) 19 – 19 – 19 Financial collateral provided (level 1) 26 – 26 – 26 17 – – 17 17 17 – – 17 17 Fair value option Other financial assets Available for sale Floating-interest securities and time deposits (level 1) Held for trading (level 2) Derivative financial instruments not included in a designated hedging relationship Derivative financial instruments included in a designated hedging relationship (level 2) Total 135 – – 135 135 6,228 3,670 1,787 771 6,228 Liabilities Amortized cost Trade accounts payable Borrowings not included in a designated hedging relationship Borrowings included in a designated hedging relationship Other financial liabilities Held for trading (level 2) Derivative financial instruments not included in a designated hedging relationship Derivative financial instruments included in a designated hedging relationship (level 2) Total 5,543 5,543 – – 5,543 2,872 2,872 – – 2,872 186 186 – – 186 2,430 2,430 – – 2,430 55 55 – – 55 31 – – 31 31 31 – – 31 31 3 – 3 – 3 5,577 5,543 3 31 5,577 Notes to the consolidated financial statements 112 Consolidated statement of financial position 114 Consolidated statement of income 115 Consolidated statement of comprehensive income 115 Consolidated statement of changes in equity 116 Consolidated statement of cash flows 153 117 Group segmentreport by business unit 118 Key financials by region 119 Accounting principles and methods applied in preparation of the consolidated financial statements 128 Notes to the consolidated statement of financial position 163 Notes to the consolidated statement of income 168 Other disclosures 175 Independent Auditor’s Report 177 Recommendation for the approval of the annual financial statements and the appropriation of the profit of Henkel AG & Co. KGaA 178 Annual financial statements of Henkel AG & Co. KGaA (summarized) 179 Responsibility statement by the Personally Liable Partner 180 Corporate management bodies of Henkel AG & Co. KGaA 132 Carrying amounts and fair values of financial instruments Valuation according to IAS 39 December 31, 2014 in million euros Carrying amount December 31 Amortized cost Fair value, through other comprehensive income Fair value, through profit or loss Fair value December 31 Assets 4,331 4,331 – – 4,331 2,747 2,747 – – 2,747 356 356 – – 356 Receivables from associated companies 1 1 – – 1 Financial receivables from third parties 34 34 – – 34 226 226 – – 226 95 95 – – 95 1,228 1,228 – – 1,228 Loans and receivables Trade accounts receivable Other financial assets Receivables from Henkel Trust e.V. Sundry financial assets Cash and cash equivalents Fair value option Other financial assets 227 – – 227 227 227 – – 227 227 196 Fixed-interest securities (level 1) 196 – – 196 Fixed-interest securities (level 2) 31 – – 31 31 114 21 93 – 114 Available for sale Other financial assets 114 21 93 – 114 Other investments 21 21 – – 21 Floating-interest securities and time deposits (level 1) 14 – 14 – 14 Floating-interest securities (level 2) 60 – 60 – 60 – – – – – 19 – 19 – 19 23 – – 23 23 23 – – 23 23 Fixed-interest securities (level 1) Financial collateral provided (level 1) Held for trading (level 2) Derivative financial instruments not included in a designated hedging relationship Derivative financial instruments included in a designated hedging relationship (level 2) Total 65 – 16 49 65 4,760 4,352 109 299 4,760 4,865 4,865 – – 4,866 3,046 3,046 – – 3,046 395 395 – – 395 1,349 1,349 – – 1,350 75 75 – – 75 35 – – 35 35 35 – – 35 35 8 – 8 – 8 4,908 4,865 8 35 4,909 Liabilities Amortized cost Trade accounts payable Borrowings not included in a designated hedging relationship Borrowings included in a designated hedging relationship Other financial liabilities Held for trading (level 2) Derivative financial instruments not included in a designated hedging relationship Derivative financial instruments included in a designated hedging relationship (level 2) Total The following hierarchy is applied in order to determine and disclosethe fair value of financial instruments: • Level 1: Fair values which are determined on the basis of quoted, unadjusted prices in active markets. • Level 2: Fair values which are determined on the basis of parameters for which either directly or indirectly derived market prices are available. • L evel 3: Fair values which are determined on the basis of parameters for which the input factors are not derived from observable market data. The fair value of securities and time deposits classified as level 1 is based on the quoted market prices on the reporting date. Observable market data are used to measure the fair value 154 Notes to the consolidated financial statements Henkel Annual Report 2014 of level 2 securities. If bid and ask prices are available, the mid price is used to determine the fair value. We did not perform any reclassifications between the valuation categories o r transfers within the fair value hierarchy either in fiscal 2014 or in the previous year. Net gains and losses from financial instruments by category The net gains and losses from financial instruments c an be allocated to the following categories: Net results of the measurement categories and reconciliation to financial result in million euros Loans and receivables Fair value option Financial assets available for sale Financial assets and liabilities held for trading including derivatives in a designated hedging relationship Financial liabilities measured at amortized cost Total net results Foreign exchange effects Interest expense of pension obligations less interest income from plan assets and reimbursement rights Other financial result (not related to financial instruments) Financial result 133 2013 2014 47 51 7 12 10 15 – 35 107 – 109 – 82 – 80 103 – 1 – 118 – 24 – 19 – 8 – 15 – 113 – 49 The net result of “Loans and receivables” is allocated in full to interest income. Net expenses arising from additions and releases of valuation allowances amounting to –20 million euros (previous year: –17 million euros) and income from payments on financial instruments already written off and derecognized amounting to 0 million euros (previous year: 4 million euros) were recognized in operating profit. The net result of the securities classified under the “Fair value option” includes interest income of 5 million euros (previous year: 7 million euros) and valuation gains of 7 million euros (previous year: 0 million euros). The net result from securities and time deposits classified as “Available for sale” amounts to 8 million euros (previous year: 10 million euros) for interest income, 1 million euros for income from sales (previous year: 0 million euros) and 6 million euros (previous year: 0 million euros) for income from other investments. The measurement of these financial instruments at fair value led to a gain of 1 million euros (previous year: 1 million euros) which we have recognized in the reserve for “Financial instruments available for sale” in equity. The net result from “Held for trading” financial instruments and derivatives in a designated hedging relationship includes, in addition to the outcome of measurement of these derivatives at fair value amounting to 59 million euros (previous year: –94 million euros), an expense of 0 million euros arising from additions to the valuation allowance made for counterparty credit risk (previous year: expense of –1 million euros). Moreover, 48 million euros of interest income and expenses from interest rate derivatives and amounts recycled from cash flow hedges recognized in equity are also included under this heading (previous year: 60 million euros). The net result from “Financial liabilities measured at amortized cost” is essentially derived from the interest expense for borrowings amounting to –124 million euros (previous year: –184 million euros). Also included are valuation gains of 45 million euros (previous year: 81 million euros) from borrowings in a fair value hedge relationship. Fees amounting to –3 million euros for procuring money and loans were also recognized under this heading (previous year: –6 million euros). The realization and valuation of financial assets and liabilities in foreign currencies (without derivative financial instruments) resulted in an expense of –118 million euros (previous year: –1 million euros). Derivative financial instruments Derivative financial instruments are measured at their fair value at the reporting date. Recognition of the gains and losses arising from fair value changes of derivative financial instruments is dependent upon whether the requirements of IAS 39 are fulfilled with respect to hedge accounting. Hedge accounting is not applied to the large majority of derivative financial instruments. We recognize through profit or loss the fair value changes in these derivatives which, in economic terms, represent effective hedges within the framework of Group strategy. These are largely compensated by fair value changes in the hedged items. In hedge accounting, derivative financial instruments are qualified as instruments for hedging the fair value of a recognized underlying (“fair value hedge”), as instruments for hedging future cash flows (“cash flow hedge”) or as instruments for hedging a net investment in a foreign entity (“hedge of a net investment in a foreign entity”). The following table provides an overview of the derivative financial instruments utilized and recognized within the Group, and their fair values: Notes to the consolidated financial statements 112 Consolidated statement of financial position 114 Consolidated statement of income 115 Consolidated statement of comprehensive income 115 Consolidated statement of changes in equity 116 Consolidated statement of cash flows 155 117 Group segmentreport by business unit 118 Key financials by region 119 Accounting principles and methods applied in preparation of the consolidated financial statements 128 Notes to the consolidated statement of financial position 163 Notes to the consolidated statement of income 168 Other disclosures 175 Independent Auditor’s Report 177 Recommendation for the approval of the annual financial statements and the appropriation of the profit of Henkel AG & Co. KGaA 178 Annual financial statements of Henkel AG & Co. KGaA (summarized) 179 Responsibility statement by the Personally Liable Partner 180 Corporate management bodies of Henkel AG & Co. KGaA 134 Derivative financial instruments At December 31 in million euros Nominal value 2013 2014 2013 2014 2013 Forward exchange contracts 1 2,118 3,516 17 39 – 20 – 36 (1,671) (1,757) (12) (16) (– 19) (– 18) (56) (428) (1) (16) – (– 8) 62 2 1 – – – 3,424 1,517 134 49 – 14 – 7 (of which: for hedging loans within the Group) (of which: designated as cash flow hedge) Foreign exchange options Interest rate swaps Positive fair value 2 Negative fair value 2 2014 (of which: designated as fair value hedge) (2,300) (1,300) (134) (49) (–) (–) (of which: designated as cash flow hedge) (508) (–) (–) (–) (– 3) (–) (of which: to hedge financial instruments in the fair value option) (616) (217) (–) (–) (– 11) (– 7) 1 – – – – – (–) (–) (–) (–) (–) (–) 5,605 5,035 152 88 – 34 – 43 Commodity futures 1 (of which: designated for hedge accounting) Total derivative financial instruments 1 Maturity less than 1 year. 2 Fair values including accrued interest and a valuation allowance for counterparty credit risk of 2 million euros (previous year: 2 million euros). For forward exchange contracts, we determine the fair value on the basis of the reference exchange rates of the European Central Bank prevailing at the reporting date, taking into account forward premiums / forward discounts for the remaining term of the respective contract versus the contracted foreign exchange rate. Foreign exchange options are measured using price quotations or recognized models for the determination of option prices. We measure interest rate hedging instruments on the basis of discounted cash flows expected in the future, taking into account market interest rates applicable for the remaining term of the contracts. These are indicated for the two most important currencies in the following table. It shows the interest rates quoted on the interbank market in each case on December 31. Depending on their fair value and their maturity on the reporting date, derivative financial instruments are included in financial assets (positive fair value) or in financial liabilities (negative fair value). Most of the forward exchange contracts serve to hedge risks arising from trade accounts receivable and payable, and those pertaining to Group financing. 135 Interest rates in percent p.a. At December 31 Term In measuring derivative financial instruments, counterparty credit risk is taken into account with an adjustment to the fair values concerned, determined on the basis of credit risk premiums. The adjustment relating to fiscal 2014 amounts to 2 million euros (previous year: 2 million euros). The addition is recognized in profit or loss under financial result. Euro US dollar 2013 2014 2013 1 month 0.24 0.02 0.16 2014 0.17 3 months 0.25 0.08 0.25 0.26 6 months 0.41 0.17 0.38 0.36 1 year 0.52 0.33 0.59 0.63 2 years 0.54 0.18 0.48 0.88 5 years 1.26 0.36 1.79 1.75 10 years 2.22 0.81 3.17 2.27 Due to the complexities involved, financial derivatives for hedging commodity price risks are primarily measured on the basis of simulation models derived from market quotations. We perform regular plausibility checks in order to safeguard valuation correctness. Interest rate hedges essentially serve to manage the interest rate risks arising from the fixed-interest hybrid bond issued by Henkel AG & Co. KGaA. See also the following explanations relating to fair value hedges and cash flow hedges and to the interest rate risk in the Henkel Group. In addition, interest rate derivatives are entered into to hedge the fair value of the fixed-interest securities classified in the “Fair value option.” To a small extent, we use commodity derivatives to hedge uncertainties in future commodity price developments. See also the explanations relating to other price risks on page 162. Fair value hedges: A fair value hedge hedges the fair value of recognized assets and liabilities. The change in the fair value of the derivatives and the change in the fair value of the underlying relating to the hedged risk are simultaneously recognized in profit or loss. 156 Notes to the consolidated financial statements Henkel Annual Report 2014 Receiver interest rate swaps are used to hedge the fair value risk of the fixed-interest hybrid bond issued by Henkel AG & Co. KGaA. The fair value of these interest rate swaps is 45 million euros (previous year: 95 million euros) excluding accrued interest.The changes in fair value of the receiver interest rate swaps arising from market interest rate risks amounted to –50 million euros (previous year: –85 million euros). The corresponding changes in fair value of the hedged bonds amounted to 45 million euros (previous year: 81 million euros). In determining the fair value change in the bonds (see also Note 17 on page 148), only that portion is taken into account that relates to the interest rate risk. The following table provides an overview of the gains and losses arising from fair value hedges (valuation allowance made for the counterparty credit risk not included): 136 Gains and losses from fair value hedges 2013 in million euros Gains (+) / losses (–) from hedged items Gains (+) / losses (–) from hedging instruments Net 2014 81 45 – 85 – 50 – 4 – 5 Cash flow hedges: A cash flow hedge hedges fluctuations in future cash flows from recognized assets and liabilities, and also transactions that are either planned or highly probable, or firmly contracted unrecognized financial commitments, from which an interest-rate or currency risk arises. The effective portion of a cash flow hedge is recognized in the hedge reserve in equity. The ineffective portion arising from the change in value of the hedging instrument is recognized through profit or loss in the financial result or operating profit, depending on the item hedged. The gains and losses recorded in equity are subsequently recognized through profit or loss in the period in which the hedged transaction influences the results for that period. Cash flow hedges (after tax) 137 Initial balance Addition (recognized in equity) Disposal (recognized through profit or loss) End balance 2014 – 217 2013 – 234 11 4 – 202 7 10 – 217 in million euros The initial value of the cash flow hedges recognized in equity reflects firstly the fair values of the payer interest swaps that were used to hedge the cash flow risks of the floating-interest US dollar liabilities at Henkel of America, Inc. and expired in the reporting period. Secondly, it relates to currency hedges for acquisitions made in previous years and for the acquisition of the Polish laundry and home care business completed during the reporting period. The addition of 11 million euros after tax relates to currency hedges of planned sales and inventory purchases against fluctuations in spot rates. Of the losses recognized in equity, 2 million euros were reclassified to operating profit in the reporting period. The positive and negative fair values of the derivatives contracted as a currency hedge of planned sales and inventory purchases amounted to 16 million and –8 million euros respectively. The cash flows from the currency derivatives and the cash flows from the hedged sales and inventory purchases are expected to occur and affect profit or loss in the next fiscal year. An addition of 1 million euros is due to the interest rate hedge of the US dollar liabilities of Henkel of America, Inc. Since the hedge expired in full in the first quarter of 2014, the amount recognized in equity of 2 million euros was reclassified to profit or loss under financial result. A further addition of –1 million euros results from the currency hedge for the acquisition of the Polish laundry and home care business. The hedged cash flows relating to acquisitions will only be recognized in operating profit with disposal or in the event of an impairment loss on the hedged items. In the fiscal year under review, ineffective portions amounting to less than 1 million euros (as in the previous year) were recognized in profit or loss under financial result. Hedges of a net investment in a foreign entity: The accounting treatment of hedges of a net investment in a foreign entity against translation risk is similar to that applied to cash flow hedges. The gain or loss arising from the effective portion of the hedging instrument is recognized in equity through other comprehensive income; the gain or loss of the ineffective portion is recognized directly through profit or loss. The gains or losses recognized directly in equity remain there until disposal or partial disposal of the net investment. The items recognized in equity relate essentially to translation risks arising from net investments in Swiss francs and US dollars for which the associated hedges were entered into and settled in previous years. A minor impact of less than 1 million euros in equity and financial result ensued from hedges of net investments contracted and settled in the past fiscal year. We made no transfers from equity to profit or loss in the course of the year. Notes to the consolidated financial statements 112 Consolidated statement of financial position 114 Consolidated statement of income 115 Consolidated statement of comprehensive income 115 Consolidated statement of changes in equity 116 Consolidated statement of cash flows 157 117 Group segmentreport by business unit 118 Key financials by region 119 Accounting principles and methods applied in preparation of the consolidated financial statements 128 Notes to the consolidated statement of financial position Hedges of a net investment in a foreign entity (after tax) in million euros 138 Initial Addition Disposal End balance balance (recognized (recognized in equity) through profit or loss) 2014 35 – – 35 2013 35 – – 35 163 Notes to the consolidated statement of income 168 Other disclosures 175 Independent Auditor’s Report 177 Recommendation for the approval of the annual financial statements and the appropriation of the profit of Henkel AG & Co. KGaA 178 Annual financial statements of Henkel AG & Co. KGaA (summarized) 179 Responsibility statement by the Personally Liable Partner 180 Corporate management bodies of Henkel AG & Co. KGaA The maximum credit risk is represented by the carrying value of the financial assets recognized in the statement of financial position (excluding financial investments recognized using the equity method), as indicated in the following table: in million euros 2013 2014 Trade accounts receivable 2,370 2,747 17 23 Derivative financial instruments not included in a designated hedging relationship Risks arising from financial instruments, and risk management As a globally active corporation, Henkel is exposed in the course of its ordinary business operations to credit risks, liquidity risks and market risks (currency translation, interest rate and commodity price risks). The purpose of financial risk management is to restrict the exposure arising from operating activities through the use of selective derivative and non- derivative hedges. Henkel uses derivative financial instruments exclusively for the purposes of risk management. Without these instruments, Henkel would be exposed to higher financial risks. Changes in exchange rates, interest rates or commodity prices can lead to significant fluctuations in the fair values of the derivatives used. These variations in fair value should not be regarded in isolation from the hedged items, as derivatives and the underlying constitute a unit in terms of countervailing fluctuations. Management of currency, interest rate and liquidity risks is based on the treasury guidelines introduced by the Management Board, which are binding on the entire corporation. They define the targets, principles and competences of the Corporate Treasury organizational unit. These guidelines describe the fields of responsibility and establish the distribution of these responsibilities between Corporate Treasury and Henkel’s subsidiaries. The Management Board is regularly and comprehensively informed of all major risks and of all relevant hedging transactions and arrangements. Our description of the objectives and fundamental principles adopted in capital management can be found in the Group management report on pages 72 and 73. There were no major risk clusters in the reporting period. Credit risk In the course of its business activities with third parties, the Henkel Group is exposed to global credit risk arising from both its operating business and its financial investments. This risk derives from the possibility of a contractual party not fulfilling its obligations. 139 Maximum risk position Derivative financial instruments included in a designated hedging relationship 135 65 2,655 697 Cash and cash equivalents 1,051 1,228 Total carrying values 6,228 4,760 Other financial assets In its operating business, Henkel is confronted by progressive concentration and consolidation on the customer side, as reflected in the receivables from individual customers. A credit risk management system operating on the basis of a globally applied credit policy ensures that credit risks are constantly monitored and bad debts minimized. This policy, which applies to both new and existing customers, governs the allocation of credit limits and compliance with those limits, individual analyses of customers’ creditworthiness based on both internal and external financial information, risk classification, and continuous monitoring of the risk of bad debts at the local level. We also monitor our key customer relationships at the regional and global level. In addition, safeguarding measures are implemented on a selective basis for particular countries and customers inside and outside the eurozone. Collateral received and other safeguards include country- specific and customer-specific protection afforded by credit insurance, confirmed and unconfirmed letters of credit in the export business, and guarantees, warranties, and cover notes. We make valuation allowances with respect to financial assets so that the assets are recognized at their fair value at the reporting date. In the case of impairment losses that have already occurred but have not yet been identified, we make global valuation allowances on the basis of empirical evidence, taking into account the overdue structure of the trade accounts receivable. For receivables and loans that are more than 180 days overdue, following the impairment test, a valuation allowance of 100 percent is recognized. 158 Notes to the consolidated financial statements Henkel Annual Report 2014 The decision as to whether a credit risk is accounted for through a valuation allowance account or by derecognition of the impaired receivable depends upon the probability of incurring a loss. For accounts receivable classified as irrecoverable, we report the credit risk directly through derecognition of the impaired receivable or the relevant amount in the valuation allowance account. If the basis for the original impairment is eliminated, we recognize a reversal through profit or loss. In all, we recognized valuation allowances on loans and receivables in 2014 in the amount of 20 million euros ( previous year: 17 million euros). The carrying amount of loans and receivables, the term of which was renegotiated because they would have otherwise fallen overdue or been impaired, was 0 million euros (previous year: 1 million euros). Based on our experience, we do not expect the necessity for any further valuation allowances, other than those described above, on non-overdue, non-impaired financial assets. 140 Age analysis of non-impaired overdue loans and receivables Analysis Less than 30 days 30 to 60 days 61 to 90 days More than 91 days Total At December 31, 2014 173 64 27 2 266 At December 31, 2013 165 52 20 5 242 in million euros Credit risks also arise from monetary investments such as cash at banks, securities and the positive fair value of derivatives. Such exposure is limited by our Corporate Treasury specialists through the selection of counterparties with strong credit ratings, and limitations on the amounts allocated to individual investments. In financial investments and derivatives trading with German and international banks, we only enter into transactions with counterparties of high financial standing. We invest exclusively in securities from issuers with an investment grade rating. Our cash deposits can be liquidated at short notice. Our financial investments are broadly diversified across various counterparties and various financial assets. To minimize the credit risk, we agree netting arrangements to offset bilateral receivables and obligations with counterparties. We additionally enter into collateral agreements with selected banks, on the basis of which reciprocal sureties are established twice a month to secure the fair values of contracted derivatives and other claims and obligations. The netting arrangements only provide for a contingent right to offset transactions conducted with a contractual party. Accordingly, associated amounts can be offset only under certain circumstances, such as the insolvency of one of the contractual parties. Thus, the netting arrangements do not meet the offsetting criteria under IAS 32 “Financial Instruments: Presentation.” The following table provides an overview of financial assets and financial liabilities from derivatives that are subject to netting, collateral, or similar arrangements: Financial assets and financial liabilities from derivatives subject to netting, collateral, or similar arrangements At December 31 in million euros Financial assets Financial liabilities Gross amount recognized in the statement of financial position 1 141 Amount eligible for offsetting Financial collateral received / provided Net amount 2013 2014 2013 2014 2013 2014 2013 2014 154 90 19 26 54 19 81 45 34 43 19 26 4 11 11 6 1 Fair values excluding valuation allowance of 2 million euros made for counterparty credit risk (previous year: 2 million euros). Notes to the consolidated financial statements 112 Consolidated statement of financial position 114 Consolidated statement of income 115 Consolidated statement of comprehensive income 115 Consolidated statement of changes in equity 116 Consolidated statement of cash flows 117 Group segmentreport by business unit 118 Key financials by region 119 Accounting principles and methods applied in preparation of the consolidated financial statements 128 Notes to the consolidated statement of financial position In addition to netting and collateral arrangements, investment limits are set, based on the ratings of the counterparties, in order to minimize credit risk. These limits are monitored and adjusted regularly. When determining the limits, we also apply certain other indicators, such as the pricing of credit default swaps (CDS) by banks. A valuation allowance of 2 million euros exists to cover the remaining credit risk from the positive fair values of derivatives ( previous year: 2 million euros). Liquidity risk Liquidity risk is defined as the risk of an entity failing to meet its financial obligations at any given time. We minimize this risk by deploying financing instruments in the form of issued bonds and commercial paper. With the help of our existing debt issuance program in the amount of 6 billion euros, this is also possible on a short-term and flexible basis. In order to ensure the financial flexibility of the Henkel 159 163 Notes to the consolidated statement of income 168 Other disclosures 175 Independent Auditor’s Report 177 Recommendation for the approval of the annual financial statements and the appropriation of the profit of Henkel AG & Co. KGaA 178 Annual financial statements of Henkel AG & Co. KGaA (summarized) 179 Responsibility statement by the Personally Liable Partner 180 Corporate management bodies of Henkel AG & Co. KGaA Group at any time, the liquidity within the Group is extensively centralized and managed through the use of cash pools. We predominantly invest cash in financial assets traded in a liquid market in order to ensure that they can be sold at any time to procure liquid funds. In addition, the Henkel Group has at its disposal confirmed credit lines of 1.5 billion euros to ensure its liquidity and financial flexibility at all times. These credit lines have terms until 2019. The individual subsidiaries of the Henkel Group additionally have at their disposal committed bilateral loans of 0.1 billion euros with a revolving term of up to one year. Our credit rating is regularly assessed by the rating agencies Standard & Poor’s and Moody’s. Our liquidity risk can therefore be regarded as very low. The maturity structure of the original and derivative financial liabilities within the scope of IFRS 7 based on cash flows is shown in the following table. 142 Cash flows from financial liabilities Remaining term in million euros December 31, 2013 Carrying amounts Up to 1 year Between 1 and 5 years More than 5 years December 31, 2013 Total cash flow 2,446 2,461 1,146 – 1,300 Commercial paper 2 35 35 – – 35 Liabilities to banks 117 117 – – 117 2,872 2,872 – – 2,872 58 53 2 3 58 5,543 4,223 2 1,303 5,528 Bonds 1 Trade accounts payable Sundry financial instruments 3 Original financial instruments Derivative financial instruments Total 34 28 6 – 34 5,577 4,251 8 1,303 5,562 1 Interest payments through to the contractual maturity of the hybrid bond in 2104 would total 70 million euros p.a., which are not included in the figure for long-term cash outflows. 2 From the euro and US dollar commercial paper program (total volume 2 billion US dollars and 1 billion euros). 3 Sundry financial instruments include amounts due to customers, and finance bills. 143 Cash flows from financial liabilities Remaining term in million euros December 31, 2014 Carrying amounts Up to 1 year Between 1 and 5 years More than 5 years December 31, 2014 Total cash flow 1,370 1,349 70 – 1,300 Commercial paper 2 288 288 – – 288 Liabilities to banks 104 96 9 – 105 3,046 3,046 – – 3,046 78 74 1 3 78 4,865 3,574 10 1,303 4,887 Bonds 1 Trade accounts payable Sundry financial instruments 3 Original financial instruments Derivative financial instruments Total 43 40 3 – 43 4,908 3,614 13 1,303 4,930 1 Interest payments through to the contractual maturity of the hybrid bond in 2104 would total 70 million euros p.a., which are not included in the figure for long-term cash outflows. 2 From the euro and US dollar commercial paper program (total volume 2 billion US dollars and 1 billion euros). 3 Sundry financial instruments include amounts due to customers, and finance bills. 160 Notes to the consolidated financial statements Henkel Annual Report 2014 Market risk Currency risk Market risk exists where the fair value or future cash flows of a financial instrument may fluctuate due to changes in market prices. Market risks primarily take the form of currency risk, interest rate risk and various price risks (particularly the commodity price risk). The global nature of our business activities results in a huge number of cash flows in different currencies. The resultant currency exposure breaks down into two categories, namely transaction and translation risks. The Corporate Treasury department manages currency exposure and interest rates centrally for the Group and is therefore responsible for all transactions with financial derivatives and other financial instruments. Trading, Treasury Controlling and Settlement (front, middle and back offices) are separated both physically and in terms of organization. The parties to the contracts are German and international banks which Henkel monitors regularly, in accordance with Corporate Treasury guidelines, for creditworthiness and the q uality of their quotations. Financial derivatives are used to manage currency exposure and interest rate risks in connection with operating activities and the resultant financing requirements, again in accordance with the Corporate Treasury guidelines. Financial derivatives are entered into solely for hedging purposes. The currency and interest rate risk management of the Group is supported by an integrated treasury system which is used to identify, measure and analyze the Group’s currency exposure and interest rate risks. In this context, “integrated” means that the entire process from the conclusion of financial transactions to their entry in the accounts is covered. Much of the currency trading takes place on internet-based, multibank dealing platforms. These foreign currency transactions are automatically transferred into the treasury system. The currency exposure and interest rate risks reported by all subsidiaries under standardized reporting procedures are integrated into the treasury system by data transfer. As a result, it is possible to retrieve and measure at any time all currency and interest rate risks across the Group and all derivatives entered into to hedge the exposure to these risks. The treasury system supports the use of various risk concepts. Market risk is monitored on the basis of sensitivity analyses and value-at-risk computations. Sensitivity analyses enable estimation of potential losses, future gains, fair values or cash flows of instruments susceptible to market risks arising from one or several selected hypothetical changes in foreign exchange rates, interest rates, commodity prices or other relevant market rates or prices over a specific period. Sensitivity analyses are used in the Henkel Group because they enable reasonable risk assessments to be made on the basis of direct assumptions (e.g. an increase in interest rates). Value-at-risk computations reveal the maximum potential future loss of a certain portfolio over a given period based on a specified probability level. Transaction risks arise from possible exchange rate fluctuations causing changes in the value of future foreign currency cash flows. The hedging of the resultant exchange rate risks forms a major part of our central risk management activity. Transaction risks arising from our operating business are partially avoided by the fact that we largely manufacture our products in those countries in which they are sold. Residual transaction risks on the operating side are proactively managed by Corporate Treasury. This includes the ongoing assessment of the specific currency risk and the development of appropriate hedging strategies. The objective of our currency hedging is to fix prices based on hedging rates so that we are protected from future adverse fluctuations in exchange rates. Because we limit our potential losses, any negative impact on profits is restricted. The transaction risk arising from major financial payables and receivables is, for the most part, hedged. In order to manage these risks, we primarily utilize forward exchange contracts and currency swaps. The derivatives are designated as cash flow hedges or “Held for trading” and measured accordingly. The currency risk that exists within the Group in the form of transaction risk initially affects equity in the case of cash flow hedges, while all changes in the value of derivatives designated as “Held for trading“ are recognized directly in income. The value-at-risk pertaining to the transaction risk of the Henkel Group as of December 31, 2014 amounted to 215 million euros after hedging (previous year: 74 million euros). The value-atrisk shows the maximum expected risk of loss in a year as a result of currency fluctuations. Starting in fiscal 2013, our valueat-risk analysis has been extended to one year in our internal risk reports as it provides a more comprehensive representation of the risk associated with a fiscal year. The risk arises from imports and exports by Henkel AG & Co. KGaA and its foreign subsidiaries. Due to the international nature of its activities, the Henkel Group has a portfolio with more than 50 different currencies. In addition to the US dollar, the main influence on currency risk is exerted by the Russian ruble, the Turkish lira, the Mexican peso, the Brazilian real and the Indian rupee. The value-at-risk analysis assumes a time horizon of one year and a unilateral confidence interval of 95 percent. We adopt the variance-covariance approach as our basis for calculation. Volatilities and correlations are determined using historical data. The value-at-risk analysis is based on the operating book positions and budgeted positions in foreign currency, normally with a forecasting horizon of nine months. Notes to the consolidated financial statements 112 Consolidated statement of financial position 114 Consolidated statement of income 115 Consolidated statement of comprehensive income 115 Consolidated statement of changes in equity 116 Consolidated statement of cash flows 117 Group segmentreport by business unit 118 Key financials by region 119 Accounting principles and methods applied in preparation of the consolidated financial statements 128 Notes to the consolidated statement of financial position Translation risks emanate from changes caused by foreign exchange fluctuations to items on the statement of financial position and the income statement of a subsidiary, and the effect these changes have on the translation of individual company financial statements into Group currency. However, unlike transaction risk, translation risk does not necessarily impact future cash flows. The Group’s equity reflects the changes in carrying value resulting from foreign exchange influences. The risks arising from the translation of the earnings results of subsidiaries in foreign currencies and from net investments in foreign entities are only hedged in exceptional cases. 161 163 Notes to the consolidated statement of income 168 Other disclosures 175 Independent Auditor’s Report 177 Recommendation for the approval of the annual financial statements and the appropriation of the profit of Henkel AG & Co. KGaA 178 Annual financial statements of Henkel AG & Co. KGaA (summarized) 179 Responsibility statement by the Personally Liable Partner 180 Corporate management bodies of Henkel AG & Co. KGaA from fixed to floating through interest rate swaps. In the event of an expected rise in interest rate levels, Henkel protects its positions by transacting additional interest rate derivatives as an effective means of guarding against interest rates rising over the short term. A major portion of the financing in US dollars has been converted from floating to fixed interest rates through interest rate swaps. This interest fixing expired at the end of the first quarter 2014. Since that time, the net interest position has been entirely floating. Our exposure to interest rate risk at the reporting dates was as follows: Interest rate risk The interest rate risk encompasses those potentially negative influences on profits, equity or cash flow in current or future reporting periods arising from changes in interest rates. In the case of fixed-interest financial instruments, changing capital market interest rates result in a fair value risk, as the attributable fair values fluctuate depending on capital market interest rates. In the case of floating-interest financial instruments, a cash flow risk exists because the interest payments may be subject to future fluctuations. Interest rate exposure The Henkel Group obtains and invests the majority of the cash it requires from and in the international money and capital markets. The resulting financial liabilities and our cash deposits may be exposed to the risk of changes in interest rates. The aim of our centralized interest rate management system is to manage this risk through our choice of interest commitments and the use of derivative financial instruments. Only those derivative financial instruments that can be modeled, monitored and assessed in the risk management system may be used to hedge the interest rate risk. Floating-interest financial instruments Henkel’s interest management strategy is essentially aligned to optimizing the net interest result for the Group. The decisions made in interest management relate to the bonds and commercial paper issued to secure Group liquidity, the securities and time deposits used for cash investments, and the other financial instruments. The financial instruments and interest rate derivatives exposed to interest rate risk are primarily denominated in euros and US dollars. Depending on forecasts with respect to interest rate developments, Henkel enters into derivative financial instruments, primarily interest rate swaps, in order to optimize the interest rate lock-down structure. The coupon interest on the euro- denominated hybrid bond issued by Henkel has been converted 144 Carrying amounts in million euros 2013 2014 Fixed-interest financial instruments Euro US dollar Others – – – 508 – – – – 508 – 827 252 – 168 – 1,398 Chinese yuan 364 502 Russian ruble 106 59 Others 338 432 1,467 – 153 Euro US dollar The calculation of the interest rate risk is based on sensitivity analyses. The analysis of cash flow risk examines all the main floating-interest financial instruments as of the reporting date. Net debt is defined as borrowings less cash and cash equivalents and readily monetizable financial instruments classified as “Available for sale” or according to the “Fair value option,” less positive and plus negative fair values of hedging transactions. The interest rate risk figures shown in the table are based on this calculation at the relevant reporting date. When analyzing fair value risk, we assume a parallel shift in the interest curve of 100 basis points and calculate the hypothetical loss or gain of the relevant interest rate derivatives at the reporting date. 162 Notes to the consolidated financial statements Henkel Annual Report 2014 The risk of interest rate fluctuations with respect to the earnings of the Henkel Group is shown in the basis point value (BPV) analysis in the following table. 145 Interest rate risk in million euros Based on an interest rate change of 100 basis points 2013 2014 – 15 2 – 15 2 – – of which: Cash flow through profit or loss Fair value recognized in equity through comprehensive income As a small part of the risk management strategy, cash-settled commodity futures are entered into on the basis of forecasted purchasing requirements in order to hedge future uncertainties with respect to commodity prices. Cash-settled commodity derivatives are only used at Henkel where there is a direct relationship between the hedging derivative and the physical underlying. Henkel does not practice hedge accounting and is therefore exposed to temporary price risks when holding commodity derivatives. Such price risks arise due to the fact that the commodity derivatives are measured at fair value whereas the purchasing requirement, as a pending transaction, is not measured or recognized. This can lead to losses being recognized in profit or loss and equity. Developments in fair values and the resultant risks are continuously monitored. Other price risks (commodity price risk) Uncertainty with respect to commodity price development impacts the Group. Purchase prices for raw materials can affect the net assets, financial position and results of operations of the corporation. The risk management strategy put in place by the Group management for safeguarding against procurement market risk is described in more detail in the risk and opportunities report on pages 102 and 103. The influence of negative commodity price developments on the valuation of the derivatives employed is immaterial to the financial position of the Henkel Group due to the low volume of derivatives used. In the event of a change in commodity prices of 10 percent, the resultant loss from the derivatives would be less than 1 million euros. 163 Notes to the consolidated financial statements 112 Consolidated statement of financial position 114 Consolidated statement of income 115 Consolidated statement of comprehensive income 115 Consolidated statement of changes in equity 116 Consolidated statement of cash flows 117 Group segmentreport by business unit 118 Key financials by region 119 Accounting principles and methods applied in preparation of the consolidated financial statements 128 Notes to the consolidated statement of financial position 163 Notes to the consolidated statement of income 168 Other disclosures 175 Independent Auditor’s Report 177 Recommendation for the approval of the annual financial statements and the appropriation of the profit of Henkel AG & Co. KGaA 178 Annual financial statements of Henkel AG & Co. KGaA (summarized) 179 Responsibility statement by the Personally Liable Partner 180 Corporate management bodies of Henkel AG & Co. KGaA Notes to the consolidated statement of income Sale proceeds and principles of income recognition 22 24 Marketing, selling and distribution expenses Sales remained approximately at the previous year’s level, at 16,428 million euros. Revenues and their development by business unit and region are summarized in the Group segment report and in the key financials by region on pages 117 and 118. A detailed explanation of the development of major income and expense items can be found in the Group management report on pages 65 to 69. Marketing, selling and distribution expenses amounted to 4,151 million euros (previous year: 4,242 million euros). Sales comprise sales of goods and services less direct sales deductions such as customer-related rebates, credits and other benefits paid or granted. Sales are recognized once the goods have been delivered or the service has been performed. In the case of goods, this coincides with the physical delivery and so-called transfer of risks and rewards. Henkel uses different terms of delivery that contractually determine the transfer of risks and rewards. It must also be probable that the economic benefits associated with the transaction will flow to the Group, and the costs incurred with respect to the transaction must be reliably measurable. Services are generally provided in conjunction with the sale of goods, and recorded once the service has been performed. No sale is recognized if there are significant risks relating to the receipt of the consideration or it is likely that the goods will be returned. Interest income is recognized on a time-proportion basis that takes into account the effective yield on the asset and the interest rate in force. Dividend income from investments is recognized when the shareholders’ right to receive payment is legally established. 23 Cost of sales The cost of sales increased from 8,546 million euros to 8,712 million euros. Cost of sales comprises the c ost of products and services sold and the purchase cost of merchandise sold. It consists of the directly attributable cost of materials and primary production cost, as well as indirect production overheads including the production-related amortization/depreciation and impairment of intangible assets and property, plant and equipment. In addition to marketing organization and distribution expenses, this item comprises, in particular, advertising, sales promotion and market research expenses. Also included here are the expenses of technical advisory services for customers, valuation allowances on trade accounts receivable and valuation allowances and impairment losses on trademarks and other rights. 25 Research and development expenses Research and development expenses were slightly below the previous year’s level, at 413 million euros. The capitalization of research expenses is not permitted. Development expenditures are recognized as an asset if all the criteria for recognition are met, the research phase can be clearly distinguished from the development phase, and the expenditures can be attributed to distinct project phases. Currently, the criteria set out in IAS 38 “Intangible Assets” for recognizing development expenditures are not all being met in regard to product and technology developments, due to a high level of interdependence within these developments and the difficulty of assessing which products will eventually be marketable. 26 Administrative expenses Administrative expenses amounted to 852 million euros ( previous year: 842 million euros). Administrative expenses include personnel and non-personnel costs of Group management and costs relating to the Human Resources, Purchasing, Accounting and IT departments. 164 Notes to the consolidated financial statements Henkel Annual Report 2014 27 Other operating income 29 Financial result 146 Other operating income 2013 2014 Release of provisions 1 14 10 Gains on disposal of non-current assets 39 in million euros in million euros – 9 7 Other financial result – 55 – 46 4 4 Investment result 5 – Total Payments on derecognized receivables 4 – Impairment reversal on assets held for sale – 25 56 63 122 109 1 Including income from the release of provisions for pension o bligations (curtailment gains) of 2 million euros in 2014 (2013: 0 million euros). in million euros Losses on disposal of non-current assets Contractual termination severance payments 2014 – 5 – 6 – – – 35 – – – Sundry operating expenses – 107 – 159 Total – 147 – 165 Impairment on assets held for sale Impairment on other assets Sundry operating expenses include –109 million euros for provisions related to antitrust proceedings in Europe and a number of individual items arising from ordinary operating activities, such as fees, provisions for litigation and third party claims, sundry taxes, and similar expenses. 2013 2014 39 – 94 – 48 Total – 58 – 9 1 Including interest income and interest expense, both in the amount of 31 million euros in 2014 (2013: 30 million euros), with respect to m utually offset deposits and liabilities to banks, reported on a net basis. 150 Other financial result 2013 2014 – 28 – 24 Interest income on plan assets – – Interest income on reimbursement rights (IAS 19) 4 5 – 56 – 154 Interest expense for pension obligations 2013 149 Interest to third parties 1 in million euros 147 6 – 49 36 Interest and similar income from third parties 1 28 Other operating charges – – 113 Interest result in million euros Regarding the impairment reversal on assets held for sale, please refer to Note 9 on page 135 of the report on assets and liabilities held for sale. Sundry operating income relates to a number of individual items arising from ordinary operating activities, such as grants and subsidies, tax refunds for indirect taxes, and similar income. Other operating charges 2014 – 58 Write-ups of non-current assets Sundry operating income 2013 Interest result Insurance claim payouts Total 148 Financial result Other financial charges Other financial income Total 25 127 – 55 – 46 Other financial charges include –118 million euros (previous year: –21 million euros) from currency losses. Other financial income includes 114 million euros (previous year: 9 million euros) for currency gains. Please see page 154 of the financial instruments report for information on the net results of the valuation categories under IFRS 7 and the reconciliation to financial result. 165 Notes to the consolidated financial statements 112 Consolidated statement of financial position 114 Consolidated statement of income 115 Consolidated statement of comprehensive income 115 Consolidated statement of changes in equity 116 Consolidated statement of cash flows 117 Group segmentreport by business unit 118 Key financials by region 119 Accounting principles and methods applied in preparation of the consolidated financial statements 128 Notes to the consolidated statement of financial position 30 Taxes on income Income tax expense/income breaks down as follows: 151 Income before tax and analysis of taxes in million euros Income before tax 2013 163 Notes to the consolidated statement of income 168 Other disclosures 175 Independent Auditor’s Report 177 Recommendation for the approval of the annual financial statements and the appropriation of the profit of Henkel AG & Co. KGaA We have summarized the individual company reports – prepared on the basis of the tax rates applicable in each country and taking into account consolidation procedures – in the statement below, showing how the expected tax charge, based on the tax rate applicable to Henkel AG & Co. KGaA of 31 percent, is reconciled to the effective tax charge disclosed. 2014 2,172 2,195 Current taxes 571 579 Deferred taxes – 24 – 46 in million euros Taxes on income 547 533 Income before taxes Tax rate in percent 25.2 % 24.3 % Tax rate (including trade tax) of Henkel AG & Co. KGaA Tax reductions due to differing tax rates abroad – 86 – 91 Tax increases/reductions for prior years – 32 20 Tax increases/reductions due to changes in tax rates – 3 3 10 – 14 2014 601 Current tax adjustments for prior years – 38 – 22 Tax increases/reductions due to the recognition of deferred tax assets relating to unused tax losses and temporary differences – 34 Tax reductions due to tax-free income and other items – 31 – – 5 Deferred tax expense from tax credits – 4 Deferred tax expense/income from changes in tax rates – 3 3 Increase/decrease in valuation allowances on deferred tax assets 10 – 14 Deferred tax expense by items on the statement of financial position in million euros Intangible assets 153 2013 2014 – 6 – 126 – 12 – Financial assets – 1 73 Inventories – 1 – 8 Property, plant and equipment Other receivables and other assets Special tax items – 28 3 – 3 – 3 Provisions 4 31 Liabilities 13 – 1 Tax credits – 4 Unused tax losses – – 5 10 – 14 – 24 – 46 Valuation allowances Financial statement figures 31 % 31 % 680 609 Deferred tax income from unused tax losses 2014 2,195 673 2013 Deferred tax expense/income from temporary differences 2013 2,172 Expected tax charge Current tax expense/income in the reporting year in million euros 154 Tax reconciliation statement 152 Main components of tax expense and income 178 Annual financial statements of Henkel AG & Co. KGaA (summarized) 179 Responsibility statement by the Personally Liable Partner 180 Corporate management bodies of Henkel AG & Co. KGaA – 107 – 186 Tax increases/reductions arising from additions and deductions for local t axes 18 13 Tax increases due to withholding taxes 22 24 Tax increases due to non-deductible expenses 52 84 547 533 Tax charge disclosed Tax rate 25.2 % 24.3 % Deferred taxes are calculated on the basis of tax rates that apply in the individual countries at the year-end date or which have already been legally decided. In Germany, there is a uniform corporate income tax rate of 15 percent plus a solidarity surcharge of 5.5 percent. After taking into account trade tax, this yields an overall tax rate of 31 percent. Deferred tax assets and liabilities are netted where they involve the same tax authority and the same tax creditor. 166 Notes to the consolidated financial statements Henkel Annual Report 2014 The deferred tax assets and liabilities stated on the reporting date relate to the following items of the consolidated statement of financial position, unused tax losses and tax credits: 155 Allocation of deferred taxes Deferred tax assets in million euros Deferred tax liabilities December 31, December 31, December 31, December 31, 2013 2014 2013 2014 193 269 Property, plant and equipment 15 18 73 82 Financial assets 10 1 18 83 Inventories 35 43 7 5 Other receivables and other assets 48 32 59 46 Special tax items – – 40 37 Provisions 636 755 12 12 Liabilities 77 70 9 6 8 5 – – Intangible assets Tax credits 661 750 29 60 – – – 422 – 393 – 422 – 393 Valuation allowances – 23 – 22 – – Financial statement figures 606 838 457 628 Unused tax losses Amounts netted The deferred tax assets of 755 million euros (previous year: 636 million euros) relating to provisions in the financial statement result primarily from recognition and measurement differences with respect to pension obligations. The deferred tax liabilities of 750 million euros (previous year: 661 million euros) relating to intangible assets are mainly attributable to business combinations such as the acquisition of the National Starch businesses in 2008 and of Spotless Group SAS in 2014. An excess of deferred tax assets is only recognized insofar as it is likely that the company concerned will achieve sufficiently positive taxable profits in the future against which the deductible temporary differences can be offset and tax loss carry-forwards can be used. Deferred taxes have not been recognized with respect to unused tax losses of 126 million euros (previous year: 93 million euros), as it is not sufficiently probable that taxable gains or benefits will be available against which they may be utilized. Of these tax losses carried forward, 60 million euros (previous year: 75 million euros) expire after more than three years. State taxes relating to our US subsidiaries account for 48 million euros (previous year: 42 million euros) of these unused tax losses (tax rate: around 5 percent). Of the tax losses carried forward, 64 million euros are non- expiring (previous year: 18 million euros). Deferred tax liabilities of 12 million euros (previous year: 12 million euros) relating to the retained earnings of foreign subsidiaries have been recognized due to the fact that these earnings will be distributed in 2015. We have summarized the expiry dates of unused tax losses and tax credits in the following table, which includes unused tax losses arising from losses on the disposal of assets of 10 million euros (previous year: 9 million euros) which may be carried forward without restriction. In addition to the unused tax losses listed in the table, interest expense of 16 million euros is available, which may be carried forward in full with no expiration. 167 Notes to the consolidated financial statements 112 Consolidated statement of financial position 114 Consolidated statement of income 115 Consolidated statement of comprehensive income 115 Consolidated statement of changes in equity 116 Consolidated statement of cash flows 117 Group segmentreport by business unit 118 Key financials by region 119 Accounting principles and methods applied in preparation of the consolidated financial statements 128 Notes to the consolidated statement of financial position 163 Notes to the consolidated statement of income 168 Other disclosures 175 Independent Auditor’s Report 177 Recommendation for the approval of the annual financial statements and the appropriation of the profit of Henkel AG & Co. KGaA 178 Annual financial statements of Henkel AG & Co. KGaA (summarized) 179 Responsibility statement by the Personally Liable Partner 180 Corporate management bodies of Henkel AG & Co. KGaA 156 Expiry dates of unused tax losses and tax credits Unused tax losses in million euros December 31, 2013 Tax credits December 31, 2014 December 31, 2013 December 31, 2014 Expire within 1 year 4 8 – 2 2 years – 10 – – 1 3 years more than 3 years May be carried forward without restriction Total In many countries, different tax rates apply to losses on the disposal of assets and to operating profits, and in some cases losses on the disposal of assets may only be offset against gains on the disposal of assets. Of unused tax losses expiring beyond three years, 91 million euros (previous year: 93 million euros) relate to loss carry forwards of US subsidiaries with respect to state taxes. Equity-increasing deferred taxes of 123 million euros were recognized (previous year: equity-decreasing amount of 36 million euros). Within this figure, income of 127 million euros results from actuarial gains and losses on pension obligations, expense of 1 million euros results from gains and losses on cash flow hedges, and expense of 3 million euros from currency hedges. – 13 – 144 145 8 2 52 109 – – 200 285 8 5 31 Non-controlling interests The amount shown here represents the proportion of net income and losses attributable to other shareholders of consolidated affiliated companies. Their share of net income was 36 million euros (previous year: 36 million euros) and that of losses was 2 million euros (previous year: 0 million euros). The non-controlling interests included in the Henkel Group at the end of fiscal 2014 had no material impact on our net assets, financial position and results of operations. The Group has no joint operations or unconsolidated structured entities. 168 Notes to the consolidated financial statements Henkel Annual Report 2014 Other disclosures 32 Payroll cost and employee structure 157 Payroll cost 1 in million euros 2013 2014 Wages and salaries 2,056 2,073 Social security contributions and staff welfare costs 358 372 Pension costs 156 153 2,570 2,598 Total 1 Excluding personnel-related restructuring charges of 105 million euros (previous year: 116 million euros). 158 Number of employees per function 1 2013 2014 Production and engineering 23,000 23,000 Marketing, selling and distribution 14,850 15,200 Research and development 2,600 2,650 Administration 6,350 6,950 46,800 47,800 Total 1A nnual average headcount: full-time employees, excluding apprentices and trainees, work experience students and interns; figures rounded. 33 Share-based payment plans Global Cash Performance Units Plan (Global CPU-Plan) 2004 – 2012 Since the end of the Stock Incentive Plan in 2004, those eligible for that plan, the senior executive personnel of the Henkel Group (excluding members of the Management Board), have been part of the Global CPU Plan, which enables them to participate in any increase in the price of the Henkel preferred share. Cash Performance Units (CPUs) are awarded on the basis of the level of achievement of certain defined targets. They grant the beneficiary the right to receive a cash payment at a fixed point in time. The CPUs are granted on condition that the member of the Plan is employed for three years by Henkel AG & Co. KGaA or one of its subsidiaries in a position senior enough to qualify to participate and that he or she is not under notice during that period. This minimum period of employment pertains to the calendar year in which the CPUs are granted and the two subsequent calendar years. The number of CPUs granted depends not only on the hier– archy level of the officer but also on the achievement of set target figures. For the cycles up to 2012, these targets were operating profit (EBIT) and net income attributable to shareholders of Henkel AG & Co. KGaA. The value of a CPU in each case is the average price of the Henkel preferred share as quoted 20 stock exchange trading days after the Annual General Meeting following the performance period. An upper limit or cap is imposed in the event of extraordinary share price increases. Global Long Term Incentive Plan (Global LTI Plan) 2013 In fiscal 2013, the general terms and conditions of the Global CPU Plan were amended and replaced by the Global LTI Plan 2013. Starting in 2013, CPUs are granted on condition that the member of the Plan is employed for four years by Henkel AG & Co. KGaA or one of its subsidiaries in a position senior enough to qualify to participate and that he or she is not under notice during that period. This minimum period of employment pertains to the calendar year in which the CPUs are granted and the three subsequent calendar years. In addition, an Outperformance Reward, which awards CPUs based on the achievement of target figures established in advance, may be set at the beginning of a four-year medium-term plan. Due to the extension of the cycle, one tranche with a threeyear term and another with a four-year term were issued in 2013. The number of CPUs granted depends not only on the seniority of the officer but also on the achievement of set target figures. For the cycles issued from 2013 onward, the target is based on growth in adjusted earnings per preferred share. The value of a CPU in each case is the average price of the Henkel preferred share as quoted 20 stock exchange trading days after the Annual General Meeting following the performance period. The overall payout of the long-term incentive is subject to a cap. The total value of CPUs granted to senior management personnel is remeasured at each year-end and treated as a payroll cost over the period in which the plan members provide their services to Henkel. The eighth cycle, which was issued in 2011, became due for payment in 2014. At December 31, 2014, the CPU Plan worldwide comprised 429,872 CPUs (previous year: 514,776 CPUs) from the ninth tranche issued in 2012 (expense: 12.5 million euros), 994,775 CPUs (previous year: 1,099,475 CPUs) from the tranches issued in 2013 (expense: 25.2 million euros), and 533,553 CPUs from the tranche issued in the reporting year (expense: 11.7 million euros). The Outperformance Reward comprised 541,682 CPUs (expense: 11.8 million euros). This resulted in an additional expense in the reporting year of 61.2 million euros (previous year: 60.5 million euros). The corresponding provision amounted to 123.2 million euros (previous year: 94.7 million euros). 169 Notes to the consolidated financial statements 112 Consolidated statement of financial position 114 Consolidated statement of income 115 Consolidated statement of comprehensive income 115 Consolidated statement of changes in equity 116 Consolidated statement of cash flows 117 Group segmentreport by business unit 118 Key financials by region 119 Accounting principles and methods applied in preparation of the consolidated financial statements 128 Notes to the consolidated statement of financial position 34 Group segment report The format for reporting the activities of the Henkel Group by segment is by business unit; selected regional information is also provided. This classification corresponds to the way in which the Group manages its operating business, and the Group’s reporting structure. Business units The activities of the Henkel Group are divided into the following reported operating segments: Laundry & Home Care, Beauty Care, and Adhesive Technologies (Adhesives for Consumers, Craftsmen and Building, and Industrial Adhesives). Laundry & Home Care The Laundry & Home Care business unit is globally active in the laundry and home care Branded Consumer Goods industry. The Laundry Care business area includes not only heavy-duty and specialty detergents but also fabric softeners, laundry performance enhancers and laundry care products. Our Home Care business area encompasses hand and automatic dishwashing products, cleaners for bathroom and WC applications, and household, glass and specialty cleaners. We also offer air fresheners and insecticides for household applications in selected regions. Beauty Care The Beauty Care business unit is active worldwide in the Branded Consumer Goods business area with Hair Care, Hair Colorants, Hair Styling, Body Care, Skin Care and Oral Care, as well as in the professional Hair Salon business area. Adhesive Technologies (Adhesives for Consumers, Craftsmen and Building, and Industrial Adhesives) The Adhesive Technologies business unit comprises five market- and customer-focused business areas. 163 Notes to the consolidated statement of income 168 Other disclosures 175 Independent Auditor’s Report 177 Recommendation for the approval of the annual financial statements and the appropriation of the profit of Henkel AG & Co. KGaA 178 Annual financial statements of Henkel AG & Co. KGaA (summarized) 179 Responsibility statement by the Personally Liable Partner 180 Corporate management bodies of Henkel AG & Co. KGaA Our portfolio here encompasses Loctite products for industrial maintenance, repair and overhaul, a wide range of sealants and system solutions for surface treatment applications, and specialty adhesives. The Packaging, Consumer Goods and Construction Adhesives business area serves major international customers as well as medium- and small-sized manufacturers of the consumer goods and furniture industries. Our economies of scale allow us to offer attractive solutions for standard and volume appli cations. Our Electronics business area offers customers from the worldwide electronics industry a broad spectrum of innovative high-technology adhesives and soldering materials for the manufacture of microchips and electronic assemblies. Principles of Group segment reporting In determining the segment results and the assets and liabilities, we apply essentially the same principles of recognition and measurement as in the consolidated financial statements. We have valued net operating assets in foreign currencies at average exchange rates. The Group measures the performance of its segments on the basis of a segment income variable referred to by Internal Control and Reporting as “adjusted EBIT.” For this purpose, operating profit (EBIT) is adjusted for one-time charges and gains and also restructuring charges. Of the restructuring charges, 74 million euros is attributable to the business unit Laundry & Home Care (previous year: 28 million euros), 64 million euros is attributable to Beauty Care (previous year: 51 million euros) and 60 million euros is attributable to Adhesive Technologies (previous year: 58 million euros). In the Adhesives for Consumers, Craftsmen and Building business area, we market a wide range of brand-name products for private and professional users. Based on our four international brand platforms, namely Loctite, Pritt, Pattex and Ceresit, we offer target group-aligned system solutions for applications in the household, schools and offices, for do-it-yourselfers and craftsmen, and also for the building industry. For reconciliation with the figures for the Henkel Group, Group overheads are reported under Corporate together with income and expenses that cannot be allocated to the individual business units. Our Transport and Metal business area serves major international customers in the automotive and metal-processing industries, offering tailor-made system solutions and specialized technical services that cover the entire value chain – from steel strip coating to final vehicle assembly. Operating assets, provisions and liabilities are assigned to the segments in accordance with their usage or origin. Where usage or origin is attributable to several segments, allocation is effected on the basis of appropriate ratios and keys. In the General Industry business area, our customers comprise manufacturers from a multitude of industries, ranging from household appliance producers to the wind power industry. Proceeds transferred between the segments only exist to a negligible extent and are therefore not separately disclosed. For regional and geographic analysis purposes, we allocate sales to countries on the basis of the country-of-origin principle, and non-current assets in accordance with the domicile of the international company to which they pertain. 170 Notes to the consolidated financial statements Henkel Annual Report 2014 Reconciliation between net operating assets / capital employed and financial statement figures 159 Financial statement figures Net operating assets in million euros Financial statement figures Net operating assets Annual December 31, December 31, average 1 2013 2013 2013 Annual December 31, December 31, average 1 2014 2014 2014 Goodwill at book value 6,565 6,353 6,353 6,842 8,074 8,074 Other intangible assets and property, plant and equipment (total) 4,281 4,131 4,131 4,373 4,977 4,977 – – 606 – – 838 Inventories 1,618 1,494 1,494 1,700 1,671 1,671 Trade accounts receivable from third parties 2,747 Deferred taxes 2,633 2,370 2,370 2,763 2,747 Intra-group accounts receivable 765 706 – 764 880 – Other assets and tax refund claims 2 439 372 3,303 410 416 1,395 Cash and cash equivalents Operating assets (gross) / Total assets – Operating liabilities of which: Trade accounts payable to third parties Intra-group accounts payable Other provisions and other liabilities 2 (financial and non-financial) Net operating assets 1,228 1,051 Assets held for sale 31 36 16,301 15,426 19,344 16,852 18,765 20,961 5,669 5,470 – 5,617 5,959 – 2,920 2,872 2,872 2,992 3,046 3,046 768 706 – 764 880 – 1,981 1,892 2,122 1,861 2,033 2,292 10,632 9,959 – 11,235 12,806 – – Goodwill at book value 6,565 – – 6,842 – – + Goodwill at cost 3 7,072 – – 7,397 – – 11,139 – – 11,790 – – Capital employed 1 The annual average is calculated on the basis of the 12 monthly figures. 2 We only take amounts relating to operating activities into account in calculating net operating assets. 3 Before deduction of accumulated impairment pursuant to IFRS 3.79(b). 171 Notes to the consolidated financial statements 112 Consolidated statement of financial position 114 Consolidated statement of income 115 Consolidated statement of comprehensive income 115 Consolidated statement of changes in equity 116 Consolidated statement of cash flows 117 Group segmentreport by business unit 118 Key financials by region 119 Accounting principles and methods applied in preparation of the consolidated financial statements 128 Notes to the consolidated statement of financial position 163 Notes to the consolidated statement of income 168 Other disclosures 175 Independent Auditor’s Report 177 Recommendation for the approval of the annual financial statements and the appropriation of the profit of Henkel AG & Co. KGaA 178 Annual financial statements of Henkel AG & Co. KGaA (summarized) 179 Responsibility statement by the Personally Liable Partner 180 Corporate management bodies of Henkel AG & Co. KGaA 35 Earnings per share 160 Earnings per share 2013 in million euros (rounded) 2014 Net income attributable to shareholders of Henkel AG & Co. KGaA 1,589 1,628 Dividends, ordinary shares 312 335 Dividends, preferred shares 213 229 Total dividends 525 564 Retained earnings per ordinary share 636 636 Retained earnings per preferred share 428 428 Retained earnings 1,064 1,064 Number of ordinary shares 259,795,875 259,795,875 1.20 1.29 3 0.02 0.02 Retained earnings per ordinary share in euros 2.45 2.45 EPS per ordinary share in euros 3.65 3.74 Dividend per ordinary share in euros of which preliminary dividend per ordinary share in euros 1 Number of outstanding preferred shares 2 174,482,305 174,482,310 1.22 1.31 3 0.04 0.04 Retained earnings per preferred share in euros 2.45 2.45 EPS per preferred share in euros 3.67 3.76 Dividend per preferred share in euros of which preferred dividend per preferred share in euros 1 Number of ordinary shares 259,795,875 259,795,875 1.20 1.29 3 of which preliminary dividend per ordinary share in euros 1 0.02 0.02 Retained earnings per ordinary share in euros (after dilution) 2.45 2.45 Diluted EPS per ordinary share in euros 3.65 3.74 Dividend per ordinary share in euros Number of potential outstanding preferred shares Dividend per preferred share in euros of which preferred dividend per preferred share in euros 1 174,482,305 174,482,310 1.22 1.31 3 0.04 0.04 Retained earnings per preferred share in euros (after dilution) 2.45 2.45 Diluted EPS per preferred share in euros 3.67 3.76 1 See Group management report, Corporate governance, Capital stock denominations, Shareholder rights on pages 30 and 31. 2 Weighted annual average of preferred shares (Henkel buy-back program). 3 Proposal to shareholders for the Annual General Meeting on April 13, 2015. 172 Notes to the consolidated financial statements 36 Consolidated statement of cash flows We prepare the consolidated statement of cash flows in accordance with International Accounting Standard (IAS) 7 “Statement of Cash Flows.” It describes the flow of cash and cash equivalents by origin and usage of liquid funds, distinguishing between changes in funds arising from operating activities, investing activities, and financing activities. Financial funds include cash on hand, checks and credit at banks, and other financial assets with a remaining term of not more than three months. Securities are therefore included in financial funds, provided that they are available at short term and are only exposed to an insignificant price change risk. The computation is adjusted for effects arising from currency translation. In some countries, there are administrative hurdles to the transfer of money to the parent company. Henkel Annual Report 2014 The free cash flow shows how much cash is actually available for acquisitions and dividends, reducing debt and/or contri butions to pension funds. 37 Contingent liabilities 161 Analysis in million euros Liabilities under guarantee and warranty agreements December 31, 2013 December 31, 2014 4 4 38 Other unrecognized financial commitments Cash flows from operating activities are determined by initially adjusting operating profit by non-cash variables such as amortization / depreciation / impairment / write-ups on intangible assets and property, plant and equipment – supplemented by changes in provisions, changes in other assets and liabilities, and also changes in net working capital. We disclose payments made for income taxes under operating cash flow. In the reporting period, payments made for income taxes included tax credits of 4 million euros for the expansion of production. Operating leases as defined in IAS 17 comprise all forms of rights of use of assets, including rights of use arising from rent and leasehold agreements. Payment commitments under operating lease agreements are shown at the total amounts payable up to the earliest date of termination. The amounts shown are the nominal values. At December 31, 2014, they were due for payment as follows: Cash flows from investing activities occur essentially as a result of outflows of funds for investments in intangible assets and property, plant and equipment, subsidiaries and other business units, as well as investments accounted for using the equity method and joint ventures. We also recognize inflows of funds from the sale of intangible assets and property, plant and equipment, subsidiaries and other business units here. In the reporting period, cash flows from investing activities mainly involved outflows for the acquisition of subsidiaries and other business units in the amount of –1,719 million euros (previous year: –31 million euros), as described in the section “Acquisitions and divestments” on pages 120 to 122. in million euros In cash flow from financing activities, we recognize interest and dividends paid and received, the change in borrowings and in pension provisions, and also payments made for the acquisition of non-controlling interests and other financing transactions. The change in borrowings in the reporting year was influenced by the redemption of our senior bond, which matured in March 2014, and by the inflows from issuing commercial paper. The inflows from other financing transactions essentially reflect the partial sale of our cash deposits. 162 Operating lease commitments Due in the following year Due within 1 to 5 years Due after 5 years Total December 31, 2013 December 31, 2014 62 67 119 135 19 24 200 226 Within the Group, we primarily lease office space and equipment, automobiles, and IT equipment. Some of these contracts contain extension options and price adjustment clauses. In the course of the 2014 fiscal year, 64 million euros became due for payment under operating leases (previous year: 63 million euros). As of the end of 2014, commitments arising from orders for property, plant and equipment amounted to 67 million euros (previous year: 62 million euros). As of the reporting date, payment commitments under the terms of agreements for capital increases and share purchases contracted prior to December 31, 2014 amounted to 0 million euros (previous year: 0 million euros). 173 Notes to the consolidated financial statements 112 Consolidated statement of financial position 114 Consolidated statement of income 115 Consolidated statement of comprehensive income 115 Consolidated statement of changes in equity 116 Consolidated statement of cash flows 117 Group segmentreport by business unit 118 Key financials by region 119 Accounting principles and methods applied in preparation of the consolidated financial statements 128 Notes to the consolidated statement of financial position 39 Voting rights / Related party disclosures Related parties as defined by IAS 24 (“Related Party Disclosures”) are legal entities or natural persons who may be able to exert influence on Henkel AG & Co. KGaA and its subsidiaries, or be subject to control or material influence by Henkel AG & Co. KGaA or its subsidiaries. These include, in particular, the members of the Henkel family share-pooling agreement as a whole, the non-consolidated entities in which Henkel holds a participating interest, associated entities and also the members of the corporate management bodies of Henkel AG & Co. KGaA whose compensation are indicated in the remuneration report section of the management report on pages 38 to 49. Henkel Trust e.V. and Metzler Trust e.V. also fall into the category of related parties as defined in IAS 24. Information required by Section 160 (1) no. 8 of the German Stock Corporation Act [AktG]: Henkel AG & Co. KGaA, Düsseldorf, has been notified that on November 3, 2014 the proportion of voting rights held by the members of the Henkel family share-pooling agreement represented in total a share of 60.84 percent of the voting rights (158,048,919 votes) in Henkel AG & Co. KGaA, held by • 129 members of the families of the descendents of Fritz Henkel, the company’s founder, • four foundations set up by members of those families, • three trusts set up by members of those families, • two private limited companies (GmbH) set up by members of those families, thirteen limited partnerships with a lim ited company as general partner (GmbH & Co. KG), and one limited partnership (KG), under the terms of a share-pooling agreement per Section 22 (2) of the German Securities Trading Law [WpHG], whereby the shares held by the two private limited companies, by the thirteen limited partnerships with a limited company as general partner, and by the one limited partnership, representing a percentage of 16.97 percent (44,081,965 voting rights), are attributed (per Section 22 (1) no. 1 WpHG) to the family members who control those companies. No party to the share-pooling agreement is obliged to notify that it has reached or exceeded 3 percent or more of the total voting rights in Henkel AG & Co. KGaA, even after adding voting rights expressly granted under the terms of usufruct agreements. Dr. Simone Bagel-Trah, Germany, is the authorized represen tative of the parties to the Henkel family share-pooling agreement. 163 Notes to the consolidated statement of income 168 Other disclosures 175 Independent Auditor’s Report 177 Recommendation for the approval of the annual financial statements and the appropriation of the profit of Henkel AG & Co. KGaA 178 Annual financial statements of Henkel AG & Co. KGaA (summarized) 179 Responsibility statement by the Personally Liable Partner 180 Corporate management bodies of Henkel AG & Co. KGaA Financial receivables from and payables to other investments in the form of non-consolidated affiliated entities and associated entities are disclosed in Notes 3 and 18. Henkel Trust e.V. and Metzler Trust e.V., as parties to relevant contractual trust arrangements (CTA), hold the assets required to cover the pension obligations in Germany. The claim on Henkel Trust e.V. for reimbursement of pension payments made is shown under other financial assets (Note 3 on page 133). The receivable does not bear interest. 40 Exercise of exemption options The following German companies included in the consolidated financial statements of Henkel AG & Co. KGaA exercised exemption options in fiscal 2014: • Schwarzkopf Henkel Production Europe GmbH & Co. KG, Düsseldorf (Section 264b German Commercial Code [HGB]) • Henkel Loctite-KID GmbH, Hagen (Section 264 (3) HGB) • Henkel IP Management and IC Services GmbH, Monheim (Section 264 (3) HGB) The Dutch company Henkel Nederland B.V., Nieuwegein, exercised the exemption option afforded in Article 2:403 of the Civil Code of the Netherlands. Remuneration of the corporate management bodies 41 The total remuneration of the members of the Supervisory Board and of the Shareholders’ Committee of Henkel AG & Co. KGaA amounted to 1,562,000 euros plus value-added tax (previous year: 1,529,589 euros) and 2,350,000 euros (previous year: 2,350,000 euros), respectively. The total remuneration (Section 285 no. 9a and Section 314 (1) no. 6a HGB) of the Management Board and members of the Management Board of Henkel Management AG amounted to 27,404,426 euros (previous year: 26,944,135 euros). For pension obligations to former members of the Management Board and the management of Henkel KGaA, as well as the former management of its legal predecessor and surviving dependents, 108,218,489 euros (previous year: 95,956,228 euros) is deferred. The total remuneration for this group of persons (Section 285 no. 9b and Section 314 (1) no. 6b HGB) in the reporting year amounted to 7,138,469 euros (previous year: 7,626,894 euros). For further details regarding the compensation of the corporate management bodies, please refer to the audited remuneration report on pages 38 to 49. 174 Notes to the consolidated financial statements Henkel Annual Report 2014 Declaration of compliance with the Corporate 42 Governance Code (DCGK) In February 2014, the Management Board of Henkel Management AG and the Supervisory Board and Shareholders’ Committee of Henkel AG & Co. KGaA approved a joint declaration of compliance with the recommendations of the German Corporate Governance Code (DCGK) in accordance with Section 161 AktG. The declaration has been made permanently available to shareholders on the company website: www.henkel.com/ir The item “Audits” includes fees and disbursements with respect to the audit of the Group accounts and the legally prescribed financial statements of Henkel AG & Co. KGaA and its affiliated companies. The fees for “Other audit-related services” relate primarily to the quarterly reviews. The item “Tax advisory services” includes fees for advice and support on tax issues and the performance of tax compliance services on behalf of affiliated companies outside Germany. “Other services” comprise fees predominantly for project-related consultancy services. 43 Subsidiaries and other investments Details relating to the investments held by Henkel AG & Co. KGaA and the Henkel Group, which are part of these financial statements, are provided in a separate schedule appended to these notes to the consolidated financial statements but not included in the printed form of the Annual Report. Said schedule is included in the accounting record submitted for publication in the electronic Federal Gazette and can be viewed there and at the Annual General Meeting. The schedule is also included in the online version of the Annual Report on our website: www.henkel.com/ir Auditor’s fees and services 44 The total fees charged to the Group for services provided by the auditor KPMG AG Wirtschaftsprüfungsgesellschaft and other companies of the worldwide KPMG network in fiscal 2013 and 2014 were as follows: 163 Type of fee 2013 of which Germany 2014 of which Germany Audits 6.5 1.5 7.5 1.9 Other audit-related services 2.0 0.9 2.0 0.7 Tax advisory services 1.0 0.0 0.9 0.1 Other services 0.3 0.2 0.8 0.8 Total 9.8 2.6 11.2 3.5 in million euros Düsseldorf, January 30, 2015 Henkel Management AG, Personally Liable Partner of Henkel AG & Co. KGaA Management Board Kasper Rorsted, Jan-Dirk Auris, Carsten Knobel, Kathrin Menges, Bruno Piacenza, Hans Van Bylen 175 112 Consolidated statement of financial position 114 Consolidated statement of income 115 Consolidated statement of comprehensive income 115 Consolidated statement of changes in equity 116 Consolidated statement of cash flows 117 Group segmentreport by business unit 118 Key financials by region 119 Accounting principles and methods applied in preparation of the consolidated financial statements 128 Notes to the consolidated statement of financial position 163 Notes to the consolidated statement of income 168 Other disclosures 175 Independent Auditor’s Report 177 Recommendation for the approval of the annual financial statements and the appropriation of the profit of Henkel AG & Co. KGaA 178 Annual financial statements of Henkel AG & Co. KGaA (summarized) 179 Responsibility statement by the Personally Liable Partner 180 Corporate management bodies of Henkel AG & Co. KGaA Independent Auditor’s Report To Henkel AG & Co. KGaA, Düsseldorf Report on the Consolidated Financial Statements We have audited the accompanying consolidated financial statements of Henkel AG & Co. KGaA, Düsseldorf, and its subsidiaries, which comprise the consolidated statement of financial position, the consolidated statement of income, the consolidated statement of comprehensive income, the consolidated statement of changes in equity, the consolidated statement of cash flows, and notes to the consolidated financial statements for the business year from January 1 to December 31, 2014. Responsibility of the Personally Liable Partner of the Company for the Consolidated Financial Statements The personally liable partner of Henkel AG & Co. KGaA is responsible for the preparation of these consolidated financial statements. This responsibility includes preparing these consolidated financial statements in accordance with International Financial Reporting Standards as adopted by the EU, and the supplementary requirements of German law pursuant to § [Article] 315a Abs. [paragraph] 1 HGB [Handelsgesetzbuch: German Commercial Code], to give a true and fair view of the net assets, financial position and results of operations of the Group in accordance with these requirements. The personally liable partner of the company is also responsible for the internal controls that management determines are necessary to enable the preparation of consolidated financial statements that are free from material misstatement, whether due to fraud or error. Auditor’s Responsibility Our responsibility is to express an opinion on these consolidated financial statements based on our audit. We conducted our audit in accordance with § 317 HGB and German generally accepted standards for the audit of financial statements promulgated by the Institut der Wirtschaftsprüfer [Institute of Public Auditors in Germany] (IDW) as well as in supplementary compliance with International Standards on Auditing (ISA). Accordingly, we are required to comply with ethical requirements and plan and perform the audit to obtain reasonable assurance about whether the consolidated financial statements are free from material misstatement. An audit involves performing audit procedures to obtain audit evidence about the amounts and disclosures in the consolidated financial statements. The selection of audit procedures depends on the auditor’s professional judgment. This includes the assessment of the risks of material misstatement of the consolidated financial statements, whether due to fraud or error. In assessing those risks, the auditor considers the internal control system relevant to the entity’s preparation of the consolidated financial statements that give a true and fair view. The aim of this is to plan and perform audit procedures that are appropriate in the given circumstances, but not for the purpose of expressing an opinion on the effectiveness of the Group’s internal control system. An audit also includes evaluating the appropriateness of accounting policies used and the reasonableness of accounting estimates made by the company’s personally liable partner, as well as evaluating the overall presentation of the consolidated financial statements. We believe that the audit evidence we have obtained is sufficient and appropriate to provide a basis for our audit opinion. Audit Opinion Pursuant to § 322 Abs. 3 Satz 1 HGB, we state that our audit of the consolidated financial statements has not led to any reservations. In our opinion, based on the findings of our audit, the consolidated financial statements comply in all material respects with IFRSs as adopted by the EU and the supplementary requirements of German commercial law pursuant to § 315a Abs. 1 HGB and give a true and fair view of the net assets and financial position of the Henkel Group as at December 31, 2014, as well as the results of operations for the business year then ended, in accordance with these requirements. Report on the Group Management Report We have audited the accompanying Group management report of Henkel AG & Co. KGaA for the business year from January 1 to December 31, 2014. The personally liable partner of Henkel AG & Co. KGaA is responsible for the preparation of the Group management report in compliance with the applicable requirements of German commercial law pursuant to § [Article] 315a Abs [paragraph] 1 HGB [Handelsgesetzbuch: German Commercial Code]. We conducted our audit in accordance with § 317 Abs. 2 HGB and German generally accepted standards for the audit of Group management reports promulgated by the Institut der Wirtschaftsprüfer [Institute of Public Auditors in Germany] (IDW). Accordingly, we are required to plan and perform the audit of Group management reports to obtain reasonable assurance about whether the Group management report is consistent with the consolidated financial statements and the audit findings, and as a whole provides a suitable view of the Group’s position and suitably presents the opportunities and risks of future development. 176 Pursuant to § 322 Abs. 3 Satz 1 HGB, we state that our audit of the Group management report has not led to any reservations. In our opinion, based on the findings of our audit of the consolidated financial statements and Group management report, the Group management report is consistent with the consolidated financial statements, and as a whole provides a suitable view of the Group’s position and suitably presents the opportunities and risks of future development. Düsseldorf, January 30, 2015 KPMG AG Wirtschaftsprüfungsgesellschaft Prof. Dr. Kai C. Andrejewski Simone Fischer WirtschaftsprüferWirtschaftsprüferin (German Public Auditor) (German Public Auditor) Henkel Annual Report 2014 177 112 Consolidated statement of financial position 114 Consolidated statement of income 115 Consolidated statement of comprehensive income 115 Consolidated statement of changes in equity 116 Consolidated statement of cash flows 117 Group segmentreport by business unit 118 Key financials by region 119 Accounting principles and methods applied in preparation of the consolidated financial statements 128 Notes to the consolidated statement of financial position 163 Notes to the consolidated statement of income 168 Other disclosures 175 Independent Auditor’s Report 177 Recommendation for the approval of the annual financial statements and the appropriation of the profit of Henkel AG & Co. KGaA Recommendation for the approval of the annual financial statements and the appropriation of the profit of Henkel AG & Co. KGaA It is proposed that the annual financial statements of Henkel AG & Co. KGaA be approved as presented and that the unappropriated profit of 713,647,739.32 euros for the fiscal year 2014 be applied as follows: a) Payment of a dividend of 1.29 euros per ordinary share (259,795,875 shares) = 335,136,678.75 euros b) Payment of a dividend of 1.31 euros per preferred share (178,162,875 shares) = 233,393,366.25 euros c) Carried forward as retained earnings = 145,117,694.32 euros 713,647,739.32 euros According to Section 71 German Stock Corporation Act [AktG], treasury shares do not qualify for a dividend. The amount in unappropriated profit which relates to the shares held by the corporation (treasury shares) at the date of the Annual General Meeting will be carried forward as retained earnings. As the number of such treasury shares can change up to the time of the Annual General Meeting, a correspondingly adapted proposal for the appropriation of profit will be submitted to it, providing for an unchanged payout of 1.29 euros per ordinary share qualifying for a dividend and 1.31 euros per preferred share qualifying for a dividend, with corresponding adjustment of the other retained earnings and retained earnings carried forward to the following year. Düsseldorf, January 30, 2015 Henkel Management AG, Personally Liable Partner of Henkel AG & Co. KGaA Management Board 178 Annual financial statements of Henkel AG & Co. KGaA (summarized) 179 Responsibility statement by the Personally Liable Partner 180 Corporate management bodies of Henkel AG & Co. KGaA 178 Henkel Annual Report 2014 Annual financial statements of Henkel AG & Co. KGaA (summarized) * 164 Statement of income in million euros 2013 2014 Sales 3,469 3,603 Cost of sales – 2,375 – 2,495 Gross profit 1,094 1,108 – 1,383 – 1,371 343 279 Selling, research and administrative expenses Other income (net of other expenses) Operating profit 54 16 Financial result 982 546 1,036 562 Profit on ordinary activities Change in special accounts with reserve element 9 8 Extraordinary result – – Income before tax Taxes on income Net income Profit brought forward Allocated to other retained earnings / transferred from other retained earnings Unappropriated profit 1 1,045 570 – 17 – 32 1,028 538 186 176 – 514 – 700 714 1 Statement of income figures are rounded; unappropriated profit 2013: 700,363,032.37 euros; unappropriated profit 2014: 713,647,739.32 euros. 165 Balance sheet in million euros 2013 2014 648 712 Financial assets 8,716 8,136 Non-current assets 9,364 8,848 Intangible assets and property, plant and equipment 236 240 2,218 2,413 Marketable securities 459 288 Liquid funds 329 134 3,242 3,075 Inventories Receivables and miscellaneous assets / Deferred charges Current assets Assets arising from the overfunding of pension obligations Total assets Equity 293 373 12,899 12,296 6,078 6,092 Special accounts with reserve element 120 112 Provisions 702 691 5,999 5,401 12,899 12,296 Liabilities, deferred income and accrued expenses Total equity and liabilities * The full financial statements of Henkel AG & Co. KGaA with the auditor’s unqualified opinion are filed with the commercial register and are also available at www.henkel.com/ir. Copies can be obtained from Henkel AG & Co. KGaA on request. 179 112 Consolidated statement of financial position 114 Consolidated statement of income 115 Consolidated statement of comprehensive income 115 Consolidated statement of changes in equity 116 Consolidated statement of cash flows 117 Group segmentreport by business unit 118 Key financials by region 119 Accounting principles and methods applied in preparation of the consolidated financial statements 128 Notes to the consolidated statement of financial position 163 Notes to the consolidated statement of income 168 Other disclosures 175 Independent Auditor’s Report 177 Recommendation for the approval of the annual financial statements and the appropriation of the profit of Henkel AG & Co. KGaA Responsibility statement by the Personally Liable Partner To the best of our knowledge, and in accordance with the applicable accounting principles, the consolidated financial statements give a true and fair view of the net assets, financial position and results of operations of the Group, and the management report of the Group includes a fair review of the development, performance and results of the business and the position of the Group, together with a cogent description of the principal opportunities and risks associated with the expected development of the Group. Düsseldorf, January 30, 2015 Henkel Management AG Management Board Kasper Rorsted, Jan-Dirk Auris, Carsten Knobel, Kathrin Menges, Bruno Piacenza, Hans Van Bylen 178 Annual financial statements of Henkel AG & Co. KGaA (summarized) 179 Responsibility statement by the Personally Liable Partner 180 Corporate management bodies of Henkel AG & Co. KGaA 180 Notes to the consolidated financial statements Henkel Annual Report 2014 Corporate management bodies of Henkel AG & Co. KGaA Boards / memberships as defined by Section 125 (1) sentence 5 of the German Stock Corporation Act [AktG] as at January 2015 Honorary Chairman of the Henkel Group: Dipl.-Ing. Albrecht Woeste Supervisory Board of Henkel AG & Co. KGaA Dr. rer. nat. Simone Bagel-Trah Boris Canessa Birgit Helten-Kindlein * Chair, Private Investor, Düsseldorf Private Investor, Düsseldorf Member of the Works Council of Henkel AG & Co. KGaA, Düsseldorf site Born in 1969 Member since: April 14, 2008 Born in 1963 Member since: April 16, 2012 Memberships: Henkel Management AG (Chair) 1 Henkel AG & Co. KGaA (Shareholders’ Committee, Chair) 2 Bayer AG 1 Heraeus Holding GmbH 1 Ferdinand Groos Winfried Zander * Béatrice Guillaume-Grabisch Managing Partner, Cryder Capital Partners LLP, London Born in 1965 Member since: April 16, 2012 Vice Chair, Chairman of the General Works Council of Henkel AG & Co. KGaA and Chairman of the Works Council of Henkel AG & Co. KGaA, Düsseldorf site Vice President Zone Europe Nestlé S.A., Vevey Born in 1954 Member since: May 17, 1993 Member of the Executive Board of IG Bergbau, Chemie, Energie and responsible for Wages / Finance, Hannover Jutta Bernicke * Member of the Works Council of Henkel AG & Co. KGaA, Düsseldorf site Born in 1962 Member since: April 14, 2008 Dr. rer. nat. Kaspar von Braun Born in 1964 Member since: April 16, 2012 Peter Hausmann * Born in 1964 Member since: April 14, 2008 Prof. Dr. sc. nat. Michael Kaschke Chairman of the Executive Board, Carl Zeiss AG, Oberkochen Born in 1957 Member since: April 14, 2008 Memberships: Carl Zeiss Group: Carl Zeiss SMT GmbH (Chair) 1 Carl Zeiss Meditec AG (Chair) 1 CZ Microscopy GmbH (Chair) 2 Carl Zeiss Australia Pty. Ltd. (Chair), Australia 2 Carl Zeiss Far East Co. Ltd. (Chair), China / Hong Kong 2 Carl Zeiss Pte. Ltd. (Chair), Singapore 2 Carl Zeiss India (Bangalore) Private Ltd., India 2 Born in 1954 Member since: April 15, 2013 Barbara Kux Memberships: Bayer AG 1 Continental AG 1 Vivawest Wohnen GmbH 1 50 Hertz Transmission AG (Vice Chair) 1 Born in 1954 Member since: July 3, 2013 Astrophysicist, Munich Born in 1971 Member since: April 19, 2010 *Employee representatives. 1 Membership in statutory supervisory and administrative boards in Germany. 2 Membership of comparable oversight bodies. Private Investor, Munich Memberships: Firmenich S.A., Switzerland 2 Pargesa Holding S.A., Switzerland 2 Total S.A., France 2 Umicore N.V., Brussels, Belgium 2 181 Notes to the consolidated financial statements 112 Consolidated statement of financial position 114 Consolidated statement of income 115 Consolidated statement of comprehensive income 115 Consolidated statement of changes in equity 116 Consolidated statement of cash flows 117 Group segmentreport by business unit 118 Key financials by region 119 Accounting principles and methods applied in preparation of the consolidated financial statements 128 Notes to the consolidated statement of financial position 163 Notes to the consolidated statement of income 168 Other disclosures 175 Independent Auditor’s Report 177 Recommendation for the approval of the annual financial statements and the appropriation of the profit of Henkel AG & Co. KGaA 178 Annual financial statements of Henkel AG & Co. KGaA (summarized) 179 Responsibility statement by the Personally Liable Partner 180 Corporate management bodies of Henkel AG & Co. KGaA Mayc Nienhaus * Dr. rer. nat. Martina Seiler * Edgar Topsch * Member of the General Works Council of Henkel AG & Co. KGaA and Chairman of the Works Council of Henkel AG & Co. KGaA, Unna site Chemist, Duisburg Chairwoman of the General Senior Staff Representative Committee and of the Senior Staff Representative Committee of Henkel AG & Co. KGaA Member of the General Works Council of Henkel AG & Co. KGaA and Vice Chairman of the Works Council of Henkel AG & Co. KGaA, Düsseldorf site Born in 1961 Member since: January 1, 2010 Born in 1971 Member since: January 1, 2012 Born in 1960 Member since: August 1, 2010 Andrea Pichottka * Prof. Dr. oec. publ. Theo Siegert Managing Director, IG BCE Bonusagentur GmbH, Hannover Managing Partner of de Haen-Carstanjen & Söhne, Düsseldorf Born in 1959 Member since: October 26, 2004 Born in 1947 Member since: April 20, 2009 Memberships: E.ON AG 1 Merck KGaA 1 DKSH Holding Ltd., Switzerland 2 E. Merck OHG 2 Supervisory Board committees Nominations Committee Audit Committee Functions The Nominations Committee prepares the resolutions of the Supervisory Board on election proposals to be presented to the Annual General Meeting for the election of members of the Supervisory Board (representatives of the share holders). Functions The Audit Committee prepares the proceedings and resolutions of the Supervisory Board relating to the approval of the annual financial statements and the consolidated financial statements, and relating to ratification of the proposal to be put before the Annual General Meeting regarding appointment of the auditor. It also deals with accounting, risk management and compliance issues. Members Dr. Simone Bagel-Trah, Chair Dr. Kaspar von Braun Prof. Dr. Theo Siegert Members Prof. Dr. Theo Siegert, Chair Prof. Dr. Michael Kaschke, Vice Chair Dr. Simone Bagel-Trah Peter Hausmann Birgit Helten-Kindlein Winfried Zander 182 Notes to the consolidated financial statements Henkel Annual Report 2014 Shareholders’ Committee of Henkel AG & Co. KGaA Dr. rer. nat. Simone Bagel-Trah Stefan Hamelmann Konstantin von Unger Chair, Private Investor, Düsseldorf Private Investor, Düsseldorf Founding Partner, Blue Corporate Finance AG, London Born in 1969 Member since: April 18, 2005 Born in 1963 Member since: May 3, 1999 Born in 1966 Member since: April 14, 2003 Memberships: Henkel AG & Co. KGaA (Chair) 1 Henkel Management AG (Chair) 1 Bayer AG 1 Heraeus Holding GmbH 1 Prof. Dr. rer. pol. Ulrich Lehner Dr. rer. pol. h.c. Christoph Henkel Born in 1958 Member since: May 27, 1991 Memberships: Deutsche Telekom AG (Chair) 1 E.ON SE 1 Porsche Automobil Holding SE 1 ThyssenKrupp AG (Chair) 1 Novartis AG, Switzerland 2 Prof. Dr. oec. HSG Paul Achleitner Dr.-Ing. Dr.-Ing. E.h. Norbert Reithofer Chairman of the Supervisory Board, Deutsche Bank AG, Munich Chairman of the Management Board of Bayerische Motoren Werke AG, Munich Born in 1956 Member since: April 30, 2001 Born in 1956 Member since: April 11, 2011 Memberships: Bayer AG 1 Daimler AG 1 Deutsche Bank AG (Chair) 1 Membership: Siemens AG 1 Vice Chair, Founding Partner, Canyon Equity LLC, London Johann-Christoph Frey Private Investor, Klosters Born in 1955 Member since: April 16, 2012 Former Chairman of the Management Board of Henkel KGaA, Düsseldorf Born in 1946 Member since: April 14, 2008 Memberships: Henkel Management AG 1 Ten Lifestyle Management Ltd., Great Britain 2 Werner Wenning Chairman of the Supervisory Board of Bayer AG, Leverkusen Born in 1946 Member since: April 14, 2008 Memberships: Bayer AG (Chair) 1 E.ON AG (Chair) 1 Henkel Management AG 1 Siemens AG 1 Freudenberg & Co. KG 2 Jean-François van Boxmeer Chairman of the Executive Board of Heineken N.V., Amsterdam Born in 1961 Member since: April 15, 2013 Membership: Mondelez International Inc., USA 2 Subcommittees of the Shareholders’ Committee Finance Subcommittee Human Resources Subcommittee Functions The Finance Subcommittee deals principally with financial matters, accounting issues including the statutory year-end audit, taxation and accounting policy, internal auditing, and risk management in the company. Functions The Human Resources Subcommittee deals principally with personnel matters relating to members of the Management Board, issues pertaining to human resources strategy, and with remuneration. Members Dr. Christoph Henkel, Chair Stefan Hamelmann, Vice Chair Prof. Dr. Paul Achleitner Prof. Dr. Ulrich Lehner Dr. Norbert Reithofer Members Dr. Simone Bagel-Trah, Chair Konstantin von Unger, Vice Chair Johann-Christoph Frey Jean-François van Boxmeer Werner Wenning 1Membership in statutory supervisory and administrative boards in Germany. 2Membership of comparable oversight bodies. 183 Notes to the consolidated financial statements 112 Consolidated statement of financial position 114 Consolidated statement of income 115 Consolidated statement of comprehensive income 115 Consolidated statement of changes in equity 116 Consolidated statement of cash flows 117 Group segmentreport by business unit 118 Key financials by region 119 Accounting principles and methods applied in preparation of the consolidated financial statements 128 Notes to the consolidated statement of financial position 163 Notes to the consolidated statement of income 168 Other disclosures 175 Independent Auditor’s Report 177 Recommendation for the approval of the annual financial statements and the appropriation of the profit of Henkel AG & Co. KGaA 178 Annual financial statements of Henkel AG & Co. KGaA (summarized) 179 Responsibility statement by the Personally Liable Partner 180 Corporate management bodies of Henkel AG & Co. KGaA Management Board of Henkel Management AG * Kasper Rorsted Carsten Knobel Bruno Piacenza Chairman of the Management Board Finance / Purchasing / Integrated Business Solutions Laundry & Home Care Born in 1962 Member since: April 1, 2005 3 Born in 1969 Member since: July 1, 2012 Born in 1965 Member since: January 1, 2011 Memberships: Bertelsmann SE & Co. KGaA 1 Danfoss A/S, Denmark 2 Memberships: Henkel (China) Investment Co. Ltd., China 2 Henkel & Cie AG, Switzerland 2 Henkel Central Eastern Europe GmbH (Chair), Austria 2 Henkel Consumer Goods Inc. (Chair), USA 2 Henkel Ltd., Great Britain 2 Henkel of America Inc. (Chair), USA 2 Jan-Dirk Auris Adhesive Technologies Born in 1968 Member since: January 1, 2011 Membership: Henkel Corporation (Chair), USA 2 Hans Van Bylen Beauty Care Born in 1961 Member since: July 1, 2005 3 Memberships: GfK SE, Nuremberg 1 The Dial Corporation (Chair), USA 2 Kathrin Menges Human Resources / Infrastructure Services Born in 1964 Member since: October 1, 2011 Memberships: Adidas AG 1 Henkel Central Eastern Europe GmbH, Austria 2 Henkel Nederland BV, Netherlands 2 Henkel Norden AB, Sweden 2 Henkel Norden Oy, Finland 2 Henkel of America Inc., USA 2 Supervisory Board of Henkel Management AG * Dr. rer. nat. Simone Bagel-Trah Konstantin von Unger Werner Wenning Chair, Private Investor, Düsseldorf Vice Chair Founding Partner, Blue Corporate Finance AG, London Chairman of the Supervisory Board of Bayer AG, Leverkusen Born in 1969 Member since: February 15, 2008 Memberships: Henkel AG & Co. KGaA (Chair) 1 Henkel AG & Co. KGaA (Shareholders’ Committee, Chair) 2 Bayer AG 1 Heraeus Holding GmbH 1 Born in 1966 Member since: April 17, 2012 Memberships: Henkel AG & Co. KGaA (Shareholders’ Committee) 2 Ten Lifestyle Management Ltd., Great Britain 2 *Personally Liable Partner of Henkel AG & Co. KGaA. 1 Membership in statutory supervisory and administrative boards in Germany. 2 Membership of comparable oversight bodies. 3 Including membership of the Management Board of Henkel KGaA. Born in 1946 Member since: September 16, 2013 Memberships: Bayer AG (Chair) 1 E.ON AG (Chair) 1 Siemens AG 1 Freudenberg & Co. KG 2 Henkel AG & Co. KGaA (Shareholders’ Committee) 2 184 Further information Henkel Annual Report 2014 Quarterly breakdown of key financials 166 1st quarter 2013 in million euros 2nd quarter 2014 2013 3rd quarter 2014 2013 4th quarter 2014 2013 Full year 2014 2013 2014 Sales 1,177 1,147 1,186 1,139 1,167 1,188 1,050 1,152 4,580 4,626 873 856 923 897 886 918 828 876 3,510 3,547 1,944 1,893 2,138 2,069 2,095 2,100 1,940 2,065 8,117 8,127 39 34 38 32 36 30 35 32 148 128 4,033 3,929 4,286 4,137 4,184 4,236 3,852 4,126 16,355 16,428 Cost of sales – 2,076 – 2,016 – 2,219 – 2,210 – 2,175 – 2,245 – 2,076 – 2,241 – 8,546 – 8,712 Gross profit 1,957 1,913 2,067 1,927 2,009 1,991 1,776 1,885 7,809 7,716 – 1,089 – 1,033 – 1,130 – 1,025 – 1,059 – 1,045 – 964 – 1,048 – 4,242 – 4,151 Laundry & Home Care Beauty Care Adhesive Technologies Corporate Henkel Group Marketing, selling and distribution expenses Research and development expenses – 106 – 104 – 105 – 103 – 101 – 104 – 103 – 102 – 415 – 413 Administrative expenses – 220 – 202 – 208 – 216 – 202 – 210 – 212 – 224 – 842 – 852 23 34 – 17 6 2 – 29 – 33 – 67 – 25 – 56 Other operating charges and income EBIT Laundry & Home Care 175 196 167 160 185 171 155 88 682 615 Beauty Care 124 114 135 135 122 98 93 74 474 421 1,345 Adhesive Technologies 314 331 333 346 365 354 259 314 1,271 Corporate – 47 – 32 – 28 – 52 – 24 – 20 – 42 – 33 – 141 – 137 Henkel Group 565 608 607 589 649 603 464 444 2,285 2,244 Investment result 6 – Other financial result – 11 – 12 – – – 10 – 13 – – – 10 – 22 Interest result – 18 – 10 – 17 2 – 13 – 1 – 10 Financial result – 30 – 15 – 27 – 11 – 25 – 11 – 31 Income before tax – – – 12 – 21 – 6 – – 46 – 55 – 58 – 9 – 12 – 113 – 49 2,195 535 593 580 578 624 592 433 432 2,172 – 132 – 137 – 148 – 132 – 155 – 142 – 112 – 122 – 547 – 533 403 456 432 446 469 450 321 310 1,625 1,662 – Attributable to non-controlling interests – 10 – 7 – 14 – 5 – 11 – 10 – 1 – 12 – 36 – 34 – Attributable to shareholders of Henkel AG & Co. KGaA 393 449 418 441 458 440 320 298 1,589 1,628 Taxes on income Net income Earnings per preferred share in euros 0.91 1.04 0.96 2014 2013 1st quarter 2013 in million euros EBIT (as reported) 565 One-time gains Restructuring charges Adjusted EBIT Adjusted earnings per preferred share in euros 1.06 2014 2013 2nd quarter 1.01 0.74 2014 2013 3rd quarter 608 607 589 649 0.69 3.67 2014 2013 4th quarter 603 464 Full year 444 2,244 – 10 – 3 – 10 – 28 8 36 17 4 43 37 91 82 159 30 28 27 71 19 47 83 67 159 213 600 619 660 674 672 693 584 602 2,516 2,588 0.96 1.04 1.07 1.16 1.10 – 1.17 The quarterly figures are specific to the quarter to which they refer and have been rounded for commercial convenience. Calculated on the basis of units of 1,000 euros. 0.94 – 2014 2,285 – 25 – – 3.76 5 – One-time charges 1.02 1.01 4.07 4.38 Further information 184 Quarterly breakdown of key financials 185 Multi-year summary 186 Index of tables and graphs 185 188 Glossary 191 Credits 192 Contacts Multi-year summary 167 2008 2009 2010 in million euros 2011 restated 1 2012 2013 2014 Results of operations Sales 16,428 14,131 13,573 15,092 15,605 16,510 16,355 Laundry & Home Care 4,172 4,129 4,319 4,304 4,556 4,580 4,626 Beauty Care 3,016 3,010 3,269 3,399 3,542 3,510 3,547 Adhesive Technologies 6,700 6,224 7,306 7,746 8,256 8,117 8,127 243 210 199 156 155 148 128 Corporate Gross margin 42.0 Research and development expenses Operating profit (EBIT) 45.4 46.5 45.3 46.8 47.7 47.0 429 396 391 410 408 415 413 2,244 779 1,080 1,723 1,765 2,199 2,285 Laundry & Home Care 439 501 542 419 621 682 615 Beauty Care 376 387 411 471 483 474 421 1,345 Adhesive Technologies Corporate Income before tax Tax rate in % Net income Net income attributable to shareholders of Henkel AG & Co. KGaA Net return on sales 2 in % Interest coverage ratio 658 290 878 1,002 1,191 1,271 – 694 – 98 – 108 – 127 – 97 – 141 – 137 1,627 885 1,552 1,610 2,018 2,172 2,195 24.2 29.0 26.4 26.0 24.4 25.2 24.3 1,233 628 1,143 1,191 1,526 1,625 1,662 1,221 602 1,118 1,161 1,480 1,589 1,628 8.7 4.7 7.6 7.6 9.2 9.9 10.1 4.8 8.7 12.8 14.0 14.3 23.9 48.4 Net assets Total assets 16,173 15,818 17,525 18,487 19,525 19,344 20,961 Non-current assets 11,360 11,162 11,590 11,848 11,927 11,360 14,150 Current assets 4,813 4,656 5,935 6,639 7,598 7,984 6,811 Equity 6,535 6,544 7,950 8,670 9,511 10,158 11,644 9,539 9,274 9,575 9,817 10,014 9,186 9,317 Liabilities Equity ratio in % 40.3 41.4 45.4 46.9 48.7 Return on equity 3 in % 21.6 9.6 17.5 15.0 17.6 Operating debt coverage ratio in % 45.1 41.8 71.4 91.6 >500 52.5 17.1 not relevant 4 55.6 16.4 274.8 Financial position Cash flow from operating activities 1,165 1,919 1,851 1,562 2,634 2,116 1,914 Capital expenditures 4,074 415 260 443 516 465 2,214 Investment ratio as % of sales 28.8 3.0 1.7 2.8 3.1 2.8 13.5 Shares Dividend per ordinary share in euros 0.51 0.51 0.70 0.78 0.93 1.20 1.29 5 Dividend per preferred share in euros 0.53 0.53 0.72 0.80 0.95 1.22 1.31 5 Total dividends 227 Payout ratio in % Share price, ordinary shares, at year end Share price, preferred shares, at year end Market capitalization at year end 227 310 345 411 529 569 5 24.0 27.6 25.5 25.5 25.6 30.0 30.0 5 in euros 18.75 31.15 38.62 37.40 51.93 75.64 80.44 in euros 22.59 36.43 46.54 44.59 62.20 84.31 89.42 8.9 14.6 18.3 17.6 24.6 34.7 36.8 in bn euros Employees Total 6 Germany Abroad (at December 31) 49,750 55,150 49,250 47,850 47,250 46,600 46,850 9,750 8,800 8,600 8,300 8,000 8,050 8,200 45,400 40,450 39,250 38,950 38,600 38,600 41,550 1A pplication of IAS 8 “Accounting policies, changes in accounting estimates and errors” (see notes on pages 116 and 117 of the 2012 Annual Report). 2N et income divided by sales. 3 Net income divided by equity at the start of the year. 4 F igure not relevant due to the positive balance of net financial position and pension obligations. 5 Proposed. 6 Basis: permanent employees excluding apprentices. 186 Further information Henkel Annual Report 2014 Index of tables and graphs The Company Operational activities 28 Highlights 2014 (inside cover) Henkel around the world: regional centers Research and development 55 61 R&D expenditures 81 62 R&D expenditures by business unit 81 63 Selected research and development sites 82 64 Key R&D figures 82 65 Fritz Henkel Award for Innovation 2014 85 1 Key financials 2 Sales by business unit 29 Financial targets 2016 56 3 Sales by region 30 Acquisitions completed in fiscal 2014 57 4 Key financials Laundry & Home Care 5 Sales Laundry & Home Care 6 Key financials Beauty Care 66 Sales Beauty Care Key financials 88 7 32 Weighted average cost of capital (WACC)62 Sales development 88 8 Key financials Adhesive Technologies 67 33 WACC before tax by business unit Sales Adhesive Technologies 68 9 Sales 90 Strategy and financial targets 2016 31 34 10 Remuneration structure 38 11 Caps on remuneration 40 12 Remuneration of Management Board members who served in 2014 42 13 Structure of Management Board remuneration42 14 Pension benefits 16 17 18 19 43 43 Pursuant to DCGK, payments / benefits granted for the reporting year to members of the Management Board serving in 201444 Pursuant to DCGK, payments / benefits allocated in or for the reporting year to members of the Management Board serving in 2014 45 Average rates of exchange versus the euro Beauty Care 63 Results of operations 92 Sales development 92 71 Sales 94 Adhesive Technologies 35 Sales 65 36 Sales development 65 72 Key financials 96 37 Price and volume effects 65 73 Sales development 96 38 Adjusted operating profit (EBIT) 66 74 Sales 98 39 Key financials by region 66 40 Guidance versus performance 2014 67 41 Reconciliation from sales to adjusted operating profit 68 42 Net income 68 43 Adjusted earnings per preferred share 69 44 Preferred share dividends 69 Risk management system 75 Major risk categories 102 76 Classification of risks in ascending order102 Consolidated financial statements 77 Consolidated statement of financial position 112 Net assets and financial position 78 Consolidated statement of income 114 48 46 Capital expenditures by business unit 71 79 Additional voluntary information 114 Shareholders’ Committee remuneration49 47 Capital expenditures 2014 71 80 48 Net financial position 2010 to 2014 71 Consolidated statement of comprehensive income 115 81 Consolidated statement of changes in equity 115 82 Consolidated statement of cash flows 116 83 Additional voluntary information Reconciliation to free cash flow Supervisory Board remuneration 21 Henkel share performance versus market January through December 2014 51 Henkel share performance versus market 2005 through 2014 50 51 Henkel represented in all major indices 49 Net financial position 72 50 Credit ratings 73 51 Key financial ratios 73 Employees Employees by region 74 53 Employees by business unit 74 85 Key financials by region 118 54 86 Scope of consolidation 119 Employees by activity 75 52 55 Employees by age group 75 24 ADR data 52 56 Employees 75 Shareholder structure: institutional investors holding Henkel shares Henkel bonds Bond data 53 Pro-active capital market communication Analyst recommendations Acquisitions and divestments 87 Reconciliation of the purchase price to provisional difference 121 88 Acquisitions 121 Procurement 53 54 Group segment report by business unit117 52 Share data International shareholder structure 116 84 23 27 Key financials 70 70 Key data on Henkel shares 2010 to 2014 26 69 Financial structure 20 25 Laundry & Home Care 45 Shares and bonds 22 62 Macroeconomic and industry-related conditions Remuneration report Service cost / Present value of pension benefits 60 Cost of capital Group management report 15 Our focal areas and targets for the five-year period from 2011 to 2015 57 Material expenditures by business unit 78 58 Material expenditures by type 78 Currency translation 89 Production 59 Number of production sites 79 60 Sustainability targets for 2015 and current status 81 Currencies 123 Recognition and measurement methods 90 Summary of selected measurement methods124 Further information 184 Quarterly breakdown of key financials 185 Multi-year summary 186 Index of tables and graphs 187 188 Glossary 191 Credits 192 Contacts New international accounting regulations according to International Financial Reporting Standards (IFRS) 91 92 93 value of reimbursement rights at December 31, 2014 126 Accounting regulations not applied in advance of their effective date 127 127 Useful life 128 Intangible assets 95 Cost 128 96 Accumulated amortization/ impairment129 97 Net book values 129 98 Book values – Goodwill 130 99 Book values – Trademarks and other rights 130 Property, plant and equipment 100 Cost 131 101 Accumulated 102 liability from pension obligations at December 31, 2014 141 119 Analysis of plan assets 143 120 Plan assets by country 2014 143 121 Classification of bonds by rating 2014 143 Risks associated with pension obligations 122 Future Non-current assets 94 141 118 Net Accounting methods applied for the first time in the year under review Accounting regulations not yet adopted into EU law Financial result 117 Fair 105 106 108 109 Assets and liabilities held for sale135 Issued capital135 165 166 of sundry provisions by function 146 125 Analysis 110 Actuarial assumptions 148 127 Bonds 148 128 Other financial liabilities149 129 Other liabilities149 instruments report 150 amounts and fair values of financial instruments (12/31/2013) 152 amounts and fair values of financial instruments (12/31/2014) 153 value of pension obligations at December 31, 2013 154 134 Derivative financial instruments 155 135 Interest rates in percent p.a. 155 and losses from fair value hedges 136 Gains 139 113 Fair liability from pension obligations at December 31, 2013 139 114 Net value of pension obligations at December 31, 2014 156 of employees per function 168 Group segment report 159 Reconciliation between net operating assets / capital employed and financial statement figures 170 160 Earnings per share171 161 Contingent liabilities172 Other unrecognized financial commitments 162 Operating lease commitments 172 163 Type of fee 174 nnual financial statements of A Henkel AG & Co. KGaA (summarized) 164 Statement of income 178 165 Balance sheet 178 Further information 166 Quarterly breakdown of key financials 184 Maximum risk position 157 167 Multi-year summary 158 assets and financial liabilities from derivatives subject to netting, collateral, or similar arrangements158 142 Cash flows from financial liabilities at December 31, 2013 159 143 Cash flows from financial liabilities at December 31, 2014 159 Interest rate exposure 161 145 Interest rate risk 162 140 146 Other operating income164 141 147 Other operating charges164 115 Present value of plan assets at December 31, 2014 158 Number 168 157 144 140 Payroll cost of a net investment in a foreign entity (after tax) 141 Financial 139 112 Fair value of reimbursement rights at December 31, 2013 156 138 Hedges 111 Present value of plan assets at December 31, 2013 flow hedges (after tax) 157 Auditor’s fees and services results of the measurement categories and reconciliation to financial result analysis of non-impaired overdue loans and receivables 138 167 Payroll cost and employee structure 126 Borrowings 139 dates of unused tax losses and tax credits 146 Borrowings 137 Cash tax expense by items on the statement of financial position 165 156 Expiry 140 Age Pension obligations 165 Allocation of deferred taxes 134 of valuation allowances on trade accounts receivable 134 components of tax expense and income 165 Tax reconciliation statement Development in 2014 133 Net 107 Development before tax on income and analysis of taxes 155 Other assets133 134 151 Income 124 Other financial assets133 Trade accounts receivable Taxes on income 154 130 Financial Trade accounts receivable 164 Income tax provisions and other provisions Financial instruments report Analysis of inventories Other financial result 153 Deferred – Present value of pension obligations at December 31, 2014 145 Net book values Inventories 164 150 123 Sensitivities 132 Carrying 104 164 Interest result 152 Main 131 Carrying 103 Financial result 149 payments for pension benefits 145 depreciation/ impairment132 132 148 116 Fair 185 188 Further information Henkel Annual Report 2014 Glossary Adjusted EBIT Earnings Before Interest and Taxes (EBIT) adjusted for exceptional items in the form of one-time charges, onetime gains and restructuring charges. Beta factor Reflects the systemic risk (market risk) of a share price compared to a certain index (stock market average): in the case of a beta factor of 1.0, the share price fluctuates to the same extent as the index. If the factor is less than 1.0, this indicates that the share price undergoes less fluctuation, while a factor above 1.0 indicates that the share price fluctuates more than the market average. Capital employed Capital invested in company assets and operations. Equity + interest-bearing liabilities. Cash flows Inflow and outflow of cash and cash equivalents divided within the statement of cash flows into cash flow from ordinary activities, from investing a ctivities, and from financing activities. Commercial paper Short-term bearer bonds with a promise to pay, issued for the purpose of generating short-term debt capital. Compliance Acting in conformity with applicable regulations; adherence to laws, rules, regulations and in-house or corporate codes of conduct. Compound annual growth rate Year-over-year rate of growth, e.g. of an investment. Corporate governance System of management and control, primarily within listed companies. Describes the powers and authority of corporate management, the extent to which these need to be monitored and the extent to which structures should be put in place through which certain interest / stakeholder groups may exert influence on the corporate management. Corporate Governance Code The German Corporate Governance Code (abbreviation: DCGK) is intended to render the rules governing corporate management and control for a stock corporation in Germany transparent for national and international investors, engendering trust and confidence in the corporate management of German companies. Credit default swap Instrument used by Henkel to evaluate the credit risks of banks. Credit facility Aggregate of all loan services available on call from one or several banks as cover for an immediate credit requirement. DAX ® Abbreviation for Deutscher Aktienindex, the German share index. The DAX lists the stocks and shares of Germany’s 30 largest listed corporations. Henkel’s preferred shares are quoted on the DAX. DAX is a registered trademark of Deutsche Börse AG, the German stock exchange company. Declaration of conformity Declaration made by the management / executive board and supervisory board of a company according to Section 161 of the German Stock Corporation Act [AktG], confirming implementation of the recommendations of the Governmental Commission for the German Corporate Governance Code. Deferred taxes In accordance with International Accounting Standard (IAS) 12, deferred taxes are recognized with respect to temporary differences between the statement of financial position valuation of an asset or a liability and its tax base, unused tax losses and tax credits. Defined contribution plans Post-employment benefit plans under which an entity pays fixed contributions into a separate entity (a fund) and will have no legal or constructive obligation to pay further contributions if the fund does not hold sufficient assets to pay all employee benefits relating to employee service in current and prior periods. Derivative Financial instrument, the value of which changes in res ponse to changes in an underlying asset or an index, which will be settled at a future date and which initially requires only a small or no investment. Divestment Disposal, sale or divestiture of an asset, operation or business unit. Earnings per share (EPS) Metric indicating the income of a joint stock corporation divided between the weighted average number of its shares outstanding. The calculation is performed in accordance with International Accounting Standard (IAS) 33. Further information 184 Quarterly breakdown of key financials 185 Multi-year summary 186 Index of tables and graphs 189 188 Glossary 191 Credits 192 Contacts EBIT Abbreviation for Earnings Before Interest and Taxes. Standard profit metric that enables the earning power of the operating business activities of a company to be assessed independently of its financial structure, enab ling comparability between entities where these are financed by varying levels of debt capital. EBITDA Abbreviation for Earnings Before Interest, Taxes, Depreciation and Amortization. Economic Value Added (EVA®) The EVA concept reflects the net wealth generated by a company over a certain period. A company achieves positive EVA when the operating result exceeds the weighted average cost of capital. The WACC corresponds to the yield on capital employed expected by the capital market. EVA is a registered trademark of Stern Stewart & Co. Equity ratio Financial metric indicating the ratio of equity to total capital. It expresses the share of total assets financed out of equity (owners’ capital) rather than debt capital (provided by lenders). Serves to assess the financial stability and independence of a company. Fair value Amount at which an asset or a liability might be exchanged or a debt paid in an arm’s length transaction between knowledgeable, willing parties. Free cash flow Cash flow actually available for acquisitions, dividend payments, the reduction of borrowings, and contributions to pension funds. Goodwill Amount by which the total consideration for a company or a business exceeds the netted sum of the fair values of the individual, identifiable assets and liabilities. Gross margin Indicates the percentage by which a company’s sales exceed cost of sales, i.e. the ratio of gross profit to sales. Gross profit Difference between sales and cost of sales. Hedge accounting Method for accounting for hedging transactions whereby the compensatory effect of changes in the fair value of the hedging instrument (derivative) and of the underlying asset or liability is recognized in either the statement of income or the statement of comprehensive income. Hybrid bond Equity-like corporate bond, usually with no specified date of maturity, or with a very long maturity, char acterized by its subordination in the event of the issuer becoming insolvent. IAS / IFRS Abbreviation for International Accounting Standards and International Financial Reporting Standards, respectively. In Europe, capital market-oriented companies are generally required to prepare consolidated financial statements in accordance with the International Financial Reporting Standards adopted by the European Union. Standards issued before 2003 are known as IAS, those since that date are IFRS. Impairment Impairments of assets are recorded when the recover able amount is lower than the carrying amount at which the asset is recognized in the statement of financial position. The recoverable amount is calculated as the higher of fair value less costs to sell (net realizable value) and value in use. IT risk The international standard ISO / IEC 27001 “Information technology, Security techniques, Information security management systems, Requirements” specifies the requirements for establishing, implementing, operating, monitoring, reviewing, maintaining and improving a documented Information Security Management System within the context of an organization’s overall IT risks. ISO / IEC 27002 additionally provides recommendations for designing the control mechanisms needed for information security. KGaA Abbreviation for “Kommanditgesellschaft auf Aktien.” A KGaA is a company with a legal identity (legal entity) in which at least one partner has unlimited liability with respect to the company’s creditors (personally liable partner), while the liability for such debts of the other partners participating in the share-based capital stock is limited to their share capital (limited shareholders). Long-term incentive (LTI) Bonus aligned to long-term financial performance. Market capitalization Market value of a company calculated from the number of shares issued, multiplied by their list price as quoted on the stock exchange. Net debt Borrowings less cash and cash equivalents and readily monetizable financial instruments classified as “availa ble for sale” or in the “fair value option,” less positive and plus negative fair values of hedging transactions. Net working capital Inventories plus payments on account, receivables from suppliers and trade accounts receivable, less trade accounts payable, liabilities to customers, and current sales provisions. 190 Further information Henkel Annual Report 2014 Non-controlling interests Proportion of equity attributable to third parties in subsidiaries included within the scope of consolidation. Previously termed “minority interests.” Valued on a proportional net asset basis. A pro-rata portion of the net earnings of a corporation is due to shareholders owning non-controlling interests. Operational excellence A comprehensive program to structure and optimize all Henkel’s business processes based on customer needs, quality and efficiency. Organic sales growth Growth in revenues after adjusting for effects arising from acquisitions, divestments and foreign exchange differences – i.e. “top line” growth generated from within. Scope of consolidation The scope of consolidation is the aggregate of companies incorporated in the consolidated financial statements. Supply chain Encompasses purchasing, production, storage, transport, customer services, requirements planning, production scheduling, and supply chain management. Swap Term given to the exchange of capital amounts in differing currencies (currency swap) or of different interest obligations (interest swap) between two entities. Value-at-risk Method, based on fair value, used to calculate the maximum likely or potential future loss arising from a portfolio. Payout ratio Indicates what percentage of annual net income (ad justed for exceptional items) is paid out in dividends to shareholders, including non-controlling interests. Volatility Measure of fluctuation and variability in the prices quoted for securities, in interest rates and in foreign exchange rates. Plan assets Pension fund investment vehicles per definition under IAS 19 “Employee Benefits.” Weighted average cost of capital (WACC) Average return on capital, calculated on the basis of a weighted average of the cost of debt and equity. WACC represents the minimum return expected of a company by its lenders for financing its assets. Rating Assessment of the creditworthiness of a company as published by rating agencies. Return-enhancing portfolio Contains investments in equities and alternative investments, and serves to improve the overall return of the pension plan assets over the long term in order to raise the coverage ratio of pension funds. In addition, a broader investment horizon increases the level of investment diversification. Return on capital employed (ROCE) Profitability metric reflecting the ratio of earnings before interest and taxes (EBIT) to capital employed. Return on sales (EBIT) Operating business metric derived from the ratio of EBIT to revenues. Also known as EBIT margin. Further information 184 Quarterly breakdown of key financials 185 Multi-year summary 186 Index of tables and graphs 191 188 Glossary 191 Credits 192 Contacts Credits Published by: Henkel AG & Co. KGaA 40191 Düsseldorf, Germany Phone: +49 (0) 211-797-0 © 2015 Henkel AG & Co. KGaA Edited by: Corporate Communications, Investor Relations, Corporate Accounting and Subsidiary Controlling Coordination: Renata Casaro, Dr. Hannes Schollenberger, Wolfgang Zengerling English translation: RR Donnelley, London Design and typesetting: mpm Corporate Communication Solutions, Mainz Photographs: Guido Daniele, Steffen Hauser, Claudia Kempf, Nils Hendrik Müller, Rüdiger Nehmzow; Henkel Pre-print proofing: Paul Knighton, Cambridge; Thomas Krause, Krefeld Printed by: Druckpartner, Essen Date of publication of this Report: March 4, 2015 PR no.: 03 15 5,500 ISSN: 0964-5963 ISBN: 978-3-941517-59-2 The Annual Report is printed on Galaxi Keramik FSC. The paper is made from pulp bleached without chlorine. It has been certified and verified in accordance with the rules of the Forest Stewardship Council (FSC). The printing inks contain no heavy metals. This publication was cover-finished and bound with these Henkel products: Cellophaning with Aquence GA 6085 HGL laminating adhesive, bound using Technomelt PUR 3400 ME COOL and Technomelt GA 3960 Ultra for the highest occupational health and safety standards. Except as otherwise noted, all marks used in this publication are trademarks and/or registered trademarks of the Henkel Group in Germany and elsewhere. This document contains forward-looking statements which are based on the current estimates and assumptions made by the executive management of Henkel AG & Co. KGaA. Forward-looking statements are characterized by the use of words such as expect, intend, plan, predict, assume, believe, estimate, anticipate and similar formulations. Such statements are not to be understood as in any way guaranteeing that those expectations will turn out to be accurate. Future performance and the results actually achieved by Henkel AG & Co. KGaA and its affiliated companies depend on a number of risks and uncertainties and may therefore differ materially from forward-looking statements. Many of these factors are outside Henkel’s control and cannot be accurately estimated in advance, such as the future economic environment and the actions of competitors and others involved in the marketplace. Henkel neither plans nor undertakes to update forward-looking statements. 192 Further information Contacts Corporate Communications Phone: +49 (0) 211-797-3533 Fax: +49 (0) 211-798-2484 E-mail: [email protected] Investor Relations Phone: +49 (0) 211-797-3937 Fax: +49 (0) 211-798-2863 E-mail: [email protected] Henkel Annual Report 2014 Financial calendar Annual General Meeting Henkel AG & Co. KGaA 2015: Monday, April 13, 2015 Publication of Report for the First Quarter 2015: Thursday, May 7, 2015 Publication of Report for the Second Quarter / Half Year 2015: Wednesday, August 12, 2015 Publication of Report for the Third Quarter / Nine Months 2015: Wednesday, November 11, 2015 Publication of Report for Fiscal 2015: Thursday, February 25, 2016 Annual General Meeting Henkel AG & Co. KGaA 2016: Monday, April 11, 2016 Up-to-date facts and figures on Henkel also available on the internet: www.henkel.com Henkel www.henkel.com/annualreport Henkel www.henkel.com/sustainabilityreport Henkel app available for iOS and Android: Henkel in social media: www.henkel.com/annualreport www.henkel.com/sustainabilityreport www.facebook.com/henkel www.twitter.com/henkel www.youtube.com/henkel Henkel AG & Co. KGaA 40191 Düsseldorf, Germany Phone: +49 (0) 211-797-0 www.henkel.com


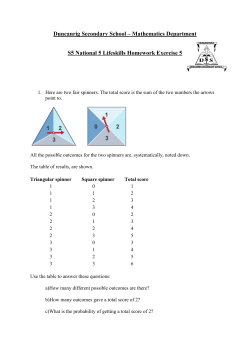


© Copyright 2026