
-‐ TRAIN -‐ - David Bekaert
-‐ TRAIN -‐ Toolbox for Reducing Atmospheric InSAR Noise (Visible spectrum images at a geostationary orbit over Mexico, copyright NOAA) David Bekaert – University of Leeds – 2015 Version 1beta Toolbox for Reducing Atmospheric InSAR Noise – TRAIN 1 Introduction The Toolbox for Reducing Atmopsheric InSAR Noise – TRAIN – is developed in an effort to include current state of the art tropospheric correction methods into the default InSAR processing chain. This work started as part of a tool for my own PhD research at the University of Leeds, but developed futher into a tool for the InSAR community. While we are currently in the process of writing a manuscript as citation reference for TRAIN, we request users to meanwhile reference Bekaert et al (2015a) which links to the initial method implemented in TRAIN: Bekaert, D.P.S., Hooper, A.J., and Wright, T.J. (2015a), A spatially-‐variable power-‐law tropospheric correction technique for InSAR data, JGR, doi:10.1029/2014JB011558 I would like to acknowledge the contribution and help of Richard J. Walters, the support of Tim J. Wright, Andy J. Hooper, and Doug J. Parker. TRAIN is freely available for non-‐commercial projects like academic research. The toolbox consists of a combination of command line scripts, shell scripts, and matlab scripts. More information on software is provided in Chapter 3. TRAIN is independent of the used InSAR processor, as long as the data convention is followed. The toolbox is compatible with the StaMPS software. Further initial efforts have been put to include TRAIN into the default Π-‐rate processing chain. The manual provided with this toolbox is undergoing continuous development. Any feedback is welcomed. Questions and comments can be posted to the TRAIN help forum. In order to post to the forum you will need to subscribe and provide a small description. The latter is only used to separate spam from actual users. You can search for answered questions without being a member of the group. https://groups.google.com/forum/?hl=en#!forum/TRAIN_support Throughout this manual command line commands are indicated in blue. Matlab commands are indicated to be in the matlab environment, i.e. command is proceeded by >>. Red refers to inputs that need to be set by the user. Description of the matlab functions can be obtained by typing help and the function name in matlab e.g. >> help function_name. In matlab all the processing parameters are contained in the parms_aps.mat file. Parameter values can be retrieved by >> getparm_aps for the full list or through >> getparm_aps('parameter_name') for the parameter_name parameter. On the other hand parameters can be changed by the user by using the > setparm_aps('parameter_name',new_value). At the first run the default parameters will be loaded. To reset at any time on of the parameters to the default value do: > setparm_aps ('parameter_name', NaN) 1 Toolbox for Reducing Atmospheric InSAR Noise – TRAIN TRAIN includes: Weather balloon sounding delays: ! Balloon sounding download script ! Balloon sounding delay estimation tool (station location only) Tropospheric correction techniques for InSAR: ! Phase-‐based -‐ Power-‐law correction o Input parameters can be estimated from sounding data o Option to have variable power-‐law coefficients between interferograms ! Phase-‐based -‐ Linear correction o Full interferogram or non-‐deforming region ! Spectrometer -‐ MERIS correction (currently only Envisat support) o Input parameters can be estimated from sounding data o Option to vary conversion coefficients for each SAR date o Auto re-‐projection to geo-‐coordinates ! Spectrometer -‐ MODIS correction o Input parameters can be estimated from sounding data o Option to vary conversion coefficients for each SAR date o Auto download and merging using OSCAR service ! Weather model -‐ ERA-‐I correction o BADC and ECMWF data websites supported ! Weather model -‐ Weather Research and Forecasting Model (WRF) correction o Including download script of weather model data o WRF input file generation The table below gives an overview of the different components estimated in each technique Techniques Hydrostatic delay Wet delay MERIS (Spectrometer) NO* YES – Including turbulent MODIS (Spectrometer) NO* YES – Including turbulent WRF (Weather model) YES YES – Including turbulent ERA (weather model) YES YES – Including turbulent Linear correction Yes -‐ Combined (no turbulence). (uniform troposphere) Power-‐law correction Yes -‐ Combined (no turbulence). (spatially-‐varying troposphere) *A comparison can be made with other techniques when adding the hydrostatic component from e.g. a weather model. 2 Toolbox for Reducing Atmospheric InSAR Noise – TRAIN 2 Contents 1 Introduction ................................................................................................................ 1 2 Contents...................................................................................................................... 3 3 Configuration .............................................................................................................. 5 3.1 Matlab.............................................................................................................................. 5 3.2 Beam ................................................................................................................................ 5 3.3 NCL ................................................................................................................................... 5 3.4 GMT ................................................................................................................................. 6 3.5 Python .............................................................................................................................. 6 3.6 OSCAR JPL – MODIS service .............................................................................................. 6 3.7 ECMWF WEBAPI ............................................................................................................... 6 3.8 StaMPS ............................................................................................................................. 6 4 Preparing data for processing with TRAIN.................................................................... 7 5 Downloading of sounding data .................................................................................... 9 5.1 Download ......................................................................................................................... 9 5.2 Loading in Matlab and saving into .mat files ....................................................................10 6 Computation of sounding profile delays .................................................................... 11 6.1 Sounding data format ......................................................................................................11 6.2 Computation of sounding delays......................................................................................11 7 Phase-‐based -‐ Linear correction ................................................................................. 13 7.1 Full interferogram based..................................................................................................13 7.2 Non-‐deforming region .....................................................................................................13 8 Phase-‐based -‐ Power-‐law correction.......................................................................... 14 8.1 Step 1: Estimate power-‐law coefficient from sounding data.............................................14 8.2 Step 2: Rotate and interpolate to a regular grid together with power-‐law scaling ............16 8.3 Step 3: 1D and or 2D Fourier band filtering ......................................................................17 8.4 Step 4: Computation of the tropospheric delays ..............................................................18 9 Spectrometer -‐ MODIS correction.............................................................................. 19 9.1 Downloading and cropping of MODIS data ......................................................................19 9.2 Step 1: Spectrometer conversion parameter estimation from sounding data ...................20 9.3 Step 2: Computing the individual SAR delays ...................................................................21 9.4 Step 3: Computing the MODIS tropospheric InSAR delays ................................................22 10 Spectrometer -‐ MERIS correction (Envisat only)....................................................... 24 10.1 Downloading of MERIS data ..........................................................................................24 3 Toolbox for Reducing Atmospheric InSAR Noise – TRAIN 10.2 10.3 10.4 10.5 10.6 Projecting the MERIS data to WGS 84 ............................................................................24 Setting the directory structure.......................................................................................25 Step 1: MERIS conversion parameter estimation from sounding data ............................25 Step 2: Computing the individual SAR delays .................................................................27 Step 3: Computing the MERIS tropospheric InSAR delays...............................................28 11 Weather model -‐ ERA-‐I correction ........................................................................... 29 11.1 Downloading of ERA-‐I data ............................................................................................29 11.2 Step 2: Computing individual SAR delays (zenith) ..........................................................31 11.3 Step 3: Computing the ERA-‐I tropospheric InSAR delays ................................................31 12 Weather model -‐ Weather Research and Forecasting model.................................... 33 12.1 Required files and generation of the WPS and WRF input files.......................................33 12.2 Downloading and directory set-‐up of GFS data ..............................................................34 12.3 Running of the WRF software ........................................................................................34 12.4 Step 1: Computing individual SAR delays (zenith) ..........................................................34 12.5 Step 2: Computing the WRF tropospheric InSAR delays..................................................35 13 Plotting results ........................................................................................................ 37 13.1 StaMPS plotting.............................................................................................................37 Bibliography .................................................................................................................... 38 Version Control ............................................................................................................... 39 4 Toolbox for Reducing Atmospheric InSAR Noise – TRAIN 3 Configuration To set up the required variables source the appropriate file for your shell. If you are using a csh like shell, run: source APS_CONFIG.tcsh Or, if you are using a bash like shell: source APS_CONFIG.sh If you unsure of which shell you are using, you should be able to find out by running the command: echo $SHELL Edit the APS_CONFIG file and update the path of the APS_toolbox to the location where you have downloaded it to. The configure file needs to be sourced on each shell start-‐up. It is recommended to add the sourcing command to your .bashrc or .tcshrc file Below a list is provided with external software’s that are used within this toolbox. All of them are freely available except Matlab. Not all of them are required when running specific parts of the toolbox. 3.1 Matlab The main software used throughout this toolbox. The development of the toolbox has been done using Matlab 2012 and 2013. While not tested it is expected to run without large problems with older versions. 3.2 Beam Free downloadable software from ESA, http://www.brockmann-‐consult.de/cms/web/beam/, which allows you to load satellite data and perform image operation like re-‐projection to WGS84 format. The Beam (VISAT) software is only used for the MERIS correction part of the toolbox. Note that other software might be able to do a re-‐projection as well. 3.3 NCL Free downloadable software from http://www.ncl.ucar.edu/index.shtml, which is used to convert GRIB1 and GRIB2 reanalysis date into netcdf format. This software will be needed when using weather model data from the US. 5 Toolbox for Reducing Atmospheric InSAR Noise – TRAIN 3.4 GMT Open source software that can be downloaded for free and which is used during the MERIS tropospheric correction of the toolbox for cropping of the MERIS and DEM data. Download from http://gmt.soest.hawaii.edu/gmt/gmt_download.html. 3.5 Python Python is used to automate some routines, which can also be completed manually. E.g. this includes the batch ordering and download of ERA-‐I data from the ECMWF website, and the automatically batch re-‐projection of the MERIS coordinate system. When using the automated options one will also need to add the PYTHONPATH with the location of the packages in the APS_CONFIG file. 3.6 OSCAR JPL – MODIS service For the MODIS spectrometer estimate, the downloading and cropping relies on the OSCAR JPL online service. Data fetching and downloading can be done using their provided Python scripts. Download these at http://oscar.jpl.nasa.gov and update the location of the get_modis.py in your APS_CONFIG.sh or APS_CONFIG.tcsh file. 3.7 ECMWF WEBAPI The ECMWF webapi can be used to batch order and download the ERA-‐I from the ECMWF website. Download the package and follow the guidelines as given at: https://software.ecmwf.int/wiki/display/WEBAPI/Accessing+ECMWF+data+servers+in+batch. The python package can be installed in the Python folder of the APS toolbox, which will be automatically sourced in the APS_CONFIG file. Installing the package at another location will require you to update the APS_CONFIG file such the package is added to the PYTHONPATH. To run the API, a username and password from ECMWF are required, and a WEBAPI password will need to be requested linked to your account. Once given, put your account information in the hidden ~/.ecmwfapirc file. 3.8 StaMPS Users which are using this toolbox as a plug-‐in to StaMPS can use ps_plot of the StaMPS Matlab toolbox to visualise their tropospheric correction results. The aps toolbox has been integrated with StaMPS and recognises the StaMPS structure. For the power-‐law tropospheric correction a lot of the required processing parameters are automatically extracted based on the StaMPS files. Note that for non-‐processed StaMPS data, the plotting will fail, unless all the required files are provided. For interested users see: http://homepages.see.leeds.ac.uk/~earahoo/stamps/. 6 Toolbox for Reducing Atmospheric InSAR Noise – TRAIN 4 Preparing data for processing with TRAIN TRAIN assumes the interferometric phase, height, and date information to be stored in a specific formation. Below it is elaborated how to set this structure up. StaMPs users can skip this step, as the toolbox will be automatically set the paths to the correct variables in the parameter file. In the following n_p, refers to the number of points, while n_ifgs will refer to the number of interferograms. Tip: When you have a different selection of points for each interferogram you can include NaN’s in the phase matrix for those pixels. To save you data do something like: >> save(‘hgt.mat’,’hgt’) hgt_matfile = [pwd 'hgt.mat'] Topography, stored in a column vector of size [n_points 1] in meter units as variable “hgt”. This is needed for the phase based correction methods. phuw_matfile = [pwd 'phuw.mat'] Unwrapped interferograms, stored as a matrix of size [n_points n_ifgs] in radian units, as variable “phuw”. This is needed for the phase based correction methods. ll_matfile = [pwd 'll.mat'] Geo-‐coordinates, stored in a matrix with size [n_points 2] and in its columns the longitude and latitude, specified as degrees, as variable “lonlat”. Needed for all correction methods. ifgday_matfile = [pwd 'ifgday.mat'] Interferogram dates stored as a matrix with name ifgday and size [n_ifgs 2]. The master image is in the first and slave in the second column respectively. Specify dates a numeric value in YYYYMMDD format, and as variable “ifgday”. Needed for all correction methods. UTC_sat = ['HH:MM'] UTC time of the satellite pass over your study area. It is specified as a string in a two digit hour and two digit minute format. A colon needs to be included in between! Needed for 7 Toolbox for Reducing Atmospheric InSAR Noise – TRAIN the weather model (ERA, WRF), and MODIS correction methods. look_angle = 21/180*pi or path to file The look angle [rad] used in the projection to the line of sight. By default this is set to 21 degrees. Alternative a file can be specified in which the look angle for each point can be given. This needs to be a column vector of size [n_points 1] with the angle in radians saved as “la” variable. Needed for all correction methods except phase based correction and MERIS. 8 Toolbox for Reducing Atmospheric InSAR Noise – TRAIN 5 Downloading of sounding data This step is not required for the linear topography-‐phase correction. Optional it can be used for the MERIS and power-‐law correction to get an estimate for the scaling coefficients of the correction techniques. In case no sounding data is downloaded the default values will be loaded for those techniques instead. The values can be manually changed by the user as well. Sounding data can give a good indication on how delays vary within your region of interest. However, note that sounding delays are acquired at fixed times of 00 UTC and 12 UTC and thus there might be an offset between your radar acquisition over which the atmospheric conditions might have been changed. Retrieve those sounding acquisitions the closest to your SAR acquisition. 5.1 Download Below the instructions are provided on how to automatically download balloon sounding from the University of Wyoming (please acknowledge the source data in your work). cp $APS_toolbox_scripts/sounding_download . edit the parameters in sounding_download to your region of interest and run sounding_download from the command line. Parameter name Description station The station number of the sounding station the closest to your region of interest. To identify the station number consult the sounding map at http://weather.uwyo.edu/upperair/sounding.html region This is the regions where your souding station is located. This is either "eu" for Europe, "na" for North America, "af" for Africa. When going to the website you can find the region of the station within the URL. year The years of sounding data that needs to be downloaded e.g. "2010 2011 2012". month The months of the year that needs to be downloaded e.g. "01 02 03" for January till March. day The days of the month that needs to be downloaded e.g . "28 29 30 31". 9 Toolbox for Reducing Atmospheric InSAR Noise – TRAIN savepath The full path where the sounding data needs to be saved to. The data will be downloaded when available and saved as a YYYYMMDD_HR.txt files following the region/station_nr/YYYYMMDD_HR.txt directory structure. 5.2 Loading in Matlab and saving into .mat files Next all the “txt” files are loaded into Matlab and saved as “.mat” files with the variables in the structure as assumed by other routines in this toolbox. Launch matlab >> load_sounding Update the following variable using setparm_aps to your assumed data location Parameter and default value Description sounding_dir = [pwd '/sounding_data'] Directory string where the sounding data is downloaded to. Use full path. 10 Toolbox for Reducing Atmospheric InSAR Noise – TRAIN 6 Computation of sounding profile delays This Matlab script allows for the computation of the sounding delays. No modification of the file structure is needed when the sounding data has been loaded using the load_sounding script as elaborated in Chapter 5. When done so the first step can be skipped 6.1 Sounding data format All the sounding data should be loaded into Matlab and saved into the date 'YYYYMMDD' and UTC ‘HR’ format as “YYYYMMDD_HR.mat” files. The variables within this mat files are the ‘P’ pressure (hPa), ‘T’ the temperature (degrees), ‘RH’ the relative humidity (%) and ‘h’ the heights in (m). After having constructed vectors for each of these variables, of the same length, do the following to save them: >> save('YYYYMMDD_HR.mat', 'P', 'T', 'RH', 'h') 6.2 Computation of sounding delays Go directly to the power-‐law and MERIS chapter when you want to use sounding data to estimate the input coefficients of the correction. The sounding program computes the refractivity, the mean LOS delay (phase [rad] and displacement [m]), the corresponding heights and appends this information to the existing “YYYYMMDD_HR.mat” files. In addition, a single estimate for the power law coefficients will be given as output based on the full sounding period. It can be neglected when not needed. More sophisticated power-‐law and MERIS coefficient estimation, including seasonal variation and SAR date specific estimates, are contained in the chapter of the power-‐law and MERIS correction. Delays are computed based on the user processing parameters, given below and which can be retrieved using the >> getparm_aps and modified using the >> setparm_aps functions. To compute the delays, type: >> sounding Parameter and default value Description sounding_dir = [pwd '/sounding_data'] Directory string where the sounding data is downloaded to. Use full path. 11 Toolbox for Reducing Atmospheric InSAR Noise – TRAIN sounding_time_stamp = ['00' ; '12'] The UTC acquisition times of the sounding data to be used into the computation. By default this is set to 00 and 12 UTC. Needs to be specified as a column vector string. sounding_start_date = [] Start date of the sounding data to be used into the computation, specified as a string in ‘yyyymmdd’ format. By default [], the earliest date is used. sounding_end_date = [] End date of the sounding data to be used into the computation, specified as a string in 'yyyymmdd' format. By default [], the latest date is used. sounding_h0 = 0 The height in km units till which the delays are computed. When set to 0 sounding_h0 is computed to the height at which the net delay is approximately 0. Note for individual delays you might want to increase this value. sounding_errror_promp = 'n' Crashes are suppressed (default). Instead error message are outputted and data is patched with NaN when set to 'n'. look_angle = 21/180*pi or path to file The look angle [rad] used in the projection to the line of sight. By default this is set to 21 degrees. Alternative a file can be specified in which the look angle for each pixel or PS can be given. This needs to be a column vector of size [n_points 1] with the angle in [rad]. lambda The radar wavelength of the SAR satellite in m. This is used to convert the delay towards a phase delay. By default lambda is set to be 0,0562 m. 12 Toolbox for Reducing Atmospheric InSAR Noise – TRAIN 7 Phase-based - Linear correction A linear tropospheric correction can be computed based on the phase and topographic information by typing >> aps_linear Output is saved into a “tca2.mat” or “tca_sb2.mat” as the “ph_tropo_linear” variable. The relation can either be estimated based on the full interferogram or for a selected non-‐deforming region. The parameters which are used in this function are: Parameter and default value Description hgt_matfile = [pwd 'hgt.mat'] Full file path containing the topography, stored in a column vector of size [n_points 1]. phuw_matfile = [pwd 'phuw.mat'] Full file path of the unwrapped interferograms, stored as a matrix of size [n_points n_ifgs]. ll_matfile = [pwd 'll.mat'] Full file path of the geo-‐coordinates, stored in a matrix with size [n_points 2] and in its columns the longitude and latitude. non_defo_flag = 'n' By default the correction is performed based on the full interferogram. Put to 'y' to use the non-‐deforming estimation. 7.1 Full interferogram based By default the 'non_defo_flag' is set to 'n', which will force the computation of the tropospheric relation between phase and topography based on the whole interferogram. 7.2 Non-deforming region To use the non-‐deforming region turn the 'non_defo_flag' in the parms_aps list on by typing: >> setparm_aps('non_defo_flag','y') Note that turning this functionality on, requires you to have a file “non_defo.mat” with in it a variable “poly”, being a matrix with in its columns the longitude and latitude of the non-‐deforming region. To save such a variable do: >> save('non_defo.mat', 'poly'). 13 Toolbox for Reducing Atmospheric InSAR Noise – TRAIN 8 Phase-based - Power-law correction This technique is contained in Bekaert et.al. (2015a, 2015b). The following section described the processing step that need to be followed together with the required input parameters for each step. The selection of a non-‐contaminated frequency band is not automated. You will need to know which frequency band to use in advance, or by validation with another independent technique, e.g. MERIS. Beside the tectonic deformation also other signals can bias specific frequency bands like for example the higher spatial frequencies in case of atmospheric turbulence. The program can be called by >> aps_powerlaw for which all processing steps will be run. Individual steps can be run by: >> aps_powerlaw(start_step,end_step) Output is saved into a “tca2.mat” or “tca_sb2.mat” as the “ph_tropo_powerlaw” variable. In the first processing step the power-‐law decay coefficient and height at which the net delays have reduced to approximately zero is estimated from the sounding data. By default, and in case no sounding data is available ('sounding_data flag is set 'n') this step can be skipped and the defaults or user defined values will be loaded. For more information on how to obtain sounding data and the required structure see Chapter 5 of the manual. 8.1 Step 1: Estimate power-law coefficient from sounding data Two options exist for the coefficient estimation. By default a mean value will be estimated for the power-‐law coefficients using the full sounding date range ('sounding_sensitivity' = 'n'). However, this can changed such the power-‐law coefficients are estimated for each specific SAR data, after which the mean is taken to estimate the power-‐law coefficients for each individual interferogram. In addition there is the option to make a sensitivity analysis of the power-‐law coefficients. Below the different option are summarised together with their specific parameters. Modify these using setparm_aps. A mean coefficient for all interferograms (default option) 'sounding_sensitivity' is 'n'. This method is not recommended for large sounding periods. It is recommended instead to use the sensitivity analysis and manually set a mean value. Individual coefficients for each interferogram 'sounding_sensitivity' and 'sounding_ifg_dates' are both 'y'. In total 15 days before and after the SAR date are used 14 Toolbox for Reducing Atmospheric InSAR Noise – TRAIN to compute the mean delay. Sensitivity analysis 'sounding_sensitivity' is set to 'y', while 'sounding_ifg_dates' is set to 'y'. The number of months over which the mean delay is computed is given by 'sounding_months'. The latter is by default 1 month. To run the estimation, the sounding data flag needs to be turned on and at the same time the path needs to point to the correct location. >> setparm_aps('sounding_data','y') >> setparm_aps('sounding_dir',string_with_your_path) The sounding_h0 flag needs to be put to 0, in order to estimate the height h0 at which the tropospheric net delays have reduced to approximately zero: >> setparm_aps('sounding_h0', 0) h0 will be estimated from the sounding data by making many net-‐delay combinations. The other parameters can be set as wanted. To run the estimation program type: >> aps_powerlaw(1,1) Parameter and default value Description sounding_time_stamp = ['00' ; '12'] The UTC acquisition times of the sounding data to be used into the computation. By default this is set to 00 and 12 UTC. Needs to be specified as a column vector string. sounding_start_date = [] Start date of the sounding data to be used into the computation, specified as a string in 'yyyymmdd' format. By default [], the earliest date is used. sounding_end_date = [] End date of the sounding data to be used into the computation, specified as a string in 'yyyymmdd' format. By default [], the latest date is used. sounding_h_alpha_thres = 4 Lower range of sounding heights in km, for which the power-‐law decay coefficient alpha 15 Toolbox for Reducing Atmospheric InSAR Noise – TRAIN is estimated. It is recommended to have this value around or a bit a larger than the maximum topography. sounding_errror_promp = 'n' Crashes are suppressed (default). Instead error message are outputted and data is patched with NaN when set to 'n'. Obtained results can be displayed by running: >> aps_powerlaw(1.1,1.1) 8.2 Step 2: Rotate and interpolate to a regular grid together with power-
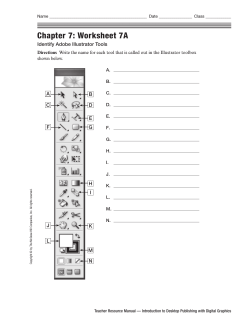
law scaling To avoid the Fourier band filtering effects the InSAR data is rotated over approximately the heading angle such the bounding box marked/white space is minimized, see Figure 1. At the same time it is required to have the data on a regular grid. The latter can be specified by modifying powerlaw_xy_res. Note that this should not be made bigger than the actual resolution of you InSAR data. Next the topography is scaled according to the power-‐law relationship. An overview of the used input parameters is given below. Figure 1: Rotate over the satellite heading to minimize the bounding box around the data. Parameter and default value Description heading = [] or from StaMPs file The rotation angle in deg over which the InSAR data needs to be rotated to minimize the bounding box. The satellite heading is a 16 Toolbox for Reducing Atmospheric InSAR Noise – TRAIN good approximation. powerlaw_xy_res = [30 30] The regular grid resolution [x y] in m, to which the data will be interpolated. This should not be made larger than the resolution of the data. powerlaw_h0 = 10 or from step 1 The height in km at which the tropospheric net delays have approximately reduced to zero. By default this value is set to be 10 km. When running step 1 this value is automatically updated. powerlaw_alpha = 1.6 or from step 1 The power-‐law decay coefficient. By default this value is set to be 1.6. When running step 1 this value is automatically updated. powerlaw_DEM_corr = ‘n’ For time-‐series interferograms the input phase used for the tropospheric estimation can be corrected for the DEM associated error (correlated with baseline). By default this is not done. It is not recommended to perform this correction when having less than 5 interferograms. 8.3 Step 3: 1D and or 2D Fourier band filtering At this stage the scaled topography and phase is filtered in different bands. By default it is opted to perform a 2D Fourier band filter. However in those cases where the percentage of the largest filter dimension with respect to the smallest dimension is bigger than 10%, then the filtering is switched automatically to a 1D Fourier filtering in the largest dimension only. The different spatial band filters are contained in 'powerlaw_spatial_bands'. It is advised not to make your spatial band filters much bigger than your maximum dimension, as this would introduce filtering effects. The data is mirrored to reduce edge effects While not done by default, there is at this stage the option to crop out part of the data by changing >> setparm_aps('crop_flag', 'y'). As wrongly unwrapped regions bias the filtering and thus the tropospheric estimation, it is advised to use this option to crop out the specific area. Parameter and default value Description powerlaw_spatial_bands = Spatial filter band given in meters as a two column matrix [lower_band higher_band]. It is recommended not to make you filter [ 2000 4000 4000 8000 17 Toolbox for Reducing Atmospheric InSAR Noise – TRAIN 8000 16000 16000 32000 32000 64000 64000 128000]; magnitude smaller that the twice the spatial resolution of the dataset (Nyquist frequency) and larger than the spatial extend of your dataset. 8.4 Step 4: Computation of the tropospheric delays In this step the tropospheric delays are estimated. This is done over multiple sub-‐windows (patches) in the spatial frequency bands you filtered before. Currently a mean is selected from the indicated frequency bands, so it is important to exclude those bands which are contaminated by other signals than the atmosphere. In case you modified this you will need to re-‐run the filtering. To estimate the delays type: Parameter and default value Description powerlaw_h0 = 10 or from step 1 The height in km at which the tropospheric net delays have approximately reduced to zero. By default this value is set to be 10 km. When running step 1 this value is automatically updated. Do not modify this or one will need to re-‐run from step 2 onwards. powerlaw_alpha = 1.6 or from step 1 The power-‐law decay coefficient. By default this value is set to be 1.6. When running step 1 this value is automatically updated. Do not modify this parameter or one will need to re-‐
run from step 2 onwards. powerlaw_spatial_bands = Spatial filter band given in meters as a two column matrix [lower_band higher_band]. It is recommended not to make you filter magnitude smaller that the twice the spatial resolution of the dataset (Nyquist frequency) and larger than the spatial extend of your dataset. Do not modify this parameter, or one will need to re-‐run from step 3 onwards. [ 2000 4000 4000 8000 8000 16000 16000 32000 32000 64000 64000 128000]; powerlaw_n_patches = 50 Number of patches using this value is adapted such approximately square patches are generated. When a single patch is preferred, put to 0. 18 Toolbox for Reducing Atmospheric InSAR Noise – TRAIN 9 Spectrometer - MODIS correction MODIS data (spectrometer) is acquired on the Aqua and Terra satellites, and can be used for the estimation of an atmospheric delay map for any platform, but limited to day-‐light conditions. The success rate of this is strongly depending on the daily cloud cover. The service used to download and mosaic the MODIS data is provided by JPL through the Online Services for Correcting Atmosphere in Radar (OSCAR). Only wet delay is provided when using spectrometer data. The MODIS delay estimation is controlled by >> aps_modis, which runs all processing steps. Individual steps can be run by: >> aps_modis(start_step,end_step) Output is saved into a “tca2.mat” or “tca_sb2.mat” as the “ph_tropo_modis” and “ph_tropo_modis_no_interp” variables. The latter contains the non-‐interpolated but cloud masked MODIS delay estimates. Note that the integrated water vapour conversion parameter estimation (step 1) is optional. 9.1 Downloading and cropping of MODIS data The MODIS data is downloaded using the OSCAR service provided by JPL. Make sure the software is set-‐up accordingly. Data is provided free of charge. The service consists out MODIS granule identification covering your area, interpolated space and time of the MODIS data, and the cropping of the data. To run this step type: >> aps_modis(0,0) The program will automatically set up the directory structure PATH/MODIS/ within this folder the YYYYMMDD/MODIS*.grd files. The following inputs control the download: Parameter and default value Description modis_datapath The full path to your MERIS processing folder. region_lon_range = [] The longitude crop in degrees. Make this slightly bigger than your InSAR region region_lat_range =[] The latitude crop in degrees. Make this slightly bigger than your InSAR region 19 Toolbox for Reducing Atmospheric InSAR Noise – TRAIN ifgday_matfile = [pwd 'ifgday.mat'] Full file path to the mat file containing the interferogram dates stored as a matrix with name ifgday and size [n_ifgs 2]. The master image is in the first and slave in the second column respectively. Specify dates a numeric value in YYYYMMDD format. 9.2 Step 1: Spectrometer conversion parameter estimation from sounding data This step is optional. Unless already ran when using the MERIS correction, when skipped the default values are used for the atmospheric scale height and the PI-‐conversion factor. (Walters, et al., In review) showed the sensitivity of these parameters not to be significant in affecting the estimated delay map. To run this step you will need to have the balloon sounding data downloaded. Information on how to do this is documented in Chapter 5. The constants can be estimated by running: >> aps_modis(1,1) Both the PI_factor and the H_scaling variables are appended to each “.mat” file of the sounding data. Both the spectrometer_PIconversion and spectrometer_scale_height are updated automatically in parameter list. You can either estimate it for each SAR date or use an average value. A mean coefficient for all interferograms (default option) This method is not recommended for large sounding periods. It is recommended instead to have SAR date varying conversion factors. Individual coefficients for each interferogram Put 'sounding_ifg_dates' to 'y'. In total 15 days before and after the SAR date are used to compute the coefficient on each day. Incase the actual day does not have a sounding, the mean over this period is used instead. In case this does not lead to an estimate, the average for all SAR dates is used to fill in the gaps.. 20 Toolbox for Reducing Atmospheric InSAR Noise – TRAIN The following parameters control the conversion factor estimation: Parameter and default value Description sounding_dir = [pwd '/sounding_data'] Directory string where the sounding data is downloaded. Use full path. sounding_time_stamp = ['00' ; '12'] The UTC acquisition times of the sounding data to be used into the computation. By default this is set to 00 and 12 UTC. Needs to be specified as a column vector string. sounding_start_date = [] Start date of the sounding data to be used into the computation, specified as a string in ‘yyyymmdd’ format. By default [], the earliest date is used. sounding_end_date = [] End date of the sounding data to be used into the computation, specified as a string in 'yyyymmdd' format. By default [], the latest date is used. sounding_errror_promp = 'n' Crashes are suppressed (default). Instead error message are outputted and data is patched with NaN when set to 'n'. 'sounding_ifg_dates' = 'n' By default conversion factors are estimated as the mean of the sounding period. Putting this flag to 'y' will allow to compute the conversion factor for each SAR date. The time-‐series of coefficients is saved in the sounding directory within the spectrometer folder. The mean of the time-‐series coefficients is automatically set to be the new coefficient in aps parameter file. 9.3 Step 2: Computing the individual SAR delays Next, an individual delay map is computed for each of the MERIS dates, by running >> aps_modis (2,2) When not existing a file “MODIS_batch_file.txt” is generated containing the full paths to the downloaded MODIS files. The first line of the file should read “files”. All specified file are processed individually. 21 Toolbox for Reducing Atmospheric InSAR Noise – TRAIN MODIS is know to overestimate Percipitable Water Vapour (PWV), this is accounted for through the calibration factor which is defined as PWVcalibrated = calibration*PWVMODIS. While this calibration factor varies in time, Li Z. et al. (2009) found an average bias of 0.95. Update the following input parameters to your region of interest using the setparm_aps function. Parameter and default value Description meris_datapath The full path to your MERIS processing folder. spectrometer_PIconversion = 6.2 or from step 1 PI conversion [-‐] factor. Can be estimated from step 1. region_res = 0.00833 The output resolution in degrees region_lon_range = [] The longitude crop in degrees. Make this slightly bigger than your InSAR region region_lat_range =[] The latitude crop in degrees. Make this slightly bigger than your InSAR region modis_calibration=0.95 MODIS calibration factor. On average MODIS over-‐estimates by 5% (Z. Li et al., 2009). TIP: When having problems, the first thing to check is that you have the files set-‐up correctly, i.e. in a data folder structure with a file name of the MODIS*YYYYMMDD.grd data. Next you can check if the dem is loaded properly. You can check this by turning the fig_test flag to 1 in the aps_modis_SAR script. When running the script a plot of the resampled dem will be made. 9.4 Step 3: Computing the MODIS tropospheric InSAR delays Note that in the estimation of a SAR delay a exponential decay has been assumed for the pressure for estimating the dry component. For an interferometric delay this will cancel out when assuming identical ground pressures, reducing the estimated interferometric delay to a wet delay only. To compute the interferometric MERIS delay type: >> aps_modis(3,3) 22 Toolbox for Reducing Atmospheric InSAR Noise – TRAIN The following parameters are used to calculate the interferometric phase delays Parameter and default value Description meris_perc_coverage = 80 Percentage of points that need to have MODIS coverage (cloud free). In case this is not met the MODIS date is rejected. lambda The radar wavelength of the SAR satellite in m. This is used to convert the delay towards a phase delay. By default lambda is set to be 0,0562 m. ll_matfile = [pwd 'll.mat'] Full file path of the geo-‐coordinates, stored in a matrix with size [n_points 2] and in its columns the longitude and latitude. ifgday_matfile = [pwd 'ifgday.mat'] Full file path to the mat file containing the interferogram dates stored as a matrix with name ifgday and size [n_ifgs 2]. The master image is in the first and slave in the second column respectively. Specify dates a numeric value in YYYYMMDD format. 23 Toolbox for Reducing Atmospheric InSAR Noise – TRAIN 10 Spectrometer - MERIS correction (Envisat only) Both the ASAR and spectrometer instrument, MERIS, have been operated simultaneous on-‐board Envisat, which allows for the estimation of an atmospheric delay map from the MERIS data for each specific descending (day-‐time) ASAR acquisition. However the success rate of this is strongly depending on the daily cloud cover e.g. (Walters, et al., 2013). Only wet delay is provided when using spectrometer data. The MERIS delay estimation is controlled by >> aps_meris, which runs all processing steps. Individual steps can be run by: >> aps_meris(start_step,end_step) Output is saved into a “tca2.mat” or “tca_sb2.mat” as the “ph_tropo_meris” and “ph_tropo_meris_no_interp” variables. The latter contains the non-‐interpolated but cloud masked MERIS delay estimates. Below additional information is provided regarding the free MERIS data download, the projection to the WGS84 reference frame, the MERIS conversion parameter estimation using sounding data, the delay map computation for the different SAR acquisitions and as last the interferometric delay computation. Note that the MERIS conversion parameter estimation is optional. 10.1 Downloading of MERIS data MERIS data “MER_RR_2P” can be obtained from ESA Earthnet Online website under the free-‐
distributed ESA policy (https://earth.esa.int/web/guest/pi-‐community). A user id is required, which can be requested by contacting ESA. Next follow the information on how to download the data as send by email. 10.2 Projecting the MERIS data to WGS 84 The MERIS data is provided in its image format with equal spaced points and needs to be re-‐
projected to WGS 84. This is done here using the free Beam (VISAT) software from ESA (see section 3.2). You can either do it by hand or using the command line in batch process. To project from command line, make sure the bin of the Beam software is sourced such it finds the “gpt.sh” script. Next continue with the next section (setting up the directory structure) and turn the re-‐projection flag to 1 To do the re-‐projection manually, load each MERIS data file, by opening it in beam. Re-‐project the data by going to “tools” tab > “Reprojection”. Next change the projection to “Geographic Lat/Lon (WGS 84)” under the “reprojection parameters” tab. Make sure to change the save format to a 24 Toolbox for Reducing Atmospheric InSAR Noise – TRAIN “GeoTIFF”. Note that re-‐projection MER_RR__2P*.N1_reprojected.tif). filenames should be kept as default (e.g. 10.3 Setting the directory structure It is recommended to make symbolic links of your raw and re-‐projected data to avoid loss of data. Both the raw and re-‐projected data needs to be organised in a date structure as YYYYMMDD/MER_RR_2P*. When not done, all files should be placed in the same folder and the link_raw_meris script will set-‐up the structure prior to making the symbolic links. To run the script type: link_raw_meris Rawdata_PATH [Processing_PATH reprojection_flag date_file](optional) With the Rawdata_PATH the full path to downloaded MERIS data, Processing_PATH the full path to your processing directory, reprojection_flag a flag set to 1 to auto re-‐project using beam command line, and date_file the path to a file containing the dates folders to be linked (specified as rows in YYYYMMDD format). The latter three are optional fields. It is recommended to set your Processing_PATH to a dedicated MERIS folder, which can be at the same level of your InSAR processing directory. For example PATH/MERIS/ within this folder the YYYYMMDD/MER_RR_2P* structure needs to be followed. TIP: In case the re-‐projection fails it could be that some extreme values at the edge of the projection is causing issues. It might be worth trying to do the re-‐projection locally over you study region only. You can do this by modifying link_raw_meris such it call reproject_params_subset.xml instead of reproject_params.xml. Next you will need to edit POLYGON((LAT1 LON1, LAT2 LON2, LAT3 LON3, LAT4 LON4)), where LAT and LON are the corners of your study region, in: vim $APS_toolbox_scripts/reproject_params_subset.xml 10.4 Step 1: MERIS conversion parameter estimation from sounding data This step is optional. Unless already ran when using the MODIS correction, when skipped the default values are used for the atmospheric scale height and the PI-‐conversion factor. (Walters, et al., In review) showed the sensitivity of these parameters not to be significant in affecting the estimated delay map. To run this step you will need to have the balloon sounding data downloaded. Information on how to do this is documented in Chapter 5. The constants can be estimated by running: >> aps_meris(1,1) 25 Toolbox for Reducing Atmospheric InSAR Noise – TRAIN Both the PI_factor and the H_scaling variables are appended to each “.mat” file of the sounding data. Both the spectrometer_PIconversion and spectrometer_scale_height are updated automatically in parameter list. You can either estimate it for each SAR date or use an average value. A mean coefficient for all interferograms (default option) This method is not recommended for large sounding periods. It is recommended instead to have SAR date varying conversion factors. Individual coefficients for each interferogram Put 'sounding_ifg_dates' to 'y'. In total 15 days before and after the SAR date are used to compute the coefficient on each day. Incase the actual day does not have a sounding, the mean over this period is used instead. In case this does not lead to an estimate, the average for all SAR dates is used to fill in the gaps.. The following parameters control the conversion factor estimation: Parameter and default value Description sounding_dir = [pwd '/sounding_data'] Directory string where the sounding data is downloaded to. Use full path. sounding_time_stamp = ['00' ; '12'] The UTC acquisition times of the sounding data. By default this is set to 00 and 12 UTC. Needs to be specified as a column vector string. sounding_start_date = [] Start date of the sounding data to be used into the computation, specified as a string in ‘yyyymmdd’ format. By default [], the earliest date is used. sounding_end_date = [] End date of the sounding data to be used into the computation, specified as a string in 'yyyymmdd' format. By default [], the latest date is used. sounding_errror_promp = 'n' Crashes are suppressed (default). Instead error message are outputted and data is patched with NaN when set to 'n'. 'sounding_ifg_dates' = 'n' By default conversion factors are estimated as the mean of the sounding period. Putting this flag to 'y' will allow to compute the conversion factor for each SAR date. 26 Toolbox for Reducing Atmospheric InSAR Noise – TRAIN The time-‐series of coefficients is saved in the sounding directory within the MERIS folder. The mean of the time-‐series coefficients is automatically set to be the new coefficient in aps parameter file. 10.5 Step 2: Computing the individual SAR delays Next, an individual delay map is computed for each of the MERIS dates, by running >> aps_meris (2,2) When not existing a file “MERIS_batch_file.txt” is generated containing the full paths to the re-‐
projected MERIS files. The first line of the file should read “files”. All specified file are processed individually. Update the following input parameters to your region of interest using the setparm_aps function. Note that the DEM information will be required to be updated. Parameter and default value Description meris_datapath The full path to your MERIS processing folder. demfile = [pwd 'dummy.dem'] The path to the DEM_file. Each DEM should be accompanied with a DEM_file.rsc which contains the associated WIDTH, LENGTH, X_STEP (resolution), Y_STEP(-‐1*resolution), X_FIRST and Y_FIRST (upper left corner of the DEM). X and Y refer to longitude and latitude. The DEM is assumed to be stored as a short 2-‐byte integer. dem_null = -‐32768 The value associated with no data in the DEM spectrometer_scaleheight = 8340 or from Scale height in m of the troposphere. Can be step 1 estimated from step 1. spectrometer_PIconversion = 6.2 or from step 1 PI conversion [-‐] factor. Can be estimated from step 1. region_res = 0.00833 The output resolution in degrees region_lon_range = [] The longitude crop in degrees. Make this slightly bigger than your InSAR region region_lat_range =[] The latitude crop in degrees. Make this slightly bigger than your InSAR region 27 Toolbox for Reducing Atmospheric InSAR Noise – TRAIN TIP: When having problems, the first thing to check is that you have the files set-‐up correctly, i.e. in a data folder structure with a file name of the meris data ending with _reprojected.tif. Next you can check if the dem is loaded properly. You can check this by turning the fig_test flag to 1 in the aps_meris_SAR script. When running the script a plot of the resampled dem will be made. 10.6 Step 3: Computing the MERIS tropospheric InSAR delays Note that in the estimation of a SAR delay a exponential decay has been assumed for the pressure for estimating the dry component. For an interferometric delay this will cancel out when assuming identical ground pressures, reducing the estimated interferometric delay to a wet delay only. To compute the interferometric MERIS delay type: >> aps_meris(3,3) The following parameters are used to calculate the interferometric phase delays Parameter and default value Description meris_perc_coverage = 80 Percentage of points that need to have MERIS coverage (cloud free). In case this is not met the MERIS date is rejected. lambda The radar wavelength of the SAR satellite in m. This is used to convert the delay towards a phase delay. By default lambda is set to be 0,0562 m. ll_matfile = [pwd 'll.mat'] Full file path of the geo-‐coordinates, stored in a matrix with size [n_points 2] and in its columns the longitude and latitude. ifgday_matfile = [pwd 'ifgday.mat'] Full file path to the mat file containing the interferogram dates stored as a matrix with name ifgday and size [n_ifgs 2]. The master image is in the first and slave in the second column respectively. Specify dates a numeric value in YYYYMMDD format. 28 Toolbox for Reducing Atmospheric InSAR Noise – TRAIN 11 Weather model - ERA-I correction The ERA-‐I delay estimation is controlled by >> aps_era, which runs all processing steps. Individual steps can be run by: >> aps_era(start_step,end_step) Output is saved into a “tca2.mat” or “tcasb2.mat” as the “ph_tropo_era” variable. Below additional information is provided regarding the download of ERA-‐I data, including an apriori check on the required data files. This is followed by a section on delay and as last the interferometric delay computation. 11.1 Downloading of ERA-I data ERA-‐Interim model data contains reanalysis data from the ECMWF weather model and is evaluated at specific times of 00, 06, 12 and 18. Depending on your location it can be downloaded from ECMWF (https://apps.ecmwf.int/auth/login/ both GRIP and netcdf files) for Europe. For the UK research institutes the BADC (http://badc.nerc.ac.uk/home/) also distributes the data (netcdf). For both the ECMWF and BADC website a download script is in the toolbox. To find out which data files are needed for your processing, run in the InSAR directory >> aps_era(0,0) A file “ERA_I_files.txt” is generated which contains the ERA-‐I filenames including the specific hours, which are selected based on the closed ERA-‐I model data with respect to the satellite overpass. The parameters used in this function are summarised as: Parameter and default value Description era_datapath = [] The full path to your ERA-‐I processing folder. UTC_sat = ['HH:MM'] The UTC time of the satellite pass over your study area. It is specified as a string in a two digit hour and two digit minute format. A colon needs to be included in between! era_data_type = 'ECMWF' The data website that will be used to download the ECMWF data. By default this is set to ECMWF, alternatively set to BADC. ifgday_matfile = [pwd 'ifgday.mat'] Full file path to the mat file containing the interferogram dates stored as a matrix with 29 Toolbox for Reducing Atmospheric InSAR Noise – TRAIN name ifgday and size [n_ifgs 2]. The master image is in the first and slave in the second column respectively. Specify dates a numeric value in YYYYMMDD format. You can choose either do download the data from the BADC or from the ECMWF website. The latter allows users outside the UK to place orders. Also data can be cropped to a specific region when selecting the ECMWF data option. To download the BADC data to your current location type: > get_ecmwf password username filelist Where you replace password with your password, username with your BADC username and filelist with the full path to the file containing the files to be downloaded. When using BADC data option skip the following and go to step 2 directly. For downloading the data from ECMWF website type (requires python and the ECMWF API to be installed, see softwares, as well as an ECMWF account and API password) >> aps_era(0.1,0.1) A data selection will be made depending on your area of interest, requiring you to set the parameters depending on your area of interest prior to running this step. Parameter and default value Description era_datapath = [] The full path to your ERA-‐I processing folder. region_lon_range = [] The longitude crop in degrees. Make this slightly bigger than your InSAR region region_lat_range =[] The latitude crop in degrees. Make this slightly bigger than your InSAR region UTC_sat = ['HH:MM'] The UTC time of the satellite pass over your study area. It is specified as a string in a two digit hour and two digit minute format. A colon needs to be included in between! Alternatively the user can download the data manually. Note that the APS toolbox assumes a fixed format for the ERA-‐I files, being ggapYYYYMMDDHHMM.nc being stored in date folder structure YYYYMMDD at your era_datapath. 30 Toolbox for Reducing Atmospheric InSAR Noise – TRAIN 11.2 Step 2: Computing individual SAR delays (zenith) In this step the zenith tropospheric dry and wet delays are computed for each of the SAR dates by running >> aps_era(1,1) Update the following input parameters to your region of interest using the setparm_aps function. Note that the DEM information will be required to be updated. Parameter and default value Description era_datapath = [] The full path to your ERA-‐I processing folder. UTC_sat = ['HH:MM'] The UTC time of the satellite pass over your study area. It is specified as a string in a two digit hour and two digit minute format. A colon needs to be included in between! demfile = [pwd 'dummy.dem'] The path to the DEM_file. Each DEM should be accompanied with a DEM_file.rsc which contains the associated WIDTH, LENGTH, X_STEP (resolution), Y_STEP(-‐1*resolution), X_FIRST and Y_FIRST (upper left corner of the DEM). X and Y refer to longitude and latitude. The DEM is assumed to be stored as a short 2-‐byte integer. You can use construct_dem.sh to make you dem. dem_null = -‐32768 The value associated with no data in the DEM region_res = 0.00833 The output resolution in degrees region_lon_range = [] The longitude crop in degrees. Make this slightly bigger than your InSAR region region_lat_range =[] The latitude crop in degrees. Make this slightly bigger than your InSAR region 11.3 Step 3: Computing the ERA-I tropospheric InSAR delays To compute the interferometric ERA-‐I delays type: 31 Toolbox for Reducing Atmospheric InSAR Noise – TRAIN >> aps_era(2,2) The following parameters are used to calculate the interferometric phase delays. Make sure the default values are updated to your region. Parameter and default value Description lambda = 0.0562 The radar wavelength of the SAR satellite in m. This is used to convert the delay towards a phase delay. By default lambda is set to be 0,0562 m. ll_matfile = [pwd 'll.mat'] Full file path of the geo-‐coordinates, stored in a matrix with size [n_points 2] and in its columns the longitude and latitude. look_angle = 21/180*pi or path to file The look angle [rad] used in the projection to the line of sight. By default this is set to 21 degrees. Alternative a file can be specified in which the look angle for each pixel or PS can be given. This needs to be a column vector of size [n_points 1] with the angle in [rad] saved as “la” variable. ifgday_matfile = [pwd 'ifgday.mat'] Full file path to the mat file containing the interferogram dates stored as a matrix with name ifgday and size [n_ifgs 2]. The master image is in the first and slave in the second column respectively. Specify dates a numeric value in YYYYMMDD format. 32 Toolbox for Reducing Atmospheric InSAR Noise – TRAIN 12 Weather model - Weather Research and Forecasting model This part of the toolbox gives support to run and compute the delays using the Weather Research and Forecast (WRF) model. Currently only support scripts are included using Global Forecast System (GFS) input data. An account (free) is required in order to download the GFS data from CISL Research data Archive (http://rda.ucar.edu/datasets/ds335.0/#!description). 12.1 Required files and generation of the WPS and WRF input files Once the path has been set-‐up. Step 0 can be run in order to get a list of the required files. Simultaneous input files are generated for the WPS and WRF software. For these input files the domains need to be set-‐up. To do so edit the top lines of the aps_wrf_files.m function, by typing: >> edit aps_wrf_files.m Next run: >> aps_wrf(0,0) Update the following input parameters to your region of interest using the setparm_aps function. Parameter and default value Description wrf_datapath = [] The full path to your WRF processing/data folder. UTC_sat = ['HH:MM'] The UTC time of the satellite pass over your study area. It is specified as a string in a two digit hour and two digit minute format. A colon needs to be included in between! ifgday_matfile = [pwd 'ifgday.mat'] Full file path to the mat file containing the interferogram dates stored as a matrix with name ifgday and size [n_ifgs 2]. The master image is in the first and slave in the second column respectively. Specify dates a numeric value in YYYYMMDD format. WPS and WRF input files will be generated such that the model has at least a 12 hr spin-‐up time, based on a 6 hr interval renewal of the nested boundaries, and output the weather model simulation at the time of the SAR acquisition. The domain information is set automatically as well as the required outputs needed to computed the tropospheric delays. 33 Toolbox for Reducing Atmospheric InSAR Noise – TRAIN 12.2 Downloading and directory set-up of GFS data Once a list with the required files has been generated, the files can be downloaded automatically from the GFS website to your current folder by typing on the command line: > cd wrf_datapath > get_GFS.csh passwd email filelist Where you replace wrf_datapath with the path of your wrf data, passwd with your password, email with your email address and filelist with the full path to the file containing the files to be downloaded. After download has been completed the downloaded files can be organised in the date folder structure YYYYMMDD by running in your InSAR directory: >> aps_wrf(0.1,0.1) 12.3 Running of the WRF software Once all the data has been downloaded and the directory structure has been set-‐up the WRF software can be run for all the different SAR dates by executing: > wrf_runfile datelist Where datelist is the path to a file containing all the date folders (YYYYMMDD format) to be processed. Within the wrf_runfile also additional input needs to be modified including the WRF data_dir and the path to the WPS software. This can be done by typing: > vim $APS_toolbox/bin/wrf_runfile 12.4 Step 1: Computing individual SAR delays (zenith) In this step the zenith tropospheric dry and wet delays are computed for each of the SAR dates by running >> aps_wrf(1,1) Update the following input parameters to your region of interest using the setparm_aps function. Note that the DEM information will be required to be updated. Parameter and default value Description demfile = [pwd 'dummy.dem'] The path to the DEM_file. Each DEM should be accompanied with a DEM_file.rsc which 34 Toolbox for Reducing Atmospheric InSAR Noise – TRAIN contains the associated WIDTH, LENGTH, X_STEP (resolution), Y_STEP(-‐1*resolution), X_FIRST and Y_FIRST (upper left corner of the DEM). X and Y refer to longitude and latitude. The DEM is assumed to be stored as a short 2-‐byte integer. dem_null = -‐32768 The value associated with no data in the DEM region_res = 0.00833 The output resolution in degrees region_lon_range = [] The longitude crop in degrees. Make this slightly bigger than your InSAR region region_lat_range =[] The latitude crop in degrees. Make this slightly bigger than your InSAR region 12.5 Step 2: Computing the WRF tropospheric InSAR delays To compute the interferometric WRF delays type: >> aps_wrf(2,2) The following parameters are used to calculate the interferometric phase delays. Make sure the default values are updated to your region. Parameter and default value Description lambda = 0.0562 The radar wavelength of the SAR satellite in m. This is used to convert the delay towards a phase delay. By default lambda is set to be 0,0562 m. ll_matfile = [pwd 'll.mat'] Full file path of the geo-‐coordinates, stored in a matrix with size [n_points 2] and in its columns the longitude and latitude. look_angle = 21/180*pi or path to file The look angle [rad] used in the projection to the line of sight. By default this is set to 21 degrees. Alternative a file can be specified in which the look angle for each pixel or PS can be given. This needs to be a column vector of size [n_points 1] with the angle in [rad] saved as “la” variable.. 35 Toolbox for Reducing Atmospheric InSAR Noise – TRAIN ifgday_matfile = [pwd 'ifgday.mat'] Full file path to the mat file containing the interferogram dates stored as a matrix with name ifgday and size [n_ifgs 2]. The master image is in the first and slave in the second column respectively. Specify dates a numeric value in YYYYMMDD format. 36 Toolbox for Reducing Atmospheric InSAR Noise – TRAIN 13 Plotting results Results can be plotted in StaMPS using the conventional ps_plot function. In case the data has not been processed in StaMPS one can load the tropospheric corrections from the tca_sb2.mat or tca2.mat files, and plot you own plotting tools. The data is stored in the same format as the definition of the input interferogram, i.e. as a matrix with an interferogram in each column. 13.1 StaMPS plotting NOTE: The current version of StaMPS does not include the latest support for the TRAIN toolbox. A patch is provided online, which will allow users to use the plotting options provided below. To plot only atmosphere the same convention is used as for the phase, where 'a' refers to single master, and 'asb' to small baselines. In addition you will need to specify the correction method. Depending on the chosen processing type use for the following different correction techniques: 'a_e', 'a_w' wet+hydro of ERA, WRF 'a_l' wet+hydro of linear 'a_eh', 'a_wh' hydro of ERA, WRF 'a_p' wet+hydro of powerlaw 'a_ew', 'a_ww' wet of ERA, WRF 'a_m', 'a_M' wet of MERIS, MODIS Examples for the hydrostatic WRF delays for small baselines and single master respectively: >> ps_plot('asb','a_wh',2) >> ps_plot('asb','a_wh',2) The location of the processing type (e.g. 'a_wh') does not matter with respect to the other input arguments of ps_plot. The other ps_plot flag remain valid, e.g. following is identical as above: >> ps_plot('asb',2,0,'a_wh') >> ps_plot('asb',2,0,'a_wh') In StaMPS you can conventionally remove DEM errors, master atmosphere, and ramps by adding respectively 'd', 'm', and 'o' as a minus argument to the phase 'u' and 'usb', or the velocity 'v' and 'V'. Likewise you can do the same for the tropospheric signal as estimated using TRAIN, by stating 'a' as a minus argument. Examples for the WRF delay removed from the velocity. >> ps_plot('v-‐da','a_w') >> ps_plot('v-‐dao','a_w'). To see full functionality type: >> help ps_plot 37 Toolbox for Reducing Atmospheric InSAR Noise – TRAIN Bibliography Walters, R., Elliott, J., Li, Z., & Parsons, B. (2013). Rapid strain accumulation on the Ashkabad fault (Turkmenistan) from atmosphere-‐corrected InSAR, Journal of Geophysical Research, DOI: 10.1002/jgrb.50236. Bekaert, D.P.S., Hooper, A.J., and Wright, T.J. (2015a), A spatially-‐variable power-‐law tropospheric correction technique for InSAR data, JGR, doi:10.1029/2014JB011558 (open acces, download here) Bekaert, D.P.S., Hooper, A.J., and Wright, T.J. (2015b), Reassesing the 2006 Guerrero slow slip event, Mexico: implications for large earthquakes in the Guerrero Gap, JGR, doi:10.1029/2014JB011557 (open access, download here) Li, Z., Fielding, E. J., Cross, P., & Preusker, R. (2009). Advanced InSAR atmospheric correction: MERIS/MODIS combination and stacked water vapour models. International Journal of Remote Sensing, 30(13), 3343-‐3363. doi: 10.1080/01431160802562172 38 Toolbox for Reducing Atmospheric InSAR Noise – TRAIN Version Control Version 1beta: released version −
−
−
−
−
−
−
−
−
−
−
Initial version of the toolbox Updates to the initial chapters add info on installation Significant updating on the MERIS and power law chapters. MERIS codes have been updated to be included on the toolbox. Incorporate ERA-‐I correction technique Incorporate processing structure different from StaMPS for MERIS and ERA-‐I. ERA-‐I script adapted from Richard Walters. Incorporate WRF processing functionality Include submissions by Hannes Bathke to include ERA-‐I ECMWF website data support. This includes file generation, fetching data and data reading. Expand the manual and clean it up. Incorporate more compatibility with non-‐stamps processing. Include ridges based approach for power-‐law. Include MODIS tropospheric correction. This is based on the JPL OSCAR service for downloading and cropping of MODIS data. Include varying conversion factors for each SAR date for the spectrometer options. Re-‐name variables to be more generic for spectrometers. Expand the StaMPS plotting chapter with examples and options. 39


© Copyright 2026