
The Ketogenic Diet: A complete guide for the Dieter and Practitioner Lyle McDonald
The Ketogenic Diet:
A complete guide for
the Dieter and Practitioner
Lyle McDonald
This page intentionally
left blank.
Page down to view The Ketogenic Diet
This book is not intended for the treatment or prevention of disease, nor as a substitute for
medical treatment, nor as an alternative to medical advice. It is a review of scientific evidence
presented for information purposes, to increase public knowledge of the ketogenic diet.
Recommendations outlined herein should not be adopted without a full review of the scientific
references given and consultation with a health care professional. Use of the guidelines herein is
at the sole choice and risk of the reader.
Copyright: © 1998 by Lyle McDonald. All rights reserved.
This book or any part thereof, may not be reproduced or recorded in any form without permission
in writing from the publisher, except for brief quotations embodied in critical articles or reviews.
For information contact: Lyle McDonald, 500 E. Anderson Ln. #121-A, Austin, Tx 78752
ISBN: 0-9671456-0-0
FIRST EDITION
SIXTH PRINTING
3
Acknowledgements
Thanks to Dan Duchaine and Dr. Mauro DiPasquale, and before them Michael Zumpano,
who did the initial work on the ketogenic diet for athletes and got me interested in researching
them. Without their initial work, this book would never have been written.
Special thanks to the numerous individuals on the internet (especially the lowcarb-l list),
who asked me the hard questions and forced me to go look for answers. To those same
individuals, thank you for your patience as I have finished this book.
Extra special thanks go out to my editors, Elzi Volk and Clair Melton. Your input has been
invaluable, and prevented me from being redundant. Thanks also goes out to everybody who has
sent me corrections through the various printings. Even more thanks to Lisa Sporleder, who
provided me valuable input on page layout, and without whom this book would have looked far
worse.
Finally, a special acknowledgement goes to Robert Langford, who developed the 10 day
ketogenic diet cycle which appears on pages 150-151.
4
Introduction
I became interested in the ketogenic diet two and one-half years ago when I used a modified
form (called a cyclical ketogenic diet) to reach a level of leanness that was previously impossible
using other diets. Since that time, I have spent innumerable hours researching the details of the
diet, attempting to answer the many questions which surround it. This book represents the
results of that quest.
The ketogenic diet is surrounded by controversy. Proponents of the ketogenic diet proclaim
it as a magical diet while opponents denounce the diet because of misconceptions about the
physiology involved. As with so many issues of controversy, the reality is somewhere in the
middle. Like most dietary approaches, the ketogenic diet has benefits and drawbacks, all of
which are discussed in this book.
The goal of this book is not to convince nor dissuade individuals to use a ketogenic diet.
Rather, the goal of this book is to present the facts behind the ketogenic diet based on the
available scientific research. While the use of anecdotal evidence is minimized, it is included
where it adds to the information presented.
Guidelines for implementing the ketogenic diet are presented for those individuals who
decide to use it. Although a diet free of carbohydrates is appropriate for individuals who are not
exercising or only performing low-intensity aerobic exercise, it is not appropriate for those
individuals involved in high-intensity exercise. In addition to the standard ketogenic diet, two
modified ketogenic diets are discussed which integrate carbohydrates while maintaining ketosis.
The first of these is the targeted ketogenic diet, which includes the consumption of
carbohydrates around exercise. The second, the cyclical ketogenic diet, alternates a span of
ketogenic dieting with periods of high-carbohydrate consumption. In addition to an examination
of the ketogenic diet, exercise is addressed, especially as it pertains to ketogenic diets and fat loss.
This book is divided into seven parts. Part I includes an introduction to the ketogenic diet
and a history of its development. Part II presents the physiology of fuel utilization in the body,
ketone bodies, the adaptations to ketosis, changes in body composition, and other metabolic
effects which occur as a result of ketosis. Part III discusses the specific diets presented in this
book. This includes a general discussion of dieting principles, including body composition and
metabolic rate, as well as details of how to develop a standard, targeted, and cyclical ketogenic
diet. Part IV completes discussion of the ketogenic diet with chapters on breaking fat loss
plateaus, ending the diet, tools used to enhance the diet, and concerns for individuals considering
using ketogenic diet.
Part V discusses exercise physiology, including aerobic exercise, interval training, and
weight training. Additionally, the effects of exercise on ketosis and fat loss are discussed. Part VI
develops general exercise guidelines based on the information presented in the preceding
chapters. Part VII presents sample exercise programs, as well as guidelines for pre-contest
bodybuilders. Finally, Part VIII discusses the use of supplements on the ketogenic diet, both for
general health as well as specific goals.
This book is meant as a technical reference manual for the ketogenic diet. It includes
5
information that should be useful to the general dieting public, as well as to athletes and
bodybuilders. Hopefully, the attention to technical accuracy will make it useful to researchers
and medical professionals. As such, technical information is necessarily presented although
attempts have been made to minimize highly technical details. Over 600 scientific references
were examined in the writing of this book, and each chapter includes a full bibliography so that
interested readers may obtain more detail when desired. Readers who desire further in-depth
information are encouraged to examine the cited references to educate themselves.
Lyle McDonald
Bio: Lyle McDonald received his B.S. from the University of California at Los Angeles in
physiological sciences. He has written for several publications, including two web magazines
(Cyberpump and Mesomorphosis), two print magazines (Hardgainer and Peak Training Journal),
and two newsletters (Dave’s PowerStore Newsletter and Dirty Dieting).
6
Foreword
REGULATION OF KETOGENESIS
(Sung to the tune of “Clementine”)
In starvation, diabetes, sugar levels under strain
You need fuel to keep going saving glucose for your brain
Ketone bodies, Ketone bodies, both acetoacetate
And its partner on reduction, 3-hydroxybutyrate.
Glucagon’s up, with low glucose, insulin is down in phase
Fatty acids mobilised by hormone-sensitive lipase
Ketone bodies, Ketone bodies, all start thus from white fat cell
Where through lack of glycerol-P, TG making’s down as well.
Fatty acyl, CoA level, makes kinase phosphorylate
Acetyl-CoA carboxy-lase to its inactive state
Ketone bodies, Ketone bodies, because glucagon they say
Also blocks carboxylation, lowers Malonyl-CoA.
Malonyl-CoAs a blocker of the key CPT-1
Blocking’s off so now the shuttle into mito’s is begun
Now we’ve ß oxidation, now we’ve acetyl-CoA
But what’s to stop it’s oxidation via good old TCA?
In starvation, glucose making, stimulating PEP CK
Uses oxaloacetic, also lost another way
Ketone bodies, what is odd is that the oxidation state
Also favours the reduction of OA to make malate.
OA’s low now, citrate synthase, thus loses activity
So the flux into the cycle cuts off (temporarily)
Ketone bodies, Ketone bodies situation thus is this
Acetyl-CoA’s now pouring into Ketogenesis.
It’s a tricky little pathway, it’s got HMG-CoA
In effect it’s condensation in a head-to-tailish way
Ketone bodies, Ketone bodies, note the ratio of the pair
Is controlled by NAD to NADH everywhere.
Don’t despise them, they’re good fuels for your muscles, brain and heart
When you’re bodies overloaded though, that’s when your troubles start
Ketone bodies, ketone bodies, make acetone, lose CO2
You can breath those out, but watch out - acidosis does for you!
© “The Biochemists’ Songbook, 2nd ed.” Harold Baum. London: Taylor and Francis Publishers,
1995. Used with permission.
7
8
Table of contents
Part I: Introduction
19. Interval training
200
206
1. Introduction to the ketogenic diet
11
20. Weight training
2. History of the ketogenic diet
13
21. The effect of exercise
Part II: The physiology of ketosis
on ketosis
225
229
3. Fuel utilization
18
22. Exercise and fat loss
4. Basic ketone body physiology
28
Part VI: Exercise guidelines
5. Adaptations to ketosis
38
23. General exercise guidelines
239
6. Changes in body composition
52
24. Aerobic exercise
241
7. Other effects of the ketogenic diet
71
25. Interval training
245
26. Weight training
248
Part III: The diets
8. General dieting principles
86
Part VII: Exercise programs
9. The standard ketogenic diet (SKD) 101
27. Beginner/intermediate
10. Carbs and the ketogenic diet
28. The advanced CKD workout 266
120
11. The targeted ketogenic diet (TKD) 124
29. Other applications
12. The cyclical ketogenic diet (CKD)
30. Fat loss for pre-competition
128
Part IV: Other topics
bodybuilders
260
270
278
13. Breaking fat loss plateaus
148
Part VIII: Supplements
14. Ending a ketogenic diet
152
31. General supplements
289
15. Tools for the ketogenic diet
158
32. Fat loss
292
16. Final considerations
166
33. The carb-load
302
34. Strength/mass gains
307
Part V: Exercise physiology
Appendices
309
174
Glossary
312
180
Index
314
17. Muscular physiology and
energy production
18. Aerobic exercise
9
Part I
Introduction
Chapter 1: Introduction to the ketogenic diet
Chapter 2: The history of the ketogenic diet
Prior to discussing the details of the ketogenic diet, it is helpful to discuss some
introductory information. This includes a general overview of the ketogenic diet as well as the
history of its development, both for medical conditions as well as for fat loss.
10
Chapter 1:
Introduction to the ketogenic diet
Many readers may not be familiar with the ketogenic diet. This chapter discusses some
general ideas about ketogenic diets, as well as defining terms that may be helpful.
In the most general terms, a ketogenic diet is any diet that causes ketone bodies to be
produced by the liver, shifting the body’s metabolism away from glucose and towards fat
utilization. More specifically, a ketogenic diet is one that restricts carbohydrates below a certain
level (generally 100 grams per day), inducing a series of adaptations to take place. Protein and
fat intake are variable, depending on the goal of the dieter. However, the ultimate determinant of
whether a diet is ketogenic or not is the presence (or absence) of carbohydrates.
Fuel metabolism and the ketogenic diet
Under ‘normal’ dietary conditions, the body runs on a mix of carbohydrates, protein and fat.
When carbohydrates are removed from the diet, the body’s small stores are quickly depleted.
Consequently, the body is forced to find an alternative fuel to provide energy. One of these fuels is
free fatty acids (FFA), which can be used by most tissues in the body. However, not all organs
can use FFA. For example, the brain and nervous system are unable to use FFA for fuel ;
however, they can use ketone bodies.
Ketone bodies are a by-product of the incomplete breakdown of FFA in the liver. They
serve as a non-carbohydrate, fat-derived fuel for tissues such as the brain. When ketone bodies
are produced at accelerated rates, they accumulate in the bloodstream, causing a metabolic
state called ketosis to develop. Simultaneously, there is a decrease in glucose utilization and
production. Along with this, there is a decrease in the breakdown of protein to be used for energy,
referred to as ‘protein sparing’. Many individuals are drawn to ketogenic diets in an attempt to
lose bodyfat while sparing the loss of lean body mass.
Hormones and the ketogenic diet
Ketogenic diets cause the adaptations described above primarily by affecting the levels of
two hormones: insulin and glucagon. Insulin is a storage hormone, responsible for moving
nutrients out of the bloodstream and into target tissues. For example, insulin causes glucose to
be stored in muscle as glycogen, and FFA to be stored in adipose tissue as triglycerides. Glucagon
is a fuel-mobilizing hormone, stimulating the body to break down stored glycogen, especially in the
liver, to provide glucose for the body.
When carbohydrates are removed from the diet, insulin levels decrease and glucagon levels
increase. This causes an increase in FFA release from fat cells, and increased FFA burning in the
liver. The accelerated FFA burning in the liver is what ultimately leads to the production of
ketone bodies and the metabolic state of ketosis. In addition to insulin and glucagon, a number of
11
other hormones are also affected, all of which help to shift fuel use away from carbohydrates and
towards fat.
Exercise and the ketogenic diet
As with any fat-loss diet, exercise will improve the success of the ketogenic diet. However,
a diet devoid of carbohydrates is unable to sustain high-intensity exercise performance although
low-intensity exercise may be performed. For this reason, individuals who wish to use a ketogenic
diet and perform high-intensity exercise must integrate carbohydrates without disrupting the
effects of ketosis.
Two modified ketogenic diets are described in this book which approach this issue from
different directions. The targeted ketogenic diet (TKD) allows carbohydrates to be consumed
immediately around exercise, to sustain performance without affecting ketosis. The cyclical
ketogenic diet (CKD) alternates periods of ketogenic dieting with periods of high-carbohydrate
consumption. The period of high-carbohydrate eating refills muscle glycogen to sustain exercise
performance.
12
Chapter 2:
History of the Ketogenic Diet
Before discussing the theory and metabolic effects of the ketogenic diet, it is useful to
briefly review the history of the ketogenic diet and how it has evolved. There are two primary
paths (and numerous sub-paths) that the ketogenic diet has followed since its inception:
treatment of epilepsy and the treatment of obesity.
Fasting
Without discussing the technical details here, it should be understood that fasting (the
complete abstinence of food) and ketogenic diets are metabolically very similar. The similarities
between the two metabolic states (sometimes referred to as ‘starvation ketosis’ and ‘dietary
ketosis’ respectively) have in part led to the development of the ketogenic diet over the years.
The ketogenic diet attempts to mimic the metabolic effects of fasting while food is being
consumed.
Epilepsy (compiled from references 1-5)
The ketogenic diet has been used to treat a variety of clinical conditions, the most well
known of which is childhood epilepsy. Writings as early as the middle ages discuss the use of
fasting as a treatment for seizures. The early 1900’s saw the use of total fasting as a treatment
for seizures in children. However, fasting cannot be sustained indefinitely and only controls
seizures as long as the fast is continued.
Due to the problems with extended fasting, early nutrition researchers looked for a way to
mimic starvation ketosis, while allowing food consumption. Research determined that a diet high
in fat, low in carbohydrate and providing the minimal protein needed to sustain growth could
maintain starvation ketosis for long periods of time. This led to development of the original
ketogenic diet for epilepsy in 1921 by Dr. Wilder. Dr. Wilder’s ketogenic diet controlled pediatric
epilepsy in many cases where drugs and other treatments had failed. The ketogenic diet as
developed by Dr. Wilder is essentially identical to the diet being used in 1998 to treat childhood
epilepsy.
The ketogenic diet fell into obscurity during the 30’s, 40’s and 50’s as new epilepsy drugs
were discovered. The difficulty in administering the diet, especially in the face of easily prescribed
drugs, caused it to all but disappear during this time. A few modified ketogenic diets, such as the
Medium Chain Triglyceride (MCT) diet, which provided greater food variability were tried but they
too fell into obscurity.
In 1994, the ketogenic diet as a treatment for epilepsy was essentially ‘rediscovered’ in the
story of Charlie, a 2-year-old with seizures that could not be controlled with medications or other
treatment, including brain surgery. Charlie’s father found reference to the ketogenic diet in the
literature and decided to seek more information, ending up at Johns Hopkins medical center.
13
Charlie’s seizures were completely controlled as long as he was on the diet. The amazing
success of the ketogenic diet where other treatments had failed led Charlie’s father to create the
Charlie Foundation, which has produced several videos, published the book “The Epilepsy Diet
Treatment: An introduction to the ketogenic diet”, and has sponsored conferences to train
physicians and dietitians to implement the diet. Although the exact mechanisms of how the
ketogenic diet works to control epilepsy are still unknown , the diet continues to gain acceptance
as an alternative to drug therapy.
Other clinical conditions
Epilepsy is arguably the medical condition that has been treated the most with ketogenic
diets (1-3). However, preliminary evidence suggests that the ketogenic diet may have other
clinical uses including respiratory failure (6), certain types of pediatric cancer (7-10), and possibly
head trauma (11) . Interested readers can examine the studies cited, as this book focuses
primarily on the use of the ketogenic diet for fat loss.
Obesity
Ketogenic diets have been used for weight loss for at least a century, making occasional
appearances into the dieting mainstream. Complete starvation was studied frequently including
the seminal research of Hill, who fasted a subject for 60 days to examine the effects, which was
summarized by Cahill (12). The effects of starvation made it initially attractive to treat morbid
obesity as rapid weight/fat loss would occur. Other characteristics attributed to ketosis, such as
appetite suppression and a sense of well being, made fasting even more attractive for weight loss.
Extremely obese subjects have been fasted for periods up to one year given nothing more than
water, vitamins and minerals.
The major problem with complete starvation is a large loss of body protein, primarily from
muscle tissue. Although protein losses decrease rapidly as starvation continues, up to one half of
the total weight lost during a complete fast is muscle and water, a ratio which is unacceptable.
In the early 70’s, an alternative approach to starvation was developed, termed the Protein
Sparing Modified Fast (PSMF). The PSMF provided high quality protein at levels that would
prevent most of the muscle loss without disrupting the purported ‘beneficial’ effects of starvation
ketosis which included appetite suppression and an almost total reliance on bodyfat and ketones
to fuel the body. It is still used to treat severe obesity but must be medically supervised (13).
At this time, other researchers were suggesting ‘low-carbohydrate’ diets as a treatment for
obesity based on the simple fact that individuals tended to eat less calories (and hence lose
weight/fat) when carbohydrates were restricted to 50 grams per day or less (14,15). There was
much debate as to whether ketogenic diets caused weight loss through some peculiarity of
metabolism, as suggested by early studies, or simply because people ate less.
The largest increase in public awareness of the ketogenic diet as a fat loss diet was due to
“Dr. Atkins Diet Revolution” in the early 1970’s (16). With millions of copies sold, it generated
14
extreme interest, both good and bad, in the ketogenic diet. Contrary to the semi-starvation and
very low calorie ketogenic diets which had come before it, Dr. Atkins suggested a diet limited only
in carbohydrates but with unlimited protein and fat. He promoted it as a lifetime diet which
would provide weight loss quickly, easily and without hunger, all while allowing dieters to eat as
much as they liked of protein and fat. He offered just enough research to make a convincing
argument, but much of the research he cited suffered from methodological flaws.
For a variety of reasons, most likely related to the unsupported (and unsupportable)
claims Atkins made, his diet was openly criticized by the American Medical Association and the
ketogenic diet fell back into obscurity (17). Additionally, several deaths occurring in dieters
following “The Last Chance Diet” - a 300 calorie-per-day liquid protein diet, which bears a
superficial resemblance to the PSMF - caused more outcry against ketogenic diets.
From that time, the ketogenic diet (known by this time as the Atkins diet) all but
disappeared from the mainstream of American dieting consciousness as a high carbohydrate,
lowfat diet became the norm for health, exercise performance and fat loss.
Recently there has been a resurgence in low carbohydrate diets including “Dr. Atkins New
Diet Revolution” (18) and “Protein Power” by the Eades (19) but these diets are aimed primarily
at the typical American dieter, not athletes.
Ketogenic diets and bodybuilders/athletes
Low carbohydrate diets were used quite often in the early years of bodybuilding (the fish
and water diet). As with general fat loss, the use of low carbohydrate, ketogenic diets by athletes
fell into disfavor as the emphasis shifted to carbohydrate based diets.
As ketogenic diets have reentered the diet arena in the 1990’s, modified ketogenic diets
have been introduced for athletes, primarily bodybuilders. These include so-called cyclical
ketogenic diets (CKD’s) such as “The Anabolic Diet” (20) and “Bodyopus” (21).
During the 1980’s, Michael Zumpano and Daniel Duchaine introduced two of the earliest
CKD’s: ‘The Rebound Diet’ for muscle gain, and then a modified version called ‘The Ultimate Diet’
for fat loss. Neither gained much acceptance in the bodybuilding subculture. This was most
likely due to difficulty in implementing the diets and the fact that a diet high in fat went against
everything nutritionists advocated.
In the early 1990’s, Dr. Mauro DiPasquale, a renowned expert on drug use in sports,
introduced “The Anabolic Diet” (AD). This diet alternated periods of 5-6 days of low carbohydrate,
moderate protein, moderate/high fat eating with periods of 1-2 days of unlimited carbohydrate
consumption (20). The major premise of the Anabolic Diet was that the lowcarb week would
cause a ‘metabolic shift’ to occur, forcing the body to use fat for fuel. The high carb consumption
on the weekends would refill muscle carbohydrate stores and cause growth. The carb-loading
phase was necessary as ketogenic diets can not sustain high intensity exercise such as weight
training.
DiPasquale argued that his diet was both anti-catabolic (preventing muscle breakdown) as
well as overtly anabolic (muscle building). His book suffered from a lack of appropriate
references (using animal studies when human studies were available) and drawing incorrect
15
conclusions. As well, his book left bodybuilders with more questions than it provided answers.
A few years later, bodybuilding expert Dan Duchaine released the book “Underground
Bodyopus: Militant Weight Loss and Recomposition” (21). Bodyopus addressed numerous topics
related to fat loss, presenting three different diets. This included his approach to the CKD, which
he called BODYOPUS. BODYOPUS was far more detailed than the Anabolic Diet, giving specific
food recommendations in terms of both quality and quantity. As well, it gave basic workout
recommendations and went into more detail regarding the physiology of the diet.
However, “Bodyopus” left many questions unanswered as evidenced by the numerous
questions appearing in magazines and on the internet. While Duchaine’s ideas were accepted to
a limited degree by the bodybuilding subculture, the lack of scientific references led health
professionals, who still thought of ketogenic diets as dangerous and unhealthy, to question the
diet’s credibility.
A question
Somewhat difficult to understand is why ketogenic diets have been readily accepted as
medical treatment for certain conditions but are so equally decried when mentioned for fat loss.
Most of the criticisms of ketogenic diets for fat loss revolve around the purported negative health
effects (i.e. kidney damage) or misconceptions about ketogenic metabolism (i.e. ketones are made
out of protein).
This begs the question of why a diet presumed so dangerous for fat loss is being used
clinically without problem. Pediatric epilepsy patients are routinely kept in deep ketosis for
periods up to 3 years, and occasionally longer, with few ill effects (3,5). Yet the mention of a brief
stint on a ketogenic diet for fat loss and many people will comment about kidney and liver
damage, ketoacidosis, muscle loss, etc. If these side effects occurred due to a ketogenic diet, we
would expect to see them in epileptic children.
It’s arguable that possible negative effects of a ketogenic diet are more than outweighed by
the beneficial effects of treating a disease or that children adapt to a ketogenic diet differently
than adults. Even then, most of the side effects attributed to ketogenic diets for fat loss are not
seen when the diet is used clinically. The side effects in epileptic children are few in number and
easily treated, as addressed in chapter 7.
References cited
1. “The Epilepsy Diet Treatment: An introduction to the ketogenic diet” John M. Freeman, MD ;
Millicent T. Kelly, RD, LD ; Jennifer B. Freeman. New York: Demos Vermande, 1996.
2. Berryman MS. The ketogenic diet revisited. J Am Diet Assoc (1997) 97: S192-S194.
3. Wheless JW. The ketogenic diet: Fa(c)t or fiction. J Child Neurol (1995) 10: 419-423 .
4. Withrow CD. The ketogenic diet: mechanism of anticonvulsant action. Adv Neurol (1980)
27: 635-642.
5. Swink TD, et. al. The ketogenic diet: 1997. Adv Pediatr (1997) 44: 297-329.
6. Kwan RMF et. al. Effects of a low carbohydrate isoenergetic diet on sleep behavior and
pulmonary functions in healthy female adult humans. J Nutr (1986) 116: 2393-2402.
16
7. Nebeling LC. et. al. Effects of a ketogenic diet on tumor metabolism and nutritional status in
pediatric oncology patients: two case reports. J Am Coll Nutr (1995) 14: 202-208.
8. Nebeling LC and Lerner E. Implementing a ketogenic diet based on medium-chain triglyceride
oil in pediatric patients with cancer. J Am Diet Assoc (1995) 95: 693-697.
9. Fearon KC, et. al. Cancer cachexia: influence of systemic ketosis on substrate levels and
nitrogen metabolism. Am J Clin Nutr (1988) 47:42-48.
10. Conyers RAJ, et. al. Cancer, ketosis and parenteral nutrition. Med J Aust (1979) 1:398-399.
11. Ritter AM. Evaluation of a carbohydrate-free diet for patients with severe head injury. J
Neurotrauma (1996) 13:473-485.
12. Cahill GF and Aoki T.T. How metabolism affects clinical problems. Medical Times (1970)
98: 106-122.
13. Walters JK, et. al. The protein-sparing modified fast for obesity-related medical problems.
Cleveland Clinical J Med (1997) 64: 242-243.
14. Yudkin J and Carey M. The treatment of obesity by a ‘high-fat’ diet - the inevitability of
calories. Lancet (1960) 939-941.
15. Yudkin J. The low-carbohydrate diet in the treatment of obesity. Postgrad Med (1972)
51: 151-154.
16. “Dr. Atkins’ Diet Revolution” Robert Atkins, MD. New York: David McKay Inc.
Publishers, 1972.
17. Council on Foods and Nutrition A critique of low-carbohydrate ketogenic weight reducing
regimes. JAMA (1973) 224: 1415-1419.
18. “Dr. Atkins’ New diet Revolution” Robert Atkins, MD. New York: Avon Publishers, 1992.
19. “Protein Power” Michael R. Eades, MD and Mary Dan Eades, MD. New York: Bantam Books,
1996.
20. “The Anabolic Diet” Mauro DiPasquale, MD. Optimum Training Systems, 1995.
21. “BODYOPUS: Militant fat loss and body recomposition” Dan Duchaine. Nevada: Xipe
Press, 1996.
17
Part II:
The Physiology of Ketosis
Chapter 3: Fuel utilization
Chapter 4: Basic ketone physiology
Chapter 5: Adaptations to ketosis
Chapter 6: Changes in body composition
Chapter 7: Other effects of the ketogenic diet
To address the physiology behind the ketogenic diet, a number of topics must be discussed.
Chapter 3 discusses the utilization of various fuels: glucose, protein, fat, ketones. Although not
specific to the ketogenic diet, this provides the background to understand the following chapters.
Chapters 4 and 5 address the topics of ketone bodies, ketogenesis, as well as the
adaptations which are seen during the ketogenic diet. These two chapters are among the most
technical in the book but are critical to understanding the basis for the ketogenic diet. Many of
the adaptations seen are well-established, others less so. To avoid turning this into an
undergraduate level biochemistry discussion, many of the smaller details have been omitted.
Interested readers are encouraged to examine the references cited, especially the recent review
papers.
Chapter 6 addresses the question of whether a ketogenic diet causes greater, weight,
water, fat, and protein losses compared to a more traditional fat loss diet. Finally, chapter 7
addresses the other metabolic effects which occur during ketosis.
A note on nomenclature: Strictly speaking, the term ‘ketone’ refers to a general class of chemical
compounds. However, the only three ketone bodies we are concerned with are acetoacetate
(AcAc), beta-hydroxybutyrate (BHB) and acetone. To avoid confusion, and since we are only
concerned with these three specific ketone bodies, the terms ketone bodies and ketone(s) are used
interchangeably.
18
Chapter 3:
The basics of fuel utilization
Although this chapter does not discuss the ketogenic diet in great detail, the information
presented is helpful in understanding the following chapters. There are four primary fuels which
can be used in the human body: glucose, protein, free fatty acids, and ketones. These fuels are
stored in varying proportions in the body. Overall, the primary form of stored fuel is triglyceride,
stored in adipose tissue. Glucose and protein make up secondary sources. These fuels are used in
varying proportions depending on the metabolic state of the body.
The primary determinant of fuel utilization in humans is carbohydrate availability, which
affects hormone levels. Additional factors affecting fuel utilization are the status of liver glycogen
(full or empty) as well as the levels of certain enzymes.
Section 1: Bodily Fuel Stores
The body has three storage depots of fuel which it can tap during periods of caloric
deficiency: protein, which can be converted to glucose in the liver and used for energy ;
carbohydrate, which is stored primarily as glycogen in the muscle and liver ; and fat , which is
stored primarily as body fat. A fourth potential fuel is ketones. Under normal dietary conditions,
ketones play a non-existent role in energy production. In fasting or a ketogenic diet, ketones play
a larger role in energy production, especially in the brain. A comparison of the various fuels
available to the body appear in table 1.
Table 1: Comparison of bodily fuels in a 150 lb man with 22% bodyfat
Tissue
Adipose tissue triglyceride
Muscle protein
Carbohydrate stores
Muscle glycogen (normal)
Liver glycogen
Blood glucose
Total carbohydrate stores
Average weight (lbs)
33
13
00.25
00.5
00.04
00.8
Caloric worth (kcal)
135,000
24,000
480
280
80
840
Source: “Textbook of Biochemistry with Clinical Correlations 4th ed.” Ed. Thomas M. Devlin.
Wiley-Liss, 1997.
The main point to take from this chart is that carbohydrate stores are minimal in
comparison to protein and fat, sufficient to sustain roughly one day’s worth of energy. Although
stored protein could conceivably fuel the body for far longer than carbohydrate, excessive protein
losses will eventually cause death. This leaves adipose tissue as the primary depot for long term
energy storage (2). The average person has enough energy stored as bodyfat to exist for weeks or
19
energy storage (2). The average person has enough energy stored as bodyfat to exist for weeks or
months without food intake and obese individuals have been fasted for periods of up to one year.
Section 2: Relationships in fuel use
Looking at table 1, it appears that there are least 4 distinct fuels which the body can use:
glucose, protein, free fatty acids (FFA), and ketones. However when we look at the relationships
between these four fuels, we see that only glucose and FFA need to be considered.
The difference in the proportion of each fuel used will depend on the metabolic state of the
body (i.e. aerobic exercise, weight training, normal diet, ketogenic diet/fasting). Exercise
metabolism is addressed in later chapters and we are only concerned here with the effects of
dietary changes on fuel utilization.
In general, tissues of the body will use a given fuel in proportion to its concentration in the
bloodstream. So if a given fuel (i.e. glucose) increases in the bloodstream, the body will utilize that
fuel in preference to others. By the same token, if the concentrations of a given fuel decrease in
the bloodstream, the body will use less of that fuel. By decreasing carbohydrate availability, the
ketogenic diet shifts the body to using fat as its primary fuel.
Glucose and protein use
When present in sufficient quantities, glucose is the preferred fuel for most tissues in the
body. The major exception to this is the heart, which uses a mix of glucose, FFA and ketones.
The major source of glucose in the body is from dietary carbohydrate. However, other
substances can be converted to glucose in the liver and kidney through a process called
gluconeogenesis (‘gluco’ = glucose, ‘neo’ = new, ‘genesis’ = the making). This includes certain
amino acids, especially alanine and glutamine.
With normal glucose availability, there is little gluconeogenesis from the body’s protein
stores. This has led many to state that carbohydrate has a ‘protein sparing’ effect in that it
prevents the breakdown of protein to make glucose. While it is true that a high carbohydrate
intake can be protein sparing, it is often ignored that this same high carbohydrate also decreases
the use of fat for fuel. Thus in addition to being ‘protein sparing’, carbohydrate is also ‘fat sparing’
(3).
If glucose requirements are high but glucose availability is low, as in the initial days of
fasting, the body will break down its own protein stores to produce glucose. This is probably the
origin of the concept that low carbohydrate diets are muscle wasting. As discussed in the next
chapter, an adequate protein intake during the first weeks of a ketogenic diet will prevent muscle
loss by supplying the amino acids for gluconeogenesis that would otherwise come from body
proteins.
By extension, under conditions of low glucose availability, if glucose requirements go down
due to increases in alternative fuels such as FFA and ketones, the need for gluconeogenesis from
protein will also decrease. The circumstances under which this occurs are discussed below.
20
Since protein breakdown is intimately related to glucose requirements and availability, we
can effectively consider these two fuels together. Arguably the major adaptation to the ketogenic
diet is a decrease in glucose use by the body, which exerts a protein sparing effect (2). This is
discussed in greater detail in chapter 5.
Free Fatty Acids (FFA) and ketones
Most tissues of the body can use FFA for fuel if it is available. This includes skeletal
muscle, the heart, and most organs. However, there are other tissues such as the brain, red
blood cells, the renal medulla, bone marrow and Type II muscle fibers which cannot use FFA and
require glucose (2).
The fact that the brain is incapable of using FFA for fuel has led to one of the biggest
misconceptions about human physiology: that the brain can only use glucose for fuel. While it is
true that the brain normally runs on glucose, the brain will readily use ketones for fuel if they are
available (4-6).
Arguably the most important tissue in terms of ketone utilization is the brain which can
derive up to 75% of its total energy requirements from ketones after adaptation (4-6). In all
likelihood, ketones exist primarily to provide a fat-derived fuel for the brain during periods when
carbohydrates are unavailable (2,7).
As with glucose and FFA, the utilization of ketones is related to their availability (7).
Under normal dietary conditions, ketone concentrations are so low that ketones provide a
negligible amount of energy to the tissues of the body (5,8). If ketone concentrations increase,
most tissues in the body will begin to derive some portion of their energy requirements from
ketones (9). Some research also suggests that ketones are the preferred fuel of many tissues (9).
One exception is the liver which does not use ketones for fuel, relying instead on FFA (7,10,11).
By the third day of ketosis, all of the non-protein fuel is derived from the oxidation of FFA
and ketones (12,13). As ketosis develops, most tissues which can use ketones for fuel will stop
using them to a significant degree by the third week (7,9). This decrease in ketone utilization
occurs due to a down regulation of the enzymes responsible for ketone use and occurs in all
tissues except the brain (7). After three weeks, most tissues will meet their energy requirements
almost exclusively through the breakdown of FFA (9). This is thought to be an adaptation to
ensure adequate ketone levels for the brain.
Except in the case of Type I diabetes, ketones will only be present in the bloodstream
under conditions where FFA use by the body has increased. For all practical purposes we can
assume that a large increase in FFA use is accompanied by an increase in ketone utilization and
these two fuels can be considered together.
Relationships between carbohydrates and fat
Excess dietary carbohydrates can be converted to fat in the liver through a process called
de novo lipognesis (DNL). However short term studies show that DNL does not contribute
21
significantly to fat gain in humans. As long as muscle and liver glycogen stores are not
completely filled, the body is able to store or burn off excess dietary carbohydrates. Of course
this process occurs at the expense of limiting fat burning, meaning that any dietary fat which is
ingested with a high carbohydrate intake is stored as fat.
Under certain circumstances, excess dietary carbohydrate can go through DNL, and be
stored in fat cells although the contribution to fat gain is thought to be minimal (14). Those
circumstances occur when muscle and liver glycogen levels are filled and there is an excess of
carbohydrate being consumed.
The most likely scenario in which this would occur would be one in which an individual was
inactive and consuming an excess of carbohydrates/calories in their diet. As well, the
combination of inactivity with a very high carbohydrate AND high fat diet is much worse in
terms of fat gain. With chronically overfilled glycogen stores and a high carbohydrate intake, fat
utilization is almost completely blocked and any dietary fat consumed is stored.
This has led some authors to suggest an absolute minimization of dietary fat for weight
loss (15,16). The premise is that, since incoming carbohydrate will block fat burning by the body,
less fat must be eaten to avoid storage. The ketogenic diet approaches this problem from the
opposite direction. By reducing carbohydrate intake to minimum levels, fat utilization by the
body is maximized.
Summary
From the above discussion, we can represent the body’s overall use of fuel as:
Total energy requirements = glucose + FFA
Therefore if energy requirements stay the same, a decrease in the use of glucose will
increase the use of FFA for fuel. By corollary, an increase in the body’s ability to use FFA for fuel
will decrease the need for glucose by the body. This relationship between glucose and FFA was
termed the glucose-FFA Cycle by Randle almost 30 years ago (17,18).
Section 3: Factors influencing fuel utilization
There are several factors which affect the mix of fuels used by the body. The primary
factor is the amount of each nutrient (protein, carbohydrate, fat and alcohol) being consumed and
this impacts on the other three factors (16). The second determinant is the levels of hormones
such as insulin and glucagon, which are directly related to the mix of foods being consumed. Third
is the bodily stores of each nutrient including fat stores and muscle/liver glycogen. Finally the
levels of regulatory enzymes for glucose and fat breakdown, which are beyond our control except
through changes in diet and activity, determine the overall use of each fuel. Each of these factors
are discussed in detail below.
Quantity of nutrients consumed
22
Quantity of nutrients consumed
There are four substances which man can derive calories from: carbohydrate, protein, fats,
and alcohol. As stated above, the body will tend to utilize a given fuel for energy in relation to its
availability and concentration in the bloodstream.
In general, the body can increase or decrease its use of glucose in direct proportion to the
amount of dietary carbohydrate being consumed. This is an attempt to maintain body glycogen
stores at a certain level (19). If carbohydrate consumption increases, carbohydrate use will go
up and vice versa.
Protein is slightly less regulated (16). When protein intake goes up, protein oxidation will
also go up to some degree. By the same token, if protein intake drops, the body will use less
protein for fuel. This is an attempt to maintain body protein stores at constant levels.
In contrast, the amount of dietary fat being eaten does not significantly increase the
amount of fat used for fuel by the body. Rather fat oxidation is determined indirectly: by alcohol
and carbohydrate consumption (15).
The consumption of alcohol will almost completely impair the body’s use of fat for fuel.
Similarly the consumption of carbohydrate affects the amount of fat used by the body for fuel. A
high carbohydrate diet decreases the use of fat for fuel and vice versa (15). Thus, the greatest
rates of fat oxidation will occur under conditions when carbohydrates are restricted. As well, the
level of muscle glycogen regulates how much fat is used by the muscle (20,21), a topic discussed
in chapter 18. Using exercise and/or carbohydrate restriction to lower muscle and liver glycogen
levels increases fat utilization (22).
Hormone levels
There are a host of regulatory hormones which determine fuel use in the human body. The
primary hormone is insulin and its levels, to a great degree, determine the levels of other
hormones and the overall metabolism of the body (2,16,23). A brief examination of the major
hormones involved in fuel use appears below.
Insulin is a peptide (protein based) hormone released from the pancreas, primarily in
response to increases in blood glucose. When blood glucose increases, insulin levels increase as
well, causing glucose in the bloodstream to be stored as glycogen in the muscle or liver. Excess
glucose can be pushed into fat cells for storage (as alpha-glycerophosphate). Protein synthesis is
stimulated and free amino acids (the building blocks of proteins) are be moved into muscle cells
and incorporated into larger proteins. Fat synthesis (called lipogenesis) and fat storage are both
stimulated. FFA release from fat cells is inhibited by even small amounts of insulin.
The primary role of insulin is to keep blood glucose in the fairly narrow range of roughly 80120 mg/dl. When blood glucose increases outside of this range, insulin is released to lower blood
glucose back to normal. The greatest increase in blood glucose levels (and the greatest increase
in insulin) occurs from the consumption of dietary carbohydrates. Protein causes a smaller
increase in insulin output because some individual amino acids can be converted to glucose. FFA
can stimulate insulin release as can high concentrations of ketone bodies although to a much
lesser degree than carbohydrate or protein. This is discussed in chapter 4.
23
When blood glucose drops (during exercise or with carbohydrate restriction), insulin levels
generally drop as well. When insulin drops and other hormones such as glucagon increase, the
body will break down stored fuels. Triglyceride stored in fat cells is broken down into FFA and
glycerol and released into the bloodstream. Proteins may be broken down into individual amino
acids and used to produce glucose. Glycogen stored in the liver is broken down into glucose and
released into the bloodstream (2). These substances can then be used for fuel in the body.
An inability to produce insulin indicates a pathological state called Type I diabetes (or
Insulin Dependent Diabetes Mellitus, IDDM). Type I diabetics suffer from a defect in the
pancreas leaving them completely without the ability to make or release insulin. IDDM diabetics
must inject themselves with insulin to maintain blood glucose within normal levels. This will
become important when the distinction between diabetic ketoacidosis and dietary induced ketosis
is made in the next chapter.
Glucagon is essentially insulin’s mirror hormone and has essentially opposite effects. Like
insulin, glucagon is also a peptide hormone released from the pancreas and its primary role is also
to maintain blood glucose levels. However, glucagon acts by raising blood glucose when it drops
below normal.
Glucagon’s main action is in the liver, stimulating the breakdown of liver glycogen which is
then released into the bloodstream. Glucagon release is stimulated by a variety of stimuli
including a drop in blood glucose/insulin, exercise, and the consumption of a protein meal (24).
High levels of insulin inhibit the pancreas from releasing glucagon.
Under normal conditions, glucagon has very little effect in tissues other than the liver (i.e.
fat and muscle cells). However, when insulin is very low, as occurs with carbohydrate restriction
and exercise, glucagon plays a minor role in muscle glycogen breakdown as well as fat
mobilization. In addition to its primary role in maintaining blood glucose under conditions of low
blood sugar, glucagon also plays a pivotal role in ketone body formation in the liver, discussed in
detail in the next chapter.
From the above descriptions, it should be clear that insulin and glucagon play antagonistic
roles to one another. Whereas insulin is primarily a storage hormone, increasing storage of
glucose, protein and fat in the body ; glucagon’s primary role is to mobilize those same fuel stores
for use by the body.
As a general rule, when insulin is high, glucagon levels are low. By the same token, if
insulin levels decrease, glucagon will increase. The majority of the literature (especially as it
pertains to ketone body formation) emphasizes the ratio of insulin to glucagon, called the
insulin/glucagon ratio (I/G ratio), rather than absolute levels of either hormone. This ratio is an
important factor in the discussion of ketogenesis in the next chapter. While insulin and glucagon
play the major roles in determining the anabolic or catabolic state of the body, there are several
other hormones which play additional roles. They are briefly discussed here.
Growth hormone (GH) is another peptide hormone which has numerous effects on the
body, both on tissue growth as well as fuel mobilization. GH is released in response to a variety of
stressors the most important of which for our purposes are exercise, a decrease in blood glucose,
and carbohydrate restriction or fasting. As its name suggests, GH is a growth promoting
hormone, increasing protein synthesis in the muscle and liver. GH also tends to mobilize FFA
from fat cells for energy.
24
In all likelihood, most of the anabolic actions of GH are mediated through a class of
hormones called somatomedins, also called insulin-like growth factors (IGFs). The primary IGF
in the human body is insulin like growth factor-1 (IGF-1) which has anabolic effects on most
tissues of the body. GH stimulates the liver to produce IGF-1 but only in the presence of insulin.
High GH levels along with high insulin levels (as would be seen with a protein and
carbohydrate containing meal) will raise IGF-1 levels as well as increasing anabolic reactions in
the body. To the contrary, high GH levels with low levels of insulin, as seen in fasting or
carbohydrate restriction, will not cause an increase in IGF-1 levels. This is one of the reasons
that ketogenic diets are not ideal for situations requiring tissue synthesis, such as muscle growth
or recovery from certain injuries: the lack of insulin may compromise IGF-1 levels as well as
affecting protein synthesis.
There are two thyroid hormones, thyroxine (T4) and triiodothyronine (T3). Both are
released from the thyroid gland in the ratio of about 80% T4 and 20% T3. In the human body, T4
is primarily a storage form of T3 and plays few physiological roles itself. The majority of T3 is not
released from the thyroid gland but rather is converted from T4 in other tissues, primarily the
liver. Although thyroid hormones affect all tissues of the body, we are primarily concerned with
the effects of thyroid on metabolic rate and protein synthesis. The effects of low-carbohydrate
diets on levels of thyroid hormones as well as their actions are discussed in chapter 5.
Cortisol is a catabolic hormone released from the adrenal cortex and is involved in many
reactions in the body, most related to fuel utilization. Cortisol is involved in the breakdown of
protein to glucose as well as being involved in fat breakdown.
Although cortisol is absolutely required for life, an excess of cortisol (caused by stress and
other factors) is detrimental in the long term, causing a continuous drain on body proteins
including muscle, bone, connective tissue and skin. Cortisol tends to play a permissive effect in
its actions, allowing other hormones to work more effectively.
Adrenaline and noradrenaline (also called epinephrine and norepinephrine) are frequently
referred to as ‘fight or flight’ hormones. They are generally released in response to stress such as
exercise, cold, or fasting. Epinephrine is released primarily from the adrenal medulla, traveling in
the bloodstream to exert its effects on most tissues in the body. Norepinephrine is released
primarily from the nerve terminals, exerting its effects only on specific tissues of the body.
The interactions of the catecholamines on the various tissues of the body are quite
complex and beyond the scope of this book. The primary role that the catecholamines have in
terms of the ketogenic diet is to stimulate free fatty acid release from fat cells.
When insulin levels are low, epinephrine and norepinephrine are both involved in fat
mobilization. In humans, only insulin and the catecholamines have any real effect on fat
mobilization with insulin inhibiting fat breakdown and the catecholamines stimulating fat
breakdown.
Liver glycogen
The liver is one of the most metabolically active organs in the entire body. All foods coming
through the digestive tract are processed initially in the liver. To a great degree, the level of liver
25
glycogen is the key determinant of the body’s overall trend to store or breakdown nutrients (25).
Additionally, high levels of liver glycogen tends to be associated with higher bodyfat levels (19).
The liver is basically a short term storehouse for glycogen which is used to maintain blood
glucose. The breakdown of liver glycogen to glucose, to be released into the bloodstream, is
stimulated by an increase in glucagon as discussed previously.
When liver glycogen is full, blood glucose is maintained and the body is generally anabolic,
which means that incoming glucose, amino acids and free fatty acids are stored as glycogen,
proteins, and triglycerides respectively. This is sometimes called the ‘fed’ state (1).
When liver glycogen becomes depleted, via intensive exercise or the absence of dietary
carbohydrates, the liver shifts roles and becomes catabolic. Glycogen is broken into glucose,
proteins are broken down into amino acids, and triglycerides are broken down to free fatty acids.
This is sometimes called the ‘fasted’ state (1).
If liver glycogen is depleted sufficiently, blood glucose drops and the shift in insulin and
glucagon occurs. This induces ketone body formation, called ketogenesis, and is discussed in the
next chapter.
Enzyme levels
The final regulator of fuel use in the body is enzyme activity. Ultimately enzyme levels are
determined by the nutrients being ingested in the diet and the hormonal levels which result.
For example, when carbohydrates are consumed and insulin is high, the enzymes involved
in glucose use and glycogen storage are stimulated and the enzymes involved in fat breakdown
are inhibited. By the same token, if insulin drops the enzymes involved in glucose use are
inhibited and the enzymes involved in fat breakdown will increase.
Long term adaptation to a high carbohydrate or low carbohydrate diet can cause longer
term changes in the enzymes involved in fat and carbohydrate use as well. If an individual
consumes no carbohydrates for several weeks, there is a down regulation of enzymes in the liver
and muscle which store and burn carbohydrates (1,17,18). The end result of this is an inability to
use carbohydrates for fuel for a short period of time after they are reintroduced to the diet.
Summary
Although there are four major fuels which the body can use, for our purposes only the
interactions between glucose and free fatty acids need to be considered. As a general rule,
assuming that the body’s total energy requirements stay the same, an increase in glucose use by
the body will result in a decrease in the use of fatty acids and vice versa.
There are four major factors that regulate fuel use by the body. Ultimately they are all
determined by the intake of dietary carbohydrates. When carbohydrate availability is high,
carbohydrate use and storage is high and fat use is low. When carbohydrate availability is low,
carbohydrate use and storage is low and fat use is high.
The most basic premise of the ketogenic diet is that the body can be forced to burn greater
amounts of fat by decreasing its use of glucose. The adaptations which occur in the body as well
as the processes involved are discussed in the next chapter.
26
References Cited
1. “Textbook of Biochemistry with Clinical Correlations 4th ed.” Ed. Thomas M. Devlin.
Wiley-Liss, 1997.
2. Cahill G. Starvation in man. N Engl J Med (1970) 282: 668-675
3. “Textbook of Medical Physiology” Arthur C. Guyton. W.B. Saunders Company, 1996.
4. Owen O.E. et. al. Brain metabolism during fasting. J Clin Invest (1967) 10: 1589-1595.
5. Sokoloff L. Metabolism of ketone bodies by the brain. Ann Rev Med (1973) 24: 271-280.
6. Cahill G. Ketosis. Kidney International (1981) 20: 416-425.
7. Mitchell GA et. al. Medical aspects of ketone body metabolism. Clinical & Investigative
Medicine (1995) 18: 193-216.
8. Swink TD et. al. The ketogenic diet: 1997. Adv Pediatr (1997) 44: 297-329.
9. Robinson AM and Williamson DH. Physiological roles of ketone bodies as substrates and
signals in mammalian tissues. Physiol Rev (1980) 60: 143-187.
10. Nosadini R. et. al. Ketone body metabolism: A physiological and clinical overview.
Diabet/Metab Rev (1989) 5: 299-319.
11. Krebs HA et. al. The role of ketone bodies in caloric homeostasis. Adv Enzym Regul (1971)
9: 387-409.
12. Elia M. et. al. Ketone body metabolism in lean male adults during short-term starvation, with
particular reference to forearm muscle metabolism. Clinical Science (1990) 78: 579-584.
13. Owen OE et. al. Protein, fat and carbohydrate requirements during starvation: anaplerosis
and cataplerosis. Am J Clin Nutr (1998) 68: 12-34.
14. Hellerstein M. Synthesis of fat in response to alterations in diet: insights from new stable
isotope methodologies. Lipids (1996) 31 (suppl) S117-S125.
15. Flatt JP. Use and storage of carbohydrate and fat. Am J Clin Nutr (1995) 61(suppl):
952S-959S.
16. Flatt JP. McCollum Award Lecture, 1995: Diet, lifestyle, and weight maintenance. Am J Clin
Nutr (1995) 62: 820-836.
17. Randle PJ. Metabolic fuel selection: general integration at the whole-body level. Proc Nutr
Soc (1995) 54: 317-327.
18. Randle PJ et. al. Glucose fatty acid interactions and the regulation of glucose disposal. J Cell
Biochem (1994) 55 (suppl): 1-11.
19. Flatt JP. Glycogen levels and obesity. Int J Obes (1996) 20 (suppl): S1-S11.
20. Schrauwen P, et. al. Role of glycogen-lowering exercise in the change of fat oxidation in
response to a high-fat diet. Am J Physiol (1997) 273:E623-E629
21. Schrauwen P, et al. Fat balance in obese subjects: role of glycogen stores. Am J Physiol.
(1998) 274: E1027-E1033.
22. Flatt JP. Integration of the overall response to exercise. Int J Obes (1995) 19 (suppl):
S31-S40.
23. Cahill GF Jr. et. al. Hormone-fuel relationships during fasting. J Clin Invest (1966) 45:
1751-1769
24. Cahill GF. Banting Memorial Lecture 1971: Physiology of insulin in man. Diabetes (1971)
20: 785.
25. Foster D. Banting Lecture 1984 - From Glycogen to Ketones - and Back. Diabetes (1984) 33:
1188-1199.
27
Chapter 4:
Basic ketone physiology
To understand the adaptations which occur as a result of ketosis, it is necessary to
examine the physiology behind the production of ketone bodies in the liver. As well, an
examination of what ketone bodies are and what ketosis represents is necessary. Finally,
concerns about ketoacidosis as it occurs in diabetics are addressed.
Section 1: Ketone bodies
What are ketone bodies?
The three ketone bodies are acetoacetate (AcAc), beta-hydroxybutyrate (BHB) and
acetone. AcAc and BHB are produced from the condensation of acetyl-CoA, a product of
incomplete breakdown of free fatty acids (FFA) in the liver. While ketones can technically be
made from certain amino acids, this is not thought to contribute significantly to ketosis (1).
Roughly one-third of AcAc is converted to acetone, which is excreted in the breath and urine.
This gives some individuals on a ketogenic diet a ‘fruity’ smelling breath.
As a side note, urinary and breath excretion of acetone is negligible in terms of caloric loss,
amounting to a maximum of 100 calories per day (2). The fact that ketones are excreted through
this pathway has led some authors to argue that fat loss is being accomplished through urination
and breathing. While this may be very loosely true, in that ketones are produced from the
breakdown of fat and energy is being lost through these routes, the number of calories lost per
day will have a minimal effect on fat loss.
Functions of ketones in the body
Ketones serve a number of functions in the body. The primary role, and arguably the most
important to ketogenic dieters, is to replace glucose as a fat-derived fuel for the brain (3,4). A
commonly held misconception is that the brain can only use glucose for fuel. Quite to the
contrary, in situations where glucose availability is limited, the brain can derive up to 75% of its
total energy requirements from ketone bodies (3).
Ketones also decrease the production of glucose in the liver (5-7) and some researchers
have suggested that ketones act as a ‘signal’ to bodily tissues to shift fuel use away from glucose
and towards fat (6). These effects should be seen as a survival mechanism to spare what little
glucose is available to the body. The importance of ketones as a brain fuel are discussed in more
detail in the next chapter.
A second function of ketones is as a fuel for most other tissues in the body. By shifting the
entire body’s metabolism from glucose to fat, what glucose is available is conserved for use by the
28
brain (see chapter 5 for more detail) (6). While many tissues of the body (especially muscle) use
a large amount of ketones for fuel during the first few weeks of a ketogenic diet, most of these
same tissues will decrease their use of ketones as the length of time in ketosis increases (4). At
this time, these tissues rely primarily on the breakdown of free fatty acids (FFA). In practical
terms, after three weeks of a ketogenic diet, the use of ketones by tissues other than the brain is
negligible and can be ignored.
A potential effect of ketones (discussed further in chapter 5) is to inhibit protein
breakdown during starvation through several possible mechanisms, discussed in detail in the next
chapter. The only other known function of ketones is as a precursor for lipid synthesis in the
brain of neonates (4).
Section 2: Ketogenesis and the two site model
The formation of ketone bodies, called ketogenesis, is at the heart of the ketogenic diet and
the processes involved need to be understood. As described in the previous chapter, the primary
regulators of ketone body formation are the hormones insulin and glucagon. The shift that occurs
in these two hormones, a decrease in insulin and an increase in glucagon is one of the major
regulating steps regulating ketogenesis.
A great amount of research has been performed to determine exactly what is involved in
ketogenesis. All the research has led to a model involving two sites: the fat cell and the liver. In
addition, the enzyme mitochondrial HMG CoA reductase (MHS) has been suggested as a third
site of regulation (4,8). For our purposes, MHS and its effects are unimportant so we will focus
only on the first two sites of regulation: the fat cell and the liver.
The fat cell
As discussed in the previous chapter, the breakdown of fat in fat cells, is determined
primarily by the hormones insulin and the catecholamines. When insulin is high, free fatty acid
mobilization is inhibited and fat storage is stimulated through the enzyme lipoprotein lipase
(LPL). When insulin decreases, free fatty acids (FFA) are mobilized both due to the absence of
insulin as well as the presence of lipolytic (fat mobilizing) hormones such as the catecholamines
(9,10). Glucagon, cortisol and growth hormone play additional but minor roles.
Insulin has a much stronger anti-lipolytic effect than the catecholamines have a lipolytic
effect. If insulin is high, even though catecholamines are high as well, lipolysis is blocked. It is
generally rare to have high levels of both insulin and catecholamines in the body. This is because
the stimuli to raise catecholamine levels, such as exercise, tend to lower insulin and vice versa.
Breakdown and transport of Triglyceride (11)
When the proper signal reaches the fat cell, stored triglyceride (TG) is broken down into
glycerol and three free fatty acid (FFA) chains. FFA travels through the bloodstream, bound to a
29
protein called albumin. Once in the bloodstream, FFA can be used for energy production by most
tissues of the body, with the exception of the brain and a few others.
FFA’s not used for energy by other tissues will reach the liver and be oxidized (burned)
there. If there is sufficient FFA and the liver is prepared to produce ketone bodies, ketones are
produced and released into the bloodstream.
The fat cell should be considered one regulatory site for ketone body formation in that a
lack of adequate FFA will prevent ketones from being made in the liver. That is, even if the liver
is in a mode to synthesize ketone bodies, a lack of FFA will prevent the development of ketosis.
The liver
The liver is always producing ketones to some small degree and they are always present in
the bloodstream. Under normal dietary conditions, ketone concentrations are simply too low to
be of any physiological consequence. A ketogenic diet increases the amount of ketones which are
produced and the blood concentrations seen. Thus ketones should not be considered a toxic
substance or a byproduct of abnormal human metabolism. Rather, ketones are a normal
physiological substance that plays many important roles in the human body.
The liver is the second site involved in ketogenesis and arguably the more important of the
two. Even in the presence of high FFA levels, if the liver is not in a ketogenic mode, ketones will
not be produced.
The major determinant of whether the liver will produce ketone bodies is the amount of
liver glycogen present (8). The primary role of liver glycogen is to maintain normal blood glucose
levels. When dietary carbohydrates are removed from the diet and blood glucose falls, glucagon
signals the liver to break down its glycogen stores to glucose which is released into the
bloodstream. After approximately 12-16 hours, depending on activity, liver glycogen is almost
completely depleted. At this time, ketogenesis increases rapidly. In fact, after liver glycogen is
depleted, the availability of FFA will determine the rate of ketone production. (12)
The Insulin/Glucagon ratio
With the two regulating sites of ketogenesis discussed, we can return to the discussion of
insulin and glucagon and their role in establishing ketosis. When carbohydrates are consumed,
insulin levels are high and glucagon levels are low. Glycogen storage is stimulated and fat
synthesis in the liver will occur. Fat breakdown is inhibited both in the fat cell as well as in the
liver (8).
When carbohydrates are removed from the diet, liver glycogen will eventually be emptied
as the body tries to maintain blood glucose levels. Blood glucose will drop as liver glycogen is
depleted. As blood glucose decreases, insulin will decrease and glucagon will increase. Thus there
is an overall decrease in the insulin/glucagon ratio (I/G ratio) (8,14).
As insulin drops, FFA are mobilized from the fat cell, providing adequate substrate for the
liver to make ketones. Since liver glycogen is depleted, CPT-1 becomes active, burning the
incoming FFA, which produces acetyl-CoA. Acetyl-CoA accumulates as discussed in the section
30
above and is condensed into ketones.
The liver has the capacity to produce from 115 to 180 grams of ketones per day once
ketogenesis has been initiated (4,15-17). Additionally, the liver is producing ketones at a maximal
rate by the third day of carbohydrate restriction (16). It appears that once the liver has become
ketogenic, the rate of ketone body formation is determined solely by the rate of incoming FFA
(12). This will have implications for the effects of exercise on levels of ketosis (see chapter 21 for
more details). Figure 1 graphically illustrates the 2 site model of ketogenesis.
Figure 1: The two site model of ketogenesis
Liver
Blood
Fat cell
FFA
FFA
Triglyceride
Ketones
Insulin
Glucagon
Summary
The production of ketone bodies in the liver requires a depletion of liver glycogen and a
subsequent fall in malonyl-CoA concentrations allowing the enzyme carnitine palmityl tranferase
I (CPT-1) to become active. CPT-1 is responsible for carrying free fatty acids into the
mitochondria to be burned. At the same time CPT-1 is becoming active, a drop in blood glucose
causes a decrease in the insulin/glucagon ratio allowing free fatty acids to be mobilized from fat
cells to provide the liver with substrate for ketone body formation.
Technical note: Malonyl-CoA and Carnitine Palmityl Transferase-1 (CPT-1)
Rather than liver glycogen per se, the primary regulator of ketogenesis in the liver is a
substance called malonyl-CoA (8,13). Malonyl-CoA is an intermediate in fat synthesis which
is present in high amounts when liver glycogen is high. When the liver is full of glycogen, fat
synthesis (lipogenesis) is high and fat breakdown (lipolysis) is low (8).
Malonyl-CoA levels ultimately determine whether the liver begins producing ketone
bodies or not. This occurs because malonyl-CoA inhibits the action of an enzyme called
carnitine palmityl tranferase 1 (CPT-1) both in the liver and other tissues such as muscle
(8,13).
CPT-1 is responsible for transporting FFA into the mitochondria to be burned. As FFA
are burned, a substance called acetyl-CoA is produced. When carbohydrate is available,
acetyl-CoA is used to produce more energy in the Krebs cycle. When carbohydrate is not
available, acetyl-CoA cannot enter the Krebs cycle and will accumulate in the liver (figure 2).
As Malonyl-CoA levels drop and CPT-1 becomes active, FFA oxidation occurs rapidly
causing an increase in the level of acetyl-CoA. As discussed in the next section, when acetyl31
CoA levels increase to high levels, they are condensed into acetoacetic acid which can further
be converted to beta-hydroxybutyrate and acetone, the three major ketone bodies.
Figure 2: Interrelationship between Malonyl-CoA and CPT-1
Glycogen
FFA
Malonyl CoA
(inhibits)
CPT-1
(stimulates)
Acetyl-CoA
Acetoacetate
Krebs Cycle
Acetone
Beta-hydroxybutyrate
Section 3: Ketosis and Ketoacidosis
Having discussed the mechanisms behind ketone body production, we can now examine
the metabolic state of ketosis, and what it represents. Additionally, ketosis is contrasted to
runaway diabetic ketoacidosis.
What is ketosis?
Ketosis is the end result of a shift in the insulin/glucagon ratio and indicates an overall shift
from a glucose based metabolism to a fat based metabolism. Ketosis occurs in a number of
physiological states including fasting (called starvation ketosis), the consumption of a high fat
diet (called dietary ketosis), and immediately after exercise (called post-exercise ketosis). Two
pathological and potentially fatal metabolic states during which ketosis occurs are diabetic
ketoacidosis and alcoholic ketoacidosis.
The major difference between starvation, dietary and diabetic/alcoholic ketoacidosis is in
the level of ketone concentrations seen in the blood. Starvation and dietary ketosis will normally
not progress to dangerous levels, due to various feedback loops which are present in the body
(12). Diabetic and alcoholic ketoacidosis are both potentially fatal conditions (12).
All ketotic states ultimately occur for the same reasons. The first is a reduction of the
hormone insulin and an increase in the hormone glucagon both of which are dependent on the
depletion of liver glycogen. The second is an increase in FFA availability to the liver, either from
dietary fat or the release of stored bodyfat.
Under normal conditions, ketone bodies are present in the bloodstream in minute amounts,
approximately 0.1 mmol/dl (1,6). When ketone body formation increases in the liver, ketones
begin to accumulate in the bloodstream. Ketosis is defined clinically as a ketone concentration
above 0.2 mmol/dl (6). Mild ketosis, around 2 mmol, also occurs following aerobic exercise. (4).
The impact of exercise on ketosis is discussed in chapter 21.
32
Ketoacidosis is defined as any ketone concentration above 7 mmol/dl. Diabetic and
alcoholic ketoacidosis result in ketone concentrations up to 25 mmol (6). This level of ketosis will
never occur in non-diabetic or alcoholic individuals (12). A summary of the different ketone body
concentrations appears in table 1.
Table 1: Comparison of ketone concentrations under different conditions
Metabolic state
Mixed diet
Ketosis
Fasting 2-3 days
Post-exercise
Fasting 1 week
Ketogenic diet
Fasting 3-4 weeks
Ketoacidosis
Diabetic ketoacidosis
Ketone body concentration (mmol/dl)
0.1
0.2
1
Up to 2
5
5-6
6-8
8+
Up to 25
Note: Ketone body concentrations are higher in fasting than during a ketogenic diet due to the
slight insulin response from eating.
Data is from Mitchell GA et al. Medical aspects of ketone body metabolism. Clinical &
Investigative Medicine (1995) 18:193-216 ; and Robinson AM and Williamson DH. Physiological
roles of ketone bodies as substrates and signals in mammalian tissues. Physiol Rev (1980) 60:
143-187.
Ketonemia and ketonuria
The general metabolic state of ketosis can be further subdivided into two categories. The
first is ketonemia which describes the buildup of ketone bodies in the bloodstream. Technically
ketonemia is the true indicator that ketosis has been induced. However the only way to measure
the level of ketonemia is with a blood test which is not practical for ketogenic dieters.
The second subdivision is ketonuria which describes the buildup and excretion of ketone
bodies in the urine, which occurs due to the accumulation of ketones in the kidney. The excretion
of ketones into the urine may represent 10-20% of the total ketones made in the liver (4).
However, this may only amount to 10-20 grams of total ketones excreted per day (17). Since
ketones have a caloric value of 4.5 calories/gram, (17) the loss of calories through the urine is only
45-90 calories per day.
The degree of ketonuria, which is an indirect indicator of ketonemia, can be measured by
the use of Ketostix (tm), small paper strips which react with urinary ketones and change color.
Ketonemia will always occur before ketonuria. Ketone concentrations tend to vary throughout
the day and are generally lower in the morning, reaching a peak around midnight (6). This may
occur from changes in hormone levels throughout the day (18). Additionally, women appear to
show deeper ketone levels than men (19,20) and children develop deeper ketosis than do adults
(5). Finally, certain supplements, such as N-acetyl-cysteine, a popular anti-oxidant, can falsely
indicate ketosis (4).
The distinction between ketonuria and ketonemia is important from a practical
33
The distinction between ketonuria and ketonemia is important from a practical
standpoint. Some individuals, who have followed all of the guidelines for establishing ketosis will
not show urinary ketones. However this does not mean that they are not technically in ketosis.
Ketonuria is only an indirect measure of ketone concentrations in the bloodstream and Ketostix
(tm) measurements can be inaccurate (see chapter 15 for more details).
What does ketosis represent?
The development of ketosis indicates two things. First, it indicates that the body has
shifted from a metabolism relying primarily on carbohydrates for fuel to one using primarily fat
and ketones for fuel (4). This is arguably the main goal of the ketogenic diet: to cause an overall
metabolic shift to occur in the body. The reasons this shift may be desirable are discussed in the
next chapter.
Second, ketosis indicates that the entire pathway of fat breakdown is intact (4). The
absence of ketosis under conditions which are known to induce it would indicate that a flaw in fat
breakdown exists somewhere in the chain from fat breakdown, to transport, to oxidation in the
liver. This absence would indicate a metabolic abnormality requiring further evaluation.
Blood pH and ketoacidosis
A major concern that frequently arises with regards to ketogenic diets is related to the
slight acidification caused by the accumulation of ketone bodies in the bloodstream. Normal
blood pH is 7.4 and this will drop slightly during the initial stages of ketosis.
While blood pH does temporarily decrease, the body attains normal pH levels within a few
days (21) as long as ketone body concentrations do not exceed 7-10 mmol (22). Although blood
pH is normalized after a few days, the buffering capacity of the blood is decreased (21), which has
implications for exercise as discussed in chapters 18 through 20.
There is frequent confusion between the dietary ketosis seen during a ketogenic diet and
the pathological and potentially fatal state of diabetic ketoacidosis (DKA). DKA occurs only in
Type I diabetes, a disease characterized by a defect in the pancreas, whereby insulin cannot be
produced. Type I diabetics must take insulin injections to maintain normal blood glucose levels.
In diabetics who are without insulin for some time, a state that is similar to dietary ketosis
begins to develop but with several differences.
Although both dietary ketosis and DKA are characterized by a low insulin/glucagon ratio, a
non-diabetic individual will only develop ketosis with low blood glucose (below 80 mg/dl) while a
Type I diabetic will develop ketosis with extremely high blood glucose levels (Type I diabetics may
have blood glucose levels of 300 mg/dl or more) (12).
Additionally, the complete lack of insulin in Type I diabetics appears to further increase
ketone body formation in these individuals. While a non-diabetic individual may produce 115-180
grams of ketones per day (4,16), Type I diabetics have been found to produce up to 400 grams of
ketones per day (22,23). The drop in blood pH seen in DKA is probably related to the
overproduction of ketones under these circumstances (12).
34
This increase in ketone formation is coupled with an inability in the Type I diabetic to use
ketones in body tissues (12). Presumably this occurs because blood glucose is present in
adequate amounts making glucose the preferred fuel. Thus there is a situation where ketone body
formation is high but ketone body utilization by the body is very low, causing a rapid buildup of
ketones in the bloodstream.
Additionally, in non-diabetic individuals there are at least two feedback loops to prevent
runaway ketoacidosis from occurring. When ketones reach high concentrations in the
bloodstream (approximately 4-6 mmol), they stimulate a release of insulin (8,12). This increase
in insulin has three major effects (24). First, it slows FFA release from the fat cell. Second, by
raising the insulin/glucagon ratio, the rate of ketone body formation in the liver is decreased .
Third, it increases the excretion of ketones into the urine. These three effects all serve to lower
blood ketone body concentration.
In addition to stimulating insulin release, ketones appear to have an impact directly on the
fat cell, slowing FFA release (12,22). This would serve to limit FFA availability to the liver,
slowing ketone body formation. Ultimately these two feedback loops prevent the non-diabetic
individual from overproducing ketones since high ketone levels decrease ketone body formation.
Type I diabetics lack both of these feedback loops. Their inability to release insulin from
the pancreas prevents high ketone body levels from regulating their own production. The clinical
treatment for DKA is insulin injection which rapidly shuts down ketone body formation in the
liver, slows FFA release from fat cells, and pushes ketones out of the bloodstream (12).
Additionally, rehydration and electrolyte supplementation is necessary to correct for the effects
of DKA (12).
The feedback loops present in a non-insulin using individual will prevent metabolic ketosis
from ever reaching the levels of runaway DKA (12). Table 2 compares the major differences
between a normal diet, dietary ketosis and diabetic ketoacidosis.
Table 2: Comparison of Dietary Ketosis and Diabetic Ketoacidosis (DKA)
Blood glucose (mg/dl)
Insulin
Glucagon
Ketones production (g/day)
Ketone concentrations (mmol/dl)
Blood pH
Normal diet
80-120
Moderate
Low
Low
0.1
7.4
Dietary ketosis
~ 65-80
Low
High
115-180
4-10
7.4
DKA
300+
Absent
High
400
20+
<7.30
One additional pathological state which is occasionally confused with dietary ketosis is
alcoholic ketoacidosis. Alcoholic KA occurs in individuals who have gone without food while
drinking heavily (4). Ethanol also has effects on ketone body formation by the liver, causing a
runaway ketotic state similar to DKA (25). In contrast to DKA, alcoholic ketoacidosis can be
easily reversed by eating carbohydrates as this increases insulin and stops ketone formation (4).
35
Summary
Ketosis is a metabolic state where ketones and FFA replace glucose as the primary fuel of
the body in most tissues. The presence of ketosis indicates that fat breakdown has been
activated in the body and that the entire pathway of fat degradation is intact. The lack of ketosis
in states such as fasting and a ketogenic diet known to induce ketosis would indicate the presence
of a metabolic abnormality.
Ketosis can be delineated into ketonemia, the presence of ketones in the bloodstream, and
ketonuria, the presence of ketones in the urine. Clinically, ketosis is defined as a ketone
concentration of 0.2 mmol. A ketogenic diet or fasting will result in ketone levels between 4 and 8
mmol. Ketoacidosis is defined as 8 mmol or higher and pathological ketoacidosis, as in diabetic
ketoacidosis, can result in ketone concentrations of 20 mmol or greater. Ketoacidosis, as it
occurs in Type I diabetics and alcoholics and which is potentially fatal, will not occur in nondiabetic individuals due to built in feedback loops whereby excess ketones stimulate the release of
insulin, slowing ketone body formation.
References Cited
1. Nosadini R. et. al. Ketone body metabolism: A physiological and clinical overview.
Diabet/Metab Rev (1989) 5: 299-319.
2. Council on Foods and Nutrition. A critique of low-carbohydrate ketogenic weight reducing
regimes. JAMA (1973) 224: 1415-1419.
3. Owen OE et. al. Brain metabolism during fasting”.J Clin Invest (1967) 10: 1589-1595.
4. Mitchell GA et. al. Medical aspects of ketone body metabolism. Clinical & Investigative
Medicine (1995) 18:193-216.
5. Haymond MW et. al. Effects of ketosis on glucose flux in children and adults. Am J Physiol
(1983) 245: E373-E378
6. Robinson AM and Williamson DH. Physiological roles of ketone bodies as substrates
and signals in mammalian tissues. Physiol Rev (1980) 60: 143-187.
7. Miles JM et. al. Suppression of glucose production and stimulation of insulin secretion by
physiological concentrations of ketone bodies in man. J Clin Endocrin Metab (1981)
52: 34-37.
8. Foster D. Banting Lecture 1984 - From Glycogen to Ketones - and Back. Diabetes (1984)
33: 1188-1199.
9. Wolfe RR et. al. Effect of short-term fasting on lipolytic responsiveness in normal and
obese human subjects. Am J Physiol (1987) 252: E189-E196.
10. Jenson MD et. al. Lipolysis during fasting: Decreased suppression by insulin and increased
stimulation by epinephrine. J Clin Invest (1987) 79: 207-213.
11. “Textbook of Biochemistry with Clinical Correlations 4th ed.” Ed. Thomas M. Devlin.
Wiley-Liss, 1997.
12. “Ellenberg and Rifkin’s Diabetes Mellitus: Theory and Practice 5th ed.” Ed. Porte D
and Sherwin R. New York: Appleton and Lange, 1997.
13. McGarry JD et. al. Regulation of ketogenesis and the renaissance of carnitine
palmitoyltransferase. Diabetes/Metab Rev (1989) 5:271-284.
14. Fery F et. al. Hormonal and metabolic changes induced by an isocaloric isoprotienic ketogenic
diet in healthy subjects. Diabete Metab (1982) 8: 299-305.
36
15. Flatt JP. On the maximal possible rate of ketogenesis. Diabetes (1972) 21: 50-53.
16. Garber A.J. et. al. Hepatic ketogenesis and gluconeogenesis in humans. J Clin Invest
(1974) 54: 981-989.
17. Reichard GA et. al. Ketone-body production and oxidation in fasting obese humans. J Clin
Invest (1974) 53: 508-515.
18. Ubukata E et. al. Diurnal variations in blood ketone bodies in insulin-resistant diabetes
mellitus and noninsulin-dependent diabetes mellitus patients: the relationship to serum
C-peptide immunoreactivity and free insulin. Ann Nutr Metab (1990) 34: 333-342.
19. Merimee T.J. et. al. Sex variations in free fatty acids and ketones during fasting: evidence for
a role of glucagon. J Clin Endocrin Metab (1978) 46: 414-419.
20. Merimee TJ and Fineberg SE. Homeostasis during fasting II: Hormone substrate differences
between men and women. J Clin Endocrinol Metab (1973) 37: 698-702.
21. Withrow CD. The ketogenic diet: mechanism of anticonvulsant action. Adv Neurol (1980)
27: 635-642.
22. Balasse EO and Fery F. Ketone body production and disposal: Effects of fasting, diabetes and
exercise Diabetes/Metabolism Reviews (1989) 5: 247-270.
23. Misbin RI. et. al. Ketoacids and the insulin receptor. Diabetes (1978) 27: 539-542.
24. Keller U. et. al. Human ketone body production and utilization studied using tracer
techniques: regulation by free fatty acids, insulin, catecholamines, and thyroid hormones.
Diabetes/Metabolism Reviews (1989) 5: 285-298.
25. Cahill G. Ketosis. Kidney International (1981) 20: 416-425.
37
Chapter 5:
Adaptations to Ketosis
Having discussed the basics of fuel utilization, ketone body formation and ketosis, it is now
time to examine in detail the adaptations which occur in shifting the body away from glucose and
towards fat metabolism. The primary adaptation occurs in the brain although other systems are
affected as well.
There is a common misconception, especially among bodybuilders, that ketosis is
indicative of protein breakdown when in fact the exact opposite is the case. The development of
ketosis sets in motion a series of adaptations which minimize body protein losses during periods
of caloric deprivation. In fact, preventing the development of ketosis during these periods
increases protein losses from the body.
The adaptations to ketosis are complex and involve most systems of the body. As with the
previous sections, smaller details are ignored for this discussion and interested readers should
examine the references provided. Rather, the major adaptations which occur in the body’s
tissues, especially the brain, liver, kidney and muscle are described
The adaptations to ketosis have been studied in great depth during periods of total
starvation. While this is an extreme state, the lack of food intake makes it simpler to examine
the major adaptations. To help individuals understand the adaptations to ketosis, the
metabolism of the body is examined during both short and long term fasting. The next chapter
discusses the effects of food intake on ketosis, as well as body composition changes. The following
sections address in detail the effects of ketosis on glucose/protein requirements as well as the
effects on fat and ketone use.
Section 1: An overview of starvation
Starvation and the ketogenic diet
In one sense, the ketogenic diet is identical to starvation, except that food is being
consumed. That is, the metabolic effects which occur and the adaptations which are seen during
starvation are roughly identical to what is seen during a ketogenic diet. The primary difference is
that the protein and fat intake of a ketogenic diet will replace some of the protein and fat which
would otherwise be used for fuel during starvation.
The response to total starvation has been extensively studied, arguably moreso than the
ketogenic diet itself. For this reason the great majority of data presented below comes from
studies of individuals who are fasting. With few exceptions, which are noted as necessary, the
metabolic effects of a ketogenic diet are identical to what occurs during starvation.
Although it is discussed in greater detail in a later section, the critical aspect of developing
ketosis is the quantity of carbohydrates in the diet and carbohydrate restriction mimics the
38
response seen with total fasting (1-3). The amounts of protein and fat are less critical in this
regard (see chapter 9 for more details).
A brief overview of the adaptations to starvation (4)
Before looking in detail at the adaptations to starvation, we will briefly discuss the major
events which occur. Starvation can be broken into 5 distinct phases. In the first phase, during
the first 8 hours of starvation, the body is still absorbing fuel from previous meals. Within 10
hours after the last carbohydrate containing meal, roughly 50% of the body’s total energy
requirements are being met by free fatty acids (FFA).
In the second phase, the first day or two of starvation, the body will rely on FFA and the
breakdown of liver glycogen for its energy requirements. Liver glycogen is typically gone within
12-16 hours.
In the third phase, during the first week of starvation, the body will drastically increase the
production of glucose from protein and other fuels such as lactate, pyruvate and glycerol. This is
called gluconeogenesis (the making of new glucose) and is discussed in detail below. At the same
time, tissues other than the brain are decreasing their use of glucose, relying on FFA and ketones
instead. This helps to spare what little glucose is available for the brain. During this phase,
protein breakdown increases greatly.
The fourth phase of starvation is ketosis, which begins during the third or fourth day of
starvation, and continues as long as carbohydrates are restricted. The major adaptations during
ketosis is increased utilization of ketones by the brain. The final phase, which begins in the
second week, is marked by decreasing protein breakdown and gluconeogenesis, as the major
protein sparing adaptations to ketosis occur. With the exception of the initial hours of
carbohydrate restriction (phases 1 and 2), each of the above phases is discussed in more detail
below.
Changes in hormones and fuel availability
Although some mention is made in the discussions below of the adaptations seen during
this time period, most of the major adaptations to ketosis start to occur by the third day,
continuing for at least 3 weeks (4-6). During the first 3 days of fasting, blood glucose drops from
normal levels of 80-120 mg/dl to roughly 65-75 mg/dl. Insulin drops from 40-50 µU/ml to 7-10
µU/ml (5,7,8). Both remain constant for the duration of the fast. One thing to note is that the
body strives to maintain near-normal blood glucose levels even under conditions of total fasting
(5). The popularly held belief that ketosis will not occur until blood glucose falls to 50 mg/dl is
incorrect. Additionally, the popular belief that there is no insulin present on a ketogenic diet is
incorrect (7).
One difference between fasting and a ketogenic diet is that the slight insulin response to
dietary protein will cause blood glucose to be maintained at a slightly higher level, approximately
80-85 mg/dl (1). This most likely occurs due to the conversion of dietary protein to glucose in the
liver.
39
At the same time that insulin and glucose are decreasing from carbohydrate restriction,
other hormones such as glucagon and growth hormone are increasing, as are the levels of
adrenaline and noradrenaline (7,10-12). Cortisol may actually decrease (13). This increases the
rate of fat breakdown and blood levels of FFA and ketones increase (6,8,10,14,15).
Although the liver is producing ketones at its maximum rate by day three (14), blood
ketone levels will continue to increase finally reaching a plateau by three weeks (6). The decrease
in blood glucose and subsequent increase in FFA and ketones appear to be the signal for the
adaptations which are seen, and which are discussed below (16).
In addition to increases in FFA and ketones, there are changes in blood levels of some
amino acids (AAs). Increases are seen in the the branch chain amino acids, indicating increased
protein breakdown (1, 17-19). As well, there are decreases in other AAs, especially alanine (1,
10,17-19) This most likely represents increased removal by the liver but may also be caused by
decreased release of alanine from the muscles (16). This is discussed in further detail in section 3.
Changes in levels of the other amino acids also occur and interested readers should examine the
references cited. Blood levels of urea, a breakdown product of protein also increase (1). All of this
data points to increased protein breakdown during the initial stages of starvation.
By the third day of carbohydrate restriction, the body is no longer using an appreciable
amount of glucose for fuel. At this time essentially all of the non-protein energy is being derived
from the oxidation of fat, both directly from FFA and indirectly via ketone bodies (20).
Section 2: Changes in ketone and fat
usage during starvation
The changes which occur in ketone and FFA utilization during starvation are different for
short and long term starvation. Both are discussed below.
Fat and ketone use during short term starvation
Measurements of fuel use show that approximately 90% of the body’s total fuel
requirements are being met by FFA and ketones by the third day (20). After three weeks of
starvation, the body may derive 93% of its fuel from FFA (10, 21).
For an individual with a metabolic rate of 2700 calories per day, roughly 2400 calories of
FFA (approximately 260 grams of fat) are used to fuel the body. Considering that one pound of
fat contains 3,500 calories, this represents a loss of almost two-thirds of a pound of fat per day.
Smaller individuals with lower metabolic rates will use proportionally less fat. While this extreme
rate of fat loss makes starvation attractive as a treatment for obesity, the problems associated
with total fasting (especially body protein loss) make it unacceptable.
The main point is that the metabolic state of ketosis causes a large scale shift from
glucose to fat metabolism resulting in a much larger oxidation of fat than is seen on a more
40
‘balanced’ diet. The ketogenic diet is an attempt to harness this shift to cause maximum fat loss
and minimum muscle loss, as discussed in greater detail in the upcoming sections.
Fat and ketone use during long term starvation
Most tissues except the brain, stop using ketones for fuel after the third week of ketosis.
This is especially true for skeletal muscle. While muscle initially derives up to 50% of its energy
requirements from ketones (22), this drops to 4-6% by the third week of ketosis. (22, 23). This is
thought to occur for the following reason.
During the first few days of ketosis, the brain is incapable of using ketones for fuel. By
using a large amount of ketones for fuel, skeletal muscle prevents a rapid increase in blood ketone
levels, which might cause acidosis. As time passes and the brain adapts to using ketones for fuel,
skeletal muscle must stop using ketones for fuel, to avoid depriving the brain of fuel. For all
practical purposes, with long term starvation, the primary fuel of all tissues except the brain
(and the others mentioned in section 3) is FFA, not ketones.
Section 3: Changes in Glucose and
Protein Use During Starvation
At the same time that FFA and ketone use is increasing, the body’s use of glucose and
protein are going down. This is a critical adaptation for two reasons. First and foremost, there
are tissues in the body which can not use FFA for fuel, requiring glucose. By decreasing their use
of glucose, those tissues which do not require glucose for energy spare what little is available for
the tissue which do require it. Thus, there is always a small requirement for glucose under any
condition. As we shall see, this small glucose requirement can easily be met without the
consumption of carbohydrates.
The second reason is that a reduction in protein losses is critical to survival during total
starvation. The loss of too much muscle tissue will eventually cause death (6). From a fat loss
standpoint, the ‘protein sparing’ effect of ketosis is also important to prevent lean body mass
losses.
To examine the adaptations to ketosis in terms of glucose and protein, we first need to
discuss which tissues do and do not require glucose. Then the adaptations which occur during
starvation, in terms of the conservation of glucose, can be examined.
Which tissues use glucose?
All tissues in the body have the capacity to use glucose. With the exception of the brain
and a few other tissues (leukocytes, bone marrow, erythrocytes), all tissues in the body can use
FFA or ketones for fuel when carbohydrate is not available (5,23).
Under normal dietary conditions, glucose is the standard fuel for the brain and central
41
nervous system (CNS) (24,25). The CNS and brain are the largest consumers of glucose on a
daily basis, requiring roughly 104 grams of glucose per day (5,25).
This peculiarity of brain metabolism has led to probably the most important
misconception regarding the ketogenic diet. A commonly heard statement is that the brain can
only use glucose for fuel but this is only conditionally true. It has been known for over 30 years
that, once ketosis has been established for a few days, the brain will derive more and more of its
fuel requirements from ketones, finally deriving over half of its energy needs from ketones with
the remainder coming from glucose (6,26,27).
As a few tissues do continue to use glucose for fuel, and since the brain’s glucose
requirement never drops to zero, there will still be a small glucose requirement on a ketogenic diet.
This raises the question of how much glucose is required by the body and whether or not this
amount can be provided on a diet completely devoid of carbohydrate.
How much carbohydrate per day is needed to sustain the body?
When carbohydrate is removed from the diet, the body undergoes at least three major
adaptations to conserve what little glucose and protein it does have (5). The primary adaptation
is an overall shift in fuel utilization from glucose to FFA in most tissues, as discussed in the
previous section (5,6). This shift spares what little glucose is available to fuel the brain.
The second adaptation occurs in the leukocytes, erythrocytes and bone marrow which
continue to use glucose (6). To prevent a depletion of available glucose stores, these tissues
break down glucose partially to lactate and pyruvate which go to the liver and are recycled back
to glucose again (5,6). Thus there is no net loss of glucose in the body from these tissues and they
can be ignored in terms of the body’s carbohydrate requirements.
The third, and probably the most important, adaptation, occurs in the brain, which shifts
from using solely carbohydrate for fuel to deriving up to 75% of its energy requirements from
ketones by the third week of sustained ketosis. (5,6,26) As the brain is the only tissue that
continues to deplete glucose in the body, it is all we need concern ourselves with in terms of daily
carbohydrate requirements.
The brain’s glucose requirements
In a non-ketotic state, the brain utilizes roughly 100 grams of glucose per day (5,25). This
means that any diet which contains less than 100 grams of carbohydrate per day will induce
ketosis, the depth of which will depend on how many carbohydrates are consumed (i.e. less
carbohydrates will mean deeper ketosis). During the initial stages of ketosis, any carbohydrate
intake below 100 grams will induce ketosis (28). As the brain adapts to using ketones for fuel and
the body’s glucose requirements decrease, less carbohydrate must be consumed if ketosis is to be
maintained.
The question which requires an answer is this: What sources of glucose does the body have
other than the ingestion of dietary carbohydrate? Put differently, assuming zero dietary
carbohydrate intake, can the body produce enough glucose to sustain itself?
42
Please note that the following discussion is only truly relevant to individuals on a Standard
Ketogenic Diet (SKD) who are not exercising. However the same information also applies to
individuals using a TKD or CKD as some period is spent in ketosis. The impact and implications
of exercise on carbohydrate requirements is discussed in later chapters.
Sources of glucose in the body during short term ketosis
The easiest way to examine the body’s requirements for glucose is to look at the effects of
complete fasting in both the short term (a few hours to 3 weeks) and the long term (3 weeks and
up). The few differences between complete fasting and a ketogenic diet are discussed afterwards.
Liver glycogen and gluconeogenesis
The initial storage depot of carbohydrate in the body is the liver, which contains enough
glycogen to sustain the brain’s glucose needs for approximately 12-16 hours (4). We will assume
for the following discussion that liver glycogen has been depleted, ketosis established, and that
the only source of glucose is from endogenous fuel stores (i.e. stored bodyfat and protein). The
effects of food intake on ketosis is discussed in chapter 9.
After its glycogen has been depleted, the liver is one of the major sources for the production
of glucose (gluconeogenesis) and it produces glucose from glycerol, lactate/pyruvate and the
amino acids alanine and glutamine (5,6,25) The kidney also produces glucose as starvation
proceeds (8).
Glycerol comes from the breakdown of adipose tissue triglyceride, lactate and pyruvate
from the breakdown of glycogen and glucose, and alanine and glutamine are released from muscle.
Since we are ultimately concerned with the loss of muscle tissue during ketosis, gluconeogenesis
from alanine and glutamine are discussed further.
Protein breakdown
With the induction of starvation, blood alanine/glutamine levels both increase
significantly, indicating an increase in muscle protein breakdown (6,19). Alanine is absorbed by
the liver, converted to glucose and released back into the bloodstream. Glutamine is converted to
glucose in the kidney (8). There are also increases in blood levels of the branch-chain amino
acids, indicating the breakdown of skeletal muscle (18).
During the initial weeks of starvation, there is an excretion of 12 grams of nitrogen per
day. Since approximately 16% of protein is nitrogen, this represents the breakdown of roughly 75
grams of body protein to produce 75 grams of glucose (6). If this rate of protein breakdown were
to continued unchecked, the body’s protein stores would be depleted in a matter of weeks, causing
death.
After even 1 week of starvation, blood alanine levels begin to drop and uptake by the
kidneys decreases, indicating that the body is already trying to spare protein losses (19). During
43
longer periods of starvation, blood levels of alanine and glutamine continue to decrease, as does
glucose production by the liver (6,21). As glucose production in the liver is decreasing, there is
increased glucose production in the kidney (21).
Because of these adaptations, nitrogen losses decrease to 3-4 grams per day by the third
week of starvation, indicating the breakdown of approximately 20 grams of body protein (6).
With extremely long term starvation, nitrogen losses may drop to 1 gram per day (7), indicating
the breakdown of only 6 grams of body protein. However at no time does protein breakdown
decrease to zero, as there is always a small requirement for glucose (10). As we shall see in a
later section, the development of ketosis during starvation is critical for protein sparing.
Fat breakdown
The glycerol portion of triglycerides (TG) is converted to glucose in the liver with roughly
ten percent of the total grams of TG broken down (whether from bodyfat or dietary fat) appearing
as glucose (25,29). An average sized individual (150 lbs) may catabolize 160-180 grams of fat per
day which will yield 16-18 grams of glucose (10). Obviously a larger individual would oxidize more
fat, producing more glucose. The amount of glycerol converted to glucose is fairly constant on a
day to day basis and will depend primarily on metabolic rate.
Protein and fat
Excluding the glucose made by recycling lactate and pyruvate, the body will produce the
100 grams of glucose which it needs from the breakdown of approximately 180 grams of TG and
75 grams of muscle protein (see Table 1) (6).
Table 1: Sources of glucose during the initial stages of starvation
Source
Amount of carbohydrate required by brain
Breakdown of 180 grams of TG
Breakdown of 75 grams of protein
Total carbohydrate produced per day
in the liver
Glucose produced (grams)
~100
18
75
93
Production of glucose during long term starvation
As long term adaptation to ketosis continues, there are a number of adaptations which
occur to further spare glucose. From the third day of ketosis to three weeks of fasting, the brain
gradually increases its use of ketones for fuel, ultimately deriving up to 75% of its total energy
from ketones (6,26). This shift to using ketones by the brain means that only 40 grams of
glucose per day is required, the remaining 60-75 grams of energy being provided by ketones (26).
This means that less protein must be broken down to produce glucose. Since TG breakdown will
still provide 18 grams of glucose per day, protein breakdown will only be 20 grams per day (see
44
still provide 18 grams of glucose per day, protein breakdown will only be 20 grams per day (see
table 2 on the next page) (6). As stated previously, is appears the primary purpose of ketones in
humans is to provide the brain with a non-glucose, fat-derived fuel for the brain (27,30).
Summary
The implication of the adaptations discussed above is that the body does not require
dietary carbohydrates for survival (exercise and muscle growth are a separate issue). That is,
there is no such thing as an essential dietary carbohydrate as the body can produce what little
glucose it needs from other sources.
Of course, the price paid is the loss of body protein, which will ultimately cause death if
continued for long periods of time. This loss of body protein during total starvation is
unacceptable but the above discussion only serves to show that the body goes through a series of
adaptations to conserve its protein. As we see later in this chapter, the addition of dietary
protein will maintain ketosis, while preventing the breakdown of bodily protein. In brief, rather
than break down bodily protein to produce glucose, the body will use some of the incoming dietary
protein for glucose production. This should allow maximal fat utilization while sparing protein
losses.
Table 2: Sources of glucose during long term starvation
Source
Amount of carbohydrate required by brain
Breakdown of 180 grams of fat
Breakdown of 20 grams of protein
Total carbohydrate produced per day
in the liver and kidney
Glucose produced (grams)
~40
18
20
38
Section 4: Ketosis and protein sparing
Having quantitatively examined the adaptations which occur in terms of glucose use and
nitrogen losses during starvation, the mechanisms behind the ‘protein sparing’ effect of ketosis
can now be discussed.
The question which needs to be answered is what mechanisms exist for ketones (or
ketosis) to spare protein. There are at least four possible mechanisms through which ketogenic
diets may spare protein, three of which are well established in the literature, the fourth less so.
They are discussed in more detail below.
Decreasing the body’s glucose requirements
This is arguably the primary mechanism through which ketosis spares nitrogen losses.
This adaptation is discussed in detail in the previous sections and is well established in the
45
literature. To briefly recap, by shifting the body’s overall metabolism to fat and ketones
(especially in the brain), less protein is converted to glucose and protein is spared (6,27). This
mechanism is not discussed in further detail here.
It should be noted that preventing the development of ketosis, either with drugs or with the
provision of too much dietary carbohydrate, maintains the nitrogen losses during starvation (31).
That is, the development of ketosis is a critical aspect of preventing excessive nitrogen
losses during periods of caloric insufficiency. This suggests that non-ketogenic low-carbohydrate
diets (frequently used by bodybuilders) may actually cause greater protein losses by preventing
the body from maximizing the use of fat for fuel, which is addressed in chapter 6 .
Decreased nitrogen excretion via the kidney
The kidney is a major site of ketone uptake and the buildup of ketones in the kidney has at
least two metabolic effects (32). The first is an increase in urinary excretion of ketones, which
can be detected with Ketostix (tm). The second is an impairment of uric acid uptake, which is
discussed in chapter 7.
The excretion of ketones through the kidneys has an important implication for nitrogen
sparing. The kidney produces ammonia, which requires nitrogen, as a base to balance out the
acidic nature of ketones and prevent the urine from becoming acidic. This is at least one possible
site for an increase in protein losses during ketosis (32). In all likelihood, the increased excretion of
ammonia may be the basis of the idea (long held in bodybuilding) that ketone excretion is
indicative of protein loss.
As ketosis develops, however, there is an adaptation in the kidney to prevent excessive
ammonia loss. As blood ketone concentrations increase, the kidney increases its absorption of
ketones. If this increased absorption was accompanied by increased ketone excretion, there
would be further nitrogen loss through ammonia production.
However urinary excretion of ketones does not increase, staying extremely constant from
the first few days of ketosis on. Therefore, most of the ketones being absorbed by the kidney are
not being excreted. The resorption of ketones appears to be an adaptation to prevent further
nitrogen losses, which would occur from increasing ammonia synthesis (16,32). This adaptation
has the potential to spare 7 grams of nitrogen (roughly 42 grams of body protein) per day from
being lost (32).
Directly affecting protein synthesis and breakdown.
As stated, it is well established that protein breakdown decreases during the adaptation to
total starvation and one of the mechanisms for this decrease is a lessening of the brain’s glucose
requirements. It has also been suggested that protein sparing is directly related to ketosis (5,26).
As well, many popular authors have suggested that ketones are directly anti-catabolic but this
has not been found in all studies.
As described previously, muscles will derive up to 50% of their energy requirements from
ketones during the first few days of ketosis. However this drops rapidly and by the third week of
46
ketosis, muscles derive less only 4-6% of their energy from ketone bodies (22). This becomes
important when considering the time course for nitrogen sparing during ketosis.
Infusion studies
Several studies have examined the effects on protein breakdown during the infusion of
ketone bodies at levels that would be seen in fasting or a ketogenic diet. Of these studies, three
have shown a decrease in protein breakdown (33-35) while two others have not (36,37). One
study suggested that ketones were directly anabolic (38). One oddity of these studies is that the
infusion of ketones (usually as a ketone salt such as sodium-acetoacetate) causes an increase in
blood pH (36,38), contrary to the slight drop in blood pH which normally occurs during a ketogenic
diet.
At least one study suggests that the rise in pH is responsible for the decrease in protein
breakdown rather than the ketones themselves (36); and sodium bicarbonate ingestion can
reduce protein breakdown during a ketogenic diet (39). However, since blood pH is normalized
within a few days of initiating ketosis, while maximal protein sparing does not occur until the third
week, it seems unlikely that changes in blood pH can explain the protein sparing effects of
ketosis.
It should be noted that these studies are different than the normal physiological state of
ketosis for several reasons. First and foremost, the mixture of ketone salts used is not
chemically identical to the ketones that appear in the bloodstream. Additionally, the increase in
pH seen with ketone salt infusion is in direct contrast to the drop in pH seen on a ketogenic diet
suggesting a difference in effect. Therefore, ketones produced during metabolic ketosis may still
have a direct anti-catabolic effect.
Possibly the biggest argument against the idea that ketones are directly anti-catabolic is
the time course for changes in nitrogen balance. Most of the infusion studies were done on
individuals who had been fasting for short periods of time, overnight or a few days. The major
decrease in nitrogen sparing does not occur until approximately the third week of ketosis, at
which time muscles are no longer using ketones to any significant degree (22,40). All of the
above data makes it difficult to postulate a mechanism by which ketones directly affect muscle
protein breakdown. In all likelihood, contrary to popular belief, ketones are not directly anticatabolic.
Affecting thyroid levels
A fourth possible mechanism by which ketosis may reduce protein breakdown involves
the thyroid hormones, primarily triiodothyronine (T3). T3 is arguably one of the most active
hormones in the human body (42-44). While most think of T3 simply as a controller of metabolic
rate, it affects just about every tissue of the body including protein synthesis. A decrease in T3
will slow protein synthesis and vice versa. As a side note, this is one reason why low
carbohydrate diets are not ideal for individuals wishing to gain muscle tissue: the decrease in T3
will negatively affect protein synthesis.
47
The body has two types of thyroid hormones (42). The primary active thyroid hormone is
T3, called triiodothyronine. T3 is responsible most of the metabolic effects in the body. The other
thyroid hormone is T4, called thyroxine. Thyroxine is approximately one-fifth as metabolically
active as T3 and is considered to be a storage form of T3 in that it can be converted to T3 in the
liver.
T3 levels in the body are primarily related to the carbohydrate content of the diet (44-46)
although calories also play a role (47-49). When calories are above 800 per day, the
carbohydrate content of the diet is the critical factor in regulating T3 levels and a minimum of 50
grams per day of carbohydrate is necessary to prevent the drop in T3 (44,48,49). To the
contrary, one study found that a 1500 calorie diet of 50% carbohydrate and 50% fat still caused a
drop in T3, suggesting that fat intake may also affect thyroid hormone metabolism (50).
Below 800 calories per day, even if 100% of those calories come from carbohydrate, T3
levels drop (47). Within days of starting a ketogenic diet, T3 drops quickly. This is part of the
adaptation to prevent protein losses and the addition of synthetic T3 increases nitrogen losses
during a ketogenic diet (1). In fact the ability to rapidly decrease T3 levels may be one
determinant of how much protein is spared while dieting (51).
Hypothyroidism and euthyroid stress syndrome (ESS)
There are two common syndromes associated with low levels of T3 which need to be
differentiated from one another. Hypothyroidism is a disease characterized by higher than
normal thyroid stimulating hormone (TSH) and lower levels of T3 and T4. The symptoms of this
disease include fatigue and a low metabolic rate.
The decrease in T3 due to hypothyroidism must be contrasted to the decrease seen during
dieting or carbohydrate restriction. Low levels of T3 with normal levels of T4 and TSH (as seen in
ketogenic dieting) is known clinically as euthyroid stress syndrome (ESS) and is not associated
with the metabolic derangements seen in hypothyroidism (1). The drop in T3 does not appear to
be linked to a drop in metabolic rate during a ketogenic diet (17,52).
As with other hormones in the body (for example insulin), the decrease in circulating T3
levels may be compensated for by an increase in receptor activity and/or number (1). This has
been shown to occur in mononuclear blood cells but has not been studied in human muscle or fat
cells (53). So while T3 does go down on a ketogenic diet, this does not appear to be the reason for a
decrease in metabolic rate.
Summary
The primary adaptation to ketosis (as it occurs during total starvation) is a gradual
decrease in the body’s glucose requirements with a concomitant increase in the use of free fatty
acids and ketones. The main adaptation which occurs is in the brain which shifts from deriving
100% of its fuel from glucose to deriving as much as 75% of its total energy requirements from
ketones. Thus the commonly stated idea that the brain can only use glucose is incorrect.
48
A large increase in the breakdown of body protein during the initial stages of starvation
provides the liver and kidney with the amino acids alanine and glutamine to make glucose.
However, there is a gradual decrease in protein breakdown which occurs in concert with the
decreasing glucose requirements.
Although the exact mechanisms behind the ‘protein sparing’ effect of ketosis are not
entirely established, there are at least four possible mechanisms by which ketogenic diets may
spare protein. These include decreased glucose requirements, decreased excretion of ketones
from the kidneys, a possible direct effect of ketones on protein synthesis, and the drop in thyroid
levels seen during starvation.
References Cited
1. Fery F et. al. Hormonal and metabolic changes induced by an isocaloric isoprotienic ketogenic
diet in healthy subjects. Diabete Metab (1982) 8: 299-305.
2. Bloom W and Azar G. Similarities of carbohydrate deficiency and fasting. Part I: weight loss,
electrolyte excretion and fatigue. Arch Intern Med (1963) 112: 333-337.
3. Azar G and Bloom W. Similarities of carbohydrate deficiency and fasting. Part II: Ketones,
nonesterified fatty acids and nitrogen excretion. Arch Intern Med (1963) 112: 338-343.
4. Cahill G. Starvation. Trans Am Clin Climatol Assoc (1982) 94: 1-21.
5. Cahill G. Starvation in man. N Engl J Med (1970) 282: 668-675
6. Cahill G and Aoki TT. How metabolism affects clinical problems Medical Times (1970)
98: 106-122.
7. Cahill, G et. al. Hormone-fuel relationships during fasting. J Clin Invest (1966) 45: 1751-1769
8. Owen OE et. al. Liver and kidney metabolism during prolonged starvation. J Clin Invest (1969)
48: 574-583
10. Owen OE et. al. Protein, fat and carbohydrate requirements during starvation: anaplerosis
and cataplerosis. Am J Clin Nutr (1998) 68: 12-34.
11. Wolfe RR et. al. Effect of short-term fasting on lipolytic responsiveness in normal and obese
human subjects. Am J Physiol (1987) 252: E189-E196
12. Jensen MD et. al. Lipolysis during fasting: decreases suppression by insulin and decreased
stimulation by epinephrine. J Clin Invest (1987) 79: 207-213.
13. Haymond MW et. al. Effects of ketosis on glucose flux in children and adults. Am J Physiol
(1983) 245: E373-E378
14. Garber AJ et. al. Hepatic ketogenesis and gluconeogenesis in humans. J Clin Invest (1974)
54: 981-989.
15. Carlson MG et al. Fuel and energy metabolism in fasting humans. Am J Clin Nutr. (1994)
60: 29-36.
16. Robinson AM and Williamson DH Physiological roles of ketone bodies as substrates and
signals in mammalian tissues. Physiol Rev (1980) 60: 143-187.
17. Phinney S.D. et. al. The human metabolic response to chronic ketosis without caloric
restriction: physical and biochemical adaptations. Metabolism (1983) 32: 757-768.
18. Swendseid ME et. al. Plasma amino acid levels in subjects fed isonitrogenous diets containing
different proportions of fat and carbohydrate. Am J Clin Nutr (1967) 20: 52-55.
19. Felig P. et. al. Amino acid metabolism during prolonged starvation. J Clin Invest (1969)
48: 584-594.
49
20. Elia M. et. al. Ketone body metabolism in lean male adults during short-term starvation, with
particular reference to forearm muscle metabolism. Clinical Science (1990) 78: 579-584.
21. Felig P. et. al. Utilization of metabolic fuels in obese subjects. Am J Clin Nutr (1968)
21: 1429-1433.
22. Owen OE and Reichard GA Human forearm metabolism during progressive starvation. J Clin
Invest (1976) 50: 1536-1545.
23. Mitchell GA et al. Medical aspects of ketone body metabolism. Clinical & Investigative
Medicine (1995) 18: 193-216.
24. Sokoloff L. Metabolism of ketone bodies by the brain. Ann Rev Med (1973) 24: 271-280.
25. Felig P. et. al. Blood glucose and gluconeogenesis in fasting man. Arch Intern Med (1969)
123: 293-298.
26. Owen OE et. al. Brain metabolism during fasting. J Clin Invest (1967) 10: 1589-1595.
27. “Ellenberg and Rifkin’s Diabetes Mellitus: Theory and Practice 5th ed.” Ed. Daniel Porte and
Robert Sherwin. Appleton and Lange, 1997.
28. Bistrian BR et. al. Effect of a protein-sparing diet and brief fast on nitrogen metabolism in
mildly obese subjects. J Lab Med (1977) 89:1030-1035
29. Bortz WM et. al. Glycerol turnover in man. J Clin Invest (1972) 51: 1537-1546.
30. Balasse EO and Fery F. Ketone body production and disposal: Effects of fasting, diabetes and
exercise. Diabetes/Metabolism Reviews (1989) 5: 247-270.
31. Flatt JP and Blackburn GL. The metabolic fuel regulatory system: implications for protein
sparing therapies during caloric deprivation and disease. Am J Clin Nutr (1974)
27: 175-187.
32. Sapir DG and Owen OE. Renal conservation of ketone bodies during starvation. Metabolism
(1975) 24: 23-33.
33. Sherwin RS et. al. Effect of ketone infusion on amino acid and nitrogen metabolism in man.
J Clin Invest (1975) 55: 1382-1390.
34. Pawan GLS and Semple SJG. Effect of 3-hydroxybutyrate in obese subjects on very-lowenergy diets and during therapeutic starvation. Lancet (1983) 1:15-17.
35. Beaufrere B et al. Effects of D-beta-hydroxybutyrate and long- and medium-chain
triglycerides on leucine metabolism in humans. Am J Physiol. (1992) 262: E268-E274.
36. Fery F and Balasse EO. Differential effects of sodium acetoacetate and acetoacetic acid
infusions on alanine and glutamine metabolism in man. J Clin Invest (1980) 66: 323-331.
37. Miles JM et. al. Failure of infused b-hydroxybutyrate to decrease proteolysis in man.
Diabetes (1983) 32: 197-205.
38. Nair KS et. al. Effect of b-hydroxybutyrate on whole-body leucine kinetics and fractional
skeletal muscle protein synthesis in humans. J Clin Invest (1988) 82: 198-205.
39. Gougeon-Reyburn R and Marliss EB. Effects of sodium bicarbonate in nitrogen metabolism
and ketone bodies during very low protein diets in obese subjects. Metabolism (1989)
38: 1222-1230.
40. Hagenfeldt L and Wahren J. Human forearm metabolism during exercise VI. Substrate
Utilization in Prolonged Fasting. Scand J Clin Lab Invest (1971) 27: 299-306.
41. “Werner and Ingbar’s The Thyroid: A fundamental and clinical text” Lewis E. Braverman and
Robert D. Utiger. Lipincott-Raven publishers, 1995.
42. Van Gall L.F. et. al. Factors determining energy expenditure during very-low-calorie diets.
Am J Clin Nutr (1992) 56: 224S-229S.
43. Freake HC and Oppenheimer JH. Thermogenesis and thyroid function. Annual Rev Nutr
(1995) 15: 263-291.
50
44. Pasquali R. et. al. Effects of dietary carbohydrates during hypocaloric treatment of obesity
on peripheral thyroid hormone metabolism. J Endocrinol Invest (1982) 5: 47-52.
45. Fery F. et. al. Hormonal and metabolic changes induced by an isocaloric isoproteneic
ketogenic diet in healthy subjects. Diabete et Metabolisme (1982) 8: 299-305.
46. Serog P. et. al. Effects of slimming and composition of diets on VO2 and thyroid hormones in
healthy subjects. Am J Clin Nutr (1982) 35: 24-35.
47. O’Brian J.T. et. al. Thyroid hormone homeostasis in states of relative caloric deprivation.
Metabolism (1980) 29: 721- 727.
48. Spaulding SW. et.al. Effect of caloric restriction and dietary composition of serum T3 and
reverse T3 in man. J Clin Endocrin Metabolism (1976) 42: 197-200.
49. Pasquali R et. al. Relationships between iodothyronine peripheral metabolism and ketone
bodies during hypocaloric dietary manipulations. J Endocrinol Invest (1982) 6: 81-89.
50. Otten M.H. et. al. The role of dietary fat in peripheral thyroid hormone metabolism.
Metabolism (1980) 29: 930- 935.
51. Yang MU and Van Itallie TB. Variability in body protein loss during protracted severe caloric
restriction: role of triiodothyronine and other possible determinants. Am J Clin Nutr
(1984) 40: 611-622.
52. Acheson KJ and Berger AG. A study of the relationship between thermogenesis and thyroid
hormones. J Clin Endocrin Metab (1980) 51: 84-89.
53. Matzen LE and Kvetny J. The influence of caloric deprivation and food composition on TSH,
thyroid hormones and nuclear binding of T3 in mononuclear blood cells in obese women.
Metabolism (1989) 38: 555-561.
51
Chapter 6:
Changes in body composition
Having discussed the primary metabolic adaptations which occur during ketosis in the
previous chapter, we can now examine the effects of ketogenic diets on body composition. The
first issue to examine is the effect of food intake on ketosis. This will lead into an examination of
protein sparing on a ketogenic diet, as well as issues involving weight, water, and fat loss.
The question to be answered is whether a ketogenic diet does in fact cause greater fat loss
with less loss of body protein than a more ‘balanced’ diet. Unfortunately, the lack of appropriate
studies, as well as a high degree of variability in study subjects, make this a difficult question to
answer unequivocally. Issues relating to water loss on a ketogenic diet are discussed as well.
Section 1: Macronutrients and Ketosis
Before discussing how to prevent nitrogen loss during starvation, we need to briefly discuss
the effects of different nutrients on the development of ketosis. Both protein and carbohydrate
intake will impact the development of ketosis, affecting both the adaptations seen as well as how
much of a ‘protein sparing’ effect will occur.
Despite the generally ‘high fat’ nature of the ketogenic diet, or at least how it is perceived,
dietary fat intake has a rather minimal effect on ketosis per se. Fat intake will primarily affect
how much bodyfat is used for fuel. Although alcohol has been discussed within the context of
ketoacidosis, the effects of alcohol intake on the state of ketosis are discussed again here.
The ketogenic ratio
Although its application for ketogenic dieters is somewhat limited, the simplest way to
examine the effects of food consumption on ketosis is to look at the equation used to develop
ketogenic diets for childhood epilepsy (figure 1).
Figure 1: The ketogenic ratio
Ketogenic
K
0.9 fat + 0.46 protein
------------------- = ---- = ------------------------------------------------Anti-ketogenic AK 1.0 carbohydrate + 0.1 fat + 0.58 protein
Note: Protein, fat and carbohydrates are in grams.
Source: Withrow CD. The ketogenic diet: mechanism of anticonvulsant action. Adv Neurol
(1980) 7: 635-642.
52
This equation represents the relative tendency for a given macronutrient to either promote
or prevent a ketogenic state (1). Recalling from the previous chapter that insulin and glucagon
are the ultimate determinants of the shift to a ketotic state, this equation essentially represents
the tendency for a given nutrient to raise insulin (anti-ketogenic) or glucagon (pro-ketogenic).
For the treatment of epilepsy, the ratio of K to AK must be at least 1.5 for a meal to be
considered ketogenic (1). Typically, this results in a diet containing 4 grams of fat for each gram
of protein and carbohydrate, called a 4:1 diet. More details on the development of ketogenic diets
for epilepsy can be found in the references, as they are beyond the scope of this book.
Although this ratio is critically important for the implementation of the ketogenic diet in
clinical settings, we see in chapter 9 that it is not as important for the general dieting public.
Each macronutrient is now briefly discussed within the context of the equation in figure 1.
Carbohydrate
Carbohydrate is 100% anti-ketogenic. As carbohydrates are digested, they enter the
bloodstream as glucose, raising insulin and lowering glucagon, which inhibits ketone body
formation. In fact, any dietary change that raises blood glucose is anti-ketogenic.
As mentioned in the previous chapter, the brain is the only tissue which requires glucose in
amounts of roughly 100 grams per day. If sufficient carbohydrate is consumed to provide this
much glucose, the brain will have no need to begin using ketones. Therefore any diet which
contains more than 100 grams of carbohydrate per day will not be ketogenic (2). After
approximately three weeks, when the brain’s glucose requirements have dropped to only 40
grams of glucose per day, carbohydrates must be restricted even further.
Additionally, from the standpoint of rapidly depleting liver glycogen, the more that
carbohydrates are restricted during the first days of a ketogenic diet, the faster ketosis will occur
and the deeper the degree of ketonemia. When examining the diet studies, any diet with more
than 100 grams of carbohydrates is considered to be non-ketogenic (often called a ‘balanced’ diet)
while any diet with less than 100 grams of carbohydrates is ketogenic (2).
Protein
Protein has both ketogenic effects (46%) and anti-ketogenic effects (58%). This reflects
the fact that 58% of dietary protein will appear in the bloodstream as glucose (3), raising insulin
and inhibiting ketogenesis. Note that the insulin response from consuming dietary protein is
much smaller than that from consuming dietary carbohydrates. Consequently protein must be
restricted to some degree on a ketogenic diet as excessive protein intake will generate too much
glucose, impairing or preventing ketosis. Protein also stimulates glucagon release and has some
pro-ketogenic effects.
The most critical aspect of protein intake has to do with preventing the breakdown of body
protein. By providing dietary protein during starvation, the breakdown of body protein can be
decreased or avoided entirely (4). The interactions between protein and glucose intake and protein
sparing are the topic of the next section.
53
Fat
Fat is primarily ketogenic (90%) but also has a slight anti-ketogenic effect (10%). This
represents the fact that ten percent of the total fat grams ingested will appear in the
bloodstream as glucose (via conversion of the glycerol portion of triglycerides) (5,6). If 180 grams
of fat are oxidized (burned) per day, this will provide 18 grams of glucose from the conversion of
glycerol.
Alcohol
Although alcohol is not represented in the above equation, having no direct effect on
ketosis, alcohol intake will have an impact on the depth of ketosis and the amount of body fat
used by the body. As discussed in chapter 4, excessive alcohol intake while in ketosis can cause
runaway acidosis to develop which is potentially very dangerous. Additionally as alcohol intake
limits how much FFA can be processed by the liver, calories from alcohol will detract from overall
fat loss.
Summary
The three macronutrients are carbohydrate, protein and fat. All three nutrients have
differing effects on ketosis due to their digestion and subsequent effects on blood glucose and
hormone levels. Carbohydrate is 100% anti-ketogenic due to its effects on blood glucose and
insulin (raising both). Protein is approximately 46% ketogenic and 58% anti-ketogenic due to the
fact that over half of ingested protein is converted to glucose, raising insulin. Fat is 90%
ketogenic and ten percent anti-ketogenic, representing the small conversion of the glycerol
portion of triglycerides to glucose. While alcohol has no direct effect on the establishment of
ketosis, excessive alcohol intake can cause ketoacidosis to occur.
Section 2: Nitrogen sparing:
A theoretical approach
The breakdown of body protein during total starvation to produce glucose ultimately led
researchers to explore two distinctly different approaches to prevent this loss. The simplest
approach was to provide glucose in order to eliminate the need for protein breakdown. However,
this had a secondary effect of preventing the adaptations to ketosis. In some clinical situations
such as post-surgical trauma, providing glucose or glucose with protein caused greater protein
losses by preventing the adaptations to ketosis from occurring.
The second approach was to mimic the effects of starvation while consuming food. This
allows ketosis to develop while limiting the loss of body protein. One approach was to simply
consume high quality protein, which was called the protein sparing modified fast (PSMF).
54
After much research, it was concluded that a protein intake of 1.5-1.75 grams protein per
kilogram of ideal body weight (ideal body weight was used to approximate lean body mass) would
spare most of the nitrogen loss, especially as ketosis developed and the body’s glucose
requirements decreased. As we shall see below, providing sufficient protein from the first day of a
low-carbohydrate diet should prevent any net nitrogen loss from the body. Of all aspects of the
PSMF or ketogenic diet, adequate dietary protein is absolutely critical to the success of the diet in
maximizing fat loss and sparing body protein.
The ketogenic diet as most consider it is simply a PSMF with added dietary fat. Note that
the addition of dietary fat does not affect the adaptations or protein sparing effects of the PSMF.
Only overall fat loss is affected since dietary fat is used to provide energy instead of bodyfat.
How much dietary protein is necessary to prevent nitrogen losses?
Without going into the details of protein requirements, which are affected by activity and
are discussed in the next chapter, we can determine the minimum amount of protein which is
necessary to prevent body protein losses by looking at two factors: the amount of glucose
required by the brain, and the amount of glucose produced from the ingestion of a given amount of
dietary protein.
Both of these factors are discussed in previous chapters and a few brief calculations will
tell us how much protein is necessary. In the next section, these values are compared to a
number of diet studies to see if they are accurate.
To briefly recap, during the first weeks of ketosis, approximately 75 grams of glucose must
be produced (the other 18 grams of glucose coming from the conversion of glycerol to glucose) to
satisfy the brain’s requirements of ~100 grams of glucose per day. After approximately 3 weeks
of ketosis, the brain’s glucose requirements drop to approximately 40 grams of glucose. Of this,
18 grams are derived from the conversion of glycerol, leaving 25 grams of glucose to be made
from protein.
Since 58% of all dietary protein will appear in the bloodstream as glucose (3), we can
determine how much dietary protein is required by looking at different protein intakes and how
much glucose is produced (table 1).
Table 1: Protein intake and grams of glucose produced *
Protein intake (grams)
50
100
125
150
175
200
Glucose produced (grams)
27
58
72.5
87
101.5
116
* Assuming a 58% conversion rate
55
Assuming zero carbohydrate intake, during the first 3 weeks of a ketogenic diet a protein
intake of ~150 grams per day should be sufficient to achieve nitrogen balance. Therefore,
regardless of bodyweight, the minimum amount of protein which should be consumed during the
initial three weeks of a ketogenic diet is 150 grams per day.
After 3 weeks of ketosis, as little as 50 grams of protein per day should provide enough
glucose to achieve nitrogen balance. The inclusion of exercise will increase protein requirements
and is discussed in chapter 9.
Carbohydrate intake
The consumption of carbohydrate will decrease dietary protein requirements since less
glucose will need to be made from protein breakdown. For example, if a person was consuming
125 grams of protein per day, this would produce 72 grams of glucose plus 18 more from the
breakdown of glycerol for a total of 90 grams of glucose. To avoid any nitrogen losses, this
individual could either consume 10 grams of carbohydrate per day or simply increase protein
intake to 150 grams per day.
Summary
Looking at the topic of protein sparing from a purely theoretical standpoint, a protein
intake of approximately 150 grams per day should be sufficient to prevent any nitrogen losses
during the first three weeks of a ketogenic diet. After this time period, as little as 50 grams of
protein should be necessary to prevent nitrogen losses. These values are examined by looking at
specific studies in the next section.
Section 3: Nitrogen sparing:
The studies
Having examined protein requirements from a theoretical standpoint, we can now see how
the values determined previously compare to the studies done on ketogenic diets at varying
calorie levels. Before examining some key studies, a discussion of nitrogen balance and how it is
determined is necessary. Additionally, some of the problems with nitrogen balance are discussed.
Protein losses and nitrogen balance
There are many methods of measuring protein losses during dieting and starvation (7).
Without exception all make assumptions and simplifications. From the standpoint of the
ketogenic diet, some methods are better than others, but none are perfect.
56
Many early ketogenic diet studies simply subtracted muscle loss from total weight loss and
assumed the difference represented fat loss. The problem with this method was that assessment
of muscle loss can be seriously affected by the glycogen loss seen on a ketogenic diet (8).
Although newer methods are becoming available, most of the studies examined estimate
body protein losses by performing a nitrogen balance study. Nitrogen is brought into the body in
the form of dietary protein and is excreted from the body through a number of pathways including
urine, feces and sweat (9). Generally estimations are made for fecal and sweat nitrogen losses
and only urinary nitrogen excretion is measured.
Since it is easier to measure nitrogen than it is to measure protein directly, a nitrogen
balance study compares the amount of nitrogen being lost in the urine to the amount of nitrogen
being consumed in the diet. If less nitrogen is being excreted than consumed, the body is said to
be in positive nitrogen balance meaning that protein is being stored. Since the body has a
minimal store of non-tissue protein (9), it is assumed that this stored protein is being
incorporated into muscle or other tissues. If more nitrogen is being excreted than is being
consumed, the body is in negative nitrogen balance meaning that body protein is being broken
down and excreted. A negative nitrogen balance generally indicates a loss of lean body mass and
we will assume it to indicate a loss of muscle.
Problems with nitrogen balance
Although nitrogen balance is one of the best methods for determining muscle loss while
dieting, there are still problems. First and foremost, there tends to be a great degree of variability
in total nitrogen losses among subjects in diet studies. For example, one study found that daily
nitrogen losses on a ketogenic diet varied among the subjects between 1 gram of nitrogen/day and
6 grams of nitrogen/day. This represents a difference in bodily protein breakdown of 6-36 grams
of protein/day (10). Unfortunately most diet studies report nitrogen balances as average values
for differing diet groups. This tends to overstate either how well or how poorly a diet works to
spare protein. If one individual loses a significant amount of nitrogen while another loses very
little, reporting an average does not provide accurate information.
An additional problem is that there is no easy way to tell where the protein is coming from
or going to. In the case of a negative nitrogen balance, it is possible that liver proteins are being
broken down, while muscle is spared and vice versa. To simplify matters, we will equate a
negative nitrogen balance with a loss of muscle.
Why the variability?
The reason for such variability in nitrogen sparing is likely related to several factors.
Obese individuals appear to better spare protein losses due to having a greater store of bodyfat to
use as an alternate fuel (10). In contrast, higher levels of lean body mass appear to increase
nitrogen losses (10). This may be part of the reason that heavily muscled individuals tend to lose
muscle more easily. The ability to decrease insulin levels and establish ketosis may also play a
role (11,12). Finally, the ability to rapidly down regulate the levels of thyroid hormones may play
a role in nitrogen sparing (10).
57
Additionally, since the major adaptations to ketosis (especially with regards to protein
sparing) take at least 3 weeks to occur, studies shorter than three weeks in duration may
erroneously conclude that the ketogenic diet provides no benefit in terms of protein sparing
compared to a balanced diet (13). Invariably these studies show a gradual improvement in
nitrogen balance over three weeks suggesting that the ketogenic diet might have the benefit in
terms of protein sparing in the longer term (13). Since most dieters do not diet for only three
weeks, longer term changes in nitrogen balance are more important than short term.
Most diet studies are done at extremely low calorie levels, generally less than 800 calories
per day (referred to as a very-low-calorie-diet or VLCD). Although the dietary fat intake has little
effect on nitrogen sparing, the low calorie nature of most studies has an important implication: to
keep calories very low, protein intake must also be low.
Research has established that a minimum protein intake of 1.5 grams protein/kg ideal
body weight is necessary to achieve nitrogen balance (2,14). However, some studies provide as
little as 50 grams of protein per day, drawing erroneous conclusions about the nitrogen sparing
effects of ketogenic diets (15). When protein intake is inadequate to begin with, extra
carbohydrate is significantly protein sparing, especially in the first three weeks while the
adaptations to ketosis are occurring (15). But given adequate protein, carbohydrates appear to
have no additional nitrogen sparing effect.
As the following data shows, providing adequate protein from the first day of even a VLCD
ketogenic diet should prevent any loss of nitrogen. The calculations presented in the last section
suggest that 150 grams of protein per day should be used during at least the first three weeks of
a ketogenic diet. The available studies are examined to see if this value is correct.
How much protein is needed to prevent nitrogen loss?
Having examined this question theoretically in the previous section, we can examine a few
studies to see if the suggested 150 grams of protein per day is correct. Since only a few studies
provided an appropriate amount of protein to its subjects, we will look at these studies in detail.
In a maintenance calorie diet study, six subjects were given 2,800 calories with 135 grams
of protein, 40 grams of carbohydrate and 235 grams of fat for a period of 6 days (15). This was
compared to a diet containing 135 grams of protein, 40 grams of fat, and 475 grams of
carbohydrate. Both diet groups were in positive nitrogen balance from the first day of the study.
As well, the 40 grams of carbohydrate in the ketogenic group spared some protein breakdown. It
would be expected that a lower carbohydrate intake would require a larger intake of protein to
avoid nitrogen losses.
In a second maintenance calorie diet study, subjects received 1.75 g protein/kg ideal body
weight daily (17). Nitrogen balance was attained in most subjects by the second week of the
study. However, since the study did not list how many grams of protein were given to each
subject, it is impossible to determine how much additional protein would have been needed to
establish nitrogen balance from the first day. This study simply supports the idea that nitrogen
balance can be attained quickly on a ketogenic diet, provided that sufficient protein is consumed
In another study, eight men were placed on diets of 1800 calories, containing 115 grams of
58
protein for 9 weeks (18). Carbohydrate intake varied from 104 grams to 60 grams to 30 grams.
Although all three groups were in ketosis to some degree (especially during the first three weeks),
we will only consider that 30 and 60 carbohydrate gram diets as truly ketogenic diets.
Nitrogen balance was slightly negative during the first week of the diet. Approximately 2
grams of nitrogen were lost, equating to 13 grams of protein converted to glucose, meaning that
22 additional grams of protein would have been required to attain nitrogen balance. Added to the
115 grams of protein given, this yields a total of 137 grams of protein to prevent all nitrogen
losses. Nitrogen balance was achieved during week 2 and became slightly positive during the
third week.
In a third study, which examined the metabolic effects of a variety of different dietary
approaches, subjects were studied under a total of 6 different dietary conditions (19). We are only
concerned with three of them. The first was a 400 calorie diet consisting of 100 grams of protein.
In this group the average negative nitrogen balance was -2 grams, the equivalent of 12 grams of
body protein broken down to make glucose. An additional 20 grams of dietary protein (for a total
of 120 grams/day) would have provided this amount of glucose and prevented any nitrogen losses.
When you consider that even 100 grams of protein was unable to prevent nitrogen losses, it is no
surprise that studies using less protein (often only 50 grams per day) than this fail to show
nitrogen sparing with ketogenic diets.
The second dietary approach we are concerned with was a group given 800 calories as 200
grams of protein. In this group, there was a positive nitrogen balance of almost 8 grams/day, the
equivalent of 48 grams of protein. This suggests that a protein intake of 152 grams would have
been sufficient to achieve nitrogen balance, supporting the value of 150 grams from the previous
section.
A third group was given 400 calories of protein and 400 calories of fat and showed the
same negative nitrogen balance as the 400 calories of protein only. This points out that the fat
intake/calorie level of a ketogenic diet does not affect nitrogen balance. Meaning that, protein
calories are far more important than fat calories in terms of achieving nitrogen balance on a
ketogenic diet.
This study is interesting as it shows that nitrogen balance can be attained essentially
regardless of calorie level as long as sufficient protein intake is consumed, as has another study
(20). The difference between the two values for protein intake determined in this study (120
grams and 152 grams) cannot be explained from the data presented.
Do ketogenic diets spare more nitrogen than non-ketogenic diets?
A lack of well done studies makes this question difficult to answer unequivocally. As
mentioned above, the problem is that many studies are very short, generally a few days to a few
weeks. As the studies discussed above show (and discussed in detail in chapter 5), a minimum of
3 weeks is required for the protein sparing adaptations to ketosis to occur.
Most studies comparing ketogenic to non-ketogenic diets are done at very low calorie levels
(VLCD, below 600 cal/day). These have limited applicability to an individual dieting at 10-20%
below maintenance levels as advocated in this book for reasons discussed in detail below.
59
All that can be said from most of these studies is that a non-ketogenic diet will spare
nitrogen better than a ketogenic diet as long as the diet periods are less than three weeks
(13,16,19,21). The problem being that diets are rarely used for a period as short as three weeks
in the real world. Some studies show greater nitrogen sparing for the ketogenic diet (22-24) while
others show no advantage (21,23,25) and others show less nitrogen sparing (13,15,26).
At higher calorie levels (maintenance to 1200 calories), there are few studies. One study
at 1200 calories found less lean body mass (LBM) loss for the higher carbohydrate diets (27)
while another found no difference in LBM losses (28). A final study done at 1800 calories found
less nitrogen sparing for the ketogenic diet during the first three weeks of the diet but greater
nitrogen sparing during the last three weeks of the diet (18).
Summary
Arguably the most critical aspect to prevent nitrogen losses on a ketogenic diet is the
consumption of adequate protein. It should be noted that there is great variability in how well
people spare protein on a ketogenic diet. On average it appears that a protein intake of at least
120-150 grams per day should be sufficient to maintain nitrogen balance, regardless of calorie
levels. However, this value does not include any additional protein needed to cover exercise, and
none of these studies have discussed weight training individuals. This topic of exercise and
protein requirements is discussed in chapter 9.
It is difficult to draw any good conclusions about the relative effects on protein sparing for
ketogenic versus non-ketogenic diets. The general study designs, incorporating very short study
periods, very low calories and inadequate protein make it impossible to draw conclusions for an
individual dieting at twenty percent below maintenance calories, with adequate protein, and who
is exercising. The limited studies done at higher calorie and higher protein levels suggest that the
ketogenic diet is no worse in terms of protein sparing than a non-ketogenic diet, assuming that
adequate protein is given. One study suggests that protein sparing is better as long as adequate
protein is given and the adaptations to ketosis are allowed to occur.
Anecdotal evidence suggests that there is great variety in muscle loss when individuals
diet. Many individuals can avoid muscle loss effectively with any number of diets while others
find that muscle losses are much less on a ketogenic diet compared to a more balanced diet. By
the same token, some individuals find that their muscle loss is greater on a ketogenic diet versus
a more traditional diet.
The implication of the above data is this: if an individual finds that they lose too much
muscle on a balanced diet, with a reasonable deficit, and adequate protein, a ketogenic diet may
be worth trying. By corollary, if an individual finds that they are losing lean body mass on a
ketogenic diet (as indicated by changes in body composition measurements or consistent losses of
strength in the gym), and protein intake is adequate, it should be concluded that the adaptations
to ketosis are not sufficient to prevent protein losses and a more ‘balanced’ dietary approach
should be tried.
60
Section 4: Water and weight loss
Having discussed the topic of nitrogen sparing we can finally examine the effects of
ketogenic diets on the other aspects of body composition: water, weight and fat loss. The question
then to be answered is whether a ketogenic diet will cause more weight and/or fat loss than a nonketogenic diet with the same calories. As with the sections on protein sparing, study methodology
makes makes it impossible to absolutely answer this question. Prior to discussing the effects of
the ketogenic diet on body composition, a few comments about the various studies cited by both
the pro- and anti-ketogenic groups are in order.
Problems with the studies
Most of the early ketogenic diet studies looked at weight loss only, making no distinction
between fat, water and muscle loss. As discussed in chapter 8, a dieter’s goal should be maximal
fat loss with minimal muscle loss. Since water weight can be gained or lost quickly, it should not
be used as the factor to determine whether a ketogenic or balanced diet is the optimal approach.
Likewise, many early studies, which are frequently cited by pro-ketogenic authors,
confused water loss with fat loss due to methodological problems. These studies should not be
considered as evidence either for or against a ketogenic diet.
Many early diet studies were extremely short in duration, five to ten days in some cases.
This makes drawing valid conclusions about the effectiveness of a given diet approach impossible
as results are confounded by the rapid water losses which occurs in the first few days. In very
short term studies, a ketogenic diet will almost always show greater weight loss because of fluid
losses. However, the amount of fat loss which can occur in this period of time is negligible in
almost any diet study. As well, since few dieters pursue fat loss for only 10 days, studies of this
duration have limited applicability.
The early studies
A number of studies done in the 50’s and 60’s showed almost magical results from lowcarbohydrate, high-fat diets. The primary result was significantly greater weight loss for low
versus high carbohydrate diets in obese subjects (29,30). This led researchers involved to
conclude that there was an enhancement of metabolism with the high fat diets, a sentiment
echoed by some popular diet book authors. It was suggested that ketogenic diets caused the
secretion of a ‘fat mobilizing substance’ which enhanced fat loss (31,32), but this substance was
never identified.
In these studies, obese subjects lost weight on a 2600 calorie high fat diet but lost no
weight when put on a 2000 calorie higher carbohydrate diet (29,30). As these studies attempted
to measure changes in lean body mass as well, they concluded that large amounts of fat were
being lost on the high fat, but not the high-carbohydrate diets.
As would be expected, results of this nature were far too good to be true. The very short
61
term nature of the studies, 9 days or less, as well as the rapid weight loss which occurred in the
first few days of the high fat diets, indicate that the supposed fat loss which was occurring was
coming primarily from changes in water balance (33,34), which can contribute anywhere from 5
to 15 lbs of weight loss within a few days (see next section). Later studies using the same
experimental design, determined that the weight lost and counted as fat was water and that there
was no ‘metabolic advantage’ to low carbohydrate diets in terms of weight loss (35,36).
Water loss on the ketogenic diet
A well established fact is that low-carbohydrate diets tend to cause a rapid loss of water in
the first few days. This occurs for several reasons. First and foremost, glycogen is stored along
with water in a ratio of three grams of water for every gram of stored carbohydrate (37). As
glycogen is depleted, water is lost. For large individuals, this can represent a lot of weight.
Additionally, ketones appear to have a diuretic effect themselves causing the excretion of
water and electrolytes (38). This includes the excretion of sodium, which itself causes water
retention. Electrolyte excretion is discussed in greater detail in the next chapter.
Due to confusions about weight loss and fat loss (see chapter 8), many individuals are
drawn to low-carbohydrate diets specifically for the rapid initial loss of water weight. During the
first few days of a ketogenic diet, water loss has been measured from 4.5 to 15 lbs (17,39-41).
Although transient, this rapid initial weight loss can provide psychological incentive for
dieters, which may mean greater compliance with the diet. In one study of subjects on a verylow-calorie ketogenic diet adhered to their diet much more than individuals consuming more
carbohydrate, and who lost less weight (8).
Regardless of possible psychological benefits, it should be understood that the initial weight
loss on a ketogenic diet is water. This is especially critical for when individuals come off of a
ketogenic diet, either deliberately or because they ‘cheated’. The rapid weight gain which occurs
when carbohydrates are reintroduced into the diet, which can range from three to five pounds in
one day, can be as psychologically devastating to dieters as the initial weight loss was beneficial.
In the same way that fat cannot be lost extremely rapidly, it is physiologically impossible to gain
three to five pounds of true bodyfat in one day. This is discussed in more detail in chapter 14 .
A final thing to note is that this water loss can be misinterpreted as a loss of proteincontaining lean body mass (LBM), depending on the method of measurement. (8). This may be
part of the reason that some studies find report a greater loss of LBM for ketogenic versus nonketogenic diets.
Weight loss
The fact that the initial weight loss on a ketogenic diet is from a loss of water weight has
led to a popular belief that the only weight lost on a ketogenic diet is from water, an attitude that
makes little sense. The question then is whether more or less true weight (i.e. non-water) is lost
on a ketogenic diet versus a non-ketogenic diet.
62
In most studies, a low-carbohydrate diet will show a greater total weight loss than a highcarbohydrate (8,18,19,25,26,35) but this is not always the case (10,13,15,22) . Once water loss
has been taken into account, the rate of weight loss seen, as well as the total weight loss is
generally the same for ketogenic versus non-ketogenic diets (35,40). That is, if individuals are put
on a 1200 calorie per day diet, they will lose roughly the same amount of ‘true’ weight (not
including water) regardless of the composition of the diet. As discussed in chapter 2, a loss of
weight is not the sole goal of a diet. Rather the goal is maximization of fat loss with a
minimization of muscle loss.
Section 5: Fat loss
The basic premise of the ketogenic diet is that, by shifting the metabolism towards fat use
and away from glucose use, more fat and less protein is lost for a given caloric deficit. Given the
same total weight loss, the diet which has the best nitrogen balance will have the greatest fat
loss. Unfortunately a lack of well done studies (for reasons discussed previously) make this
premise difficult to support.
Before discussing the studies on ketogenic diets, a related approach, called the protein
sparing modified fast (PSMF) is discussed. Following that, changes in body composition are
discussed at three calorie levels: maintenance calories, below 1200 calories per day, and finally
between 10% below maintenance and 1200 calories per day.
The PSMF
The PSMF is a ketogenic regimen designed to maximize fat loss while minimizing protein
losses. The sole source of calories are lean proteins which provide 1.5 grams of protein per
kilogram of ideal body mass (which is used to estimate lean body mass) or approximately 0.7-0.8
grams of protein per pound. (14,20,42-44). Vitamins and minerals are given to avoid the
problems discussed in chapter 7 and no other calories are consumed (42,44).
The total caloric intake of the PSMF is extremely low, generally 600-800 calories per day
or less. Once the adaptations to ketosis have occurred, the remainder of the day’s caloric
requirements are derived from bodyfat. For an average size male, with a basal metabolic rate of
2700 calories per day, this may represent 2500 calories or 280 grams of fat (approximately 0.7 lb
of fat) used per day.
Fat losses of 0.2 kilograms/day (0.45 lbs) in women and 0.3 kilograms/day (0.66 lbs) in men
can be achieved and weight losses of three to five pounds per week are not uncommon (44,45).
This can be achieved with only small losses of protein, which occur primarily during the first three
weeks while the adaptations to ketosis are occurring.
Additionally, appetite tends to be blunted in some individuals, making adherence easier.
Finally, there are typically improvements in blood pressure, blood glucose, and blood lipids while
on the PSMF (44). These effects make the PSMF is a very attractive approach for fat loss.
However, the PSMF has drawbacks which make it unsuitable for do-it-yourself dieters.
63
First and foremost, the extremely low calorie nature of the PSMF makes medical supervision an
absolute requirement as frequent blood tests must be performed to watch for signs of metabolic
abnormalities (44). Additionally, the excessively low calories will cause a decrease in metabolic
rate making weight regain more likely than if a more moderate approach is used.
Typically the PSMF is only used with cases of morbid obesity, when the risks associated
with the PSMF are lower than the risks associated with remaining severely obese, and where
rapid weight loss is required (44,45). In fact, the PSMF has been shown to be more effective in
individuals who are obese versus those who are lean (43,46).
The ketogenic diet at maintenance calories
A popular belief states that fat can be lost on a ketogenic diet without the creation of a
caloric deficit. This implies that there is an inherent ‘calorie deficit’, or some sort of metabolic
enhancement from the state of ketosis that causes fat to be lost without restriction of calories.
There are several mechanisms that might create such an inherent caloric deficit.
The loss of ketones in the urine and breath represents one mechanism by which calories
are wasted. However, even maximal excretion of ketones only amounts to 100 calories per day
(47). This would amount to slightly less than one pound of extra fat lost per month.
Additionally since ketones have fewer calories per gram (4.5 cal/gram) compared to free
fatty acids (9 cal/gram), it has been suggested that more fat is used to provide the same energy
to the body. To provide 45 calories to the body would require 10 grams of ketones, requiring the
breakdown of 10 grams of free fatty acids in the liver, versus only 5 grams of free fatty acids if
they are used directly. Therefore an additional 5 grams of FFA would be ‘wasted’ to generate
ketones.
However, this wastage would only occur during the first few weeks of a ketogenic diet when
tissues other than the brain are deriving a large portion of their energy from ketones. After this
point, the only tissue which derives a significant amount of energy from ketones is the brain.
Since ketones at 4.5 calories/gram are replacing glucose at 4 calories/gram, it is hard to see how
this would result in a substantially greater fat loss. Anecdotally, many individuals do report that
the greatest fat loss on a ketogenic diet occurs during the first few weeks of the diet, but this
pattern is not found in research.
Only one study has examined a long term ketogenic diet at maintenance calories (17).
Elite cyclists were studied while they maintained their training. Over the span of four weeks
there was a small weight loss, approximately 2.5 kilograms (~5lbs) which was quickly gained
back when carbohydrates were refed. This loss most likely represented water and glycogen loss,
and not true fat loss. Whether this would be different with weight training is unknown. But it
does not appear that a ketogenic diet affects metabolism such that fat can be lost without the
creation of a caloric deficit.
Strangely, some individuals have reported that they can over consume calories on a
ketogenic diet without gaining as much fat as would be expected. While this seems to contradict
basic thermodynamics, it may be that the excess dietary fat is excreted as excess ketones rather
than being stored. Frequently these individuals note that urinary ketone levels as measured by
64
Ketostix (tm) are much deeper when they over consume calories. Obviously at some point a
threshold is reached where fat consumption is higher than utilization, and fat will be stored.
One study has examined the effect of increasing amounts of dietary fat while on a lowcarbohydrate diet and found that up to 600 grams of fat per day could be consumed before weight
gain began to occur (48). This effect only occurred in subjects given corn oil, which is high in
essential fatty acids, but did not occur in subjects given olive oil, which is not. The corn oil
subjects reported a feeling of warmth, suggesting increased caloric expenditure which generated
heat. This obviously deserves further research.
The ketogenic diet at very low calorie levels (VLCD, below 1200 cal/day)
As with the studies on protein sparing, VLCD studies comparing ketogenic to nonketogenic diets tend to be highly variable in terms of results. Some studies show greater
weight/fat and less protein losses (19,24,46,49) while others show the opposite
(10,15,21,23,25,26,50). The variability is probably related to factors discussed previously: short
study periods, insufficient protein in many studies, and exceedingly low calorie levels.
Additionally, few studies incorporate exercise, which has been shown to improve fat loss
while sparing muscle loss. Therefore, it is difficult to extrapolate from these studies to the types
of ketogenic diets discussed in this book (with a moderate caloric deficit, sufficient protein, and
exercise). Ultimately these studies should should not be used as evidence for or against ketogenic
diets.
The ketogenic diet at low calorie levels (10% below maintenance to 1200 cal/day)
In contrast to the results seen with ketogenic VLCDs, there is slightly more evidence that
a ketogenic diet will show greater fat loss and less muscle loss than a non-ketogenic diet at higher
calorie levels. However, more research is needed at moderate caloric deficits. Since there are few
studies done comparing fat loss/muscle loss at this caloric level, they are discussed in more detail.
In one of the earliest studies of low-carbohydrate diets, subjects were fed 1800 calories,
115 grams of protein, and varied carbohydrate from 104 grams to 60 grams to 30 grams (18).
Fat was varied in proportion to carbohydrate to keep calories constant. The diet was fed for 9
weeks. Total fat loss was directly related to carbohydrate content with the highest fat loss
occurring with the lowest carbohydrate content and vice versa. Since there were so few subjects
in each group, the data for each subject is presented. The data from this study appears in table
2 on the next page.
By examining the data for each subject, some patterns emerge. First and foremost, there
is a definite trend for greater fat loss and less LBM loss as carbohydrates are decreased in the
diet. However, there is a large degree of variability (note that subject 3 in the medium
carbohydrate group lost less muscle than subject 3 in the low carbohydrate group). Before
drawing any ultimate conclusions from this study, it should be noted that the protein intake is
still below what is recommended in this book, which might change the results in all diet groups.
Additionally, the low carbohydrate nature of all three diets, relative to current dietary
65
recommendations, makes it impossible to draw conclusions between a ketogenic diet and a more
typical high-carbohydrate diet deriving 55-60% of its total calories from carbohydrate.
Table 2: changes in body composition
Group
Carb Protein
(g)
(g)
104 115
Fat
(g)
103
Weight
loss (kg)
8.5
13.9
Fat
loss (kg)
6.6
10.2
LBM
loss (kg)
1.9
2.7
Medium 1
2
3
60
115
122
13.4
11.6
11.8
9.9
9.9
10.9
3.5
1.7
0.9
Low
30
115
133
High
1
2
1
2
3
15.3
16.0
Not measured
14.7
15.0
0.6
1.0
Source: Young CM et. al. Effect on body composition and other parameters in young men of
carbohydrate reduction in diet. Am J Clin Nutr (1971) 24: 290-296.
Two recent studies, both at 1200 calories found no significant difference in the weight or fat
loss between groups consuming high- or low-carbohydrate diets (27,28) However, an examination
of the data shows a trend towards greater fat loss in the lower carbohydrate groups with less
protein loss. The data is summarized below in table 3.
Table 3: Changes in body composition for high- and low-carbohydrate diets
Study
Golay (27)
Length
(weeks)
12
Carbs Protein
(g)
(g)
75
86
135 86
Weight
loss (kg)
10.2
8.6
Fat
loss (kg)
8.1
7.1
LBM
loss (kg)*
2.1
1.4
Alford (28)
10
75
135
225
6.4
5.4
4.8
5.7
4.5
3.7
0.7
0.9
1.1
90
60
45
*Determined as the difference between total weight loss and fat loss
Note: in both studies, the difference in weight, fat and LBM loss was not statistically
significant, due to the high degree of variability among subjects.
Source: Golay A et al. Weight-loss with low or high carbohydrate diet? Int J Obes (1996) 20:
1067-1072 ; and Alford BB et. al. The effects of variations in carbohydrate, protein and fat
content of the diet upon weight loss, blood values, and nutrient intake of adult women. J Am Diet
Assoc (1990) 90: 534-540.
66
Why the discrepancy between VLCD research and moderate caloric deficits?
The discrepancy between research on diets with extreme caloric deficits versus those with
more moderate deficits is perplexing. At first glance it would seem that the greater the caloric
deficit, the more fat which should be lost. However in practice, even with sufficient dietary
protein, this is rarely the case, especially in the first few weeks of a diet. Although the reasons for
this discrepancy are unknown, some speculation is warranted.
It appears that there are certain caloric thresholds beyond which the physiological
responses to diet and exercise change. As discussed in chapter 22, exercise has its greatest
impact in increasing fat loss and decreasing muscle loss with moderate caloric deficits. (51) Once
calories are reduced below a certain point, exercise generally stops having a significant effect.
It may also be that once calorie levels fall below a certain level, there is increased muscle
loss regardless of diet, especially in the first few weeks. That is, for reasons which are not entirely
understood, the body appears to be limited in the quantity of fat it can breakdown without some
loss of protein (52). This makes it difficult to measure significant differences in bodyfat and
protein losses, simply because they are so high in both ketogenic and non-ketogenic VLCDs.
This speculation is consistent with studies on metabolic rate showing a much larger
decrease in metabolic rate once calories reach a certain low level (53,54). Hence this book’s
recommendation to use moderate caloric restriction with exercise. It is interesting that the study
done with the highest caloric intake (1800 calories/day) showed the most significant differences in
fat and weight loss ; but more research is needed at this calorie level.
Along with this is the issue of inadequate protein, discussed previously in this book. The
low-calorie nature of the VLCD mandates low protein levels. With only 400 calories per day, the
maximum amount of protein which could be consumed would be 100 grams, still lower than the
150 grams required to prevent all nitrogen losses determined in the last chapter. Low protein
intake may be one cause of the decrease in metabolic rate with VLCDs (55) and it seems
reasonable that this could have an impact on fat loss/LBM loss as well.
Summary
The effects of the ketogenic diet on weight and water loss are fairly established. In general,
due to the diuretic nature of ketones, total weight and water loss will generally be higher for a
ketogenic diet compared to a non-ketogenic diet. However, once water losses, which may
represent a weight loss of 5 pounds or more, are factored out, the true weight loss from a
ketogenic diet is generally the same as for a non-ketogenic diet of the same calorie level. This is
especially true at low calorie levels.
The research on fat and LBM losses are more contradictory and may be related to calorie
level. At maintenance calories, fat loss will not occur. At extremely low calorie levels, below 1200
per day and lower, there are some studies suggesting that a ketogenic diet causes more fat/less
LBM loss than a non-ketogenic diet while other studies support the opposite. In all likelihood, the
differences are due to variations in study design, protein intake, study length, etc. Because these
studies do not mimic the types of ketogenic diets described in this book, with a moderate caloric
67
deficit, adequate protein, and exercise, they should not be used as evidence for or against the
ketogenic diet.
At more moderate caloric levels, one early study has shown that fat loss increased as
carbohydrate intake decreased. Two recent studies showed no statistically significant
differences, but there was a trend towards greater fat loss and less muscle loss as carbohydrate
quantity came down. An important note is the high degree of variability in subject response to
the different diets. None of these studies provided what this author considers to be adequate
amounts of protein.
Perhaps the proper conclusion to be drawn from these studies is the variety of approaches
which can all yield good results. At the very least, a properly designed ketogenic diet with
adequate protein appears to give no worse results than a non-ketogenic diet with a similar caloric
intake. Some research suggests that it may give better results. Anecdotally many individuals
report better maintenance of lean body mass for a SKD/CKD compared to a more traditional diet.
This is not universal and others have noted greater LBM losses on a ketogenic diet.
The definitive study comparing a ketogenic to a non-ketogenic diet has yet to be performed.
It would compare fat loss/muscle loss for a ketogenic diet at 10-20% below maintenance calories,
with adequate protein, and weight training to a higher carbohydrate diet with the same calories,
protein intake, and exercise.
Ultimately, fat loss depends on expending more calories than are consumed. Some
individuals have difficulty restricting calories on a high-carbohydrate diet. If lowering
carbohydrates and increasing dietary fat increases satiety, and makes it easier to control
calories, then that may be the better dietary choice. Other potential pros and cons of the
ketogenic diet are discussed in the next chapter.
References Cited
1. Withrow CD. The ketogenic diet: mechanism of anticonvulsant action. Adv Neurol (1980)
27: 635-642.
2. Phinney S. Exercise during and after very-low-calorie dieting. Am J Clin Nutr (1992)
56: 190S-194S
3. Jungas RL et. al. Quantitative analysis of amino acid oxidation and related gluconeogenesis
in humans Phys Rev (1992) 72: 419-448
4. Cahill G. Starvation. Trans Am Clin Climatol Assoc (1982) 94: 1-21.
5. Felig P. et. al. Blood glucose and gluconeogenesis in fasting man. Arch Intern Med (1969)
123: 293-298.
6. Bortz WM et. al. Glycerol turnover in man. J Clin Invest (1972) 51: 1537-1546.
7. Yang MU et. al. Estimation of composition of weight loss in man: a comparison of methods.
J Appl Physiol (1977) 43: 331-338.
8. Krietzman S. Factors influencing body composition during very-low-calorie diets.
Am J Clin Nutr (1992) 56 (suppl): 217S-223S.
9. Lemon P. Is increased dietary protein necessary or beneficial for individuals with a physically
active lifestyle? Nutrition Reviews (1996) 54: S169-S175.
10. Yang MU and Van Itallie TB. Variability in body protein loss during protracted severe caloric
restriction: role of triiodothyronine and other possible determinants. Am J Clin Nutr (1984)
68
40: 611-622.
11. Flatt JP and Blackburn GL. The metabolic fuel regulatory system: implications for protein
sparing therapies during caloric deprivation and disease. Am J Clin Nutr (1974)
27: 175-187.
12. Blackburn GL et. al. Protein sparing therapy during periods of starvation with sepsis or
trauma. Ann Surg (1973) 177: 588-594.
13. Hendler R and Bonde AA. Very low calorie diets with high and low protein contest: impact on
triiodothyronine, energy expenditure and nitrogen balance. Am J Clin Nutr (1988)
48: 1239-1247.
14. Davis PG and Phinney SD. Differential effects of two very low calorie diets on aerobic and
anaerobic performance. Int J Obes (1990) 14: 779-787.
15. Vazquez J and Adibi SA. Protein sparing during treatment of obesity: ketogenic versus
nonketogenic very low calorie diet. Metabolism (1992) 41: 406-414.
16. Swendseid ME et. al. Plasma amino acid levels in subjects fed isonitrogenous diets containing
different proportions of fat and carbohydrate. Am J Clin Nutr (1967) 20: 52-55.
17. Phinney SD et. al. The human metabolic response to chronic ketosis without caloric
restriction: physical and biochemical adaptations. Metabolism (1983) 32: 757-768.
18. Young CM et. al. Effect on body composition and other parameters in young men of
carbohydrate reduction in diet. Am J Clin Nutr (1971) 24: 290-296.
19. Bell J. et. al. Ketosis, weight loss, uric acid, and nitrogen balance in obese women fed single
nutrients at low caloric levels. Metab Clin Exp (1969) 18:193-208.
20. Bistrian BR et. al. Effect of a protein-sparing diet and brief fast on nitrogen metabolism in
mildly obese subjects. J Lab Med (1977) 89:1030-1035
21. Yang MU and VanItallie TB. Composition of weight lost during short-term weight reduction.
Metabolic responses of obese subjects to starvation and low-calorie ketogenic and
nonketogenic diets. J Clin Invest (1976) 58: 722-730.
22. Hoffer LJ et. al. Metabolic effects of very low calorie weight reduction diets. J Clin Invest
(1984) 73: 750-758.
23. Golay A. et. al. Similar weight loss with low- or high-carbohydrate diets. Am J Clin Nutr
(1996) 63: 174-178.
24. Morgan WD et. al. Changes in total body nitrogen during weight reduction by very-low-calorie
diets. Am J Clin Nutr (1992) 56 (suppl): 26S-264S.
25. DeHaven JR at. al. Nitrogen and sodium balance and sympathetic-nervous-system activity
in obese subjects treated with a very low calorie protein or mixed diet. N Engl J Med
(1980) 302: 302-477.
26. Dietz WH and Wolfe RR. Interrelationships of glucose and protein metabolism in obese
adolescents during short term hypocaloric dietary therapy. Am J Clin Nutr (1985)
42: 380--390.
27. Golay A et al. Weight-loss with low or high carbohydrate diet? Int J Obes (1996)
20: 1067-1072.
28. Alford BB et. al. The effects of variations in carbohydrate, protein and fat content of the diet
upon weight loss, blood values, and nutrient intake of adult women. J Am Diet Assoc
(1990) 90: 534-540.
29. Kekwick A and Pawan GLS. Metabolic study in human obesity with isocaloric diets high in
fat, protein, and carbohydrate. Metabolism (1957) 6: 447-460.
30. Kekwick A and Pawan GLS. Calorie intake relation to bodyweight changes in the obese.
Lancet (1956) 155-161.
69
31. Chalmers TM et. al. On the fat-mobilising activity of human urine Lancet (1958) 866-869.
32. Chalmers TM et. al. Fat-mobilising and ketogenic activity of urine extracts: Relation to
corticotrophin and growth hormones. Lancet (1960) 6-9.
33. Grande F Letters to the editor: (Fasting versus a ketogenic diet). Nutr Rev (1967)
25:189-191
34. Grande F. Energy balance and body composition: a critical study of three recent publications.
Ann Int Med (1968) 68: 467-480.
35. Werner SC Comparison between weight reduction on a high calorie, high fat diet and on a
isocaloric regimen high in carbohydrate. New Engl J Med (1955) 252: 604-612.
36. Oleson ES and Quaade F. Fatty foods and obesity. Lancet (1960) 1:1048-1051
37. “Textbook of Biochemistry with Clinical Correlations 4th ed.” Ed. Thomas M. Devlin.
Wiley-Liss 1997.
38. Sigler MH. The mechanism of the natiuresis of fasting. J Clin Invest (1975) 55: 377-387.
39. Olsson KE and Saltin B. Variations in total body water with muscle glycogen changes in man.
Acta Physiol Scand (1970) 80: 11-18.
40. Pilkington TRE et. al. Diet and weight reduction in the obese. Lancet (1960) 1: 856-858.
41. Kreitzman SN et. al. Glycogen storage: illusions of easy weight loss, excessive weight regain,
and distortions in estimates of body composition. Am J Clin Nutr (1992) 56: 292S-293S.
42. Bistrian B. Recent developments in the treatment of obesity with particular reference to
semistarvation ketogenic regimens. Diabetes Care (1978) 1: 379-384.
43. Palgi A. et. al. Multidisciplinary treatment of obesity with a protein-sparing modified fast:
Results in 668 outpatients. Am Journal Pub Health (1985) 75: 1190-1194.
44. Walters JK et. al. The protein-sparing modified fast for obesity-related medical problems.
Cleveland Clinical J Med (1997) 64: 242-243.
45. Bistrian BR Clinical use of protein-sparing modified fast. JAMA (1978) 2299-2302.
46. Iselin HU and Burckhardt P. Balanced hypocaloric diet versus protein-sparing modified fast
in the treatment of obesity: A comparative study. Int J Obes (1982) 6:175-181.
47. Council on Foods and Nutrition. A critique of low-carbohydrate ketogenic weight reducing
regimes. JAMA (1973) 224: 1415-1419.
48. Kasper H. et. al. Response of bodyweight to a low carbohydrate, high fat diet in normal and
obese subjects. Am J Clin Nutr (1973) 26: 197-204.
49. Rabast U. et. al. Dietetic treatment of obesity with low and high-carbohydrate diets:
comparative studies and clinical results. Int J Obes (1979) 3: 201-211.
50. Hood CE et. al. Observations on obese patients eating isocaloric reducing diets with varying
proportions of carbohydrate. Br J Nutr (1970) 24: 39.
51. Saris WHM. The role of exercise in the dietary treatment of obesity. Int J Obes (1993)
17 (suppl 1): S17-S21.
52. Owen OE et. al. Protein, fat and carbohydrate requirements during starvation: anaplerosis
and cataplerosis. Am J Clin Nutr (1998) 68: 12-34.
53. Saris WHM. Effects of energy restriction and exercise on the sympathetic nervous system.
Int J Obes (1995) 19 (suppl 7): S17-S23.
54. Prentice AM et. al. Physiological responses to slimming. Proc Nutr Soc (1991) 50: 441-458.
55. Whitehead JM et. al. The effect of protein intake on 24-h energy expenditure during energy
restriction. Int J Obes (1996) 20: 727-732.
70
Chapter 7:
Other effects of the ketogenic diet
The ketogenic diet has numerous metabolic effects, many of which are discussed in the
previous chapters. However there are numerous other metabolic effects that need to be
discussed as well as concerns which are typically raised regarding the ketogenic diet.
This chapter is a catch-all to discuss any effects on the body that have not been discussed
in previous chapters. It examines the effects (and side-effects) of the metabolic state of ketosis
on the human body. As well, some of the major health concerns which have been voiced regarding
the ketogenic diet are addressed here.
There are ultimately two main concerns regarding the ketogenic diet in terms of health
risks. The first is the potential negative effects of the ‘high protein’ intake of the ketogenic diet.
Additionally, there is the effect of high levels of ketones. They are discussed as needed below.
Please note that not all of the effects of ketosis on human physiology are known at this
time. Ketosis has been studied for almost 100 years and will most likely continue to be studied so
any information provided here represents only the current base of knowledge. For this discussion,
no distinction is made, except as necessary, between starvation ketosis and dietary ketosis.
A note on long-term effects
There are few studies of the long term effects of a ketogenic diet. One of the few, which
followed two explorers over a period of 1 year was done almost 70 years ago (1). Beyond that
study, the two models most often used to examine the effects of the ketogenic diet are the Inuit
and pediatric epilepsy patients. Epileptic children have been studied extensively, and are kept in
ketosis for periods up to three years. In this group, the major side effects of the ketogenic diet are
elevated blood lipids, constipation, water-soluble vitamin deficiency, increased incidence of kidney
stones, growth inhibition, and acidosis during illness.
However, the pediatric epilepsy diet is not identical the the typical ketogenic diet used by
dieters and healthy adults, especially in terms of protein intake, and may not provide a perfect
model. While studies of epileptic children give some insight into possible long term effects of a
ketogenic diet, it should be noted that there are no studies of the long-term effects of a CKD or
similar diet approach. The consequences of alternating between a ketogenic and non-ketogenic
metabolism are a total unknown. For this reason, it is not recommended that a CKD, or any
ketogenic diet, be followed indefinitely.
Insulin resistance
Although low-carbohydrate diets tend to normalize insulin and blood glucose levels in many
individuals, a little known effect is increased insulin resistance when carbohydrates are refed.
There is little research concerning the physiological effects of refeeding carbohydrates after long71
term ketogenic dieting although fasting has been studied to some degree. Early ketogenic diet
literature mentions a condition called ‘alloxan’ or ‘starvation diabetes’, referring to an initial
insulin resistance when carbohydrates are reintroduced to the diet following carbohydrate
restriction (2).
In brief, the initial physiological response to carbohydrate refeeding looks similar to what is
seen in Type II diabetics, namely blood sugar swings and hyperinsulinemia. This type of
response is also seen in individuals on a CKD. It should be noted that this response did not occur
universally in research, being more prevalent in those who had preexisting glucose control
problems. As well, exercise appears to affect how well or poorly the body handles carbohydrates
during refeeding.
One hypothesis for this effect was that ketones themselves interfered with insulin binding
and glucose utilization but this was shown not to be the case (3,4). In fact, ketones may actually
improve insulin binding (2). The exact reason for this ‘insulin resistance’ was not determined until
much later. The change was ultimately found to be caused by changes in enzyme levels,
especially in those enzymes involved in both fat and carbohydrate burning (5). High levels of free
fatty acid levels also affect glucose transport and utilization (6).
Long periods of time without carbohydrate consumption leads to a down regulation in the
enzymes responsible for carbohydrate burning. Additionally, high levels of free fatty acids in the
bloodstream may impair glucose transport (6).
This change occurs both in the liver (5) and in the muscle (5,7). During carbohydrate
refeeding, the body upregulates levels of these enzymes but there is a delay during which the body
may have difficulty storing and utilizing dietary carbohydrates. This delay is approximately 5
hours to upregulate liver enzyme levels and anywhere from 24-48 hours in muscle tissue (8,9).
While there is a decrease in carbohydrate oxidation in the muscle, this is accompanied by an
increase in glycogen storage (7).
These time courses for enzyme up-regulation correspond well with what is often seen in
individuals on a CKD, which is really nothing more than a ketogenic diet followed by carbohydrate
refeeding done on a weekly basis. Frequently, individuals will report the presence of urinary
ketones during the first few hours of their carb-loading period, seeming to contradict the idea that
carbohydrates always interrupt ketosis. This suggests that the liver is continuing to oxidize fat
at an accelerated rate and that ingested carbohydrates are essentially not being ‘recognized’ by
the liver.
After approximately 5 hours, when liver enzymes upregulate, urinary ketone levels
typically decrease as liver glycogen begins to refill. Another interesting aspect of carbohydrate
refeeding is that liver glycogen is not initially refilled by incoming glucose. Rather glucose is
released into the bloodstream for muscle glycogen resynthesis (especially if muscle glycogen
stores are depleted) initially, refilling liver glycogen later.
In practice, many individuals report what appears to be rebound hypoglycemia (low blood
sugar) either during the carb-up or during the first few days of eating carbohydrates when
ketogenic eating is ended, for the reasons discussed above.
Ketones themselves do not appear to alter how cells respond to insulin (4) which goes
against the popular belief that ketogenic diets somehow alter fat cells, making them more likely
to store fat when the ketogenic diet is ended. Practical experience shows this to be true, as many
72
individuals have little trouble maintaining their bodyfat levels when the ketogenic diet is stopped,
especially if their activity patterns are maintained.
Appetite suppression
An unusual effect of complete fasting is a general decrease in appetite after a short period
of time. Additionally, studies which restrict carbohydrate but allow ‘unlimited’ fat and protein find
that calorie intake goes down compared to normal levels further suggesting a link between
ketosis and appetite (10,11).
Since continued fasting causes an increase in ketone bodies in the bloodstream, achieving
a maximum in 2-3 weeks, it was always assumed that ketones were the cause of the appetite
suppression (12). As with many aspects of ketosis (in this case starvation ketosis), this
assumption was never directly studied and propagated itself through the literature without
challenge. Recent research indicates that ketones per se are most likely not the cause of the
decreased appetite during ketosis.
As discussed in chapter 9, several studies have shown an automatic decrease in caloric
intake (and presumably appetite) when individuals restrict carbohydrates to low levels, despite
being told to eat ‘unlimited’ amounts of fat and protein. In one study the ketogenic diet
suppressed appetite moreso than a balanced diet where an appetite suppressant was given (13).
Several studies have compared appetite on a very low calorie (below 800 calories/day)
ketogenic diet versus appetite on a balanced diet with the same calories (14,15). In general, no
difference was seen in appetite between the two diets. This leads researchers to think that
ketones do not blunt appetite in and of themselves. Rather two possible mechanisms seem a
more likely explanation for the appetite blunting seen with a ketogenic diet.
First, is the relatively higher fat content of the ketogenic diet compared to other diets. Fat
tends to slow digestion, meaning that food stays in the stomach longer, providing a sense of
fullness. The same has been shown to for protein (14). Additionally, protein stimulates the
release of the hormone cholecystokinin (CCK) which is thought to help regulate appetite.
However, studies using very-low-calorie intake (and hence low dietary fat intakes) have
documented this same blunting of appetite, suggesting a different mechanism. Rather than the
effects of dietary fat, the researchers argue that what is perceived as a blunting of appetite is
simply a return to baseline hunger levels.
That is, during the initial stages of a diet, there is an increase in appetite, which is followed
by a decrease over time. It is this decrease which is being interpreted by dieter’s as a blunting of
appetite (14,15).
Overall, the data supporting an appetite suppressing effect of ketogenic diets points to a
mechanism other than ketones. This is not to say that appetite may not be suppressed on a
ketogenic diet, only that it is most likely not ketones or metabolic ketosis which are the cause of
the suppression.
Anecdotally, some individuals have a strong suppression of appetite while others do not.
This discrepancy can probably be ascribed to individual differences. If a dieter’s appetite is
suppressed substantially on a ketogenic diet, it may be difficult for them to consume the
73
necessary calories. In this case, the use of calorically dense foods such as mayonnaise and
vegetable oils can be used to increase caloric intake. If appetite is not suppressed on a ketogenic
diet, less calorically dense foods can be consumed.
Cholesterol levels
The relatively high fat intake of the ketogenic diet immediately raises concerns regarding
the effects on blood lipids and the potential for increases in the risk for heart disease, stroke, etc.
Several key players in relative risk for these diseases are low density lipoproteins (LDL, or ‘bad
cholesterol’), high density lipoproteins (HDL, or ‘good cholesterol’) and blood triglyceride levels
(TG). High levels of total cholesterol, and high levels of LDL correlate with increased disease risk.
High levels of HDL are thought to exert a protective effect against cholesterol-related disease.
The overall effects of implementing a ketogenic diet on blood cholesterol levels are far from
established. Early short-term studies showed a large increase in blood lipid levels (16,17).
However, later studies have shown either no change or a decrease in cholesterol levels (18-20).
One problem is that few long term studies are available on the ketogenic diet, except in
epileptic children. In this population, who are kept in deep ketosis for periods up to three years,
blood lipid levels do increase (21,22). However, the ketogenic diet is not thought to be atherogenic
due to the fact that any negative effects induced by three years in ketosis will be corrected when
the diet is ended (22).
It has been shown that Inuits, who maintain a ketogenic diet for long periods of time every
year, do not develop heart disease as quickly as other Americans (23), suggesting that there are
no long term effects. However, this may be related to the fact that a ketogenic diet is not
continued indefinitely. There may be a slow removal of cholesterol from the arteries during time
periods when a more balanced diet is being followed (23).
Most of the degenerative diseases thought to be linked to high blood lipid levels take years
(or decades) to develop. Unless an individual is going to stay on a ketogenic diet for extremely long
periods of time, it is not thought that there will be appreciable problems with cholesterol buildup.
From a purely anecdotal standpoint, some individuals who have undergone testing show a
complete lack of cholesterol buildup in their arteries.
Another problem is that weight/fat loss per se is known to decrease cholesterol levels and it
is difficult to distinguish the effects of the ketogenic diet from the effects of the weight/fat loss
which occurs. A few well designed studies allow us to make the following rough generalizations:
1. If an individual loses weight/fat on a ketogenic diet, their cholesterol levels will go down
(18,24,25) ;
2. If an individual does not lose weight/fat on a ketogenic diet, their cholesterol levels will go up
(24,26).
As well, there can be a decrease followed by increase in blood lipid levels (27). This is
thought to represent the fact that body fat is a storehouse for cholesterol and the breakdown of
bodyfat during weight loss causes a release of cholesterol into the bloodstream (27). Additionally,
women may see a greater increase in cholesterol than men while on the ketogenic diet although
the reason for this gender difference in unknown (28). In practical experience however, there is a
74
great range of responses among individuals on a ketogenic diet. Some show a drastic decrease in
cholesterol while others shown an increase.
Changes in blood TG levels are also common on the ketogenic diet. Somewhat
counterintiuitively, there is generally a decrease in blood TG levels, (28) which may indicate
greater uptake of TG by tissues such as skeletal muscle.
Since no absolute conclusions can be drawn regarding cholesterol levels on a ketogenic diet,
dieters are encouraged to have their blood lipid levels monitored for any negative responses.
Ideally, blood lipid levels should be checked prior to starting the diet and again 6-8 weeks later. If
repeat blood lipid tests show a worsening of lipid levels, saturated fats should be substituted with
unsaturated fats or the diet should be abandoned.
Low energy levels
Carbohydrates are the body’s preferred fuel when they are available (see chapter 4). As
well, they burn more efficiently than fats. Many individuals voice concerns about drops in general
energy levels (not including exercise) on a ketogenic diet due to the lack of carbohydrates.
Many subjects in early studies on ketosis or the PSMF noted transient lethargy and
weakness. As well many studies noted a high occurrence of orthostatic hypotension which is a
drop in blood pressure when individuals move from a sitting to standing position. This caused
lightheadedness in many individuals. It was always taken for granted that ketosis caused this to
happen.
However, later studies established that most of these symptoms could be avoided by
providing enough supplemental minerals, especially sodium. Providing 4-5 grams of sodium per
day (not much higher than the average American diet) prevents the majority of symptoms of
weakness and low energy, possibly by maintaining normal blood pressure (26).
In most individuals fatigue should disappear within a few days to a few weeks at most. If
fatigue remains after this time period, small amounts of carbohydrates can be added to the diet,
as long as ketosis is maintained, or the diet should be abandoned for a more balanced diet.
The effects of ketogenic diets on exercise are discussed in chapter 22. To summarize,
ketogenic diets can generally sustain low-intensity aerobic exercise without problem after a
period of adaptation. However because carbohydrates are an absolute requirement to sustain
high intensity exercise such as weight training or high-intensity aerobic exercise, a standard
ketogenic diet is not appropriate.
Effects on the brain
A well known effect of ketogenic diets is the increased use of ketones by the brain (29). As
well, some of the effects of the ketogenic diet in treating childhood epilepsy may be due to this
increased extraction of ketones (30,31). Due to the changes which occur, a variety of concerns
has been voiced in terms of possible side-effects. These include permanent brain impairment and
short term memory loss.
75
These concerns are difficult to understand in terms of where they originated. What must
be understood is that ketones are normal physiological substances. As discussed in great detail
in chapter 4, ketones provide the brain with fuel when glucose (or food in general) is not available.
The brain develops the enzymes to use ketones during fetal development and these enzymes are
still present as we age (32), which should serve to illustrate that ketones are normal fuels, and
not toxic byproducts of an abnormal metabolism.
Although not a perfect model, epileptic children provide some insight into possible
detrimental long term effects of the ketogenic diet on brain function. Quite simply, there are no
negative effects in terms of cognitive function (30). Except for some initial transient fatigue,
similar to what is reported in adults, there appears to be no decrement in mental functioning
while on the diet or after it is ended.
However, this is not absolute proof that the ketogenic diet couldn’t have possible long-term
effects on the brain ; simply that no data currently exists to suggest that it will have any
negative effects. Anecdotally, individuals tend to report one of two types of functioning while in
ketosis: excellent or terrible. Some individuals feel that they concentrate better and think more
lucidly while in ketosis ; others feel nothing but fatigue. Differences in individual physiology may
explain the difference.
With regard to short term memory loss, the only study which remotely addresses this
point is a recent study which showed temporary decrements in a trail-making task (which
requires a high degree of mental flexibility) during the first week of a low-calorie ketogenic diet as
compared to a non-ketogenic diet (33). The majority of the effects were seen during the first week
of the diet, and disappeared as the study progressed.
As stated previously, some individuals do note mental fatigue and a lack of concentration
during the first 1-3 weeks of a ketogenic diet. In practical terms, this means that individuals who
operate heavy machinery, or need maximum mental acuity for some reason (i.e. a presentation
or final exam) should not start a ketogenic diet during this time period.
Uric acid levels
Uric acid is a waste product of protein metabolism that is excreted through the kidneys.
Under normal circumstances, uric acid is excreted as quickly as it is produced. This prevents a
buildup of uric acid in the bloodstream which can cause problems, the most common of which is
gout. Gout occurs when urate cause deposit in the joints and cause pain.
High levels of uric acid in the bloodstream can occur under one of two conditions: when
production is increased or when removal through the kidneys is decreased. The ketogenic diet has
been shown to affect the rate of uric acid excretion through the kidneys.
Ketones and uric acid compete for the same transport mechanism in the kidneys. Thus
when the kidneys remove excess ketone bodies from the bloodstream, the removal of uric acid
decreases and a buildup occurs.
Studies of the ketogenic diet and PSMF show a consistent and large (oftentimes doubling or
tripling from normal levels) initial increase in uric acid levels in the blood (24,26). In general
however, levels return towards normal after several weeks of the diet (35). Small amounts of
76
carbohydrates (5% of total daily calories) can prevent a buildup of uric acid (35). Additionally, in
studies of both epileptic children as well as adults the incidence of gout are very few, and only
occur in individuals who are predisposed genetically (12, 26,34).
Related to this topic, uric acid stones have occasionally been found in epileptic children
following the ketogenic diet (36). This appears to be related to high levels of urinary ketones, low
urinary pH and fluid restriction in these patients. It is unknown whether individuals consuming
sufficient water on a ketogenic diet have any risk for this complication.
From a practical standpoint, individuals with a genetic predisposition towards gout should
either include a minimal amount of carbohydrates (5% of total calories) in their diet or not use a
ketogenic diet.
Kidney stones and kidney damage
A common concern voiced about ketogenic diets is the potential for kidney damage or the
passing of kidney stones, presumably from an increase in kidney workload from having to filter
ketones, urea, and ammonia. As well, dehydration can cause kidney stones in predisposed
individuals. Finally, the ‘high-protein’ nature of ketogenic diets alarms some individuals who are
concerned with potential kidney damage.
Overall there is little data to suggest any negative effect of ketogenic diets on kidney
function or the incidence of kidney stones. In epileptic children, there is a low incidence (~5%) of
small kidney stones (22,30). This may be related to the dehydrated state the children are
deliberately kept in rather than the state of ketosis itself (22).
The few short term studies of adults suggest no alteration in kidney function (by
measuring the levels of various kidney enzymes) or increased incidence of kidney stones, either
while on the diet or for periods up to six months after the diet is stopped (26). Once again, the lack
of any long term data prevents conclusions about potential long-term effects of ketosis on kidney
function.
With regards to the protein issue, it should be noted that kidney problems resulting from a
high protein intake have only been noted in individuals with preexisting kidney problems, and little
human data exists to suggest that a high protein intake will cause kidney damage (37). From a
purely anecdotal standpoint, athletes have consumed high protein diets for long periods and one
would expect kidney problems to show up with increasing incidence in this group. But such an
increase has not appeared, suggesting that a high protein intake is not harmful to the kidneys
under normal circumstances (37).
However, much of this is predicated on drinking sufficient water to maintain hydration,
especially to limit the possibility of kidney stones. Individuals who are predisposed to kidney
stones (or have preexisting kidney problems) should consider seriously whether a ketogenic diet is
appropriate for them. If they do choose to use a ketogenic diet, kidney function should be
monitored with regular blood work to ensure that no complications arise.
77
Liver damage
Another concern often raised is for the potential negative effects of a ketogenic diet on the
liver. In one of the few longer-term (4 weeks) studies of the ketogenic diet, liver enzymes were
measured and no change was observed (26). Additionally, no liver problems are encountered in
epileptic children. However, it is unknown whether negative effects would be seen in the longer
term.
Constipation
Arguably one of the more common side-effects seen on a ketogenic diet is that of reduced
bowel movements and constipation (30,34). In all likelihood, this stems from two different
causes: a lack of fiber and increased gastrointestinal absorption of foods.
First and foremost, the lack of carbohydrates in a ketogenic diet means that fiber intake
will be low unless supplements are used. There is no doubt that fiber is an important nutrient to
human health. A high fiber intake has been linked to the prevention of a variety of health
problems including some forms of cancer and heart disease.
To make a ketogenic diet as healthy as possible, some type of sugar-free fiber supplement
should be used. In addition to possibly preventing any health problems, this will help to maintain
bowel regularity. Many individuals find that a large salad containing fibrous vegetables may help
with regularity and should fit easily with the 30 gram carbohydrate limit.
One interesting effect of the ketogenic diet is the typically reduced stool volume seen (30).
Presumably this is due to enhanced absorption/digestion of foods which leads to less waste
products being generated (22).
Vitamin/mineral deficiencies
The restricted food choices of a ketogenic diet raise concerns about possible deficiencies in
vitamin and mineral intake. Any diet which is restricted in calories, whether ketogenic or not, will
show a decrease in micro-nutrient intake compared to a similar diet at higher calories. So the
question is whether the ketogenic diet is more or less nutritionally adequate compared to a
‘balanced’ diet at the same calorie level. While this is a fairly moot point for those who have
already decided to use a ketogenic diet, it is important to examine, if for no other reason than to
know what nutrients should be supplemented to the diet.
It is difficult, if not impossible, to obtain adequate micro-nutrients on any diet containing
less than 1200 calories per day (37). To a great degree, micro-nutrient intake is affected by total
caloric intake regardless of diet. That is, a diet containing 400 calories will have less micronutrients that one containing 2000 calories regardless of composition. Therefore, let us look at
nutrient intake relative to caloric intake (amount of nutrient per calorie).
One researcher did exactly this, comparing nutrient intakes of his low-carbohydrate diet to
the subject’s normal diet (39). He then examined how much micronutrient intake would be
affected if the subject’s normal diets were reduced to the same caloric level as they consumed on
78
the low-carbohydrate diet. As these studies demonstrated, there will obviously be a decrease in
nutrient intake if a subject decreases caloric intake from 1900 to 1400 (39). The question
therefore is whether a 1400 calorie ketogenic diet is more or less nutritionally complete than a
1400 calorie balanced diet.
On an absolute level, small decreases in thiamine, nicotinic acid, calcium and iron were
noted while there were increases in vitamin D and riboflavin. When compared on a relative scale
(amount of nutrient per 1000 calories), nutrient intake was actually higher on the lowcarbohydrate diet (39). It should be noted that the diet studied was higher in carbohydrate
(averaging 67 grams per day) than most ketogenic diets and contained milk. This provides only a
limited model for a diet containing 30 grams of carbohydrate or less per day.
Another study examining nutrient intake of a ketogenic diet at 2100 calories found the
ketogenic diet to provide greater than the RDA for Vitamin A, Vitamin C, riboflavin, niacin, and
phosphorous. There were deficiencies in thiamine, Vitamin B-6, folacin, calcium, magnesium,
iron, zinc and fiber (38).
It should be noted that current research into optimal health and prevention of diseases
focuses on nutrients in vegetables called phytonutrients, which appear to play a protective role in
many diseases. The limited vegetable intake on a ketogenic diet means that these nutrients will
not be consumed to any appreciable degree. This once again points to the fact that the ketogenic
diet should probably not be used long term (unless indicated for medical reasons), or that
individuals on a ketogenic diet should use their small carbohydrate allowance to maximize
vegetable intake.
Due to its restrictive nature, the ketogenic diet can be deficient in certain nutrients.
However this is no different than any other calorically restricted diet in that any reduction in food
intake will result in a reduction in nutrient intake. At the very minimum, a basic multivitamin/mineral (providing at least the RDA for all nutrients) should be taken daily to avoid
deficiencies. Depending on the intake of dairy foods such as cheese, a calcium supplement may
be warranted. Specific nutrients, especially electrolytes are discussed in the next section.
Electrolyte excretion/Death
The diuretic (dehydrating) nature of ketosis causes an excretion of three of the body’s
primary electrolytes: sodium, potassium, and magnesium (31,40). These three minerals are
involved in many processes in the body, one of which is the regulation of muscle contraction,
including the heart. Some studies show a net loss of calcium while others do not (31).
A severe loss of electrolytes is problematic. At the least, it can cause muscle cramping,
which is often reported by individuals on a ketogenic diet. At the extreme, it can compromise
normal heart function.
During the late 1970’s, a large number of deaths occurred in individuals following a 300
calorie per day liquid ketogenic diet called “The Last Chance Diet” (41-43). This diet relied on a
processed protein as its only source of calories and the protein, which was a hydrolyzed collagen
protein with the amino acid tryptophan added to it, contained no vitamins or minerals. As well,
mineral supplements were not given or suggested to individuals on the diet.
79
Several possible causes for these deaths have been suggested, including the direct
breakdown of the heart due to the low quality of protein used (42). A second, and more likely
cause was that the depletion of electrolytes caused fatal heart arrhythmias. As well, given high
quality protein and adequate mineral supplementation, no cardiac abnormalities appear in
individuals on a ketogenic diet (44).
“The Last Chance Diet” should be contrasted to a ketogenic diet based around whole foods.
The intake of whole protein foods will ensure some intake of the three electrolytes. Even so,
studies show that the amount of electrolytes consumed by most on a ketogenic diet is
insufficient. Some of the fatigue which was demonstrated in early ketogenic diet studies may
have occurred from insufficient mineral intake, especially sodium (26).
A known effect of ketogenic diets is a decrease in blood pressure, most likely due to sodium
excretion and water loss. In individuals with high blood pressure (hypertension), this may be
beneficial. Individuals with normal blood pressure may suffer from ‘orthostatic hypotension’
which is lightheadedness which occurs when moving from a sitting to standing posture (45). The
inclusion of sufficient minerals appears to be able to prevent symptoms of fatigue, nausea and
hypotension (26).
To counteract the excretion of minerals on a ketogenic diet, additional mineral intake is
required. Although exact amounts most vary, suggested amounts for the three primary
electrolytes appear below (26,46):
Sodium: 3-5 grams in addition to the sodium which occurs in food
Potassium: 1 gram in addition to the 1-1.5 grams of potassium which occur in food
Magnesium: 300 mg
Note: An excessive intake of any single mineral (especially potassium) can be just as dangerous
as a deficiency. Although the values listed above are averages, individuals are encouraged to
have mineral levels checked to determine the required level of mineral supplementation. At no
time should mineral supplements be taken in excess.
Calcium loss/Osteoporosis
A general belief states that high protein diets may be a causative factor in osteoporosis
but this is still highly debated (47,48). While studies have shown increased calcium excretion
with high protein intakes, this was typically with ‘purified’ proteins (37). It is thought that wholefood proteins do not cause this to occur as the high phosphate content prevents calcium losses
(37). In any event, the ‘high protein’ nature of the ketogenic diet raises concerns about calcium
loss and osteoporosis. There is some evidence that the ketogenic diet causes disordered calcium
metabolism, especially if it is combined with drug treatment for epilepsy (49). This effect is
reversed when adequate Vitamin D is consumed. Additionally, depending on dairy intake, a
calcium supplement may be necessary to ensure positive calcium balance. The current
guidelines for calcium intake are 1200 milligrams/day for men and pre-menopausal women and
1500 mg/day for post-menopausal women.
80
Weight/Fat regain
It is well known that dieting alone shows extremely poor rates of long term success.
Typically less than 5-10% of individuals who lose weight through dieting alone will maintain that
weight loss in the long term. The effects and implications of coming off a ketogenic diet are
discussed in chapter 14. In brief, any fat loss efforts based on caloric restriction alone are
typically bound for failure, regardless of whether the diet used is ketogenic or not.
For some reason, there is a concern that weight regain is more of an issue on ketogenic
diets than other diets. This most likely stems from the confusion between the loss of body weight
and the loss of bodyfat (see chapter 8). The dehydration and glycogen depletion which occurs on
ketogenic diets can be anywhere from 1 to 15 pounds of bodyweight. Thus it is to be expected
that this weight will be regained when carbohydrates are reintroduced into the diet (either
because the diet is being stopped, or for carb-ups as with a CKD).
For individuals who fixate on the scale as the only measure of their progress, this weight
regain can be disheartening and may make the individual fear carbohydrates as the source of
their excess body weight. Dieters must realize that the initial weight gain is water and glycogen
(carbohydrate stored in the muscle) and move past it. Focusing on changes in body composition
(see chapter 8) should avoid psychological problems with the weight regain from replenishing
water and glycogen. Other issues pertaining to returning to a ‘balanced’ diet from a ketogenic (or
cyclical ketogenic diet) are addressed in chapter 14.
Immune system
Anecdotally, there is a great deal of variety in individual response to ketogenic diets in
terms of the immune system. Some individuals have reported a decrease in certain ailments,
notably allergy symptoms, while others become more susceptible to minor sicknesses.
There is limited research into the effects of a ketogenic diet on the immune system with
two studies showing decrements in some indices of immune system status (50,51). However, one
of these studies (50) was done on epileptic children who may consume inadequate protein while
the other was done during a PSMF (51). Therefore, it is difficult to be sure whether it is ketosis, a
lack of protein, or a lack of calories which is causing these decrements in immune system status.
Since no decrease in immune system status was seen when a maintenance calorie ketogenic diet
was given, (26) it would seem that any negative immune systems effects in the other studies
were caused by low calories and inadequate protein.
Optic neuropathy
One unusual side effect of ketogenic diets which has appeared in a few cases is the
development of optic neuropathy, which is a dysfunction of the optic nerve. In all cases, the
problem was linked to the fact that the individuals in question were not receiving calcium or
vitamin supplements for periods of up to a year. Supplementation of adequate B-vitamins,
especially thiamine, corrected all cases which were reported (52,53).
81
Hair loss/changes in finger and toenails
A final effect which has occasionally been noted, primarily during total fasting or the
PSMF, is transient hair loss (34). In a related vein, some individuals have reported changes in
the quality of their finger and toe nails. The cause of this phenomenon is unknown but could
possible be related to protein or vitamin and mineral intake.
Summary
A number of metabolic effects have either been directly or anecdotally observed to occur in
individuals who use the ketogenic diet. As well, a number of health concerns have been voiced,
some valid, some invalid. This chapter addresses the main concerns surrounding the ketogenic
diet, as well as other effects which can occur outside of the major metabolic effects discussed in
the previous chapter.
References Cited
1. Lieb CW. The effects on human beings of a twelve months’ exclusive meat diet. JAMA
(1929) 20-22.
2. Robinson AM and Williamson DH Physiological roles of ketone bodies as substrates and
signals in mammalian tissues. Physiol Rev (1980) 60: 143-187.
3. Kissebah AH. et. al. Interrelationship between glucose and acetoacetate metabolism in human
adipose tissue. Diabetologia (1974) 10: 69-75.
4. Misbin RI et. al. Ketoacids and the insulin receptor. Diabetes (1978) 27: 539-542.
5. “Textbook of Biochemistry with Clinical Correlations 4th ed.” Ed. Thomas M. Devlin.
Wiley-Liss 1997.
6. Roden M et al. Mechanism of free fatty acid-induced insulin resistance in humans.
J Clin Invest. (1996) 97: 2859-2865.
7. Cutler DL. Low-carbohydrate diet alters intracellular glucose metabolism but not overall
glucose disposal in exercise-trained subjects. Metabolism: Clinical and Experimental
(1995) 44: 1364-70.
8. Randle PJ Metabolic fuel selection: general integration at the whole-body level. Proc Nutr Soc
(1995) 54: 317-327.
9. Randle PJ et. al. Glucose fatty acid interactions and the regulation of glucose disposal. J Cell
Biochem (1994) 55 (suppl): 1-11.
10. Yudkin J. and Carey M. The treatment of obesity by a ‘high-fat’ diet - the inevitably of
calories. Lancet (1960) 939.
11. Yudkin J. The low-carbohydrate diet in the treatment of obesity. Postgrad Med (1972)
151-154
12. Cahill G. Starvation. Trans Am Clin Climatol Assoc (1982) 94: 1-21.
13. Kew MC. Treatment of obesity in the Bantu: value of a low-carbohydrate diet with and
without an appetite suppressant. South Africa Med Journal (1970) 44: 1006-1007.
14. Rosen JC et. al. Comparison of carbohydrate-containing and carbohydrate-restricted
hypocaloric diets in the treatment of obesity: effects on appetite and mood. Am J Clin Nutr
82
(1982) 36: 463-469.
15. Rosen JC et. al. Mood and appetite during minimal-carbohydrate and carbohydratesupplemented hypocaloric diets. Am J Clin Nutr (1985) 42: 371-379.
16. Cham BE et. al. Effect of a high energy, low carbohydrate diet on serum levels of lipids and
lipoproteins. Med J Austr (1981) 1:237-240.
17. Rickman F. et. al. Change in serum cholesterol during the Stillman diet. JAMA (1974)
228: 54.
18. Hoffer LJ et. al. Metabolic effects of very low calorie weight reduction diets. J Clin Invest
(1984) 73: 750-758.
19. Lewis SB et. al. Effect of diet composition on metabolic adaptations to hypocaloric nutrition:
comparison of high carbohydrate and high fat isocaloric diets. Am J Clin Nutr (1977)
30: 160-170.
20. Alford BB et. al. The effects of variations in carbohydrate, protein and fat content of the diet
upon weight loss, blood values, and nutrient intake of adult women. J Am Diet Assoc
(1990) 90: 534-540.
21. Dekaban A. Plasma lipids in epileptic children treated with the high fat diet. Arch Neurol
(1966) 15: 177-184.
22. Swink TD. et. al. The ketogenic diet: 1997. Adv Pediatr (1997) 44: 297-329.
23. Ho JJ et. al. Alaskan arctic Eskimo: responses to a customary high fat diet. Am J Clin Nutr
(1972) 25: 737-745.
24. Krehl WA et. al. Some metabolic changes induced by low carbohydrate diets. Am J Clin Nutr
(1967) 20: 139-148.
25. Golay A et al. Weight-loss with low or high carbohydrate diet? Int J Obes Relat Metab
Disord. (1996) 20: 1067-1072.
26. Phinney SD et. al. The human metabolic response to chronic ketosis without caloric
restriction: physical and biochemical adaptations. Metabolism (1983) 32: 757-768.
27. Phinney SD et. al. The transient hypercholesterolemia of major weight loss. Am J Clin Nutr
(1991) 53: 1404-1410.
28. Larosa JC et. al. Effects of high-protein, low-carbohydrate dieting on plasma lipoproteins and
body weight. J Am Diet Assoc (1980) 77: 264-270.
29. Owen OE et. al. Brain metabolism during fasting. J Clin Invest (1967) 10: 1589-1595.
30. Wheless JW. The ketogenic diet: Fa(c)t or fiction. J Child Neurol (1995) 10: 419-423 .
31. Withrow CD. The ketogenic diet: mechanism of anticonvulsant action. Adv Neurol (1980)
27: 635-642.
32. Patel MS. et. al. The metabolism of ketone bodies in developing human brain: development of
ketone-body-utilizing enzymes and ketone bodies as precursors for lipid synthesis.
J Neurochem (1975) 25: 905-908.
33. Wing RR et. al. Cognitive effects of ketogenic weight-reducing diets. Int J Obes (1995)
19:811-816.
34. Palgi A et. al. Multidisciplinary treatment of obesity with a protein-sparing modified fast:
Results in 668 outpatients. Am Journal Pub Health (1985) 75: 1190-1194.
35. Worthington BS and Taylor LE. Balanced low-calorie vs. low-protein-low carbohydrate
reducing diets. II: Biochemical changes. J Am Diet Assoc (1974) 64: 52-55.
36. Herzberg GZ et. al. Urolithiasis associated with the ketogenic diet. J Pediatr (1990)
117:743-745
37. Lemon P. Is increased dietary protein necessary or beneficial for individuals with a physically
active lifestyle? Nutrition Reviews (1996) 54: S169-S175.
83
38. Fisher MC and Lachance PA Nutrition evaluation of published weight reducing diets. J Amer
Dietetic Assoc (1985) 85: 450-454.
39. Stock A and Yudkin J. Nutrient intake of subjects on low carbohydrate diet used in treatment
of obesity. Am J Clin Nutr (1970) 23: 948-952
40. Sigler MH. The mechanism of the natiuresis of fasting. J Clin Invest (1975) 55: 377-387.
41. Sours HE et. al. Sudden death associated with very low calorie weight reduction regimens.
Am J Clin Nutr (1981) 34: 453-461.
42. Lantigua RA et. al Cardiac arrhythmias associated with a liquid protein diet for the
treatment of obesity. N Engl J Med (1980) 303: 735-738.
43. Isner JM et. al. Sudden unexpected death in avid dieters using the liquid-protein-modified-fast
diet: Observations in 17 patients and the role of the prolonged QT interval. Circulation
(1979) 60: 1401-1412.
44. Phinney SD et. al. Normal cardiac rhythm during hypocalorie diets of varying carbohydrate
content. Arch Intern Med (1982) 143: 2258-2261.
45. DeHaven JR at. al. Nitrogen and sodium balance and sympathetic-nervous-system activity
in obese subjects treated with a very low calories protein or mixed diet. N Engl J Med
(1980) 302: 302-477.
46. Bistrian B. Recent developments in the treatment of obesity with particular reference to
semistarvation ketogenic regimens. Diabetes Care (1978) 1: 379-384.
47. Heaney RP. Excess dietary protein may not adversely affect bone. J Nutr (1998)
128:1054-1057.
48. Barzel US and Massey LK Excess dietary protein can adversely affect bone. J Nutr (1998)
128:1051-1053.
49. Hahn TJ et. al. Disordered mineral metabolism produced by ketogenic diet therapy. Calcif
Tissue Int (1979) 28:17-22.
50. Woody RC et. al. Impaired neutrophil function in children with seizures treated with the
ketogenic diet. J Pediatr (1989) 115: 427-430
51. McMurray RW et. al. Effect of prolonged modified fasting in obese persons on in vitro markers
of immunity: lymphocyte function and serum effects on normal neutrophils. Am J Med Sci
(1990) 299: 379-385.
52. Hoyt CS and Billson FA. Optic neuropathy in ketogenic diet. Br J Ophthalmol (1979)
63: 191-194
53. Hoyt CS and Billson FA. Low-carbohydrate diet optic neuropathy. Med J Austr (1977)
1: 65-66.
84
Part III:
The Diets
Chapter 8: General dieting principles
Chapter 9: The standard ketogenic diet (SKD)
Chapter 10: Carbs and the ketogenic diet
Chapter 11: The targeted ketogenic diet (TKD)
Chapter 12: The cyclical ketogenic diet (CKD)
Having discussed the physiology behind and adaptations to a ketogenic diet, we can now go
about setting up the diet. Before addressing the specifics of the diet, a few general dieting
concepts need to be discussed. The first is to differentiate between bodyweight and bodyfat.
Most dieters use the scale as the only measure of a diet’s effectiveness but this does not give any
information as to what (i.e. muscle, fat, water) is being lost.
The second general dieting topic deals with metabolic rate, and setting calories for fat loss
or weight gain. Most individuals desiring fat loss tend to restrict calories excessively, causing
problems with metabolic slowdown. In this chapter, estimations are made to determine optimal
calorie levels for different goals.
Chapter 9 details how to set up the standard ketogenic diet (SKD) which forms the
template for the other two diets. Specifics regarding carbohydrate, protein and fat are discussed.
As well, the effects of other nutritional substances such as caffeine and citric acid are discussed.
Finally, two sample SKDs are set up.
Although the details of exercise physiology are discussed in chapter 18 through 20, it is a
fact that a ketogenic diet can not sustain high intensity exercise for very long. This mandates
that carbohydrates be introduced into the SKD. Chapters 10 through 12 include discussions of
muscle glycogen and depletion as well as the modifications to the SKD which can be made to
sustain exercise while maintaining ketosis.
85
Chapter 8:
General Dieting Principles
Before discussing the details of the ketogenic diet, it is necessary to first discuss some
general concepts which relate to body composition, metabolic rate, dieting, and fat loss. Most
dieters tend to focus on bodyweight as the only measure of a diet’s effectiveness. This is an
incomplete approach and may be partly responsible for the failure of many mainstream weight
loss approaches. Simply put, changes in bodyweight do not tell the entire story during a diet.
Rather the prospective dieter needs to change focus to look at body composition: the ratio of body
fat to total body weight.
Experience has shown that most dieters tend to reduce calories excessively. While this
causes rapid initial weight loss, a plateau occurs as metabolic rate slows. This drop in metabolic
rate may increase the chance for weight regain when the diet is ended.
A discussion of the various components of metabolic rate is followed with equations to
estimate maintenance calorie levels as well as how to estimate caloric intake for fat loss and
muscle gain. Most dieters, especially those who are used to starving themselves to lose weight,
are surprised to learn how much they should eat for optimal fat loss.
Section 1: Fat loss versus Weight loss
Most individuals starting a diet as well as most diet books tend to focus solely on one
measure of progress: changes in bodyweight. The scale has been used for years as the only
indicator of whether or not a diet is working. While this is a problem on any diet (for reasons
discussed below), it can be of even greater importance when discussing low-carbohydrate diets
and low-carbohydrate diet studies, due to shifts in water weight. To accurately know whether a
diet is working or not, we have to be more specific in our measurements than simply bodyweight.
Bodyfat vs. Bodyweight
The primary distinction that dieters should consider is between weight loss and fat loss.
Weight loss is easy: Don’t drink any water for three days and you will lose three to five pounds by
the scale. This obviously isn’t ‘real’ weight loss since it returns when you drink water again.
Whether they know it or not, most dieters want fat loss to occur.
Fat loss is a more specific type of weight loss. While this seems a trivial distinction, it is
not. Without knowing where the lost weight is coming from (fat, muscle, or water), an individual
cannot know whether their diet and exercise program is working optimally. Ideally, lean body
mass (which includes muscle mass) will increase or stay the same while fat is reduced. In
practice this rarely occurs. Any calorie restricted diet will cause the loss of some muscle through
86
a variety of mechanisms (that are discussed in later chapters), more so if exercise is not included.
In fact, if a person loses weight without exercising, over half of the total weight loss is muscle and
water, not fat.
Body Composition
More than changes in scale weight, we need to focus on overall change in body composition.
Body composition (or bodyfat percentage) represents the ratio of bodyfat to total body weight.
The body is generally divided into two components (1):
1. Fat mass (FM): the sum of the body’s fat stores
2. Lean body mass (LBM): everything else including bone, muscle, body water, minerals, the
brain, internal organs, muscle glycogen, etc.
Total bodyweight (TB) = FM + LBM
Therefore,
Bodyfat percentage = FM/TB
The ultimate goal in dieting is to see a drop in bodyfat percentage primarily through a
decrease in fat mass. Increases in lean body mass will also cause bodyfat percentage to
decrease.
A sample body composition estimation
An individual is measured and found to have 15% bodyfat at a bodyweight of 180 lbs. He
has:
180 lbs * 0.15 = 27 lbs of fat
180 lbs - 27 lbs = 153 lbs of lean body mass.
For an individual desiring a specific bodyfat percentage, there is an equation that will
determine how much fat must be lost assuming 100% of the weight lost is fat and there is no
change in lean body mass (2).
Desired bodyweight = lean body mass / (1-desired bodyfat).
Fat loss needed = current body weight - desired body weight.
So if our 180 lb., 15% bodyfat individual (with 153 lbs of lean body mass) wished to reach 10%
bodyfat, he would have to lose the following:
Body weight needed = 153 / (1 - .10) = 153 / 0.90 = 170 lbs
Fat loss needed = 180 lbs -170 lbs = 10 lbs fat loss.
Problems with the scale
The primary problem with the scale is that it does not differentiate between what is being
lost (or gained) on a diet. With regular exercise, especially weight training, there may be an
87
increase in lean body mass as fat is being lost. Although body weight may not change, body
composition is changing.
Let’s say our 180 lb individual at 15% bodyfat begins a basic exercise program of weight
training and aerobic exercise. Over the first eight weeks, he gains 4 lbs of lean body mass and
loses 4 lbs of fat at the same time. Looking only at weight, nothing appears to have happened.
But looking at changes in body composition (in table 1), it is obvious that the program is working.
Table 1: Changes in body composition
Before
Total weight (lbs) 180
LBM (lbs)
153
Fat (lbs)
27
% bodyfat
15%
After
180
157
23
12.7%
Change
No change
+4
-4
-2.3%
Individuals beginning a weight training program often gain one or two pounds by the scale
from increased water storage in the muscles. This weight gain is temporary and should not be
confused with true fat gain. Similarly, consuming carbohydrates after a period of low
carbohydrate dieting will cause a large, but transient, increase in bodyweight from increased body
water. This weight gain also should not be confused with true fat gain.
Although the measurement of body composition may not be convenient for many
individuals, as it requires special equipment, a similarly objective method exists: how clothes are
fitting. Many individuals beginning an exercise program, especially if it includes weight training,
will lose inches with no change on the scale. Since one pound of muscle takes up less space than
one pound of fat, this reflects a gain in muscle that equals or exceeds the loss of fat. Keep in mind
that a large gain in muscle may cause clothes to fit tighter and should not be misinterpreted as
fat gain.
Subcutaneous vs. Essential fat
Before discussing how body composition is measured, it is necessary to know where the
bodyfat is located. Total bodyfat is typically divided into subcutaneous fat (under the skin) and
essential fat (in the spine, brain and around the internal organs). Average levels for these two
types of fat appear in table 2 below along with the bodyfat levels recommended by health
organizations (1). Bodybuilders are included as a reference point only for those individuals
seeking extreme levels of leanness. In all likelihood, maintaining this level of leanness is
unhealthy, especially for women.
88
Table 2: Comparison of bodyfat levels
Group
Men
Women
Male bodybuilder
Female bodybuilder
Essential fat (%)
3
9-12
3
9-12
Average bodyfat (%)
11-18
21-28
3-4
8-9
Recommended (%)
10-15
18-25
N/A
N/A
Measuring bodyfat (3)
Over the years, many methods have been used to measure bodyfat. The method currently
considered the ‘Gold Standard’ is underwater weighing. Based on the fact that fat floats better
than muscle (technically, fat is less dense than muscle), bodyfat percentage can be estimated by
weighing an individual on ground and again when submerged underwater.
Many assumptions and estimations are made during underwater weighing. Although the
subject is instructed to exhale all air from their lungs, there will always be a small amount left. A
correction for this residual air must be made. Additional estimations are made on the density of
bone, fat and muscle but these vary greatly depending on race, age, activity level, etc. Many of
the assumptions which are being made for underwater weighing have been found to be incorrect
(3).
The other methods of bodyfat measurement are generally based on underwater weighing.
Descriptions of the most common methods of measuring body composition appear below.
Girth measures
Girth methods of bodyfat estimation typically use weight and several girth measures (i.e.
circumference of the waist, wrist, or hips) to estimate bodyfat. While these measurements are
fast and easy to perform, they are notoriously inaccurate as they cannot distinguish between an
individual with excess fat, excess muscle, or simply a large bone structure.
For example, an equation which used hip circumference would vastly overestimate the
bodyfat percentage of an individual with genetically wide hips, even if that person were very lean.
Although girth measures can provide another measure of progress on a diet, they should not be
used to estimate bodyfat percentage.
Bioelectrical impedance (BIA)
BIA estimates bodyfat by running a small electrical current through the body based on the
fact that muscle, fat and water conduct electricity at different rates. With several other
variables (height, age, weight), the BIA machine will estimate body fat percentage. BIA can be
severely affected by hydration state. Due to changes in hydration during ketogenic diets
(especially cyclical ketogenic diets), BIA is not recommended.
89
Infrared Reactance (IR)
Infrared reactance attempts to measure bodyfat thickness (and by extension estimate
overall bodyfat levels) by measuring the scatter of light through the tissue. Little research
supports its use or accuracy. IR is not recommended.
Skinfold calipers
Because the majority of bodyfat is under the skin, an individual’s total fat can be
estimated with skinfold measurements taken with calipers (spring loaded pinchers). Three or
more measurements are made at specific sites on the body which are entered into an equation
with weight, age and gender to estimate bodyfat. The estimation equations are accurate to
within plus or minus 5% (3) and tend to become less accurate at extremes of both leanness and
fatness. Although current research is questioning the overall accuracy of skinfold equations (3,4),
they are still considered the most accurate of the methods described above.
Due to the inherent inaccuracies involved in caliper estimations, it is suggested that
regular skinfold measurements be used to track relative changes rather then to provide absolute
measurements of bodyfat percentage (5). Table 3 compares the two skinfold measurements
below.
Table 3: Comparison of skinfold measurements
Date
Pectoral
Abdominal
Thigh
Total
Skinfolds in millimeters
1/1/98
2/1/98
5
4
15
12
10
8
30
24
We can see that this person has lost bodyfat, irrespective of the estimated bodyfat
percentages. Individuals using regular skinfold measurements should develop the habit of just
comparing measurements rather than relying on estimations of bodyfat.
With regards to bodybuilders (arguably the athletes most concerned with bodyfat levels), a
caliper measurement of 3-4 millimeters represents essentially zero subcutaneous fat. However
experienced bodybuilders know not to rely only on the numbers, but rather on appearance.
Striving for excessively low skinfold measurements may decrease muscle size, fullness and
symmetry. Ultimately, bodybuilders aren’t being judged on who has the lowest bodyfat level.
Rather they are judged by who looks the best on stage.
90
Summary
Although most dieters rely solely on the scale to gauge the progress of their diet, this
method leaves much to be desired unless coupled with another method of measurement. Ideally
dieters should keep track of their body composition changes which give a better picture of what is
being lost and gained during the diet (i.e. muscle or fat). Although no current method of measuring
bodyfat is perfect, skinfold calipers seem to be the best choice, especially considering the fluid
shifts which can occur on a ketogenic diet. With practice, most individuals should be able to keep
track of their own skinfold measurements at home with a pair of inexpensive calipers.
Section 2:
Metabolic rate and calorie levels
Changes in bodyweight are ultimately tied into simple thermodynamics and the energy
balance equation. The energy balance equations represents the difference between energy
coming into the body (via diet) and energy going out (via metabolic rate). If intake exceeds
expenditure, calories are stored in the body (i.e. weight gain). If expenditure exceeds intake,
calories are taken from body stores (i.e. weight loss). The difference between caloric intake and
caloric expenditure is referred to as the caloric deficit or excess as necessary. To better address
the issue of setting calories, we must first look at the determinants of basal metabolic rate, which
represents the number of calories needed to maintain bodyweight with no changes.
Metabolic Rate
Before discussing how to set calories for fat loss or muscle gain, maintenance calorie
requirements should be determined. There are two ways to determine maintenance calorie levels:
the food diary method and the calculation method.
Food diary method
This method requires an individual to record every food they consume over some period and
then calculate the number of calories being consumed. Typically three days are used including at
least one weekend day. If weight stays stable over this period, it is assumed that the caloric
intake is the maintenance calorie level. Most individuals will not take the time to do this
consistently and it has been shown that the simple act of recording one’s food intake causes
many people to change their eating patterns. Although only an estimate, a preferred method is
to calculate caloric requirements, which is discussed next.
91
Calculation method
To estimate the number of calories needed to maintain bodyweight, we have to examine
the three components of daily caloric requirements (1). They are:
1. Resting energy expenditure (REE)
2. Thermic effect of activity (TEA): which can be further subdivided into two
components:
A. Calories burned during exercise
B. Calories burned after exercise
3. Thermic Effect of Feeding (TEF)
Total energy expenditure (also called basal metabolic rate) is equal to REE plus TEA plus TEF.
Each component is discussed in detail below.
Resting energy expenditure (REE)
REE represents the number of calories needed by the body to sustain itself at rest. It
typically comprises 60-75% of the total caloric expenditure per day. REE is determined by a
number of factors including total body weight, lean body mass, thyroid hormones, and nervous
system activity (6).
In general, REE correlates closely with total body weight as well as lean body mass. Total
body weight is used to calculate REE due to the difficulty in obtaining accurate measures of lean
body mass (see the previous section on body composition).
There are numerous equations to estimate REE. The simplest method is to multiply total
bodyweight in pounds by 10-11 calories per pound (7). Women should generally use the lower
value, men the higher. Again, this number represents how many calories the body will burn
assuming zero activity.
Sample REE calculation
Female weighing 150 lbs * 10 calories/lb = ~1500 calories/day
Male weighing 180 lbs * 11 calories/lb = ~1980 calories/day
REE is adjusted upward by determining the number of calories expended during the day,
called the thermic effect of activity.
Thermic Effect of Activity (TEA)
TEA includes general moving around, shivering, and exercise. Depending on the frequency,
intensity and duration, exercise can increase total caloric expenditure by 15% (very sedentary) to
30% or more (very active) over baseline levels. Although it is possible to calculate the number of
calories burned with varying types of exercise, it is generally sufficient to simply estimate the
number of calories burned with activity.
The level of activity in a day will determine the increase in caloric requirements over REE.
(7) Even someone who is totally sedentary will need to adjust REE upwards by at least 15%.
See Table 4 below for REE multipliers:
92
Table 4: Multiplication modifiers for activity level
Description
Sedentary
Lightly active
Moderately active
Very active
Extremely active
Multiplier
1.15
1.3
1.5
1.7
2.0
For most people, assuming they exercise three to four times weekly at a moderate
intensity, an activity modifier of 1.5-1.6 is sufficient. So, using our two dieters from above:
Female at 150 lbs = 1500 calories/day * 1.5 = 2250 calories per day
Male at 180 lbs = 1980 calories/day * 1.5 = 3000 calories per day
The final calculation necessary is to add the thermic effect of feeding (TEF).
The Thermic Effect of Feeding (TEF)
TEF represents the slight increase in metabolic rate which occurs when food is ingested.
The term specific dynamic action (SDA) of food is also used. The three macronutrients:
carbohydrate, protein and fat have different SDA values. Protein has the highest SDA, burning
off 20-25% of its total calories during digestion. If 100 calories of protein are eaten, 20-25 calories
are burned during digestion. Carbohydrate is slightly less, having a SDA of 15-20%. Fat has the
lowest SDA, approximately 3%.
As an average, TEF will increase caloric requirements by roughly 10% per day.
Female at 150 lbs = 2250 calories/day + 10% (225 calories) = 2475 calories/day
Male at 180 lbs = 3000 calories/day + 10% (300 calories) = 3300 calories/day
These values represent the estimated caloric intake needed to maintain bodyweight and
bodyfat at a stable level. It is modified based on whether an individual wishes to gain or lose
weight/fat.
An alternative method
Another rough way to estimate daily maintenance calories is to simply multiply
bodyweight in pounds by approximately 15-16 calories/pound. Women should use the lower
value, men the higher.
Female at 150 lbs * 15 cal/lb = 2250 cal/day
Male at 180 lbs * 16 cal/lb = 2880 cal/day
Both values compare fairly closely to the those from the calculated method above.
Summary
93
Summary
The number of calories needed to maintain a stable bodyweight is determined by three
factors: resting energy expenditure, thermic effect of activity, and the thermic effect of food.
While estimations can be made for all three components of metabolic rate, a simpler and fairly
accurate estimation of maintenance calorie needs can be made by multiplying bodyweight in
pounds by 15-16 calories. Women should generally use the lower number, men the higher.
Section 3:
Setting calorie levels
Having determined maintenance calories levels, it is now time to discuss the concept of
energy balance, fat loss and muscle gain. Energy balance refers to the difference in caloric intake
via diet and caloric expenditure via metabolic rate and activity. It is given by:
Energy balance = calories in - calories out
When energy balance is positive (i.e. calories in exceeds calories out), energy is stored in
the body as glycogen, protein and fat. When energy balance is negative (i.e. calories out exceeds
calories in), energy is pulled from the body’s stores. In the case of fat loss, stored energy in
adipose tissue is converted to usable energy and burned by the body.
Thus to lose weight, one must burn more calories than they consume. Therefore any
attempt to lose fat must center around decreasing caloric intake or increasing energy
expenditure. By corollary, to gain weight one must consume more calories than they burn. Any
attempt to gain weight must center around increasing caloric intake or decreasing energy
expenditure.
A gain in muscle or fat tissue revolves around the creation of a caloric excess. For the
most part, it is impossible to lose fat (requiring a caloric deficit) and gain muscle (requiring a
caloric excess) at the same time. While it is attractive to think that the body will pull energy
from fat stores to synthesize muscle tissue, this does not appear to occur in most cases. The
only exception to this is beginning exercisers and those returning from a layoff from training,
although the reasons for this are not known.
Calories and the Atkins diet: a misconception
A misconception, and commonly heard criticism, surrounding the Atkins diet is the
(apparent) claim that fat can be lost with an ‘unrestricted caloric intake’, which contradicts
basic thermodynamics (8). Strictly speaking, Atkins claimed that one could lose weight eating as
much fat and protein ‘as they liked’ meaning they could eat until they were full without worrying
about counting calories.
Atkins based this claim on the established fact that individuals on a diet restricted in
94
carbohydrate but with ‘unlimited’ fat and protein will tend to automatically restrict calories. The
mechanism behind the appetite suppressing effect of ketogenic diets is addressed in more detail in
chapter 7.
Studies examining the ketogenic diet at maintenance calories show no weight loss other
than the small water loss seen with carbohydrate restriction. Simply put, there is no magical
effect of ketosis that allows one to lose weight without some type of shift in energy balance that
leads to either an increased caloric expenditure or a decreased caloric intake. As with any diet,
fat loss on a ketogenic diet will still require the creation of a caloric deficit.
Setting calories for fat Loss
Generally speaking, most dieters restrict calories too much when dieting for fat loss. The
logic is that a greater caloric deficit will yield faster and greater fat loss, but this is not always the
case. Excessively low caloric intakes are countered in the body by a reduction in metabolic rate
which slows fat loss (9,10). This reduction can range from 5 to 36% of resting metabolic rate,
depending on the severity of caloric restriction (9). While the exact cause of the decrease is
unknown, possible causes are a decrease in thyroid hormones, loss of lean body mass, or a
decrease in the activity of the sympathetic nervous system. A similar drop in metabolic rate
can also occur with excessive amounts of exercise. When normal eating resumes, the decreased
metabolic rate causes rapid weight regain, more so if exercise is not included in the fat loss
efforts.
The loss of one pound of fat requires that 3,500 calories be burned in excess of what is
being consumed. Therefore the typical advice to dieters is to restrict caloric intake by 500-1000
calories per day which should yield a 1-2 lb fat loss over the span of 7 days (500-1000 calories/day
* 7 days = 3500-7000 caloric deficit per day = 1-2 lbs of fat loss). As discussed in chapter 22, the
reduction of calories without the addition of exercise will cause muscle loss and metabolic
slowdown. Therefore a restriction of calories should never be the only method of creating a caloric
deficit.
A second approach to creating a caloric deficit is to eat at maintenance calories and add
excessive amounts of exercise. As we will see in chapter 22, the expenditure of even 500 calories
per day with exercise requires a larger amount of exercise (or exercise at a higher intensity) than
most individuals are able to do. To expend 1000 calories per day with exercise generally requires
2 or more hours of exercise per day.
A third and preferable approach is to reduce caloric intake to some degree and increase
activity at the same time. A decrease in caloric intake of 500 calories coupled with an increase in
activity of 500 calories per day should also yield a 2 lb fat loss per week. It is unusual to see an
exact fat loss of 2 pounds per week in most dieters.
How large of a deficit: two common methods
The primary question to be addressed is how large of a deficit to use when setting up a fat
loss diet. As mentioned in the introduction, most dieters tend to drop calories extremely low based
on the idea that the greater the deficit, the more weight that will be lost. Up to a point this
95
appears to be true, in that greater caloric restriction yields greater fat loss. However this ignores
the potential effects of extreme caloric restriction on metabolic rate, muscle loss, etc. A recent
review of twenty-two studies found that extremely low calorie levels, below 1000 calories/day,
caused a much greater drop in metabolic rate than even 1200 calories/day (10). So, there
appears to be a threshold level of caloric intake where metabolic rate is more greatly affected.
There are two common methods of setting calories for a diet: at an absolute calorie level, or
with an absolute caloric reduction. That is, consider two individuals, one weighing 120 pounds, the
other weighing 240 pounds and assume both have a maintenance calorie intake of 15 cal/lb.
First let us examine what happens if both decide to diet at 1200 calories per day. Table 5
compares their caloric intake relative to their maintenance levels.
Table 5: Comparison of two individuals dieting at 1200 calories per day
Subject
1
2
Body
weight (lbs)
120
240
Maintenance
calories (cal/day)*
1800
3600
Intake
(cal/day)
1200
1200
Intake
(cal/lb)
10
5
Daily
deficit (cal)
600
2400
* Estimated at 15 calories per pound of bodyweight
It would seem logical that the second person’s body would perceive a greater deficit
(relative to resting levels) and decrease metabolic rate more so than the first person. While
anecdotal evidence suggests this to be the case, direct research looking at changes in metabolic
rate at different caloric intakes relative to bodyweight is necessary.
In a second situation, assume both individuals decide to create a 1000 calorie deficit
through some combination of diet and exercise. Table 6 compares them as above.
Table 6: Comparison of two individuals dieting at 1000 calories below maintenance
Subject
1
2
Body
weight (lbs)
120
240
Maintenance
calories (cal/day)*
1800
3600
Intake
(cal/day)‡
800
2600
Intake
(cal/lb)
6.6
10.8
Daily
deficit (cal)
1000
1000
* Estimated at 15 calories per pound of bodyweight
‡ For all practical purposes, whether the deficit is created through calorie restriction alone, or a
combination of calorie restriction and exercise, the body will only perceive that 800 or 2600
calories/day is being consumed.
In this case, the first dieter ends up with an extremely low calorie level, while the second
does not. It would seem logical that the first dieter would see a much greater drop in metabolic
rate under these conditions than the second.
A better method
96
A better method
The above example shows us that setting caloric intake relative to bodyweight (or by
creating a deficit as some percentage of maintenance levels) would be more individualized than
using an absolute deficit (such as 1000 calories below maintenance) or an absolute caloric intake
(such as 1200 calories per day).
The method recommended in this book is to set caloric intake relative to either bodyweight
or maintenance levels. It assumes that maintenance calories have either been determined with
a food diary, or estimated from the equations in section 2. It also assumes that the total caloric
deficit includes exercise. For a 500 calorie/day deficit, whether an individual reduces food intake
by 250 cal/day and increases activity by 250 cal/day or eats at maintenance and increases
activity by 500 cal/day, the deficit will be considered to be the same. Note that this only applies
as long as some form of exercise is being done as numerous studies have found that reducing
caloric intake without exercise causes muscle loss and a drop in metabolic rate.
When starting a fat loss diet, calorie levels should be restricted no more than 10-20% below
maintenance levels. This caloric deficit can be generated by decreasing food intake or increasing
activity with exercise. While the typical recommendation for increasing caloric expenditure is
aerobic exercise, we shall see in chapter 22 that weight training coupled with either aerobic
exercise OR a slight reduction in caloric intake yields the best fat loss. For all practical purposes,
there is no difference between reducing calories by 300 per day and expending an additional 300
calories through aerobic exercise. The choice ultimately becomes the dieter’s: whether to eat less
or perform more aerobic exercise. It is the opinion of this author that weight training is NOT
optional on any diet.
From a maintenance level of 15-16 calories per pound, reducing calorie levels by 20% yields
a calorie intake of approximately 12-13 calories per pound of current bodyweight. Many diet
books and dieters prefer to use a caloric goal based on goal bodyweight (i.e. 12-13 calories per
pound of desired bodyweight). The problem with this method is that dieters, in their hurry to
reach their goals, invariably set goal bodyweight or bodyfat far too low. Consequently, calories
are set too low and metabolic rate slows down. Therefore, daily calorie levels should be based on
current bodyweight.
Using the values for maintenance calories from the last section we have:
Female at 150 lbs * 15 cal/lb = 2250 cal/day
A 20% deficit yields 2250 * 0.20 = 450 calorie/day deficit
2250 calories - 450 calories = 1800 calories per day
1800 calories/day / 150 lbs = 12 calories/lb
Male at 180 lbs * 16 cal/lb = 2880 cal/day
A 20% deficit yields 2880 cal/day * 0.20 = 576 cal/day
2880 cal - 576 cal = 2304 cal/day
2304 cal/day / 180 lbs = ~13 calories/lb
These levels should be considered starting points only as they are based on averages and
estimations for maintenance calorie levels. Some individuals may need to reduce calories further
but this should be done cautiously to avoid muscle loss and metabolic slowdown.
97
Regular body composition measurements will indicate if the calorie level should be changed
or not. Most individuals should be able to sustain a fat loss of 1-1.5 lbs of fat per week. If fat loss
is occurring at less than 1 pound per week, calories can be reduced slightly (or aerobic exercise
increased). It is rare to find anyone who can lose 2 lbs of fat per week consistently without losing
muscle as well. Anyone losing more than 2 pounds of weight per week should increase calories or
decrease aerobic activity to avoid muscle loss.
The maximum allowed deficit
The effects of exercise at different calorie levels on fat loss vary and are discussed in
chapter 22. In general, the studies support the idea that there is a threshold deficit where
maximum fat loss will occur with minimal changes in metabolic rate. This threshold occurs at
approximately 1000 calories per day below maintenance and represents the maximum allowed
deficit. As a general rule, the total daily deficit, created through caloric restriction and exercise,
should be no greater than 1000 calories total per day. This should yield an average fat loss of 2
pounds per week. Some exceptions to this rule are discussed in chapter 13.
This 1000 calories per day deficit can be created through a variety of combinations of
caloric restriction and exercise. If an individual prefers to eat more calories (such as eating at
maintenance levels), they would need to do an extensive amount of exercise to generate a 1000
calorie/day deficit. By the same token, if an individual is involved in an activity (such as long
distance running or cycling) that has them expending 1500 calories/day through exercise, they
will need to increase calories by 500 calories above maintenance to avoid surpassing the 1000
calorie/day threshold.
For some individuals, even 1000 calories/day may be too great of a deficit. This is
especially true for lighter individuals, for whom a 1000 calorie/day deficit may take their caloric
excessively low. Arguably a better approach is to use a smaller caloric deficit with increased
activity and aim for a sustainable and safe fat loss of 1-1.5 lbs of fat per week. While the
ultimate bodyfat/bodyweight goal will take longer to achieve, it should be easier to sustain as
there is less tendency for metabolic rate to decrease.
To summarize: dieters should initially create a net deficit (exercise plus caloric restriction)
of approximately 10-20% below maintenance. For the average person, this means a caloric
intake of 12-13 calories/lb of bodyweight with moderate activity levels. After 2 weeks, depending
on total fat loss, the total deficit can be increased, to a maximum deficit of 1000 calories per day.
Weight Gain
For weight gain to occur, a calorie excess is needed to support muscle growth. There is
little research into the number of calories needed to meet maintenance levels as well as allowing
for muscle growth to occur.
A good starting point is to increase calories by 20% over maintenance. This gives an
approximate calorie intake of 18-19 calories/day although many individuals may require much
higher calorie levels (above 20 cal/day). Obviously muscle gain is predicated on performing weight
98
training to stimulate muscle growth and protein synthesis. Other issues pertaining to the CKD
and gaining muscle are discussed in chapter 29.
For example, using the values for maintenance calories from last chapter we have:
Female at 150 lbs * 15 cal/lb = 2250 cal/day
2250 * 0.20 = 450 cal/day
2250 + 450 = 2700 cal/day
2700 cal/day / 150 lbs = 18 cal/lb
Male at 180 lbs * 16 cal/lb = 2880 cal/day
2880 * 0.20 = 576 cal
2880 + 576 cal = 3,456 cal/day
3456 cal/day / 180 lbs = 19 cal/lb
Summary
Daily caloric requirements are comprised of resting energy expenditure, the thermic effect
of activity and the thermic effect of food. While these can be calculated based on bodyweight and
activity, an easy estimation for maintenance calories is to multiply bodyweight by 15-16 calories
per pound.
As a rule of thumb, to avoid metabolic slowdown calories should be initially decreased 1020% below maintenance for fat loss. This can be accomplished by either decreasing caloric
intake, increasing activity, or some combination of the two. Repeated body composition
measurements will indicate if less or greater caloric intakes are necessary to optimize fat loss. In
general, a fat loss of 1 to 1.5 lbs per week should ensure that no muscle is being lost. A total
weight loss of greater than 2 pounds per week (not counting water weight) indicates that some
muscle is being lost and calories should be increased.
Those desiring to gain weight on a ketogenic diet will need to increase calories above
maintenance. A good starting point is roughly 20% above maintenance levels which is
approximately 18 cal/lb for most people. Depending on changes in body composition, calories can
be adjusted upwards or downward in order to maximize gains in lean body mass, while minimizing
gains in bodyfat.
References Cited
1. “Physiology of Sport and Exercise” Jack H. Wilmore and David L. Costill. Human Kinetics
Publishers, 1994.
2. “Guidelines for Exercise Testing and Prescription, 5th ed.” The American College of Sports
Medicine. Lea & Febiger Publishers, 1995.
3. “Advances in Body Composition” Timothy G. Lohman Human Kinetics Publishers, 1992.
4. Heyward V. Evaluation of Body Composition. Sports Med (1996) 22: 146-156.
5. “Physiological Testing of the High-Performance Athlete” Ed. J Duncan McDougall,
Howard A. Wenger, and Howard J. Green. Human Kinetics Publishers, 1982.
99
6. Astrup A. The sympathetic nervous system as a target for intervention in obesity. Int J Obes
(1995) 19 (suppl 7): S24-S28.
7. “Advanced Fitness Assessment & Exercise Prescription” Vivian Heyward. Human Kinetics,
1998.
8. Council on Foods and Nutrition. A critique of low-carbohydrate ketogenic weight reducing
regimes. JAMA (1973) 224: 1415-1419.
9. Saris WHM. Effects of energy restriction and exercise on the sympathetic nervous system.
Int J Obes (1995) 19 (suppl 7): S17-S23.
10. Prentice AM et. al. Physiological responses to slimming. Proc Nutr Soc (1991) 50: 441-458.
100
Chapter 9:
The Standard Ketogenic Diet
The standard ketogenic diet (SKD) is what most think of as the ketogenic diet. It is a diet
low in carbohydrate, and moderate-high in both protein and fat. Since the SKD forms the basis of
the next two diets, it is discussed in detail. This includes a discussion of the effects of the
macronutrients (carbohydrate, protein and fat) on ketosis, as well as discussions of how to
determine optimal carbohydrate, protein and fat intake. Additionally, the effects of alcohol and
other nutritional substances (such as caffeine and aspartame) on ketosis is discussed.
Section 1: Macronutrient intake
on the ketogenic diet
Any diet which restricts calories will alter the intake of nutrients. This includes changes in
caloric intake, the macronutrients (protein, carbohydrates, fat) and the micronutrients (vitamins
and minerals). Micronutrients were discussed in the last chapter, and only caloric intake and
macronutrients are discussed here.
Calories and weight loss
Although discussed in detail in Chapter 8, the basic idea of calories and weight loss (as well
as fat loss) is mentioned again here. One of the prime selling points of many low-carbohydrate
diets is a dieter can lose weight while ‘eating as much protein and fat as they like’. While this is
loosely true, this was misinterpreted by dieters and physicians alike to claim that dieters would
lose weight eating unlimited amounts of foods.
This idea was criticized by the American Medical Association (AMA) as it seemed to
suggest that a ketogenic diet could somehow break basic laws of thermodynamics (1). The AMA
was correct that it is impossible for dieter’s to lose weight while consuming unlimited calories.
However, looking at the research on ketogenic diets, we see that most individuals will
automatically reduce their caloric intake when they restrict carbohydrate to low levels.
Therefore, in a sense individuals are losing weight eating ‘as much as they like’, it is simply that
they are eating less than they think.
Studies of ketogenic diets have found that, when subjects are told to limit carbohydrate
intake but to consume ‘unlimited’ quantities of protein and fat, they automatically limit caloric
intake and consume between 1400-2100 calories (2-4). Any diet which automatically reduces
caloric intake without inducing hunger is going to be attractive to dieters.
While early studies, discussed in detail in the previous chapter, were interpreted to show
101
that ketogenic diets affected metabolism in some way to increase weight loss, other studies
suggested that it was the decreased caloric intake that caused the weight loss (2).
Judging from the studies above, many ketogenic dieters may reduce calories too much.
While this causes quick initial weight loss, as discussed in chapter 8, too severe a decrease in
caloric intake can cause metabolic slowdown and a loss of muscle. Many ketogenic dieters will
have to eat more than they feel necessary to keep fat loss from slowing down. This is especially
important if exercise is part of the overall fat loss efforts. Recommendations for determining
caloric intakes are discussed in chapter 8.
Macronutrients
The macronutrients are carbohydrate, protein and fat. Many individuals embarking upon
a ketogenic diet will set protein and fat at certain levels based on their goals. This especially
applies to athletes who will adjust protein and fat intake to vary calorie levels within the
recommended range. While it is suggested that others pay attention to overall macronutrient
intake, it is reasonable to assume that some will simply not go to the trouble to count every gram
of food which they consume.
This raises the question of what type of macronutrient intake an unspecified ketogenic diet
will produce, especially compared to a similar calorie ‘balanced’ diet. Several studies have
examined this macronutrient intake, instructing subjects on a ketogenic diet to limit
carbohydrate only but to consume unlimited quantities of fat and protein (2-4).
By its very definition, a ketogenic diet will reduce carbohydrate intake far below the levels
of a ‘balanced’ diet. Typically any diet containing more than 100 grams of carbohydrate per day,
which is enough to prevent ketosis, is referred to as a ‘balanced’ diet while any diet containing less
than 100 grams of carbohydrate per day will be ketogenic to varying degrees (6). As discussed in
chapter 5, the lower that carbohydrate intake falls, the greater the degree of ketosis that will
occur.
It should be noted that diets are being compared on a gram to gram basis, rather than in
terms of percentages. When dietary carbohydrate is restricted to low levels, the relative
percentage of fat and protein will increase, even though the absolute intake in terms of grams of
each may not change much. Saying that a ketogenic diet is a ‘high-fat’ diet because it is
comprised of 70% fat by percentage of calories is misleading as the total number of fat grams
being consumed per day may be no different than a diet with a lower percentage of fat but more
carbohydrates.
These studies have found that protein intake stayed roughly the same, fat intake also
stayed about the same or went down a bit, with carbohydrate intake the primary change (3,5).
This led one researcher to suggest that the ketogenic diet should be described as a ‘lowcarbohydrate’ diet rather than a ‘high-fat’ diet (7).
Another study examined the nutrient intake on a variety of popular diets, including the
Atkins diet (4). They found that the average ketogenic dieter consumed approximately 2100
calories, 121 grams of protein, 172 grams of fat, and 24 grams of carbohydrate. A summary of
these studies appears in Table 1.
102
Table 1: Comparison of macronutrient intake on a balanced vs. ketogenic diet
Study
Larosa (3)
Fisher (4)
Yudkin (5)
Balanced diet
Calories Protein Carbs Fat
1995
96
171
113
Not listed
2330
84
216
124
Ketogenic diet
Calories Protein Carbs
1461
107
6
2136
121
24
1560
83
67
Fat
108
172
105
Note: Protein, carbs, and fat are in grams per day.
Cholesterol intake
The high intake of animal source foods affects cholesterol intake as well. A typical
balanced diet provides between 300 and 500 milligram (mg) per day of cholesterol (3). On a
ketogenic diet, depending on total caloric intake, cholesterol intake was found to increase to 828
mg/day (484) on a 1400 calorie per day diet, and approximately 1500 mg/day on a 2100 calorie
diet (4). This is far higher than the American Heart Association recommendation of no more
than 300 mg/day of cholesterol, and concerns have been raised regarding the effect of ketogenic
diets on blood cholesterol levels. The effects of the ketogenic diet on cholesterol levels are
discussed in the chapter 7.
Summary
In general, individuals who begin a ketogenic diet without paying attention to calorie,
protein, or fat levels will automatically lower their caloric intake below maintenance. The
resulting caloric deficit will result in weight/fat loss. Typically, protein intake will stay about the
same, fat intake may go up a little bit, and carbohydrate intake will drop compared to preketogenic diet levels.
Section 2: Carbohydrates and the SKD
Carbohydrate intake is arguably the most significant aspect of a ketogenic diet as
carbohydrates have the greatest effect on ketosis. As a general rule, carbohydrate intake must
be reduced below 100 grams and most individuals find that a carbohydrate intake of 30 grams is
the maximum that can be consumed. Irrespective of other other facets of the SKD, a
carbohydrate intake which is too high will disrupt ketosis.
What are carbohydrates?
Carbohydrates are organic compounds made of carbon, hydrogen and oxygen
(carbohydrate is frequently abbreviated as CHO for this reason). They are used by the body
103
primarily as an energy source. Under normal dietary conditions, most tissues in the body use
carbohydrates, in the form of glucose, for fuel. There are exceptions such as the heart which rely
primarily on fatty acids for fuel.
Carbohydrates are generally subdivided into complex and simple carbohydrates. All
carbohydrates are formed from the simple sugars glucose, fructose and galactose, called
monosaccharides. Monosaccharides combine into chains of two, called disaccharides. As
monosaccharides form into longer chains, they are called polysaccharides or simply starch,
which is a chain of hundreds or thousands of glucose molecules attached to each other.
The term ‘complex carbohydrates’ refers to starches such as breads, pasta, potatoes, rice,
and all grains. Simple carbohydrates refer to sugars such as table sugar (sucrose), fructose and
fruit. Carbohydrates can be further delineated based on the Glycemic Index (GI) which is
discussed below.
Digestion of carbohydrate
Despite dietary differences between carbohydrates, almost all ingested carbohydrate will
enter the bloodstream as glucose, raising blood glucose levels. Each gram of dietary
carbohydrate appears in the bloodstream as 1 gram of glucose. A very small amount of ingested
carbohydrate (approximately one percent) will enter the bloodstream as fructose (fruit sugar).
Once in the bloodstream, glucose has a variety of fates. It can be burned immediately for
energy by most tissues of the body or stored as glycogen (a long chain of glucose molecules
attached to one another) in the muscle or in the liver for later use. If an excess of carbohydrates
is consumed, glucose can be converted to fat in the liver (a process called de novo lipogenesis) or
pushed directly into the fat cell as alpha-glycerophosphate.
How much carbohydrate can be eaten per day?
Chapter 5 established that the body can survive indefinitely on a diet completely devoid of
dietary carbohydrate (assuming protein and vitamin/mineral intake is sufficient). However, from
a practical standpoint, it is nearly impossible to avoid all sources of carbohydrate in the diet.
Additionally, a diet completely devoid of carbohydrate foods may rapidly become monotonous.
The question to be answered is how many grams of carbohydrate can be consumed without
interrupting ketosis.
Although up to 100 grams of carbohydrate will allow ketosis to develop, it would be rare to
see ketones excreted in the urine at this level of intake. Since the only measure of ketosis
available to ketogenic dieters are Ketostix (tm) carbohydrates must be restricted below this level
if ketosis is to be measured. As a general rule of thumb, dietary carbohydrates should be below
30 grams per day for ketosis to be rapidly established and for ketones to be lost in the urine.
However, this value varies from person to person and depends on other factors such as
protein intake and activity, which allows individuals to consume relatively more carbohydrate
without disrupting ketosis.
104
Assuming a non-excessive protein intake (see next section), a carbohydrate intake of 30
grams per day or less is advised during the first weeks of a SKD to allow for adaptations to take
place. After adaptation to the diet, it appears that individuals can tolerate relatively greater
carbohydrate intakes without disrupting ketosis. Although not completely accurate, Ketostix
(tm) can provide a rough measure of how many carbohydrates can be consumed while still
maintaining ketosis. As long as trace ketosis is maintained, carbohydrates can be gradually
added to the diet. See chapter 15 for details on using Ketostix (tm).
An extremely low carbohydrate intake is relatively more important for those individuals
following the CKD, who only have five or six days to establish ketosis. In this case, carbohydrate
intake should be minimized as much as possible (meaning that protein intake must be adequate)
during the first few days of each cycle so that ketosis will occur as quickly as possible.
Individuals on a TKD follow a separate set of rules for daily carbohydrate intake which is
discussed in chapter 11.
Types of carbohydrate consumed on a SKD
Carbohydrates are generally differentiated into complex and simple carbohydrates. This is
a crude measure of the quality of carbohydrates. A more accurate measure of carbohydrate
quality is the Glycemic Index (GI) which is a measure of how much insulin a given carbohydrate
food will cause to be released (see appendix 1 for a partial GI).
The GI of a food is defined relative to white bread, which is arbitrarily given a value of 100.
A food with a GI of 60 will cause glucose levels to rise in the blood 60% as quickly as white bread,
causing the release of 60% as much insulin. Similarly, a food with a GI of 130 will raise blood
glucose 30% more quickly than white bread, causing the body to release 30% more insulin. In
general, starches and complex carbohydrates tend to have lower GI values than simple sugars
like glucose and sucrose.
Since our wish is to minimize insulin release during a standard ketogenic diet, any dietary
carbohydrates which are consumed on a SKD should come from low GI sources. This means that
the majority of carbohydrates consumed will come from vegetable sources, as most starches
have a GI that is too high.
One thing to note is that the GI of carbohydrates is affected by the ingestion of protein,
fats and fiber at the same meal. The ingestion of other nutrients slows digestion of
carbohydrates, lowering the effective GI (less insulin response) than eating that same
carbohydrate by itself.
Timing of carbohydrate consumption on a SKD
Although there is little data on ideal timing of carbohydrates on a SKD, we can create a
few guidelines. While the amount of insulin released from the ingestion of dietary carbohydrates
is related to their quality (GI), it is also related somewhat to the quantity of carbs ingested.
Ingestion of 30 grams of broccoli will cause a greater insulin release than the ingestion of 10
grams of broccoli although the GI is identical.
105
One approach is to spread carbohydrate intake throughout the day in small amounts.
While this may minimize insulin response, it should be noted that 5-6 grams of carbohydrate per
meal is not much carbohydrate. Some individuals may wish to have all of their daily
carbohydrate at one main meal, such as a large salad with dinner or lunch. Although this will
cause a slightly greater insulin release than spreading out the same amount of carbohydrate
throughout the day, the low GI of vegetables coupled with the digestion slowing effect of protein,
fat and fiber should prevent an excessive insulin response. Even if a large enough insulin
response occurred to disrupt ketosis, it should be transient and ketosis should resume soon
thereafter.
Summary
Although carbohydrate intake must be severely restricted on a SKD, a diet completely
devoid of carbohydrate is impossible to achieve in practice and would be monotonous in any case.
Depending on factors such as protein intake, a carbohydrate intake of 30 grams per day or less
will generally allow the induction of ketosis although this varies from person to person. As a
general rule, low GI carbohydrates such as vegetables are the best source as they have the least
effect on insulin release. Fruits and starches should generally be avoided on a SKD. The daily
carbohydrate amount can either be spread throughout the day or eaten all at once.
Section 3: Protein and the SKD
Having discussed the details of carbohydrate intake on a standard ketogenic diet (SKD)
last chapter, we can now discuss issues pertaining to protein. Although carbohydrate intake is
arguably the most important aspect of successfully inducing ketosis, protein intake is extremely
important in order to prevent muscle loss. While an easy solution is to simply eat as much
protein as possible, too much protein can prevent ketosis as well, disrupting the adaptations
which ketogenic dieters seek. Therefore, protein intake must fall within a narrow range: high
enough to prevent muscle loss but low enough that ketosis is not disrupted.
A common criticism of the ketogenic diet is that ketosis is catabolic. This is true in that
any diet which is restricted in calories is catabolic . The question, addressed in chapters 5 and 6,
is whether the ketogenic diet is inherently more catabolic than other dietary approaches.
As discussed in chapter 6, one of the problems with many diet studies comparing ketogenic
to non-ketogenic diets was the provision of insufficient dietary protein to both groups, causing too
much protein loss in both groups. The interpretation given was that the ketogenic diet had no
benefit over a non-ketogenic diet when the proper interpretation was that both diets were
ineffective in preventing muscle loss. With adequate protein intake, muscle loss should be
minimal.
For any diet to minimize muscle loss, it must contain sufficient amounts of high quality
protein. Due to the high intake of animal proteins, ketogenic diets will tend to contain high quality
proteins by default.
106
What is a protein?
Proteins are organic compounds which provide the body with nitrogen for a variety of uses.
Protein are used for tissue repair, as well as the synthesis of some hormones and enzymes.
Proteins are made up of sub-units called amino acids (AAs). There are 20 AAs which occur in
food, although more are present in the body. Of these, 8 are referred to as indispensable
indicating that they must be obtained from the diet. The remaining 12 are considered dispensable
in that they can be synthesized in the body.
With few exceptions (i.e. gelatin), every dietary protein contains all of the AAs in varying
amounts. This means that that concept of ‘complete’ and ‘incomplete’ proteins is inaccurate. All
proteins are complete, in that they contain all AA. It is more accurate to say that proteins have
a limiting AA, which is the indispensable AA occurring in the lowest quantity relative to what is
needed. Consuming a variety of protein sources should ensure adequate amounts of all amino
acids.
The ratios of AAs determine, to a great degree, how well the human body can use these
proteins. This is sometimes referred to as the biological value (BV) or protein efficiency ratio
(PER).
Digestion of protein
As they are digested, proteins are broken down in the stomach into smaller chains of AAs.
These chains include single AAs (peptides), chains of two AAs (dipeptides), and chains of three
AAs (tripeptides). Once AAs enter the bloodstream, they are treated identically in the body.
This means that, for all practical purposes, the protein from an egg is treated no differently than
from an amino acid capsule. The only real difference in quality between proteins are in the
relative ratios of AAs.
As described in the chapter 5, dietary protein is converted to glucose with 58% efficiency
(8). This reflects the fact that over half of the AAs can be readily converted to glucose. While
some AAs can be converted to ketones in the liver, this is not thought to contribute significantly
to ketosis.
How much protein per day is needed to sustain the body?
Unlike carbohydrate and fat, the body does not have any way to store protein except as
muscle tissue and a small pool of free AAs in the bloodstream, muscle and liver. The utilization of
any body protein for uses other than tissue synthesis should be interpreted as a loss of skeletal
muscle tissue. Additionally, periods of severe starvation can cause the loss of cardiac, smooth or
organ protein. Although recent research differentiates between the loss of essential and nonessential lean body mass (LBM), any loss of LBM should generally be avoided as there is no way
to ensure that only non-essential LBM is being lost (9).
Under all dietary conditions, the body has a certain minimum protein requirement needed
for basic tissue repair, enzyme and hormone synthesis synthesis. This is represented by the
107
Recommended Dietary Allowance (RDA). For adults, the current RDA for protein is 0.8 grams of
protein/ kilogram of bodyweight (0.36 grams of protein/ lb bodyweight). The RDA assumes a
sedentary lifestyle and adequate caloric intake. Daily protein requirements are modified by at
least two factors: carbohydrate intake and activity level.
Carbohydrate intake
As total carbohydrate goes down, protein requirements will go up (10). By corollary, as
total carbohydrate intake goes up, protein requirements will go down. The reason for this is
discussed in detail in chapter 5. To summarize, without factoring in activity, a protein intake of
at least 1.75 grams of protein/kilogram lean body mass or a minimum of 150 grams per day are
necessary to prevent nitrogen losses during the initial stages of a ketogenic diet.
Activity and protein intake
For years it has been assumed that protein intake at the level of the RDA was sufficient
for all individuals including athletes. Much recent data suggests quite conclusively that athletes
do in fact need more protein than the RDA, in some cases up to two to three times more (11).
Bodybuilders and strength athletes have always consumed large amounts of protein as a matter
of course. However, on a ketogenic diet, too much protein can be as much of a problem (by
disrupting ketosis) as too little protein.
A review of the available research has determined that athletes have protein requirements
as shown in Table 2 (11). While it is arguably more accurate to use lean body mass (LBM) to
determine protein intakes, the difficulty in getting an accurate measure of LBM makes the use of
total bodyweight a better choice. Obviously, if an individual is carrying an excessive amount of
bodyfat, and has an accurate method of determining LBM, protein intake should be based on
LBM.
Table 2: Protein requirements for athletes
Endurance athletes
Strength athletes
Grams per pound
0.54 - 0.63
0.72 - 0.81
Grams per kilogram
1.2-1.4
1.6-1.8
Source: Lemon P. Is increased dietary protein necessary or beneficial for individuals with a
physically active lifestyle? Nutrition Reviews (1996) 54: S169-S175.
How much protein per day?
The most critical time to ensure sufficient protein intake is during the first few weeks of a
ketogenic diet, when the need for protein breakdown to provide glucose is at its highest. After the
first few weeks of ketosis, protein requirements will go down as the body reduces its need for
glucose.
108
As established in chapter 5, the prevention of nitrogen losses requires a protein intake of
at least 1.75 grams protein/kg LBM (0.8 grams/ lb of bodyweight) OR 150 grams of protein,
whichever is higher.
For lighter individuals, 1.75 g/kg of protein may be less than 150 grams, in which case
protein should be adjusted upwards to avoid nitrogen losses. After the third week of ketosis, when
the major protein sparing adaptations have taken place, protein intake can be adjusted
downwards as necessary. Please note that this value was determined for individuals who are not
exercising and are consuming minimal carbohydrates.
If an individual is exercising, it is assumed that protein requirements are higher than the
minimum of 1.75 grams/kg (~0.8 grams/lb). A protein intake of 0.9 grams of protein/lb of total
bodyweight is an appropriate protein level to start at. Although this is slightly higher than the
values suggested above, we can assume that extra protein is necessary during the initial phases
of adaptation.
If an individual is consuming even marginal amounts of carbohydrates (30 grams), then
less protein is necessary to achieve a positive nitrogen balance. Recall from the previous chapter
that 1 gram of protein will produce 0.58 grams of glucose. So 2 grams of protein will produce a
little more than 1 gram of glucose. Therefore, for every gram of carbohydrate consumed on a
ketogenic diet, protein requirements should go down by 2 grams. Someone consuming the
maximum of 30 grams of carbohydrate per day could reduce protein intake by approximately 15
grams per day.
It should be noted that women may not need as much protein as men, for reasons
discussed in chapter 18, but research into gender differences is only starting to appear.
Therefore, both male and female athletes should use the values in table 3 as a guide. If an
individual has trouble establishing and maintaining ketosis, and all other aspects of the diet are in
place, protein intake can be adjusted downward until ketosis is established.
Table 3: Protein requirements for various activity levels
Bodyweight
130
150
180
200
220
250
lbs
lbs
lbs
lbs
lbs
lbs
Protein intake
Sedentary
Exercising
(0.8 grams/lb)
(0.9 grams/lb)
104*
117*
120*
135*
144*
162
160
180
176
198
200
225
* During the first three weeks of the diet, these values should be raised to 150 grams for reasons
already discussed. After three weeks have passed, protein intake can be lowered to the levels
given above.
109
Protein and ketosis
Although there are no hard and fast rules for how much protein can inhibit ketosis, some
individuals have reported trouble maintaining ketosis if they consume too much protein per day,
or even excessive amounts of protein at a given meal. To the contrary, some individuals have
eaten 1.2 grams protein/lb or higher and had no problems establishing and maintaining ketosis.
This may be related to the glycogen depletion caused by weight training. In a depleted
state, incoming carbohydrate is used to refill muscle glycogen before it is used to refill liver
glycogen. In essence, the depletion of muscle glycogen provides a ‘sink’ for excess glucose
produced from dietary protein or carbohydrate intake.
Type of protein ingested
The amount of protein calculated in tables 2 and 3 is predicated on the consumption of high
quality proteins such as animal flesh, eggs, and dairy products. The nature of the ketogenic diet
almost ensures that protein intake is from high quality proteins. Many individuals choose to use
commercial protein powders as a protein source and there are many different products available.
The only exception is certain liquid protein preparations which sometimes use low quality
protein (such as collagen or gelatin) fortified with one or more AAs (generally tryptophan).
As detailed in chapter 7, the deaths associated with liquid very- low-calorie protein sparing
modified fasts may have been related to the use of low quality collagen protein although
insufficient vitamin and mineral intake has also been implicated. As long as high quality protein
and adequate vitamins and minerals are ingested, there should not be problems of this sort on a
ketogenic diet.
Timing of protein intake
For the most part, the timing of protein intake is not an issue on a SKD, except as it
pertains to maintaining ketosis. The nature of the ketogenic diet ensures that protein is
consumed at most meals with few exceptions. Consuming protein immediately after a workout
may help with recovery, as protein synthesis is increased at this time. Typically 30-40 grams of
protein are consumed immediately after training to provide the muscles with AAs for tissue
synthesis.
Summary
Protein intake is a critical aspect of a ketogenic diet to prevent muscle loss.
Approximately 150 grams per day of protein must be ingested to provide enough glucose to
supply the brain and prevent the body from breaking down muscle protein. An individual’s daily
protein requirements are tied to activity level and bodyweight. Those individuals whose activity
and bodyweight result in less than 150 grams of protein per day will need to either increase
protein during the first 3 weeks of the diet or increase dietary carbohydrate to ensure adequate
glucose for the brain.
110
The type of protein ingested should be of high quality from animal products such as red
meat, chicken, fish, eggs and dairy. The nature of the ketogenic diet generally ensures that high
quality protein is consumed unless some type of liquid protein fast is being performed. Some
individuals also choose to use commercial protein powders as a protein source.
Section 4: Fat and the SKD
Having discussed the details of carbohydrate and protein amounts in the last two
chapters, the only remaining macronutrient to be discussed is dietary fat. Although a ketogenic
diet can be constructed with only protein and a small amount of carbohydrate, the caloric intake
is so low that metabolic slowdown will occur. Fat is in essence a caloric ballast, a nutrient which
has a relatively neutral effect on insulin levels or ketosis, and which is used to adjust calories.
What is a fat?
Fats are an organic compound, more accurately referred to as a triglyceride (TG), which is
composed of a glycerol molecule with three free fatty acid (FFA) chains attached. Depending on
the type of FFA chains, fats will vary in their types and effects on the human body. Generally,
TG is subdivided into unsaturated fats, which occur in vegetable oils, and saturated fats, which
occur in animal fats such as butter fat. A third type of TG, called a partially hydrogenated or
trans-fat, is a man-made fat produced by bubbling hydrogen through vegetable oil to make a
semi-solid fat, such as margarine.
Digestion of TG
Regardless of type, all TG is digested the same way: ultimately being broken down into
glycerol and FFA. Depending on a variety of factors, the FFA can be burned for energy by the
muscles or heart, resynthesized back to TG in fat cells, or converted to ketones in the liver. The
glycerol portion of TG can be converted to glucose as discussed in chapter 5.
Cholesterol
Although cholesterol has no direct impact on ketone body formation, confusion about
cholesterol warrants a brief discussion. While not strictly a fat, cholesterol is a compound most
often associated with dietary fat intake.
Cholesterol is a steroid molecule which is used for a variety of functions in the body
including the synthesis of some hormones such as testosterone and estrogen. Cholesterol only
occurs in food of animal origin with an average of 100 milligrams of cholesterol present in 3
ounces of meat.
111
Digestion of cholesterol
The details of cholesterol digestion are extremely complex and unnecessary for the ensuing
discussion. As dietary cholesterol has no direct affect on ketosis, it will not be discussed further in
this chapter.
With regard to blood cholesterol levels, readers need to understand that the liver produces
more cholesterol (up to 2000 milligrams per day) than most individuals would ever consume, even
on a ketogenic diet. Additionally, when dietary cholesterol intake increases, the body’s synthesis
of cholesterol will typically go down. When dietary cholesterol intake goes down, the body’s
synthesis of cholesterol typically goes up. This supports the contention that dietary cholesterol
generally has little impact on blood cholesterol levels. The effects of the ketogenic diet on blood
cholesterol levels are discussed in chapter 7.
What tissues use fat?
As discussed in previous chapters, almost all tissues of the body can use FFA as a fuel
under proper conditions. From a purely energy perspective, there is no difference between dietary
fat and stored bodyfat. From that standpoint, there is no real requirement for dietary fat with
the exception of two essential fatty acids which must be consumed through the diet. Given the
same protein and carbohydrate intake, the more dietary fat which is ingested, the less bodyfat
which will be lost and vice versa.
How much fat per day?
As opposed to carbohydrate and protein, the body is able to store an almost unlimited
supply of calories as bodyfat. An average individual (150 lbs and 15% bodyfat or 22.5 lbs of fat)
carries almost 80,000 calories worth of stored fat in their adipose tissue. This is enough stored
energy to walk approximately 800 miles without exhausting fat stores. This, along with the fact
that there is only a small essential fatty acid requirement, raises the question of why a dieter
should eat any dietary fat on a ketogenic diet.
As discussed in the previous chapter, once ketosis is established, the majority of calories
burned by the body will come from fat breakdown. The remainder comes from the small
obligatory use of glucose by certain tissues, and the use of ketones. During total starvation, or
the protein sparing modified fast, up to 1800 calories (200 grams) or more of FFA may be burned
per day by an average sized person.
Although a high fat intake is necessary for epileptic children, this is because they must
maintain deep ketosis and weight loss is not desirable for developing children in most cases.
However, for epileptic children who are also obese, the ketogenic diet is used both as a treatment
for the epilepsy as well as to cause weight loss (12).
All of this data suggests that dietary fat is not a necessary part of a ketogenic diet from a
metabolic or adaptational standpoint as ketosis will readily develop without the consumption of
dietary fat (assuming protein and carbohydrate intake are not too high). From a strictly
112
metabolic standpoint, there appears to be no difference in a ketogenic diet which contains fat and
one which does not contain fat.
The primary reason for the inclusion of dietary fat in the ketogenic diet is to keep caloric
intake high enough to prevent a slowdown of metabolic rate. Recall from chapter 8 that a caloric
deficit below 12 calories per pound of bodyweight can result in the loss of muscle and metabolic
slowdown, both of which dieters want to avoid. Since protein and carbohydrate intake must be
kept relatively constant on a ketogenic diet, the only way to modulate caloric intake is by
changing the amount of dietary fat consumed.
From a practical standpoint, the inclusion of dietary fat tends to promote feelings of
fullness as well as making food taste better, both important aspects of making a diet work for
most people. Those who have tried an all-protein diet can attest to the monotony of consuming
only lean protein at each meal for long periods of time.
In essence, after caloric requirements have been established and protein and carbohydrate
intake set, the remaining calories will come from dietary fat. The details of calculating dietary fat
requirements appear in section 6 where a complete SKD is set up.
An important observation with regards to fat intake is that some individuals have reported
transient stomach upset (and occasionally nausea) when they begin a ketogenic diet, especially if
they have been on a low-fat diet previously. Easing into the ketogenic diet more gradually, by
slowly increasing fat intake and decreasing carb intake at the same time, seems to prevent some
of these symptoms. Additionally, sufficient fiber intake may help.
Quality of fat consumed
Like carbohydrates and protein, fats can be rated in terms of their quality. Much of the
stigma associated with dietary fat is related to fat quality as much as quantity. Almost all of the
dietary fat which we eat on a daily basis is in the form of triglycerides (TG), which is a glycerol
molecule bonded to three free fatty acid (FFA) chains. Depending on the types of FFA present,
TG are typically delineated into unsaturated or saturated.
• Unsaturated fats: Typically speaking, unsaturated fats are found primarily in foods of
vegetable origin such as vegetable oils, nuts and seeds. Unsaturated fats are liquid at room
temperature. Two specific unsaturated fats, called essential fatty acids (EFAs), must be
obtained from the diet as they can not be synthesized within the body. These are linoleic acid
(LA) and alpha-linolenic acid (ALA). LA and ALA occur to some degree in all vegetable source
fats, but the most concentrated sources are flax oil/flax meal, safflower oil, and sunflower oil.
• Saturated fats: With only two exceptions (coconut oil and palm kernel oil), saturated fats occur
in foods of animal origin such as the fat in beef or chicken. Dairy fats such as butter and heavy
cream are also sources of saturated fats. Saturated fats are solid at room temperature.
• Trans-fatty acids (TFAs): Trans-fatty acids, also called partially hydrogenated vegetable oil,
occur only in processed foods. Food manufacturers bubble hydrogen through vegetable oils to
113
make a semi-solid (i.e. margarine), which has a longer shelf life. TFAs are thought to have many
negative health consequences and their intake should be minimized. An emphasis on
unprocessed foods will minimize the intake of TFAs.
Little research has examined the effects of different types of TG on a ketogenic diet,
although one study suggested a difference in weight loss and thermogenesis between olive and
corn oil, with corn oil being the preferred choice (13). Anecdotally, many individuals find that
increased intake of unsaturated fats, especially flax oil, tend to increase fat loss compared to a
high intake of saturated fats. As well, many individuals who have found that their blood
cholesterol levels increase on a ketogenic diet note that cholesterol decreases if more unsaturated
fats are consumed.
To minimize potential health problems, consuming primarily unsaturated fats may be
ideal. However, avoiding all saturated fats would be unrealistic since this will further limit the
number of foods available to ketogenic dieters. In practice, most individuals will end up
consuming a mix of both saturated and unsaturated fats during the day. A source of EFAs, such
as flax or safflower oil, should be consumed. Alternately some individuals have consumed foods
such as flax seeds or flax meal or consumed fatty nuts to fulfill their EFAs requirements.
Timing of fat intake
As with protein intake, there is no specific time to consume or not consume dietary fat on
a SKD. Most individuals tend to spread dietary fat more or less evenly throughout the day, if for
no other reason than to avoid stomach upset. The exception is immediately after a workout
when dietary fat is not desirable, as it will slow digestion of post-workout protein intake.
Summary
With the exception of the small requirement for the EFAs, there is no essential reason to
consume dietary fat as ketosis can readily be induced with a diet of all protein and a small
amount of carbohydrate. However, to avoid metabolic slowdown from an excessively low caloric
intake, dietary fat is necessary as a caloric ballast since protein and carbohydrates must be kept
relatively static on a ketogenic diet. From a purely practical standpoint, dietary fat provides
fullness and taste as a diet of pure protein is monotonously bland.
While little research has examined the optimal type of fats to consume on a SKD, when
possible it is beneficial to consume more unsaturated vegetable fats over saturated animal fats
to avoid any potential problems with blood lipid levels. To avoid all saturated fats is nearly
impossible considering the generally high intake of animal products on a ketogenic diet.
Timing of fat intake is not critical to success of the diet. The exception is that dietary fat
should be avoided post workout so that protein ingested at this time can enter the bloodstream
quickly to help with post-workout recovery.
Section 5: Other dietary effects on ketosis
114
Section 5: Other dietary effects on ketosis
Other than protein, carbohydrate and fat, a number of other nutritional substances can
affect the ability to establish and maintain ketosis. While not all have been studied with respect
to their effects on ketosis, anecdotal evidence can help to determine which substances may or
may not affect ketosis. The substances discussed in this chapter are water, alcohol, caffeine, and
citric acid/aspartame.
Water
Strictly speaking, water intake should have no direct effect on ketogenesis (at least in
terms of a direct effect at either the liver or the fat cell). However, water intake may affect the
measurement of ketosis in more subtle ways.
As discussed in chapter 4, high concentrations of blood ketones tend to prevent further
ketone body production by raising insulin and decreasing fat release from the fat cell. In theory,
this might be seen to slow fat loss when ketone concentrations become high. By extension, a high
water intake might dilute blood ketone levels and prevent this from occurring. Additionally, it
seems possible that a high fluid intake might wash ketones out of the bloodstream into the
kidneys (for excretion), causing more bodyfat to be used to synthesize more ketones.
Neither of these ideas have been studied directly. When the ketogenic diet is used to treat
epilepsy, fluids of all types are restricted in an attempt to keep blood ketone concentrations very
high, as high ketone body levels are thought to be part of the mechanism by which the diet works.
This suggests that a high water intake might dilute blood ketone levels and prevent the rise in
insulin which can occur.
However, a high water intake may also dilute urinary ketone levels, making it more
difficult to determine if one actually is in ketosis or not. Anecdotally, individuals who consume
very large amounts of water tend to show very light levels of urinary ketones on the Ketostix (tm)
(which are discussed in detail in chapter 15).
From a purely health standpoint, a high water intake is necessary on a ketogenic diet due
to the dehydrating effects of ketosis. Some of the side effects which occur in epileptic children (i.e.
kidney stones) may be related to the dehydration which is imposed and individuals are suggested
to keep water intake high as a general rule.
Alcohol
Although alcohol intake has been discussed briefly in previous sections, its effects on
ketosis need to be discussed here, especially since many individuals want to know if alcohol is
allowed on a ketogenic diet. In general, once ketosis is established alcohol tends to deepen the
level of ketosis seen. Additionally, the pathological state of alcoholic ketoacidosis (which occurs
when individuals consume nothing except alcohol for long periods) is known to result in potentially
dangerous levels of ketones in the bloodstream. Alcohol may affect ketone body production in the
115
dangerous levels of ketones in the bloodstream. Alcohol may affect ketone body production in the
liver and alcohol itself can be converted to ketones. As well, the production of ketones from
alcohol tends to result in less fat loss since less FFA is converted to ketones.
Strictly speaking there is no reason that small amounts of alcohol cannot be consumed
during a ketogenic diet although it should be realized that fat loss will be slowed. Additionally,
anecdotal reports suggest that alcohol may affect individuals more (in terms of drunkenness,
etc.) when they are in ketosis versus when they are not. Care should be taken by anyone
consuming alcohol.
Caffeine
Although caffeine is discussed in more detail in the supplement chapter, its potential
effects on ketosis are addressed here. A popular idea floating around states that caffeine raises
insulin levels which might possibly disrupt ketosis. As well many individuals find that some
caffeine containing drinks, such as diet soda, can interrupt ketosis.
However, this is contradictory to the known effects of caffeine ingestion, which are to raise
levels of adrenaline and noradrenaline and raise FFA levels. The only way that caffeine could
raise insulin would be indirectly. By raising adrenaline and noradrenaline levels, caffeine might
cause liver glycogen to be broken down into glucose and released into the bloodstream, raising
insulin. This would only occur prior to ketosis being established, such as after the carb-load
phase of the CKD, and would help a dieter to establish ketosis.
Citric acid and aspartame
In all likelihood, problems with diet soda relate to one of these two compounds, both of
which are used as artificial sweeteners in diet products. Citric acid may inhibit ketosis and diet
sodas containing citric acid or aspartame are not allowed for epileptic children on the ketogenic
diet (14). However, there is some debate over this point (15). Possibly, citric acid might affect
ketosis by affecting liver metabolism, primarily the Krebs cycle. Some individuals report that
citric acid prevents them from entering ketosis but does not affect ketosis once it has been
established. One study, examining very-low-calorie diets, found that the consumption of citric
acid inhibited ketosis and increased appetite in many individuals (16). Ultimately, individuals will
have to determine for themselves whether citric acid or aspartame has any effect on ketosis,
appetite or fat loss on a ketogenic diet.
Fiber
While fiber has already been discussed in terms of its effects on constipation in chapter 7,
there is some concern that fiber may negatively impact ketosis. Strictly speaking fiber is a
carbohydrate. However, humans do not have the enzymes necessary to digest fiber and derive
any carbohydrate grams or calories from it. Therefore, fiber intake should not be counted as part
of the total daily carbohydrate grams consumed on a ketogenic diet.
116
Similarly, there is some confusion regarding food labels and fiber content. By law, fiber has
to be listed in the total carbohydrate grams part of the food label as well as being listed
separately. However, it should not be counted as a carbohydrate in terms of ketosis and a
ketogenic diet. Therefore, the total grams of fiber in a food should be subtracted from the total
grams of carbohydrate in order to determine how many grams of carbohydrate that food will
contribute to daily totals. If a food lists 20 grams of carbohydrates, but 7 grams of fiber, only 13
grams of carbohydrate should be counted towards the daily total.
Summary
A variety of nutritional substances may have an impact on ketosis including water,
alcohol, caffeine, citric acid and aspartame, and fiber. Water has an indirect effect on ketosis,
although large water intakes may dilute urinary ketone readings. In general, alcohol tends to
deepen ketosis, and may increase an individual’s susceptibility to becoming intoxicated. Despite
popular belief, caffeine does not raise insulin except indirectly, and should not negatively affect
ketosis. Citric acid and aspartame cause problems in some individuals and not others. Fiber has
no direct impact on ketosis, but confusion exists as to how fiber should be treated in terms of
carbohydrate intake. As humans lack the enzymes necessary to digest fiber, fiber should not be
counted as part of the daily carbohydrate intake.
Section 6: Setting up an SKD
Having discussed the details behind carbohydrate, protein, and fat content several diet
examples are presented here to demonstrate how the calculations are made.
General concepts
There are four steps to set up an optimal SKD.
Step 1: Set calorie levels as discussed in chapter 8.
Step 2: Set protein levels as discussed in section 2 of this chapter. Protein should be set at 0.9
gram/lb for individuals who are exercising and 0.8 grams/lb for those who are not. If daily protein
intake is below 150 grams per day, it should be adjusted upwards for the first three weeks of the
diet. Protein contains 4 calories per gram.
Step 3: Set carbohydrate levels. This will generally be below 30 grams per day, especially during
the initial weeks of the diet. Carbohydrate contains 4 calories per gram.
Step 4: Set fat intake levels. Fat intake will represent the remainder of daily calories after
protein and carbohydrate are determined. Fat has 9 calories per gram.
Two sample diets are set up below.
117
Example 1: 200 lb male who is weight training
Step 1: Set caloric intake: 200 lb * 12 cal/lb = 2400 calories per day
Step 2: Set protein intake: 200 lb * 0.8 g/lb = 160 grams of protein. Since protein has 4
calories/gram, this is 160 grams * 4 cal/gram = 640 calories from protein
Step 3: Set carbohydrate intake. For an SKD, we will assume 10 grams of carbohydrate per day.
Since carbohydrate has 4 calories/gram, this is 10 grams * 4 cal/gram = 40 calories from
carbohydrate.
Step 4: To determine fat intake, subtract calories from protein and carbohydrate from total
calories.
2400 calories - 640 calories - 40 calories = 1720 calories from fat
Since fat has 9 calories/gram, this is 1720 calories / 9 cal/gram = 191 grams of fat
This person’s overall diet is:
Calories: 2400
Protein intake: 160 grams/day
Carbohydrate intake: 10 grams/day
Fat intake: 191 grams/day
Example 2: 150 lb female who is sedentary
Step 1: Set calorie intake: 150 lbs * 12 cal/lb = 1800 cal/day
Step 2: Set protein intake: 150 lbs * 0.8 g/lb = 120 grams of protein. Since protein intake is below
150 grams per day, this should be adjusted to 150 grams/day for the first three weeks of the diet.
At 4 cal/gram, this is 150 grams * 4 cal/gram = 600 calories from protein.
Step 3: Set carbohydrate intake: 10 grams per day * 4 cal/gram = 40 calories
Step 4: set fat intake
1800 cal/day - 600 calories - 40 calories = 1160 calories from fat
1160 calories from fat / 9 cal/gram = 128 grams of fat per day
After three weeks, dietary protein intake can be lowered to 120 grams per day or 480
calories/day. Thus fat intake must be adjusted upwards.
1800 cal/day - 480 calories - 40 calories = 1280 calories from fat
1280 calories from fat / 9 cal/gram = 142 grams of fat per day.
References Cited
1. Council on Foods and Nutrition. A critique of low-carbohydrate ketogenic weight reducing
regimes. JAMA (1973) 224: 1415-1419.
2. Yudkin J and Carey M. The treatment of obesity by a ‘high-fat’ diet - the inevitably of calories.
Lancet (1960) 939.
3. Larosa JC et. al. Effects of high-protein, low-carbohydrate dieting on plasma lipoproteins and
body weight. J Am Diet Assoc (1980) 77: 264-270.
4. Fisher MC and Lachance PA. Nutrition evaluation of published weight reducing diets. J Amer
118
4. Fisher MC and Lachance PA. Nutrition evaluation of published weight reducing diets. J Amer
Dietetic Assoc (1985) 85: 450-454.
5. Stock A and Yudkin J. Nutrient intake of subjects on low carbohydrate diet used in treatment
of obesity. Am J Clin Nutr (1970) 23: 948-952
6. Phinney S. Exercise during and after very-low-calorie dieting. Am J Clin Nutr (1992)
56: 190S-194S.
7. Yudkin J. The low-carbohydrate diet in the treatment of obesity. Postgrad Med (1972)
51:151-154.
8. Jungas RL et. al. Quantitative analysis of amino acid oxidation and related gluconeogenesis in
humans. Physiological Reviews (1992) 72: 419-448
9. Marks BL and Rippe J. The importance of fat free maintenance in weight loss programs.
Sports Med (1996) 22: 273-281.
10. Richardson DP et. al. Quantitative effect of an isoenergetic exchange of fat for carbohydrate
on dietary protein utilization in healthy young men. Am J Clin Nutr (1979) 32: 2217-2226.
11. Lemon P. Is increased dietary protein necessary or beneficial for individuals with a physically
active lifestyle? Nutrition Reviews (1996) 54: S169-S175.
12. “The Epilepsy Diet Treatment: An introduction to the ketogenic diet” John M. Freeman, MD ;
Millicent T. Kelly, RD, LD ; Jennifer B. Freeman. Demos Vermande, 1996.
13. Kasper H. et. al. Response of bodyweight to a low carbohydrate, high fat diet in normal and
obese subjects. Am J Clin Nutr (1973) 26: 197-204.
14. Gasch AT. Use of the traditional ketogenic diet for treatment of intractable epilepsy. J Am
Diet Assoc (1990) 90: 1433-1434.
15. Brunett A. Should diet soft drinks be restricted on a ketogenic diet [Letter]. J Am Diet
Assoc (1991) 91: 776
16. Krietzman S. Factors influencing body composition during very-low-calorie diets. Am J Clin
Nutr (1992) 56 (suppl): 217S-223S.
119
Chapter 10:
Carbohydrates and the ketogenic diet
In addition to the standard ketogenic diet (SKD), this book also details two modifications
which have been made to the SKD. As discussed in forthcoming chapters on exercise, a SKD
cannot sustain high-intensity exercise performance such as weight training or high-intensity
aerobic training and carbohydrates must be integrated to the SKD in some fashion.
There are two primary types of ‘modified ketogenic diets’ which incorporate carbohydrate
intake within the structure of a SKD. The first of these is the Targeted Ketogenic Diet (TKD) in
which individuals consume carbohydrates around exercise only. This allows for a maintenance of
exercise performance and glycogen resynthesis without interrupting ketosis for long periods of
time.
The second type of ‘modified ketogenic diet’ is the Cyclical Ketogenic Diet or CKD. The
CKD alternates periods of a ketogenic diet (generally 5-6 days) with periods of high carbohydrate
intake (1-2 days).
Typically the TKD is used by those individuals who either can not or will not perform the
longer carb-load of the cyclical ketogenic diet (CKD) or by individuals who are just starting
exercise programs and are not ready to perform the amount of exercise needed to make the CKD
work.
The CKD is typically aimed at individuals who are more advanced in terms of their exercise
programs (i.e. bodybuilders) due to the high volume and intensity of training needed to optimize
the diet. Before discussing the TKD and CKD in chapters 11 and 12, some general comments are
made regarding glycogen levels and rates of glycogen depletion. This chapter discusses glycogen
levels and depletion, topics which apply to both the TKD and CKD.
Section 1: Glycogen levels
To understand the basis of both the TKD and the CKD, a discussion of glycogen levels
under a variety of conditions is necessary. To achieve optimal results from either the TKD or
CKD requires that some estimations be made in terms of the amount of training which can and
should be done as well as how much carbohydrate should be consumed at a given time.
Muscle glycogen is measured in millimoles per kilogram of muscle (mmol/kg). An individual
following a normal mixed diet will maintain glycogen levels around 80-100 mmol/kg. Athletes
following a mixed diet have higher levels, around 110-130 mmol/kg (1). On a standard ketogenic
diet, with aerobic exercise only, muscle glycogen levels maintain around 70 mmol/kg with about
50 mmol/kg of that in the Type I muscle fibers (2,3).
As discussed in greater detail in upcoming chapters, fat oxidation increases, both at rest
and during aerobic exercise around 70 mmol/kg. Below 40 mmol/kg, exercise performance is
impaired. Total exhaustion during exercise occurs at 15-25 mmol/kg. Additionally, when glycogen
120
impaired. Total exhaustion during exercise occurs at 15-25 mmol/kg. Additionally, when glycogen
levels fall too low (about 40 mmol/kg), protein can be used as a fuel source during exercise to a
greater degree (4).
Following glycogen depletion, if an individual consumes enough carbohydrates over a
sufficient amount of time (generally 24-48 hours), muscle glycogen can reach 175 mmol/kg or
higher (1). The level of supercompensation which can be achieved depends on the amount of
glycogen depleted (5,6). That is, the lower that muscle glycogen levels are taken, the greater
compensation which is seen. If glycogen levels are depleted too far (below 25 mmol/kg), glycogen
supercompensation is impaired as the enzymes involved in glycogen synthesis are impaired (7).
A summary of glycogen levels under different conditions appears in table 1.
Table 1: Glycogen levels under different conditions
Condition
Diet
Supercompensated
High carb
Athlete
Mixed diet
Normal individual
Mixed diet
Normal individual,
Ketogenic diet
- aerobic exercise only
Fat burning increases
Exercise performance decreased
Exhaustion
Glycogen level (mmol/kg)
175
110-130
80-100
70
70
40
15-25
Glycogen resynthesis without post exercise carb intake
Even without the consumption of carbohydrates there is some replenishment of muscle
glycogen stores following exercise. This raises the question of whether carbohydrates are
necessary while on a SKD. A few calculations will show that the small amount of glycogen
resynthesized during exercise is insufficient to maintain glycogen stores for more than a few
workouts.
When zero carbohydrates are consumed following training, there is a small amount of
glycogen resynthesized. This glycogen comes from the conversion of lactate, a by-product of
glycogen breakdown in the muscle, to glucose in the liver. This newly made glucose is released into
the bloodstream and stored again in the muscle as glycogen. Two mmol of lactate are required to
resynthesize 1 mmol of glycogen (8). Approximately 20% of the lactate generated during weight
training can be used to resynthesize glycogen after training.
Lactate levels in the muscle during resistance training may only reach 10-15 mmol with a
maximum of 21 mmol (seen only in highly trained bodybuilders). At 2 mmol of lactate/1 mmol
glycogen and an efficiency of 20%, this would have the potential to resynthesize only 2 mmol/kg
of glycogen, an insignificant amount.
Two studies have examined the phenomenon of post-workout glycogen resynthesis. One
study using weight training with no carbohydrate given found a resynthesis rate of 1.9
mmol/kg/hour following resistance training with a total of 4 mmol/kg being resynthesized (8). As
121
40 mmol/kg of glycogen was depleted during the exercise, this small amount would not sustain
exercise performance for long.
However, in a second study, 22 mmol/kg was synthesized after training (9). The major
difference between these studies was that subjects in the second study (9) ate a small
carbohydrate-containing meal the morning of the training session whereas the subjects in the
first (8) did not. The elevation of blood glucose from the pre-workout meal allowed greater
glycogen resynthesis to occur following training in the second study (8,10). This observation is
the basis for the TKD which is discussed in chapter 11.
Summary
In the absence of dietary carbohydrates, the amount of glycogen resynthesis following
weight training is insignificant and will not sustain high intensity performance for very long. This
further stresses the importance of carbohydrate intake for individuals on a ketogenic diet
wishing to perform weight or interval training.
If carbs are taken prior to a workout, there can be a significant amount of glycogen
resynthesis following training depending on the quantity of carbohydrate consumed. This is the
basis of the TKD, discussed in the next chapter.
Section 2: Glycogen depletion during weight training
Having looked at glycogen levels under various conditions, we can now examine the rates of
glycogen depletion during weight training and use those values to make estimations of how much
training can and should be done for both the TKD and CKD.
Very few studies have examined glycogen depletion rates during weight training. One early
study found a very low rate of glycogen depletion of about 2 mmol/kg/set during 20 sets of leg
exercise (11). In contrast, two later studies both found glycogen depletion levels of approximately
7-7.5 mmol/kg/set (8,9). As the difference between these studies cannot be adequately explained,
we will assume a glycogen depletion rate of 7.5 mmol/kg/set.
Examining the data of these two studies further, we can estimate glycogen utilization
relative to how long each set lasts. At 70% of maximum weight, both studies found a glycogen
depletion rate of roughly 1.3 mmol/kg/repetition or 0.35 mmol/kg/second of work performed (8,9).
This makes it possible to estimate the amount of glycogen which is depleted for a set of lasting a
given amount of time (table 2).
Summary
Glycogen levels in muscle vary depending on a number of factors including diet and training
status. While there is a small amount of glycogen resynthesized following exercise even if no
carbohydrates are consumed, the amount is insignificant and will not be able to sustain exercise
performance for more than a few workouts.
122
Since high-intensity activity such as weight training can only use carbohydrate as fuel, a
SKD will not be able to sustain high-intensity exercise performance. This mandates that
carbohydrate be introduced into the SKD without disrupting the effects of ketosis. The two
primary ways to introduce carbohydrate to the SKD are the CKD, which allows a period of high
carbohydrate consumption lasting from 24-48 hours every week, or the TKD where the dieter
consumes carbohydrates around training.
Table 2: Amount of glycogen depleted for sets of differing lengths
Length of set (seconds)
30
40
50
60
70
80
90
Glycogen depleted (mmol/kg)
10
14
17
21
24
28
31
References Cited
1. Ivy J. Muscle glycogen synthesis before and after exercise. Sports Medicine (1991) 11: 6-19.
2. Phinney SD et. al. The human metabolic response to chronic ketosis without caloric restriction:
physical and biochemical adaptations. Metabolism (1983) 32: 757-768.
3. Phinney SD et. al. The human metabolic response to chronic ketosis without caloric restriction:
preservation of submaximal exercise capacity with reduced carbohydrate oxidation.
Metabolism (1983) 32: 769-776.
4. Lemon PR and Mullin JP. Effect of initial muscle glycogen level on protein catabolism during
exercise. J Appl Physiol (1980) 48: 624-629.
5. Zachweija JJ et. al. Influence of muscle glycogen depletion on the rate of resynthesis. Med Sci
Sports Exerc (1991) 23: 44-48.
6. Price TB et. al. Human muscle glycogen resynthesis after exercise: insulin-dependent and independent phases. J Appl Physiol (1994) 76: 104-111.
7. Yan Z et. al. Effect of low glycogen on glycogen synthase during and after exercise. Acta
Physiol Scand (1992) 145: 345-352.
8. Pascoe DD and Gladden LB. Muscle glycogen resynthesis after short term, high intensity
exercise and resistance exercise. Sports Med (1996) 21: 98-118.
9. Robergs RA et. al. Muscle glycogenolysis during different intensities of weight-resistance
exercise. J Appl Physiol (1991) 70: 1700-1706.
10. Conley M and Stone M. Carbohydrate ingestion/supplementation for resistance exercise and
training. Sports Med (1996) 21: 7-17.
11. Tesch PA et. al. Muscle metabolism during intense, heavy resistance exercise. Eur J Appl
Physiol (1986) 55: 362-366.
123
Chapter 11:
The Targeted Ketogenic Diet (TKD)
Having examined glycogen levels and glycogen depletion in the last chapter, the details of
the first ‘modified ketogenic diet’ can now be discussed. The targeted ketogenic diet (TKD) is
nothing more than the standard ketogenic diet (SKD) with carbohydrates consumed at specific
times around exercise. This means that the general guidelines for constructing a SKD in chapter
9 should be used with the exception that more carbohydrates are consumed on days when
exercise is performed. If fat loss is the goal, the number of calories consumed as carbohydrates
should be subtracted from total calories, meaning that less dietary fat is consumed on those
days.
The TKD is based more on anecdotal experience than research. Invariably, individuals on
a SKD are unable to maintain a high training intensity for reasons discussed in chapters 18
through 20. However, for a variety of reasons,some dieters choose not to do the full 1-2 day carbup of the CKD (discussed in the next chapter). The TKD is a compromise approach between the
SKD and the CKD. The TKD will allow individuals on a ketogenic diet to perform high intensity
activity (or aerobic exercise for long periods of time) without having to interrupt ketosis for long
periods of time.
Why pre-workout carbs?
Weight training is not generally limited by the availability of blood glucose. Studies giving
carbs prior to resistance training have not found an increase in performance (1). However,
almost without exception, individuals on a SKD who consume pre-workout carbs report improved
strength and endurance and an ability to maintain a higher intensity of training during their
workout. Anyone following a ketogenic diet who wishes to perform high intensity training can
benefit from the TKD approach.
Very little research has examined the effects of a ketogenic diet on weight training
performance and it is difficult to determine exactly why performance is improved with preworkout carbs. It may be that raising blood glucose to normal levels, which only requires a
minimal 5 grams of carbohydrate (2), allows better muscle fiber recruitment during training or
prevent fatigue. Ultimately, the reason why carbohydrates improve performance is less critical
than the fact that they do.
Additionally, individuals performing extensive amounts of aerobic training on a SKD
typically report improved performance with carbs consumed before and during workouts. Even
at low intensities, performance on a SKD is limited by glucose and muscle glycogen. For this
reason, endurance athletes using a SKD are encouraged to experiment with carbohydrates
around training.
124
Amounts, types and timing of carbs
The major goal with pre-workout carbs is not necessarily to improve performance,
although that is a nice benefit. Primarily, the goal is to provide enough carbohydrate to promote
post-workout glycogen synthesis without interrupting ketosis for very long. That is, the
carbohydrate taken prior to one workout is really an attempt to ‘set up’ the body for better
performance at the next workout by maintaining glycogen levels.
Although experimentation is encouraged, most individuals find that 25-50 grams of
carbohydrates taken thirty minutes before a workout enhance performance. The type of
carbohydrate consumed pre-workout is not critical and individuals are encouraged to experiment
with different types of carbs. Most seem to prefer easily digestible carbohydrates, either liquids
or high Glycemic Index (GI) candies to avoid problems with stomach upset during training. A
wide variety of foods have been used prior to workouts: glucose polymers, Sweet Tarts, bagels,
and food bars; all result in improved performance.
One concern of many SKDers (especially those who are using a ketogenic diet to control
conditions such as hyperinsulinemia) is the potential insulin response from carbohydrate
ingestion on a TKD. Generally speaking, insulin levels decrease during exercise. Exercise training
itself improves insulin sensitivity as does glycogen depletion (3,4). So hyperinsulinemia should
not be a problem during exercise for individuals consuming carbs pre-workout.
However, following training, if blood glucose is still elevated, there may be an increase in
insulin (1). This has the potential to cause a hyperinsulinemic response in predisposed
individuals. Sadly there is no direct research to say that this will happen and the only data points
available are anecdotal. Most people appear to tolerate pre-workout carbohydrates quite well,
and very few have reported problems with an insulin or blood glucose rebound with post-workout
carbohydrates. Once again, for lack of any strict guidelines, experimentation is encouraged.
Effects on ketosis
Research suggests that carbohydrates consumed before or after exercise should not
negatively affect ketosis (5). However, some individuals find that they drop out of ketosis
transiently due to the ingestion of pre-workout carbohydrates. After workout, there will be a
short period where insulin is elevated and free fatty acid availability for ketone production is
decreased (5). However, as blood glucose is pushed into the muscles, insulin should drop again
allowing ketogenesis to resume within several hours. Performing some low intensity cardio to
lower insulin and increase blood levels of free fatty acids should help to more quickly reestablish
ketosis (see chapter 21 for more detail).
Post-workout carbohydrates might be expected to have a greater effect on ketosis, in that
insulin levels will most likely be higher than are seen with pre-workout carbohydrates (5,6). For
this reason, individuals may want to experiment with pre-workout carbohydrates first, only
adding post-workout carbohydrates if necessary.
125
Training and the TKD
While an intake of 25-50 grams of carbohydrates prior to training is a good rough guideline,
some individuals have asked how to calculate the exact amounts of carbohydrate which they
should consume around exercise.
For weight training, the amount of carbs needed will depend solely on the amount of
training being done. Recall from the previous sections that a set of weight training lasting 45
seconds will use approximately 15.7 mmol/kg of glycogen. Individuals on an SKD typically
maintain glycogen levels around 70 mmol/kg and performance will be extremely compromised if
glycogen is lowered to 40 mmol/kg, allowing roughly 2 sets per bodypart to be performed.
Assuming ~30 mmol/kg used per bodypart in 2 sets, we can estimate how much
carbohydrate is needed to replace that amount of glycogen. To convert mmol of glycogen to
grams of carbohydrate, we simply divide mmol by 5.56.
30 mmol/kg divided by 5.56 = ~5 grams of carbohydrates to replace 30 mmol of glycogen.
So for every 2 sets performed during weight training, 5 grams of carbs should be consumed
to replenish the glycogen used. If a large amount of training is being performed, necessitating a
large amount of carbohydrate (greater than 100 grams) it may be beneficial to split the total
amount of carbohydrate up, consuming half 30’ prior to the workout and the other half when the
workout begins. This should avoid problems with stomach upset during training. Some
individuals have also experimented with consuming carbohydrates during training. All
approaches seem to work effectively and experimentation is encouraged.
Post-workout nutrition
For individuals wishing to consume carbs post-training to help with recovery, an additional
25-50 grams of glucose or glucose polymers are recommended. In this situation, the type of
carbohydrate ingested does matter and fructose and sucrose should ideally be avoided, since they
may refill liver glycogen and risk interrupting ketone body formation. This limits post-workout
carbohydrates to glucose or glucose-polymers, which are not used to refill liver glycogen (7).
With pre-workout carbs, there will be an increase in insulin after training ends. Even if
individuals do not want to take in carbs after training, ingesting protein can help with recovery as
the insulin from pre-workout carbs should push amino acids into the muscle cells. Consuming 2550 grams of a high quality protein immediately after training may help with recovery.
Fat should generally be avoided in a post-workout meal. First and foremost, dietary fat will
slow digestion of protein and/or carbohydrate. Second, the consumption of dietary fat when
insulin levels are high may cause fat storage after training (1).
Summary of the guidelines for the TKD
1. Individuals following the SKD who want to perform high intensity activity will absolutely have
to consume carbs at some point around exercise. The basic guidelines for setting up a SKD (from
126
chapter 9) should still be used to develop a TKD. The only difference is that calories must be
adjusted to account for the carbohydrates being consumed around training.
2. The safest time to consume carbs, in terms of maintaining ketosis, is before a workout and
ketosis should be reestablished soon after training. Depending on total training volume, 25-50
grams of carbohydrates taken 30-60’ prior to training seems to be a good amount. The type of
carbohydrate is less critical for pre-workout carbs but quickly digested, high GI carbs seem to
work best to avoid stomach upset.
3. If more than 50 grams of carbohydrates must be consumed around training, it may be
beneficial to split the total amount, consuming half 30’ before training and the other half at the
beginning (or during) of the workout.
4. If post-workout carbohydrates are consumed, an additional 25-50 grams of glucose or glucose
polymers are recommended. Fructose and sucrose should be avoided as they can refill liver
glycogen and interrupt ketosis. Additionally protein can be added to the post-workout meal to
help with recovery. Dietary fat should be avoided since it will slow digestion and could lead to fat
storage when insulin levels are high.
5. If post-workout carbohydrates are not consumed, taking in protein only can still enhance
recovery as blood glucose and insulin should be slightly elevated from the consumption of preworkout carbohydrates.
References Cited
1. Conley M and Stone M. Carbohydrate ingestion/supplementation for resistance exercise and
training. Sports Med (1996) 21: 7-17.
2. Jacobs I. Lactate Muscle Glycogen and Exercise Performance in Man. Acta Physiol Scand
Supplementum (1981) 495: 3-27.
3. Kelley DE. The regulation of glucose uptake and oxidation during exercise. Int J Obesity (1995)
19 (Suppl. 3): S14-S17.
4. Ivy JL. Effects of elevated and exercise-reduced muscle glycogen levels on insulin sensitivity.
J Appl Physiol (1985) 59: 154-159.
5. Koeslag JH et al. Post-exercise ketosis in post-prandial exercise: effect of glucose and alanine
ingestion in humans. J Physiol (Lond). (1985) 358: 395-403.
6. Carlin JI et al. The effects of post-exercise glucose and alanine ingestion on plasma carnitine
and ketosis in humans. J Physiol (Lond). (1987) 390: 295-303.
7. McGarry JD et. al. From dietary glucose to liver glycogen: the full circle around. Ann Rev Nutr
(1987) 7:51-73.
127
Chapter 12:
The Cyclical Ketogenic Diet (CKD)
As with the TKD, the CKD attempts to harness the effects of a ketogenic diet while
maintaining exercise performance. However, rather than providing carbohydrates only around
exercise, the CKD inserts a one- or two-day period of high carbohydrate eating to refill muscle
glycogen. This means that for the CKD to work, muscle glycogen must be depleted fully each
week. A few calculations which appear below show that full depletion of muscle glycogen requires
a fairly large amount of training. This means that the CKD is not appropriate for beginning
exercisers or those who are unable to perform the amount of training necessary.
Although some authors have suggested the use of CKD for mass gains, it is not optimal in
that regard for a variety of reasons which are discussed in chapter 29. This chapter focuses
primarily on optimizing the CKD for fat loss.
The standard format for a CKD is to alternate 5-6 days of ketogenic dieting with 1-2 days
of high carbohydrate eating, although other variations can be developed. Individuals have
experimented with longer cycles (10-12 days) as well as shorter cycles (3-4) days with good
results. A 7 day cycle is more a choice of convenience than anything physiological, since it fits
most people’s work schedule and allows dieters to eat more or less ‘normally’ on the weekends.
The low-carb week of the CKD is identical to the SKD and all of the information discussed
in chapter 9 applies. During the carb-loading phase of the CKD, the body’s metabolism is
temporarily switched out of ketosis, with the goal of refilling muscle glycogen levels to sustain
exercise performance in the next cycle. One question, that unfortunately has no answer, is how
the insertion of a carb-loading phase will affect the adaptations to ketosis, discussed in previous
chapters.
This chapter focuses on the theory behind optimizing both the lowcarb week (in terms of
weight training) as well as the carb-up. Additionally, it has been suggested that the weekend
carb-load may be anabolic for a variety of reasons but this is poorly studied. Possible anabolic
effects of the carb-load are discussed. Finally, specific guidelines for implementing the CKD
appear at the end of this chapter.
Section 1: Muscle glycogen, training, and the CKD
Unlike the TKD, where the goal is to maintain muscle glycogen at an intermediate level,
the goal of the CKD is to deplete muscle glycogen completely between carb-ups.
There are numerous workouts which can accomplish this goal. However, this section will
show calculations based on a Monday, Tuesday, Friday format, for reasons discussed below. The
particular nature of the CKD requires a slightly different workout schedule for optimal results.
For the CKD, the goal of the early week workouts (generally performed on Monday and
Tuesday) is to reduce muscle glycogen from initial levels to approximately 70 mmol/kg, but no
128
Tuesday) is to reduce muscle glycogen from initial levels to approximately 70 mmol/kg, but no
lower. This should maximize fat utilization at rest and during aerobic exercise while avoiding
problems with increased protein use during exercise. The total amount of training required to
accomplish this will depend on the overall length of the carb-up and is discussed below.
Immediately prior to the carb-up, glycogen levels should be further lowered to between 25
and 40 mmol/kg. This will allow maximal glycogen compensation to occur during the carb-load.
Calculations for the final workout are made in this chapter as well. Both the calculations made
for the Monday and Tuesday workouts as well as the Friday workouts are used to develop the
advanced CKD workout, which appears in chapter 28. The general format of the advanced CKD
workout is:
Monday/Tuesday: split routine, such that the entire body is trained between these two days. For
example, the lower body and abdominals might be trained on Monday, and the entire upper body
trained on Tuesday
Friday: full body workout, either a high rep depletion workout or a low rep tension workout
Sample calculations for Monday and Tuesday workouts
To see how much weight training is necessary to achieve the above goals, let us look at a
lifter who has just completed a carb-loading phase of 36 hours, achieving 150 mmol/kg of glycogen
in all major muscle groups. In the first 2 workouts, this individual needs to lower glycogen to
approximately 70 mmol/kg to maximize fat burning.
Therefore, this person needs to deplete:
150 mmol/kg - 70 mmol/kg = 80 mmol/kg of total glycogen.
Using the rate of glycogen depletion listed in chapter 10, we see that
80 mmol/kg divided by 1.3 mmol/kg/rep = 61 total reps.
or
80 mmol/kg divided by 0.35 mmol/kg/sec = 228 seconds of total set time.
Assuming an average set time of 45 seconds (10-12 reps at 4 seconds per repetition) this
level of glycogen depletion would require approximately 5-6 sets per bodypart. This total amount
of work can be divided up a number of ways. Simply performing 6 sets of 10 repetitions would be
sufficient and a lifter might perform:
Squats: 4 sets of 10 reps (4 seconds per rep = 40 seconds per set)
Leg extension: 2 sets of 10 reps (4 seconds per rep = 40 seconds per set)
There are numerous other workout schemes to achieve the general goal of reducing
glycogen levels and individuals are encouraged to experiment with their training. Regardless of
what specific type of training is done, the important fact to remember is that the proper amount
of total set time must be performed. Please note that the value of 15 mmol/kg/set was
established at an intensity of 70% of 1 repetition maximum (the amount of weight which can be
129
lifted only one time). There is unfortunately no way to know what the rate of glycogen depletion is
at 50% or 90% of 1 rep maximum.
Someone starting at a lower or higher glycogen level would need less or more sets
respectively. Table 1 shows the approximate amount of sets which would be necessary based on
the approximate glycogen levels which would be reached for a given length of carbohydrate
loading.
Table 1: Relationship between length of carb-up and sets needed for depletion
Carb-load
(# hours)
12
24
36
48
Muscle glycogen
(mmol/kg)
~80
120
150
175-190
Glycogen depletion to
reach 70 mmol/kg
10
50
80
~120
Set time
(sec.)
40
142
228
342
# of sets per
bodypart *
1
3
5
8
* Assuming 45 seconds per set
If an individual did not want to perform as many heavy sets in training, the number of
desired heavy sets could be performed and then several high rep sets performed at a lighter
weight simply to deplete glycogen.
For example, an individual could perform:
Squats: 2 sets of 10 reps (4 seconds per rep)
Leg extensions: 2 sets of 10 reps (4 seconds per rep)
This would fulfill 160 seconds of the required work leaving 60 seconds.
The remaining 60 seconds of work could be fulfilled with three light sets of leg presses, each
20 seconds in length.
Alternately, the carb load could be shortened to compensate for a reduced training volume.
That is, if a lifter only wished to perform three sets per bodypart during their Monday and
Tuesday workouts, the carb-load would need to be shortened to 24 hours to adjust.
Sample calculations for the Friday workout
Having first depleted their muscles to 70 mmol/kg on Monday and Tuesday, our lifter now
wants to deplete muscle glycogen to between 25-40 mmol/kg before starting the carb-up. This
would require a further glycogen depletion of
70 mmol/kg - 25 mmol/kg = 45 mmol/kg
70 mmol/kg - 40 mmol/kg = 30 mmol/kg
30-45 mmol/kg.
This would require:
130
30-45 mmol/kg divided by 1.3 mmol/kg/rep = 20-30 reps
30-45 mmol/kg divided by 0.35 mmol/kg/second = 85-128 seconds.
Although discussed in greater detail in the exercise chapters, there are two options for the
Friday workout which will determine how many sets are necessary to achieve full depletion. One
option is to use heavy weights and low reps (8-10) in which case approximately two to three sets
per bodypart are necessary. A second option is to use light weight and high reps (15-20) to
deplete glycogen while minimizing muscle damage, in which case 5-6 sets may be necessary.
Keep in mind that there will is a great deal of overlap between bodyparts during both the
Monday/Tuesday and Friday workouts. The glycogen depletion studies used to make these
calculations used leg extensions, only working the quadriceps. Individuals depleting glycogen in
the pectoral (chest) muscles with bench presses will also be working the deltoids and triceps to
some degree. Unfortunately, it is impossible to know how much glycogen is depleted from the
triceps from 4 sets of bench presses. The sample exercise routines will use a lower volume of
exercise for bodyparts worked by previous movements in an attempt to compensate for overlap.
That is to say, if chest has been worked for four sets (also working the shoulders and triceps), the
shoulders and triceps will receive less total sets.
Summary
The amount of training needed to deplete muscle glycogen fully depends solely on the levels
of glycogen reached on the weekend. Assuming an average carb-loading phase of 36 hours,
approximately 4-6 sets will need to be performed during the Monday and Tuesday workouts. This
will be adjusted upwards or downwards for different lengths of carb-ups. The number of sets done
on the Friday workout will depend on what type of workout is done. If heavy weights/low reps are
done, only 2-3 sets should be necessary. If light weights/high reps are used, 5-6 sets should be
done. Please note that these values for number of sets are estimations only, and rough
estimations at that. Individuals are encouraged to experiment with training structure and
volume to determine what works best.
Section 2: The carb-load
The unique aspect of the CKD is the carb-loading phase which has its own set of
implications and guidelines. Quite simply, the key to refilling muscle glycogen stores following
depletion is the consumption of large amounts of carbohydrates (1). In fact many individuals find
that the carb-load phase works just fine without much attention to the details of percentages and
amounts. Simply eating a lot of carbohydrates for 24 to 36 hours works quite well for many
people.
However many individuals want the details of how to optimize the amount of glycogen
stored without gaining any fat. The amount of glycogen resynthesized depends on a number of
factors including the degree of depletion, the amount and type of carbohydrates and the timing of
carbohydrate consumption.
131
If sufficient amounts of carbohydrates are consumed for a long enough period of time,
glycogen levels can reach greater than normal levels, a process called glycogen
supercompensation. The process of glycogen depletion and supercompensation has been used for
years by endurance athletes to improve performance (2). Only recently has it been applied to
bodybuilders and other strength athletes. The carb-load can be classified by three distinct
variables: duration and amount, type, and timing of carbohydrate intake. Each is discussed in
detail below. Other factors which can affect the carb-load are also discussed in this chapter.
Duration and amount of the carb-load
The rate limiting step in glycogen resynthesis appears to be activity of the enzymes
involved in glycogen synthesis (1). Regardless of carbohydrate intake, there is a maximal
amount of glycogen which can be synthesized in a given amount of time, meaning that
consuming all the necessary carbohydrates in a 4 hour time span, with the goal of returning to
ketogenic eating that much sooner, will not work. Only when the proper amount of
carbohydrates is consumed over a sufficient period of time, can glycogen compensation and/or
supercompensation occur.
Following exhaustive exercise and full glycogen depletion, glycogen can be resynthesized to
100% of normal levels (roughly 100-110 mmol/kg) within 24 hours as long as sufficient amounts
of carbohydrate are consumed (1,3). Assuming full depletion of the involved muscles, the amount
of carbohydrate needed during this time period is 8-10 grams of carbohydrate per kilogram of lean
body mass (LBM).
With 36 hours of carb-loading, roughly 150% compensation can occur, reaching levels of
150-160 mmol/kg of muscle glycogen. To achieve greater levels of muscle glycogen (175 mmol/kg
or more) generally requires 3-4 days of high carbohydrate eating following exhaustive exercise (2).
The first 6 hours after training appear to be the most critical as enzyme activity and
resynthesis rates are the highest, around 12 mmol/kg/hour (4). Following weight training, with a
carbohydrate intake of 1.5 grams carbohydrate/kg LBM taken immediately after training and
again 2 hours later, a total of 44 mmol/kg can be resynthesized (17).
Over the the first 24 hours, the average rate of glycogen resynthesis ranges from 5-12
mmol/kg/hour depending on the type of exercise performed (5). In general, aerobic exercise shows
the lowest rate of glycogen resynthesis (2-8 mmol/kg/hour), weight training the second highest
(1.3-11 mmol/kg/hour), and interval training the highest (15 to 33.6 mmol/kg/hour) (5,6). The
reason that glycogen resynthesis is lower after weight training than after interval training may
be related to the amount of lactic acid generated as well as the muscle damage that typically
occurs during weight training (6).
At an average rate of 5 mmol/kg /hour, approximately 120 mmol/kg of glycogen can be
synthesized over 24 hours. This can be achieved by the consumption of 50 grams or more of
carbohydrate every 2 hours during the first 24 hours after training. Intake of greater than 50
grams of carbohydrate does not appear to increase the rate of glycogen synthesis.
Over 24 hours, at 50 grams every 2 hours, this yields 600 grams of carbohydrates total to
maximize glycogen resynthesis. These values are for a 154 pound (70 kilogram) person.
132
Significantly heavier or lighter individuals will need proportionally more or less carbohydrate.
Simply use the value of 8-10 grams of carbohydrate per kilogram of LBM as a guide.
In the second 24 hours, glycogen resynthesis rates decrease (1) and a carbohydrate intake
of 5 grams/kg is recommended to further refill muscle glycogen stores while minimizing the
chance of fat gain. For many individuals, the small amount of additional glycogen resynthesis
which occurs during the second 24 hours of carbohydrate loading is not worth the risk of regaining
some of the bodyfat which was lost during the preceding week.
Type of carbohydrates
The type of carbohydrate consumed during a carb-up can affect the rate at which glycogen
is resynthesized. During the first 24 hours, when enzyme activity is at its highest, it appears that
the consumption of high glycemic index (GI) foods promotes higher levels of glycogen resynthesis
than lower GI carbs (5,7,8).
Glycogen resynthesis during the second 24 hours has not been studied as extensively. It
appears that the consumption of lower GI carbs (starches, vegetables) promotes higher overall
levels of glycogen resynthesis while avoiding fat gain by keeping insulin levels more stable (9).
Most individuals find that their regain of bodyfat, as well as retention of water under the skin, is
considerably less if they switch to lower GI carbohydrates during the second 24 hours of
carbohydrate loading.
Fructose (fruit sugar, which preferentially refills liver glycogen) will not cause the same
amount of glycogen resynthesis seen with glucose or sucrose (5,8). Whether liquids or solid
carbohydrates are consumed also appears to have less impact on glycogen resynthesis as long as
adequate amounts are consumed (10).
Anecdotally, many individuals have had success consuming liquid carbohydrates such as
commercially available glucose polymers during their first few meals and then moving towards
slightly more complex carbohydrates such as starches.
Timing of carbohydrates
While it would seem logical that consuming dietary carbohydrates in small amounts over
the length of the carb-up would be ideal, at least one study suggests that glycogen resynthesis
over 24 hours is related to the quantity of carbs consumed rather than how they are spaced out.
In this study, subjects were glycogen depleted and then fed 525 grams of carbohydrate in either
two or seven meals. Total glycogen resynthesis was the same in both groups (11). A similar
study compared glycogen resynthesis with four large meals versus twelve smaller meals (12).
Glycogen levels were the same in both groups.
Both of these studies suggest that the quantity of carbohydrates is more important than
the timing of those carbohydrates. From a purely practical standpoint, smaller meals will
generally make it easier to consume the necessary carbohydrate quantities and will keep blood
sugar more stable.
Depending on when the carb-up is begun, some dieters may have to go long periods of time
133
(i.e. during sleep) without eating, which may affect glycogen compensation. In this situation, a
large amount of carbohydrates can be consumed at once, in order to maintain blood glucose and
glycogen synthesis rates (5). For example, if an individual were going to sleep for 8 hours, they
could consume 200 grams of carbohydrates (50 grams/2 hours for 8 hours) immediately before.
Consuming these carbs with some protein, fat and fiber will slow digestion and give a more even
blood glucose release, helping to promote glycogen resynthesis. Those wishing truly maximal
glycogen resynthesis may wish to experiment with eating small carb meals throughout the night.
The carb-up should begin immediately following training. A delay of even 2 hours between
the end of training and the start of the carb-up causes glycogen resynthesis to be 47% slower
than if carbs are consumed immediately (13,14). Ideally trainees should consume a large amount
of liquid carbs immediately after training. A good rule of thumb is to consume 1.5 grams of
carbs/kg lean body mass, with approximately one half as much protein, immediately after
training and then again two hours later.
Additionally, the consumption of carbohydrates prior to, or during, the workout prior to the
carb-up will lead to higher rates of glycogen resynthesis, most likely as a result of higher insulin
levels when the carb-up begins (1,13). Finally, the consumption of protein and carbohydrates
immediately after training can raise insulin more than just carbohydrates by themselves, helping
with glycogen synthesis (15).
Training and the carb-up
Another issue regarding the carb-up is the type of exercise that precedes the carb-up.
Typical carb-ups have been studied in endurance athletes, but not weight trainers so
extrapolations must be made with care. It has been long known that only the muscles worked
immediately prior to the carb-up are supercompensated. Recall from above that a delay of even
several hours slows glycogen resynthesis greatly.
Muscle groups which have been trained several days prior to the start of a carb-load will
not be optimally supercompensated. This suggests that, for optimal results, the whole body
should be worked during the workout prior to the carb-up (this is discussed in more detail in
chapter 28). It should be noted that many individuals have achieved fine results not working the
entire body prior to the carb-up, using a more traditional split routine workout.
Additionally, the type of training preceding the carb-up affects the rate and amount of
glycogen resynthesized following training. Muscles that have been damaged with eccentric
training show lower rates of glycogen resynthesis following training (16,17). However, this
decrease in resynthesis does not show up immediately. In muscles which have undergone
eccentric trauma, glycogen levels are typically 25% lower following a carb-up but this difference
does not become apparent until three days after training (or when soreness sets in) (16,17). For
individuals performing a 1 or 2 day carb-up, the type of training prior to the carb-up is probably
not that critical. For bodybuilders performing a 3 day carb-up prior to a contest, eccentric
muscle trauma should be avoided as much as possible.
134
Other macro-nutrients
Another issue regarding the carb-load is the amounts and types of other macronutrients
(protein and fat) which should be consumed. The ingestion of protein and fat with carbohydrates
do not affect the levels of glycogen storage during the carb-up as long as carbohydrate intake is
sufficient (18). Some dieters find that too much dietary fat blunts their hunger and prevents
them from consuming enough carbohydrates to refill glycogen stores.
Recall that carbohydrate level is 10 gram/kg LBM during the first 24 hours. This will
make up 70% of the total calories consumed during the carb load. Protein and fat will make up
15% each.
Many bodybuilders may feel that this percentage of protein is too low but this is not the
case. First and foremost, a high calorie intake reduces protein requirements and increases
nitrogen retention (19). As a result, less dietary protein is needed when calorie/carbohydrate
intake is high. Protein should be consumed with carbohydrates as this has been shown to
increase glycogen resynthesis, especially after training (20)
Further the most protein lifters need is 1 gram per pound of bodyweight under extremely
intensive training conditions (21). Even at 15% protein calories, most individuals will be
consuming sufficient protein during the carb-up. Specific calculations for the carb-load phase
appear in section 5.
Fat gain during the carb-up
During the first 24 hours of the carb-load, caloric intake will be approximately twice
maintenance levels. This raises concerns regarding the potential for fat gain during this time
period. We will see that fat gain during the carb-up should be minimal as long as a few guidelines
are followed.
In a study which looked surprisingly like a CKD, subjects consumed a low-carb, high fat
(but non-ketogenic) diet for 5 days and depleted muscle glycogen with exercise (22). Subjects
were then given a total 500 grams of carbohydrate in three divided meals. During the first 24
hours, despite the high calorie (and carb) intake, there was a negative fat balance of 88 grams.
This suggests that when muscle glycogen is depleted, incoming carbohydrates are used
preferentially to refill glycogen stores, and fat continues to be used for energy production.
Additionally, the excess carbohydrates which were not stored as glycogen were used for
energy (22). In general, the synthesis of fat from glycogen (referred to as de novo lipogenesis) in
the short term is fairly small (23,24). During carbohydrate overfeeding, there is a decrease in fat
use for energy. Most fat gain occurring during high carbohydrate overfeeding is from storage of
excessive fat intake (25). Therefore, as long as fat intake is kept relatively low (below 88 grams)
during the carb-up phase of the CKD, there should be minimal fat regain.
In a similar study, individuals consumed a low-carb, high fat diet for 5 days and then
consumed very large amounts of carbohydrates (700 to 900 grams per day) over a five day
period. During the first 24 hours, with a carbohydrate intake of 700 grams and a fat intake of 60
grams per day, there was a fat gain of only 7 grams. Collectively, these two studies suggest that
the body continues to use bodyfat for fuel during the first 24 hours of carb-loading.
135
In the second 24 hours, with an intake of 800 grams of carbohydrate and a fat intake of 97
grams, there was a fat gain of 127 grams (26) indicating that the body had shifted out of ‘fat
burning’ mode as muscle glycogen stores became full. This is unlike the suggestions being made
for the CKD, where the carbohydrate intake during the second 24 hours should be lower than in
the first 24 hours. A large fat gain, as seen in this study would not be expected to occur on a CKD.
As long as fat intake is kept low and carbohydrate intake is reduced to approximately 5
gram/kg lean body mass during the second 24 hours, fat regain should be minimal. Once again,
individuals are encouraged to keep track of changes in body composition with different amounts
and durations of carb-loading to determine what works for them. Those who desire to maximize
fat loss may prefer only a 24 hour carb-up. This allows more potential days in ketosis for fat loss
to occur as well as making it more difficult to regain significant amounts of body fat.
How long does glycogen compensation last?
Pre-contest bodybuilders (and other athletes) want to know how long they will maintain
above normal glycogen levels following a carb-up so that they can time the carb-up around a
specific event. With normal glycogen levels and no exercise, glycogen levels are maintained at
least 3 days. (27,28) It appears that above-normal glycogen stores can be maintained at least 3
days as well. (29)
Section 3: The carb-load and adaptation to ketosis
In addition to the topics discussed in section 2, there are a number of other issues
regarding the carb-load phase of the CKD. A question that currently has no answer is how the
carb-load phase will affect the adaptations to ketosis. Additionally, the question of long-term
effects of the CKD is discussed.
Effects of the carb-load on the adaptation to ketosis
As discussed in the previous chapters, there are a number of potentially beneficial
adaptations which occur during ketosis in terms of decreased protein use and increased fat use.
A question which arises is how the insertion of a 1-2 day carbohydrate loading phase will affect
these adaptations.
To this author’s knowledge, no research has examined the effects on ketosis to repeated
carbohydrate loading. Recall that most of the adaptations to ketosis, especially maximum
protein sparing, require at least three weeks to occur. A question without an answer is whether
these adaptations will take longer, or whether they will occur at all, with repeated carbohydrate
loading. Anecdotal experience suggests that they do in fact occur, but research is needed in this
area.
Since no physiological measures of the adaptations to ketosis have been measured (except
in the short term), it is impossible to make any conclusions regarding the long term adaptations
136
to a CKD. Based on anecdotal reports, it seems that the adaptations do occur, but that they
simply take longer.
For example, most people starting any type of ketogenic diet go through a period of low
energy, where they are mentally ‘fuzzy’. Those who stay on a SKD generally move past this
stage by the second or third week of dieting. In contrast, those on a CKD seem to take slightly
longer to overcome this feeling. For example, this author experienced a great deal of fatigue in the
first week of being on a CKD, a smaller (but still above baseline) amount of fatigue during the
second week, and essentially no fatigue by the third week.
This anecdotal data suggests that the adaptation of the brain to ketosis may take slightly
longer due to the insertion of a carb-load phase. This also suggests that individuals may want to
do two weeks of an SKD prior to their first carb-up, to allow the adaptations to occur more
quickly. Of course, if this compromises training intensity, it is not a viable option.
Long term effects of a CKD
Although the myriad effects of ketogenic diets are discussed in detail in chapter 7, another
concern is what long term metabolic effects a CKD will have. There is unfortunately no answer.
It seems logical that any long-term adaptations to ketosis will be reversed when a non-ketogenic
diet is followed for a sufficient period of time but this is mere speculation.
Anecdotally, it appears that some of the adaptations to ketogenic diets continue even after
a non-ketogenic diet has been followed. The easiest one to examine is the aforementioned fatigue
and ‘mental fuzziness’ during the first week. In general, individuals (including this author)
returning to a CKD after a period of more ‘balanced’ dieting do not experience the same level of
fatigue as when they first started the diet. This seems to suggest that some of the changes in the
brain (especially with regards to ketone usage) may be longer lasting. Once again, the lack of long
term data prevents any conclusions from being drawn.
However, and this is repeated throughout the book, the lack of long term data on the CKD
(or any other ketogenic diet) is arguably the most compelling reason not to remain on it in the
long term. Simply put, the lack of data means that no long term safety can or should be implied.
The CKD, like any fat loss diet, should be used until the fat loss goal (whatever that may be) is
achieved and then discontinued in favor of a more ‘balanced’ diet. Strategies for ending a CKD
appear in chapter 14.
Section 4: Is the carb-load anabolic?
Several popular authors suggest that the carb-loading phase of a CKD is anabolic,
stimulating muscle growth (30,31). However there is little direct research on this topic and only
speculation can be offered. To understand the potential impact of the carb-load on muscle
growth, it is necessary to discuss anabolic and catabolic processes, as well as some of the
mechanisms regulating protein synthesis.
137
Anabolic and catabolic processes
The terms anabolic and catabolic tend to be misused and overgeneralized in popular media
leading to misunderstandings. In a biological sense, ‘anabolic’ means the building of larger
substances from smaller substances. Glucose is synthesized into glycogen, amino acids are built
into larger proteins, and FFA are combined with glycerol and stored as triglycerides (TG).
Anabolic processes occur as a result of overfeeding which raises anabolic hormones, such as
insulin and testosterone, and lowers catabolic hormones such as cortisol and glucagon.
The term ‘catabolic’ refers to the breakdown of larger substances into smaller substances.
Glycogen is broken down into glucose, large proteins are broken down into individual amino acids,
and TG are broken down to FFAs and glycerol. Catabolic processes occur as a result of
underfeeding, which lowers anabolic hormones and raises catabolic hormones. An overview of
anabolic and catabolic processes appear in figure 1.
Figure 1: Overview of anabolic and catabolic processes
Anabolic
Proteins
Glycogen
TG
Muscle gain
Fat gain
(food intake,hormones,etc)
Catabolic
Amino acids
Glucose
FFA + Glycerol
Muscle loss
Fat loss
An often heard statement is that the ketogenic diet is catabolic. This is true in that all
reduced calorie diets are catabolic. In general, without specific drugs, the body must be in either a
systemically (whole body) anabolic state or a systematically catabolic state. It is quite rare to
see anabolic processes occurring in one part of the body (i.e. muscle gain) while catabolic
processes are occurring in another (i.e. fat loss).
In this respect, the CKD is somewhat unique in that it encompasses a phase which is
catabolic (low carbs, below maintenance calories) and a phase which is anabolic (high carbs,
above maintenance calories).
Anabolism and muscle growth
The catabolic effect of the ketogenic diet has been discussed in detail in chapter 5 and are
not repeated here. Although anabolism is discussed in greater detail in chapter 20, a few general
comments about anabolism and muscle growth are necessary. The exact mechanisms behind
muscle growth are not well understood at this time. In general, it can be said that net muscle
growth requires that protein synthesis be greater than protein breakdown. This assumes that a
stimulus to synthesize new proteins (such as weight training) has been applied to the body.
Therefore, the carb-up could potentially affect muscle growth in two ways. The first would
be by decreasing protein breakdown. The second by increasing protein synthesis. There are
numerous factors affecting both protein synthesis and breakdown. These include the hormones
insulin, testosterone, thyroid, glucagon, growth hormone and cortisol (32). Insulin plays an
138
especially important role as high levels of insulin appear to decrease protein synthesis (33,34).
The availability of sufficient amino acids is paramount for growth, and high levels of amino acids
increase protein synthesis (33,34).
A recap of the lowcarb week
Recall from previous chapters that the ketogenic part of the CKD lowers insulin and
thyroid levels, while raising glucagon. The data on GH is less clear, with some studies showing an
increase, others a decrease. The effects of the ketogenic diet on testosterone and cortisol are less
established. Thus, the overall effect of the ketogenic phase is a catabolic one, although ketosis
appears to be selectively catabolic (i.e. the protein sparing effect of ketosis).
Also recall from chapter 5 that the status of the liver is one of the key regulatory
processes in determining the anabolic or catabolic state of the body. Therefore, the first step in
maximizing any anabolic processes is to reverse liver metabolism from catabolic to anabolic.
Reversing the liver’s metabolic state
To optimize any anabolic processes following the training session immediately prior to the
carb-up, it is necessary to start before the workout itself. Changing the metabolism of the liver
from catabolic to anabolic requires two things: that the enzyme levels for glucose utilization are
returned to normal and that liver glycogen is refilled.
During long-term carbohydrate restriction, the liver enzymes responsible for metabolizing
carbohydrate decrease as discussed in chapter 7. During refeeding, it takes approximately 5
hours for liver enzymes to return to normal levels (35). Therefore, the start of the carb-up should
begin 5 hours prior to the final workout. It is unclear whether glucose, fructose, or some
combination of foods is ideal at the time. A good place to begin experimenting might be with 25 to
50 grams of total carbohydrate and 25 grams of protein. Dieter’s may wish to add a small
amount of unsaturated fats to this meal, to avoid an insulin spike.
Refilling of liver glycogen will shut down ketone body formation and shift the liver back
towards anabolism. For reasons discussed in Chapter 10 (the TKD), dietary glucose is not used
efficiently to resynthesize liver glycogen (36). Although no data on humans exists, due to
difficulty in performing the studies, the effect of various nutrients on liver glycogen metabolism
has been studied in rat livers which were removed from the animal (37).
This study found that glucose by itself refilled liver glycogen poorly, as expected. However,
the combination of glucose and fructose was much more effective. The highest level of liver
glycogen was found when glucose, fructose and glutamine (discussed in detail in chapter 33) were
provided. It took approximately 2 hours to reverse liver metabolism (37). Therefore, 2 hours
prior to the final carb-up, a combination of glucose and fructose (such as fruit) should be
consumed. Individuals may wish to add glutamine as well to see if it has an added effect. It
should be noted that some individuals find it more difficult to reestablish ketosis during the next
weekly cycle if they use glutamine during the carb-load.
139
Insulin and amino acids
As mentioned above, both insulin and amino acids have profound effects on protein
synthesis and breakdown. Insulin appears to primarily act by decreasing protein breakdown
while excess amino acids directly stimulate protein synthesis (33,34). Therefore, it might be
expected that increasing both insulin and amino acid levels would increase net muscle gain.
When carbohydrates are refed after even a few days of a ketogenic diet, the insulin
response is higher than it would be under normal dietary conditions (38). This is probably due to
the slight insulin resistance which occurs during a ketogenic diet, discussed in chapter 7.
Hyperinsulinemia also increases the transport of some amino acids into muscle (39). These
metabolic effects might contribute to muscle growth during the carb-up.
To maximize insulin levels during the carb-up, high glycemic index (GI) carbohydrates are
preferred. Additionally, one study examining carb-loading after depletion found that insulin levels
were higher with 4 large meals, versus smaller smaller hourly meals although the total amount of
carbohydrates given was the same, as was the glycogen compensation (12).
Cellular hydration
A final way that the carb-load could affect anabolism is by drawing water into the muscle
cells. It has been hypothesized that cellular hydration may affect numerous processes including
protein breakdown and synthesis (40). For example, the extreme protein losses which
accompanies illness and injury is commonly accompanied by cellular dehydration, and increasing
hydration helps to prevent protein losses (40).
As glycogen depletion causes a loss of water within the muscle, the increased hydration
seen with glycogen compensation might affect protein synthesis similarly. However, while it
seems that taking a cell from pathologically dehydrated to normal hydration improves protein
synthesis, it has not been shown that increasing cellular hydration above normal levels will
improve protein synthesis above normal. So this mechanism can be considered speculative at
best, and irrelevant at worst.
A final question
Irrespective of the mechanisms by which the carb-load might cause muscle growth, a
question which must be asked is just how much additional true contractile tissue (i.e. the part of
muscle which is not glycogen, water and electrolytes) can be synthesized during a 24-36 hour
period of carbohydrate overfeeding. In all likelihood, the answer is very little.
Section 5: Setting up a CKD
Having discussed the physiological basis of the carb-load in the previous sections, we can
now examine the specifics of developing a CKD. The low-carbohydrate phase of the CKD is
140
identical to that of the SKD so please refer to chapter 9 for guidelines for protein, carbohydrate
and fat intake on an SKD.
The lowcarb week
Although the specifics of the SKD been discussed in great detail in previous chapters, they
are summarized here.
Caloric intake:
Mass gains: 18 calories per pound or more
Maintenance calories/starting the diet: 15-16 calories per pound
Fat loss: starting at 12 calories per pound
Carbohydrate intake
30 grams or less per day. The fewer carbohydrates which are consumed, the faster ketosis can
be established. The amount of carbohydrates consumed is more critical on a CKD than on either
the SKD or TKD as there are only 5-6 days to establish ketosis.
Protein intake
During the first 3 weeks of the CKD, protein intake should be set at either 0.9 grams of protein
per pound of bodyweight or 150 grams per day, whichever is greater.
After three weeks of dieting, protein should be set at 0.9 grams of protein/pound of bodyweight.
Fat intake
Fat intake will make up the remainder of the calories in the diet
Getting out of ketosis: beginning the carb-load
To shift the body out of ketosis and toward a more anabolic state, dieters will need to begin
consuming carbohydrates approximately 5 hours prior to the final workout. At this time, a small
amount of carbohydrates, perhaps 25 to 50 grams, can be consumed along with some protein and
unsaturated fats, to begin the upregulation of liver enzymes. The type of carbohydrate needed
has not been studied and individuals are encouraged to experiment with different types and
amounts of foods.
Approximately 2 hours before the final workout, a combination of glucose and fructose
(with optional glutamine) should be consumed, to refill liver glycogen. Once again, specific
amounts have not been determined but 25 to 50 grams total carbohydrate would seem a good
place to start.
141
The carb-load: Two methods
There are essentially two methods for carb-loading on the CKD. The first is to ignore
specific macronutrient ratios and simply consume a large amount of carbohydrates for the time
period chosen. This approach, while more haphazard than paying attention to specific ratios,
works well for many individuals. In fact, it is this aspect of the CKD that draws many individuals
to the diet: you can essentially eat whatever you want during your carb-load phase. Having a 24
to 36 hour time period where you can consume whatever foods you want, without paying
attention to calories or nutrient percentages, makes dieting psychologically easier. For those
individuals who find that haphazard carb-loading leads to a lack of results in terms of fat loss, a
more exacting approach can be used. Guidelines for optimizing the carb-load period appear below.
Nutrient intake
During the first 24 hours of carb-loading, carbohydrate intake should be 10 grams per
kilogram of lean body mass or 4.5 grams of carbs per pound of lean body mass . This will
represent 70% of the total calories consumed. The remaining calories are divided evenly between
fat (15% of total calories) and protein (15% of total calories). Table 2 gives estimated amounts of
carbohydrate, protein and fat for various amounts of lean body mass.
Table 2: Nutrient intake during first 24 hours of carb-loading
LBM
(lbs)
100
120
140
160
180
200
Carb
(g)
450
540
630
720
810
900
Fat
(g)
43
51
60
68
76
85
Protein
(g)
98
115
135
153
172
193
Total
calories*
2600
3100
3600
4100
4600
5100
* The total calories consumed during the first 24 hours of the carb-load should be approximately
twice what was consumed during the lowcarb week.
During the second 24 hours of carb-loading, carbohydrates will make up 60% of the total calories,
protein 25% and fat 15% as shown in table 3.
Table 3: Nutrient intake during second 24 hours of carb-loading
LBM
(lbs)
100
120
140
160
180
200
Carb
(g)
227
270
310
360
405
450
Fat
(g)
20
25
30
35
40
45
142
Protein
(g)
90
108
126
144
162
180
Total
calories
1448
1737
2014
2331
2628
2925
Once again, the above amounts should be considered guidelines only. Experimentation
coupled with good record keeping will help an individual determine the optimal amounts of
nutrients to consume during their carb-up.
Summary of guidelines for glycogen supercompensation on the CKD
1. 5 hours prior to your final workout before the carb-up, consume 25-50 grams of carbohydrate
with some protein to begin the shift out of ketosis. Small amounts of protein and fat may be
added to this meal.
2. 2 hours prior to the final workout, consume 25-50 grams of glucose and fructose (such as fruit)
to refill liver glycogen.
3. The level of glycogen resynthesis depends on the duration of the carb-up and the amount of
carbohydrates consumed. In 24 hours, glycogen levels of 100-110 mmol/kg can be achieved as
long as 10 grams carb/kg lean body mass are consumed. During the second 24 hours of carbing,
an intake of 5 grams/kg lean body mass is recommended.
4. During the first 24 hours, the macronutrient ratios should be 70% carbs, 15% protein and 15%
fat. During the second 24 hours, the ratios are roughly 60% carbs, 25% protein and 15% fat.
5. As long as sufficient amounts of carbohydrate are consumed, the type and timing of intake is
relatively less important. However, some data suggests the higher glycogen levels can be
attained over 24 hours, if higher Glycemic Index (GI) carbs are consumed. If carbing is continued
past 24 hours, lower GI foods should be consumed.
Summary
Assuming full depletion, which requires a variable amount of training depending on the
length of the carb-up, glycogen levels can be refilled to normal within 24 hours, assuming that
carbohydrate consumption is sufficient. With longer or shorter carb-loading periods, muscle
glycogen levels can reach higher or lower levels respectively.
During the initial 24 hours of carb-loading, a carbohydrate intake of 8-10 grams of carbs
per kilogram of lean body mass will refill muscle glycogen to normal levels. Although less well
researched, it appears that a carbohydrate intake of roughly 5 grams/kg lean body mass is
appropriate. While the type of carbohydrate ingested during the first 24 hours of carb-loading is
less critical, it is recommended that lower GI carbs be consumed during the second 24 hours to
avoid fat regain. The addition of other nutrients to the carb-load phase does not appear to affect
glycogen resynthesis rates. However fat intake must be limited somewhat to avoid fat gain.
It is currently unknown how the insertion of a carb-loading phase will affect the
adaptations to ketosis. As well, no long term data exists on the metabolic effects which are seen.
143
Therefore it can not be recommended that the CKD be followed indefinitely and a more ‘balanced’
diet should be undertaken as soon as one’s goals are achieved.
A question which is asked is whether the carb-load is anabolic, stimulating muscle growth
while dieting. As muscle growth requires an overall anabolic metabolism, the body must be
shifted out of ketosis (which is catabolic) during the carb-load. This requires that liver
metabolism be shifted away from ketone production, which necessitates both an increase in
certain enzymes as well as a refilling of liver glycogen. Therefore the carb-load really begins
about 5 hours prior to the final workout when a small amount of carbohydrates should be
consumed to begin upregulating liver enzymes. Approximately 2 hours prior to the workout, a
combination of glucose and fructose should be consumed to refill liver glycogen. Glutamine is an
optional addition that may increase liver glycogen levels.
There are a number of ways that the carb-load might affect muscle growth. The primary
mechanism is by increasing insulin and amino acid availability. The second is by increasing
cellular hydration levels. Both have the potential to increase protein synthesis while decreasing
protein breakdown.
Ultimately the question must be asked as to just how much new muscle can be
synthesized during a carb-up of 24 to 48 hours. Even assuming zero muscle breakdown during
the ketogenic week, the amount of new muscle synthesized is likely to be small. So while
individuals may gain a small amount of muscle during a CKD, it should not be expected or
counted on.
References Cited
1. Ivy J. Muscle glycogen synthesis before and after exercise. Sports Medicine (1991) 11: 6-19.
2. “Physiology of Sport and Exercise” Jack H. Wilmore and David L. Costill. Human Kinetics
Publishers 1994.
3. Sherman W. Metabolism of sugars and physical performance. Am J Clin Nutr (1995)
62(suppl): 228S-41S.
4. Pascoe DD et. al. Glycogen resynthesis in skeletal muscle following resistive exercise. Med Sci
Sports Exerc (1993) 25: 349-354.
5. Coyle EF. Substrate utilization during exercise in active people. Am J Clin Nutr (1995)
61 (suppl): 968S-979S.
6. Pascoe DD and Gladden LB. Muscle glycogen resynthesis after short term, high intensity
exercise and resistance exercise. Sports Med (1996) 21: 98-118.
7. Burke LM et. al. Muscle glycogen storage after prolonged exercise: effects of the glycemic index
of carbohydrate feedings. J Appl Physiol (1993) 75: 1019-1023.
8. Rankin J. Glycemic Index and Exercise Metabolism. in Gatorade Sports Science Exchange
Volume 10(1).
9. Costill DL et. al. Muscle glycogen utilization during prolonged exercise on successive days.
J Appl Physiol (1971) 31: 834-838.
10. Reed MJ et. al. Muscle glycogen storage postexercise: effect of mode of carbohydrate
administration. Med Sci Sports Exerc (1989) 66: 720-726.
11. Costill DL et. al. The role of dietary carbohydrate in muscle glycogen resynthesis after
running. Am J Clin Nutr (1981) 34: 1831-1836.
144
12. Burke LM et. al. Muscle glycogen storage after prolonged exercise: effect of the frequency of
carbohydrate feedings. Am J Clin Nutr (1996) 64: 115-119.
13. Conley M and Stone M. Carbohydrate ingestion/supplementation for resistance exercise and
training. Sports Med (1996) 21: 7-17.
14. Ivy JL et. al. Muscle glycogen synthesis after exercise: effect of time of carbohydrate
ingestion. J Appl Physiol (1988) 64: 1480-1485.
15. Chandler RM et. al. Dietary supplements affect the anabolic hormones after weight-training
exercise. J App Phys (1994) 76: 839-45.
16. Doyle J.A. et. al. Effects of eccentric and concentric exercise on muscle glycogen
replenishment. J Appl Physiol (1993) 74: 1848-1855.
17. Widrick JJ et. al. Time course of glycogen accumulation after eccentric exercise.
J Appl Physiol (1992): 1999-2004.
18. Burke LM et. al. Effect of coingestion of fat and protein with carbohydrate feeding on muscle
glycogen storage. J Appl Physiol (1995) 78: 2187-2192.
19. Chiang An-Na and Huang P. Excess nitrogen balance at protein intakes above the
requirement level in young men. Am J Clin Nutr (1988) 48: 1015-1022.
20. Zawadzki et al. Carbohydrate-protein complex increases the rate of muscle glycogen storage
after exercise. J Appl Physiol (1992) 72: 1854-1859.
21. Lemon P. Is increased dietary protein necessary or beneficial for individuals with a physically
active lifestyle? Nutrition Reviews (1996) 54: S169-S175.
22. Acheson KJ. Nutritional influences on lipogenesis and thermogenesis after a carbohydrate
meal. Am J Physiol (1984) 246: E62-E70.
23. Shah M and Garg A. High-fat and high-carbohydrate diets and energy balance. Diabetes
Care (1996) 19: 1142-1152.
24. Hellerstein M. Synthesis of fat in response to alterations in diet: insights from new stable
isotope methodologies. Lipids (1996) 31 (suppl) S117-S125.
25. Jebb SA et. al. Changes in macronutrient balance during over- and underfeeding assessed by
12-d continuous whole body calorimetry. Am J Clin Nutr (1996) 64: 259-266.
26. Acheson KJ et. al. Glycogen storage capacity and de novo lipogenesis during massive
carbohydrate overfeeding in man. Am J Clin Nutr (1988) 48: 240-247.
27. Knapik JJ et. al. Influence of fasting on carbohydrate and fat metabolism during rest and
exercise in men. J Appl. Physiol (1988) 64: 1923-1929.
28. Loy S. et. al. Effects of 24-hour fast on cycling during endurance time at two different
intensities. J Appl Physiol (1986) 61: 654-659.
29. Goldforth HW et. al. Persistence of supercompensated muscle glycogen in trained subjects
after carbohydrate loading. J Appl Physiol (1997) 82: 324-347.
30. “The Anabolic Diet” Mauro DiPasquale, MD. Optimum Training Systems, 1995.
31. “BODYOPUS: Militant fat loss and body recomposition” Dan Duchaine. Xipe Press, 1996.
32. Borer K. Neurohumoral mediation of exercise-induced growth. Med Sci Sports Exerc (1994)
26:741-754.
33. Tessari P et. al. Differential effects of hyperinsulinemia and hyperaminoacidemia on leucinecarbon metabolism in vivo. J Clin Invest (1987) 79: 1062-1069.
34. Heslin MJ et. al. Effect of hyperinsulinemia on whole body and skeletal muscle leucine carbon
kinetics in humans. Am J Physiol (1992) 262: E911-E918.
35. Randle PJ et. al. Glucose fatty acid interactions and the regulation of glucose disposal. J Cell
Biochem (1994) 55 (suppl): 1-11.
36. McGarry JD et. al. From dietary glucose to liver glycogen: the full circle around. Ann Rev Nutr
145
(1987) 7:51-73.
37. Boyd ME et. al. In vitro reversal of the fasting state of liver metabolism in the rat. J Clin
Invest (1981) 68: 142-152.
38. Sidery MB et. al. The initial physiological responses to glucose ingestion in normal subjects
are modified with a 3 d high fat-diet. Br J Nutr (1990) 64: 705-713.
38. Biolo G et. al. Physiologic hyperinsulinemia stimulates protein synthesis and enhances
transport of selected amino acids in human skeletal muscle. J Clin Investigation (1995)
95: 811-9.
39. Haussinger D et. al. Cellular hydration state: an important determinant of protein catabolism
in health and disease. Lancet (1993) 341: 1330-1332.
146
Part IV:
Other dieting issues
Chapter 13: Breaking fat loss plateaus
Chapter 14: Ending a ketogenic diet
Chapter 15: Tools for the ketogenic diet
Chapter 16: Final considerations
Outside of the physiology and specifics of setting up the ketogenic diet, there are a number
of other issues which need to be discussed. Chapter 13 addresses the reality of the fat-loss
plateau, offering several strategies to overcome those plateaus. Chapter 14 addresses the issue
of ending a ketogenic diet. Chapter 15 discusses the various tools, such as skinfold calipers and
Ketostix (tm), which can be of use on a ketogenic diet to track results and optimize the diet.
Finally, chapter 16 addresses the considerations which individuals must take into account before
they decide to do the ketogenic diet.
147
Chapter 13:
Breaking fat loss plateaus
A reality of all fat loss diets is the dreaded plateau. Although the exact reasons are
unknown, the body eventually adapts to the diet and fat loss slows or stops completely. The
typical approach to breaking plateaus is to either decrease calories further or increase activity.
Since calories can only be taken so low and only so much exercise can be performed each week,
other strategies to break fat loss plateaus are necessary. Due to the differential nature of the
SKD/TKD and the CKD, they are discussed separately.
Section 1: Tips for individuals on a SKD, TKD or CKD
Improve the nutrient quality of the lowcarb week.
The nature of the ketogenic diet is such that most individuals tend to consume a lot of
saturated fats while on the diet. Substituting some of the saturated fat intake inherent to the
ketogenic diet with unsaturated fats such as fish oils and vegetable oils, may increase
thermogenesis (the burning of calories to produce heat) and increase fat loss. Many individuals
report a significant amount of bodily warmth following a meal high in unsaturated fats, probably
due to increased thermogenesis. Note that this further limits the food choices available on a
ketogenic diet.
Eat the day’s calories across fewer meals.
Although this strategy is purely conjectural, some people have reported better fat loss by
eating the same daily calories across fewer meals. In theory, this could allow greater fat loss as
the body may be required to draw more energy from body fat stores in between meals.
Take a week off the diet.
Although this goes against everything most dieters have been conditioned to believe,
sometimes the best strategy to break a fat loss plateau is to take a week off of the diet and eat
at maintenance calories. Some individuals choose to remain ketogenic, simply increasing their
caloric intake, while others prefer to return to a carbohydrate based diet.
The body ultimately adapts to anything including diet and calorie levels. Taking a week off
of the diet can help raise metabolic rate as well as rebuild any muscle which may have been lost.
However, fat gain during a one week break is generally minimal as long as individuals do not
overdo caloric intake. Keep in mind that adding carbohydrates back into the diet can cause a
rapid but transient weight regain for individuals on an SKD or TKD.
148
Individuals on a CKD typically lengthen their carb-up to 5-7 days as their break from
dieting. Obviously, carbohydrate intake during the first 24 hours should be lowered since a longer
carb-load period is being performed. A one to two-week break from the diet every four to six
weeks of dieting seems to work well for most people.
Cycle calories throughout the week.
Many individuals have found success by cycling caloric intake while on a ketogenic diet. If
we use a rough guideline of 12 cal/lb as an average caloric intake during the lowcarb week, an
individual might alternate a day at slightly lower calorie levels (for example one day at 11
calories/pound) with days at slightly higher calorie levels (14 calories per pound) to get fat loss
going again.
Under these conditions, individuals can cautiously take calories below the 11-12
calorie/pound limit set in chapter 3 but only for a day or two at a time after which calories should
be raised above 12 calories per pound. Although calorie cycling can restart fat loss, dieters must
watch for signs of muscle loss. An example 7-day span where calories are cycled appears below.
Monday: 12 cal/lb
Tuesday: 10 cal/lb
Wednesday: 15 cal/lb
Thursday: 13 cal/lb
Friday: 12 cal/lb
Average caloric intake: 12.4 cal/lb
Note that the highest daily caloric intake (15 cal/lb) occurs immediately after the lowest
daily caloric intake (10 cal/lb). In theory, this might help to prevent any metabolic slowdown
from the low calorie day.
Section 2: Tips only for individuals on a CKD
Reduce the length of the carb-up period to 24 hours.
By allowing more time in ketosis, it should be possible to achieve greater fat loss.
Carbohydrates should be consumed for 24 hours after the Friday workout, ending on Saturday
evening. As usual, 10 g of carbs per kg of lean body mass should be consumed. As discussed in
chapter 12, due to lower glycogen resynthesis, training volume will have to be decreased during
the Mon and Tue workouts by about 2 sets per bodypart.
Some dieters consider cutting out the carb-up period completely but this is generally a
mistake as inadequate glycogen will sap training intensity. With the exception of the week before
149
a contest where no carb-up is done, and unless a longer cycle (such as the 10 day cycle discussed
below) is being used, trainees should not reduce the carb-up to less than 24 hours in most cases.
Improve the quality of the carb-load phase.
A great number of individuals are drawn to the CKD by the idea that any and all
carbohydrates can be consumed during the carb-loading period. While this is loosely true, it
comes with the price of slowing fat loss. Some individuals have consumed as much as 10,000
calories during a carb-load. Dieters consuming lots of junk food (especially with a high sugar and
fat content) oftentimes regain some of the bodyfat which was lost during the lowcarb week.
Thus, the CKD becomes a two-steps forward, one-step backwards ordeal.
Making better food choices, limiting carbohydrate intake to 10 grams/kilogram lean body
mass, emphasizing carbohydrates with a lower glycemic index, and eating less dietary fat can
minimize any fat regain during the carb-load. Additionally, certain supplements (discussed in
chapter 31) may help to prevent fat regain during the carb-load. Refer back to chapter 12 for
details on optimizing the carb-load phase of the CKD.
Establish ketosis more quickly.
In theory, if ketosis can be established faster, more fat might be lost. Applying strategies
#1 and #2 above is the first step. If individuals still having trouble establishing ketosis quickly,
they may need to increase the amount of cardio done the morning after the carb-up. Alternately,
the carb-up can be ended earlier in the previous day to allow liver glycogen to empty more
quickly. Finally, fructose and sucrose can be avoided during the carb-load to avoid refilling liver
glycogen. However, this may compromise potential muscle growth during the carb-up, due to the
liver remaining in a catabolic state (see chapter 12).
Perform longer periods in ketosis before carbing
This ties into strategy #1 above. Some individuals have found that a 10 day cycle (one
carb-load period every 10 days) significantly increases fat loss compared to a 7 day cycle. In this
case, the weekly training should be spread out over 10 days. An example workout cycle appears
below.
day 1: upper body (tension workout as per advanced CKD workout), cardio optional
day 2: lower body (tension workout as per advanced CKD workout), cardio optional
Note: The goal of these two workouts, as with the advanced CKD workout is to send an anabolic
stimulus to the muscle to maintain muscle mass while dieting.
day 3: off to allow recovery from previous day’s workouts
day 4: cardio or reduce calories 10% more
day 5: cardio or reduce calories 10% more
day 6: short depletion workout
150
Note: During this workout, high reps should be used with light weights, not training to failure. The
goal is only to deplete glycogen more to enhance fat use by the muscle. Few sets, approximately
2-3 per bodypart should be done but no more.
day 7: cardio or reduce calories 10% more
day 8: cardio or reduce calories 10% more
day 9: cardio or reduce calories 10% more
day 10: depletion in morning; begin carb-up immediately after training.
The final depletion should be a repeat of the day 6 depletion, being comprised of an
additional 2-3 sets per bodypart. This should completely deplete muscle glycogen, prior the
starting the carb-up, which would last 24 hours before starting the cycle over again.
The problem with this cycle is that it does not fit neatly into a 7 day work-week and
requires that different days of the week be trained on each cycle. However if a dieter has the
flexibility in their schedule, and wants to pursue maximal fat loss from each cycle, it may be a
worthwhile experiment.
Summary
A reality of fat loss diets is the inevitable plateau which occurs. There are a variety of
strategies available to overcome a fat loss plateau. These range from making better choices in
food quality, to taking a week off from the diet, to a variety of different workout schedules which
can be tried. In general, only one strategy should be tried at any one time so that an individual
can gauge how the change is or is not working.
151
Chapter 14:
Ending a ketogenic diet
One important aspect of any fat loss diet is how it should be ended. Realistically, one can
not, and should not, be on a fat loss diet forever. At some point, an individual will have reached
their goal and the focus will change to maintenance. Bodybuilders will frequently move from fat
loss phases back into mass gaining phases, where some regain of bodyfat is accepted as an end
result of gaining muscle mass.
A sad reality of fat/weight loss is the dismal statistics for long-term weight maintenance.
Individuals who use caloric restriction as the only way to achieve their fat loss have a much lower
chance of keeping that fat/weight off than those who use exercise or a combination of exercise
and dietary changes (1). Simply put, dieters can not restrict their caloric intake and be hungry
forever.
This is the primary reason that exercise has been emphasized in this book as an integral
part of any diet. It is not realistic to subsist on low calories forever. Far more realistic is to
maintain good exercise habits for a lifetime. This is also the reason that neither an excessive
caloric deficit or an excessive amount of exercise is advocated. While it may take longer to reach
one’s personal fat loss goals with a more moderate approach, the chances of maintaining that fat
loss are much higher if good habits have been developed.
If an individual tries to lose fat quickly by exercising ten hours per week, they will
eventually run into problems with scheduling. As soon as they cut back to a few hours of exercise
per week, the weight/fat will start to come back. Instead, if this individual develops a regular
schedule of three to four hours per week of exercise, and couples that with a slight caloric deficit
until they reach their fat loss goals, they will be more likely to maintain this amount of exercise
on a consistent basis. This should make maintaining the fat loss easier.
Some individuals may choose to remain on some form of a ketogenic (or low carbohydrate)
diet indefinitely while others will not. For those who remain on a ketogenic diet, there are fewer
issues involved in moving from fat loss maintenance. Either calories can be increased (in the
form of dietary fat or carbohydrate) or activity levels can be decreased until fat loss stops. Since
the long term health implications of ketogenic diets are not known, this book cannot recommend
that a ketogenic diet be sustained indefinitely.
For individuals who do move away from the ketogenic diet, there are more issues which
need to be discussed including the physiological ramifications of adding carbohydrates back to the
diet, maintaining bodyfat levels, etc. Each is discussed in this chapter. Most of the information
presented here applies to individuals on a SKD or TKD. Due to the structure of the CKD, it has
its own set of implications and consequences.
152
Section 1: General issues for
ending a ketogenic diet
Weight regain
Although this topic has been discussed several times already, it bears repeating.
Individuals who have been on a low-carbohydrate diet (of any type) will show a rapid increase in
bodyweight when carbohydrates are added to the diet (2,3). This weight gain, similar to what
occurs during the carb load phase of a CKD, can be anywhere from 5 to 11 pounds (2,3).
For dieters who focus only on the scale, this rapid weight gain can be disheartening,
pushing them straight back into a low-carbohydrate eating style. The inability to differentiate
between weight gain and fat gain tends to promote the belief in dieters that excess carbohydrates
(rather than excess calories) are the cause of their problems. This may make it difficult for these
individuals to ever wean themselves away from the ketogenic diet.
Once again, a distinction must be made between weight gain and true fat gain. Weight
gains of 3-5 pounds or more are not uncommon for individuals who eat even small amounts of
carbohydrates after being on a ketogenic diet for long periods of time. From an energy balance
standpoint, we can easily see that it is impossible to gain this much true fat in a short time
period.
To gain one pound of fat requires that 3,500 calories be consumed above the number of
calories burned. To gain a true three pounds of fat would require that 10,500 calories be
consumed above the number of calories burned that day. A five pound fat gain would require the
consumption of 17,500 calories above the number of calories burned per day. It should be
obvious that the weight gain from initial carbohydrate consumption reflects shifts in water
weight only.
To fully discuss proper nutritional strategies for either bodyfat maintenance or mass gains
would require another book. Simply keep in mind that maintenance of new bodyfat levels
requires that caloric expenditure match caloric intake, regardless of diet. By the same token,
gains in body mass (for bodybuilders or other strength athletes who wish to gain muscle mass)
require that more calories be consumed than are expended. This will come with the consequence
of some fat gain while lean body mass is being added.
Insulin resistance
As discussed in chapter 7, one effect of long term low-carbohydrate diets is an increase in
insulin resistance, sometimes called ‘starvation diabetes’, when carbohydrates are refed (4). This
effect is briefly discussed again here.
In brief, the initial physiological response to carbohydrate refeeding looks similar to what is
seen in Type II diabetics, including blood sugar swings and hyperinsulinemia. Several possible
hypotheses for this effect have been considered including a direct effect of ketones, but this is not
the case (5,6) and ketones may improve insulin binding (4). The change in insulin sensitivity is
153
caused by changes in enzyme levels, especially in those enzymes involved in both fat and
carbohydrate burning (7). High levels of free fatty acid levels also affect glucose transport and
utilization (8).
Long periods of time without carbohydrate consumption leads to a down regulation in the
enzymes responsible for carbohydrate burning. Additionally, high levels of free fatty acids in the
bloodstream may impair glucose transport (8). This change occurs both in the liver (7) and in
the muscle (7,9). With carbohydrate refeeding, these changes are gone within 5 hours in the liver
and 24-48 hours in muscle tissue (10,11).
In practice, many individuals report what appears to be rebound hypoglycemia (low blood
sugar) either during the carb-up or during the first few days of eating carbohydrates when
ketogenic eating is ended, for the reasons discussed above.
Ketones themselves do not appear to alter how cells respond to insulin (6) which goes
against the popular belief that ketogenic diets somehow alter fat cells, making them more likely
to store fat when the ketogenic diet is resumed. Practical experience shows this to be true, as
many individuals have little trouble maintaining their bodyfat levels when the ketogenic diet is
stopped, especially if their activity patterns are maintained.
To reiterate, the key to maintenance of a new bodyweight/bodyfat level is to balance
energy consumption with energy expenditure. This makes exercise an absolute requirement for
weight/fat maintenance when a diet is abandoned.
Section 2: Recommendations for ending a SKD or TKD
There are few practical recommendations for ending a ketogenic diet in the literature. In
research studies of the protein sparing modified fast (PSMF), carbohydrates are typically
reintroduced slowly to minimize weight gain and gastric upset, which occurs in some people.
Ending a SKD or TKD can be done in one of two fashions. If an individual no longer wishes fat
loss, but chooses to stay on the SKD/TKD, fat intake can be increased (to raise calories to a
maintenance level of approximately 15-16 calories/pound) until fat loss stops.
If an individual wishes to stop the SKD/TKD altogether and de-establish ketosis, obviously
carbohydrates will have to be added to the daily diet. This has several important consequences.
First and foremost, as dietary carbohydrates are added to the diet, dietary fat must be reduced to
avoid the consumption of excess calories. Since fat contains approximately twice as many
calories per gram as carbohydrate (9 calories/gram vs. 4 calories/gram), for every 2 grams of
carbohydrate which are added to the diet, 1 gram of fat must be removed.
Individuals concerned with rapid weight regain when they end a ketogenic diet should
simply introduce carbohydrates slowly, perhaps adding twenty to thirty grams per day at most.
To avoid possible problems with rebound hypoglycemia, primarily vegetables should be consumed
with starches (pasta, rice, breads) remaining limited.
Many individuals who turn to ketogenic diets to lose bodyfat tend to have problems with
excessive carbohydrate consumption in the first place, finding that high- carbohydrate, very-lowfat diets increase their hunger. By the same token, individuals coming off of a ketogenic diet
frequently find that their taste for starchy foods, especially high glycemic index carbs, has
154
diminished and caloric intake can be more easily controlled.
Obviously activity patterns should be maintained while calories/carbohydrates are being
reintroduced to the diet. If individuals find themselves consuming too many calories (especially
during the first few days of carbohydrate refeeding), an increase in activity may be useful during
that time period.
Section 3: Recommendations for ending a CKD
Generally speaking, individuals who utilize the CKD for fat loss tend to be bodybuilders or
athletes who need a way to reduce bodyfat without compromising high-intensity exercise
performance. However, this is not universally the case. In this group of individuals it is not
uncommon to move from a fat loss phase (which may be done by bodybuilders for a contest or
simply to avoid gaining too much bodyfat during the off season) directly into a weight/muscle
gaining phase where an excess of calories are consumed. As with ending the SKD/TKD there are
two primary options for individuals who wish to end a fat loss CKD.
Option 1: Stay on the CKD
It is this author’s opinion that the CKD is not the optimal diet for gaining lean body mass
for bodybuilders or athletes. Ultimately, insulin is one of the most anabolic hormones in the body,
stimulating protein synthesis and inhibiting protein breakdown. A high calorie CKD, by limiting
insulin levels, will not allow optimal gains in LBM. However, athletes may be able to slow bodyfat
gains by using CKD for mass gains, but this comes with the price of slower gains in lean body
mass.
The major changes which must be made for those who want to stay on a CKD are in
calorie levels, length of the carb-up, and training strategies. As discussed in chapter 3, gains in
lean body mass may require a caloric intake of 18 calories per pound of bodyweight or more.
Some individuals find consuming this many calories on a low-carbohydrate diet to be difficult. As
well, since protein must still be somewhat limited to maintain ketosis, this means that fat intake
must be raised to high levels. The potential health consequences of such a dietary strategy are
unknown. To reiterate, without long term data on the health consequences of a SKD or CKD, it is
not recommended that the CKD be followed indefinitely.
In practice, most lifters tend to reduce their carb-loading phase to 30 hours or less for
maximal fat loss. For optimal mass gains, the carb-up should be increased in duration to a full 48
hours. While fat gain tends to be higher with this strategy, gains in lean body mass are typically
greater as well. An alternate strategy, and one that will most likely help to prevent some of the
fat gain which would otherwise occur, is to have two carb-loading phases of 24 hours performed in
a 7 day span. That is, an individual might perform a 24 hour carb-load phase on Wednesday and
again on Saturday. As discussed in chapter 12, the carb-up should optimally follow a workout.
Finally, training structure can be altered to fit the individuals preference for mass gain
training. Training for mass gains on a CKD are discussed in chapter 29.
155
Option 2: Come off the CKD
This is the strategy advocated by this author. As discussed above, lean body mass gains
will most likely be higher with a carbohydrate based diet although fat gain may be higher as well,
especially if calories are excessive. A full discussion of nutritional strategies for mass gains or
bodyfat maintenance are beyond the scope of this book.
As mentioned above, calories should be increased above maintenance if mass gains are the
goal. As a general rule, protein intake should remain fairly stable, approximately 0.9 grams of
protein/pound of bodyweight. Fat intake should be controlled, but 15-25% seems to work well for
most lifters. The remainder of the diet should be carbohydrate, typically comprising 50-60% of
the total daily calories. Once non-ketogenic eating has been resumed, the day’s total calories
should be consumed in five to six smaller meals to keep blood sugar stable. As well, a postworkout drink of carbohydrates and protein may help with recovery and gains.
By coming off of the CKD, trainees will have much greater flexibility in the types of
training programs which can be used for mass gains, because they do not have to plan their
training around the carb-loading phase. This is yet another reason that a carbohydrate based
diet will most likely be superior to a CKD for mass gains. The format of the CKD mandates that
training structure follow certain guidelines geared to the peculiarities of the diet. With a more
balanced diet, training structure does not have to be as rigid.
For those individuals who are using a CKD but who simply want to maintain their current
bodyfat without attempting to add lean body mass, the same options discussed above still apply.
It would be somewhat unusual for someone to remain on the CKD indefinitely for bodyfat
maintenance. Generally speaking most individuals will tend to come off the CKD and only use it
when bodyfat levels start to increase again. Using the CKD in short stints, to bring bodyfat
levels down again, should minimize any potential health problems.
As with the SKD/TKD, the long term health consequences of a CKD are unknown and its
long term use cannot be recommended at this time. The biggest difference between those who
simply want to maintain their fat loss versus those who want to gain mass are in calorie levels,
which should be raised to maintenance.
Summary
Equally as important as losing fat initially is the maintenance of that new bodyfat level.
Depending on an individual’s goal (maintenance or muscle gain) and the diet which they were on to
begin with, a variety of options exist for ending a ketogenic diet. Due to a lack of long term health
data, it is not recommended that extreme carbohydrate restricted diets be followed in the long
term.
References Cited
1. Miller WC et. al. A meta-analysis of the past 25 years of weight loss research using diet,
exercise or diet plus exercise intervention. Int J Obes (1997) 21: 941-947.
2. Phinney SD et. al. The human metabolic response to chronic ketosis without caloric restriction:
156
physical and biochemical adaptations. Metabolism (1983) 32: 757-768.
3. Kreitzman SN et. al. Glycogen storage: illusions of easy weight loss, excessive weight regain,
and distortions in estimates of body composition. Am J Clin Nutr (1992) 56: 292S-293S.
4. Robinson AM and Williamson DH Physiological roles of ketone bodies as substrates and signals
in mammalian tissues. Physiol Rev (1980) 60: 143-187.
5. Kissebah AH. et. al. Interrelationship between glucose and acetoacetate metabolism in human
adipose tissue. Diabetologia (1974) 10: 69-75.
6. Misbin RI et. al. Ketoacids and the insulin receptor. Diabetes (1978) 27: 539-542.
7. “Textbook of Biochemistry with Clinical Correlations 4th ed.” Ed. Thomas M. Devlin. WileyLiss 1997.
8. Roden M et al. Mechanism of free fatty acid-induced insulin resistance in humans. J Clin
Invest. (1996) 97: 2859-2865.
9. Cutler DL Low-carbohydrate diet alters intracellular glucose metabolism but not overall
glucose disposal in exercise-trained subjects. Metabolism: Clinical and Experimental
(1995) 44: 1364-70.
10. Randle PJ. Metabolic fuel selection: general integration at the whole-body level. Proc Nutr Soc
(1995) 54: 317-327.
11. Randle PJ et. al. Glucose fatty acid interactions and the regulation of glucose disposal. J Cell
Biochem (1994) 55 (suppl): 1-11.
157
Chapter 15:
Tools for ketogenic diets
There are a number of tools which can and should be used by ketogenic dieters to maximize
results. These include the scale, skin fold calipers, glucometers, Ketostix (tm) and various tools to
measure food amounts with. Some of the most frequently questions and issues which are raised
about each are discussed.
Section 1: Measuring body composition
Measurements serve two purposes. First and foremost, measurements give dieters a way
to gauge progress towards their ultimate goals. Second, to set up the diet, dieters need to know at
least their body weight since calories and protein intake is determined relative to weight.
The three major types of measurement methods that most individuals will have access to
are the scale, body fat measurement, and the tape measure. No method of measurement is
perfectly accurate and all have built in errors that can make it difficult to gauge progress. The
solution is to simply use them for comparative measures, rather than focusing on absolute
numbers. By taking measurements at the same time each week, under identical conditions,
dieters can get a rough idea of overall changes in body weight and body composition.
The Scale
The scale is overused by most dieters and is typically the only method used to chart
progress. As discussed in chapter 8, the scale used by itself can be misleading on any diet but
even moreso on a ketogenic diet.
The main problem with the scale is that it does not differentiate between what is being
gained or lost (i.e. muscle, fat, water). Recall that glycogen depletion on a ketogenic diet results in
a drop in body water causing immediate weight loss (5-10 lbs depending on bodyweight).
Carbohydrate consumption following a period of carbohydrate restriction causes a similar
increase in body weight. Individuals who tend to fixate on short-term weight changes will become
frustrated by the changes in scale weight on a ketogenic diet, especially the CKD.
It is recommended that individuals use the scale only to make comparative
measurements, described below. Recall that weight training may cause the scale to
misrepresent actual fat loss due to increases in muscle mass.
Ideally the scale should always be used along with skin fold measurements or the tape
measure for more accurate measures of changes in body composition. Even when body weight is
stable, if body fat percentage or tape measure readings are decreasing, a loss of body fat has
occurred. For best results, scale measurements should be taken first thing in the morning after
going to the bathroom but before food is eaten. This will give the greatest consistency. More
158
going to the bathroom but before food is eaten. This will give the greatest consistency. More
detailed suggestions for the best use of the scale on each of the three diets appears below.
Please note that very few individuals will make constant linear changes in body weight and
plateaus are frequent. Women will frequently gain or lose water weight during different phases of
their menstrual cycle. For these reasons, regular weighing is NOT recommended for most
individuals. While weekly weighing may give some indication of changes, weighing every two to
four weeks may give a better indication of long term changes.
The scale on the SKD/TKD
On a SKD, there is an initial drop in body weight due to a loss of glycogen and water,
especially if an individual is exercising. After the initial weight loss, individuals can use the scale
as a rough guide of overall changes by measuring at a consistent time each week, such as every
Monday morning after awakening. Keep in mind that the consumption of even moderate
amounts of carbs can cause a rapid jump in scale weight. This increase is temporary only and
will disappear once ketogenic dieting is resumed.
Individuals on a TKD will only see shifts in scale weight if they weigh themselves around
their workouts, when carbohydrates are being consumed. As long as scale measurements are
taken at the same time each week, there should be no large scale changes in body weight from
the consumption of pre- and/or post-workout carbs.
The scale on the CKD
Use of the scale is the most problematic on the CKD. Over the course of a one to two day
carbohydrate loading phase, individuals have reported weight gains from one pound to fifteen
pounds. In general, women seem to gain less overall weight (most likely due to lower amounts of
lean body mass) during the carb-load than men but this is highly variable.
The scale can be used on the CKD as long as the measurement is made at consistent
times of the week. Initial measurements should be taken the morning before the carb-up, when
the dieter is the most depleted/lightest, and again after the carb-up when they are the heaviest.
This should give a rough idea of overall changes in body composition. If weight increases by 7 lbs
from the morning of the carb-load to the morning after the carb-load, the dieter know that they
need to lose more than 7 lbs prior to the next carb-load for ‘true’ fat loss to have occurred. Most of
the weight gained will disappear quickly as glycogen levels are depleted early in the week and
trainees typically experience a large weight drop by the third day following the carb-load. A
typical pattern of weight gain/loss on a CKD appears below.
Monday: 150 lbs
Friday: 143 lbs
Monday: 149 lbs
Friday: 142 lbs
Monday: 148 lbs
Friday: 141 lbs
159
Despite the large fluctuations from Monday to Friday, repeat measurements show a trend
downwards, indicating true long term weight/fat loss.
Selecting a scale
In general, most scales seem to be fairly accurate. However some low cost scales seem to
be affected significantly by where you stand on the scale, giving inaccurate results. A relatively
inexpensive digital scale should yield consistent and accurate results. Some individuals choose to
use the scale at their gym. If this results in inconsistent weighing (either different days of the
week or different times of day when body weight can be affected by prior meals), using a gym
scale is not the best choice. However, if consistency can be guaranteed, the scales at gyms
should be sufficient to track progress.
Body fat measurements
As discussed in chapter 8, there are numerous methods of measuring body fat percentage
including skin folds, infrared inductance, bioelectrical impedance, and underwater weighing. All
make assumptions about body composition that appear to be inaccurate.
In general, the best method for most individuals is skin fold measurements taken with
calipers, primarily because it can be done easily and yields consistent results. With practice it is
possible for dieters to take their own skinfolds. In many cases, this is preferred since many gyms
have a high turnover of employees. More critical than how accurate the skin fold measurements
are is how consistent the measurements are. Everyone differs slightly in their measurement
technique and comparing the skinfold measures taken by one person to those taken by another
person will not be accurate. If dieters always take their own skinfolds, they can at least be sure
of consistency in measuring.
In general, it is recommended that individuals measure skinfolds every two to four weeks
to track changes in body composition. Beginners starting a diet or exercise program will generally
not see changes in body composition for the first six to eight weeks. While it is recommended that
measurements be taken prior to starting the diet/exercise program, remeasuring too frequently
can cause frustration and drop-out from a lack of changes.
For this reason, beginners should not repeat body composition measurements any sooner
than eight weeks into their diet/exercise programs. This is about how long it takes for the initial
changes to occur. After the initial changes occur, more frequent measures can be made if
desired. However it is rare to find an individual who makes linear, constant changes in body
composition and it is very easy to become pathological about the lack of changes.
Skin folds on the SKD or TKD
Individuals using the SKD or TKD should try to have body composition measured at
consistent times whenever it is done. As large changes in body weight and water are not
occurring (as with the CKD), it is not that critical when skin folds are taken.
160
Skin folds on the CKD
As with the scale on the CKD (see above), to get the most out of caliper measurements, it
is recommended that they be taken at consistent times during the week. Although fat cells
contain very little water, changes in hydration level (especially water under the skin) does seem
to affect skinfold readings. Comparing a set of measurements taken on Monday to another set
taken on Friday may give inaccurate results. Rather, measurements taken on Monday should be
compared to measurements taken on the following Monday, measurements taken on Friday to
measurements taken the following Friday. Some tips for getting the most out of skinfolds on the
CKD appear below (guidelines for pre-contest bodybuilders appear in chapter 30).
1. Weigh and take skin folds the morning of the last low-carbohydrate day of the week. This will
show a dieter at their leanest and give the lowest bodyfat percentage and body weight (if they use
the equations).
2. Measure skinfolds and weight the morning after the end of the carb-loading phase. Due to
shifts in water weight, and depending on the changes in water under the skin, this will give the
highest skinfold measurements and body weight.
Selecting calipers
Calipers vary greatly in price, quality and accuracy. The inexpensive one-site click-type
calipers (which click to indicate when the measurement is made) have proven to be inaccurate.
Oftentimes they show no change in skinfolds when other, more accurate sets of calipers show
obvious changes. They are not recommended.
The most expensive, and most accurate caliper is the Lange caliper. However, it is cost
prohibitive for most people. A good choice for a home caliper is the Slimguide caliper available
from many different sources (see appendix 2 for resources). Its measurements agree quite
closely with Lange calipers but at about one fourth the cost (approx. $30-40).
The Tape Measure
Many individuals will not have access to the equipment necessary to get accurate body
composition measurements. In this case, a very rough estimate of changes in body composition
can be made by using a measuring tape.
As with the scale and skin fold measurements, the tape measure should be used at a
consistent time of the week, generally when weight is measured. Typical sites to measure are:
Chest: taken at nipple level
Arms: taken in the middle of the arm
Abdomen: taken at the level of the belly button
Hips: taken at the largest diameter of the buttocks
Thigh: taken halfway between the knee and where the thigh joins the hip
Calf: taken at the largest diameter of the calf
161
The biggest problem with the tape measure is obtaining consistent tension as it is quite
easy to pull the tape tighter to get a smaller measurement. Ideally, the tape should be pulled just
tight enough that it slightly depresses the skin. Another option is to have someone else take the
measurements.
Also as discussed in chapter 8, keep in mind that changes in the tape measure are affected
by changes in muscle mass. Those starting an exercise program often gain muscle more quickly
than they lose bodyfat. This can show up as a temporary increase in tape measurements.
Section 2: Measuring ketosis
Whether correct or not, many ketogenic diets tend to live or die by the presence of ketones
in their urine. The presence of ketosis, which is indicative of lipolysis can be psychologically
reassuring to ketogenic dieters. However it should be noted that one can be in ketosis, defined as
ketones in the bloodstream, without showing urinary ketones. Since dieters will not be able to
determine blood ketones, other methods are necessary. The two measurement tools which most
individuals will have access to are Ketostix (tm) and glucometers, which are small machines used
by diabetics to measure blood glucose level. Both are discussed below.
Ketostix (tm)
Probably the most common tools used by ketogenic dieters are Ketostix (tm) or Diastix
(tm), which measure the urinary concentrations of either ketones or ketones and glucose
respectively. Typically, they are used by Type I diabetics for whom the presence of high urinary
ketones/glucose can indicate the start of a diabetic emergency. Since a non-diabetic individual
shouldn’t show glucose in the bloodstream, there is no reason for most ketogenic dieters to use the
Diastix (tm). Only Ketostix (tm) are discussed here.
Ketostix (tm) use the nitroprusside reaction, which reacts to the presence of acetoacetate,
to indicate the concentration of urinary ketones. Depending on the concentrations of
acetoacetate, the Ketostix (tm) react by turning various shades of purple with darker colors
indicating greater concentrations.
Since Ketostix (tm) only register relative concentrations, rather than absolute amounts,
changes in hydration state can affect the concentration of ketones which appear. A high water
intake tends to dilute urinary ketone concentrations giving lighter readings.
Ketostix (tm) are typically used to indicate that one’s diet is truly inducing a state of
ketosis. The problem is that Ketostix (tm) are a only an indirect way of measuring ketosis. Recall
from chapter 4 that ketosis is technically defined by the presence of ketones in the bloodstream
(ketonemia). Ketones in the urine simply indicate an overproduction of ketones such that excess
spill into the urine. So it is conceivable for someone to be in ketosis without showing urinary
ketones.
162
Some individuals can never get past trace ketosis, while others always seem to show
darker readings. There seems to be little rhyme or reason as to why some individuals will always
show deep concentrations of urinary ketones while others will not. Some will show higher urinary
ketones after a high fat meal, suggesting that dietary fat is being converted to ketones which are
then excreted. Consuming medium chain triglycerides (MCT’s) has the same effect. Other
individuals seem to only register ketones on the stick after extensive aerobic exercise. Finally,
there appear to be daily changes in ketone concentrations, caused by fluctuations in hormone
levels. Generally ketone concentrations are smaller in the morning and larger in the evening,
reaching a peak at midnight. Many individuals report high ketones at night but show no urinary
ketones the next morning while others report the opposite.
No hard and fast rules can be given for the use of Ketostix (tm) except not to be obsessive
about them. In the same way that the presence of ketones can be psychologically reassuring,
the absence of ketones can be just as psychologically harmful. It is easy to mentally shortcircuit by checking the Ketostix (tm) all the time.
A popular idea is that the deeper the level of ketosis as measured by Ketostix (tm), the
greater the weight/fat loss. However there is no data to support or refute this claim. While some
popular diet authors have commented that urinary ketone excretion means that bodyfat is being
excreted causing fat loss, this is only loosely true in that ketones are made from the breakdown of
fat in the liver. The number of calories lost in the urine as ketones amounts to 100 calories per
day at most.
Anecdotally, higher levels of urinary ketones seem to be indicative of slower fat loss.
Individuals who maintain trace ketosis seem to lose fat more efficiently although there is no
research examining this phenomenon. A possible reason is this: high levels of ketones in the
bloodstream raise insulin slightly and block the release of free fatty acids from fat cells. This
seems to imply that higher levels of ketones will slow fat mobilization.
The ideal situation would seem to be one where trace ketosis (as measured by Ketostix
(tm)) is maintained, since this is the lowest level of ketosis which can be measured while still
ensuring that one is truly in ketosis. This should be indicative of relatively lower blood ketone
concentrations, meaning that bodyfat can be mobilized more efficiently.
How to use Ketostix (tm)
To measure the level of urinary ketones, the Ketostick should be removed from the
package and then the package closed. The reagent end of the stick should not be touched. The
Ketostick should be passed through the stream of urine, wetting the reactive end of the stick.
After 15 seconds have passed, the stick is compared to the chart on the side of the bottle of
Ketostix (tm) giving a rough indication of the concentration of urinary ketones.
Again, please note that the lack of urinary ketones does not automatically mean that one
does not have ketones in the bloodstream, simply that no excess are being excreted. Some
individuals will show urinary ketones initially but show negative ketones at later tests. Assuming
that something has not been done that would disrupt ketosis, such as eating carbohydrates,
dieters should not assume that the lack of a reaction on the Ketostix (tm) means that they are
out of ketosis.
163
Ketostix (tm) seem to have their greatest use for individuals just starting the diet. After a
period of time on a ketogenic diet, most individuals can ‘feel’ when they are in ketosis. Many
individuals get a metallic taste in their mouth, or report a certain smell to their breath or urine,
making Ketostix (tm) unnecessary.
Glucometers
Due to the somewhat indirect method of measuring ketosis with Ketostix (tm), some
individuals have tried to use glucometers, small handheld devices which measure the amount of
glucose in the bloodstream, to check the progress of their diet. Glucometers are most typically
used by diabetics who must ensure that their blood glucose does not rise too high which can cause
a host of health complications. Non-diabetic individuals will maintain normal blood glucose levels
between 80-120 mg/dl under most conditions.
Contrary to popular belief, blood glucose never drops that low on a ketogenic diet. Even
during total fasting, blood glucose maintains a level of roughly 65-70 mmol/dl. Depending on the
protein intake of a ketogenic diet, blood glucose will be higher, close to the low normal levels of 7585 mmol/dl. Many individuals have measured blood glucose at a relatively normal value of 80
mmol/dl while showing urinary ketones and wondered if they were truly in ketosis. The answer is
yes. With the exception noted previously for N-acetyl-cysteine, the presence of urinary ketones
is indicative that a dieter is in ketosis, regardless of their blood glucose levels.
Additionally, glucometers can have an accuracy range of plus or minus 30 mmol/dl. For a
diabetic individual trying to determine how much insulin is necessary to bring blood glucose down
from 300 (or higher) to a normal level, an inaccuracy of 30 points is not a problem. For nondiabetics, the inaccuracies inherent in most glucometers make them a useless addition to a
ketogenic diet. They are not recommended.
Section 3: Tools For measuring your diet
There are only two items which are truly necessary for measuring the diet. The first and
arguably the most important is some sort of calorie/nutrient counter book. Many individuals are
confused as to which foods have carbs in them and which foods do not. And while most foods are
labeled with the proportions of carbohydrate, protein and fat many foods are not, especially
meats and cheeses. In this case a food count book can be invaluable to ensure that carbohydrate
intake stays low during a ketogenic diet. Although there are carbohydrate counter books
available which only provide information on carbohydrate content, it is recommended that dieters
obtain a book providing protein and fat gram information as well.
For those wishing to be meticulous about their diet, a full set of measuring spoons, cups, as
well as a food scale is necessary. These can be bought at a variety of places from specific kitchen
shops to grocery stores. With time, most individuals should be able to estimate their daily food
intake but it is recommended that foods be measured initially. The generally calorically dense
164
nature of many ketogenic foods makes it easy to exceed daily caloric requirements.
As a final option, there are computer programs that generally contain food databases
which can be used to develop diet plans. As well, many individuals have used spreadsheet
programs to track their intake of calories, protein, carbohydrate and fat.
Summary
A variety of tools can be used by ketogenic dieters to gauge progress and measure the
effects of changes in the diet. These include a variety of ways to measure body composition,
including the scale, skinfold calipers and the tape measure. The presence of ketosis can be
measured with Ketostix (tm), which indicate the concentration of urinary ketones. While some
have tried to use a glucometer, which measures blood glucose concentrations, they have proven
inaccurate and are not recommended. Tools to measure food intake, as well as nutrient levels of
foods, are recommended especially in the beginning stages of the diet.
165
Chapter 16:
Final considerations
As stated previously, this book is not meant to argue for or against the ketogenic diet as
the ideal diet for weight/fat loss or any other application. Rather it is an attempt to present a
comprehensive account of what occurs during a ketogenic diet, and to dispel the many
misconceptions surrounding the state of dietary ketosis. Additionally, specific guidelines have
been offered for those individuals who have decided to do a ketogenic diet.
As discussed in chapter 6, it is impossible to state unequivocally whether a ketogenic diet
is better or worse in terms of fat loss and protein sparing than a carbohydrate-based diet with a
similar calorie level. This is largely due to the paucity of applicable studies done with reasonable
calorie levels and adequate protein. In essence, the definitive studies, which would apply to the
calorie and protein recommendations being made in this book, have not been done.
It is this author’s opinion that a variety of dietary approaches can be effective and that no
single dietary approach is optimal for every goal. For example, a bodybuilder dieting for a contest
has different dietary needs than an endurance athlete preparing for an event or the average
person trying to lose a few pounds. As with any approach to fat loss, the ketogenic diet has
various benefits and drawbacks. Although most of these have been mentioned within a specific
context in previous chapters, they are briefly discussed again. Additionally, certain medical
conditions preclude the use of a ketogenic diet, which are discussed in the next section.
Section 1: Comparison of ketogenic to
balanced dieting
For any diet to be effective, it must match not only the individual’s physiology but also
their psychology. The best diet in the world will not work if an individual does not adhere to it.
Like any dietary approach, ketogenic diets have benefits and drawbacks in this regard, which are
discussed here. Note that this section is derived from mostly anecdotal sources rather than from
research.
Food issues
The limited food choices on a ketogenic diet can be considered either good or bad. On the
one hand, some individuals seem to do better with diets that are very restrictive, as it simplifies
meal planning. The limited food choices on a ketogenic diet make it easier for some individuals to
adhere to the diet. By the same token, this limitation in food choices can make the diet
monotonous. With some creativity, low-carbohydrate food can be made more interesting,
especially with the increased availability of low-carbohydrate cookbooks.
166
Similarly, the limited food choices of a ketogenic diet may mean that certain nutrients,
namely those found in fruits and vegetables, are not consumed. As discussed in chapter 7, recent
research has focused on the potential health benefits of phytonutrients, which are only found in
vegetables and fruits. Since some carbohydrates are allowed during any ketogenic diet, limited
intake of these nutrients is possible, but will be less than could be consumed on a balanced diet.
Finally, some individuals may find it difficult to resume balanced dieting after long periods
on a ketogenic diet. Since many individuals gravitate towards a ketogenic diet out of a difficulty,
whether real or perceived, in handling dietary carbohydrates (i.e. hypoglycemia,
hyperinsulinemia), reintroducing carbohydrates in controlled amounts may be difficult. By the
same token, some individuals find it easier to control a previously excessive carbohydrate intake
after a ketogenic diet. For example, many individuals have reported a decreased taste for refined
carbohydrates. This is discussed in greater detail in chapter 14.
The CKD: The ultimate solution?
To a great degree, the CKD avoids most of the problems discussed above. By allowing one
or more days of essentially ad-libitum eating, many of the above issues are eliminated. Monotony
is avoided since all food choices are allowed during the carb-up. Additionally, there can be some
consumption of fruits and vegetables during the carb-up. However, the CKD carries its own
particular problem for some people.
Many individuals see the carb-up as an ‘eat-anything day’ of their diet. Some individuals
have reported consuming upwards of 10,000 calories in a 24 hour time span during the carb-up, a
practice which is most likely unhealthy. In a sense, this makes the CKD look very much like a
binge-purge cycle with alternations of strict dieting with free-for-all eating. This may have the
potential to engender poor eating habits when the diet is ended. Ultimately, this is not different
from many fat-loss diets, especially those which are very restrictive.
Body composition issues
The primary selling point of the ketogenic diet is that it causes greater fat loss while
sparing protein losses. As discussed previously, this stance cannot be unequivocally defended
based on the data available. Anecdotally, many individuals find that fat loss is more effective and
that less muscle is lost with a ketogenic diet compared to more traditional dieting. This especially
applies to bodybuilders, who may be starting with far more muscle and less bodyfat, than the
average dieter. However this is not reported universally and most likely reflects differences in
individual physiology, insulin sensitivity, and other factors.
Additionally, many dieters are drawn to the ketogenic diet due to the rapid initial weight
loss which occurs from water loss. This is a double-edged sword. On the one hand, a rapid initial
drop in bodyweight can be psychologically very encouraging for individuals who have battled with
weight loss. By the same token, the rapid weight gain which can occur with even a small
carbohydrate intake can be just as psychologically devastating. Understanding the distinction
between weight loss and fat loss, as discussed in chapter 8, should help to avoid this problem.
167
Section 2: Choosing a diet
Three related but distinct dietary approaches are described in previous chapters. These
are the standard ketogenic diet (SKD), the targeted ketogenic diet (TKD), and the cyclical
ketogenic diet (CKD). Although it is not this book’s goal to suggest that dieters choose a
ketogenic diet over another dietary approach, a question which does arise is which of the three
ketogenic diets is appropriate for a given individual. The major determinants of which diet is the
best choice for any given individual are the amount and type of exercise being done, as well as
some certain health related issues.
The SKD
The SKD described in this book is no different than a myriad of other dietary approaches
which are currently in vogue, although greater specifics regarding calorie and protein intake have
been given. The SKD is most appropriate for individuals who are either not exercising, or who are
only doing low- or moderate-intensity aerobic exercise. As discussed in chapter 18, a diet devoid of
carbohydrates can sustain this type of exercise. However those individuals who are performing
any form of high-intensity exercise such as weight training will not be able to use the SKD for any
extended periods of time as exercise performance will suffer. Additionally, many individuals
involved in long-duration endurance activities tend to find that performance is enhanced by
adding carbohydrates to their diet.
The CKD
The CKD alternates periods of ketosis with periods of high carbohydrate eating. Due to the
structure of the CKD, it is critical to fully deplete muscle glycogen between carb-up periods. For
individuals wishing to use a 7 day cycle (5-6 days of ketosis, 1-2 days of carbohydrates), this
necessitates a fairly high volume and intensity of training. This makes the 7-day CKD most
appropriate for fairly advanced exercisers and weight trainers. Beginning exercisers may not be
able to do the amount of exercise necessary, at a sufficient intensity, to fully deplete glycogen.
Individuals who are using the ketogenic diet for various health reasons (such as
hyperinsulinemia or hypertension) may find the CKD unworkable as the hormonal response to
high-carbohydrate consumption can trigger the exact health consequences which are being
treated with the ketogenic diet. Additionally, some individuals find that their food intake is
uncontrollable during a full carb-load, for either psychological or physiological reasons. In this
case, a CKD is not an appropriate dietary choice.
The TKD
Within certain limits, the TKD can sustain high intensity exercise performance, although
perhaps not as well as the CKD. The TKD is generally most appropriate for beginning and
168
intermediate weight-trainers, as it will allow them to sustain exercise intensity without disrupting
ketosis for long periods of time. Additionally those individuals who cannot use the CKD for health
reasons, but who are also involved in high-intensity exercise, may find the TKD appropriate.
Other options
The three approaches described in this book are by no means the only ways to implement
a ketogenic diet and individuals may need to experiment to determine what works best for them.
Anecdotally, some individuals have found a 10-day CKD cycle to be the most effective.
Additionally, individuals who cannot do a full carb-load every 7 days have done a 14 day cycle
with a carb-load every other week. This allows some of the freedom of the carb-up, without
requiring the large amount of exercise needed.
Which diet gives the best fat loss?
A question which is often asked is whether the SKD, TKD, or CKD yields the best fat loss.
This is not really a question with a single answer. Ultimately, fat loss is going to be determined
primarily by caloric considerations. In the long run, a SKD, TKD or CKD at the same calorie level
will probably yield fairly similar fat loss.
Section 3: Contraindications to the ketogenic diet
Like any dietary approach, the ketogenic diet is not universally applicable. Individuals
with certain preexisting medical conditions should seriously consider whether an extreme
approach such as the ketogenic diet is appropriate. Although little data is available on this topic,
some major conditions which might preclude the use of a ketogenic diet are discussed below.
Kidney problems
Although no data exists to suggest that the ‘high protein’ nature of a ketogenic diet is
problematic for individuals with normal kidney functioning, high protein intake may cause
problems for individuals with preexisting conditions. Therefore, individuals who are prone to
kidney stones should seriously consider whether the ketogenic diet is appropriate for them. The
slight dehydration which occurs coupled with a high protein intake may increase the risk of
stones. For individuals on the ketogenic diet, it is imperative to drink sufficient water and to be
aware of the potential for problems.
169
Diabetes
As previously discussed, Type I (insulin dependent) diabetics may have problems with
ketoacidosis if insulin levels drop too low. Since these individuals rely on injections to normalize
insulin, a ketogenic diet conceivably poses no problems. However, the lack of carbohydrates, as
well as changes in insulin sensitivity, on a ketogenic diet will affect insulin requirements (1). Any
Type I diabetic who wishes to try a lowered carbohydrate diet must consult with their physician
or health provider to determine changes in their insulin regimen.
Type II (non-insulin dependent) diabetics are frequently drawn to low carbohydrate or
ketogenic diets as they may help to control blood glucose and insulin levels (2). Individuals with
severe hyperinsulinemia and/or hypoglycemia will need to be careful when implementing a
ketogenic diet to avoid problems with blood sugar crashes and related difficulties.
Individuals with Type II diabetes may have greater difficulty establishing ketosis, as some
data suggests that liver glycogen is more difficult to deplete (3,4). Additionally, it has been found
that obese individuals, who typically suffer from insulin resistance, have greater difficulty
establishing ketosis (5). This points even more to the importance of exercise to help deplete liver
glycogen and establish ketosis.
Coronary artery disease/high cholesterol
The impact of a ketogenic diet on blood cholesterol is discussed in detail in chapter 7. For
many individuals, the ketogenic diet causes an improvement in blood lipid levels, especially in
cases where bodyfat is lost. However, this is not a universal finding. Individuals with diagnosed
coronary artery disease or high blood cholesterol must monitor their blood lipid levels for negative
changes. Individuals who show negative changes can try decreasing saturated fat intake, while
increasing unsaturated fat. Additionally, a fiber supplement may be helpful. If blood cholesterol
levels continue to respond negatively, the ketogenic diet should be abandoned.
Gout
Individuals with a past history or genetic propensity for gout should seriously consider
whether or not a ketogenic diet is appropriate. As discussed previously, a rise in uric acid levels
occurs when the ketogenic diet is started and this may trigger gout in predisposed individuals.
Since even small amounts of dietary carbohydrates (5% of total calories) appear to alleviate
problems with uric acid buildup, a less restrictive ketogenic diet may be possible for individuals
who are prone to gout.
Pregnancy
This author is unaware of any research looking specifically at the effects of the ketogenic
diet in pregnant humans. However, malformations of the neural tube occur with increased
170
frequency in diabetic mothers and exposure of pregnant female rats to high ketone levels can
increase the risk of these same neural tube defects, suggesting that ketones may be a cause (6).
Additionally, it appears that glucose is the primary fuel for the developing fetus (7).
Considering the above data, as well as the potential harm which might occur to an unborn
child, a ketogenic diet is not considered appropriate during pregnancy. In fact, any diet whose aim
is weight or fat loss is inappropriate during pregnancy as diet should be optimal to support the
developing fetus and the mother.
Epilepsy
Although the ketogenic diet has shown great impact in the treatment of childhood epilepsy,
the diet used for epilepsy is significantly different than the diet described in this book.
Additionally, implementation of the ketogenic diet for therapeutic purposes requires medical
supervision. Under no circumstances should individuals attempt to implement the ketogenic diet
for the treatment of epilepsy without medical supervision.
Adolescents
Although the epileptic diet is used in children under the age of 10, its use in adolescents is
less well studied. From the standpoint of fat loss, the pediatric epilepsy diet is used for weight loss
if necessary, by adjusting calories (8). Additionally, the protein sparing modified fast has shown
some benefits in treating morbid childhood obesity (9). Although adolescent obesity is increasing,
parents should be careful in self-administering diets, due to the possibility of stunted or altered
growth. Due to the lack of data on the CKD, and due to the hormonal fluctuations which occur,
its use is not recommended in adolescents.
Summary
There are certain medical conditions which either directly preclude the use of the ketogenic
diet, or that warrant serious consideration prior to beginning such a diet. While there is no data
for a majority of disease states, individuals should exercise caution prior to making any large
scale changes in diet. When in doubt, the proper medical authorities should be consulted and no
self-diagnosis should be made.
References Cited
1. Bistrian B. et. al. Nitrogen metabolism and insulin requirements in obese diabetic adults on a
protein-sparing modified fast. Diabetes (1976) 25: 494-504.
2. Grey NJ and Kipnis DM. Effect of diet composition on the hyperinsulinism of obesity.
New Engl J Med (1971) 285: 827
3. Clore JN et. al. Evidence for increased liver glycogen in patients with noninsulin-dependent
diabetes-melliture after a 3-day fast. J Clin Endocrinol Metab (1992) 74: 660-666.
171
4. Clore J and Blackard W. Suppression of gluconeogenesis after a 3-day fast does not deplete
liver glycogen in patients with NIDDM. Diabetes (1994) 43: 256-262.
5. Mohammadiha H. Resistance to ketonuria and ketosis in obese subjects. Am J Clin Nutr
(1974) 27: 1213-1213.
6. Mitchell GA et al. Medical aspects of ketone body metabolism. Clinical & Investigative
Medicine (1995) 18: 193-216.
7. Robinson AM and Williamson DH. Physiological roles of ketone bodies as substrates and
signals in mammalian tissues. Physiol Rev (1980) 60: 143-187.
8. “The Epilepsy Diet Treatment: An introduction to the ketogenic diet” John M. Freeman, MD;
Millicent T. Kelly, RD, LD ; Jennifer B. Freeman. Demos Vermande, 1996
9. Willi SM et. al. The effects of a high-protein, low-fat, ketogenic diet on adolescents with morbid
obesity: Body composition, blood chemistries, and sleep abnormalities. Pediatrics (1998)
101: 61-67.
172
Part V:
Exercise Physiology
Chapter 17: Muscular physiology and energy
production
Chapter 18: The physiology of aerobic exercise
Chapter 19: The physiology of interval training
Chapter 20: The physiology of strength training
Chapter 21: The effects of exercise on ketosis
Chapter 22: Exercise and fat loss
As more and more research is performed, the conclusion is fairly unequivocal: if there is
one thing that improves overall health, it is regular exercise. The best diet and all of the
supplements in the world cannot make up for a lack of regular activity.
Exercise has the potential to impact numerous facets of daily life. Some of the benefits of
regular exercise are an increase in overall health, stronger bones, a stronger heart and lungs,
improved cholesterol levels, etc. This book is not going to spend time trying to convince
individuals that they should exercise. As discussed in chapter 14, beyond the health-related
reasons to exercise, dieting without exercise has an extremely low rate of long-term success.
Unless there is some specific reason that exercise can not be performed, such as an injury,
exercise should be considered a mandatory part of any attempt to lose bodyfat.
There are three general categories of exercise which are discussed in this book. They are
aerobic exercise (such as walking, swimming or bicycling), interval training (sprinting), and
resistance training (weight training). The next 6 chapters focus on the underlying physiology of
exercise, especially as it pertains to the ketogenic diet. The impact of exercise on ketosis and fat
loss is also addressed.
173
Chapter 17:
Basic muscular physiology
and energy production
The human body contains roughly 600 muscles, ranging from the large muscles of the
quadriceps (front thigh) to the small muscles that control the movement of the eyes. All force
production depends on the ability of these muscles to contract and cause movement within our
body. All forms of exercise ultimately depend on force production by muscles so it is necessary to
briefly discuss some basic muscular physiology and detail about force production. Additionally,
basic concepts regarding energy production is discussed.
Section 1: Muscle Fiber Types
There are three different types of muscle fibers. Each possesses its own specific
characteristics. The distinction between different fiber types is important from the standpoint of
understanding the adaptations which occur during exercise as well as what fuels are used.
Types of muscle fibers
Human skeletal muscle contains three distinct types of fibers (1): Type I or slow oxidative
(SO), Type IIa or fast oxidative glycolytic (FOG), and Type IIb or fast glycolytic (FG).
Each fiber type has distinct physical and physiological characteristics (such as preferred
fuel) which determine the type of activity they are best suited for. Depending on the type of
exercise done, fibers will adapt accordingly (adaptations to specific types of exercise are
addressed in separate chapters). A summary of the fiber types and their primary metabolic
characteristics appears in table 1.
Table 1: Comparison of various characteristics of fiber types
Metabolic Characteristic
Oxidative capacity (a)
Glycolytic capacity (b)
Mitochondrial density
Capillary density
Speed of contraction
Resistance to fatigue
Time to fatigue
Force production capacity
Growth capacity
Type I
Type IIa
Type IIb
High
Low
High
High
Slow
high
4’+
low
low
Medium
High
Medium
Medium
Fast
moderate
about 4’
moderate
moderate
Low
Highest
Low
Low
Fast
low
about 2’
high
high
174
a. Oxidative capacity refers to a muscle’s ability to generate energy through the aerobic
metabolism of fats and glycogen (see fuel metabolism section).
b. Glycolytic capacity refers to a muscle’s ability to generate energy through the anaerobic
metabolism of glycogen and ATP and CP.
Source: “Physiology of Sport and Exercise” Jack H. Wilmore and David L. Costill. Human
Kinetics Publishers 1994. ; “Exercise Physiology: Human Bioenergetics and it’s applications”
George A Brooks, Thomas D. Fahey, and Timothy P. White. Mayfield Publishing Company 1996. ;
Eric Hultman “Fuel selection, muscle fibre” Proceedings of the Nutrition Society (1995) 54: 107121.
Overview of fiber types
Type I muscle fibers are endurance fibers. They utilize primarily free fatty acids (FFA) for
fuel, fatigue slowly but can’t generate much force. They are used primarily during low-intensity,
long-duration activity such as walking. Type I fibers have the least capacity for muscle growth of
the fiber types. Type I fibers are sometimes called red fibers because of their reddish color under
a microscope.
Type IIb muscle fibers are high force fibers. They generate more force but fatigue quickly.
Type IIb fibers use glycogen as their primary fuel, generating lactic acid as a byproduct. Type IIb
fibers are primarily used for high-intensity, high-force, short-duration activities such as weight
training and sprinting. They have the greatest capacity for growth and appear white under a
microscope.
Type IIa fibers are intermediate fibers. They have medium-force capacity and fatigue
characteristics. They can derive energy either from glycogen or fat depending on the type of
activity that is being done. They have a growth capacity between Type I and IIb fibers and
appear pinkish under a microscope.
Most people have roughly equal numbers of Type I and Type II fibers although elite
athletes may have extreme distributions of fibers (2). Typically, endurance athletes have a
preponderance of Type I fibers while elite strength athletes are Type II fiber dominant.
Generally speaking, fibers do not change from one type to another but the overall
characteristics of the fibers can shift towards more aerobic or anaerobic (1,5). The effects of
different types of training on fiber characteristics appears in figure 1.
Figure 1: Possible interconversion of muscle fiber characteristics with training
Type of activity
Fiber Characteristics
Endurance training
Type I
Interval training
Type IIa
Weight training
Type IIb
Section 2: Muscle Fiber Recruitment
The concept of muscle fiber recruitment is important to understand for this reason:
different types of exercise rely on each muscle fiber type to a greater or lesser degree. The
175
utilization of different fiber types (due to differences in physical characteristic) greatly affects the
fuel used, the adaptations seen to training, and the effects of a ketogenic diet. All of the
information which follows regarding exercise types and the necessity of carbohydrates or not is
ultimately tied into the issue of recruitment.
Recruitment and rate coding
The body generates force through one of two different mechanisms. It can either recruit
more fibers (called recruitment) or send more signals so that the fibers contract more strongly
(called rate coding). For large muscles, the body uses recruitment up to roughly 80-85% of
maximal force production at which point all fibers available have been recruited (6). Above this
point, force production is accomplished solely through rate coding. Untrained individuals may not
be able to recruit all of their Type IIb muscle fibers. With regular training, complete recruitment
can be developed (7,8,9).
Muscle fiber recruitment and the Size principle (2)
Fibers recruit from smallest (Type I) to largest (Type IIb) according to the Size Principle.
At low intensities (i.e. slow walking or about 20% of maximal force), only Type I fibers are
recruited. As intensity increases (i.e. jogging), more Type I fibers are recruited until they can no
longer provide sufficient force. At this point, some Type IIa fibers are recruited. As force
production requirements continue to increase towards maximal levels, Type IIb fibers are
recruited. Please note that recruitment is determined by force, not velocity. Near maximal slow
movements will recruit Type IIb fibers as long as force requirement are high enough (see below).
With regards to specific fiber types, Type I fibers are recruited from zero to about 60% of
maximum force production capacities. Around 20% of maximal force, some Type IIa fibers are
recruited and are maximally recruited around 75-80% of maximal force. Type IIb fibers do not
begin to recruit until about 60-65% of maximal force production and continue to be recruited up to
about 85% of max. as stated before. An overview of recruitment of different fiber types appears
in figure 2.
% of Fibers used
0 20 40 60 80 100
Figure 2: Relationship between force requirements and fiber recruitment
FG
FG
FOG
SO
0 20 40 60 80 100
% Max Contraction
176
With few exceptions (most of which would never occur during normal training), it is
impossible to recruit Type II fibers before Type I fibers. The only case where Type II fibers are
recruited without Type I fibers being recruited is during eccentric muscle actions (see chapter
20).
In summary:
At low intensities of exercise (i.e. walking), only Type I fibers are recruited.
At moderate intensities (i.e. jogging, weight training), Type I and IIa fibers are recruited.
At maximal intensities (i.e. sprinting, weight training), all fiber types are recruited.
Section 3: An overview of exercise
and energy production
Exercise is classified into two main categories: aerobic or anaerobic. These categories
differ in intensity, duration and the way that energy is produced by the body. Generally speaking,
aerobic exercise relies on energy pathways that require oxygen (oxidative metabolism).
Anaerobic exercise relies on energy pathways that do not require oxygen (glycolytic metabolism).
Energy production during exercise
The only fuel source that can be used directly by muscles is a compound called adenosinetri phosphate (ATP). During exercise, ATP is broken down to adenosine-diphosphate (ADP) in the
muscles and must be regenerated. However, there is only enough ATP stored in the muscle for
roughly 6 seconds of effort. There are four different energy systems which regenerate ATP during
exercise (2), and each of the energy systems is examined in more detail in subsequent chapters.
The contribution of each energy system during exercise depends primarily on the intensity and
duration of the activity, but other factors such as gender, diet and training status also play a role.
1. ATP-CP system: From one to twenty seconds of activity, the body relies on stored ATP and
creatine phosphate (CP) to provide fuel. This energy pathway is used primarily during maximal
intensity exercise such as sprinting and low rep weight training. This reaction does not require
the presence of oxygen (i.e. it is anaerobic).
2. Anaerobic glycolysis: From twenty to sixty seconds, the body breaks down carbohydrate stored
in the muscle (called glycogen) for energy resulting in the production of lactic acid. Lactic acid
causes a burning sensation and may be one cause of fatigue during exercise. Anaerobic glycolysis
will predominate during near maximal intensity exercise such as a 400 meter sprint or medium
rep weight training (6-20 reps). Anaerobic glycolysis does not require oxygen to proceed.
177
3. Aerobic glycolysis: During exercise of about 20’ maximal duration, the muscle primarily breaks
down stored muscle glycogen as well as blood glucose to provide energy. This produces pyruvate
as an end product which is used to make more energy. This energy system is used during
activities such as a 2 mile run.
4. Aerobic lipolysis: During exercise of longer than 20’, the body will break down free fatty acids to
produce energy. This energy system is used during low intensity aerobic activities.
The body may also use other fuel sources (ketones, protein, and intramuscular triglyceride)
during exercise to varying degrees. The involvement of each fuel is discussed in specific
situations. A brief overview of the four energy systems and their duration appears in table 2.
Summary
Muscle fibers are typically delineated into three different types, depending on their
characteristics. During exercise, depending on the intensity, the various muscle fibers are
recruited as necessary to produce force. As muscles produce force, they utilize the fuel
adenosine-triphosphate (ATP). Since there is limited ATP stored in the muscle itself, a variety of
energy systems exist to produce more ATP. The energy system which is used will depend on the
duration and intensity of exercise.
Table 2: Overview of energy systems for different activities
Energy System
ATP-CP
Time
1-20”
Anaerobic glycolysis
20-60”
Aerobic glycolysis
FFA Oxidation
1-10’
10’ and up
Exercise Intensity Example Activity
Maximal
Shot putting, low rep
weight training (1-5 reps)
Near maximal
400 meter sprint, medium
rep weight training (6
reps+)
High
2 mile run
Low
slow walking, jogging
Source: Hawley JA and Hopkins WG. Aerobic glycolytic and aerobic lipolytic power systems: A
new paradigm with implications for endurance and ultraendurance events. Sports Med (1995) 19:
240-250.
References Cited
1. “Designing Resistance Training Programs, 2nd edition” W. Kraemer and S. Fleck, Human
Kinetics 1996.
2. “Physiology of Sport and Exercise” Jack H. Wilmore and David L. Costill. Human Kinetics
Publishers 1994.
3. “Exercise Physiology: Human Bioenergetics and it’s applications” George A Brooks, Thomas D.
Fahey, and Timothy P. White. Mayfield Publishing Company 1996.
178
4. Hultman E. Fuel selection, muscle fibre. Proc of the Nutrition Society (1995) 54: 107-121.
5. Baumann H et. al. Exercise training induces transitions of myosin isoform subunits within
histochemically typed human muscle fibers. Pflugers Archiv (1987) 409: 349-360.
6. “Strength and Power in Sport” Ed. P.V. Komi Blackwell Scientific Publications 1992.
7. Behm DG. Neuromuscular implications and adaptations of resistance training. J Strength and
Cond Res (1995) 9: 264-274.
8. Stone WJ and Coulter SP. Strength/endurance effects from three resistance training protocols
with women. J Strength Cond Res (1994) 8: 231-234.
9. “Neuromechanical basis of kinesiology” Roger M. Enoka. Human Kinetics Publishers 1994.
10. Hawley JA and Hopkins WG. Aerobic glycolytic and aerobic lipolytic power systems: A new
paradigm with implications for endurance and ultraendurance events. Sports Medicine
(1995) 19: 240-250.
179
Chapter 18:
The Physiology of Aerobic Exercise
The word ‘aerobic’ literally means ‘with oxygen’ and aerobic exercise is fueled by reactions
which require oxygen to proceed. Typical aerobic activities are walking, running, cycling and
swimming. While activities like basketball and soccer could be considered aerobic (as they rely
on aerobic energy systems), their stop and start nature would cause them to be more typically
referred to as interval training discussed in the next chapter.
We will define aerobic exercise as any activity that is fueled by aerobic energy sources and
only consider exercise such as walking, cycling, etc in this chapter. Aerobic energy pathways
include the breakdown of glycogen, blood glucose, free fatty acids, intramuscular triglyceride,
ketones and protein. The intensity and duration of exercise will determine which of these fuels is
the primary energy source.
Aerobic exercise typically causes heart rate to reach 50% to 80-85% of maximum heart
rate (or about the lactate threshold, defined below). In general, the adaptations to aerobic
exercise are for the body to become more efficient at producing energy aerobically. These
adaptations occur in the enzymes necessary for aerobic energy production as well as in the
muscle and heart. As a general rule, maximal strength and muscle size do not increase with
aerobic exercise.
Section 1: Adaptations to aerobic exercise
Aerobic exercise affects two major tissues in the body: the heart and the muscles. With
regular aerobic training, the heart becomes stronger and more efficient, pumping more blood with
every beat. Heart rate at rest and during exercise decreases indicating a greater efficiency.
Normal resting heart rate is around 70 to 80 beats per minute (bpm), but elite endurance
athletes may have resting heart rates of 40 bpm. (1)
The primary change in the muscle is an increase in the capacity to utilize fats for fuel
during exercise and at rest (2,3), and this adaptation only occurs in the muscles which are trained
(4). For example, when subjects trained the quadriceps of only one leg, that leg’s ability to use
free fatty acids (FFA) increased while the untrained leg did not. (4) This is why running (which
primarily uses the hamstrings and gluteal muscles) does not improve cycling (which primarily
uses the quadriceps) and vice versa.
The main site of aerobic energy production in the muscle is the mitochondria. Regular
training increases the number and activity of mitochondria. (2,5) Training also increases the
number of capillaries in the muscle which deliver blood, oxygen and nutrients to the muscles.
(2,4,6) Finally, the enzymes required for the oxidation (burning) of FFA all increase with regular
aerobic training (2,4,6). These adaptations in the mitochondria and capillaries may also occur as
a result of weight training, especially if high reps and short rest periods are used (see chapter 20
for more information).
180
During aerobic exercise, levels of adrenaline increase, raising heart rate and mobilizing fuel
for energy. However, regular aerobic training decreases the amount of adrenaline released during
exercise (7). This is accompanied by greater oxidation of FFA and a larger proportion of the FFA
oxidized comes from intramuscular triglycerides (3,7). Thus, despite lower levels of adrenaline,
there are higher rates of fat breakdown indicating an increase in tissue sensitivity to adrenaline
(8). These adaptations in adrenaline sensitivity are completed after three weeks of regular
training (3) and last as long as training is performed at least once every four days (9). Individuals
performing aerobic exercise should exercise at least once every four days or these adaptations
begin to disappear. Older individuals typically show a decrease in tissue sensitivity to adrenaline
which may be partially corrected with regular aerobic training.
Finally, chronic aerobic training causes a shift in muscle fiber type from Type IIb towards
Type IIa and I characteristics (10). That is, Type IIb and IIa fibers (which are typically strength
and power oriented), take on the characteristics of Type I fibers (endurance oriented) (2).
Regular aerobic exercise also causes a decrease in fiber size and loss of muscle (6,11).
Individuals in strength/power sports (powerlifting, etc) as well as bodybuilders should incorporate
aerobic training sparingly to avoid a loss of muscle size and strength.
Section 2: Aerobic Fuel Metabolism
Aerobic exercise can rely on multiple fuel sources for energy. These include glycogen (a
storage form of carbohydrate) in the muscle and liver, free fatty acids (FFA) from adipose tissue,
intramuscular triglyceride (droplets of fat stored within the muscle fibers), ketones and protein.
The use of protein during aerobic exercise has implications for protein requirements, as discussed
in chapter 9. The body’s total stores of each appear in table 1 (reprinted from page 19).
Table 1: Comparison of bodily fuels in a 150 lb man with 22% bodyfat
Tissue
Adipose tissue triglyceride
Carbohydrate stores
Muscle glycogen (normal)
Liver glycogen
Blood glucose
Total carbohydrate stores
Intramuscular TG
Ketones (a)
Muscle protein (b)
Average weight (lbs)
~33
Caloric worth (kcal)
135,000
~ .25
~ .5
0.04
0.8
0.35
Varies
~13
480
280
80
840
1465
Varies
24,000
(a) Ketones rarely provide more than 7-8% of total energy yield even in highly ketotic individuals
(b) Protein only provides 5-10% of total energy yield (up to 13 grams of protein per hour).
Source: “Textbook of Biochemistry with Clinical Correlations 4th ed.” Ed. Thomas M. Devlin.
Wiley-Liss, 1997.
181
An overview of fat and carbohydrate regulation
As at rest, the primary fuels during aerobic exercise are carbohydrate (muscle glycogen
and blood glucose) and FFA (from adipose tissue as well as intramuscular triglyceride) (13,14).
At low intensities, fat is the primary fuel source during exercise. As exercise intensity increases,
glycogen is used to a greater degree. This fact has been misinterpreted by some to suggest that
low-intensity activity is the best choice for fat loss. However, the absolute amount of fat used
during exercise is greater at higher exercise intensities. This topic is discussed in detail in chapter
22.
As exercise intensity increases, less fat and more glycogen is used as fuel. Eventually, as
exercise intensity increases, there is a crossover point where glycogen becomes the primary fuel
during exercise (15). This point corresponds roughly with the lactate threshold, described below.
The increase in glycogen utilization at higher intensities is related to a number of factors
including greater adrenaline release (1,15), decreased availability of FFA (16), and greater
recruitment of Type II muscle fibers (15,17,18). The ketogenic diet shifts the crossover (i.e.
lactate threshold) point to higher training intensities (15) as does regular endurance training
(1,5). As discussed further below, this means that endurance athletes are able to maintain
higher exercise intensities while relying on FFA for energy.
The interactions between fat and carbohydrate utilization during exercise has been studied
extensively. The determining factor of fat versus carbohydrate utilization appears to be related
to glucose availability rather than FFA availability (14,19). When carbohydrates are abundant,
they are the primary fuel for exercise.
As discussed in detail in chapter 3, depleting muscle glycogen and lowering glucose
availability in the muscle and bloodstream increases utilization of FFA while increasing muscle
glycogen stores increases carbohydrate use (and decreases fat utilization) during exercise (20).
Additionally, protein use increases with glycogen depletion.
The proposed reason that high glucose availability may impair fat burning is similar to the
processes which occur in the liver (see chapter 4). High levels of glucose and glycogen raise levels
of malonyl-Coa which inhibits enzymes necessary for the oxidation (burning) of fat for fuel. The
end result is an inhibition of fat oxidation when glucose availability is high and an increase in fat
oxidation when glucose is low (19).
Having discussed some of the general determinants for carbohydrate and fat metabolism
during exercise, we can examine the details of energy production from each fuel source.
Glycolysis
Glycolysis refers generally to the breakdown of carbohydrates for energy. Carbohydrates
are stored in the muscle and liver (in long chains called glycogen) and also circulate in the blood as
glucose. During exercise, glycogen or glucose is broken down to provide ATP as shown in figure 1.
182
Figure 1: Pathway of glucose/glycogen breakdown
glycolytic enzymes
(Aerobic)
Glucose/Glycogen
ATP + Pyruvate
Krebs cycle, liver, other
pathways
(Anaerobic)
Lactate/lactic acid
During exercise below the lactate threshold (discussed below), glycolysis results primarily
in the production of pyruvate which can be reused in the mitochondria to produce more ATP.
Alternately pyruvate is released into the bloodstream where it travels to the liver and is
converted to glucose (to be released back into the bloodstream) through a process called
gluconeogenesis. Regardless of the ultimate fate of pyruvate, it is reused to produce ATP. The
overall energy yield of aerobic glycolysis is 36-39 ATP molecules per molecule of glycogen or
glucose broken down (5). This is sometimes called slow glycolysis.
At higher exercise intensities, pyruvate is converted to lactic acid, which lowers pH inside
the muscle and causes a burning sensation. Lactic acid separates in the muscle to lactate (a
salt) and H+ (a proton). The accumulation of H+ lowers the pH of muscle, inhibiting further
energy production. High levels of lactic acid/lactate are likely involved in fatigue during highintensity aerobic exercise. The production of lactate from the breakdown of glycogen or glucose is
referred to as fast glycolysis (5).
It should be noted that lactate is always being produced by the muscle to a small degree.
Lactate levels are low at rest and increase gradually as exercise intensity increases (21). In the
past, lactate was thought of as only a waste product of glycolysis that caused fatigue. It is now
recognized that lactate is another useful fuel during and after exercise. Lactate can be used for
energy by slow twitch muscle fibers (Type I) as well as by the heart. Alternately, lactate can
diffuse into the bloodstream, travel to the liver, and be converted to glucose or glycogen through
the process of gluconeogenesis.
Following exercise, lactate can be regenerated to muscle glycogen which may have
implications for individuals following a standard ketogenic diet as glycogen availability is the
limiting factor in many types of exercise. Post-workout glycogen resynthesis from lactate is
discussed in chapter 10.
Exercise and the lactate threshold
The body has a limited capacity to buffer the lactate produced during glycolysis. As
exercise intensity increases, the body’s ability to buffer and/or reuse lactate is surpassed and
lactate accumulates in the bloodstream. Although there is still debate in the literature over
proper terminology, this is generally referred to as the lactate threshold (LT). (21)
The LT represents the maximum exercise intensity which can be sustained for long periods
of time. Above this level lactate levels increase quickly (see figure 3) causing fatigue. In
183
untrained individuals, LT may occur at exercise intensities as low as 50% of maximum heart rate
but this can be raised to 85-90% of maximum heart rate in elite athletes. Exercise above LT is
generally considered anaerobic and is discussed in the following chapter. With training at and
above LT, there is a shift to the right in LT. This allows higher intensities of exercise to be
performed before fatigue sets in. The changes which occur in LT are shown in figure 3
Figure 3: Change in lactate threshold with training
Lactic
Acid
(mmol)
Lactate Threshold (LT)
Untrained
4
2
0
Trained
Exercise intensity
Note: Circles represent LT.
Liver glycogen
In addition to muscle glycogen and freely circulating blood glucose, liver glycogen plays a
role in energy production during exercise. The liver stores about 110 grams of glycogen under
normal conditions and this can be almost doubled to approximately 200 grams with a high
carbohydrate diet. A ketogenic diet will reduce liver glycogen to approximately 13 grams (22).
Liver glycogen breakdown accelerates in response to the increase in adrenaline and
noradrenaline during exercise (see section 3 of this chapter). Glycogen depletion will occur 15-24
hours after carbohydrates have been removed from the diet depending on initial liver glycogen
levels (23).
Approximately 2 hours of low-intensity aerobics are necessary to totally deplete liver
glycogen following an overnight fast (22). High-intensity exercise will cause greater liver
glycogen output (1) although it is difficult to estimate exactly how much exercise would be needed
to totally deplete liver glycogen. As discussed in detail in chapter 4, the depletion of liver glycogen
is critical for the rapid establishment of ketosis, especially for individuals on a CKD. The effects
of exercise on the establishment of ketosis is discussed in chapter 22.
Additionally, glucagon and cortisol levels (which increase with exercise) further influence
liver glycogen release into the bloodstream. When liver glycogen is depleted, blood glucose drops
and the resulting hypoglycemia (low blood sugar) may be one cause of fatigue during aerobic
exercise.
It should be noted that total bodily glycogen and glucose stores can only provide
approximately 1500 calories of energy (this can be doubled with carbohydrate loading), enough to
run approximately 15 miles. As this is still fairly limiting energy wise, the body has several other
sources of fuel that it can utilize during exercise. The other major fuel for energy during aerobic
exercise is fat, in the form of free fatty acids or intramuscular triglyceride.
184
Metabolism of free fatty acids (FFA) and intramuscular triglyceride (TG)
The body has two major stores of fats which can be used during exercise to provide energy:
adipose tissue and intramuscular triglycerides. One pound of fat contains 3,500 calories worth of
usable energy. A 154 lb (70kg) male with 12% bodyfat and 18 lbs (8.4 kg) of total fat has
approximately 70,000 calories stored in bodyfat and an additional 1,500 calories stored as
intramuscular triglyceride. Running one mile requires about 100 calories so this individual could
run 720 miles if he could use 100% fat for fuel.
Even the leanest athlete with only 5 lbs. of bodyfat (containing approximately 17,500
calories worth of usable energy) could run 17 miles if they were able to use just fat for fuel. This
has led most researchers to the conclusion that diets higher in fat are not necessary since the
body has more than enough stored (24). Others have suggested that adaptation to a higher fat
diet may be beneficial for the endurance athlete by sparing glycogen during exercise (20).
Why humans are unable to utilize 100% fat for fuel during activity is a question that many
researchers have asked and is a topic that is discussed in greater detail below (25).
Adipose tissue triglyceride metabolism
Bodily stores of adipose tissue may contain 70,000 calories or more of usable energy stored
in the form of triglyceride (TG). TG is composed of a glycerol backbone with three FFA attached
to it. While intramuscular TG are contained within the muscle and can be used directly, FFA
from adipose tissue must be carried through the bloodstream to the muscles to be used for
energy.
The process of burning adipose tissue TG involves four steps. First the TG must be
mobilized, which refers to the breakdown of TG to three FFAs and a glycerol molecule. Glycerol is
released into the bloodstream and regenerated into glucose in the liver (8). The breakdown of TG
occurs due to the enzyme hormone sensitive lipase (HSL) which is regulated by insulin and the
catecholamines, adrenaline and noradrenaline (8,26,27).
Adrenaline and noradrenaline (which increase during exercise) bind to beta-adrenergic
receptors in the fat cell stimulating HSL to release FFA into the bloodstream (8). Insulin (which
decreases during exercise but increases in response to increases in blood glucose) inhibits HSL
activity and blocks the release of FFA for energy production.
Once broken down within the fat cell, FFAs enter the bloodstream and travel to the muscle
or liver. Consequently, changes in blood flow during exercise affect FFA transport (8). FFA is
taken up into the muscle and transported into the mitochondria for burning via the enzyme
carnitine palmityl transferase 1 (CPT-1). FFA are also broken down in the liver and may be used
to make ketones if liver glycogen is depleted.
Finally, FFA is burned in the mitochondria to produce ATP and acetyl-CoA. The acetylCoa is used to produce more energy in muscle. In the liver, excess acetyl-CoA is condensed into
ketones as discussed in chapter 4. Alternately, incoming FFA may be stored as intramuscular
triglyceride .
One molecule of FFA will yield 129 to 300 ATP or more depending on the length of the FFA
185
that is burned. Compared to aerobic glycolysis (which produces 36-39 ATP per molecule of
glucose), fats provide far more energy. However, more oxygen is required to burn one molecule of
FFA compared to burning one molecule of carbohydrate. This means that the body has to work
harder to oxidize fats than glycogen during exercise. Although FFA produces more energy per
molecule, carbohydrate is still a more efficient fuel.
Questions about fat metabolism
One question that arises is why fats cannot be used as the sole source of energy during
exercise, especially considering their abundance compared to carbohydrate stores. (25) The
limiting factor in fat oxidation is related to the muscle’s oxidative capacity (i.e. mitochondrial
density, enzyme activity). Recall that the major adaptation to aerobic training is an increase in
the amount and activity of mitochondria and the enzymes needed for fat oxidation. At high
exercise intensities the inhibition of FFA release may also limit fat oxidation.
The rate of FFA oxidation during exercise is generally related to its concentration in the
bloodstream (28). During low-intensity exercise (below 65% of maximum heart rate), fats can
provide nearly 100% of the energy required (14,28). The rest comes from blood glucose.
As exercise intensity increases to about 75% of maximum heart rate, the rate of FFA
appearance into the bloodstream decreases, but the rates of fat oxidation increase (16). This
indicates an increased reliance on intramuscular TG use at higher intensities.
However, at this intensity, higher levels of FFA do not further increase fat burning
indicating that the muscle is not able to use fat quickly enough (16,29). The limiting factor
appears to be the muscle’s oxidative capacity (28). During high-intensity activity, more fast
twitch muscle fibers are called into play but the ability of fast twitch muscle fibers to derive
energy from fat is low (13). Recall that the primary adaptation to regular aerobic training is an
increased capacity to use fat for fuel at any intensity.
As exercise intensity increases to 85% of maximum heart rate (or roughly the lactate
threshold), blood FFA levels do not increase during exercise and FFA utilization decreases (28).
The decrease in FFA release during high-intensity exercise may be related to one of several
factors. The first is a decrease in blood flow through adipose tissue at high exercise intensities.
Additionally, FFA appears to become trapped in the adipose cells due to high levels of lactic acid
(13,16,25).
This ‘trapping’ effect of lactic acid is indirectly supported by a large post-exercise FFA
release following exercise at 85% VO2 max. (16). Also, when the blood is made alkaline (with
sodium bicarbonate), higher rates of FFA release are seen during exercise further supporting the
effects of blood lactic acid levels and pH on FFA release (30).
Summary of adipose tissue metabolism
The amount of fat utilized during exercise depends on the intensity and duration of exercise.
At low intensities, there is abundant FFA in the bloodstream and the rate of oxidation appears to
be limited by the muscle’s capacity to oxidize them for energy. As exercise intensity increases to
186
high levels, FFA release from the adipose cell is inhibited by lactic acid and the decrease in fat
oxidation (and subsequent increase in glycogen utilization) is related primarily to decreased
availability.
Additionally, during high-intensity activity, even with sufficient FFA present, fat oxidation
is still impaired. This indicates that other factors, such as oxygen availability, also play a role.
Oxygen availability during exercise is determined both by the amount of blood being pumped (by
the heart) as well as the muscle’s capacity to use oxygen in the bloodstream.
Intramuscular triglyceride (TG) metabolism
As an additional source of energy, there are droplets of fat, called intramuscular
triglyceride (IM TG), stored within the muscle fiber (1,5,31). IM TG is oxidized in the same
manner as blood borne FFA and play a large role in energy production (32). As this type of TG is
stored within the muscle, they are thought to be a more rapidly accessible form of fat energy
during exercise. The utilization of IM TG is highest in Type I fibers due to higher levels of
oxidative enzymes (3,31). Type II muscle fibers do not readily use IM TG for fuel, relying almost
solely on glycogen for energy (31).
Utilization of IM TG ranges from 10% during low-intensity exercise to 50% at high
intensities. (3,31) This is related to changes in hormone levels and blood flow (32). As adrenaline
levels go up at higher intensities, IM TG use is stimulated. Well trained individuals use more IM
TG during exercise than untrained (14, 31). Following exercise which depletes IM TG, there is a
rapid uptake of FFA into the muscle to replenish the TG stores (31).
Ketones
The oxidation of ketones for fuel is similar to that of FFA and intramuscular triglyceride.
Under normal (non-ketotic) conditions, ketones may provide 1% of the total energy yield during
exercise (33). During the initial stage of a ketogenic diet, ketones may provide up to 20% of the
total energy yield during exercise (34). After adaptation, even under conditions of heavy ketosis,
ketones rarely provide more than 7-8% of the total energy produced, a relatively insignificant
amount (35-37).
The reason that more ketones are not used during exercise is to ensure that the brain has
adequate amounts of ketones. Therefore, during aerobic exercise, the muscle will primarily use
FFA and glucose for fuel and ketones can generally be ignored as a fuel source. As we will see in a
later section, blood glucose availability does not appear to limit aerobic exercise on a ketogenic
diet.
Protein
In each muscle there is a pool of amino acids (AAs), that can be used to provide energy
under specific circumstances. Generally, the oxidation of AAs during exercise is small, accounting
187
for perhaps 5% of the total energy yield in men and less in women (see section on gender
differences below). With glycogen depletion, this may increase to 10% of the total energy yield,
amounting to the oxidation of about 10-13 grams of protein per hour of continuous exercise (38).
The primary type of AAs oxidized are the branch-chain amino acids (BCAAs): valine, leucine, and
isoleucine.
BCAA oxidation has been studied extensively in individuals with a metabolic defect called
McArdle’s disease. Due to an enzyme insufficiency, these patients are unable to utilize glycogen
for fuel during exercise. This makes them a good (although extreme) group to study in terms of
glycogen depletion as would be seen during prolonged exercise or a ketogenic diet (39).
During prolonged exercise, McArdle’s patients show increased levels of ammonia which
comes from the breakdown of ATP shown in figure 3.
Figure 3: Breakdown of ATP to ammonia when glycogen is unavailable
ATP
ADP
AMP
IMP + ammonia
To buffer the increased ammonia, glutamate is converted to glutamine, which carries the
ammonia to the liver to be excreted as urea. The BCAA’s (especially leucine) are used to
generate glutamine which is then released into the bloodstream (39). The increased ammonia
load seen in this situation may be one cause of fatigue during exercise. During prolonged exercise,
the increase in ammonia is caused by AA oxidation due to muscle glycogen depletion (39).
The protein oxidized in this fashion appears to comes from the intramuscular AA pool and
not from actual contractile tissue. However several studies have shown an increase in protein
requirements for endurance athletes in heavy training (40,41) indicating that depletion of the
intramuscular AA pool is ultimately damaging to the body. Therefore, excessive aerobic activity
should be avoided to prevent muscle loss. Specific recommendations for aerobic exercise appear
in chapter 24.
As the contribution of protein and ketone bodies to energy generation during exercise is
generally small, they will both be ignored in further discussion of exercise metabolism.
Summary of IM TG, ketone and protein oxidation
As an alternative source of fat derived fuel, the body has a store of triglyceride within the
muscle which can be used to provide energy during higher intensity aerobic exercise. As well,
ketones and protein can provide small amounts of energy during aerobic exercise . In general
ketones do not provide significant amounts of energy during aerobic exercise and protein will only
be broken down to a great degree when glycogen is depleted.
188
Gender Differences in fuel metabolism
There are differences between men and women in terms of the physiological response to
aerobic exercise. While the exact implication of these differences are unclear, they have one
major consequence with regards to the ketogenic diet, especially the CKD.
At any aerobic intensity, women use more fat and less carbohydrate and protein during
exercise (42-45). Studies also show that women do not respond to carb loading the same as men
do, most likely because they deplete less muscle glycogen less during aerobic exercise (42). This
has two important ramifications for women wishing to follow a ketogenic diet. First and foremost,
less dietary protein is required during the week as less protein is used during exercise and at rest
(43). As discussed in chapter 9, if ketosis can not be established and all other facets of the diet
are in order, protein should be reduced gradually until trace ketosis is established. Additionally,
since less glycogen is depleted during aerobic exercise (42,44) carbohydrate requirements for
women on a ketogenic diet are affected.
Anecdotally, some women report excessive fat regain during the carb-load portion of a
CKD, especially if they are not weight training during the week. This may be related to the
physiological differences outlined above. Since glycogen levels are depleted less in women than in
men, the chance for extra carbohydrate calories to ‘spill over’ during the carb-up and be stored as
fat is more likely.
If a woman is only performing aerobic exercise, a CKD will not be appropriate and the TKD
is the better choice. If a woman is weight training and following the CKD, but finds that fat
regain is occurring during the carb-up, the carb-up can be shortened or only performed once every
two weeks.
The exact cause of these gender differences is unknown but is probably related to one or
more of the following factors. Women have higher growth hormone levels than men at rest and
have a greater increase in GH during exercise (46). Additionally, women show a higher adrenaline
release to exercise than men as well as having lower baseline insulin levels (42,44,45). Finally,
women have a greater capacity for beta-oxidation (fat burning) than do men (47).
These differences only appear to occur during the luteal phase of the menstrual cycle,
which is the time period between ovulation and menstruation (42). Higher levels of estradiol (one
of the estrogens) also appear to be involved (44). Interestingly, this difference in substrate
utilization occurs only in untrained women and well trained women show roughly the same fuel
utilization pattern as men (48).
Section 3: The hormonal response
to aerobic exercise
Several hormones are affected by aerobic exercise depending on exercise intensity and
duration. Overall, the hormonal response to aerobic exercise is very similar to what is seen
during a ketogenic diet. Levels of anabolic hormones, such as insulin, go down while levels of
189
catabolic hormones, such as the catecholamines, cortisol and growth hormone, go up. The major
hormones which are affected by aerobic exercise are discussed below.
The catecholamines are adrenaline and noradrenaline and both are involved in energy
production. The catecholamines raise heart rate and blood pressure, stimulate fat breakdown ,
increase liver and muscle glycogen breakdown, and inhibit insulin release from the pancreas (49).
Both adrenaline and noradrenaline increase during exercise although in differing amounts
depending on intensity of exercise. Noradrenaline levels rise at relatively low exercise intensities.
This stimulates FFA utilization in the muscles but has little effect on the breakdown of liver and
muscle glycogen.
Adrenaline levels increase more slowly with increasing exercise intensity until the lactate
threshold (LT) is reached at which time levels increase quickly (3). This point is sometimes called
the adrenaline threshold and corresponds very well with the lactate threshold (50). As adrenaline
is one of the primary hormones responsible for stimulating the liver to release glycogen, raising
adrenaline levels by training at or above the LT is one way to quickly empty liver glycogen to
establish ketosis (this topic is further discussed in chapter 21).
After exercise, adrenaline levels decrease quickly but noradrenaline levels may stay
elevated for several hours depending on the intensity and duration of exercise. Noradrenaline
stimulates calorie burning in muscle cells and the elevations in NA following exercise may explain
part of the post-exercise calorie burn (see chapter 22 for more details on this topic).
During aerobic exercise, insulin levels drop quickly due to an inhibitory effect of adrenaline
on its release from the pancreas (3,49). The drop in insulin allows FFA release to occur from the
fat cells during exercise. Lowering insulin is also important for establishing ketosis. Despite a
decrease in insulin levels during exercise, there is an increased uptake of blood glucose by the
muscle. An increase in glucose uptake with a decrease in insulin indicates improved insulin
sensitivity at the muscle cells during exercise.
Increased insulin sensitivity occurs because muscular contraction causes a specialized
receptor called the glucose transporter-4 (GLUT-4) receptor to move to the cell membrane. For
individuals suffering from hyperinsulinemia (overproduction of insulin), the increase in insulin
sensitivity means that carbohydrates can be consumed during exercise with a minimal increase
in insulin.
Insulin levels can not go up during exercise when glucose is consumed due to the inhibitory
effect of adrenaline on insulin secretion. As soon as exercise ceases, insulin returns to baseline
depending on blood glucose levels. So the amounts of carbs consumed will have to be determined
through trial and error to avoid a insulin reaction after exercise. This topic is discussed in greater
detail in chapter 11.
As the mirror hormone of insulin, glucagon levels increase during aerobic exercise (49).
Thus the overall response to aerobic exercise is pro-ketogenic in that it causes the necessary
shift in the I/G ratio to occur.
As duration and intensity of aerobic exercise increases, the body releases cortisol to
further stimulate liver glycolysis (to maintain blood sugar) and stimulate FFA release. Growth
hormone is also released to help stimulate FFA release (49).
190
Summary
The overall hormonal response to aerobic exercise is geared towards fuel mobilization and
the maintenance of blood glucose. The primary storage hormone of the body, insulin, decreases
while the major fuel mobilization hormones (adrenaline, noradrenaline, cortisol, glucagon, and GH)
all increase. This mimics the hormonal response to a ketogenic diet and aerobic exercise is
inherently ketogenic in nature.
Section 4: Fatigue during aerobic exercise
The cause of fatigue during aerobic exercise depends on the intensity and duration of
activity. This has implications for the effects of a ketogenic diet and each intensity of exercise is
discussed.
During low-intensity exercise (65% maximum heart rate and below), only Type I muscle
fibers are recruited (51). Type I fibers have a high oxidative capacity and use mainly fat for fuel
(13). Additionally, Type I fibers do not generate much lactic acid. The majority of energy during
exercise at this intensity comes from the oxidation of FFA with a small contribution from blood
glucose. As there is essentially an unlimited amount of bodyfat to provide energy, fatigue during
this type of exercise is caused by dehydration, boredom and hypoglycemia (22,52). A ketogenic
diet would not be expected to affect exercise of this intensity.
As exercise intensity increases towards the lactate threshold, more Type II muscle fibers
are recruited (13). Recall that Type II fibers rely more heavily on glycogen for fuel and there is a
greater reliance on stored muscle glycogen as intensity of exercise increases. Fatigue at this
intensity generally correlates with muscle glycogen depletion (22,35). Increasing glycogen levels
with diet invariably improves performance time (52,53).
Interestingly, the exact reason that glycogen depletion causes fatigue is not known (54). It
does not appear to be related to a lack of ATP so it is not simply a matter of a lack of energy. It
may be that some glycogen breakdown is necessary to provide Krebs cycle intermediates for
FFA breakdown (54). Alternately, changes in potassium levels or an impairment of muscle
contraction may occur with glycogen depletion (54).
Another possible source of fatigue during exercise of this type of the buildup of ammonia
in the bloodstream (55). As shown in figure 2 above, ammonia is generated from the breakdown
of ATP and tends to occur when carbohydrates are unavailable. Ammonia production can also
occur from the oxidation of amino acids (56,57). Studies of the ketogenic diet have shown no
change in ammonia levels at rest (57) but inreased levels during aerobic exercise. (56,57).
A ketogenic diet will have a negative impact on performance during moderate- intensity
aerobic exercise (between 75% of maximum heart rate up to the lactate threshold) as this type of
exercise due to the lack of dietary carbohydrates.
191
Section 5: Effects of short-term carbohydrate
depletion on endurance exercise
As early as 1967, it was established that overall endurance performance was dependent
on the availability of glycogen in the muscle, finding that exhaustion during aerobic exercise
occurred when muscle glycogen decreased below a certain level (35). At exhaustion, glycogen
levels in the working muscle were almost entirely emptied.
At the same time, it was found that the rate of glycogen used during exercise was related
to the amount of glycogen present in the muscle. When glycogen levels were the highest,
glycogen breakdown was also the highest. As muscle glycogen levels dropped, the rate of
glycogen utilization decreased as well. Since that time, glycogen stores have been assumed to be
the ultimate determinant of endurance exercise performance, but that viewpoint has recently
been challenged (58). Additionally, it is currently unclear why depleted muscle glycogen would
necessitate a reduction in exercise intensity when FFA are so readily available (54).
As discussed in chapter 10, normal glycogen levels are roughly 100-110 mmol/kg. One
interesting observation in the afforementioned study (35) was that glycogen utilization was
severely impaired below a level of 40 mmol/kg of muscle suggesting an impairment in the
glycolytic pathway. Additionally, below 10 mmol/kg, a further decrease in glycogen utilization
was observed suggesting that there may be some critical level below which exercise performance
is severely impaired. This is remarkably consistent with the observation that performance
during a 30 kilometer run was severely impaired when glycogen fell to level of 15-25 mmol/kg (53).
Numerous studies have examined the effects of short-term glycogen depletion during endurance
exercise of various intensities and duration. In general all support the early study described
above: that performance is impaired with glycogen depletion
Endurance exercise below 85% of maximum heart rate
At low exercise intensities, fat is the main fuel for exercise. As intensity increases, muscle
glycogen plays a greater role in energy production. This has led researchers to examine the
effects of both short-term and long-term carbohydrate depletion on endurance performance.
Typically, subjects are tested during exercise at normal glycogen levels and then perform
glycogen depleting exercise followed by 1-5 days of a high fat, carbohydrate restricted diet at
which point they are retested. Following the second test, the subjects are frequently given a diet
high in carbohydrates (causing glycogen super compensation) to examine the effects of above
normal glycogen levels on various parameters of exercise performance. A schematic of this
study design appears in figure 4 on the next page.
Almost without exception, the studies of short-term glycogen depletion on endurance
exercise below 85% of maximum heart rate find similar results. The primary result is a decrease
in glycogen use during exercise (35,59-64). This simply reflects a lack of availability of glucose,
prompting the body to find an alternative fuel source (i.e. FFA). The initial decrease in glycogen
utilization (and increase in fat utilization) during exercise occurs around 70 mmol/kg (65). Other
studies suggest that muscle glycogen breakdown does not decrease until very low glycogen levels
(around 40 mmol/kg) are reached (66).
192
Figure 4: Schematic of study design for short-term glycogen depletion studies
Day
Exercise
1
Baseline
Exercise test
2
Deplete glycogen
with exhaustive
exercise
5
Repeat exercise
test
5-8
No
exercise
Diet
Normal
Low carb,
high fat
Low carb,
high fat
Carb load
8
Repeat
exercise
test
With decreased glycogen levels, there is a decrease in blood lactate levels both at rest (6165,67) and during exercise (35, 59-68). This reflects the decreased use of carbohydrate and
greater use of FFA for fuel.
The increased use of FFA for fuel occurs both at rest (35,60-62,69) and during exercise
(35,59,60,62,64,67,69), as indicated by a decreased respiratory quotient (RQ). RQ is a measure
of the proportion of fat and carbohydrate being burned. Lower RQ values indicate greater fat
utilization and higher RQ values greater carbohydrate utilization.
Blood levels of FFA acids increase at rest (60,61-63) and during exercise (60,62). This
occurs due to the drop in insulin and blood glucose (60,62,63) as well as the increase in levels of
adrenaline and noradrenaline (70). The increase in FFA levels provides ample substrate for
ketogenesis in the liver. In the short-term there is no change in blood glucose uptake during
exercise (60,61,64).
Despite the increased use of fat for fuel and the ‘glycogen sparing’ effect, exercise
performance still suffers. Time to exhaustion decreases significantly with short-term
carbohydrate depletion at both low and moderate aerobic intensities (59,60,65,71).
Additionally, there is higher oxygen uptake at rest (61) and during exercise (29,60,62
67,69) as well as a higher heart rate at rest (61,69) and during exercise (60,62,67,69). The
oxidation of fat requires more oxygen than the oxidation of the same amount of carbohydrate so
this is to be expected. From a practical standpoint this means that, at any given workload,
exercise will feel subjectively harder under conditions of glycogen depletion. It should be noted
that not all studies have shown a change in heart rate or oxygen uptake during exercise (64)
when carbohydrates are restricted. Finally, there is increased activity of the enzyme lipoprotein
lipase, an enzyme involved in fat utilization in the muscle (66).
Effects of glycogen super compensation on aerobic exercise
In general, studies that compare glycogen loading to normal or depleted glycogen levels find
the opposite of the above results. In a glycogen compensated state, some studies find increased
levels of lactate during exercise (35,68) while others have found no change (66). There is also a
higher RQ during exercise indicating greater use of glycogen (35). Despite increased reliance on
carbohydrate, there is still a greater time to exhaustion (65) and higher peak power output (67)
in a carb-loaded state. Overall performance capacity increases.
193
Summary
With short-term glycogen depletion, there is a progressive decrease in glycogen breakdown
during exercise accompanied by an increase in fat utilization. While this ‘glycogen sparing’ effect
might be expected to increase endurance performance, this does not appear to be the case for
short-term (1-5 days) carbohydrate restriction as endurance time invariably decreases and effort
level increases in the glycogen depleted subjects. This is remarkably consistent with data from
fasted subjects (72) which find that, despite drastically increased utilization of fats for fuel,
performance is still hindered by the lack of muscle glycogen. The effects of long-term adaptation
to carbohydrate restriction are addressed in the next section.
Additionally, there are breakpoints where glycogen utilization during exercise changes. The
first appears to occur around 70 mmol/kg where an initial drop in glycogen utilization (and an
increase in fat use) occurs. The second occurs at 40 mmol/kg which is near the glycogen levels
where exhaustion occurs during continuous exercise. Below 40 mmol/kg, glycolysis appears to be
impaired although the exact mechanism is unknown.
With carbohydrate supercompensation the opposite results are seen. Glycogen utilization
during exercise and at rest increases with a decrease in fat utilization. Exercise heart rate and
oxygen uptake during exercise and an increased in time to exhaustion. Whether this adaptation
would occur following longer term adaptation to a ketogenic diet followed by carb-loading is
discussed in the next section.
Thus, from a purely performance standpoint, at least in the short-term, it appears that
carbohydrates are still the body’s preferred fuel. Fat is simply unable to sustain optimal
performance at high intensities.
Section 6: Long-term ketogenic diet and
endurance activity
Although many studies have examined the effects of short-term glycogen depletion with a
high fat diet, only a few have examined the long-term effects of a ketogenic diet on endurance
performance. As we shall see, there appears to be a difference between short-term glycogen
depletion and long-term ketogenic adaptation. Please note that these studies generally did not
examine the effects of exercise on fat loss on a ketogenic diet. Rather, they simply examined
what types of exercise could be sustained on a diet devoid of carbohydrates.
Studies on longer term ketogenic (2 to 6 weeks) diets find either a maintenance (73,74) or
increase (75,76) in endurance at low-intensity exercise (75% of maximum heart rate and below).
At higher intensities (around 85% of maximum heart rate which is likely above the lactate
threshold) performance decreases (77). As higher intensity exercise relies proportionally more on
carbohydrate for fuel, this would be expected to occur. A recent review of the ketogenic diet and
exercise literature (78) has criticized the one study showing a performance decrement (77) on the
basis that high-intensity exercise (85% of maximum) was inappropriate for untrained individuals.
194
Despite increases in the muscle’s ability to utilize fat for fuel, exhaustion during exercise is
still related to a depletion of glycogen in Type I muscle fibers (73). As discussed previously, the
exact cause of fatigue is unknown in this case but may relate to a decrease in Krebs cycle
intermediates such as citrate which are necessary for oxidation of FFA (79). This means that
endurance athletes following a ketogenic diet will still require carbohydrates for optimal
performance.
As with short-term carbohydrate depletion, there is a drop in RQ both at rest and during
exercise indicating greater reliance on fat for fuel (73-76). At least part of the long-term
adaptation to a ketogenic diet is an increase in the carnitine palmityl transferase 1 (CPT-1)
system allowing for greater utilization of fats during exercise (79). This may in part explain the
difference between short-term glycogen depletion and long-term adaptation and it has been
suggested that “These adaptations to a chronic exposure to high-fat or low CHO feeding may
‘retool’ the working muscle mitochondria and increase their capacity for fat oxidation.” and that
adaptation to a ketogenic diet are similar to that seen with endurance training (58)
Why the discrepancy between short and long-term studies?
As noted, there is a discrepancy in the capacity for endurance performance between
studies of short-term (1-5 day) glycogen depletion compared to longer term (2-6 weeks)
adaptation to a ketogenic diet. It appears, as with many aspects of human adaptation, the
impact on skeletal muscle metabolism of a ketogenic diet may take several weeks or more to
occur (58). Thus during the first few 3-4 weeks of a ketogenic or CKD, aerobic exercise
performance will most likely decrease. With chronic carbohydrate depletion, the muscles adapt
by improving their ability to use fat for fuel and performance may improve again.
Summary
Long-term adaptation to a ketogenic diet appears to improve the ability of the muscle to
use fat for fuel, although the exact mechanisms are not known. Endurance during low-intensity
exercise (below 75% of maximum heart rate) can be maintained or improved with a total lack of
dietary carbohydrates.
As exercise intensity increases, glycogen plays a much greater role in performance. And
the limited studies available suggest that performance at moderate-intensity (75-85% of
maximum heart rate) is decreased with a ketogenic diet. At higher intensities (90% VO2 max.
and above), fatigue is generally caused by factors other than glycogen availability and is
discussed in a later section.
The primary point of this section is this: individuals on a long-term ketogenic diet are
limited in the types of activity that they may comfortably perform. It appears that either lowintensity activity or high-intensity activity is tolerated and only moderate-intensity activity
(near the lactate threshold where glycogen availability is the primary determinant of
performance) is compromised and should be avoided.
195
Additionally, even with the adaptations to a high fat diet, it appears that submaximal
exercise endurance is still ultimately limited by muscle glycogen stores. Individuals wishing to
perform high-intensity aerobic exercise will need to consume carbohydrates at some point. So,
while the ketogenic diet may be more effective for fat loss, it simply is not the ideal endurance
performance diet.
References Cited
1. “Physiology of Sport and Exercise” Jack H. Wilmore and David L. Costill. Human Kinetics
Publishers 1994.
2. Simoneau JA. Adaptations of human skeletal muscle to exercise-training. Int J Obesity (1995)
19 (Suppl 3): S9-S13.
3. Martin WH. Effects of acute and chronic exercise on fat metabolism. Exercise and Sports
Science Reviews (1994) Vol 24: 203-231.
4. Kiens B et. al. Skeletal muscle substrate utilization during submaximal exercise in man: effect
of endurance training. J Physiology (93) 469: 459-478.
5. “Exercise Physiology: Human Bioenergetics and it’s applications” George A Brooks, Thomas D.
Fahey, and Timothy P. White. Mayfield Publishing Company 1996.
6. Klausen K et. al. Adaptive changes in work capacity, skeletal muscle capillarization and
enzyme levels during training and detraining. Acta Physiol Scand (1981) 113:9-16.
7. Martin WH et. al. Effect of endurance training on plasma free fatty acid turnover and oxidation
during exercise. Am J Physiol (1993) 265: E708-714.
8. Arner P. Impact of exercise on adipose tissue metabolism during exercise” Int J Obesity (1995)
19 Suppl 3: S18-S21.
9. Martin WH et. al. Effects of stopping exercise training on epinephrine-induced lipolysis in
humans. J Appl Physiol (1984) 56: 845-848.
10. Baumann H et. al. Exercise training induces transitions of myosin isoform subunits within
histochemically typed human muscle fibers. Pflugers Archiv (1987) 409: 349-360.
11. Terados NJM et. al. Decrease in skeletal muscle myoglobin with intensive training in man.
Acta Physiol Scand (1986) 651-652.
12. “Textbook of Biochemistry with Clinical Correlations 4th ed.” Ed. Thomas M. Devlin.
Wiley-Liss, 1997.
13. Hultman E. Fuel selection, muscle fibre. Proceedings of the Nutrition Society (1995)
54: 107-121.
14. Coyle EF. Substrate Utilization during exercise in active people. Am J Clin Nutr (1995)
61 (suppl): 968S-979S.
15. Brooks G and Mercier J. Balance of carbohydrate and lipid utilization during exercise: the
“crossover” concept. J Appl Physiol (1994) 76: 2253-2261.
16. Romijn JA et. al. Regulation of endogenous fat and carbohydrate metabolism in relation to
exercise intensity and duration. Am J Physiol (1993) 265: E380-391.
17. Vollestad NK et al. Muscle glycogen depletion patterns in type I and subgroups of Type II
fibers during prolonged severe exercise in man. Acta Physiol Scand (1984) 122: 433-441.
18. Gollnick PD et. al. Selective glycogen depletion in skeletal muscle fibres of man following
sustained contractions. J Physiol (1974) 241: 59-67.
19. Sidossis LS and Wolfe RR. Glucose and insulin-induced inhibition of fatty acid oxidation: the
glucose-fatty acid cycle reversed. Am J Physiol (1996) 270: E733-E738.
196
20. Hawley JA and Hopkins WG. Aerobic glycolytic and aerobic lipolytic power systems: A new
paradigm with implications for endurance and ultraendurance events. Sports Medicine
(1995) 19: 240-250.
21. “The Blood lactate response to exercise” Arthur Weltman Human Kinetics Publishers 1995.
22. Sherman W Metabolism of sugars and physical performance. Am J Clin Nutr (1995)
62(suppl): 228S-41S.
23. Lavoie JM et. al. Effects of dietary manipulations on blood glucose and hormonal responses
following supramaximal exercise. Eur J Appl Physiol (1987) 56: 109-114.
24. Clarkson PM. Nutrition for improved sports performance: Current issues on ergogenic aids.
Sports Med (1996) 21: 393-401.
25. Guezennec CY. Role of lipids on endurance capacity in man. Int J Sports Med (1992)
13: S114-S118.
26. Wahrenberg H et. al. Adrenergic regulation of lipolysis in human fat cells during exercise.
Eur J Clin Invest (1991) 21: 534-541.
27. Wahrenberg H et. al. Mechanisms underlying regional differences in lipolysis in human
adipose tissue. J Clin Invest (1989) 84: 458-467.
28. Romijn JA et. al. Relationship between fatty acid delivery and fatty acid oxidation during
strenuous exercise. J Appl Physiol (1995) 79: 1939-1945.
29. Hargreaves M et. al. Effect of increased plasma FFA concentrations on muscle metabolism
in exercising man. J Appl Physiol (1995) 78: 288-292.
30. Hood VL. Systemic pH modifies ketone body production rates and lipolysis in humans.
Am J Physiol 259 (1990) 22: E327-E334.
31. Gorski J. Muscle Triglyceride metabolism during exercise. Can J Physiol Pharmacol (1993)
70: 123-131.
32. Maggs DG et. al. Interstitial fluid concentrations of glycerol, glucose, and amino acids in
human quadricep muscle and adipose tissue. J Clin. Invest (1995) 96: 370-377.
33. “Exercise Metabolism” Ed. Mark Hargreaves. Human Kinetics Publishers 1995.
34. Elia M et. al. Ketone body metabolism in lean male adults during short-term starvation, with
particular reference to forearm muscle metabolism. Clinical Science (1990) 78: 579-584.
35. Bergstrom J et. al. Diet, muscle glycogen and physical performance. Acta Physiol Scand
(1967) 71: 140-150.
36. Balasse EO and Fery F. Ketone body production and disposal: Effects of fasting, diabetes and
exercise. Diabetes/Metabolism Reviews (1989) 5: 247-270.
37. Wahren J et. al. Turnover and splanchnic metabolism of free fatty acids and ketones in
insulin-dependent diabetics at rest and in response to exercise. J Clin Invest (1984)
73: 1367-1376.
38. Lemon PR and Mullin JP. Effect of initial muscle glycogen level on protein catabolism during
exercise. J Appl Physiol (1980) 48: 624-629.
39. Wagenmakers AJM et. al. Metabolism of Branched-Chain Amino Acids and Ammonia During
Exercise: Clues from McArdle’s Disease. Int J Sports Med (1990) 11: S101-113.
40. Lemon P. Is increased dietary protein necessary or beneficial for individuals with a physically
active lifestyle? Nutrition Reviews (1996) 54: S169-S175.
41. Friedman JE and Lemon P. Effect of chronic endurance exercise on retention of dietary
protein. Int J Sports Med (1989) 10: 118-123.
42. Tarnopolsky MS et. al. Carbohydrate loading and metabolism during exercise in men and
women. J Appl Physiology (1995) 78: 1360-1368.
43. Phillips SM et al. Gender differences in leucine kinetics and nitrogen balance in endurance
197
athletes. J Appl Physiol (1993) 75: 2134-2141.
44. Ruby BC and Robergs R. Gender differences in substrate utilisation during exercise. Sports
Med (1994) 17: 393-410.
45. Tarnopolsky LJ et. al. Gender differences in substrate for endurance exercise. J Appl Physiol
(1990) 68: 302-308.
46. Bunt JC et. al. Sex and training differences in human growth hormone levels during prolonged
exercise. J Appl Physiol (1986) 61: 1796-1801.
47. Green HJ et. al. Male and female differences in enzyme activities of energy metabolism in
vastus lateralis muscle. J Neurol Sci (1984) 65: 323-331.
48. Friedmann B and Kindermann W. Energy metabolism and regulatory hormones in women
and men during endurance exercise. Eur J Appl Phys (1989) 59: 1-9.
49. “Exercise Physiology: Human Bioenergetics and it’s applications” George A Brooks, Thomas
D. Fahey, and Timothy P. White. Mayfield Publishing Company 1996.
50. “The Blood lactate response to exercise” Arthur Weltman Human Kinetics Publishers 1995.
51. Vollestad NK. Metabolic correlates of fatigue from different types of exercise in man.
Advances in Experimental Medicine and Biology 384: Fatigue Ed: Simon C Gandevia et al.
Plenum Press 1995.
52. Sahlin K. Metabolic factors in fatigue. Sports Medicine (1992) 13: 99-107.
53. Karlsson J and Saltin B. Diet, muscle glycogen, and endurance performance. J Appl Physiol
(1971) 31: 203-206.
54. Green HJ. How Important is endogenous muscle glycogen to fatigue in prolonged exercise.
Can J Physiol Pharmacol (1991) 69: 290-297.
55. Sewell DA et. al. Hyperammonaemia in relation to high-intensity exercise duration in man.
Eur J Appl Physiol (1994) 69: 350-354.
56. Greenhaff PL et. al. The influence of dietary manipulation on plasma ammonia accumulation
during incremental exercise in man. Eur J Apply Physiol (1991) 63: 338-344.
57. Czarnowski D et. al. Effect of a low-carbohydrate diet on plasma and sweat ammonia
concentrations during prolonged nonexhausting exercise. Eur J Appl Physiol (1995)
70:70-74.
58. Conlee RE. Muscle glycogen and exercise endurance: a twenty year perspective. Exercise and
Sports Science Reviews (1987) 15: 1-28.
59. Galbo H et. al. The effect of different diets and of insulin on the hormonal response to
prolonged exercise. Acta Physiol Scand (1979) 107: 19-32.
60. Jansson E and Kaijser L. Effect of diet on the utilization of blood-borne and intramuscular
substrates during exercise in man. Acta Physiol Scand (1982) 115: 19-30.
61. Jannson J and Kaijser L. Effect of diet on muscle glycogen and blood glucose during a shortterm exercise in man. Acta Physiol Scand (1982) 115:341-347.
62. Spencer MK et. al. Effect of low glycogen on carbohydrate and energy metabolism in human
muscle during exercise. Am J Physiol (1992) 262: C975-C979.
63. Yan Z et. al. Effect of low glycogen on glycogen synthase during and after exercise. Acta
Physiol Scand (1992) 145: 345-352.
64. Hargreaves M et. al. Influence of muscle glycogen on glycogenolysis and glucose uptake
during exercise in humans. J Appl Physiol (1995) 78: 288-292.
65. Bosch AN et. al. Influence of carbohydrate loading on fuel substrate turnover and oxidation
during prolonged exercise. J Appl Physiol (1993) 74: 1921-1927.
66. Jacobs I. Lactate Muscle Glycogen and Exercise Performance in Man. Acta Physiol Scand
Supplementum (1981) 495: 3-27.
198
67. Heigenhauser GJF et. al. Effect of glycogen depletion on the ventilatory response to exercise.
J Appl Physiol (1983) 54: 470-474.
68. Asmussen E et. al. Lactate Production and anaerobic work capacity after prolonged exercise.
Acta Physiol Scand (1974) 90:731-742.
69. Jannson E and Kaijser L. Leg citrate metabolism at rest and during exercise in relation to diet
and substrate utilization in man. Acta Physiol Scand (1984) 122: 145-153
70. Jansson E et. al. Diet induced changes in sympatho-adrenal activity during submaximal
exercise in relation to substrate utilization in man. Acta Physiol Scand (1982)
114: 171-178.
71. Johannessen A et. al. Prolactin, growth hormone, thyrotropin, 3,4,3’-trioiodothyronine, and
thyroxine responses to exercise after fat- and carbohydrate-enriched diet. J Clin
Endocrinology and Metabolism (1981) 52: 56-61.
72. Aragon-Vargas LF. Effects of fasting on endurance exercise. Sports Medicine (1993)
16: 255-265.
73. Phinney SD et. al. The human metabolic response to chronic ketosis without caloric
restriction: preservation of submaximal exercise capacity with reduced carbohydrate
oxidation. Metabolism (1983) 32: 769-776.
74. Phinney SD et. al. Effects of aerobic exercise on energy expenditure and nitrogen balance
during very low calorie dieting. Metabolism (1988) 37: 758-765.
75. Phinney SD et. al. Capacity for moderate exercise in obese subjects after adaptation to a
hypocaloric, ketogenic diet. J Clin Invest (1980) 66: 1152-1161.
76. Lambert EV et. al. Enhanced endurance in trained cyclists during moderate intensity exercise
following 2 weeks adaptation to a high fat diet. Eur J Apply Physiol (1994) 69: 387-293.
77. Bogardus C et. al. Comparison of Carbohydrate-containing and carbohydrate-restricted
hypocaloric diets in the treatment of obesity. J Clin Invest (1981) 68: 399-404.
78. Phinney S. Exercise during and after very-low-calorie dieting” Am J Clin Nutr (1992)
56: 190S-194S.
79. Spencer M and Katz A. Role of glycogen in control of glycolysis and IMP formation in human
muscle metabolism. Am J Physiol (1991) 260: E859-E864.
80. Fisher EC et. al. Changes in skeletal muscle metabolism induced by a eucaloric ketogenic
diet. In Knuttgen, H.G. et. al. (eds) “Biochemistry of exercise” Champaign, Ill.: Human
Kinetics, 1983.
199
Chapter 19:
Physiology of interval training
Interval training refers generally to any activity which alternates periods of high intensity
exercise with periods of lower intensity exercise. While interval training is most commonly
thought of as sprint training, activities such as basketball and football, which are of a stop and
start nature, should be classified as interval training as well. Although weight training is interval
in nature, it is discussed separately in the next chapter.
As was discussed in the previous chapter, the breakdown of glycogen during exercise can
yield either pyruvate or lactate. At low exercise intensities, glycogen breakdown produces
pyruvate which is used to generate more ATP. At higher intensities of exercise, lactate is
produced in greater and greater amounts and begins to accumulate in the muscle and
bloodstream.
Up to a certain point, the body can deal with the increased lactate by reusing it for fuel or
buffering it with bicarbonate to producing water and carbon dioxide. The point at which
production of lactic acid exceeds the body’s ability to cope with increasing amounts is referred to
as the lactate threshold (LT) and, in essence, reflects the body’s switch from primarily aerobic to
primarily anaerobic energy production.
Lactic acid causes fatigue by inhibiting muscular contraction and preventing further
energy production from glycogen breakdown. Thus, the duration of exercise above LT is limited.
Depending on the intensity of activity, the duration of activity will vary from twenty minutes or
more at LT to thirty seconds or less at maximal intensities.
The primary adaptation to interval training is to shift the LT to the right allowing higher
intensities of exercise to be performed before lactic acid buildup causes fatigue. This allows
endurance athletes to perform at higher intensities without fatigue.
Section 1: Adaptations to interval training
At intensities around LT, both Type I and Type IIa muscle fibers are recruited (1). As
exercise intensity approaches maximum, Type IIb fibers are also recruited (2,3,4). Similar to
aerobic exercise, the primary adaptation to interval training is an increase in the oxidative
capacity of the recruited muscle fibers (i.e. Type IIa and IIb fibers) (5). Additionally, with regular
exercise above LT, there is a gradual shift in LT to the right during exercise (5). That is, higher
exercise intensities can be sustained with less lactic acid buildup.
For endurance athletes looking to maximize performance, this is an important adaptation
as the majority of endurance events are performed close to or at the LT. Performance in
endurance events has improved greatly in the past 15 years despite little or no increase in
maximal aerobic capacity. This is explained by the greater amount of training time spent at or
above LT by modern endurance athletes (5).
200
For bodybuilders and other strength/power athletes, the adaptations to interval training
may be detrimental to performance. Several studies have reported a shift of Type IIb muscle
fibers towards Type IIa characteristics with intensive interval training (6,7,8). Therefore,
individuals wishing to maximize muscle size or strength are advised to stick with low intensity
aerobic activity (below LT) under most circumstances (9). Specific guidelines for frequency of
interval training is discussed in chapter 25.
Section 2: Hormonal response to interval training
The hormonal response to interval training is very similar to aerobic exercise. The higher
intensity nature of interval training simply causes a greater hormonal response to be seen as
compared to lower intensity aerobic training.
Adrenaline and noradrenaline both cause an increase in glycogen breakdown in the liver
and muscles and increases in blood glucose and free fatty acids (2). Exercise above the LT
causes a significant increase in both hormones. Blood glucose increases during interval training
due to increased output of liver glycogen. This is further discussed in chapter 21.
Despite the increase in blood glucose during interval training, insulin levels still go down.
However, if blood glucose is elevated following exercise, insulin levels will increase to drive blood
glucose into the muscles. The increase in blood glucose and insulin may de-establish ketosis for a
brief period after exercise.
As mentioned previously, growth hormone (GH) helps to control fuel mobilization by
increasing fat breakdown and decreasing glycogen and protein use. Interval training significantly
increases GH levels most likely by raising lactic acid levels (10,11).
Section 3: Energy Metabolism
By its very nature, interval training will rely on anaerobic energy metabolism, namely
anaerobic glycolysis and the phosphagen energy system. Both are described below.
The Phosphagen System
Recall that ATP is the only fuel that muscles can use directly and all other energy systems
have as their ultimate goal ATP production. When muscle contracts, ATP provides energy by
being broken down to adenosine diphosphate (ADP) in the following reaction with the help of an
enzyme called an ATPase as shown in figure 1.
201
Figure 1: Breakdown of ATP
ATPase
ATP
ADP + Pi + energy
Note: Pi represents an inorganic phosphate molecule
Within a muscle, there is about 6 seconds worth of ATP stored which can be used for
immediate energy. For activity to continue past 6 seconds, ATP must be generated through
various other reactions. The first of these of these is through the creatine phosphate (CP)
system.
The creatine phosphate system
Also stored in the muscle is a substance called creatine phosphate (CP). This provides a
phosphate molecule to ADP to regenerate ATP so that muscular activity can continue. CP
donates its high energy phosphate molecule to ADP to regenerate ATP via an enzyme called
creatine kinase as shown in figure 2.
Figure 2: Breakdown of CP to regenerate ATP
Creatine kinase
ADP + CP
ATP + Creatine
There is enough stored CP in a normal muscle to provide energy for approximately the first
20 seconds of muscular activity at which time intramuscular CP is depleted. The CP system
operates in the absence of oxygen (it is anaerobic) and can provide energy very quickly during
exercise. Collectively stored ATP and CP are known as the ATP-CP or phosphagen system. The
total energy yield from the ATP-CP system is low due to the small amount of ATP and CP
available in the muscle. The ATP-CP system is used to fuel maximal intensity activities of a
duration of 20 seconds or less such as low rep weight training and sprinting. At exhaustion during
these types of exercise, fatigue is most likely caused by CP depletion. It should be noted that,
even at complete exhaustion, muscle ATP stores do not decrease very much during any type of
exercise. After depletion, CP is resynthesized fully in approximately 3-4 minutes (12).
For activity to continue past 20 seconds, the body must rely on other fuel sources to
generate ATP. One of these is the breakdown of blood glucose or glycogen (the storage form of
glucose found in the muscles and liver), which is called glycolysis.
Aerobic glycolysis is discussed in the previous chapter and is not repeated here. The major
difference between aerobic glycolysis (during exercise below LT) and anaerobic glycolysis is the
ultimate fate of pyruvate. Whereas in aerobic glycolysis, pyruvate goes into the Krebs cycle to
provide more energy, in anaerobic glycolysis pyruvate is converted to lactate. The fate of lactate
202
is discussed in the previous chapter and will not be reproduced here. To briefly recap, the
increased rate of lactate production during interval training overwhelms the body’s ability to
buffer or reuse the lactate and there will be a build-up of lactate in the bloodstream.
Section 4: Fatigue during interval training
and the effects of a ketogenic diet
As stated, during exercise above lactate threshold, anaerobic glycolysis leads to a
generation of lactic acid. During high intensity exercise of 20-60 seconds duration, lactic acid
accumulation is the most likely cause of fatigue (13,14). At fatigue, glycogen levels in the muscle
fibers typically remain high (15,16) further suggesting that fatigue is occurring from the buildup
of waste products. Thus, it would not appear that a ketogenic diet would directly impair
performance during this type of exercise as glycogen availability is not the limiting factor. During
repeated bouts of high intensity exercise (i.e. sprint training), depletion of glycogen will become an
important factor in fatigue (17).
The effects of glycogen depletion during interval sprint exercise has been thoroughly
studied. Most studies (18-24) have reported a decrease in exercise performance during sprint
training (at various intensities above LT). The reason for the drop in performance is not
immediately apparent.
While on a ketogenic diet, although pH is rapidly normalized, there is a decrease in the
body’s buffering capacity due to lower bicarbonate levels (19,20,21,25). Since bicarbonate is used
to buffer the lactic acid produced from anaerobic glycolysis, fatigue during a single interval may
occur faster due to greater lactic acid buildup in the muscle.
This link between blood pH and sprint performance is not supported by at least two
studies. Following 5 days of a ketogenic diet, lactate levels do not differ during sprint exercise (20)
which indicates no impairment in glycolysis. Additionally, reversal of the acidosis by bicarbonate
ingestion (23) did not improve performance in the ketogenic diet group.
Another possible cause of fatigue is a decrease in the muscle’s capacity to generate energy
through anaerobic glycolysis. The major regulating enzyme of glycolysis (called phosphorylase)
breaks stored glycogen down to glucose for the cell to use. Phosphorylase activity decreases
when glycogen levels fall below a certain level (about 40 mmol/kg) and this may be a cause of
muscular fatigue (24, 26,27).
Indirectly supporting this idea are studies examining the effects of higher than normal
glycogen levels on performance and glucose use. It appears that glycogen supercompensation
above normal does not increase glycolysis (27-29) compared to normal glycogen levels. Thus, as
long as glycogen is above a certain level (40 mmol/kg), glycolysis is not affected. Only when
glycogen falls below a certain critical level does performance suffer.
203
Summary
Interval training refers to any type of activity which alternates periods of high intensity
activity with periods of low intensity activity. The adaptations to interval training are similar to
what is seen with aerobic exercise but occur in Type II muscle fibers. As glycogen plays a much
larger role in energy production during high intensity activity it would be expected that a
ketogenic diet will affect performance. Although the exact reason why fatigue occurs more
quickly while on a ketogenic diet is unknown, it is well established that performance will decrease.
References Cited
1. Vollestad NK et al. Muscle glycogen depletion patterns in type I and subgroups of Type II
fibers during prolonged severe exercise in man. Acta Physiol Scand (1984) 122: 433-441.
2. “Physiology of Sport and Exercise” Jack H. Wilmore and David L. Costill. Human Kinetics
Publishers 1994.
3. “Endurance in Sport” Ed. R.J. Shephard & P.-O. Astrand. Blackwell Scientific Publishers
1992.
4. “Exercise Physiology: Human Bioenergetics and it’s applications” George A Brooks, Thomas
D. Fahey, and Timothy P. White. Mayfield Publishing Company 1996.
5. “The Blood lactate response to exercise” Arthur Weltman Human Kinetics Publishers 1995.
6. Simoneau JA. Adaptations of human skeletal muscle to exercise-training. Int J Obesity
(1995) 19 (Suppl 3): S9-S13.
7. Simoneau JA et. al. Human skeletal muscle fiber alteration with high-intensity intermittent
training. Eur J Appl Physiol (1985) 54: 250-253.
8. Simoneau JA et. al. Inheritance of human skeletal muscle and anaerobic capacity to
adaptation to high-intensity intermittent training. Int J Sports Med (1986) 7:167-171.
9. “Max O2: The Complete Guide to Synergistic Aerobic Training” Jerry Robinson and Frank
Carrino, Health for Life 1993.
10. Chwalbinska-Monet J et. al. Threshold increases in plasma growth hormone in relationship to
plasma catecholamine and blood lactate concentrations during progressive exercise in
endurance-trained athletes. Eur J Appl Physiol (1996) 73: 117-120.
11. Nevill ME et. al. Growth hormone responses to treadmill sprinting in sprint- and endurancetrained athletes. Eur J Appl Physiol (1996) 72: 460-467.
12. “Exercise Metabolism” Ed. Mark Hargreaves. Human Kinetics Publishers 1995.
13. Yu-Yahiro H. Electrolytes and their relationship to normal and abnormal muscle function.
Orthopaedic Nursing (1994) 13: 38-40.
14. Allen DG et. al. The role of intracellular acidosis in muscle fatigue. in Advances in
Experimental Medicine and Biology 384: Fatigue Ed: Simon C Gandevia et al. Plenum
Press 1995.
15. Karlsson J and Saltin B. Diet, muscle glycogen, and endurance performance. J Appl Physiol
(1971) 31: 203-206.
16. Sahlin K. Metabolic factors in fatigue. Sports Medicine 13(2): 99-107, 1992.
17. Abernathy PH et. al. Acute and chronic response of skeletal muscle to resistance exercise.
Sports Med (1994) 17: 22-38
18. Maughan RJ and Poole DC. The effects of a glycogen-loading regimen on the capacity to
perform anaerobic exercise. Eur J Appl Physiol (1981) 46: 211-219.
204
19. Greenhaff PL et. al. The effects of dietary manipulation on blood acid-base status and the
performance of high intensity exercise. Eur J Appl Physiol (1987) 56: 331-337.
20. Greenhaff PL et. al. The effects of a glycogen loading regime on acid-base status and blood
lactate concentration before and after a fixed period of high intensity exercise in man. Eur
J Appl Physiol (1988) 57: 254-259.
21. Greenhaff PL et. al. The effects of diet on muscle pH and metabolism during high intensity
exercise. Eur J Appl Phys (1988) 57: 531- 539.
22. Jenkins DG et. al. The influence of dietary carbohydrate on performance of supramaximal
intermittent exercise. Eur J Appl Phys (1993) 67: 309-314.
23. Ball D et. al. The acute reversal of a diet-induced metabolic acidosis does not restore
endurance capacity during high-intensity exercise in man. Eur J Appl Phys (1996)
73: 105-112.
24. Casey A et. al. The effect of glycogen availability on power output and the metabolic
response to repeated bouts of maximal, isokinetic exercise in man. Eur J Apply Physiol
(1996) 72: 249-255.
25. Greenhaff PL et. al. The influence of dietary manipulation on plasma ammonia accumulation
during incremental exercise in man. Eur J Apply Physiol (1991) 63: 338-344.
26. Jacobs I. Lactate concentrations after short maximal exercise at various glycogen levels.
Acta Physiol Scand (1981) 111: 465-469.
27. Bangsbo J et. al. Elevated muscle glycogen and anaerobic energy production during
exhaustive exercise in man. J Physiol (1992) 451: 205-227.
28. Vandenberghe K et. al. No effect of glycogen level on glycogen metabolism during high
intensity exercise. Med Sci Sports Exerc (1995) 27: 1278-1283.
29. Hargreaves M Effect of muscle glycogen availability on maximal exercise performance. Eur J
Appl Phys (1997) 75: 188-192.
205
Chapter 20:
Physiology of weight training
Weight training refers generally to any activity where muscles must produce high forces
against an external resistance (such as a dumbbell, weight machine, or rubber tubing). Due to
the high forces involved, weight training can recruit all muscle fiber types similar to interval
training. However the adaptations seen with weight training are significantly different than with
interval training and are discussed separately.
Section 1: Adaptations to weight training
In general, the adaptations to resistance training improve the body’s ability to generate
force. In the laboratory, strength is defined as the amount of force an individual can produce
during an isometric contraction (where the muscle contracts but the limbs do not move). This
measurement of strength is referred to as maximal voluntary isometric contraction (MVIC).
Many lifters are familiar with the term 1 Repetition Maximum (1RM) which is the weight which
can be lifted only once in perfect form. For all practical purposes MVIC is equal to 1RM.
As a general rule, MVIC is proportional to a muscle’s cross sectional area (CSA,
essentially its size). However, there is also a neural component of strength and some have
suggested that size and strength can be developed preferentially. Schematically, maximal
strength can be represented as (1)
MVIC/1RM = muscle CSA * neural factors
An individual with well-developed neural factors but small muscle CSA would have overall
lower maximal force capacity than an individual with the same neural factors but larger muscles.
By the same token, an individual with a large muscle CSA but poorly developed neural factors
would not achieve his or her strength potential.
Adaptations from strength training occur both centrally, in the nervous system, and
peripherally, in the muscle itself (2,3). The major nervous system adaptations to strength
training include increased Type IIb fiber recruitment, increased rate coding (the number of
signals sent to the muscle), a decrease in activity of non-involved or opposing muscles during
activity (called disinhibition), better motor unit synchronization within a single muscle, better
synchronization between several muscles involved in the same movement (i.e. pectorals, deltoids
and triceps in the bench press), and changes in muscle fiber recruitment as exercises are learned
(1, 3-10)
Peripherally, the primary adaptation is an increase in muscle CSA with preferential
growth occurring in the Type II fibers (11,12). Growth also occurs in the Type I fibers, simply to
a smaller degree. Muscle growth can potentially occur in one of two ways: hypertrophy or
206
hyperplasia. Hypertrophy is an increase in the actual size of the individual muscle fibers while
hyperplasia refers to an increase in the total number of muscle fibers (1). While hyperplasia has
been repeatedly documented in animals, it is not believed to contribute to human muscle growth
to a significant degree (13-15). If hyperplasia were to occur in humans, it would be most likely to
occur with heavy eccentric loading and slow movement speeds (13).
Timing for central versus peripheral adaptations
The time course for the different adaptations to strength training has been studied using a
variety of testing protocols. During the first four to eight weeks of training, there typically is an
increase in MVIC without an increase muscle size. This implies that the majority of changes
during this time period are occurring due to the neural adaptations outlined above (6,11,16-18).
In beginning trainees, increases in muscle size do not begin to occur during the first 4-5
week (12,19) and may contribute to further increases in strength for several years. Eventually
the muscles reach a genetic upper limit in terms of strength and size which can only be
surpassed with the use of growth enhancing drugs (20). Once muscle size has reached this limit,
further increases in strength can occur due to improved technique and further neural adaptation
(1).
Beginning weight trainers should not expect to see increases in muscle size until the fourth
or fifth week of training. Although strength is increasing, the improvements are mainly in the
nervous system and simply reflect ‘learning’ how to lift weights (6,21). Some beginners are
unable to recruit the largest Type II muscle fibers which may explain the delay in growth.
(1,6,22).
Differences between bodybuilders vs. powerlifters
As stated above, some training authorities have suggested that neural factors and muscle
CSA can be developed differentially (23-25). Although little research appears to have directly
examined this assumption, we may be able to gain insight from comparisons of the adaptations
seen in elite powerlifters and bodybuilders. Powerlifters typically train with low reps often
considered the ‘neural’ training zone ; while bodybuilders typically train with higher reps, often
considered the ‘growth’ zone. Please note that it is impossible to know for certain if the following
adaptations are a result of the type of training done or individual genetics. The major differences
between powerlifters and bodybuilders appears in table 1. With the exception of total number of
muscle fibers, all of the characteristics listed have been shown to change with training.
Overall, it appears that bodybuilding training has the effect of increasing muscular
endurance (i.e. capillary density and mitochondrial density) probably due to the higher levels of
lactic acid produced with a program of high volume and short rest periods. In essence, typical
bodybuilding programs are similar to interval training in terms of the adaptations seen. It has
been suggested that bodybuilding training preferentially cause sarcoplasmic hypertrophy, which
is growth of non-contractile components such as mitochondria and capillaries, while powerlifting
training causes the actual muscle fiber growth (3,23,24,33).
207
Table 1: A comparison of bodybuilders and powerlifters
Characteristic
Type IIb fiber size (3,15,26)
Type II fiber number (13,26,27)
Capillary density (3,11,15,27,28)
Tolerance to lactic acid (29)
Sarcoplasmic volume (30)
Mitochondrial density (3,15,30,32)
Activate lipolysis during training (13)
Total number of muscle fibers (30)
Bodybuilders
Smaller
Lower
Higher
Higher
Higher
Higher?
Yes
Same?
Powerlifters
Larger
Higher
Lower
Lower
Lower
Lower
No
Same?
Adaptations in capillary density and mitochondrial volume are affected by the
specifics of the training program and are linked to lactic acid levels. Generating high amounts of
lactic acid (using long set times, around 60 seconds) may stimulate capillary growth and
increases in mitochondria similar to what is seen with aerobic training.
Several authors have suggested 20 to 60 seconds as the ideal time range for muscle
growth (23-25) and we might tentatively subdivide that time period into the adaptations listed in
table 2.
Table 2: Set time and the possible adaptations seen
Time/set
5-20 seconds
20-30 seconds
30-45 seconds
45-60 seconds
#Reps *
1-5
4-6
12-15
25+
Primary Adaptation seen
Neural improvement
Growth of Type IIb fibers
Growth of Type IIa fibers
Increased sarcoplasmic volume (glycogen,
mitochondria, capillaries, etc).
* assumes 3-5 seconds per repetition.
Section 2: What Causes Muscle Growth?
Weight training results in an alteration in the rate of protein synthesis and degradation
(34,35). Following resistance training, levels of 3-methylhistidine (a marker of protein
breakdown) increase (34) and protein synthesis increases over the next 24-36 hours (36-38).
Although the exact stimulus for growth is not known, research supports one or more of the
following factors as critical to stimulate growth: high tension, metabolic work, eccentric muscle
actions and the hormonal response to training (33,39-41). Additionally, sufficient nutrients and
protein must be available to support the synthesis of new muscle proteins. Each factor is
discussed in further detail.
208
Tension
For a fiber to adapt, it must be used during an activity (24). Recall from chapter 17 that
muscle fiber recruitment is primarily determined by the load which must be lifted. The minimum
tension considered to stimulate growth and strength gains is roughly 60% of 1RM. Recall also
that muscle fibers continue to be recruited up to about 80-85% of 1RM at which time further
force production occurs through rate coding. Therefore optimal Type II muscle fiber involvement
will occur with loads between 60-85% of 1RM (approximately 6-20 reps). However, simply
recruiting a fiber is not sufficient to make it adapt.
Metabolic work
Once a muscle fiber is recruited, it must do more work than normal for adaptations to
occur (40). Recent research has found that muscle growth is greater with longer sets and that
the metabolic changes (increased blood metabolites such as lactic acid, phosphate, etc) seen with
longer set times may be part of the growth stimulus (42-44). It has also been suggested that
increased levels of lactic acid may play a role in the growth stimulus possibly explaining why sets
of 20-60 seconds (in the anaerobic glycolysis range) seem to give better growth than shorter sets
(45).
Tension plus metabolic work: the time under tension hypothesis
Factors 1 and 2 combined make up the time under tension (TUT) hypothesis of growth
(39,46). TUT simply says that fibers must develop sufficient tension for a sufficient time period
to adapt. While the exact amount of time necessary to stimulate growth is not known and will
most likely vary from muscle fiber to muscle fiber, it has been suggested that set times between
20-60 seconds (corresponding with anaerobic glycolysis) be used for one or more sets (23,24,46).
Even within the context of high tension for sufficient time, growth is not guaranteed. We also
need to consider how the time under tension is spent. Although muscles only contract, depending
on the relationship between the force generated, and the load which must be lifted, one of three
types of muscle actions can occur.
The first is referred to as a concentric muscle action, where the muscle shortens while
contracting, lifting the weight. The second is isometric muscle action, where the muscle does not
change length while contracting, and the weight does not move. The third is eccentric muscle
action, where the muscle lengthens while contracting, and the weight is lowered.
Performing 40 seconds of pure concentric work is not the same as performing 40 seconds
of isometric work is not the same as performing 40 seconds of pure eccentric work. The third
part of the growth stimulus is thought to be the eccentric muscle action, which has different
characteristics than concentric or isometric actions.
209
An eccentric muscle action
Numerous studies have have compared concentric only training to eccentric only training.
Most find that the eccentric training groups experiences more growth even when the total
number of repetitions (time under tension) performed by both groups is identical (2,47-51) .
There are a number of physiological differences between the performance of concentric and
eccentric muscle actions, summarized below. In general, force capacity during an eccentric
muscle action is approximately 30-40% greater than that during a concentric muscle action (8,9).
That is, if 100 pounds can be lifted by a muscle, typically 130 to 140 pounds can be lowered.
Additionally, Type II muscle fibers (which show the greatest amount of growth) are
preferentially recruited during eccentric actions (8,9). As Type II fibers have a greater force
production capacity than Type I, this may partly explain the greater strength seen during
eccentric training.
During eccentric muscle actions, fewer muscle fibers are recruited (8,9). This means that
the fibers recruited receive more overload per fiber (54) which may explain the preferential
growth seen. Finally, eccentric but not concentric lifting stimulates protein synthesis (9).
If eccentric actions are the primary stimulus for growth, the question arises of why
perform concentric (lifting) muscle actions at all? First and foremost, concentric actions are
responsible for most of the metabolic work during training contributing 84% of the total metabolic
work (49). Additionally, concentric strength limits eccentric strength (55). That is, you can only
lower as much weight as you can lift unless you have partners lift the weight for you, so that it
can be lowered. This implies that periods of concentric only training (to improve concentric
strength capacity) may be useful so that more weight may be used during the eccentric portion of
the lift.
A final observation about eccentric training is that heavy eccentric loading is associated
with most of the muscle soreness from training (56). Twenty-four to thirty-six hours after
training, soreness occurs and is called delayed onset muscle soreness (DOMS). DOMS is thought
to reflect direct mechanical damage (small tears) in the muscle fibers (57). Following eccentric
induced trauma, the muscle undergoes an adaptation to prevent further damage and DOMS from
the same overload (58).
It has also been suggested that tears to the cell membrane allow calcium to flow into the
cell, activating enzymes which break down protein (59,60). Full recovery from this type of
eccentric trauma is completed with 4-7 days suggesting that the same muscle should not be
worked any more frequently than that, at least not with heavy eccentric contractions.
Another possible mechanism by which eccentric muscle actions may be involved in muscle
growth is through satellite cell proliferation (61). Satellite cells are a type of cell located on the
surface of muscle fibers involved in muscle cell regrowth.
In response to both hormonal and mechanical stimuli (such as muscle damage), satellite
cells become active to help with tissue repair. In animal models, satellite cell activity is involved
in muscle hyperplasia (generation of new muscle fibers). Although hyperplasia does not appear
to play a role in human growth (14), heavy eccentric muscle actions may have the capacity to
stimulate satellite cell proliferation by damaging the cell and causing a local release of insulin-like
growth factor 1 (IGF-1) (61-63).
210
All of the above information (tension, metabolic work, and eccentric induced damage) has
led to the development of the following schema, which requires further validation, for muscle
damage and growth. (59)
1. Depending on the force requirements, a given number of muscle fibers are recruited.
2. The recruited muscle fibers fatigue from performing metabolic work.
3. Upon reaching fatigue, individual fibers reach a point, termed ischemic rigor, where they
physically ‘lock up’ due to insufficient ATP. This ‘locking up’ occurs during the concentric part of
the movement
4. The subsequent eccentric muscle action causes small tears to occur in the muscle, stimulating
remodeling and growth.
The schema presented above fits well with the TUT hypothesis. To stimulate the
maximum number of fibers requires performing a high set time with a high tension (within a
range of 20-60 seconds). As each fiber has a different fatigue time (based on its physiological
characteristics), each will require a relatively shorter or longer set time to lock up and be
damaged. As only the fibers which are fatigued and damaged will adapt by the subsequent
eccentric contraction, varying set times may be necessary for optimal growth (24).
The hormonal response to weight training
Weight training affects levels of many hormones in the human body depending on factors
such as order of exercise, loads, number of sets, number of repetitions, etc. The primary
hormones which are affected by weight training are growth hormone (GH), testosterone, the
catecholamines, and cortisol.
The hormonal response to exercise is thought to be of secondary importance to the factors
listed above in terms of muscle growth. With the exception of testosterone, the hormonal
response to weight training primarily affects fuel availability and utilization (64).
GH is a peptide hormone released from the hypothalamus in response to many different
stimuli including sleep and breath-holding (65). At the levels seen in humans, its main role is to
mobilize fat and decrease carbohydrate and protein utilization (66). The primary role of GH on
muscle growth is most likely indirect by increasing release of IGF-1 from the liver (66).
GH release during weight training appears to be related to lactic acid levels and the highest
GH response is seen with moderate weights (~75% of 1RM), multiple long sets (3-4 sets of 10-12
repetitions, about 40-60 seconds per set) with short rest periods (60-90 seconds). Studies using
this type of protocol (generally 3X10 RM with a 1’ rest period) have repeatedly shown increases in
GH levels in men (67,68) and women (69,70) and may be useful for fat loss due to the lipolytic (fat
mobilizing) actions of GH. Multiple sets of the same exercise are required for GH release (70).
Testosterone is frequently described as the ‘male’ hormone although women possess
testosterone as well (at about 1/10th the level of men or less) (1). Testosterone’s main role in
muscle growth is by directly stimulating protein synthesis (65,71). Increases in testosterone
occur in response to the use of basic exercises (squats, deadlifts, bench presses), heavy weights
(85% of 1RM and higher), multiple short sets (3 sets of 5 repetitions, about 20-30 seconds per
211
set) and long rest periods (3-5 minutes). Studies have found a regimen of 3X5RM with 3’ rest to
increase testosterone significantly in men (67,68,72) but not in women (69). It is unknown
whether the transient increase in testosterone following training has an impact on muscle
growth.
IGF-1 is a hormone released from the liver, most likely in response to increases in GH
levels (62). However, the small increases in GH seen with training do not appear to affect IGF-1
levels (73). More likely, IGF-1 is released from damaged muscle cells (due to eccentric muscle
actions) and acts locally to stimulate growth (42,63).
Cortisol is a catabolic hormone meaning that it breaks down larger substances to smaller
(i.e. triglycerides to fatty acids and glycerol, and proteins to amino acids). It is released from the
adrenal cortex in response to stress such as exercise or starvation. Cortisol may have a role in
the tissue remodeling seen with heavy resistance training as it increases protein breakdown at
high levels (1). Increases in cortisol tend to mirror the increases seen in growth hormone (74) and
it has been suggested that the increase in cortisol is a necessary part of the muscle remodeling
stimulus. (65,70) The basis for this is that the breakdown of tissue is necessary to stimulate a
rebuilding of that same tissue.
The major role of catecholamines (adrenaline and noradrenaline) is fuel utilization. As
described previously, increases in levels of adrenaline and noradrenaline increase liver output of
glucose, mobilize fat from adipose tissue, and stimulate glycogen breakdown in muscles. High
intensity weight training with multiple exercises increases catecholamine levels similar to that
seen in sprint training (65,75). The overall effect of the rise in catecholamine levels is an increase
in blood glucose and stimulation of fat breakdown.
Adequate nutrients and energy
Once muscle growth is stimulated, the final requirement for growth to actually occur is an
excess of nutrients and energy (63). Reduced calorie diets put the body in a systemically
catabolic (tissue breakdown) condition due to changes in hormone levels. Low-calorie diets cause
a decrease in growth promoting hormones such as insulin and thyroid while increasing growth
inhibiting hormones such as adrenaline, glucagon, and cortisol (63). Similarly, overfeeding causes
and increase in those same hormones and an increase in lean body mass as well as fat (76). It is
generally impossible, except for beginners or those returning from a layoff, for most individuals to
gain muscle while losing fat at the same time.
Simply put, the body must either be systemically catabolic (for fat loss) or systemically
anabolic (for muscle gain). Attempting to gain significant amounts of muscle while losing fat at
the same time or vice versa tends to minimize the results of either goal. Most individuals find
that focusing on either fat loss or muscle growth yields the best results. The CKD is somewhat
unique among diets in that it couples a catabolic phase (at below maintenance calories) with an
anabolic phase (at above maintenance calories), meaning that the potential to gain muscle and
lose fat simultaneously exists. This topic is discussed in greater detail in chapter 12.
212
Progressive overload: the ultimate determinant of growth
Irrespective of the above factors, the ultimate key to larger and stronger muscles is
progressive overload. Individuals have achieved growth using from 1 rep to 50 reps with a
number of different protocols, so it is impossible to say unequivocally that there is a ‘best’
program for stimulating growth. As long as stress continues to be applied to the body and
muscles are forced to work against progressively greater loads, assuming adequate recovery and
nutrients are provided, growth should occur in the long run. The above discussion is an attempt
to optimize the nature of the growth stimulus. A summary of the requirements for growth
appear in table 3.
Table 3: Summary of training requirements for growth
1. Use weights between 60-85% of maximum (roughly 6-20 reps)
2. Use a controlled eccentric (lowering) movement.
3. Apply proper progressive overload.
4. Supply adequate nutrients and allow adequate recovery
5. Train a muscle once every 4-7 days.
Section 3: Energy Metabolism during weight training
During muscular contraction above 20% of 1RM, blood flow to the muscle is blocked (90)
and energy production comes solely from anaerobic sources such as the breakdown of ATP-CP
and glycogen depending on the length of the set (see chapter 19 for more details). Weight training
cannot use fat for fuel during a set. However, fat breakdown increases during heavy weight
training (91,92) indicating that fat may be used during recovery between sets to replenish ATP.
Increases in fat breakdown during weight training are most likely stimulated by the hormonal
response to training, especially increases in levels of adrenaline and noradrenaline.
Fatigue during weight training is addressed in section 4 based on energy systems. Sets of
1-5 repetitions, as typically used by powerlifters and lasting 20 seconds or less, are discussed
separately from sets of 20-60 seconds, typically used by bodybuilders. The metabolism of both
energy systems are discussed in the previous chapter and are not be repeated here.
Section 4: Fatigue and weight training
As discussed in chapter 18, the impact of a total lack of carbohydrates on endurance
training is very consistent: performance is maintained or improved at low intensities (below 75%
of maximum heart rate) but decreased at higher intensities (75-85% of maximum heart rate or
approximately the lactate threshold). However, the effects of a ketogenic diet on weight training
are not as well established.
213
Weight lifting recruits all three fiber types. Although Type I fibers have little anaerobic
potential for energy production, all fiber types will produce energy anaerobically (through the
degradation of ATP-CP and glycogen) during weight training. Thus, a carbohydrate-free diet
should negatively effect performance.
Fatigue during weight training can have one of three potential causes: metabolic (related to
depletion of fuel or accumulation of waste products), neural (due to impairment in nervous
system activation of the muscle), and non-metabolic (everything else).
Metabolic causes of fatigue
The potential metabolic causes of fatigue during weight training depend on the length of the
set being performed and the energy system which is being primarily used. During very short
weight training sets (less than 20 seconds), the metabolic cause of fatigue is most likely depletion
of creatine phosphate (CP). Although ATP never drops more than 20% below resting values even
at exhaustion (93), CP may be fully depleted after 20 seconds of maximal intensity exercise.
Although CP may be 96% resynthesized within 3 minutes (55), force production capacity
frequently takes longer to recover to normal, as much as 4-5 minutes (8). This suggests an
additional component of fatigue during this type of exercise (see neural fatigue below).
Lactic acid is not generated to any great degree during exercise of this short duration and is
unlikely to be a cause of fatigue. However, in general, lactic acid impairs muscle fiber
recruitment (8) which has implications for warm-ups and workout design. Raising lactic acid with
high repetition sets or high intensity aerobics will impair performance during short rep sets. To
the contrary, moving to your heaviest weights (and lowest rep sets) first and then performing
high reps sets afterwards will prevent high lactic acid levels from causing early fatigue. This is
further discussed in the section on proper warm-ups and weight training systems.
For longer weight training sets of 20-60 seconds, anaerobic glycolysis is activated relying
primarily on glycogen breakdown for ATP production. Intramuscular triglycerides may also play
a role in energy production, especially when short rest periods are used (91). However, fatigue
can occur even when glycogen stores are still fairly high. This indicates that, in general, there is
another cause of fatigue during weight training, most likely the buildup of metabolites that affect
force production (90).
During weight training of 20-60 seconds duration, the exact cause of fatigue is not known
(53). It is most likely related to buildup of lactic acid, H+ and other metabolites within the cell
that directly affect force production. However, individuals suffering from McArdle’s disease (a
total inability to use glycogen for fuel) show fatigue during high intensity exercise with no change
in lactic acid levels suggesting other causes of fatigue (94).
Increases in H+ lowers muscle and blood pH both of which inhibit force production in the
muscle (95,96). During exercise, lactate and H+ is removed from the muscle cell where it can be
buffered in the bloodstream by bicarbonate and myoglobin (97). Lowering blood pH decreases
performance (98), while increasing the buffering capacity of the blood by ingesting sodium
bicarbonate improves performance (95,99,100).
214
Neural fatigue
In addition to the metabolic causes of fatigue discussed above, there is also a neural
component of fatigue. When, a ‘diverting’ activity (such as light activity of another limb) is
performed in-between bouts of high intensity activity , force output is maintained at a higher
level than if the diverting activity is not performed (101,102). This has been attributed to
‘distracting’ the nervous system, allowing faster recovery.
During a weight training session, alternating exercises with different bodyparts (i.e. one set
for legs, one set for chest) allows for greater recovery because of this diverting activity (as well as
giving more rest time between sets). Physical therapists have long known that the contraction of
one muscle (for example the biceps) causes the antagonist muscle (in this case, the triceps) to
relax. So alternating sets for opposing muscle groups (i.e. one set for biceps, rest, one set for
triceps) may allow greater force production and decrease fatigue (103).
Other causes of fatigue
Finally, there are possible non-metabolic causes of fatigue. During muscular contraction,
signals are sent from the brain to the muscle, eventually reaching the muscle fibers through a
structure called the sarcoplasmic reticulum (SR). Normal SR function may be impaired during
exercise and this impairment may be related to a loss of intracellular potassium (71,104,105).
Muscle potassium levels are decreased on a ketogenic diet as a result of glycogen depletion (104)
further implicating glycogen depletion as one source of fatigue on a ketogenic diet.
Additionally a glycogen-SR complex has been proposed (106) such that depletion of
glycogen may physically impair conduction of signals to the muscle. Finally, the intracellular
dehydration seen with a ketogenic diet may also affect strength levels (52,104,107,108).
Summary
Regardless of the ultimate cause of fatigue during weight training, glycogen depletion has
the potential to decrease performance through one of several mechanisms. Until more research
is done, we can only speculate as to the exact cause of fatigue. For the purpose of the ketogenic
diet, the exact cause of fatigue is more an academic question than a practical one. It is a basic
physiological fact that Type II fibers require glycogen to function optimally. Therefore, a SKD
will eventually decrease performance as well as inhibit muscle growth. Individuals who wish to
weight train on a ketogenic diet will have to consume carbohydrates at some point.
215
Section 5: Effects of the Ketogenic Diet
on Weight Training
Relatively few studies have examined the effects of carbohydrate depletion on resistance
training. Typically, researchers measure maximal force production during a single isometric
contraction or muscular endurance during multiple rep sets during isokinetic exercise. Isokinetic
exercise machines are special types of weight training equipment that control speed of
movement. They are typically not found outside the laboratory and may not be an applicable
model to normal strength training.
As a general rule, the maximum amount of force generated ultimately depends on Type II
muscle fibers while muscular endurance depends more on Type I fibers. The effects of glycogen
depletion on force production is fiber type specific. Glycogen depletion of only Type I fibers does
not impair maximum force but decreases muscular endurance as would be expected (109,110).
Glycogen depletion in both Type I and Type II fibers causes a decrease in both maximal force
production and muscular endurance (109). In contrast, one study found that depleting both
muscle fiber types of glycogen to approximately 40 mmol/kg did not cause a decrease in force
production or muscular endurance (111).
It is difficult to draw conclusions with regards to strength training from these studies as
performance was only measured during a single set. Multiple sets of weight training are much
more likely to be affected by glycogen availability. As discussed in the section on interval
training, glycolysis may be impaired when glycogen levels fall below a critical level (40 mmol/kg).
Although data on strength training is lacking to verify or deny this concept, many individuals
report fatigue during weight training sessions performed later in the week, so something is
occurring.
Not all lifters report this occurrence though so it may simply be individual, related to the
total amount of training done during the week. Individuals who perform a high volume of training
(number of sets) during the early part of the week tend to report a drop in performance compared
to those who do not. This suggests that the fatigue is local (i.e. glycogen depletion, dehydration,
potassium loss) rather than systemic (i.e. changes in blood pH) as discussed in section 4.
Long term ketogenic diet and high intensity activity
At this time, only one study (112) has examined high intensity exercise performance after
long term adaptation to a ketogenic diet, finding no decrease in performance. As performance at
higher intensities are generally determined by non-oxidative metabolism, it seems unlikely that
long term adaptation to a ketogenic diet would have an effect on exercise of this type. Since no
research on this topic exists, any long term effects on performance are purely speculative at this
time. The main determinant in performance in weight training is probably muscle glycogen
levels. Thus, the amount of work that can be performed in a given workout will depend on
starting muscle glycogen levels.
216
Summary
When muscle glycogen falls to extremely low levels (about 40 mmol/kg), anaerobic exercise
performance may be negatively affected. Individuals following a ketogenic diet who wish to lift
weights or perform sprint training must make modifications by consuming carbohydrates for
optimal performance as discussed in chapter 10 through 12.
During long term ketogenic diets, muscle glycogen maintains at about 70 mmol/kg (113115) leaving a ‘safety factor’ of about 30 mmol/kg at which time glycolysis will most likely be
impaired.
Section 6: Other Topics
Beyond the adaptations and effects of the ketogenic diet discussed above, there are several
other topics regarding weight training that need to be discussed. This includes the effects of
combining strength and endurance training, gender differences, and the effect of detraining.
Combining strength and endurance training
Many individuals wish to combine strength and endurance training in their exercise
program. Whether it’s a pre-contest bodybuilder looking to shed fat or an individual looking for
basic fitness, the combination of weight and aerobic training is a topic of interest. Keep in mind
that the general adaptations to aerobic/interval training are to make muscle fibers more aerobic
and enduring while the adaptations to weight training are to make the fibers larger and stronger.
These two adaptations are somewhat at odds with one another (77). Therefore, we might expect
the combination of both types of training to impair overall adaptations.
Several studies have examined the physiological effects of various combinations of aerobic
exercise with resistance training. With one exception, these studies find a decrease in the
strength gains seen in individuals performing both resistance training and high intensity aerobics
(78-80). The decrease in strength typically occurs after 8 weeks. However, these studies have
problems that need to be addressed.
First, the combined training groups (endurance and strength) typically train their legs
more total days than either the strength or endurance only groups. So, the interference effects
may simply reflect local overtraining (78). One recent study examined this possibility, having
subjects perform strength and aerobic training a total of three days per week so that all groups
only trained three days per week total (81). No decrease in strength improvements were seen
which further suggests local overtraining of the legs as the cause of the strength impairments.
Second, the studies cited used heavy resistance training in combination with interval
training (as a football player or rugby player might be expected to train) (78-80). High intensity
aerobic training recruits Type II muscle fibers, causing them to become smaller and more
aerobic. The body can generally only adapt maximally in one direction or another so it may
217
simply be that combining heavy strength training with HIGH intensity aerobic training is the
problem.
In direct contrast to the data presented above, when endurance athletes (cyclists and
runners) perform heavy resistance training, endurance performance improves (82,83). This
further supports that the studies above were simply measuring overtraining rather than true
interference effects of strength and aerobic training.
No one has examined the effects of combining weight training with low intensity aerobic
training only. Anecdotally, many individuals find that a small amount of aerobic training,
perhaps 20 minutes, two to three times per week at a low intensity (heart rate at least 15
beats/minute below lactate threshold) may aid in recovery by improving blood flow and general
conditioning (23). As well, individuals trying to gain weight find that a small amount of aerobics
can stimulate hunger.
Individuals wishing to maximize performance in the weight room are discouraged from
performing extensive amounts of aerobic training, especially at high intensities (77). However,
small amounts of aerobic training should not be detrimental, and may even aid in recovery and
overall performance.
Gender Differences
Under a microscope, there is no physiological difference between women’s muscle and
men’s. By the same token, men and women’s muscle respond similarly to training. When placed
on the same training program, women respond as well if not better than men do (84-86). Women
can gain muscle in the same fashion as male trainees do, just not to the same levels typically
seen in males (12,19).
The largest difference between male and female trainees is in the ultimate level of
muscular development which can occur. The majority of this difference in trainability is due to
differences in testosterone levels. Women have lower levels of testosterone at rest (65,86) and do
not show the same increase from training as men (1,69).
There is preliminary data that women should be trained differently during the different
phases of the menstrual cycle. However, this requires more research (87). For the time being,
there is no evidence that men and women should follow different training programs (84).
Detraining
For various reasons, athletes frequently have to take time away from training and a
discussion of detraining is necessary. The deadaptations from stopping weight workouts are
essentially the opposite of the initial adaptations. Recall that the initial adaptations to strength
training are neural with adaptations in the muscle occurring later. Detraining occurs in the
reverse order. Maximal strength begins to drop within a week but muscle size does not begin to
decrease for at least 2 weeks (18,88) reflecting a decrease in the neural aspects of strength
(13,18).
218
This has implications for any individual who must cease training, including pre-contest
bodybuilders. Individuals who must stop training for some time simply need to realize that the
initial drop in strength is neural and not related to a loss of muscle mass. As little as one heavy
weight training session has been shown to maintain strength and size for 8 weeks (89).
For pre-contest bodybuilders, as the contest gets closer and dieting begins to take its toll,
many individuals will have to reduce their training weights. As long as training is maintained at
high loads until 2 weeks before the contest, no muscle mass should be lost. In fact, many
individuals find that they increase muscle size during the last two weeks of the contest as
muscles fully repair.
Finally, during detraining, growth hormone and testosterone increase while cortisol
decreases possibly explaining the maintenance of muscle size with no training (88). Also,
strength gains during detraining are better maintained if eccentric contractions have been
performed during training (48). Therefore, individuals who must take time off may want to
slightly overtrain themselves (with an emphasis on eccentric muscle actions) prior to their layoff.
The hormonal response during detraining should help to maintain and perhaps even increase size
and strength.
References Cited
1. “Strength and Power in Sport” Ed. P.V. Komi Blackwell Scientific Publications 1992.
2. Hortobagyi T et. al. Greater initial adaptations to submaximal muscle lengthening than
maximal shortening. J Appl Physiol (1996) 81: 1677-1682.
3. Kraemer WJ et. al. Physiological adaptations to resistance exercise: Implications for athletic
conditioning. Sports Med (1988) 6:246-256.
4. Ploutz L et. al. Effect of resistance exercise on muscle use during exercise. J Appl Physiol
(1994) 76: 1675-1681.
5. Fleck S and Kraemer W. Resistance Training: basic Principles (Part 3 of 4). Physician and
Sportsmedicine (1988) 16 May: 63-72.
6. Sale D. Neural adaptations to resistance training. Med Sci Sports Exerc (1988) 20 (Suppl)
20: S135-S145.
7. Behm DG. Neuromuscular implications and adaptations of resistance training. J Strength and
Cond Res (1995) 9: 264-274.
8. “Neuromechanical basis of kinesiology” Roger M. Enoka. Human Kinetics Publishers 1994.
9. “Skeletal muscle: Form and Function” Alan J. McComas. Human Kinetics Publishers 1996.
10. Bernardi M et. al. Motor unit recruitment strategy changes with skill acquisition. Eur J Appl
Physiol (1996) 74: 52-59.
11. Kraemer WJ et. al. Strength and Power training: Physiological mechanisms of adaptation.
Exercise and Sports Science Reviews (1997) 363-397.
12. Staron RS et. al. Skeletal muscle adaptations during early phase of heavy-resistance training
in men and women. J Appl Physiol (1994) 76: 1247-1255.
13. Abernathy PH et. al. Acute and chronic response of skeletal muscle to resistance exercise.
Sports Med (1994) 17: 22-38
14. Antonio J and Gonyea WJ. Skeletal muscle fiber hyperplasia. Med Sci Sports Exerc (1993)
25: 1333-1345.
15. Fleck S and Kraemer W. Resistance Training: basic Principles (Part 2 of 4). Physician and
219
Sportsmedicine (1988) 16 April: 108-117.
16. Sale DG et. al. Hypertrophy without increased isometric strength after weight training. Eur J
Appl Physiol (1992) 64: 51-55.
17. Komi PV. Training of muscle strength and power: interactions of neuromotoric, hypertrophic,
and mechanical factors. Int J Sports Med (1986) 7 (suppl): 10-15.
18. Houston ME et. al. Muscle performance, morphology, and metabolic capacity during strength
training and detraining: a one leg model. Eur J Appl Physiol (1983) 51: 25-35.
19. Staron RS et. al. Muscle hypertrophy and fast fiber type conversions in heavy resistancetrained women. Eur J Appl Physiol (1990) 60: 71-79.
20. Alway SE et. al. Effects of resistance training on elbow flexors of highly competitive
bodybuilders. J Appl Physiol (1992) 72: 1512-1521.
21. Hakkinen K and Komi P. Training-induced changes in neuromuscular performance under
voluntary and reflex conditions. Eur J Appl Physiol (1986) 55: 147-155.
22. Ruther CL et. al. Hypertrophy, resistance training, and the nature of skeletal muscle
activation. J Strength and Cond Res (1995) 9: 155-159.
23. “Supertraining: Special Training for Sporting Excellence” Mel Siff and Yuri Verkoshanksy,
School of Mechanical Engineering Press 1993.
24.“Science and practice of strength training” Vladimir Zatsiorsky, Human Kinetics 1995.
25. “Program Design: Choosing sets, reps, loads, tempo and rest periods” Paul Chek,
Paul Chek Seminars 1996.
26. Tesch PA and Larson L. Muscle hypertrophy in bodybuilders. Eur J Appl Physiol (1982)
49: 301-306.
27. Tesch P. Skeletal adaptations consequent to long-term heavy resistance exercise. Med Sci
Sports Exerc (1988) 20 (Suppl): S132-S134.
28. Tesch PA et. al. Muscle capillary supply and fiber type characteristics in weight and power
lifters”.J Appl Physiol (1984) 56: 35-38.
29. Kraemer WJ et. al. Physiologic response to heavy-resistance exercise with very short rest
periods. Int J Sports Med (1987) 8: 247-252.
30. MacDougall KD et. al. Muscle ultrastructural characteristics of elite powerlifters and
bodybuilders. Eur J Appl Physiol (1982) 48: 117-126.
31. Kuipers H and Keizer HA. Overtraining in elite athletes: Review and directions for the future.
Sports Med (1988) 6: 79-92.
32. Alway SE et. al. Functional and structural adaptations in skeletal muscle of trained athletes.
J Appl Physiol (1988) 64: 1114-1120.
33. Jones DA. Strength of skeletal muscle and the effects of training. British Med Bulletin (1992)
48: 592-604.
34. Viru A. Mobilisation of structural proteins during exercise. Sports Medicine (1987) 4: 95-128.
35. Yarasheski KE et. al. Acute effects of resistance exercise on muscle protein synthesis rate in
young and elderly men and women. Am J Physiol (1993) 265:E210-E214.
36. Chesley A et al. Changes in human muscle protein synthesis after resistance exercise.
J Appl Physiol (1992) 73:1383-8.
37. Phillips SM et al. Mixed muscle protein synthesis and breakdown after resistance exercise in
humans. Am J Physiol (1997) 273:E99-107.
38. MacDougall JD et. al. The time course of elevated muscle protein synthesis following heavy
resistance exercise. Can J Appl Physiol (1995) 20: 480-6.
39. Jones DA and Rutherford OM. Human muscle strength training: the effects of three different
regimes and the nature of the resultant changes. J Physiol Lond (1987) 391: 1-11.
220
40. Goldberg AL et. al. Mechanism of work-induced hypertrophy of skeletal muscle. Med Sci
Sports Exerc (1975) 7: 185-198.
41. Booth FW. Perspectives on molecular and cellular exercise physiology. J Appl Physiol (1988)
65: 1461-1471.
42. Smith R and Rutherford OM. The role of metabolites in strength training I. A comparison of
eccentric and concentric contractions. Eur J apply Physiol (1995) 71: 332-336.
43. Smith R and Rutherford OM. The role of metabolites in strength training II. Short versus
long isometric contractions. Eur J Appl Physiol (1995) 71: 337-347.
44. Rooney KJ et. al. Fatigue contributes to the strength training stimulus. Med Sci Sports
Exerc (1994) 26: 1160-1164.
45. Hunt T. Can wound healing be a paradigm for tissue repair? Med Sci Sports Exerc (1994)
26: 755-758.
46. “Current trends in strength training” Charles Poliquin Dayton Publishing Group 1997.
47. Hortobagyi T et. al. Adaptive responses to muscle lengthening and shortening in humans.
J Apply Physiol (1996) 80: 765-772.
48. Colliander EB and Tesch PA. Effects of detraining following short term resistance training on
eccentric and concentric muscle strength. Acta Physiol Scand (1992) 144: 23-29.
49. Dudley GA et. al. Influence of eccentric actions on the metabolic cost of resistance exercise.
Aviat Space Environ Med (1991) 62: 678-682.
50. Hather BM et. al. Influence of eccentric contractions on skeletal muscle adaptations to
resistance training. Acta Physiol Scand (1991) 143: 177-185.
51. Armstrong RB Mechanisms of exercise-induced muscle fibre injury. Sports Med (1991)
12: 184-207.
52. Physiology of Sport and Exercise” Jack H. Wilmore and David L. Costill. Human Kinetics
Publishers 1994.
53. “Exercise Physiology: Human Bioenergetics and it’s applications” George A Brooks, Thomas
D. Fahey, and Timothy P. White. Mayfield Publishing Company 1996.
54. Teague BN and Schwane JA. Effect of intermittent eccentric contractions on symptoms of
muscle microinjury. Med Sci Sports Exerc (1995) 27: 1378-1384.
55. Hortobagyi T and Katch FI. Role of concentric force in limiting improvements in muscular
strength and hypertrophy. J Appl Physiol (1990) 68: 650-658.
56. Kuipers H. Exercise-induced muscle damage. Int J Sports Med (1994) 15: 132-135.
57. Clarkson PM and Newham DH. Associations between muscle soreness, damage and fatigue.
Advances in Experimental Medicine and Biology 384: Fatigue Ed: Simon C Gandevia et al.
Plenum Press 1995.
58. Clarkson P and Tremblay I. Exercise-induced muscle damage, repair, and adaptation in
humans. J Appl Physiol (1988) 65: 1-6.
59. Friden J and Lieber RL. Structural and mechanical basis of exercise-induced muscle injury.
Med Sci Sports Exerc (1992) 24: 521-530.
60. Colliander EB and Tesch PA. Effects of eccentric and concentric muscle actions in resistance
training. Acta Physiol Scand (1990) 140: 31-39.
61. White T and Esser K. Satellite cell and growth factor involvement in skeletal muscle growth.
Med Sci Sports Exerc (1989) 21 (Suppl): S158-S163.
62. Cooper D. Evidence for and mechanisms of exercise modulation of growth - an overview.
Med Sci Sports Exerc (1994) 26: 733-740.
63. DeVol DL et. al. Activation of insulin-like work-induced skeletal muscle growth. Am J Physiol
(1990) 259: E89-E95.
221
64. Borer K. Neurohumoral mediation of exercise-induced growth. Med Sci Sports Exerc (1994)
26:741-754.
65. Kraemer W. Endocrine responses to resistance exercise. Med Sci Sports Exerc (1989)
20 (suppl): S152-S157.
66. Rogol AD. Growth hormone: physiology, therapeutic use, and potential for abuse. Exercise
and Sports Science Reviews (1989) 17: 353-377.
67. Hakkinen K and Pakarinen A. Acute hormonal responses to two different fatiguing heavyresistance protocols in male athletes. J Appl Physiol (1993) 74: 882-887.
68. Kraemer WJ et. al. Hormonal and growth factor responses to heavy resistance exercise
protocols. J Appl Physiol (1990) 69: 1442-1450.
69. Kraemer WJ et. al. Changes in hormonal concentrations following different heavy resistance
exercise protocols in women. J Appl Physiol (1993) 75: 594-604.
70. Mulligan SE et. al. Influence of resistance exercise volume on serum growth hormone and
cortisol concentrations in women. J Strength Cond Res (1996) 10: 256-262.
71. Griggs RC et. al. Effect of testosterone on muscle mass and protein synthesis. J Appl Physiol
(1989) 66: 498-503.
72. Schwab R et. al. Acute effects of different intensities of weight lifting on serum testosterone.
Med Sci Sports Exerc (1993) 25: 1381-1385.
73. Kraemer WJ et. al. Responses of IGF-1 to endogenous increases in growth hormone after
heavy-resistance exercise. J Appl Physiol (1995) 79:1310-1315.
74. Kraemer WJ et. al. Effects of different heavy-resistance exercise protocols on plasma bendorphin concentrations. J Appl Physiol (1993) 74: 450-459.
75. Guezennec Y et. al. Hormone and metabolite response to weight-lifting training sessions.
Int J Sports Med (1986) 7: 100-105.
76. Jebb SA et. al. Changes in macronutrient balance during over- and underfeeding assessed by
12-d continuous whole body calorimetry. Am J Clin Nutr (1996) 64: 259-266.
77. Jacksin CGR et. al. Skeletal muscle fiber area alterations in two opposing modes of
resistance-exercise training in the same individual. Eur J Appl Physiol (1990) 61: 37-41.
78. Kraemer WJ et. al. Compatibility of high intensity strength and endurance training on
hormonal and skeletal adaptations. J Appl Physiol (1995) 78: 976-989.
79. Hennessy LC et. al. The interference effects of training for strength and endurance
simultaneously. J Strength Cond Res (1994) 8: 12-19.
80. Hickson RC Interference of strength development by simultaneously training for strength
and endurance. Eur J Appl Physiol (1980) 45: 255-269.
81. McCarthy JP. Compatability of adaptive responses with combining strength and endurance
training. Med Sci Sports Exerc (1995) 27: 429-436.
82. Hickson RC Strength training effects on aerobic power and short-term endurance. Med Sci
Sports Exerc (1980) 12: 336-339.
83. Hickson RC Potential for strength and endurance training to amplify endurance
performance. J Appl Phys (1988) 65: 2285-2290.
84. Holloway JB and Baechle TR. Strength training for female athletes: A review of selected
aspects. Sports Medicine (1990) 9: 216-228.
85. O’Hagen FT et. al. Response to resistance training in young women and men. Int J Sports
Med (1995) 16: 314-321.
86. Hakkinen K et. al. Neuromuscular adaptations and serum hormones in women during short
term intensive strength training. Eur J Appl Physiol (1992) 64: 106-11.
87. Reis E et. al. Frequency variations of strength training sessions triggered by the phases of
222
the menstrual cycle. Int J Sports Med (1995) 16: 545-550.
98. Hortobaygi T et. al. The effects of detraining on power athletes. Med Sci Sports Exerc (1993)
25: 929-935.
89. “Designing Resistance Training Programs, 2nd edition” W. Kraemer and S. Fleck, Human
Kinetics 1996.
90. Sahlin K. Metabolic factors in fatigue. Sports Medicine (1992) 13: 99-107.
91. Tesch PA et. al. Muscle metabolism during intense, heavy resistance exercise. Eur J Appl
Physiol (1986) 55: 362-366.
92. Essen-Gustavsson B and Tesch P. Glycogen and triglyceride utilization in relation to muscle
metabolic characteristics in men performing heavy-resistance exercise. Eur J Appl
Physiol (1990) 61: 5-10.
93. “Exercise Metabolism” Ed. Mark Hargreaves. Human Kinetics Publishers 1995.
94. Wagenmakers AJM et. al. Metabolism of Branched-Chain Amino Acids and Ammonia During
Exercise: Clues from McArdle’s Disease. Int J Sports Med (1990) 11: S101-113.
95. Jon L and Fahey TD. Sodium Bicarbonate Ingestion and Exercise Performance: An Update.
Sports Medicine (1991) 11: 71-77.
96. Vollestad NK and Sejersted OM. Biochemical correlates of fatigue. Eur J Appl Physiol (1988)
57: 336-347.
97. Juel C. Lactate/proton co-transport in skeletal muscle: regulation and importance for pH
homeostasis. Acta Physiologica Scand (1996) 156: 369-74.
98. Galloway SDR and Maughan R. The effects of induced alkalosis on the metabolic response to
prolonged exercise in humans. Eur J Appl Physiol (1996) 74: 384-389.
99. Hood VL et. al. Effect of systemic pH on pHi and lactic acid generation in exhaustive
forearm exercise, Am J Physiol (1988) 255: F479-F485.
100. Allen DG et. al. The role of intracellular acidosis in muscle fatigue. in Advanced in
Experimental Medicine and Biology 384: Fatigue Ed: Simon C Gandevia et al. Plenum
Press 1995.
101. Asmussen E and Mazin B. A central nervous system component in local muscular fatigue.
Eur J Appl Physiol (1978) 38: 9-15.
102. Asmussen E and Mazin B. A central nervous system component in local muscular fatigue.
Eur J Appl Physiol (1978) 38: 1-8.
103. Caiozzo VJ et. al. The effect of precontractions on the slow-velocity-high-force region of the
in vivo force-velocity relationship. (abstract) Med Sci Sports Exerc (1981) 13: 128.
104. Green HJ. How Important is endogenous muscle glycogen to fatigue in prolonged exercise.
Can J Physiol Pharmacol (1991) 69: 290-297.
105. Yu-Yahiro H. Electrolytes and their relationship to normal and abnormal muscle function.
Orthopaedic Nursing (1994) 13: 38-40.
106. Enteman M et. al. The sarcoplasmic reticulum glcyogenolytic complex in mammalian fast
twitch skeletal muscles. J Biol Chem (1980) 255: 6245-6252.
107. Viitasalo JT. Effects of Rapid Weight Reduction on Force Production and Vertical Jumping
Height. Int J Sports Med (1987) 8: 281-285.
108. Fogelholm M. Effects of Bodyweight reduction on sports performance. Sports Med (1994)
18: 249-267.
109. Jacobs I. Lactate concentrations after short maximal exercise at various glycogen levels.
Acta Physiol Scand (1981) 111: 465-469.
110. Young K and Davies CTM. Effect of diet on human muscle weakness following prolonged
exercise. Eur J Apply Physiol (1984) 53: 81-85.
223
111. Symons JD and Jacobs I. High-intensity exercise performance is not impaired by low
intramuscular glycogen. Med Sci Sports Exerc (1989) 21: 550-557.
112. Lambert EV et. al. Enhanced endurance in trained cyclists during moderate intensity
exercise following 2 weeks adaptation to a high fat diet. Eur J Apply Physiol (1994)
69: 387-293.
113. Phinney SD et. al. Capacity for moderate exercise in obese subjects after adaptation to a
hypocaloric, ketogenic diet. J Clin Invest (1980) 66: 1152-1161.
114. Phinney SD et. al. The human metabolic response to chronic ketosis without caloric
restriction: physical and biochemical adaptations. Metabolism (1983) 32: 757-768.
115. Phinney SD et. al. The human metabolic response to chronic ketosis without caloric
restriction: preservation of submaximal exercise capacity with reduced carbohydrate
oxidation. Metabolism (1983) 32: 769-776.
224
Chapter 21:
Effects of exercise on ketosis
Simply restricting carbohydrates will establish ketonuria (presence of ketones in the urine)
given enough time (typically 3-4 days). The requirements for the establishment of ketosis are
discussed in detail in chapter 4 but are briefly reviewed here. Additionally, exercise interacts with
carbohydrate restriction and affects ketosis. This chapter discusses the role of exercise, both in
helping to establish ketosis, as well as its impact on ketosis once established.
A recap of ketogenesis
Ketosis requires a shift in the liver away from triglyceride synthesis and towards free fatty
acid (FFA) oxidation and ketone body formation. Blood glucose must also drop, lowering insulin
and increasing glucagon and decreasing the I/G ratio. Along with this hormonal shift, there must
be adequate FFA present for the liver to produce ketones.
Exercise is inherently ketogenic and all forms of exercise will increase the rate at which the
liver releases its glycogen, helping to establish ketosis. As the rapid establishment of ketosis is
important for individuals using the CKD approach (who only have 5-6 days to maximize their
time in ketosis), strategies for entering ketosis are discussed. The overall effects of exercise on
ketone concentrations is also discussed.
Section 1: Aerobic exercise
It has been known for almost a century that ketones appear in higher concentrations in
the blood following aerobic exercise (1). During aerobic exercise, liver glycogen decreases, insulin
decreases, glucagon increases and there is an increase in FFA levels in the bloodstream. During
aerobic exercise, there is a slight increase in blood glucose uptake which peaks around ten
minutes. To maintain blood glucose, the liver will increase liver glycogen breakdown, keeping
blood glucose stable for several hours.
Thus, the overall effect of aerobic exercise is to increase the production of ketone bodies
(2,3). The increase in ketone bodies during exercise is smaller in trained versus untrained
individuals, due to decreased FFA mobilization during exercise (2).
Aerobic exercise can quickly induce ketosis following an overnight fast. One hour at 65% of
maximum heart rate causes a large increase in ketone body levels. However, ketones do not
contribute to energy production to any significant degree (4). Two hours of exercise at 65% of
maximum heart rate will raise ketone levels to 3mM after three hours. High levels of ketonemia
(similar to those seen in prolonged fasting) can be achieved five hours post-exercise (4). This
increase in ketone bodies post exercise allows for glycogen replenishment in the muscle. Since
225
the brain will not be using glucose for energy, any incoming carbohydrates can be diverted to the
muscles (4). Obviously, if no dietary carbohydrates are consumed following training, ketosis
should be maintained.
Aerobic exercise decreases blood flow to the liver which should decrease the availability of
FFA for ketogenesis (4-6). However, this is offset by an increase in FFA availability and
extraction by the liver (3-7).
If ketone body levels are low at the onset of exercise, there is an increase in ketone
concentrations during exercise. If ketone body levels are high during exercise (above 2-3 mmol),
exercise has little effect on overall ketone body levels simply because they are already high (i.e.
levels of ketosis will not deepen). This reflects one of the many feedback loops to prevent
ketoacidosis during exercise and afterwards (4). High levels of ketones inhibit further fat
breakdown during exercise although insulin levels still decrease. The primary fuel for exercise is
FFA and the body will simply use the FFA already present in the blood for fuel.
Section 2: High-intensity exercise
Very little research has looked at the effects of high-intensity exercise on establishing
ketosis or post-exercise ketosis. However, we can make some educated guesses based on what is
known to occur during high-intensity exercise.
During high-intensity exercise, the same overall hormonal picture described above occurs,
just to a greater degree. Adrenaline and noradrenaline increase during high-intensity activities
(both interval and weight training). The large increase in adrenaline causes the liver to release
liver glycogen faster than it is being used, raising blood glucose (8,9). While this may impair
ketogenesis in the short term, it is ultimately helpful in establishing ketosis. Insulin goes down
during exercise but may increase after training due to increases in blood glucose. Glucagon goes
up also helping to establish ketosis. Probably the biggest difference between high and lowintensity exercise is that FFA release is inhibited during high-intensity activity, due to increases
in lactic acid (10).
Many individuals report finding a decrease in urinary ketones (or a complete absence)
following the performance of high-intensity exercise. Most likely, this reflects a temporary
decrease in blood FFA concentrations and increase in blood glucose and insulin. Additionally, the
large increase in adrenaline and noradrenaline decreases blood flow to the liver further decreasing
FFA availability for ketone production.
So while high-intensity exercise is arguably the quickest way to establish ketosis (due to
its effects on liver glycogen breakdown), the overall effect of this type of exercise could be
described as temporarily anti-ketogenic. The solution to this dilemma is simple: follow highintensity activity (to empty liver glycogen) with low-intensity activity (to provide FFA for ketone
formation). Ten to fifteen minutes of low-intensity aerobics (below lactate threshold) following
intervals or a weight workout should help to reestablish ketosis by lowering blood glucose and
providing FFA for the liver.The impact of different forms of exercise on ketosis appears in table 1.
226
Table 1: Impact of exercise on ketosis
Type of exercise
Aerobic, below LT
Aerobic, above LT
Anaerobic training
(weights or intervals)
Blood glucose
No change or
decrease
increase
increase
Insulin
decrease
Depth of Ketosis
increase
decrease during
may increase after
decrease during
may increase after
decrease during
increase after
decrease during
increase after
Summary
Low-intensity aerobic exercise, below the lactate threshold, is useful for both establishing
ketosis following an overnight fast as well as deepening ketosis. High-intensity exercise will more
quickly establish ketosis by forcing the liver to release glycogen into the bloodstream. However it
can decrease the depth of ketosis by decreasing the availability of FFA. Performing ten minutes
or more of low-intensity aerobics following high-intensity activity will help reestablish ketosis
after high-intensity activity.
Guidelines for Establishing and Maintaining Ketosis
1. After a carb-up, if not weight training the following day, perform 45’+ of low-intensity aerobic
exercise (~65% of maximum heart rate) to deplete liver glycogen and establish ketosis without
depleting muscle glycogen. Interval training will establish ketosis more quickly by depleting liver
glycogen but will negatively affect your leg workout.
OR
2. Perform a high-intensity workout (weight training or intervals) followed by 10-20’ of lowintensity aerobics to provide adequate FFA for the liver to produce ketones.
3. Perform 10-15’ of low-intensity aerobics after high-intensity training to provide FFA for the
liver for ketone body formation.
References Cited
1. Koeslag JH. Post-exercise ketosis and the hormone response to exercise: a review. Med Sci
Sports Exerc (1982) 14: 327-334
2. Gorski J et. al. Hepatic lipid metabolism in exercise training. Med Sci Sports Exerc (1990)
22(2): 213-221.
3. Wasserman DH et. al. Role of the endocrine pancreas in control of fuel metabolism by the liver
during exercise. Int J Obesity (1995) 19 (Suppl 4): S22-30.
4. Balasse EO and Fery F. Ketone body production and disposal: Effects of fasting, diabetes and
exercise. Diabetes/Metabolism Reviews (1989) 5: 247-270.
5. Keller U et. al. Human ketone body production and utilization studied using tracer techniques:
regulation by free fatty acids, insulin, catecholamines, and thyroid hormones.
227
Diabetes/Metabolism Reviews (1989) 5: 285-298.
6. Wahren J et. al. Turnover and splanchnic metabolism of free fatty acids and ketones in insulindependent diabetics at rest and in response to exercise. J Clin Invest (1984)
73: 1367-1376.
7. Fery F and Balasse EO. Response of ketone body metabolism to exercise during transition
from postabsorptive to fasted state. Am J Physiol (1986) 250: E495-E501.
8. “Physiology of Sport and Exercise” Jack H. Wilmore and David L. Costill. Human Kinetics
Publishers 1994.
9. “Exercise Physiology: Human Bioenergetics and it’s applications” George A Brooks, Thomas D.
Fahey, and Timothy P. White. Mayfield Publishing Company 1996.
10. Romijn JA et. al. Regulation of endogenous fat and carbohydrate metabolism in relation to
exercise intensity and duration. Am J Physiol (1993) 265: E380-391.
228
Chapter 22:
Exercise and fat loss
Having examined the physiology behind the different types of exercise, it is time to
examine the effects of exercise on fat loss. There are a number of misconceptions regarding the
role of exercise in fat loss. One of the many misconceptions about is the overestimation of
calories burned during and after exercise.
As well, there is great debate about the ‘best’ form of exercise when fat loss is the goal. In
general, people tend to over-emphasize aerobic exercise for fat loss while downplaying other forms
of exercise, such as interval or weight training. Recent research highlights the benefits of weight
and interval training for fat loss.
In addition to the type of exercise done, total caloric intake has an impact on fat loss when
combined with exercise. At moderate caloric deficits, both weight training and endurance exercise
can increase fat loss. However, if caloric intake is too low, exercise can have a negative effect on
fat loss.
Section 1: Caloric expenditure during and after exercise
Calorie burned during exercise
Most exercisers tend to overestimate the number of calories expended during exercise (1).
During aerobic exercise, caloric expenditure averages about 5 calories/minute at low intensities
increasing to 10+ calories/minute as intensity increases. As a point of reference, a threshold
calorie expenditure of 300 calories three times per week or 200 calories four times per week has
been established as the minimum amount of aerobic exercise that will cause fat loss (2).
Additionally, exercising two days per week does not result in significant fat loss, even if
more calories are expended. Burning 500 calories twice per week (a total of 1000 calories
expended) does not cause the same fat loss as burning 300 calories three times per week (only
900 calories). The body must receive an exercise stimulus at least three days per week. How
this stimulus is divided between weights, aerobic exercise and/or interval training will depend on
an individual’s goals. Generally speaking, for fat loss, weight training should be performed 2-3
times per week minimum and aerobic exercise of some sort 3 or more times per week.
The loss of one pound of fat requires a calorie deficit of 3500 calories. At five to ten calories
per minute, 300 calories would require 30-60 minutes of aerobic exercise at least three times per
week. This bare minimum expenditure would only be expected to yield 800-900 calories/week
deficit and fat loss would only occur at about 1 lb per month (assuming no other changes in diet or
activity). Some authors have used this to argue against regular exercise, claiming that this small
amount of caloric expenditure cannot possibly have any effect on body weight.
However, an individual who walked briskly 2 miles daily (expending approximately 200
calories or so in 30 minutes) would expend 1400 calories per week (a little less than 1/2 of a pound
of fat). Assuming no change in caloric intake, this should yield a fat loss of about 2 lb per month,
229
24 lbs per year. Table 1 provides a comparison of estimated fat loss with different amounts of
aerobic exercise.
Table 1: Estimated fat loss with no change in calorie intake
Intensity
Low
Low
High
High
Cal/min
5
5
10
10
Time
60’
60’
60’
60’
Frequency
3/week
5/week
3/week
5/week
Total cal/wk
900
1500
1800
3000
Est. fat loss/month*
1 lb
1.7 lb
2 lb
3.5 lb
* Assuming no other changes in diet or activity
Simply adding aerobic exercise with no change in diet causes weight loss to occur for men
but not always women (3,4). The reasons for this gender discrepancy are not fully understood.
Simply put, when women add aerobic exercise without performing resistance training or making
changes to their diet, the rate of fat loss is extremely slow.
The caloric burn from interval training is harder to pinpoint since it depends highly on the
intensity and duration of the activity. The impact of interval training on fat loss is discussed
further below.
Weight training uses approximately seven to nine calories per minute, including the rest
between sets. As with aerobic exercise, weight training per se has a fairly minimal direct effect
on caloric expenditure. However, weight training has several indirect effects on the energy
balance equation which are arguably more important.
Muscle is one of the body’s most active tissues and adding muscle can permanently raise
metabolic rate. This is especially important for older individuals who may have lost muscle mass
due to inactivity. The amount of calories burned from increased muscle mass is discussed in the
next section.
Calories burned after exercise
In addition to the calories burned during exercise, there is an additional calorie expenditure
after exercise referred to as Excess Post-exercise Oxygen Consumption (EPOC) (5). EPOC is
caused by increases in circulating hormones such as adrenaline and noradrenaline, as well as
other factors, which causes the body to continue to expend calories after exercise (5). These
calories come primarily from fat stores (6). Another common exercise misconception is that the
EPOC following aerobic exercise lasts for 24 hours and contributes significantly to the overall
calorie balance equation (1).
The magnitude of EPOC is related to both the intensity and duration of activity (7,8,9).
Following low-intensity aerobic activity (65% of maximum heart rate for less than one hour),
approximately 5 total calories are burned after exercise. Moderate-intensity activity (65% of
maximum heart rate for more than an hour), may raise EPOC to 35 total calories. Following
exhaustive exercise (above 85% maximum heart rate), a post-exercise calorie expenditure of 180
230
calories may occur (7). Most individuals will not be able to sustain exercise intensities high
enough to generate a large EPOC with aerobic exercise. With few exceptions, primarily elite
endurance athletes, the EPOC from aerobic exercise is unlikely to be significant in the overall
energy balance equation (1).
Following resistance training (and perhaps interval training), the magnitude of EPOC is
much higher. Increases in metabolic rate of 4-7% over 24 hours have been seen following
extensive resistance training (10). For an individual with a 2000 calorie per day metabolic rate,
this could amount to 80-140 calories burned following every resistance training session, the
equivalent of walking an extra mile.
Part of this increase reflects increased protein synthesis which rises for 24-36 hours and
which is energetically costly. The energy used for protein synthesis will come primarily from fat
stores (11).
Section 2: The effect of exercise on fat loss
Dieting without exercise
The most common approach to fat loss for most people is to simply restrict calories
without exercise. The biggest problem with weight loss by caloric restriction alone is an
inevitable loss in lean body mass (LBM), with a large part of the LBM drop from muscle stores,
and a drop in metabolic rate. The more that calories are restricted, the more the body lowers
metabolic rate to compensate. This reflects the body going into starvation mode to prevent
further weight loss. Depending on the amount of caloric restriction, the addition of exercise may
or may not have benefits in alleviating or preventing this drop in metabolic rate.
When food intake invariably increases again, the lowered metabolic rate makes the change
of fat regain very likely. As many individuals have found out, dieting by itself is not effective for
long term weight loss. In fact a recent analysis of studies shows that weight maintenance is
much better when individuals include exercise as part of their weight loss efforts than when it is
not. Other issues dealing with weight regain are discussed in more detail in chapter 14.
Exercise at different caloric levels
Although the exact reasons are unknown, the impact of exercise with caloric restriction on
fat loss is not as simple as eating less and exercising more. Many individuals have found that
eating too little and exercising too much can put the body into a starvation mode, and fat loss
slows or stops completely. The reason for this starvation response is not known at this time. It
is sufficient to say that moderate approaches to both exercise and caloric restriction tend to yield
the best long term results. Additionally, exercise appears to have its greatest effect with
moderate, not excessive, caloric deficits (12).
The key is to find the optimal combination of dietary modification and exercise to generate
maximum fat loss without any muscle loss. Of course, the right type of exercise is also
231
maximum fat loss without any muscle loss. Of course, the right type of exercise is also
important. In an attempt to develop guidelines for calorie intake and exercise we will examine the
impact of exercise on three different dietary conditions: maintenance calories, low-calorie dieting
(10% below maintenance levels to 1200 calories per day), and very-low-calorie dieting (below 800
calories per day).
Exercise at Maintenance calories
The most basic approach to create a caloric deficit is through the addition of exercise to a
maintenance calorie diet. As stated previously, while the addition of aerobic exercise with no
change in diet causes fat loss in men, it does not reliably do so in women (3,14).
At maintenance calories, in both men and women, the performance of resistance training
causes a loss of bodyfat with no changes in dietary habits. (14-18) At this calorie level, weight
training alone generally causes a greater fat loss and muscle gain than endurance exercise alone
(14,15). In 8 weeks, beginning trainees can expect to gain 2-4 pounds of lean body mass and lose
2-4 lbs of fat with weight training alone as little as 30 minutes three times per week (17-19).
In a longer study of 20 weeks, women performed three sets of eight repetitions in four
lower body exercises (12 total sets) twice per week. At the end of the study, they had gained 10
lbs of muscle and lost 10 lbs of fat (20). The overall changes may have been even more
significant had the subjects trained their upper body as well. This occurred without dieting or
aerobic exercise, although fat loss would have probably been greater and/or faster with the
addition of either.
Considering the low caloric expenditure of weight training, it is difficult to understand how
weight training can cause fat loss at maintenance calories. The reason is the indirect effect of
weight training on metabolic rate. Every pound of muscle added through weight training burns an
additional 30-40 calories per day in both men (17,18) and women (18).
A beginning exerciser can gain 3-4 pounds of muscle in the first 8 weeks of training with
even the most basic of programs. This gain may increase metabolic rate by 120-150 calories per
day, the equivalent of walking 1.5 miles every day. At maintenance calories, the addition of
aerobic training to weight training will yield even better fat loss results. However, weight training
is critical for long term fat loss and weight maintenance.
Beginners can gain 3-4 lbs of muscle and to lose of 5-10 lbs of bodyfat over 8 weeks
following a very basic program of resistance training (1 set of 8-12 repetitions of 8-10 basic
exercises) and aerobic exercise (30’ at 65% of maximum heart rate), which is described in more
detail in chapter 27 (21).
Exercise with low-calorie dieting (10% below maintenance to 1200 calories/day)
With a moderate calorie restriction (from 10% below maintenance to approximately 1000
calories below maintenance) without exercise, there is inevitably a decline in resting energy
expenditure and a loss of muscle. When exercise is added fat loss increases and the loss of
muscle decreases. The drop in metabolic rate is also decreased. (22-25).
232
Resistance training alone, combined with a slight calorie restriction causes greater bodyfat
loss and a maintenance/increase in lean body mass than just restricting calories alone (24,26).
Essentially, the caloric deficit causes the fat loss and the weight training signals the body to keep
the muscle so that only fat is lost. This is an important consideration. From a calorie burning
perspective, aerobic exercise and caloric restriction are essentially identical.
Aerobic training alone, while increasing fat loss in some studies, does not generally increase
muscle except in very inactive individuals (24) . Remember that adding muscle raises metabolic
rate in the long term. Any caloric restriction should be accompanied by resistance training to
prevent the loss of LBM and possibly to even increase it.
Aerobic exercise can increase fat loss and may be added if desired and if time allows.
However, too much aerobic exercise can have the same effect as too few calories: lowering
metabolic rate and slowing fat loss. A total caloric deficit of more than 1000 cal/day seems to be
the threshold for slowing the metabolism (14).
Exercise with very-low-calorie diets: less than 800 calories per day
In a very low-calorie diet situation (VLCD, 800 calories per day or less), there are
significant changes compared to higher calorie levels. VLCD without exercise causes a large drop
in LBM and metabolic rate. The addition of aerobic exercise alone does not improve fat loss or
prevent the drop in LBM and metabolic rate (27-30).
In severe dieting situations, aerobic exercise may actually be worse than just dieting
(health benefits excepted). In one study, the addition of aerobic exercise (27 hours total over 5
weeks) to a very-low-calorie ketogenic diet (500 cal/day) caused a greater drop in metabolic rate
than dieting alone and caused no additional weight or fat loss (29). It appeared that the body
compensated for the aerobic exercise by slowing metabolic rate at other times of the day.
When resistance training only is added to an 800 calorie diet, muscle size increases despite
a similar loss in LBM in both the diet only and diet plus exercise groups (31). This implies that
the loss in LBM is due to loss of water, glycogen and other non-muscle tissues (32). Metabolic
rate still goes down.
The conclusion from this data is this: on a VLCD, weight training but not aerobic exercise
will slow the drop in metabolic rate but not stop it. The inclusion of aerobic exercise may do more
harm than good at this calorie level.
Summary
There is a caloric threshold for exercise to improve the rate of fat loss. A calorie deficit
more than 1000 cal/day will slow metabolism. Further increases in energy expenditure past that
level does not increase fat loss (14). In some cases, excess exercise will increase the drop in
metabolic rate seen with very large calorie deficits.
This value of 1000 calories per day includes any caloric deficit AND exercise. Meaning
that if 500 calories per day are removed from the diet, no more than 500 calories per day of
exercise should be performed. If someone chose to remove 1000 calories per day from their diet,
233
no aerobic exercise should be done to avoid metabolic slowdown.
The decrease in metabolic rate seen with very low-calorie diets makes weight regain likely.
Eventually, a dieter will have to eat. And when normal eating habits are resumed after a period
of starvation dieting, weight and bodyfat regain will be the result.
Therefore the best fat loss solution, in terms of both fat loss as well as maintenance of
that fat loss, is to eat at maintenance (or a slight deficit, no more than 10-20% below
maintenance) in combination with resistance training (33). Aerobic training can be added as
required and will increase fat loss as long as it is not overdone. For most, 20-40’ of aerobic
exercise several times per week should be sufficient. In this case, more is NOT better. However,
if an individual has significant amounts of fat to lose, a greater frequency of aerobic exercise may
be beneficial.
The ultimate point of the above discussion is this: resistance training coupled with a slight
decrease in energy balance is the key to fat loss. The inclusion of aerobic training can increase
fat loss as long as total calories are not taken too low.
Section 3: The fat burning myth
A commonly held idea in the field of exercise is that one must burn fat during exercise in
order to lose bodyfat. This has led to the development of charts which indicate a certain ‘fat
burning zone’ during aerobic exercise. However, recent research as well as anecdotal experience
draws into question the idea of the fat burning zone, a topic discussed in greater detail below.
The fat burning myth
A very prevalent misconception about aerobic exercise is the so-called ‘fat burning zone’
which is supposed to optimize fat loss. It is true that a greater percentage of fat is used during
low-intensity exercise (see chapter 18 for details). This suggests that low-intensity exercise is the
best form of exercise to lose fat (6). However, due to the low total caloric expenditure, the total
amount of fat used is small. As exercise intensity increases (up to about 75% of maximum heart
rate), while the percentage of total calories derived from fat is smaller, the total amount of fat
used is greater (34).
The physiology of fuel utilization described above ultimately ignores the following fact: the
utilization of fat during exercise has little bearing on fat loss (1). Numerous studies have
compared the effect of different intensities of aerobic exercise on fat loss. As long as the caloric
expenditure is the same, total fat loss is identical whether the exercise is done at low or highintensity (35-37). That is, the fuel used during exercise is of secondary importance compared to
the amount of calories expended. As long as more calories are burned than eaten, the body will
reduce fat stores.
One thing to note is that as the intensity of exercise increases, the duration of activity
decreases (see chapter 24). This means that some individuals will burn more calories by using
234
lower intensities but increasing duration, while others will burn more calories exercising at higher
intensities for a shorter period of time. Ultimately dieters must find the optimal combination of
intensity and duration which maximizes caloric expenditure.
This partly explains why simply restricting calories while weight training causes fat loss.
Fat loss is primarily a function of calories in versus calories out. Weight training ‘signals’ the
body to keep muscle and the caloric deficit signals the body to lose fat. Whether a calorie deficit is
generated with a slight restriction in calories or through aerobic exercise, the end result is
basically the same. Additionally, the caloric cost of weight training, both during and after the
workout, will contribute to the overall calorie deficit. As long as weight training is being
performed and calories are not restricted too much, the majority of weight lost should be fat.
High-intensity aerobics and interval training
Interval training is an advanced exercise technique alternating short periods (15-90
seconds) of near maximal intensity activity with periods (1-2 minutes) of very low-intensity
activity. Several recent studies have found that either high-intensity endurance activity (38) or
interval training (39) yields greater fat loss than lower intensity continuous activity when diet is
not controlled. This is probably due to an appetite blunting mechanism or a greater EPOC from
higher intensity exercise.
Tremblay compared the effects of a high-intensity interval program to continuous exercise
(39). The interval group used a progressive program working up to 5 ninety-second intervals near
their maximum heart rate three times per week. The continuous exercise group worked up to 45
minutes of exercise five times per week. Although the interval training group only exercised one
hour per week, compared to 3.75 hours in the aerobic group, and expended only half as many
calories during the interval workouts, fat loss as measured by skinfolds was nine times greater.
Although fat loss per se was not measured, total bodyweight was. As both groups maintained
their overall weight, this suggests that the interval group gained more muscle as their fat loss
was greater.
For most individuals (excepting pre-contest bodybuilders who are addressed separately in
chapter 30), the primary goal of aerobic exercise should be on total caloric expenditure. For
individuals with limited time, maximizing calorie expenditure by working at the highest intensity
that can be maintained safely, and is compatible with a ketogenic diet, is the best choice. The
inclusion of interval training from time to time can raise fitness level and increase fat loss.
Specific guidelines for when and how to incorporate training techniques such as intervals are
discussed in chapter 25.
Summary
Contrary to popular opinion, there is no ‘fat burning zone’, at least not in terms of an
optimal intensity range which will maximize fat loss. The fat loss from aerobic exercise is tied
intimately to caloric expenditure, not the particular fuel which is used during exercise. Some
studies suggest that high-intensity aerobic exercise or interval training may actually cause
235
greater fat loss than lower intensity activities. From a practical standpoint, this means that a
ketogenic dieter wanting optimal fat loss should train at as high an intensity as they can which is
compatible with a ketogenic diet. Individuals on an SKD are limited in terms of intensity while
individuals on a TKD or CKD may wish to experiment with interval training to maximize fat loss.
References cited
1. Zelasko C. Exercise for weight loss: What are the facts? J Am Diet Assoc (1995)
95: 1414-1417.
2. American College of Sports Medicine Position Stand. The recommended quantity and quality of
exercise for developing and maintaining cardiorespiratory and muscular fitness in healthy
adults. Med Sci Sports Exerc (1990) 22: 265-274.
3. Gleim GW. Exercise is not an effective weight loss modality in women. J Am Coll Nutr (1993)
12: 363-367.
4. Despres JP et al. Effect of a 20 week endurance training program on adipose tissue
morphology and lipolysis in men and women. Metabolism (1984) 33: 235-239.
5. “Physiology of Sport and Exercise” Jack H. Wilmore and David L. Costill. Human Kinetics
Publishers 1994.
6. McCarty MF. Optimizing exercise for fat loss. Medical Hypotheses (1995) 44: 325-330.
7. Bahr R. Excess postexercise oxygen consumption - magnitude, mechanisms, and practical
implications. Acta Physiol Scand (1992) (Suppl 605): 1-70.
8. Maehlum S et. al. Magnitude and duration of excess postexercise oxygen consumption in
healthy young subjects. Metabolism (1986) 35(5): 425-429.
9. Quinn TJ Postexercise oxygen consumption in trained females: effects of exercise duration.
Med Sci Sports Exerc (1994): 26: 908-913.
10. Melby C et. al. Effect of acute resistance exercise on postexercise energy expenditure and
resting metabolic rate. J Appl Physiol (1993) 75: 1847-1853.
11. MacDougall JD et. al. The time course of elevated muscle protein synthesis following heavy
resistance exercise. Can J Appl Physiol (1995) 20: 480-6.
12. Saris WHM. The role of exercise in the dietary treatment of obesity. Int J Obes (1993)
17 (suppl 1): S17-S21.
13. Ballor DL and Keesey RE. A meta-analysis of the factors affecting exercise-induced changes
in body mass, fat mass, and fat-free mass in males and females. Int J Obes (1991)
15: 717-726.
14. Wilmore J. Increasing physical activity: alterations in body mass and composition. Am J Clin
Nutr (1996) 63 (suppl): 456S-460S.
15. Broeder CE et. al. The effects of either high-intensity resistance or endurance training on
resting metabolic rate. Am J Clin Nutr (1992) 55: 802-810.
16. Butts NK and Price S. Effects of a 12-week weight training program on the body composition
of women over 30 years of age. J Strength Cond Res (1994) 8: 265-269.
17. Pratley R et. al. Strength training increases resting metabolic rate and norepinephrine levels
in healthy 50- to 65-yr-old men. J Appl Physiol (1994) 76: 133-137.
18. Cambell WW et. al. Increased energy requirements and changes in body composition with
resistance training in older adults. Am J Clin Nutr (1994) 60: 167-175.
19. Ludo ML et. al. Effect of weight-training on energy expenditure and substrate utilization
during sleep. Med Sci Sports Exerc (1995) 27: 188-193.
236
20. Staron RS et. al. Muscle hypertrophy and fast fiber type conversions in heavy resistancetrained women. Eur J Appl Physiol (1990) 60: 71-79.
21. Westcott W. Transformation: How to take them from sedentary to active. Idea Today
Magazine (1995) pp. 46-54.
22. Ross R et. al. Response of total and regional lean tissue and skeletal muscle to a program of
energy restriction and resistance exercise. Int J Obes (1995) 19: 781-787.
23. Ross R et. al. Effects of energy restriction and exercise on skeletal muscle and adipose tissue
in women as measured by magnetic resonancing imaging. Am J Clin Nutr (1995)
61: 1179-85.
24. Shinkai S et. al. Effects of 12 weeks of aerobic exercise plus dietary restriction on body
composition, resting energy expenditure and aerobic fitness in mildly obese middle-aged
women. Eur J Appl Physiol (1994) 68: 258-265
25. Belko AZ et. al. Diet, exercise, weight loss and energy expenditure in moderately overweight
women. Int J Obes (1987) 11: 93-104.
26. Ballor DL et. al. Resistance weight training during caloric restriction enhances body weight
maintenance. Am J Clin Nutr (1988) 47: 19-25.
27. Van Dale D et. al. Does exercise give an additional effect in weight reduction regimens. Int J
Obes (1987) 11: 367-375.
28. Hill JO et. al. Effects of exercise and food restriction on body composition and metabolic rate
in obese women. Am J Clin Nutr (1987) 46: 622-630.
29. Phinney SD et. al. Effects of aerobic exercise on energy expenditure and nitrogen balance
during very low calorie dieting. Metabolism (1988) 37: 758-765.
30. Phinney SD. Exercise during and after very-low-calorie dieting. Am J Clin Nutr (1992)
56: 190S-194S.
31. Donnely JE. Muscle hypertrophy with large-scale weight loss and resistance training. Am J
Clin Nutr (1993) 58: 561-565.
32. Marks BL and Rippe J. The importance of fat free maintenance in weight loss programs.
Sports Med (1996) 22: 273-281.
33. Sweeny ME et. al. Severe vs. moderate energy restriction with and without exercise in the
treatment of obesity: efficiency of weight loss. Am J Clin Nutr (1993) 57: 127-134.
34. Romijn JA et. al. Regulation of endogenous fat and carbohydrate metabolism in relation to
exercise intensity and duration. Am J Physiol (1993) 265: E380-391.
35. Grediagin M et al. Exercise intensity does not effect body composition changes in untrained,
moderately overfat women. J Am Diet Assoc (1995) 95: 661-665.
36. Ballor DL et. al. Exercise intensity does not affect the composition of diet- and exerciseinduced body mass loss. Am J Clin Nutr (1990) 51: 142-146.
37. Duncan JJ et. al. Women walking for health and fitness: how much is enough? JAMA (1991)
266: 3295-3299.
38. Bryner RW The effects of exercise intensity on body composition, weight loss, and dietary
composition in women. J Am College Nutrition (1997) 16: 68-73.
39. Tremblay A et. al. Impact of exercise intensity on body fatness and skeletal muscle
metabolism. Metabolism (1994) 43: 818-818.
237
Part VI:
Exercise guidelines
Chapter 23: General exercise principles
Chapter 24: Aerobic exercise
Chapter 25: Interval training
Chapter 26: Weight training
Having discussed the underlying physiology behind aerobic, interval, and weight training
exercise, we can now develop some general guidelines for each type of exercise. Chapter 23
discusses several general principles such as progressive overload and the FITT equation.
Chapters 24 through 26 give general guidelines for implementing the different types of exercise,
depending on goals. These general guidelines are applied in part 7, which provides sample exercise
programs.
238
Chapter 23:
General Training Principles
There are a number of general exercise principles that apply to all forms of exercise. These
include progressive overload and specificity. Both are discussed below. Additionally, the FITT
equation, which is used to determine the various components of an exercise program is also
discussed.
Section 1: Progressive overload and SAID
Progressive overload
The most basic principle of exercise training is progressive overload which means that the
body must be overloaded for fitness to increase. The specific type of overload used will depend on
the type of training being done. Aerobic fitness can be improved by performing longer duration
exercise or covering the same distance in less time. Progressive overload can be applied to
interval training by completing more intervals, or working at a higher intensity. Increases in
strength and size can be attained by increasing the weight being lifted, lifting the same weight for
more repetitions, performing more or different exercises,etc. Regardless of the specific nature of
adaptation, the body tends to have a general mode of adaptation (1). This is sometimes referred
to as the General Adaptation Syndrome or G.A.S.
The G.A.S. involves three steps:
1. Alarm: Following a stress to the body (i.e. a workout), there is a temporary decline in
performance,
2. Resistance: the alarm stage is followed by super compensation in the system which was
trained (muscle, nervous system, aerobic system),
3. Exhaustion: If inadequate rest or nutrients are given or the stress occurs too frequently, the
body’s performance capacity will decrease, called the exhaustion stage (more commonly called
overtraining).
Specificity and the SAID Principle
The adaptations seen in training are specific to the type of training done. This is
sometimes called Specific Adaptations to Imposed Demands or SAID by exercise physiologists.
For example, aerobic training improves the body’s ability to perform aerobically (by making
muscle fibers smaller and more oxidative), but does not improve strength. Strength training
improves the body’s ability to generate strength (by making muscle fibers bigger and more
glycolytic) but does not improve aerobic endurance (2,3).
Another example is the carryover between different exercises. Strength gains in one
239
exercise (i.e. the squat) show little carryover to other exercises (i.e. leg extensions) due to
differences in muscle fiber recruitment (4-6). Therefore, training must be specific to individual
goals.
Prior to establishing the specifics of a training program, individuals must decide what they
ultimately want to accomplish. In general, the body can only adapt maximally in one direction or
another. Trying to gain muscle and lose fat at the same time is generally impossible, except for
beginners. Maximizing both strength and aerobic performance is similarly impossible and one or
the other will be compromised. The more specific an individual is about their goals, the more
success they will have.
Section 2: The FITT equation
All types of exercise can generally be described by four variables. They are frequency,
which is how often a given type of exercise is performed ; intensity, which is how hard a given
exercise is ; time, which is how long a given type of exercise is performed for ; and type, which is
the specific type of exercise done. These four variables are sometimes referred to as the FITT
equation. In the following chapters, each major form of exercise is discussed within the context of
these four variables.
References
1. Viru A. Mechanism of general adaptation. Medical Hypotheses (1992) 38: 296-300.
2. “Physiology of Sport and Exercise” Jack H. Wilmore and David L. Costill. Human Kinetics
Publishers 1994.
3. Hawley JA and Hopkins WG. Aerobic glycolytic and aerobic lipolytic power systems: A new
paradigm with implications for endurance and ultraendurance events. Sports Medicine
(1995) 19: 240-250.
4. Morrisey MC et. al. Resistance training modes: specificity and effectiveness. Med Sci Sports
Exerc (1995) 27: 648-660.
5. Pipes T. Variable resistance versus constant resistance strength training in adult males. Eur J
Appl Physiol (1978) 39: 27-35.
6. Sale D And MacDougall D. Specificity in Strength Training: A Review for the Coach and
Athlete. Can J Appl Sports Sci (1981) 6:87-92.
240
Chapter 24:
Aerobic exercise guidelines
Having discussed the physiology behind aerobic exercise as well as its effects on fat loss,
we will now discuss the parameters for developing the aerobic portion of an exercise program.
Frequency
The frequency of aerobic exercise depends solely on one’s goals. For general health, a
minimum of three times per week is required. For fat loss, three times per week also appears to
be the minimum. For individuals wishing greater fat loss, a frequency of four to five days per
week is frequently recommended (1,2). However, too much aerobic exercise can be as
detrimental as too little. Many individuals find that their fat loss can slow with too much aerobic
exercise. As well, excessive aerobic exercise can cause muscle loss. In practice, three to five
aerobic sessions per week seems to work for most individuals.
Endurance athletes looking to maximize performance typically perform three to seven
aerobic exercise sessions per week. Generally, there is an alternation of high and low intensity
workouts and varying duration. The specifics of developing an endurance program for
competition are beyond the scope of this book.
Off-season bodybuilders should try to minimize aerobic training, performing perhaps 2-3
very short sessions of 20’ each. This should maintain aerobic fitness without cutting severely
into recovery. Bodybuilders who are preparing for a contest, or just embarking upon a fat loss
cycle, typically add more aerobic exercise into their routine. However, most pre-contest
bodybuilders tend to perform far too much aerobic exercise, frequently 7 days per week and often
times twice per day. The specifics of aerobic exercise for pre-contest bodybuilders is discussed in
chapter 30.
Intensity
The intensity of aerobic exercise is generally described as the percentage of maximum
heart rate. To estimate maximum heart rate, use the following formulas (2):
Men: 220 -age = maximum heart rate
Women: 227 - age = maximum heart rate
The recommended intensity for aerobic exercise is between 60-85% of maximum heart
rate although beginners will benefit from intensities as low as 50% of maximum (1,2). Multiplying
maximum heart rate by .60 to .85 will yield the proper target heart range.
241
60% maximum = _____ * .60 = _____ beats/minute
(max. HR)
85% maximum = _____ * .85 = _____ beats/minute
(max. HR)
Endurance athletes may work anywhere in this range depending on their goals. Typically
recovery workouts are done near the low end of the range, while higher intensities are used to
improve aerobic fitness. Intensities above 85% of maximum should be done in an interval fashion
and are discussed in the next chapter.
In general, bodybuilders should stay at low aerobic intensities to avoid losing muscle mass
and strength. If lactate threshold (LT) has been determined (see below), 15 beats per minute
below LT should be used as a guideline for aerobic intensity (3). If LT has not been established, a
heart rate of 60% of maximum should be used.
Non-bodybuilders looking solely at maximum weight/fat loss will benefit most from
exercising at the highest intensity they can safely maintain to maximize caloric burn. On a
standard ketogenic diet, about the highest intensity which can be maintained is 75% of maximum
heart rate. Higher intensities can be sustained following a carb-up for CKDers or pre-workout
carbs on the TKD.
Determining the lactate threshold (LT)
Determining the LT is typically done in a lab using highly accurate and specific testing
devices. However, the LT can be determined roughly in the gym as well. The LT is highly specific
to a given activity. That is, determining LT on a bicycle tells you nothing about your LT on a
treadmill or a Stairmaster. Therefore LT should be determined on the specific piece of equipment
an individual will be using during their exercise session.
Recall from the previous chapter that lactic acid is the primary cause of the burning
sensation felt in muscles during high-intensity exercise. Since LT is defined as the point where
lactic acid begins to accumulate in the bloodstream, it can be roughly determined by noting when
a burning sensation in your muscles is felt.
To most accurately determine LT, individuals need to be proficient at taking their heart
rate or have access to a digital heart rate monitor. Many aerobic exercise machines have heart
rate monitors built in. To determine LT, intensity should be gradually increased, while monitoring
heart rate, until a significant burning sensation is felt. As a general rule, each increase in
intensity level should be maintained for three minutes to allow for lactic acid to accumulate.
When a significant burning sensation is felt in the muscles being used, heart rate should be taken,
and assumed to roughly indicate the LT for that exercise.
Time
For health benefits, a minimum duration of twenty minutes per session is necessary (1).
For fat loss, a duration sufficient to expend 300 calories three times per week or 200 calories four
242
time per week is considered the minimum (1). Depending on the intensity of the exercise, 300
calories may require anywhere from thirty to forty five minutes of exercise. Unconditioned
individuals can obtain similar results by performing several shorter workout sessions per day (i.e.
ten minutes three or more times per day) as with performing the entire exercise session all at
once (4). This strategy may be useful for busy individuals or those who are just beginning an
exercise program.
Detrained individuals may not be able to exercise for 20’ continuously when they start
their exercise program. In this case, a modified type of interval training should be used. A total of
20-30’ can be performed by alternating periods of exercise (of several minutes duration, whatever
the individual is capable of) with periods of total rest (to allow for recovery). As fitness improves,
longer periods of exercise will be possible and less rest required until a full 20’ can be done without
stopping.
At this point, exercise time can be increased at each workout by a minute or two until the
final time goal is reached. Longer durations of exercise will burn more calories and may be more
beneficial for fat loss. Total caloric expenditure can also be increased by keeping duration the
same and exercising at higher intensities. For beginners, duration should be increased before
increasing intensity to avoid injury and burnout.
Intensity and duration: an inverse relationship
There is an inverse relationship between intensity and time of aerobic activity. High
exercise intensities (especially above LT) limit time. High workout times generally mandate
lower exercise intensity. As discussed in chapter 22, individuals seeking fat loss should find the
combination of intensity and duration which allows them to maximize caloric expenditure.
Type
In general, the type of activity done is less important than the previous three variables.
Ultimately, the best aerobic activity is that which an individual enjoys and will do regularly.
Bodybuilders should avoid high impact aerobic activities such as running as their higher body
mass may increase the chance of joint injury.
Aerobics classes are generally not encouraged for bodybuilders because it is relatively
more difficult to keep heart rate at low intensities. Endurance athletes should perform the
majority of their training with the same type of activity they will compete in (i.e. cyclists should
cycle, runners should run). The topic of cross-training is beyond the scope of this book.
The combination of the above principles will differ for different goals. The amount of training
needed for general fitness differs from that needed for a pre-contest bodybuilder or an endurance
athlete. Table 1 shows a sample aerobic progression for an untrained individual.
243
Table 1: Sample aerobic progression for untrained individuals
Week 1
Week 2
Week 3
Week 4
Week 5
Frequency
3Xweek
3Xweek
3Xweek
3-4Xweek
4Xweek
Intensity
60% of max.
60% of max.
60% of max.
60-65% of max.
65% of max.
Time
20’
30’
40’
30-40’
40’
Week 6
Week 7
Week 8
4Xweek
4-5Xweek
4-5Xweek
65-70% of max.
65-70% of max.
65%+ of max.
40’
40-45’
40-45’
(or begin
intervals)
References
1. American College of Sports Medicine Position Stand. The recommended quantity and quality of
exercise for developing and maintaining cardiorespiratory and muscular fitness in healthy
adults. Med Sci Sports Exerc (1990) 22: 265-274.
2. “Guidelines for Exercise Testing and Prescription, 5th ed.” The American College of Sports
Medicine. Lea & Febiger Publishers 1995.
3. Max O2: The Complete Guide to Synergistic Aerobic Training. Jerry Robinson and Frank
Carrino, Health for Life 1993.
4. Jakicic JM et. al. Prescribing exercise in multiple short bouts versus one continuous bout:
effects on adherence, cardiorespiratory fitness, and weight loss in overweight women. Int J
Obes (1995) 19: 893-901.
244
Chapter 25:
Interval training guidelines
Interval training is an advanced technique that can be used to improve fitness level and
increase fat loss. Generally defined, interval training is any activity which alternates periods of
high intensity activity (i.e. sprinting) with periods of lower intensity (i.e. walking or slow jogging).
Weight training can be considered a special case of interval training but is discussed separately.
As with aerobic exercise, interval training is discussed relative to the FITT equation.
Recall that interval training is limited without dietary carbohydrates and is not an appropriate
form of exercise for individuals consuming zero carbohydrates on the SKD. Individuals on a CKD
or TKD may use interval training.
Interval training requires a few special considerations. First and foremost, the risk of
injury with interval training is higher than with aerobic exercise due to the increased intensity.
Individuals beginning an exercise program are encouraged to develop a basic level of aerobic
fitness (a minimum of four weeks, three times per week, 30 minutes per session at 60-65% of
maximum heart rate) before incorporating higher intensity interval training.
Second, interval training should be gradually incorporated into training and the number
and length of the intervals should be progressively increased as fitness level improves. Third,
interval training may or may not be appropriate for bodybuilders. Done in excess, it may cause a
loss of muscle size and strength by making Type II muscle fibers more Type I in nature.
However, some individuals have found that interval training, performed judiciously, improves fat
loss with no loss in muscle mass or strength. Finally, endurance athletes looking to maximize
performance will need to perform interval training during specific periods of their training.
Frequency
As a very high intensity activity, interval training should be performed a maximum of
three times per week and many individuals find that one or two interval sessions are plenty.
During periods where interval training is incorporated, other forms of high intensity training may
need to be reduced to maintenance levels (i.e. weight training for the legs may be reduced to once
per week if intervals are being performed). Additionally, intervals should take the place of a
normal aerobic training session. An individual performing 4 aerobic training sessions who wished
to incorporate intervals once per week should reduce aerobic training frequency to 3 times
weekly.
Intensity
Intensity of interval training may be anywhere from lactate threshold to maximum. To
begin interval training, individuals should use intensities just above lactate threshold (generally
around 75-85% of maximum heart rate). As fitness improves, higher intensities (up to 95% of
245
maximum heart rate) can be used. Due to the short duration of most intervals, heart rate does
not give an accurate measure of intensity and trainees will have to subjectively estimate
intensity level.
In most cases, recovery in between intervals should be performed at low intensities,
around 50-60% of maximum heart rate. The recovery should almost always be active. After a
maximal sprint on a bike, recover with light spinning instead of stopping completely. This will help
with recovery between intervals by allowing the body to remove lactic acid from the muscles.
Time
The duration of a given interval may be anywhere from fifteen seconds to five minutes or
more. Generally, the shorter the interval the higher the intensity which is used and vice versa.
Fifteen second intervals are done at maximal effort while a five minute interval may be done just
above lactate threshold. The recovery time between intervals can be measured one of two ways:
1. Relative to the work interval: With this method, the duration of rest is expressed in some ratio
of time to the work interval. A 90 second interval might have a rest interval of 2:1 meaning that
twice as much rest (180 seconds or 3 minutes) would be given. A five minute interval would
require a 1:1 rest interval (5’).
2. When heart rate returns to 120 beats per minute: this method is more individual and takes
fitness level into account. However it requires some method of measuring heart rate during
exercise.
Total interval time
The total amount of intervals which should be done in any given workout ranges from 5 to
25 minutes of high intensity work not counting recovery. Obviously, this is affected by the length
of the interval done. A cyclist doing 1 minute repeats would need to do from 5 to 25 total repeats.
A sprinter might need to do 50 repeats of 15 second intervals.
In general, beginners should start with the low number of intervals and increase the
number of intervals before increasing the intensity. Once the high number of intervals is reached,
intensity can be further increased.
Type of activity
Intervals can be done on any type of equipment or outdoors. For individuals carrying extra
bodyweight who wish to incorporate intervals to hasten fat loss, non-impact activities such as
cycling or the stair climber are preferable to activities such as sprinting which may impose too
much pounding on the joints. Athletes will need to perform intervals in their particular sport.
Table 2 provides guidelines for interval training. Trainees should always warm-up and cool-down
for at least 5 minutes at low intensities prior to interval training.
246
Table 2: General guidelines for interval training
Length of Interval
15”
30”
60”
120”
5-10’
Number of Intervals
20+
10-20
5-10
3-5
1-2
Work: Rest ratio
1: 5-10
1: 2-3
1:1.5
1:1
1: 0.5
Source: “Interval Training: Conditioning for sports and general fitness.” Edward Fox and Donald
Matthews. WB Saunders Company, 1974.
An alternative form of interval training is called Fartlek which is Scandinavian for
speedplay. Fartlek training is a type of free-form interval training and is an excellent way for
non-competitive athletes to incorporate interval training. Rather than performing a specific
number of intervals for a specific amount of time, intensity is increased whenever a trainee
wishes. This might be a sprint up a hill during a bike ride, or a several minute increase in
intensity during a workout on the treadmill. The effort would be followed by several minutes of
lower intensity activity to allow for recovery. Table 2 provides a sample interval training for
untrained individuals seeking fat loss.
Table 2: Sample Interval Training Program
Week 1
Week 2
Week 3
Week 4
Week 5
Week 6
Week 7
Week 8
Frequency # intervals
(times/week)
2
2-3
2
3-5
2
6-10
2-3
2-3
2-3
3-5
2-3
6-8
2-3
2-3
2-3
3-5
Interval length
(seconds)
15-30
15-30
15-30
30-60
30-60
30-60
60-90
60-90
Rest time
(second)
30-60
30-60
30-60
60-90
60-90
60-90
60-90
60-90
Intensity
(% of max.)
70
70
75
75-80
75-85
85-90
90-95
90-95
Frequency: Additional aerobic workouts would consist of standard moderate intensity, longer
duration activities (see guidelines for aerobic training)
Interval length: If a trainee is capable of performing the longer interval at the outset, they
should go ahead and do so.
Rest time: If trainees perform the longer interval length, they should use the longer rest time.
Intensity: This is intensity of maximum capacity. Recovery intervals should be performed at
60% of max. or less.
After an 8 week interval training program had been completed, interval training would be
discontinued for several weeks to allow for recovery.
Reference cited
1. “Interval Training: Conditioning for sports and general fitness.” Edward Fox and Donald
Matthews. WB Saunders Company, 1974.
247
Chapter 26:
Weight Training Guidelines
Relative to aerobic and interval training, weight training is far more complex. The number
of workout permutations is literally infinite and there are few definitive guidelines which exist.
Individuals are encouraged to experiment within the context of the following guidelines to find
what works for them personally. The FITT equation, explained in chapter 23, does not apply as
well to weight training although topics of frequency and intensity are discussed below.
Section 1: Definitions
To better understand the topics to be discussed later in this chapter, a number of basic
weight training concepts need to be defined. They are muscle actions, muscular fatigue,
repetitions, and repetition maximum.
Muscle actions (1)
Although muscles can only contract and pull against the bones that they are attached to,
it is possible to define three different types of muscle actions depending on what happens while
the muscle is contracting. These three actions are:
1. Concentric muscle action: This type of muscle action occurs when the muscle generates more
force than the weight of the bar, causing the muscle to shorten. A concentric muscle action would
represent lifting the weight.
2. Eccentric muscle action: This type of muscle action occurs when the force being produced is
less than the force required to lift the weight. When this occurs, the weight is lowered.
3. Isometric muscle action: This type of muscle action occurs when the amount of force
generated by the muscle equals the the amount of force needed. When this occurs, the weight is
neither lifted nor lowered.
Fatigue and muscular failure
Fatigue during weight training is discussed in chapter 20 and refers to the loss of force
production potential. Muscular failure is typically defined as the momentary inability to move a
weight through a full range of motion in good form and will occur when force production
capabilities have fallen below force requirements. If moving a barbell through the full range of
motion (ROM) requires 100 pounds of force, failure will occur when the muscle can no longer
generate that much force. In that there are three types of muscle actions, there are also three
ways that muscular fatigue can occur.
248
Concentric failure: the momentary inability to lift a weight through the full range of motion
Isometric failure: the inability to hold the weight without movement
Eccentric failure: the inability to lower the weight under control
Concentric failure will occur before isometric failure which will occur before eccentric
failure. On a calorically restricted diet, going past the point of positive failure is probably not a
good idea and will most likely induce overtraining. Therefore, we will only consider positive failure
in the exercise routines.
There is a great deal of debate both in research and popular literature about training to
muscular failure. Some authors feel that training to muscular failure is the ONLY way to
generate adaptations to strength training while others argue that failure is not a prerequisite. A
full discussion of both sides is beyond the scope of this book. This author feels that as long as
individuals are training within a repetition or two of failure (such that at least 10 repetitions are
performed when 12 could have been done in good form) progress should occur.
Repetition (rep or reps)
One repetition of an exercise is the combination of a concentric muscle action and an
eccentric muscle action (a lifting followed by a lowering). Some individuals will perform eccentric
only training (where the weight is lifted by a partner and lowered by the trainee) in which case one
lowering would count as a repetition.
Repetition Maximum (RM)
RM refers to a weight that can be performed X reps but not X+1 reps in perfect form. For
example, if a trainee can do 8 reps in perfect form with 100 lbs but not 9, 100 lbs would be their
8RM weight. The relationship between RM loads and percentage of 1 repetition maximum (the
amount you can lift for 1 rep and 1 rep only) appears in figure 1.
Figure 1: Relationship between reps and percentage of 1 rep maximum
% of
M
A
X
I
M
U
M
20%
40%
50%
60%
70%
80%
85%
90%
100%
100+ 50
20 15 10 8 6 4 2 1
Number of Repetitions
Note: This is a generalized curve and may vary for different bodyparts, individuals and
between men and women.
249
Set
One set of an exercise is a series of repetitions (typically with no rest between repetitions)
terminated when the weight can no longer be moved or when some particular number (i.e. 10) is
attained.
Compound versus isolation exercises
Weight training exercises are typically delineated into compound and isolation exercises.
Compound exercises refer to any exercise where multiple muscles are worked, such as the bench
press or squat. Isolation exercises refer to any exercise where only a single muscle is worked,
such as the cable crossover or leg extension.
Section 2: Acute Program Variables
A number of program variables can be altered during strength training to achieve different
goals. They are: choice of exercise, order of exercise, load used, number of sets/reps, training
frequency, length of the rest interval, and lifting speed (3, 4,5).
Choice of Exercise
The choice of exercise depends on the goal of training. In general, beginners are advised to
stick with compound exercises (i.e. bench press) over isolation exercises (i.e. pec deck) whenever
possible. Compound exercises work more muscles during the same exercise, which burn more
calories and allow more weight to be lifted. However, advanced lifters may wish to incorporate
isolation exercises as necessary. Changing exercises changes motor unit recruitment (6) and
may be necessary for more complete muscular and strength development. The exercise routines
are based around common exercises but individuals are encouraged to substitute exercises as
necessary.
Order of exercise
The typical order of exercise is from larger muscles groups (legs, back) to smaller muscles
(arms, abdominals) as this allows heavier loads to be used during training (7). Larger muscles
require more energy and are generally done earlier in the training session. However, individuals
wishing to work on a specific weak point may choose to train that part first in a routine when
energy levels are high. For example, a bodybuilder with poor hamstrings may train the
hamstrings prior to quadriceps at every other leg workout. Exercise routines typically progress
from larger to smaller muscle groups.
250
Intensity of loading
In research terms, intensity in weight training is defined as the percentage of maximal
capacity that you are lifting (8). Beginners achieve strength gains using weights as low as 50% of
their maximum strength (5). This may allow 20 repetitions or more to be performed.
Advanced lifters will need to use at least 60% of their maximum to obtain strength gains
(5,9). This corresponds to 20 reps or less in most individuals. Maximal strength gains appear to
occur between 4-6RM with lower gains in maximal strength at less than 2RM and greater than
10RM (9). For hypertrophy, it is recommended that lifters work between 60 and 85% of 1RM, as
discussed in chapter 20. This generally falls within the range of 6 to 20 reps. For the greatest
strength gains loads of 85-100% may be used (5). This corresponds to between one and five
repetitions in most people.
In practice, the use of % of 1RM to determine intensity can be problematic since it varies
from exercise to exercise, from individual to individual, and from day to day. In the gym setting,
intensity is typically used as an indication of the overall effort of exercise. By this definition,
higher rep sets (such as 12-15RM) taken to failure can actually be more intense than lower rep
sets (such as a 2-3RM). More accurately, the higher rep set puts a much greater stress on
metabolic factors (such as lactic acid accumulation) while the lower rep set puts less stress on
these same factors (because the set is too short).
Number of reps
There is currently no data to suggest that any one rep range is better than another for the
stimulus of growth. Anecdotally, many authorities suggest a range of 6-20 repetitions completed
in 20-60 seconds as a growth stimulus (4,10-13). The reasons for this time period are discussed
in chapter 20.
There is no need for beginners to use low rep sets early in their training. Recall that the
initial adaptations to strength training are neural. In one study, whether beginners performed
sets of 4-6RM of 15-20RM, they obtained the same adaptations (14). Higher repetitions (no
lower than 8) are recommended for the first several months of training (5). After the first 8-12
weeks of training, beginners may begin working with heavier loads and lower repetitions if desired.
Training volume/number of sets
Volume of training can refer to the total poundage lifted, total number of sets done or total
number of reps done (8). This book will use total sets and reps as as measure of volume,
especially with regards to glycogen depletion and the ketogenic diet.
There is a great deal of debate over how many sets are necessary for optimal results. For
hypertrophy, anywhere from 1 to 20 sets has been used by lifters (4) and 3-6 sets per bodypart
has been suggested as optimal for growth (3,4). However, this depends greatly on individual
recovery capacity and genetics. Some individuals, typically referred to as ‘hardgainers’, may
have trouble recovering from even two or three maximal sets, while others can handle much
higher training loads.
251
In general, the number of sets done is inversely proportional to the number of reps
performed (5). If 20 rep sets are done, only 1-2 sets may be needed while 4 rep sets may require 4
or more sets.
Most research on the topic of sets has been done on beginners who are not representative
of advanced lifters. In beginners, one set gives the same results as three in terms of strength and
muscle size gains, at least over the first fourteen weeks of training (15). Most authorities agree
that 1-2 sets per exercise are sufficient for beginning trainees during the first six to eight weeks of
training (5,8,16). Whether advanced lifters need more sets is a matter of great debate. After this
initial conditioning period where only 1-2 sets are done per exercise, more sets (3-6 per exercise)
may be necessary to elicit further strength gains (5).
Reps, sets, loads and the repetition continuum
Although not all authorities agree, there is thought to be a continuum of adaptations which
may occur with different repetition sets (17). That is, optimal strength gains appear to occur
between 2 and 20RM loads (17) with strength gains becoming progressively lower as more than
20 reps per set are done. In a classic review paper, Atha determined that 4-6 sets of 4-6RM gave
optimal improvements in maximal strength but that higher and lower loads were not as beneficial
(18).
There is a dynamic interaction between the variables of reps, sets and loads. The load
used (% of 1RM) ultimately determines how many reps per set are done. Reps per set (or set
time) ultimately determines how many total sets must be done. The interaction between the
three will affect what adaptation is seen.
The interplay between load and volume (sets and reps) can be looked at as an interplay
between tension and fatigue. Tension is roughly equivalent to the weight being lifting (as a
percentage of maximum). Fatigue refers to the total amount of metabolic work done. In general,
the following appears to hold true.
High tension/low fatigue: 1-5 RM : develops 1RM strength primarily (18)
Low tension/high fatigue: 25+RM : develops muscular endurance
Moderate tension/moderate fatigue: 6-20RM : develops muscle size (19)
The above chart does not take set time into account. It is more accurate to say that low
set times will develop primarily strength, medium set times hypertrophy, and long set times
muscular endurance. However, this is highly variable and many individuals can develop
hypertrophy with very low or very high reps.
Frequency of training
Beginners typically train every other day, three times per week. However, research has
found that beginners may get similar strength gains (about 75-85%) lifting twice a week (20). As
lifters advance, they will need to train a given bodypart less frequently as they will be training it
252
more intensely. Recall from chapter 20 that a muscle may require four to seven days to recover
from eccentric loading. This fact has led many individuals to train each bodypart once per week
and train every day in the gym. This may be a mistake for natural lifters. On top of local fatigue,
trainees also have to deal with systemic fatigue as daily high intensity training generally stresses
the body. So while daily training may give each bodypart up to seven days of rest, the body as a
whole is never allowed to recover.
For natural lifters, it is suggested that no more than two days of heavy training be
performed without a day of rest to avoid negatively affecting hormone levels. In addition, three to
four days per week in the gym is probably the maximum a natural lifter should perform (11). The
exercise routines presented in chapters 27 and 28 reflect this philosophy.
Rest periods
The rest period between sets is inversely proportional to the number of reps done (5). For
sets of 1-5 reps, a rest of three to five minutes may be required. For sets of 12-15 reps, only
ninety seconds may be required for recovery to occur (5, 8). For sets of 25 and up, as little as 30”
may be required between sets
Recall from chapter 20 that the interplay of reps, sets and rest periods can affect the
hormonal response to weight training. To recap:
1. Multiple (3-4), longer sets (10-12RM, lasting 40-60 seconds), with short rest periods (60-90
seconds) raise growth hormone levels and may be helpful for fat loss.
2. Multiple (3-4), short sets (5RM, lasting 20-30 seconds), with long rest periods (3-5’) raise
testosterone levels in men and may be beneficial for strength and size gains.
Tempo
Very little research has examined the effects of lifting speed on strength and mass gains
and no consensus exists on optimal lifting speed (21). Several studies compare high-speed to slow
-speed lifting and find that slow speed lifting increases maximal strength while explosive training
(plyometrics) increases rate of force development (22,23,24).
Most exercises in the weight room are not safely done at high speeds due to the possibility
of injury. Controlled lifting speeds are recommended for strength and mass gains (5). While highspeed lifting may improve power, training for this type of event is beyond the scope of this book.
More importantly, rep speed should probably be varied in the same way that other
program variables are. Within the context of 20-60 seconds of total set time, a large variety of
rep tempos can be chosen, with the number of repetitions changing to accommodate. For
example, a lifter could do 1 rep of 30 seconds up, 30 seconds down or 15 reps of 2 seconds up, 2
seconds down or 10 reps at 2 second up, 4 seconds down.
Simply keep in mind that the eccentric portion of the movement must be controlled for the
253
growth stimulus to occur. Most studies use a 4 to 6 second repetition and we will assume a 4
second repetition from this point on. If trainees prefer a faster or slower tempo, simply change
the rep count to keep set time the same.
Section 3: Other topics
Range of motion (ROM)
Range of motion refers to the total range a weight is moved through from the beginning to
the end of the movement. Strength gains in response to training are very joint angle specific (25)
meaning that strength gains will only be seen in the ROM trained. Thus for strength gains
throughout the full ROM, exercises must be taken through a full ROM during training (8). Partial
movements are sometimes used by advanced lifters to overcome sticking points in a movement
(i.e. lockout of the bench press), but they are beyond the scope of this book.
Circuit Training
Circuit training refers to high rep, continuous weight training used in an attempt to elicit
both strength and aerobic gains. While programs of this nature increase aerobic capacity
slightly, on the order of 4-5%, this can not compare to the improvements in aerobic capacity of 20
to 30% seen with regular aerobic training (17,26). In most cases, circuit training is NOT
recommended for optimal results. The only exception is the circuit depletion workout for
individuals on the CKD which is discussed in the advanced CKD workout in chapter 28.
Aerobics or weight training first?
While trainees should always perform a short aerobic warm-up prior to weight training, the
choice of whether to do weight training or aerobics first in the same workout session is debatable.
Performing aerobics after weights will make the aerobic training harder (27). So if the primary
goal is aerobic training, that should be done first. If the primary goal is weight training, that
should be performed first when the trainee is fresh. While performing aerobics after training
should in theory rely more on fat for fuel, recall that it does not appear that using fat during
exercise has any bearing on fat loss. Bodybuilders, powerlifters and other strength athletes
should always perform weight training first after a short warmup.
Warm ups
A warm muscle can produce more force than a cold muscle (28,29). Thus a proper warmup prior to training will ensure maximal strength as well as help to prevent injuries. The warmup can be broken into two components:
254
1. General warm-up: This is 5-10’ of light aerobic activity to raise the core temperature of the
body. The general warm-up need only be continued until a light sweat is broken, as this indicates
that the body is as warm as it will get. This will also increase liver glycogen output to help
establish ketosis for early week workouts.
2. Specific warm-up: In addition to the general warm-up, a specific warm-up should also be done
to prepare the body for the specific activity which will be done. If a trainee was training chest
with the bench press, they would perform several lighter sets of bench presses prior to their
heavy sets. A common misconception among trainees is the performance of high rep warm-up
sets. All this serves to do is use valuable energy that could be used for the work sets. Warm-up
sets should generally use low reps unless there is an injury present requiring more warm-up (13).
Anywhere from 1-5 warm-up sets may be performed depending on a trainees strength
level. Beginners may not need to do any warm-up sets for the first 6-8 weeks of training.
A comparison of warmups between two lifters appears in table 2. The first lifter will be
lifting 135 lbs for 8 reps during their work sets. The second lifter will be lifting 315 lbs for 8 reps.
Table 2: Comparison of warmups for two different lifters
Lifter 1 (135X8)
barX5, rest 30”
95X3, rest 180”
135X8
Lifter 2 (315X8)
135X5, rest 30”
185X3, rest 30”
225X1, rest 30”
275X1, rest 180”
315X8
Section 4: Weight training systems
The number of training systems in existence is immense, possibly infinite. Rather than
try to describe them all, we will discuss only three: straight sets, ascending pyramids and
descending pyramids.
1. Straight sets is a method where the weight is kept constant on all work sets. If sets are being
taken to failure, most trainees will not be able to perform the same number of reps at each set.
Table 3 on the next page shows an example of straight sets. When all three sets of 10 are
accomplished during a given workout, the weight should be raised about 5% at the next workout.
2. Ascending pyramids are probably the most common type of workout. They are not the most
effective (13). In an ascending pyramid, after warm-ups, the first work set is taken to failure.
Then weight is added to the bar and another set to failure is done at lower reps. This is continued
until all sets have been completed. In a descending pyramid, the first work set is done at the
heaviest weight and the weight is reduced on subsequent sets. Compare the workouts in table 4
for a lifter who will use 275 for their heaviest set.
255
Table 3: Straight set workout for a lifter with a 10RM of 315 lbs
WeightXreps
135X5
185X3
225X1
275X1
315X10
315X8
315X6
Rest (seconds)
30-60
30-60
30-60
180 (end of warm-ups)
120-180
120-180
move to next exercise
With the descending pyramid, many more reps are performed with the heaviest weight
(275 lbs) which would simulate more growth. Then, to take fatigue into account, subsequent sets
are done at a lower weight. With few exceptions, lifters should always use descending pyramids.
Table 4: Comparison of ascending and descending pyramids
Ascending pyramid
135X15
185X12
225X10
245X8
255X8 (failure)
265X7 (failure)
275X6 (failure)
Descending Pyramid
135X8
185X3
225X3
255X1
(End of warm-up sets)
275 to failure (6+ reps)
255 to failure (8+ reps)
245 to failure (9+ reps)
Periodization
Periodization refers to the systematic variation in some aspect of training (such as sets,
reps, rest periods, exercise selection, etc) throughout the training period (1,4,5). Periodization
originally came from Eastern Europe for training weightlifters and there is much debate over its
usefulness for the average trainee. Several research studies show that periodized routines do not
give an advantage in strength gains in the short term (30,31).
However, the body can adapt to any stress and changing some aspect of training from
time to time is one way to generate further adaptation. However, individuals vary in how
frequently they need to vary their programming. Beginners may be able to perform the same
routine for 6 weeks or more without any changes. Intermediate lifters may wish to alter one or
more of the acute program variables ever 4 weeks and advanced lifters may vary some aspect of
their training every 2 to 3 weeks (5). However, many individuals achieve excellent results
making no changes to their program (other than weight lifted) for much longer periods of 12 to 18
weeks.
Although there are a number of different types of periodization which can be used, two of
the most common are linear and undulating periodization (11). Sample programs to increase
both muscle size and increase 1 RM strength appear in table 5.
256
Table 5: Comparison of linear and undulating periodization
Weeks
1-3
Linear
3X10RM
Undulating 3X10RM
4-6
4X6RM
4X6RM
7-9
5X3RM
3X8RM
10-12
6X2RM
4X3RM
13-15
8X1RM
4X5RM
As discussed previously, it does not appear that lower repetitions stimulate muscle growth
to the same degree as higher rep sets but may increase maximal strength more. Thus, a linear
periodization routine may result in loss of muscle near the end of the cycle (4). Undulating
periodization allows an individual to alternate between strength and growth training to maintain
muscle mass while pushing up maximal strength.
References cited
1. “Essentials of strength and conditioning” Ed. T. Baechle, Human Kinetics Publishers 1994.
2. Sale D And MacDougall D. Specificity in Strength Training: A Review for the Coach and
Athlete. Can J Appl Sports Sci (1981) 6:87-92.
3. Fleck S and Kraemer W. Resistance Training: basic Principles (Part 4 of 4). Physician and
Sportsmedicine (1988) 16 June: 69-81.
4. “Designing Resistance Training Programs, 2nd edition” W. Kraemer and S. Fleck, Human
Kinetics 1996.
5. “Program Design: Choosing sets, reps, loads, tempo and rest periods” Paul Chek, Paul Chek
Seminars 1996.
6. “Neuromechanical basis of kinesiology” Roger M. Enoka. Human Kinetics Publishers 1994.
7. Sforzo GA and Touey PR. Manipulating exercise order affects muscular performance during a
resistance exercise training session. J Strength Cond Res (1996) 10: 20-24.
8. Fleck S and Kraemer W. Resistance Training: basic Principles (Part 1 of 4). Physician and
Sportsmedicine (1988) 16 March: 160-171.
9. McDonagh, MJN and Davies CTM. Adaptive response of mammalian skeletal muscle to
exercise with high loads. Eur J Appl Physiol (1984) 52: 139-155.
10. “Fitness and Strength Training For All sports: Theory, Methods, Programs” J. Hartmann and
H. Tunnemann. Sports Books Publishers 1995.
11. “Current trends in strength training” Charles Poliquin Dayton Publishing Group 1997.
12. “Supertraining: Special Training for Sporting Excellence” Mel Siff and Yuri Verkoshanksy,
School of Mechanical Engineering Press 1993.
13. “Science and practice of strength training” Vladimir Zatsiorsky, Human Kinetics 1995.
14. Hisaeda H et. al. Influence of two different modes of resistance training in female subjects.
Ergonomics (1996) 39: 842-852.
15. Starkey DB et. al. Effect of resistance training volume on strength and muscle thickness.
Med Sci Sports Exerc (1996) 28: 1311-1320.
16. Westcott W. Transformation: How to take them from sedentary to active. Idea Today
Magazine (1995) pp. 46-54.
17. Kraemer WJ et. al. Physiological adaptations to resistance exercise: Implications for athletic
conditioning. Sports Med (1988) 6:246-256.
257
18. Atha J. Strengthening muscle. Exercise and Sports Science Reviews (1981) 9: 1-73.
19. Stone WJ and Coulter SP. Strength/endurance effects from three resistance training
protocols with women. J Strength Cond Res (1994) 8: 231-234.
20. American College of Sports Medicine Position Stand. The recommended quantity and quality
of exercise for developing and maintaining cardiorespiratory and muscular fitness in
healthy adults. Med Sci Sports Exerc (1990) 22: 265-274.
21. LaChance PF and Hortobagyi T. Influence of cadence on muscular performance during pushup and pull-up exercise. J Strength Cond Res (1994) 8: 76-79.
22. Hakkinen K et. al. Changes in isometric force and relaxation time, electromyographic and
muscular fiber characteristics of human skeletal muscle during strength training and
detraining. Acta Physiol Scand (1985) 125: 573-585.
23. Hakkinen K et. al. Effect of explosive type strength training on isometric force and relaxation
time, electromyographic and muscle fibre characteristics of leg extensor muscles.
Acta Physiol Scand (1985) 125: 587-600.
24. Hakkinen K and Komi P. Training-induced changes in neuromuscular performance under
voluntary and reflex conditions. Eur J Appl Physiol (1986) 55: 147-155.
25. Graves JE Specificity of limited range of motion variable resistance training. Med Sci Sports
Exerc (1989) 21: 84-89.
26. “Strength and Power in Sport” Ed. P.V. Komi Blackwell Scientific Publications 1992.
27. Bailey ML et. al. Effects of resistance exercise on selected physiological parameters during
subsequent aerobic exercise. J Strength Cond Res (1996) 10: 101-104.
28. “Physiology of Sport and Exercise” Jack H. Wilmore and David L. Costill. Human Kinetics
Publishers 1994.
29. “Exercise Physiology: Human Bioenergetics and it’s applications” George A Brooks, Thomas
D. Fahey, and Timothy P. White. Mayfield Publishing Company 1996.
30. Baker D et. al. Periodization: The effect on strength of manipulating volume and intensity.
J Strength Cond Res (1994) 8: 235-242.
31. Herrick AB and Stone WJ. The effects of periodization versus progressive resistance exercise
on upper and lower body strength in women. J Strength Cond Res (1996) 10: 72-76.
258
Part VII:
Exercise programs
Chapter 27: Beginner/intermediate programs
Chapter 28: The Advanced CKD workout
Chapter 29: Other applications for the ketogenic diet
Chapter 30: Fat loss for the pre-contest bodybuilder
Previous sections have laid the groundwork for the actual training programs to be
presented in this chapter. Depending on the goals of the individual, differing amounts of each type
of training (aerobic, interval, weight training) are necessary.
Chapter 27 presents programs for the beginning and intermediate trainee. Chapter 28
discusses the advanced CKD workout, based on the information presented in chapter 12.
Chapter 29 presents possible ways to implement the ketogenic diet for other applications such
as endurance training, power/strength sports, and mass gains. Finally, chapter 30 discusses fat
loss for the pre-contest bodybuilder.
259
Chapter 27:
Beginner/Intermediate programs
Having discussed general guidelines for the three types of exercise in previous chapters,
this chapter presents sample exercise programs for beginning and intermediate exercises. There
is also a discussion of split routines.
Section 1: Beginner routine/General Fitness
The following routine is for individuals who have never lifted weights before or who may be
starting a diet and exercise program after a long time of being inactive. It is appropriate to use
with the TKD but not the CKD (as the total amount of training is not sufficient to deplete
glycogen in all muscle groups within 5 days).
Aerobic training
A frequency of three days per week with a duration of 20-30’ and a moderate intensity
(~60-70% of maximum heart rate) is all that is necessary to build basic fitness. Aerobic exercise
can be performed prior to the weight workout or afterwards. If fat loss is the goal, trainees may
wish to perform more aerobic exercise than the bare minimum, up to 4-5 days per week. When
beginning an exercise program, it is recommended that individuals start slowly and build up.
Volume and intensity of exercise can be increased gradually as fitness improves. Doing too much
too soon is an excellent way to get injured or burn-out on an exercise program. A sample aerobic
progression appears in chapter 24.
Interval training
Interval training is an option for individuals wishing basic health and fitness but is not
required. Individuals just starting an exercise program should not consider performing interval
training until a base fitness level of at least four weeks with a minimum of 30’ of aerobic exercise
three times per week has been achieved. Beginners wishing to begin interval training should refer
to chapter 25 for guidelines.
Weight training
For basic fitness, a weight routine of 25-30’ two to three times per week is sufficient. A 5’
warmup on the bike or treadmill (or full aerobic workout) should precede every weight training
260
session. Beginners should generally start with the lightest weight possible, focusing on form and
breathing during their first few workouts. Once form has been learned, progressive overload is
applied by attempting to improve performance at each workout, by adding either repetitions or
weight. When 12 repetitions can be completed in perfect form, the weight should be raised
approximately 5% (or whatever the smallest weight increment available is), bringing the rep
count back down to 8. The lifter would then attempt to perform more reps until 12 were
performed at which point the weight would be raised again. Most beginners find they can raise
weights consistently for the first 8 weeks of training. Beginners should be sure to use a
controlled, slow lifting speed while they are learning the movements. Lifting the weight in 2-3
seconds and lowering it in 3-4 seconds is a general guideline. A sample beginner weight training
workout appears in table 1.
Table 1: Beginning weight workout
Exercise
Leg press(1*)
Calf raise (2)
Leg curl (3)
Bench press(1*)
Row (1*)
Shoulder press (2)
Pulldown (2)
Triceps pushdown (3)
Biceps curl (3)
Crunch (1*)
Low back extension (3)
Sets
1
1
1
1
1
1
1
1
1
1
1
Reps
8-12
8-12
8-12
8-12
8-12
8-12
8-12
8-12
8-12
8-12
8-12
Rest
60”
60”
60”
60”
60”
60”
60”
60”
60”
60”
60”
* Individuals with very limited time can obtain significant benefits from performing these four
exercises (which should take approximately 5’) with 20-25’ of aerobic exercise. Alternately, if a
trainee has 30’ four times per week or more to exercise, they should perform weight training twice
per week for 30’ and aerobics 2-3 times per week for 30’.
Beginning trainees starting on the ketogenic diet should not need to consume pre-workout
carbs for at least the first 2-3 weeks. This should allow the major adaptations to the ketogenic
diet to occur as rapidly as possible. After 2-3 weeks of regular training, carbohydrates can be
consumed around training as described in chapter 11.
Numbers after each exercise indicate what exercise session a given exercise should be
introduced. The first workout would be one set of leg presses, one set of bench presses, one set of
rows, and one set of crunches. At the second workout, the first four exercises would be done and
the calf raise, shoulder press, and pulldown would be added. At the third workout, the previous
seven exercises would be done with the addition of the leg curl, triceps pushdown, biceps curl, and
back extension at which point no new exercises would be added. This progression allows
beginners to ease into training without generating too much muscle soreness.
261
Section 2: Intermediate workout routines
After 8 weeks of the beginner training program, many individuals wish to move to a more
advanced workout. Due to the higher number of sets, the CKD approach becomes possible at
this time. We will assume an average set time of 45” this point in the exercise programs. This
allows a lifting speed of 2-3 seconds up and 2-4 seconds down for an average of 10 reps per set.
An intermediate workout appears in table 2.
Table 2: Intermediate 3 day full body workout
Exercise
Leg press*
Calf raise
Leg curl
Bench press*
Row*
Shoulder press
Pulldown to front
Triceps pushdown
Arm curl
Crunch
Back extension
Sets
2
1
1
2
2
1
1
1
1
2
1
Reps
6-8
8-10
8-10
6-8
6-8
8-10
8-10
12-15
12-15
12-15
8-12
Rest
90”
60”
60”
90”
90”
60”
60”
60”
60”
60”
60”
* Perform 1-2 warmup sets prior to these exercises.
Section 3: Split routines
As trainees progress, they will frequently be unable to recover from working each
bodypart three times weekly. At this time they must move to a split routine. Split routines
allows a greater amount of recovery to occur between sessions as well as allowing more work to
be done for each bodypart.
There are many different ways to split the body. The simplest split is the two day split.
This way, instead of working the whole body in one workout, it is divided into two parts. The main
types of two day splits are:
1. The Upper/Lower + abs split
2. The Push/Pull+leg split
The Upper/Lower + abs split
With the Upper/Lower split, the upper body is trained one day and lower body + abs the
next training day. A sample upper/lower split routine appears in tables 3 and 4.
262
Table 3: Sample lower body+abs workout
Exercise
Leg press/squat*
Leg curl*
Leg extension
Seated leg curl
Standing calf raise*
Seated calf raise
Reverse crunch
Crunch
Sets
3
3
2
2
3
2
2
2
Reps
8-10
8-10
10-12
12-15
8-10
12-15
15-20
15-20
Rest
90-120”
90”
90”
90”
90”
90”
60”
60”
* Perform 1-3 warmup sets prior to these exercises.
Table 4: Sample upper body workout
Exercise
Bench press*
Cable row*
Shoulder press
Pulldown to front
Triceps pushdown
Arm curl
Back Extension
Sets
3
3
2
2
1-2
1-2
2
Reps
8-10
8-10
10-12
10-12
12-15
12-15
12-15
Rest
90”
60”
60”
60”
60”
60”
60”
* Perform 1-3 warmup sets prior to these exercises.
There are two ways to work the Upper/Lower split into a routine. One is to alternate
workouts on a Monday, Wednesday, Friday workout schedule. A second is to train each bodypart
twice a week. Both options appear in table 5.
Table 5: Comparison of two different ways to sequence the Upper/Lower Split
Option 1: every other day
Mon: Lower body
Tue: off
Wed: Upper body
Thu: off
Fri: Lower body
Sat: off
Sun: off
Mon: Upper body
Tue: off
Wed: Lower body
Thu: off
Fri: Upper body
Option 2: 4 days per week
Mon: Lower body
Tue: Upper body
Wed: off
Thu: Lower body
Fri: Upper body
Sat: off
Sun: off
Mon: Lower body
Tue: Upper body
Wed: off
Thu: Lower body
Fri: Upper body
263
The every other day routine gives a lot of recovery between workouts. If using the CKD
approach, each workout will come before the carb-up every 2 weeks. The 4 day per week routine
hits each bodypart more frequently but the same workout will precede the carb-load every week.
The Push/Pull + legs split
The second type of 2 day split is the Push/Pull + legs split. With this workout, the body is
split into pushing muscles (chest, shoulders, triceps) and pulling muscles (back, biceps). Legs are
trained with pulling muscles to keep the workouts approximately the same length. Sample
workouts appear in tables 6 and 7.
Table 6: Sample pushing workout + abs
Exercise
Bench press*
Incline bench press
Shoulder press
Triceps pushdown
Reverse crunches
Crunch
Sets
4
2
3
2
3
2
Reps
6-8
10-12
10-12
12-15
15-20
15-20
Rest
90”
60”
90”
60”
60”
60”
* Perform 1-3 warmup sets prior to these exercises.
Table 7: Sample pulling workout + legs
Exercise
Leg press/squat*
Leg curl
Calf raise
Cable row*
Pulldown to front
Barbell curl
Back extension
Sets
4
4
2
4
2
2
2
Reps
6-8
6-8
15-20
6-8
8-10
10-12
12-15
Rest
120”
90”
90”
60”
60”
60”
60”
* Perform 1-3 warmup sets prior to these exercises.
The Upper/Lower split can be sequenced in the same way as the Push/Pull split, outlined in
table 6 above.
The three way split
Some individuals prefer to train a three or four day split (or more), dividing the entire body
into three or four separate sections. This is probably not ideal for the CKD approach since
bodyparts will not be optimally compensated during the carb-up. However, this type of workout
approach is usable with the TKD. Some sample three day splits appear in table 8.
264
Table 9: Possible three way splits
Option 1
Mon: Chest/back
Tue: off
Wed: Legs/abs
Thu: off
Fri: delts/arms
Sat/Sun: off
Option 2
Chest/shoulders/triceps
off
Leg/abs
off
back/biceps
off
Option 3
Chest/triceps
off
Back/biceps
off
Legs/shoulders
off
Summary
The amount of exercise needed by beginning trainees is small. A minimum of three hours
per week, generally divided half into weight training and half into intervals is all that is necessary
for basic health and fitness. Beginners can add interval training if desired.
As trainees become more advanced, they may be unable to weight train each bodypart
three times per week. In this case the body can be split, such that different bodyparts are
worked at each workout. A number of types of splits is possible.
265
Chapter 28:
The Advanced CKD for fat loss
Advanced trainees frequently want to know how to optimize the CKD for fat loss. This
chapter presents a routine which incorporates all of the information presented in the previous
chapters. The goal of this routine is to co-ordinate training to take maximal advantage of the
peculiar format of the CKD. This goal incorporates the following factors:
1. Deplete muscle glycogen in all bodyparts to approximately 70 mmol/kg by Tuesday to
maximize fat utilization by the muscles but not increase protein utilization.
2. Maximize growth hormone output (which is a lipolytic hormone) on Monday and Tuesday with
the combination of multiple, long sets, and short rest periods.
3. Maintain muscle mass with tension work outs on Monday and Tuesday.
4. Deplete muscle glycogen to between 25 and 40 mmol/kg on Friday to stimulate optimal
glycogen supercompensation.
5. Stimulate mass gains during the weekend of overfeeding with a tension workout or utilize a
high rep depletion workout to deplete glycogen completely.
Three possible formats for this routine appear in table 1.
Table 1: Possible variants for the 7 days CKD
Sun:
Mon:
Tue:
Wed:
Thu:
Fri:
Sat:
Variant 1
Variant 2
Variant 3
30-60 minutes of low intensity aerobics to reestablish ketosis
Legs
Legs/Chest/Back
Back/biceps/legs
Upper body
Delts/arms/abs
Chest/delts/triceps/abs
Aerobics or off
Aerobics or off
Aerobics or off
Aerobics or off
Aerobics of off
Aerobics or off
Full body
Full body
Full body
No workout during the carb-up phase of the diet
This format assumes that the carb-up ends Saturday at bedtime. If lifters choose to carbup for longer than 36 hours, the Sunday cardio session would be moved to Monday morning or
eliminated completely.
Aerobics are optional on Mon and Tue and should be done after lifting. Legs should
generally be trained on Monday when the trainee is strongest. Alternately weak body parts can
be trained on Monday to take advantage of glycogen compensation.
The Friday full body workout can either be a tension workout (i.e. high loads, low reps) or a
high-rep, circuit-type depletion workout. The choice of one or the other will depend on the level of
the lifter. Advanced lifters may not be able to train a bodypart heavily twice each week and fully
recover. In that case, the high-rep depletion workout would be the best choice.
266
Others may choose to do a heavy workout prior to the carb-up to take advantage of any
possible anabolism during the carb-load. For lifters wishing to use the advanced workout with the
CKD, they must calculate how many sets per bodypart are needed to deplete muscle glycogen.
Keep in mind the goal to reach 70 mmol/kg by the end of Tuesday’s workout and then
between 25-40 mmol/kg before the carb-up. The example workout is based on a lifter carbing for
36 hours, achieving a glycogen level of ~150 mmol/kg in each major muscle group. Calculations
were done in chapter 12 and sample workouts appear in table 2 and 3.
Table 2: Sample Monday workout: legs and abdominals
Exercise
Squats *
Leg curl *
Leg extension OR
feet high leg press
Seated leg curl
Standing calf raise *
Seated calf raise
Reverse crunch
Crunch
Sets
4
4
2
Reps
8-10
8-10
10-12
Rest
90”
90”
60”
2
4
2
2
2
10-12
8-10
10-12
15-20
15-20
60”
90”
60”
60”
60”
* Perform 1-3 warmup sets for these exercises
Table 3: Sample Tuesday workout: upper body
Exercise
Incline bench press *
Cable row *
Flat bench press
Pulldown to front
Shoulder press
Barbell curl
Triceps pushdown
Sets
4
4
2
2
3
2
2
Reps
8-10
8-10
10-12
10-12
10-12
12-15
12-15
Rest
60”
60”
60”
60”
60”
45”
45”
* Perform 1-3 warmup sets for these exercises
The above workouts should deplete glycogen in all target muscle groups to roughly 70
mmol/kg. On Friday, the goal is to deplete the muscles to between 25-40 mmol/kg, requiring 85128 seconds more work. Again, at 45” per set average, this requires 2-3 heavy sets per bodypart.
Due to the significant overlap between body parts, only 1 set should be needed for small muscle
groups. Arms receive sufficient work from benching, rows, presses and pulldowns. Additionally,
different exercises are selected from the Mon/Tue workouts to target different muscle fibers. A
sample Friday tension workout appears in table 4.
267
Table 4: Sample Friday tension workout
Exercise
Leg press *
or Deadlift *
Leg curl
Calf raise *
Bench press *
Wide grip row *
Shoulder press
Undergrip pulldown
Sets
3
2
1
2
2-3
2-3
1-2
1-2
Reps
8-10
10-15
10-12
10-12
8-10
8-10
10-12
10-12
Rest
90”
2-3’
60”
60”
90”
90”
60”
60”
* Perform 1-3 warmup sets for these exercises
Note: Sets and reps differ for deadlifts due to decrease the chance of low-back strain.
The depletion workout
Another option for the Friday workout is a high-rep, circuit depletion workout. If a trainee
chooses to do this workout, he or she should simply pick one exercise per bodypart and work the
body in a giant loop. For best recovery between body parts, alternate a leg exercise, a pushing
exercise, and a pulling exercise. A possible order would be legs, chest, back, hamstrings,
shoulders, lats, calves, triceps, biceps, and finally abdominals.
Each set should consist of 10-20 quick reps per set (1 second up/1 second down) with a
light weight. One minute of rest should be taken between exercises, and five minutes rest
between each circuit. This will help to limit fatigue and nausea from lactic acid buildup. The sets
should not be taken to failure as the goal is simply to deplete muscle glycogen. The depletion
circuit is the workout that pre-contest bodybuilders will do the week of the contest before the final
carb-up. Sample circuits appear below:
1. leg press, dumbbell (DB) bench press, cable row, leg curl, shoulder press, overgrip pulldown, calf
raise, triceps pushdown, barbell curl, reverse crunch.
2. leg extension, incline DB bench press, narrow grip row, seated leg curl, lateral raise, undergrip
pulldown, seated calf raise, close grip bench press, alternate DB curl, twisting crunch.
3. squat, flat flye, cable row, standing leg curl, upright row, overgrip pulldown, donkey calf raise,
overhead triceps extension, hammer curl, crunch.
Since the intensity is lower (roughly 50-60% of maximum) glycogen depletion per set will
also be lower. Additionally, 20 reps will only require about 20-40 seconds to complete. Assuming
glycogen had started at 70 mmol/kg, it will likely take 4-6 circuits to fully deplete glycogen.
268
The Hardgainer CKD fat loss workout
A potential problem with CKD for fat loss is that a fairly high volume of weight training is
required to deplete glycogen between carb-ups. Additionally, training bodyparts twice each week
can cause overtraining in those with poor recovery ability. As discussed in chapter 12, one option
is to perform less heavy tension sets on Monday and Tuesday and deplete muscle glycogen with
light, high rep sets not taken to failure.
Another option is to make the CKD a 14 day cycle rather than a seven day cycle. Thus,
the total volume of work needed to deplete muscle glycogen (roughly 4-6 sets per bodypart
assuming a 36 hour carb-up) can be stretched across two weeks of training. This allows 2-3 sets
per major bodypart (smaller bodyparts would require less sets) at each workout. Sample
Hardgainer CKD schedules appear in tables 5 and 6.
Table 5: Hardgainer option
Mon:
Tue:
Wed:
Thu:
Fri:
Sat/Sun:
Mon:
Tue:
Wed:
Thu:
Fri:
Workout 1
Off
Workout 2
Off
Workout 1 ; no carb-up
Off
Workout 2
Off
Workout 1
Off
Workout 2 ; start carb-up
Table 6: Extreme Hardgainer option
Mon:
Tue-Thu:
Fri:
Sat/Sun:
Mon:
Tue-Thu:
Fri:
Workout 1
Off
Workout 2 ; no carb-up
Off
Workout 1
Off
Workout 2, start carb-up
269
Chapter 29:
The ketogenic diet for other goals
Many individuals want to know if the CKD or other ketogenic diets can be used for specific
exercise goals. With the exception of long duration, low intensity aerobic exercise, ketogenic diets
are not optimal performance diets in most cases. In certain situations, they can be used for
individuals involved in high-intensity sports who need to lose bodyfat without sacrificing muscle
mass. However, most individuals will find that their performance is better with a carbohydratebased diet.
Section 1: The CKD and Mass gains
For reasons discussed in other chapters, the CKD is not optimal for mass or strength
gains. The lowness of insulin and other anabolic hormones,coupled with depleted liver glycogen
(which affects overall anabolic status) means that growth will be less compared to a
carbohydrate based diet.
Although lifters vary in their individual nutritional requirements, a diet with a moderate
carb intake (40-50%), moderate protein (20-30%, or 1 gram protein/lb of body weight), moderate
fat (20-30%) and above maintenance calories (10-20% above maintenance) will be more
beneficial for gaining mass and strength than a CKD. However, some lifters will choose to use a
CKD for mass gains, usually in an attempt to minimize bodyfat gains. The following guidelines
should be applied.
The lowcarb week
Gain in muscle require that calories be raised above maintenance. This also means that
some fat gain will occur. A good starting point is to raise calories during the lowcarb week to 1020% above maintenance. In practice, this yields 18 calories per pound of body weight or more per
day (see chapter 8). Some lifters require even higher calorie intakes, 20+ cal/lb depending on their
metabolic rate.
For some lifters, it can be problematic to consume this much food on a low-carbohydrate
diet, especially if they find that their appetite is blunted. Dividing the day’s total calories into
smaller meals, and using calorically dense foods to raise calories may be useful in this regard.
The carb-up
For maximal anabolism, the carb-up period should be lengthened to a full 48 hours. While
this may cause greater fat deposition, especially if lots of high glycemic index (GI) sugars are
270
consumed, this strategy should also yield greater lean body mass gains. Switching to lower GI
carbs during the second half of the carb-up should help maximize anabolism but limit fat gains.
Additionally, using Citrimax (see chapter 31) may help limit fat gain on the weekends.
The Targeted CKD
One useful strategy for maximizing anabolism with the CKD is the inclusion of pre- and
post-workout carbohydrates during the week, in addition to the weekend carb-up. In this case,
the guidelines presented for the TKD (chapter 11) should be used. Post-workout carbohydrates
may be especially useful to help keep cortisol levels down and help with recovery. Many lifters
report decreased soreness and increased recovery when carbs are taken post-workout. As with
the TKD, the choice of pre-workout carbohydrates is not critical and lifters should choose easily
digested carbohydrates.
Up to 25-50 grams of carbs can be consumed 30-60 minutes before working out. Some
lifters have also experimented with consuming carbs during training, but many report problems
with stomach upset, especially on leg training days.
The choice of post-workout carbs is important so that muscle but not liver glycogen is
refilled. The ideal carb source is glucose or glucose polymers. Fructose and sucrose should
ideally be avoided as they may refill liver glycogen, possibly interrupting ketosis.
Lifters should consume 50-100 grams of liquid high GI carbs with 25-50 grams of protein
(and supplements of choice) immediately after training. The carbs should preferentially go to the
muscles to refill muscle glycogen and ketosis should resume within an hour or two. Ketone levels
should be checked pre- and post-workout to ensure that ketosis is not being interrupted for long
periods.
The mid-week carb spike
An alternative strategy to carbing around workouts is the use of a mid-week carb-spike.
With this dietary strategy, up to 1000 calories of carbs (250 grams) with some protein (25-50
grams) but no fat is consumed as the first meal Wednesday morning. Ketogenic eating should be
resumed a few hours later to give blood glucose and insulin time to return to normal. Weight
training should take place at some point later in the day to reestablish ketosis.
Splitting up the carb-load
A final strategy which lifters may wish to try is to perform 2 shorter carb-load periods of
24 hours each at different times each week. For example, a lifter might carb-load for 24 hours on
Tuesday (following a workout) and again for 24 hours on Saturday. In theory, this might generate
more anabolism while limiting the potential for fat gain.
Body composition
271
Body composition
During mass gaining phases, body composition should be measured every two to three
weeks to determine what percentage of the weight being gained is muscle and fat. This will allow
trainees to monitor the results of their experiments and make adjustments to calorie and
carbohydrate intake.
Training
In terms of training, mass gains are best achieved with an emphasis on basic movements
like squats, benches, deadlifts, pulldowns/chins, etc, with few isolation movements. Recall that
the growth range is somewhere between 6-20 reps or about 20-60” per set. Emphasis should be
placed on the negative (lowering) portion of the movement as this seems to be a primary
stimulus for strength and mass gains.
Most advanced lifters find that training a muscle once every 5-7 days is an ideal frequency,
although this depends on the intensity of loading. In general, it seems that larger muscles (quads,
chest, back) take longer to recover than smaller muscle groups (shoulders and arms). However,
trying to set up workout programs around individual bodypart recovery times leads to too many
days in the gym and unrealistic schedules (such as training triceps the day before chest). Most
lifters will get the best mass gains training 3-4 hours per week maximum.
In terms of sets and reps, no one prescription is ideal for everyone. Some lifters respond
best to high rep (12-20) sets while others thrive on low rep sets (6-12). An ideal situation is
probably a combination of varying rep ranges, either in the same workout or alternated as in the
periodization scheme presented in chapter 26.
In a periodized scheme, a lifter might alternate between periods of 10-15 reps (roughly 4060 seconds per set) and periods of 6-10 reps (roughly 20-40 seconds per set) every 4-6 weeks or
so. An occasional (i.e. every 6-8 weeks or so) change to very low reps (1-5 reps, sets 20” or less)
can help improve the neural aspects of training, raising strength thresholds for the higher rep
brackets.
The primary issue that lifters must keep in mind is that they will be limited to a certain
number of sets based on the length of the carb-up. To a great degree, that will ultimately
determine the training structure which should be used. This is another reason why the CKD is
probably not ideal for mass gains. The structure of the diet puts limitations on the types of
training which can be done.
As calories are above maintenance, techniques such as forced reps and strip sets may be
useful but care must be taken. Overuse of any high-intensity technique can lead rapidly to
overtraining regardless of diet. It is best to pick one or two body parts per cycle (generally weak
body parts for bodybuilders) for extra attention while working other body parts at maintenance
with fewer sets.
Continual progress on all body parts at once is rare, especially in advanced lifters. While
devoting extra intensity on one or two body parts, techniques such as forced reps should not be
used more than every other workout for any given bodypart. The intervening workout should be
272
taken only to the point of positive failure (straight sets).
The main problem with the CKD for mass gains is that only muscles trained on Friday will
receive optimal super compensation and growth. This means that either a full-body workout
should be performed or that a rotating schedule must be used (such as the Upper/Lower split in
chapter 27). Each muscle group will be worked prior to the carb-up period once every two or
three weeks depending on the rotation used. Alternately, weak body parts can be trained on
Friday so they will receive the greatest super compensation and growth from the carb-up.
Maintenance body parts can be trained Mon/Tue or Mon/Wed after the carb-up. Another
alternative is to train weak body parts at a low rep range (6-8) on Monday when trainees are
strongest from the carb-up and again on Fridays with higher reps (10-15) before the carb-up.
Maintenance body parts can be trained on Wednesday with lesser volume.
An optional method is to use the four day Upper/Lower body split in chapter 27 but plan it
so that one of the lifting days occurs during the carb-up. Table 1 gives an example sequence.
Table 1: Sample workout sequence for mass gains
Day
Mon:
Tue:
Wed:
Thu:
Fri:
Sat:
Sun:
Workout
Off
Upper body
Lower body
Off
Upper body
Lower body
Off
Diet
Lowcarb
Lowcarb
Lowcarb
Lowcarb
Begin carb-up
Continue carb-up
Continue carb-up
Aerobics
During mass gaining phases, aerobic training should generally be limited to 20-30’ once or
twice a week. This will contribute to maintenance of aerobic fitness and may help with recovery
without detracting too much from mass gains. Many lifters, fearing fat gain, continue to do
copious amounts of aerobics during their mass gaining phases. While generally preventing much
of the fat gain, excess aerobics also tends to prevent muscle gain. Therefore, high amounts of
aerobic training are emphatically not recommended.
Section 2: Strength/Power Athletes
As with mass gains for bodybuilders (previous section), the CKD is not ideal for
powerlifters and other strength/power athletes (throwers, sprinters, Olympic lifters, etc). The
extremely high intensity nature of training for these sports absolutely requires carbohydrates for
optimal performance.
Additionally, the dehydration caused by ketogenic diets may compromise joint integrity,
increasing the risk of injury. However, if a powerlifter or other athlete needs to maintain
performance while losing body fat to make a weight class, the CKD may be a viable option.
273
Power lifters
Since the days following the carb-up are when individuals are typically strongest, it makes
sense to put the power training days there. Possibly, the performance of a short tension workout
(with higher reps) on Friday before the carb-up may allow a slight increase in muscle mass to
support the next cycle of power training.
If muscle gain is not desired (for example, individuals close to the top of their weight class),
performance of a high rep depletion workout or assistance exercises should be performed on
Friday instead. A sample workout cycle appears in tables 2 through 4.
The inclusion of light squats and deadlifts is so that the movement pattern can be trained.
Alternately, the light movement of the week can be trained on Friday prior to the carb-up.
Sets/reps for the power lifts are typically cycled throughout a training period as indicated by the
and no repetition guidelines are given in the following workouts. The example given in chapter 26
for undulating periodization gives a basic set/rep protocol for reaching a new 1RM. Typically,
assistance exercises are worked for slightly higher reps, 6-8 or more. Assistance exercises should
be chosen to improve the weak point of a given power movement (i.e. lockout problems on bench
would require more triceps work, heavy partials in the rack or isometrics).
Table 2: Sample Monday workout: Squats and support exercises OR
deadlifts and support exercises alternating week to week
Week 1: Sample Squat workout
Exercise
Sets
Reps
Squat
a
a
Leg curl
3
6-8
Calf raise
3
12-15
Weighted crunch
3
8-10
Cable row
2
6-8
Barbell curl
2
6-8
Light deadlifts
1
b
OR Stiff legged DL
1
6-8
Rest
3-5’
2’
2’
2’
2’
2’
Week 2: Sample Deadlift workout
Sets
Reps
Rest
Deadlift
a
a
3-5’
Undergrip pulldown
3
6-8
2’
Shrug
3
6-8
2’
Low back
3
8-10
2’
Extension
2
12-15
2’
Grip work
Varies but 2-4 sets of 40-70 seconds each are recommended.
Light squat
1
b
Exercise
a. Sets and reps are typically varied throughout the training cycle
b. Weight would be 80-85% of the previous weeks work weight for the same reps
274
Table 3: Sample Tuesday: Bench and support exercises and abdominals
Exercise
Sets
Bench press
a
Bench assistance
3
exercise (focusing on weak point)
Shoulder press
2
or dips
Close grip bench
2
Abdominals
3
Reps
a
6-8
Rest
3-5’
2-3’
10-12
2-3’
10-12
6-8
2-3’
1-2’
a. Sets and reps are typically varied throughout the training cycle
Wed/Thu: Off or low-intensity aerobics if fat loss is the goal
Table 4: Sample Friday workout: tension workout
Exercise
Leg press
Leg curl
Calf raise
Incline bench
Wide grip row
Shoulder press
Pulldown
Sets
3
1
2
3
3
1-2
1-2
Reps(a)
8-10
10-12
10-12
8-10
8-10
10-12
10-12
Rest
90”
60”
60”
90”
90”
60”
60”
a Set tempo should be such that failure occurs within 40 to 60 seconds.
Note: Direct arm work is dropped as the arms get considerable training from the compound
chest, back, and shoulder movements. If trainees must perform arm work, they should
perform 1-2 sets of 12-15 repetitions for one basic exercise (alternate DB curl, barbell curl,
close grip bench press, etc).
Different exercises should be used during the Friday workout than on the Mon/Tue
workouts to stress different muscle fibers. Additionally, using a higher rep bracket should help
avoid problems with training a muscle heavily twice per week. That is, low rep sets on Mon/Tue
will stress primarily Type IIb fibers (with some Type IIa stimulation) while the Friday workout,
with higher reps will stress Type IIa fibers more (due to longer set times).
Other Power Athletes
Athletes such as volleyball players, etc. may wish to use the CKD for the same reasons as
powerlifters: to drop body fat while maintaining anaerobic performance. The same guidelines
apply to these athletes. During and following the carb-up is the time to perform skill work and
weight training. Later in the week, when glycogen is depleted, metabolic conditioning such as
aerobic exercise can be done. A sample workout schedule appears in table 5.
275
Table 5: Sample workout week for a volleyball player appears below
Day
Mon:
Tue:
Wed:
Thu:
Fri:
Sat:
Sun:
Workout
Weight training,
Weight training (depending on split)
Metabolic conditioning (run, bike, intervals)
Metabolic conditioning (run, bike, intervals)
Depletion workout
Volleyball scrimmage or match
Skills drills, interval training
Diet
Lowcarb
Lowcarb
Lowcarb
Lowcarb
Lowcarb
Continue carb-up
Continue carb-up
For most power athletes, the CKD is probably best used during the off-season when
relatively less high-intensity training is being performed. During the season, a moderate to high
carb diet will provide better performance.
Summary
Although the ketogenic/CKD is not ideal for most strength and power sports, it is a viable
option for use during the off-season by those athletes who need to lose bodyfat while maintaining
high intensity exercise performance.
Section 3: Endurance athletes
Of all the types of exercise, low-intensity endurance exercise can be sustained by a
ketogenic diet. Individuals who are involved in endurance activities can therefore use a ketogenic
diet during their training. It should be recalled from chapter 18 that high-intensity aerobic
exercise above the lactate threshold can not be optimally sustained without carbohydrates. As
well, most individuals find that their overall performance is higher on a carb-based diet.
For optimal endurance performance, some combination of aerobic training below and near
LT as well as high-intensity intervals will be necessary. In general, endurance athletes tend to
emphasize lower-intensity training during the off-season, incorporating more high-intensity
efforts as the racing season draws near. As it is impossible to outline an entire annual plan for
different endurance sports, athletes should keep the following guidelines in mind.
1. A standard ketogenic diet (SKD) can only sustain exercise intensities of 75% maximum heart
rate and below. Endurance athletes in their off-season, performing primarily long duration, lowintensity training may benefit from the SKD.
2. For exercise intensity above 75% of max. (interval training or races), carbs will absolutely be
necessary and the CKD or TKD is suggested. Interval training can be performed during the carbup or the day or two afterwards. The rest of the week’s training sessions can be long-duration
276
endurance training. Pre-workout carbohydrates may substitute for the weekend carb-up if
preferred.
3. Endurance athletes will benefit from heavy weight training and it should be performed 2-3
times per week (full periodization of strength for athletes is beyond the scope of this book). A
sample week of training (assuming a 2 day carb-up) appears in table 6.
Table 6: Sample week of training for and endurance athlete
Mon:
Tue:
Wed:
Thu:
Fri:
Sat:
Sun:
Workout
Weight training
Long slow distance
Off
Long slow distance
Weight training
Off or intervals
Intervals/race
Diet
Lowcarb
Lowcarb
Lowcarb
Lowcarb
Begin carb-up after weight workout
Continue carb-up
Lowcarb*
* For races, it will be necessary to consume pre and during workout carbs depending on the
length of the race. For events less than 90’, pre-workout carbs and water while racing are
sufficient. For events longer than 90’, pre-workout carbs as well as 45-60 grams of carbs/hour
while racing should be consumed. Additionally, 8 oz. of water should be consumed every 15’
during the race to prevent dehydration.
An alternate and probably superior dietary strategy for endurance athletes is to vary the
diet based on performance needs. That is, during off-season training, when primarily low-intensity
aerobic training and some weights are being done, the SKD or CKD can be used. During higher
performance periods (preseason, competitive season), a higher percentage of carbohydrates
should be consumed for optimal performance.
277
Chapter 30:
The pre-contest bodybuilder
Not everyone reading this book is a competitive bodybuilder, nor do they want to be one.
Despite the title of this chapter, the following information applies to anyone trying to get into
their best shape for any special event: family reunion, pool party, best-shape-of-your-life photos,
etc.
The final week of preparation is questionable for individuals who are not competitive
bodybuilders. It involves manipulations of water and electrolytes which are of limited importance
for most dieters. Additionally, manipulating water levels in the body carries some risk and
individuals must make their own choices as to how far they will go to reach a given level of
physical development.
Pre-contest bodybuilders are an entirely different species when it comes to fat loss for a
contest. Their desire to maintain a high level of muscle mass makes dieting more difficult in
terms of their diet and workout schedules. Please note that most of the comments which appear
below apply primarily to natural bodybuilders.
Section 1: Four rules for natural bodybuilders
A huge disservice has been done to natural bodybuilders by training concepts from drugassisted competitors. With anabolic steroids and drugs which increase energy while decreasing
recovery time (such as clenbuterol, thyroid, GH, etc) specifics of the diet and training structure
become less critical. Without these drugs, natural bodybuilders risk losing considerable muscle
preparing for a contest. There are several basic rules that should be followed by natural
bodybuilders to avoid excessive muscle loss during a pre-contest diet.
Rule #1: Don’t get too fat in the off season.
The longer a bodybuilder has to diet, the more they risk risk losing muscle. As a general
guideline, male bodybuilders should go no higher than 10-12% body fat during the off season,
women 13-15%. Keeping bodyfat to these levels accomplishes two things. First, it prevents the
bodybuilder from having to diet for months to get ready. Not only does extended dieting increase
the risk of muscle loss, but many bodybuilders seem to disappear from the gym for a month after
their contest, engaging in a full-blown food binge. The less time a person has to diet, the less likely
they are to blow the diet. Additionally, starting a diet from a low enough bodyfat prevents the
bodybuilder from having to cut calories and/or increase aerobics so drastically that they lose too
much muscle.
To accurately measure body composition, dieters must have their body fat measured
278
regularly, preferably with skin fold calipers. Guidelines for measuring body composition on the
CKD appear below. Using the mirror only works for experienced competitors and it is
recommended that beginning bodybuilders use calipers. The mirror will tell trainees what they
want to see and it’s easy to put the fat blinders on during the off-season when strength and mass
are increasing.
Many lifters underestimate their body fat percentage, thinking they are leaner than they
really are. Despite the problems associated with calipers, they will give accurate measurements
as long as certain guidelines are kept in mind. By charting individual skinfold measurements,
athletes can track the changes occurring, either good or bad, during their diet. A skinfold reading
of 3-4 millimeters indicates maximal leanness. If a bodybuilder allows an individual skinfold to
approach 20 mm during the off season, they will have a problem when it is time to diet.
Rule #2: Do not change training radically before a contest.
A second mistake many bodybuilders make is switching to lighter weights and higher reps
to ‘cut up’ the muscle for a contest, an idea that most likely came from drug-assisted
bodybuilders. With steroids, lowering training weights doesn’t cause muscle loss and higher reps
will burn more calories, causing greater fat loss. For a natural bodybuilder, this will not maintain
muscle mass optimally.
Trainees should not confuse weights with aerobics or vice versa. If a bodybuilder has
acquired a certain level of muscle mass with heavy weights and low repetitions, they should
continue to perform heavy sets (as much as their depleted body will allow) to maintain that
mass. Fat loss will occur as a result of caloric deficit and aerobics. Genetics, as well as the
ability to eliminate subcutaneous water, will determine to a great degree what kind of striations
and cuts a competitor will have on contest day.
Obviously, expecting training weights to remain the same while dieting is a false hope.
However, trainees shouldn’t automatically start lowering their training weights until they
absolutely have to. Rather, trainees should attempt to keep training heavy until the last two
weeks before a contest. However, an extreme drop in training weights, or the number of reps
which can be performed with a given weight, can be indicative of muscle loss. Keeping records of
workouts is encouraged as another method of tracking progress during a diet.
Near the end of the pre-contest phase, many bodybuilders will have to switch to lighter
weights as they become more and more depleted. As body fat levels decrease, the body’s natural
joint lubrication decreases as well and heavy weights can cause injury. However, weights should
not be decreased until absolutely necessary to avoid muscle loss.
Rule #3: Start the diet early enough.
In addition to underestimating body fat levels, many bodybuilders start their diets too late
giving themselves 8 weeks or less to get into contest-ready shape. Getting into contest shape 2
weeks early is preferable to getting into contest shape 2 weeks late.
Assuming a starting body fat of 10-12% for men (13-15% for women), beginning contest
279
preparation 10-12 weeks before a contest should be sufficient for most bodybuilders. If an
individual knows that their body is slow to drop body fat, they may start their diet 16 weeks prior
to a contest. If a trainee is unsure of how quickly they will drop fat (i.e. preparing for their first
contest), they should start earlier rather than later. Starting early has an additional benefit: it
allows the possibility of taking a week off of the diet. This strategy, along with others to break fat
loss plateaus, is discussed in chapter 13.
Rule #4: Know pre-diet calorie levels
This gives trainees a starting point to set calories for their diet. For those who do not know
their pre-diet calorie intake, 15 cal/lb should be used as a starting point. Adjustments can be
made based on changes in body composition. If a bodybuilder is already adapted to a CKD, they
should start by reducing caloric intake by 250-500 calories per day. This should yield a fat loss of
.5-1lb fat per week with no muscle loss as long as protein intake is sufficient. Based on changes
in body composition, caloric intake should be adjusted. Additionally, changes can be made in
terms of the quality and length of the carb-load.
If fat loss is less than .5 lbs, calories may be reduced an additional 250 per day. If fat loss
is greater than 2 lbs (very rare), calories should be increased by 250-500 per lowcarb day.
Remember that, in general, alterations in caloric intake will be made by manipulating fat intake,
as protein should remain constant throughout the diet.
Calories and aerobics
A mistake many bodybuilders make, which is generally related to starting their diet too
late and at too high a body fat level, is to excessively cut calories and add hours of aerobics every
day in an attempt to ‘catch up’ in their contest preparation. Even though this increases fat loss,
it also causes muscle loss.
With good preparation, and by starting a diet early enough, a bodybuilder shouldn’t have to
lose much muscle dieting down. It is not unheard of for competitors to gain a pound or two of lean
body mass using the CKD while dieting. However, it should not be expected.
One easy modification to the pre-contest diet is during the carb-up. Controlling fat intake
and shortening the carb-up to 30 hours or less (from Friday evening to Saturday bedtime) can
help to maintain fat loss. See chapter 13 for more details on overcoming fat loss plateaus.
Section 2: Aerobics and the pre-contest bodybuilder
Aerobic exercise should not be necessary early in the contest diet except on Sunday after
the carb-up to help reestablish ketosis. Reducing calories to maintenance levels or a slight deficit
coupled with weight training should be sufficient to cause fat loss in the early stages of the diet.
280
Using the ephedrine, caffeine and aspirin (ECA) stack can help to kick-start fat loss as well as
blunting hunger. However, some bodybuilders prefer to save the ECA stack for later when fat
loss slows, relying on diet and training alone in the initial stages of the diet.
In general, bodybuilders are better off using only weight training plus caloric restriction
until fat loss slows. The cardio done on Sunday to reestablish ketosis plus the cardio done as a
warm-up and cool-down from training should be sufficient at the beginning of the diet.
Only when fat loss slows should small amounts of aerobic exercise be added. A maximum
of four to five sessions of 20 to 40’ is about the most a natural bodybuilder should perform
although this will vary with the individual. Assuming that a bodybuilder has followed the rules
presented above, much more than this should not be needed.
Contrary to recommendations for non-bodybuilders, intensity should be kept low. At
higher aerobic intensities, fast twitch muscle fibers are recruited. Coupled with high-intensity
weight training and no carbs, a high aerobic intensity increases the risk of overtraining and
muscle loss. An intensity of 60% of maximum heart rate (or about 15 beats below lactate
threshold) is the highest intensity any pre-contest bodybuilder should use. In practice, this
means walking on an inclined treadmill, riding the bike, or doing the Stairmaster at low
intensities. Interval training is one option that some individuals have found works well but
intervals should be eliminated at the first signs of muscle loss or overtraining.
The only exception is the one hour of low-intensity aerobics after the carb-up. The purpose
of this workout is to deplete liver glycogen and establish ketosis as quickly as possible and should
be done from the beginning of the contest diet. Ideally, this workout should be done before
breakfast on Sunday to ensure depletion of any remaining liver glycogen.
Bodybuilders have typically performed their aerobic training at one of two times: first thing
in the morning on an empty stomach, or immediately after training. The rationale for this was
that the lowered blood glucose and insulin would allow for better FFA utilization. Whether this
strategy will have a benefit on a ketogenic diet is unclear. The nature of the ketogenic diet is that
the body is relying on fat for fuel all day so it shouldn’t make a difference whether cardio is
performed prior to eating or not. However, morning cardio is a tried and true method for precontest fat loss, and may be a strategy worth trying, especially coupled with the herbal
supplement yohimbe (see chapter 31). In theory, performing aerobics on an empty stomach first
thing in the morning will maximize utilization of body fat, rather than using dietary fat.
Section 3: Measuring body composition
If possible, pre-contest bodybuilders should have body composition measured weekly so
that adjustments can be made to the diet. Keep in mind that the prediction equations become
less accurate as lower body fat percentages are reached. Pre-contest bodybuilders should pay
more attention to total skin folds and overall appearance than trying to achieve an arbitrary
body fat percentage. Ultimately, the judges are not judging skin fold measurements. If dropping
another few millimeters of skinfolds results in the loss of several pounds of muscle, overall
281
appearance will suffer. Guidelines for the pre-contest bodybuilder to track body composition
changes appear below:
1. Weigh and take skin folds the morning of the last low-carbohydrate day of the week. This is
when a bodybuilder should be their leanest and is most representative of overall body fat levels
and appearance.
2. Weight should be taken again at the end of the carb-loading phase. This tells how much weight
needs to be lost during the next low-carb cycle for fat loss to occur. If body weight increases 7
pounds from Friday morning (pre-carbup) to Sunday morning (after carbing has ended), body
weight will have to drop more than 7 lbs by the following Friday for fat loss to have occurred
(assuming similar levels of hydration, etc). Skin folds taken after the carb-up will tend to overestimate true body fat due to an increase in water underneath the skin.
3. Finally, pre-contest bodybuilders should keep visual tabs on how long after the carb-load they
look their absolute best. There will be some time point when the water underneath the skin has
been lost but muscles are still full from the increased glycogen storage. This will help to plan the
week immediately before the contest. For example, if a bodybuilder’s physique is at its best 36
hours after ending the carb-up, this will be used to adjust the timing of the carb-up for the
contest. The specifics of the pre-contest week are described below.
Section 4: Other Issues
Many competitors begin having muscle cramps as they reach excessively low body fat
levels although the reason for this is unknown. Ensuring adequate calcium (up to 1200 mg/day),
potassium (up to 1000 mg/day) and magnesium (up to 1000 mg/day) can help. All should be
taken in divided doses with food to avoid stomach upset.
Also, some competitors suffer from insomnia late in their contest preparation. Various
herbal sleep aids, such as Valerian root or melatonin, may be of help. Finally, female competitors
may stop menstruating as their body fat reaches low levels. While the fat intake of the CKD
seems to prevent this, supplementing with DHEA (25-50 mg/day max. for women) may help.
One advantage of the CKD is that it allows bodybuilders to practice the carb-up each
week. Judging by their appearance each week, competitors can determine what food choices and
timing works for them. If a bodybuilder has determined that they can only handle 30 hours of
carbing and it takes them 3 days to drop the water, adjust the following schedule accordingly.
Ideally, bodybuilders should record how their body responds to different types of carb-loads and at
what time of the week they look their best.
Section 5: The pre-contest diet
Having discussed a variety of topics which pertain to the pre-contest diet, we can set up
the details of the diet. During the first 2 weeks of a pre-contest diet, the only aerobics performed
282
will be on Sunday, the day after the carb-up. This helps establish ketosis quickly without
negatively affecting the Monday and Tuesday workouts. After the second week of the diet,
aerobics can be gradually added as necessary. Although a maximum of forty minutes, four to five
times a week is allowed, bodybuilders should gradually build up to this level to avoid putting too
much stress on the body. Bodybuilders should begin with twenty minutes of aerobics done three
times per week and increase each session by five to ten minutes per week and add sessions as
necessary. A sample weekly schedule appears in table 1.
Table 1: Sample weekly schedule for a pre-contest diet
Day
Sun:
Mon/Tue:
Wed/Thu:
Fri evening:
Sat:
Sun:
Workout
30-60 minutes of low intensity aerobics
first thing in the morning
2 day split of preferred training regime.
*
Full body workout and then begin the carb-up.
No workout while carbing.
Repeat cycle
* Wednesday and Thursday should be used for aerobic workouts. Alternately, calories may be
reduced an additional 10%.
Section 5: The Final 2 weeks before the contest
The final two weeks prior to a bodybuilding contest differ from the rest of the pre-contest
diet. Table 2 provides a fairly generic schedule for the two weeks before the contest.
Unfortunately it is impossible to say what will work ideally for every competitor. Novice
bodybuilders should not be surprised if they don’t come in perfectly at their first contest. With
practice and repetition, they can determine what type of contest carb-up schedule works best.
Table 2: Overview of the 2 weeks leading up to the contest
Day
Mon
Tue
Wed
Thu
Fri
Sat
Sun
Mon
Tue
Wed
Thu
Training
Normal Mon training
Normal Tue training
cardio optional
cardio optional
Last heavy day of training
Cardio optional
Cardio optional
Cardio optional
Depletion workout in morning
None
Posing/none
Fri
Sat
Sun
Posing
None
None
283
Diet
Lowcarb
Lowcarb
Lowcarb
Lowcarb
Lowcarb
Lowcarb
Lowcarb
Lowcarb
Start carb-up
2nd day of carb-up
Continue carb-up
if necessary
See below
See below
Go eat
Water Intake
Normal
Normal
Normal
Normal
Normal
Normal
Normal
Normal
High
High
1/2 of Wed
1/2 of Thu
As needed
• Monday/Tuesday: Monday and Tuesday are normal training and diet days. As always, prebreakfast aerobics is optional, but will negatively affect the workouts.
• Wednesday/Thursday: Aerobics optional or debit calories an additional 10%
• Friday: last heavy training day, full body, no carb-up
The body needs at least a week (legs may require more) to recover and rebuild completely
so this should be the last heavy training day. Lifters should do the full-body tension workout from
chapter 29. Pre-workout carbs are optional, but bodybuilders should return to low-carb
afterwards taking in only protein with the supplements of choice immediately after training.
Aerobics are optional after training.
• Saturday: aerobics optional, low carb
Under ideal circumstances, bodybuilders should be nearly ready for the contest by this
point. If they still have fat to lose, aerobics first thing in the morning may help but it is a mistake
to panic and do 3 hours of aerobics today. If a bodybuilder comes into their first contest too fat,
they will know to start their contest prep earlier next time.
If appearance is fine, calories should be increased back to maintenance levels (13-15 cal/b)
while remaining on the ketogenic diet. No workout today except to practice posing. Most
competitors begin to practice posing several weeks out from their contest and it should not be
inferred that this is the first day you should practice. Water intake should remain high.
• Sunday: aerobics optional, low carb
Same as Saturday, aerobics and calorie restriction are both optional. Otherwise, eat at
maintenance and take the day off except for posing. Water intake is still high.
• Monday: no training, low carb
Regardless of appearance, no training should be done and calories should be set at
maintenance using the ketogenic diet. Again, continue to practice posing. Water intake is still
high.
• Tuesday: The final depletion workout, begin carb-up
Begin the final carb-up for the contest. Early afternoon or evening is the time for a true
depletion workout. Even if a bodybuilder has been using a tension workout up until this point,
they must do a true depletion workout (meaning high reps, not to failure) to maximize glycogen
depletion and supercompensation. Glycogen should be very low from the previous week’s
workouts, minimizing the number of circuits needed.
Approximately 5 hours prior to the depletion workout, 25-50 grams of carbohydrate with
some protein should be consumed as discussed in chapter 12. About 1-2 hours before the final
depletion workout, 50 grams of carbohydrates, including some fructose, with some protein should
be consumed. The goal of this workout is to completely deplete glycogen and circuits should be
284
performed until strength starts to drop. This indicates that glycogen is being fully depleted.
Since glycogen levels should be low from the previous 10 days of lowcarb dieting, only three
to six sets per bodypart should be needed. Each set should be roughly 50% of 1 rep max. Sets
should be 10-20 quick reps (about 1 second up, 1 second down) stopped several reps short of
failure. Many athletes prefer to use machines for this workout for safety reasons (i.e. low body
fat and general depletion/fatigue). Use a variety of movements (see chapter 28 for sample
circuits) to hit all available muscle fibers. Don’t forget often neglected body parts like forearms,
traps, rear delts, etc.
Immediately after this workout, the final carb-up must begin. A liquid carb drink with 1.5
grams of carbs/kg lean body mass, 25-50 grams of protein and any supplements of choice (i.e.
creatine, glutamine) should be consumed immediately after this workout and again 2 hours later
to maximize glycogen storage. After that, bodybuilders should move to the normal carb-up and
supplement schedule, consuming ~50 grams of carbs every 2 hours or so, for a total of 10 grams
of carbs/kg of lean body mass (see chapter 12 for details).
Assuming that a bodybuilder has been on the CKD for a sufficient amount of time, they
should have a pretty good idea how their body responds to carb-ups since they have practiced it
every week. If they know that they do better with high GI carbs, those should be used. If they
have found that anything but starches makes them bloat, go with what works. Now is not the
time to experiment with anything new.
Water intake should be kept high to maximize muscle fullness and this is not the time to
start experimenting with sodium and potassium levels. Optimal glycogen transport across the
intestinal wall requires adequate sodium so reducing sodium intake will slow the carb-up.
• Wednesday: Continue carb-up
Into the second day of carbing, fats should be kept to 15% of total calories, primarily as
essential fatty acids, and carbs should be limited to 5 g/kg lean body mass. Switching to starches
and vegetables should ensure no fat spill over and chromium (up to 800 mcg per day), vanadyl
sulfate (up to 120 mg per day), magnesium (at least 300 mg per day), alpha lipoic acid (600-2000
mg), and Citrimax (750 mg taken three times at least thirty minutes before meals) may be used.
Some bodybuilders will start retaining water at this point but water intake should be kept high to
avoid increasing the body’s level of aldosterone, the hormone which causes water retention.
• Thursday: continue carb-up as necessary
Many athletes don’t eat enough during carb-ups, whether from fullness or fear of gaining
fat. This day is for those athletes. If a bodybuilder doesn’t appear fully carbed after two days of
carbing-up, they can continue to consume small amounts of carbs (mainly vegetables with some
low GI starches) during the day with protein and some fat. Water intake should be curtailed
somewhat, cutting back to half of what they’ve been drinking in the previous days. It’s probably
best to switch to distilled water so that mineral intake (notably sodium, potassium and calcium)
can be monitored.
If a bodybuilder is fully carbed up by Thursday, they should switch back to ketogenic
eating with small amounts of vegetables (30 grams of carbs maximum) throughout the day. This
285
will allow the loss of any water being held beneath the skin.
• Friday: The day before the contest
Regardless of appearance, the ketogenic diet should be resumed on on Friday. Consume
small amounts of carbs throughout the day (5-10 grams per meal, vegetables only) to keep blood
glucose steady and muscle glycogen topped off. Calories should be set to maintenance or slightly
(10%) below.
While the simple act of restricting carbohydrates will have a diuretic effect, most
bodybuilders will need to take a herbal diuretic approximately 24 hours before prejudging.
Although the use of prescription diuretics (i.e. Lasix, Aldactone, Aldactazide, etc) is banned
because of the danger of severe dehydration and death, the diuresis caused by the herbal
products is relatively minor but will improve appearance. Many health food stores stock various
types of herbal diuretic which typically contain ingredients such as buchu leaves, dandelion, uva
ursi, etc. Additionally, the simple restriction of carbohydrates has a diuretic effect. Some
bodybuilders have used glycerol to pull water from underneath their skin as well.
While sodium loading is not recommended, sodium intake should be monitored from Friday
through the evening show. While a bodybuilder need not avoid all sources of sodium, an effort
should be made to consume very small amounts, approximately 1000 mg/day total. This means
that the sodium content of foods will have to be checked. Additionally, three times as much
potassium (i.e. 3000 mg) should be consumed in divided doses.
Friday night, competitors should consume a moderate carb meal (about 50 grams or so)
with some protein (20-30 grams) and a small amount of healthy fats (i.e. olive oil). This last carb
meal helps ensure normal blood glucose and liver glycogen, to improve vascularity at prejudging.
Many competitors who skip this meal find that they aren’t vascular until the evening show. By
then it’s too late.
Finally, an effort should be made to consume easily digested meals from this point on so
that the stomach doesn’t protrude from undigested food. Some competitors will use laxatives to
help tighten the waist. Many herbal diuretics contain a light laxative, such as cascara sagrada,
in them already.
• Saturday: prejudging
If a bodybuilder is still holding water the morning of the show, they will need to find a sauna
to sweat out the last little bit of water from underneath the skin. There are no hard and fast
rules for how long to stay in the sauna. Simply use appearance as a guide.
Breakfast should be a small meal containing easily digested carbs to keep blood glucose
and liver glycogen normal. Prior experience will help determine the ideal time prior to prejudging
to eat breakfast. Failing that, since most contests have pre-judging around 9 or 10 in the
morning, a breakfast at 6 or 7 am should be sufficient.
Approximately an hour or so before prejudging, consume 25-50 grams of easily digested
carbs similar to what is consumed before the Friday depletion workout. About 20-30’ before
prejudging, competitors should begin their pump-up routine to maximize vascularity. In general,
pumping the legs seems to detract, rather than enhance vascularity.
286
• Saturday: Prejudging and the evening show
Between prejudging and the evening show is a nebulous area. Many people involved in
bodybuilding feel that the competitors are placed at prejudging but occasionally an individual will
move up at the evening show if they really tighten up or if another competitor really falls apart
appearance wise.
It’s probably best to continue eating small, easily digested meals with some carbs during
this time period and many competitors use sodium-free carbohydrate drinks. Large meals should
be avoided as this may cause the stomach to distend. The competitor wants just enough carbs to
maintain fullness and vascularity.
Prior to the evening show, consume 25-50 grams of carbs about an hour out and then
pumping up about 20-30’ out. After the evening show, the competitor can finally go eat a real
meal.
Section 6: A final comment
Don’t panic. Many (probably most) competitors, even if they have done many contests,
tend to panic right before their show. Regardless of their adherence to the diet plan or whether or
not they are on schedule, bodybuilders tend to get a little crazy in those last few days, questioning
whether they are truly ready or not. They may try untested methods, or do an extra three hours
of cardio or a last workout before their contest. Invariably, they sabotage themselves and end up
looking worse on stage than if they had left well enough alone.
If a competitor has not shown a given technique (such as sodium loading or glycerol) to
work for them, they should not experiment in the few days before the show. Ideally novice
bodybuilders should find an objective coach who will keep them on track and prevent them from
panicking at the last minute. By the same token, a good coach can give a bodybuilder feedback
on their condition and whether or not they should make changes to their pre-contest preparation.
In contrast, listening to gym buddies can be a disaster. For fear of hurting a competitor’s ego,
many people will not tell them how they truly look. Rather they’ll tell a competitor “You’re looking
ripped” rather than tell them that they are not going to be lean enough for the contest.
287
Part VIII:
Supplements
Chapter 31: General health
Chapter 32: Fat loss
Chapter 33: The carb-load
Chapter 34: Muscle/strength gain
With the exception of a basic vitamin/mineral supplement and calcium, there are no
supplements which are required for a ketogenic diet. However there are additional supplements
which may be helpful for a variety of goals while on a ketogenic diet. They are discussed in the
following chapters.
Supplements should be chosen for specific goals, whether those goals are fat loss,
muscle/strength gain, or improved endurance. A comprehensive guide to all available
supplements would require an entire book. This chapter will only deal with those supplements
which are specifically useful to the ketogenic diet, or which have an impact on ketosis that
ketogenic dieters should be aware of. There is a great deal of individual response to the different
supplements available. For this reason, it is recommended that supplements be added one at a
time so that the effects can be noted.
288
Chapter 31: Supplements for
the ketogenic diet
There are a number of supplements which can be useful on a ketogenic diet, depending on
the goal of the dieter. This chapter discusses general supplements such as a basic multivitamin/mineral, anti-oxidants, fiber supplements, and fatty acid supplements.
Basic multi-vitamin/mineral
Any calorically restricted diet may not provide for all nutritional requirements and the
limited number of food available on a ketogenic diet may cause deficiencies as discussed in
chapter 7 (1).
At the very least, individuals on a ketogenic diet should take some form of sugar free
vitamin and mineral supplement to ensure nutritional adequacy. Additionally, supplemental
sodium, magnesium and potassium may be necessary, as detailed in chapter 7. Depending on
dairy intake, a calcium supplement may also be necessary.
As a general rule, there is little difference between the vitamins sold in health food stores
and those sold in the grocery store. Obviously if individuals wish to take higher doses of any given
nutrient, a more expensive vitamin/mineral formulation is necessary.
Anti-oxidants
A great deal of recent research is currently focusing on the benefit of various anti-oxidant
nutrients such as vitamin C, vitamin E and beta-carotene (2,3). These substances, as well as
many others, may help to prevent tissue damage from substances called ‘free radicals’. Free
radicals are thought to damage cells causing the accumulation of toxic chemicals. Individuals
involved in intense exercise appear to generate an excess of free radicals so supplementation
may be indicated (4). Additionally, the few carbohydrates which are consumed on a ketogenic diet
should come from a variety of vegetable sources whenever possible. Individuals on a CKD should
try to consume vegetables during the carb-loading period. Dosing of anti-oxidant nutrients is
highly individual and readers are encouraged to review one of the many books available on this
subject.
Fiber supplements
As discussed in chapter 7, a common side effect of ketogenic diets is a decrease in bowel
movements. At least part of this is caused by the general lack of fiber in the ketogenic diet. For
this reason, a sugar-free fiber supplement may be useful to maintain regularity. Additionally,
289
the inclusion of high fiber vegetables, such as a large salad, can help with regularity in addition to
the nutrients they provide.
Essential fatty acids (EFAs)
As stated in chapter 9, EFAs are a special class of fatty acids which cannot be
synthesized in the human body and must be obtained from the diet. The two EFAs are linoleic
acid (LA) and alpha-linolenic acid (ALA). Both LA and ALA are found only in foods of plant origin
such as nuts, seeds, and some vegetables. Since a great deal of the fat intake on an average SKD
is from animal sources, a source of EFAs is needed.
One possible source is through supplementation. EFAs are found in varying degrees in
most vegetable oils. In general, LA is more abundant than ALA as it occurs in a wide variety of
vegetable oils. ALA occurs in high amounts in flax and pumpkin seeds oil as well as in soybean
oil. Many individuals have also used flax seeds or flax meal as a source of both EFAs and fiber. It
is difficult to determine EFA requirements for all individuals but many ketogenic dieters seem to
do well consuming 1-3 TBSP of a concentrated EFA source, such as flax oil, per day.
Omega-3 and omega-6 fatty acids
Another class of fats which may have health benefits are the omega-3 and omega-6 fatty
acids, also known as docosahexanoic acid (DHA) and eicosapentanoic acid (EPA) (5,6,7). Both
occur naturally in fatty fish such as salmon, sardines, mackerel, and trout. and may provide
cardioprotective effects. Since fatty fish can easily be consumed on a ketogenic diet,
supplementation of these oils is probably unnecessary.
Olive oil
Although not an essential fatty acid, oleic acid, which is found in high concentrations in
olive oil has been shown to have additional health effects, especially in terms of blood lipid levels.
Studies have shown that consumption of oleic acid lowers blood cholesterol (8). Therefore,
substituting olive oil for some of the saturated fats normally consumed on a ketogenic diet may
be useful for those individuals who show a negative blood cholesterol response.
References cited
1. Stock A and Yudkin J. Nutrient intake of subjects on low carbohydrate diet used in treatment
of obesity. Am J Clin Nutr (1970) 23: 948-952.
2. Diplock AT. Antioxidant nutrients and disease prevention: An overview. Am J Clin Nutr (1991)
53: 189s-193s.
3. Rock CL et. al. Update on the biological characteristics of the antioxidant micronutrients:
290
vitamin C, vitamin E and the carotenoids. J Am Diet Assoc (1996) 96: 693-702.
4. Dekkers JC et. al. “The role of antioxidant vitamins and enzymes in the prevention of exerciseinduced muscle damage. Sports Med (1996) 21: 213-238.
5. Phillipson BE et. al. Reduction of plasma lipids, lipoproteins, and apoproteins by dietary fish
oils in patients with hypertriglyceridemia. N Engl J Med (1985) 12: 1210-1216.
6. Herold PM et. al. Fish oil consumption and decreased risk of cardiovascular disease: A
comparison of findings from animal and human feeding trials. Am J Clin Nutr (1986)
43: 566-598.
7. Leaf A and Weber PC. Cardiovascular effects of n-3 fatty acids. N Engl J Med (1988)
318: 549-557.
8. Mattson FH et al. Comparison of effects of dietary saturated, monounsaturated, and
polyunsaturated fatty acids on plasma lipids and lipoproteins in man. J Lipid Res. (1985)
26:194-202.
291
Chapter 32: Fat loss aids
Although there is no magic pill which can cause fat loss without effort, there are
supplements which can be combined with dietary changes and exercise to hasten fat loss and/or
limit muscle loss. These types of supplements work through a variety of mechanisms including
increasing caloric expenditure, preventing a drop in metabolic rate, decreasing the amount of lean
body mass lost while dieting and decreasing hunger when calories are being restricted. Fat loss
aids can generally be grouped into three categories: thermogenic agents, appetite suppressants,
and ‘fat burners’.
Section 1: Thermogenesis and adrenoreceptors
Thermogenesis refers generally to the burning of calories to generate heat which is then
dissipated by the body. There are numerous types of thermogenesis including exercise-induced
thermogenesis and dietary-induced thermogenesis. All forms ultimately cause the body to burn
fuel to produce energy and heat.
To understand the mechanism by which thermogenic agents work, it is necessary to
discuss some of the underlying physiology. This includes a brief discussion of adrenaline and
noradrenaline as well as adrenoreceptors.
The catecholamines: adrenaline and noradrenaline
In response to stress, the body releases two hormones known generally as catecholamines.
They are adrenaline (or epinephrine) and noradrenaline (or norepinephrine). Adrenaline is
released from the adrenal glands and travels through the bloodstream to its target tissues while
noradrenaline is released only from the nerve endings to act on its target tissues (1). Both work
by binding to structures on the cell membrane called adrenoreceptors.
Adrenoreceptors
Generally termed, an adrenoreceptor is a specific receptor on a cell which binds to either
adrenaline or noradrenaline (1). When binding occurs, the adrenoreceptor sends a signal into the
cell causing several reactions to occur. There are two major types of adrenoreceptors: betareceptors and alpha-receptors. As well, there are several subtypes of each receptor. They are
discussed briefly below.
There are three primary types of beta receptors known as beta-1, beta-2, and beta-3. B-1
receptors are found primarily in the heart and increase heart rate and blood pressure when
stimulated. B-2 receptors are found primarily on fat and muscle cells and cause the body to
292
mobilize free fatty acids (FFA) for burning when activated. Additionally, the stimulation of B-2
receptors seem to help prevent muscle wasting during dieting. B-3 receptors are found primarily
in brown adipose tissue (BAT, see below for details) and are also involved in calorie burning.
Overall, the activation of beta-receptors tends to accelerate certain processes in the body
including heart rate, blood pressure, calorie burning, heat generation and fat breakdown (1). In a
sense they can be thought of as ‘accelerators’ similar to the one in a car. Therefore, substances
which stimulate beta-receptors will increase these processes. Although there are numerous
beta-agonists, the most commonly known one is ephedrine, which is discussed shortly.
There are two types of alpha receptors: alpha-1 and alpha-2. A-1 receptors are found
primarily in the heart while a-2 receptors occur primarily in fat cells. When stimulated, A-2
receptors inhibit FFA mobilization (2,3) making them a ‘bad’ receptor from a fat loss point of
view. Additionally, research has found that body fat in women’s legs and buttocks has a
preponderance of a-2 receptors compared to b-2 receptors (4-6). It is not uncommon to see
women whose upper body is very lean, but whose lower body still appears fat. This may be
partially explained by differences in receptor density.
Overall, the activation of alpha receptors tends to slow certain processes in the body
including heart rate, blood pressure, calorie burning and fat breakdown. In a sense they can be
thought of as ‘brakes’ similar to those in a car. Since alpha receptors inhibit fat mobilization, a
substance which inhibits these receptors will increase fat mobilization (2). By inhibiting the
inhibitors, the overall response is an increase. The primary substance which can be used to
inhibit alpha-receptors is an herb called yohimbe, discussed below.
Brown adipose tissue (BAT) and white adipose tissue (WAT)
There are two different types of adipose tissue in the body. White adipose tissue (WAT) is
the primary storage site for bodyfat, containing mostly stored triglycerides, some water, and a
few mitochondria (which are used to burn fat for energy). In contrast, brown adipose tissue
(BAT) contains little triglyceride but relatively more mitochondria (7). This makes BAT a type of
fat which burns FFA generating heat in the process.
Initially, humans were not thought to have much BAT but recent research documents its
existence, primarily in the back of the neck and between the ribs (7). Some research has
suggested that BAT, like any other tissue, can grow larger if chronically stimulated by such
things as ephedrine, cold, etc (8). An increase in BAT would increase the thermogenic response
(amount of calories burned) to those same stimuli.
Section 2: Ephedrine and related compounds
Probably the most common, and perhaps the most effective, fat loss compound currently
available over the counter is ephedrine, also known by its herbal name MaHuang. Ephedrine is
sold as asthma medication and is known as a non-specific beta-agonist, meaning that it
stimulates the all of the beta-receptors to one degree or another.
293
Ephedrine may work through both direct and indirect methods. Directly it can attach to
beta receptors itself. However at the concentration seen with therapeutic doses, ephedrine does
not appear to bind well to beta-receptors (8). Indirectly ephedrine causes a release in the body of
adrenaline and noradrenaline both of which have potent effects at both beta and alpha receptors
in the body (8). It seems that most of ephedrine’s thermogenic effect is through the indirect
mechanism of adrenaline and noradrenaline release, rather than through direct binding to fat cell
adrenoreceptors (8).
There have been numerous research studies done on ephedrine as an adjunct to low calorie
diets for the treatment of obesity (9,10). Through this research, it was found that the
combination of ephedrine and caffeine gave better results than ephedrine alone (8,9). One study
suggests that the combination of ephedrine and caffeine is more effective than the appetite
suppressant dexfenfluramine (11). Some research suggests that adding aspirin to the
combination of ephedrine and caffeine may provide even greater results (8,12,13). Side effects
from ephedrine include jitters, hand tremor, increased heart rate/blood pressure, and insomnia (9,.
In general, the side effects from ephedrine use typically go away in several weeks (9), while
the thermogenic effects may increase with time (8,10). Thus, unlike most diet compounds which
have a positive tolerance curve, meaning that dieters must take more to get the same effect,
ephedrine appears to have a negative tolerance curve, meaning that the same amount gives a
greater effect. Additionally, the addition of ephedrine to a calorically restricted diet appears to
prevent some of the muscle loss which would otherwise occur.
Caffeine
When ephedrine increases thermogenesis in the body, the body attempts to return itself to
homeostasis through various mechanisms. One is to increase activity of an enzyme called
phosphodiesterase (PDE). When noradrenaline attaches to the beta receptors, it causes an
increase in a substance called cAMP which is involved in regulating fat burning. The body raises
levels of PDE to inhibit the cAMP from doing its job (8,15). Caffeine indirectly blocks PDE by
attaching to adenosine receptors on the cell, preventing the decrease in cAMP levels (8). Thus,
caffeine inhibits the enzyme which inhibits fat burning. The net result is an increase in use of fat
for fuel.
Dieters who do not wish to use ephedrine, or cannot tolerate its effect, may still derive
some benefit from caffeine taken by itself as this increases thermogenesis and enhances fat
utilization (16,17). Consuming caffeine prior to exercise increases the use of FFA for fuel and
may be useful for fat loss (18). In fact, this occurs to a greater degree when carbohydrates are
restricted (18).
Aspirin
Another mechanism the body uses to reduce the increase in metabolic rate is through the
release of prostaglandins, specifically the PGE2 type, which accelerates the breakdown of
noradrenaline (15). Aspirin generally inhibits prostaglandin release further potentiating the
294
effects of ephedrine (8). The effects of aspirin on ephedrine appears to occur primarily in obese,
but not lean individuals (12,13).
The combination of ephedrine, caffeine and aspirin has become known as the ECA stack in
sports nutrition. It can be consumed in synthetic form or by taking the herbal equivalents of
MaHuang (herbal ephedrine), kola nut or guarana (herbal caffeine), and white willow bark (a
herbal form of aspirin). At least one popular author feels that white willow bark is not a suitable
substitute for aspirin (19).
Important note on the ECA stack
The ECA stack is a potent stimulant for the central nervous system (CNS) making it a
potentially dangerous compound, especially if used indiscriminately. There are an increasing
number of individuals reporting negative responses to ephedrine, and a handful of deaths have
been attributed to the combination of ECA. While details of all of these negative reactions are
not available, there is an increasing use of herbal ephedrine (MaHuang) in a variety of nutritional
supplements. The risk of overdose, especially in herbal products which are not standardized, is a
possibility. In general, the studies show good tolerance among subjects taking the ECA stack at
the recommended dose (11,14,20).
Under no circumstances should the recommended dose of ECA be exceeded. Any negative
reactions beyond the normal stimulant effect indicates that the ECA stack should not be taken.
Additionally, as a potent CNS stimulant, individuals with any type of preexisting heart condition
should not use this combination of compounds. Also, individuals with thyroid or prostate
problems should not use ECA. Individuals taking monoamine oxidase inhibitors (MAOI) should
not use ECA.
Dosing and the ECA stack
Most of the available research points to the following combination of doses as optimal for
the ECA stack (9,12-14,20,21):
ephedrine: 20 milligrams
caffeine: 200 milligrams (the amount of caffeine should be 10 times the amount of ephedrine)
aspirin: 80-325 milligrams
There is some debate over the amount of aspirin necessary to potentiate the effects of
caffeine and ephedrine. While 300 mg has been used in research (13,14), this much aspirin three
times daily can have potentially negative effects on the gastrointestinal tract, and can not be
recommended. Some popular authors have suggested as little as 80 milligrams for positive
effects (19).
This ECA stack is typically taken three times daily, with one dose in the morning, a second
dose four to five hours later, and a third dose taken in the afternoon no later than 4 pm (to avoid
problems with insomnia). Individuals who are sensitive to the side effects of ECA should begin
295
with one dose in the morning for several days, adding a second dose as tolerance increases, and
finally the third dose. Some authors suggest a 5 day on, 2 days off dosing pattern although no
research exists to support this recommendation (19). Individuals on a CKD may wish to
discontinue ephedrine during the carb-up.
Other compounds to enhance the ECA stack
The ECA stack can be potentiated by at least one other compound: the amino acid Ltyrosine. This may allow less ephedrine to be taken, further minimizing side effects, while
maintaining the thermogenic effects. Although the addition of yohimbe to the ECA stack has
been suggested, the potential for a negative reaction (discussed below) from this combination
contraindicates using them together.
L-tyrosine
L-tyrosine is an amino acid used in the synthesis of adrenaline and noradrenaline.
Additionally L-tyrosine is important for synthesis of the thyroid hormones (1). In theory, adding
it in supplemental form could further improve the thermogenic effect of the ECA stack. In
animal models, injection of ephedrine and L-tyrosine improves the thermogenic effect over
ephedrine alone but it remains to be seen if the same synergistic effect will be seen in humans
(22). Anecdotally most individuals report a greater ‘kick’ from the ECA stack when L-tyrosine is
added. The typical dose of L-tyrosine is 500-1000 milligrams taken with the ECA stack.
Section 3: Yohimbe
As discussed in section 1, one approach to fat loss is to block the alpha-adrenoreceptors,
specifically the alpha-2 adrenoreceptors (2). The herb yohimbe may act in this fashion, giving it
a potential role in aiding fat loss (2). Like ephedrine, yohimbe may work through both direct and
indirect methods. Directly, it may inhibit the effects of alpha-2 receptors, enhancing fat loss.
Indirectly, it may stimulate the release of noradrenaline from nerve endings, stimulating fat
breakdown (23-25). It appears that, at the doses seen in humans, most of the effects of
yohimbine are through the indirect mechanism of increased adrenaline release, rather than by
direct binding to alpha-2 receptors (23-25).
Yohimbe by itself
The primary use of yohimbe for fat loss has been in women although some men have
reported good results. Since the combination of yohimbe with ECA cannot be recommended
because of the potential for side effects, the use of yohimbe by itself is discussed here.
As mentioned above, yohimbe blocks alpha-2 receptors with the ultimate result of
296
increased fat breakdown and dosing yohimbe has been shown to increase fat loss on a diet (2427). Since the presence of insulin blocks the effects of yohimbe, it cannot be taken with or around
carbohydrate containing meals. Additionally, the consumption of yohimbine with food increases
the insulin response over what would normally be seen (23). This suggests that the best time to
take yohimbe (along with caffeine to increase fat breakdown) would after an overnight fast, first
thing in the morning, prior to aerobic exercise (23). In addition, the combination of yohimbine and
exercise leads to increased energy expenditure compared to aerobic exercise done alone (25,26).
However, this also causes an increased heart rate response to exercise.
By exercising prior to eating any food, the body should draw on bodyfat stores for fuel and
the yohimbe and caffeine should increase FFA release from stubborn fat depots. Anecdotally,
this strategy seems to help with the loss of hard to remove fat deposits, such as women’s hips
and the abdominals in men.
If individuals choose to use yohimbe in this fashion, and also wish to use ECA during their
diet, there are two options. The first is to alternate days, using yohimbe on one day, and ECA the
next. An alternate approach is to use yohimbe first thing in the morning prior to aerobic exercise,
and then use the ECA stack later in the day (with the first dose approximately four to five hours
after the yohimbe has been taken, to avoid potential interactions). Once again, individuals should
monitor their heart rate and blood pressure responses to avoid negative reactions. If an
individual is sensitive to yohimbe, its use should be discontinued.
Dosing of yohimbe
The optimal dose of yohimbe is thought to be 0.2 milligrams of active ingredient/kilogram of
bodyweight (2,24,25). Thus a 68 kilogram individual (150 lbs) would require 13 milligrams to
increase fat breakdown. Individuals should start with a lower dosage to assess their tolerance
and increase dosage only when no negative heart rate or blood pressure responses occur.
A significant problem with most yohimbe on the market is a lack of standardization,
making it difficult to know how much of the active compound is present. Additionally, there are
compounds present in herbal preparations, that appear to cause greater side effects for herbal
yohimbine, compared to prescription yohimbine hydrochloride. As with ephedrine, yohimbe
should not be taken with any medication which acts as a MAOI.
Combining yohimbe with the ECA stack
As mentioned above, ephedrine has non-specific beta receptor agonist effects which are
generally geared towards increasing fat burning. However, some of its effects are also felt at the
alpha receptor, specifically the alpha-2 receptor. Recall from above that the alpha-2 receptor
inhibits the use of fat for fuel when it is stimulated. So by stimulating alpha-2 receptors,
ephedrine is limiting some of its fat burning potential.
Adding an alpha-2 antagonist could conceivably increase fat loss when used with the ECA
stack. However an important cautionary note is needed. Recall from above that beta-receptors
are in essence an ‘accelerator’ for certain metabolic processes while alpha-receptors are the
297
‘brake’. Combining ECA with yohimbe is similar to pressing on the accelerator while releasing
the brake at the same time which should enhance fat loss. While this may occur, the combination
of ECA and yohimbe can cause profoundly negative effects on heart rate and blood pressure.
Therefore the combination of ECA and yohimbe is not recommended.
Section 4: Appetite suppressants
A second class of potential fat loss aids are appetite suppressants. In general, these types
of supplements are probably not needed on a ketogenic diet as the diet tends to blunt appetite in
and of itself. However for those individuals who find themselves hungry on a ketogenic diet,
appetite suppressants may be useful.
The ECA stack and yohimbe
The ECA stack is quite potent as an appetite suppressant in and of itself, especially when
it is first used (9). Typically any anorectic effects of ECA go away within a few weeks of use.
However, animal research suggests that combining ECA with the amino acid L-tyrosine may
maintain the appetite blunting effect of ECA for longer periods of time (22). Individuals who find
it hard to control their hunger on a ketogenic diet, may want to consider this combination.
Yohimbe may also suppress appetite (2).
Fiber supplements
Although fiber has already been discussed within the context of regularity, it can also be
used to suppress appetite on a diet. Fiber has many effects in the body, one of which is to slow
digestion and gastric emptying (how quickly food exits the stomach). This would be expected to
increase fullness, decreasing food intake. There are various types of fiber supplements available
from basic psyllium husk fibers to substances like guar gum. No one fiber supplement appears
to be superior to any other and most likely a combination of different types of fibers is optimal for
health. Dieters should ensure that their fiber supplement is sugar free and does not contain any
hidden carbohydrates that might affect ketosis.
Section 5: Other ‘fat burners’
At any given time, there are any number of ‘fat burners’ being marketed to dieters. In
almost all cases, these supplements are based on hype rather than science. The only two which
are discussed here are the amino acid L-carnitine and pyruvate.
298
L-carnitine
L-carnitine is an amino acid involved in the burning of FFA for energy (28). Previous
chapters have detailed how the carnitine palmityl transferase-1 system is intimately involved in
ketone body formation and fat oxidation in the muscle. Because of its role in fat oxidation, many
authors have suggested that supplemental L-carnitine might hasten fat loss. While this makes
sense from a theoretical standpoint, most studies have not shown the expected results (28).
Additionally, supplementation of L-carnitine under conditions of glycogen depletion, when it would
be expected to have the greatest impact (since fat oxidation is at its highest), shows no benefit
(29). Considering the high cost of L-carnitine, its use is not recommended.
Pyruvate
Supplemental pyruvate is a new supplement which has entered the fat burner market.
Studies have shown that pyruvate slightly enhances fat loss on very low calorie diet (30,31).
However, the doses necessary, 30 or more grams per day, to achieve this fat loss are cost
prohibitive. Additionally, since commercially available pyruvate supplements typically contain
half their weight as sodium or calcium, the risk for overload exists. Finally, pyruvate can inhibit
ketosis. Pyruvate supplements are not recommended.
Conclusion
There are a number of supplements which may be beneficial to hasten fat loss, spare
muscle loss, and blunt appetite while on a diet. These include the combination of ephedrine,
caffeine and aspirin ; yohimbe ; as well as a variety of fiber supplements that can be used while
dieting. Additionally, there are at least two popular ‘fat burning’ supplements, L-carnitine and
pyruvate, which are not recommended.
References cited
1. “Textbook of Medical Physiology” Arthur C. Guyton. W.B. Saunders Company 1996.
2. Lafontan M and Berlan M. Fat cell alpha-2 adrenoreceptors: The regulation of fat cell function
and lipolysis. Endocrine Rev (1995) 16: 716-738.
3. Lafontan M and Berlan M. Evidence for the alpha-2 nature of the alpha-adrenergic receptor
inhibiting lipolysis in human fat cells. Eur J Pharmacology (1980) 66: 87-93.
4. Wahrenberg H et. al. Adrenergic regulation of lipolysis in human fat cells during exercise. Eur J
Clin Invest (1991) 21: 534-541.
5. Wahrenberg, H et. al. Mechanisms underlying regional differences in lipolysis in human adipose
tissue. J Clin Invest (1989) 84: 458-467.
6. Arner P. Adrenergic receptor function in fat cells. Am J Clin Nutr (1992) 55: 228S-236S.
7. Strosberg AD. Structure and function of the b3-adrenergic receptor. Annu Rev Pharmacol
299
Toxicol 1997; 37:421-450.
8. Dulloo AG. Ephedrine, xanthine, and prostaglandin-inhibitors: actions and interactions in the
stimulation of thermogenesis. Int J Obes (1993) 17 (suppl. 1): S35-S40.
9. Astrup A and Toubro S. Thermogenic, metabolic and cardiovascular responses to ephedrine
and caffeine in man. Int J Obes (1993) 17 (suppl 1): S41-S43.
10. Astrup A et. al. Enhanced thermogenic responsiveness during chronic ephedrine treatment in
man. Am J Clin Nutr (1985) 42: 83-94.
11. Breum L et. al. Comparison of an ephedrine/caffeine combination and dexfenfluramine in the
treatment of obesity. A double-blind multi-centre trial in general practice. Int J Obes
(1994) 18: 99-103.
12. Horton TJ and Geissler CA. Post-prandial thermogenesis with ephedrine, caffeine and aspirin
in lean, pre-disposed obese and obese women. Int J Obes (1996) 20: 91-97.
13. Horton TJ and Geissler CA. Aspirin potentiates the effect of ephedrine on the thermogenic
response to a meal in obese but not lean women. Int J Obes (1991) 15: 359-366.
14. Daly PA et. al. Ephedrine, caffeine and aspirin: safety and efficacy for treatment of human
obesity. Int J Obes (1993) 17 (suppl. 1): S73-S78.
15. Arner P. Adenosine, prostaglandins and phosphodiesterase as targets for obesity
pharmacotherapy. Int J Obes (1993) 17 (suppl. 1): S57-S59.
16. Acheson KJ et. al. Caffeine and coffee: their influence on metabolic rate and substrate
utilization in normal weight and obese individuals. Am J Clin Nutr (1980) 33: 989-997.
17. Astrup A et. al. Caffeine: a double-blind, placebo-controlled study of its thermogenic,
metabolic, and cardiovascular effects. Am J Clin Nutr (1990) 51: 759-767.
18. Weir J et. al. A high carbohydrate diet negates the metabolic effects of caffeine during
exercise. Med Sci Sports Exerc (1987) 19: 100-105.
19. “Fat Management! The Thermogenic Factor.” Daniel B. Mowery, PhD. Utah: Victory
Publications, 1994.
20. Toubro S et. al. Safety and efficacy of long-term treatment with ephedrine, caffeine and
ephedrine/caffeine mixture. Int J Obes (1993) 17 (suppl. 1) S69-S72.
21. Astrup A et. al. Thermogenic synergism between ephedrine and caffeine in healthy
volunteers: a double-blind, placebo-controlled study. Metabolism (1991) 40: 323-329.
22. Hull KM and Maher TJ. L-tyrosine potentiates the anorexia induced by mixed-acting
sympathomimetic drugs in hyperphagic rats. Journal of Pharmacology and Experimental
Therapeutics (1990) 255: 403-409.
23. LaFontan M et. al. Alpha-2 adrenoreceptors in lipolysis: alpha-2 antagonists and lipid
-mobilizing strategies. Am J Clin Nutr (1992) 55: 219S-227S.
24. Berlan M et. al. Plasma catecholamine levels and lipid mobilization induced by yohimbine in
obese and non-obese women. Int J Obes (1991) 15: 303-315.
25. Galitzky, J et. al. Alpha-2 antagonist compounds and lipid mobilization: evidence for a lipid
mobilizing effect of oral yohimbine in healthy male volunteers. Eur J Clin Invest (1988)
18: 587-594.
26. Zahorska-Markiewicz B et. al. Adrenergic control of lipolysis and metabolic responses in
obesity. Horm Metab Res (1986) 18: 693-697.
27. Kucio C et. al Does yohimbine act as a slimming drug? Isr J Med Sci (1991) 27: 550-556.
28. Brass EP and Hiatt WR. The role of carnitine and carnitine supplementation during exercise
in man and in individuals with special needs. J Am Coll Nutr (1998) 17: 207-215.
29. Decombaz J et. al. Effect of L-carnitine on submaximal exercise metabolism after depletion of
muscle glycogen. Med Sci Sports Exerc (1993) 25: 733-740.
300
30. Stanko RT et. al. Body composition, energy utilization, and nitrogen metabolism with a 4.25
MJ/d low-energy diet supplemented with pyruvate. Am J Clin Nutr (1992) 56: 630-635.
31. Stanko RT et. al. Body composition, energy utilization, and nitrogen metabolism with a
severely restricted diet supplemented with dihydroxyacetone and pyruvate. Am J Clin
Nutr (1992) 55: 711-776.
301
Chapter 33:
The carb-load
The carb-up section of the CKD is one area where specific supplements can help to
maximize glycogen synthesis while minimizing fat regain. There are three major ways that
supplements may improve the quality of the carb-up. The first is by improving insulin
sensitivity, which is an index of how well or poorly a given tissue can utilize insulin. By keeping
muscle insulin sensitivity high, there is less likelihood that fat cells will be stimulated to store fat.
The three main insulin sensitizers are chromium picolinate, vanadyl sulfate, and alpha lipoic acid.
The second way that supplements may help the carb-up is by preventing the conversion of
carbohydrate to fat, a process called de novo lipogenesis (DNL, discussed in more detail in
chapters 3 and 12). The only supplement which may have this capacity is hydroxycitric acid
(HCA).
The final mechanism by which supplements may improve the carb-up is by increasing
glycogen storage in the muscles. Supplements which improve glycogen storage are creatine and
glutamine, which are discussed in section 4 of this chapter.
Section 1: Insulin sensitizers
In general terms, insulin sensitivity refers to how well or how poorly a given tissue
responds to the presence of insulin. There are a number of supplements which may improve
insulin sensitivity, meaning that less insulin is needed to elicit the same effect.
Chromium
Chromium picolinate is a supplement which has been popularized in the media. Early
studies suggested that it had a profound impact on body composition, but not all studies have
found this to be the case (1). Chromium has been suggested to be part of a glucose tolerance
factor (GTF) and may regulate how well or how poorly the body handles carbohydrates (1,2).
Chromium is thought to improve insulin sensitivity, which means that less insulin is
necessary to have the same effect (2). For this reason chromium may play a role in the
treatment of Type II diabetes (2,3). It has also been suggested that chromium may establish
ketosis by helping to remove glucose from the bloodstream at the beginning of the low carb phase
of the CKD. Anecdotally, it has shown only minimal effects in this regard. Individuals who suffer
from insulin resistance may find that chromium supplements are useful during a SKD (2-4).
Due to the high carbohydrate intake during the carb-up, and considering that exercise is
known to increase chromium excretion, supplementation with chromium may be beneficial (5).
Typical doses vary from 200 to 800 micrograms per day. Although a recent concern was raised
302
that chromium may cause chromosomal damage (6), the dosage necessary to cause toxicity
problems is far in excess of what could be reasonably consumed (1).
Vanadyl sulfate
Vanadyl sulfate is a specialized form of the mineral vanadate. Although this seems a
minor distinction, it becomes important when considering the issue of toxicity. While vanadate (a
heavy metal) can be extremely toxic, vanadyl sulfate (the mineral salt) has not shown as great of
toxicity.
Vanadyl has been suggested to work similarly to chromium picolinate, by improving insulin
sensitivity in tissues of the body. It has shown some benefit in the treatment of Type II diabetes
in this regard (7-9).
Because of its effects, vanadyl may have some benefit during carb-ups by keeping insulin
sensitivity high. Additionally, vanadyl appears to improve glycogen storage in muscle tissue.
Vanadyl has also been suggested to help establish ketosis, similar to chromium picolinate.
However, vanadyl appears to keep some people out of ketosis, and this may occur from an effect
on liver glycogen. The use of vanadyl sulfate is not recommended on a ketogenic diet.
Alpha lipoic acid
Alpha lipoic acid is a substance which acts as an anti-oxidant (10) as well as improving
insulin sensitivity and the removal of glucose from the bloodstream (11, 12). Although human
data on the effects of alpha lipoic acid is limited, anecdotal evidence suggests that lipoic acid is far
more potent than either chromium or vanadyl. In this respect it is considered one of the best
supplements to use on a carb-up, although it is somewhat expensive. Typical dose for lipoic acid
during carb-ups are 1.2-2 grams total taken in divided doses. Considering the high cost of lipoic
acid, individuals may wish to start with lower doses, and increase only if no noticeable effect is
seen.
Section 2: Supplements to block De Novo Lipogenesis
The second mechanism by which supplements may improve the carb-up is by blocking the
conversion of carbohydrates to fat. This process is called de novo lipogenesis (DNL) and is
discussed in chapter 3 and 12. The only supplement which may have this effect is hydroxycitric
acid.
Hydroxycitric acid
Hydroxycitric acid (HCA) has been found, in animal models only, to inhibit the conversion
of excess carbohydrates to fat in the liver, a process called de novo lipogenesis (DNL) (13). The
303
process of DNL is determined by the activity of an enzyme called ATP lyase, which HCA may
inhibit. Additionally, it may enhance fat utilization and blunt appetite (13,14). Some authors
have suggested that HCA will have similar effects in humans and may have a role in fat loss and
exercise performance (15-17).
The problem with HCA is the lack of human research to show its effectiveness. The
biggest argument against HCA is that DNL is not active in humans under normal conditions
(18). As discussed in chapter 12, DNL can occur under one specific situation: severe
carbohydrate overfeeding, as might occur during the carb-up phase of a CKD (19).
Although no research exists on this topic, anecdotal evidence suggests that the use of HCA
can improve the carb-up, giving better muscle glycogen resynthesis with less spillover of water
and fat. Additionally, in some people HCA blunts appetite, which may be good or bad during a
carb-up. For those individuals who tend to over consume calories during a carb-up, HCA may be
of benefit. For those individuals who find it difficult to consume sufficient carb calories during the
carb-up, HCA may not be a good supplement to try.
The typical dose of HCA is 750-1000 mg of active ingredient taken three times per day.
Since HCA comes in 50% standardization in most products, this means that 1500-2000 mg will
need to be taken. An important aspect of making HCA effective is that it must be in the liver
prior to the consumption of carbohydrates. This generally means that HCA should be taken at
least thirty minutes before a meal is consumed.
Finally, in some individuals HCA seems to inhibit ketosis during the week although the
exact mechanism is unknown. Beyond a potential effect on ketosis, as no carbohydrates are
being consumed during the low-carbohydrate week of a CKD, HCA is unnecessary. Some
products containing the ECA stack include HCA in them. These products are inappropriate for
use during the lowcarb week.
Section 3: Supplements that increase
glycogen storage
The final mechanism by which supplements may improve the carb-load is by increasing
glycogen storage. The two major supplements which may increase glycogen storage during the
carb-load are creatine and glutamine. Both are discussed in greater detail in the next chapter.
Glutamine is an amino acid which has been found to increase glycogen storage when
consumed with carbohydrates (20). Additionally, creatine has also been found to increase
glycogen synthesis when taken with carbohydrates (21). Therefore individuals may wish to
experiment with one or both during the carb-load phase, to see if it gives them noticeably better
glycogen supercompensation. As mentioned in the next chapter, glutamine supplementation can
keep some people out of ketosis. If individuals find it difficult to establish ketosis after having
used glutamine during the previous carb-load, they should try carb-loading without the glutamine
to see if there is any difference.
References cited
304
References cited
1. Anderson R. Effects of chromium on body composition and weight loss. Nutr Rev (1998)
56: 266-270.
2. Anderson RA. Chromium, glucose tolerance and diabetes. Biol Trace Elem Res (1992)
32: 19-24.
3. Lee NA and Reasner CA. Beneficial effects of chromium supplementation on serum
triglyceride levels in NIDDM. Diabetes Care (1994) 17: 1449-1452.
4. Anderson R et. al. “Supplemental-chromium effects on glucose, insulin, glucagon, and urinary
chromium losses in subjects consuming controlled low-chromium diets. Am J Clin Nutr
(1991) 54: 909-916.
5. Kozlovsky AS et. al. Effects of diets high in simple-sugars on urinary chromium losses.
Metabolism (1986) 35: 515-518.
6. Stearns DM et. al. Chromium (III) picolinate produces chromosome damage in Chinese
hamster ovary cells. FASEB Journal (1995) 9: 1643-1648.7.
7. Boden G et. al. Effects of vanadyl sulfate on carbohydrate and lipid metabolism in patients
with non-insulin-dependent diabetes mellitus. Metabolism: Clinical and Experimental
(1996) 45: 1130-1135.
8. Halbertstam M et. al. “Oral vanadyl sulfate improves insulin sensitivity in NIDDM but not in
obese nondiabetic subjects. Diabetes (1996) 45: 659-666.
9. Cohen N et. al. Oral vanadyl sulfate improves hepatic and peripheral insulin sensitivity in
patients with non-insulin-dependent diabetes mellitus. J Clin Invest (1995)
95: 2501-2509.
10. Packer L et. al. Alpha-lipoic acid as a biological antioxidant. Free Rad Biol Med (1995)
19: 227-250.
11. Jacob, S. et. al. “The antioxidant alpha-lipoic acid enhances insulin-stimulated glucose
metabolism in insulin-resistant rat skeletal muscle” Diabetes (1996) 45: 1024-1029.
12. Jacob S et. al. Thiotic acid enhances glucose disposal in patients with type 2 diabetes.
Drug Res (1995) 45: 872-874.
13. Sullivan AC et. al. Effect of (-)-hydroxycitrate upon the accumulation of lipid in the rat. I.
Lipogenesis. Lipids (1974) 9: 121-128.
14. Sullivan AC et. al. Effect of (-)-hydroxycitrate upon the accumulation of lipid in the rat. II.
Appetite. Lipids (1974) 9:129-134.
15. McCarty MF. Optimizing exercise for fat loss. Med Hypotheses (1995) 44: 325-330.
16. McCarty MF. Promotion of hepatic lipid oxidation and gluconeogenesis as a strategy for
appetite control. Med Hypotheses (1994) 42: 215-225.
17. McCarty MF. Inhibition of citrate lyase may aid aerobic endurance. Med Hypotheses
(1995) 45: 247-254.
18. Hellerstein MK. Synthesis of fat in response to alteration in diet: insights from new stable
isotope methodologies. Lipids (1996) 31 (suppl): S117-S125.
19. Acheson KJ et. al. Glycogen storage and de novo lipogenesis during massive carbohydrate
overfeeding in man. Am J Clin Nutr (1988) 48: 240-247.
20. Varnier M et.al. Stimulatory effect of glutamine on glycogen accumulation in human skeletal
muscle. Am J Physiol (1995): E309-315
21. Green AL et. al. Creatine ingestion augments muscle creatine uptake and glycogen synthesis
during carbohydrate feeding in man. J Physiol (1996) 491: 63-64.
305
Chapter 34:
Mass Gains
There are a number of supplements used by weight trainers in an attempt to increase
either strength or mass gains. Although the CKD is probably not the optimal mass gaining diet,
many individuals choose to use these supplements to maintain strength and muscle mass while
dieting and they are discussed here.
Glutamine
Glutamine is one of the most popular supplements on the market right now. Glutamine is
typically considered a non-essential amino acid (AA) since it can be made within the body.
However, in times of high stress, it may become essential (2). Glutamine is involved in
maintaining the immune system (1) and low glutamine levels have been linked to overtraining in
endurance athletes (1). Weight training is a form of stress and, although not directly studied,
glutamine supplements have been suggested to help deal with the stress of training.
A majority of glutamine research has focused on its effect in critically ill individuals and
burn patients. It is a major mistake to extrapolate from pathologically ill patients to healthy,
weight training athletes although many authors in the field of nutrition have made that mistake.
Outside of its effects on immune system function, oral glutamine has also been shown to
elevate growth hormone levels in the bloodstream, which may be useful for fat loss (1). The
primary problem with oral glutamine supplementation is that glutamine is a major metabolic fuel
for the small intestine. As well, high doses of glutamine tend to be absorbed by the kidney with
the end result being that little of the glutamine ingested actually gets into the muscles (2).
A possible solution is to take glutamine in small doses throughout the day. Doses of 2
grams may not activate absorption by the kidney (1) and it should be possible to keep blood
glutamine levels high by taking it in this fashion.
However, a little known effect of glutamine is that it inhibits ketogenesis in the liver (2).
Many individuals have found that glutamine supplementation prevents them from establishing
ketosis. However others have not found this to be the case and, as with many supplements,
experimentation is the key. Glutamine probably has its greatest potential during the carb-up
period of the CKD.
Creatine Monohydrate
If there is a single sports supplement that has been shown to work under a variety of
conditions, it is creatine. Recall from chapter 19 that creatine phosphate (CP) is used to provide
short term energy for exercise lasting approximately 20-30 seconds. Numerous studies have
shown that supplementing with creatine monohydrate can increase muscular stores of CP and
306
enhance high intensity exercise performance (for recent reviews of the effects of creatine, see
references 3-5).
Improvements are primarily seen in short duration, high-intensity activity such as sprint
performance as well as weight lifting (3). However, creatine has not consistently been shown to
improve longer events, which rely on other energy systems. The improvements range from the
ability to maintain a higher performance level prior to fatigue, the ability to perform more
repetitions with a given weight, and some studies suggest that creatine supplementation may
increase maximal strength (1 repetition maximum). Additionally, creatine typically causes a
large initial weight gain of 5 or more pounds, although the majority of this weight is water.
Whether long-term creatine supplementation causes significantly greater gains in lean body
mass is still under research.
Creatine is typically loaded first to saturate muscular stores. Although the optimal dosage
can vary, most studies suggest consuming 20 grams of creatine in divided doses (typically 5
grams four times a day) for 5 days to saturate muscular stores. An alternate method is to take
small (3 grams) daily doses of creatine, which results in similar loading over a period of a month.
Some individuals find that high doses of creatine cause stomach upset, and lower doses may
make loading possible while avoiding this problem.
Although maintenance doses have been suggested, there is some debate as to whether or
not this is truly necessary . As long as red meat is an integral part of the diet, as it will most likely
be on any form of ketogenic diet, muscular CP stores will stay elevated for long periods of time.
One concern regarding creatine and the ketogenic diet is that research suggests that
creatine is absorbed most efficiently if it is taken with a high glycemic index carbohydrate (6,7).
Thus the low-carbohydrate nature of the ketogenic diet raises the question of whether creatine
supplementation is useful. What should be remembered is that the early creatine studies used
coffee or tea, without carbohydrates, and creatine uptake was still fairly high. Simply more
creatine is absorbed if it is taken with a carbohydrate.
There are several strategies to get around this problem. The first is to load creatine before
starting a ketogenic diet, so that it can be taken with a high glycemic carbohydrate. Once
loaded, the high intake of meat on a ketogenic diet should maintain muscular stores. Additionally,
creatine uptake is higher following exercise so that a maintenance dose could be taken
immediately after training. Finally, many individuals have had success taking high dose of
creatine (10-20 grams) during the carb-load of the CKD. As well, creatine could be taken around
workouts on a TKD.
Creatine has no known effects on ketosis, nor would it be expected to affect the
establishment or maintenance of ketosis.
Other mass gaining supplements
Weight trainers and bodybuilders are bombarded daily with advertisements for new
supplements purported to increase strength and mass. As a general rule, there is little human
data to suggest that these substances offer a significant advantage in terms of strength or mass
gains.
307
Along with this, individuals constantly want to know if a given supplement will work on a
ketogenic diet, or how it will affect ketosis. In all of these cases, there is simply no data available,
and individuals will have to experiment to find what does and does not affect the diet.
References cited
1. Welbourne TC. Increased plasma bicarbonate and growth hormone after an oral
glutamine load. Am J Clin Nutr (1995) 61: 1058-1061.
2. Lacey J and Wilmore D. Is glutamine a conditionally essential amino acid?
Nutr Rev (1990) 48: 297-309.
3. Williams, MH and Branch D. Creatine supplementation and exercise performance:
an update. J Am Coll Nutr (1998) 17: 216-234.
4. Balsom PD et. al. Creatine in humans with special reference to creatine
supplementation. Sports Med (1994) 18: 268-280.
5. Volek JS and Kraemer WJ. Creatine supplementation: its effect on human
muscular performance and body composition. J Str Cond Res (1996)
10: 200-210.
6. Green AL et. al. Carbohydrate ingestion augments creatine retention during
creatine feeding in humans. Acta Physiol Scand (1996) 158: 195-202.
7. Green AL et. al. Carbohydrate ingestion augments skeletal muscle creatine
accumulation during creatine supplementation in man. Am J Physiol (1996)
271: E821-826.
308
Appendix 1: Partial glycemic index
The glycemic index (GI) is a measure of how much a given carbohydrate food will affect
blood glucose and insulin. Its primary use for ketogenic dieters is to pick carbohydrate sources
while on a low-carbohydrate diet (where low GI carbs should be consumed) and also to make carb
choices during the carb-up or around exercise (where high GI carbs are traditionally used). The
following list uses white bread as a reference (given a value of 100) but some lists use glucose as
the reference. To convert from the white bread GI to the glucose GI, divide by 0.7. To convert
from the glucose GI to the white bread GI, multiply by 1.42. For ease of reference, foods are
grouped by their GI, rather than by category. Therefore if individuals are looking for relatively
higher or lower GI foods, it should be easier to make food choices.
Glucose
Instant rice
Baked potatoes
Corn Flakes
Instant potatoes
Rice Crispies
Rice cakes
Jelly beans
Honey
Carrots
White bread
Cream of wheat
Sucrose
Ice cream
White rice
Brown rice
Popcorn
138
128
121
119
118
117
117
114
104
101
100
94
92
87
81
79
79
Bananas
Orange juice
Lactose
Mixed grain bread
Grapes
Oranges
All Bran cereal
Spaghetti
Apple juice
Apples
Chickpeas
Skim milk
Lentils
Full fat milk
Grapefruit
Fructose
Peas
Peanuts
76
74
65
64
62
62
60
59
58
52
47
46
41
39
36
32
32
21
Source: Foster-Powell K and Miller JB. International tables of glycemic index. Am J Clin Nutr
(1995) 62: 871S-893S.
309
Appendix 2: Resources
Note: The author does not have any financially vested interest in any of the following companies.
They simply represent good sources of products which may interest ketogenic dieters.
1. Creative Health Products: CHP is an excellent source for body fat calipers and heart rate
monitors. For calipers, the Slimguide calipers can’t be beat for cost or accuracy. They have
some of the best prices anywhere.
1-800-742-4478
2. Beyond A Century: BAC sells many nutritional supplements that can be useful on a ketogenic
diet. They have both an in-house brand as well as selling many well-known products from other
companies. They also carry unique products (such as DMSO and Guar Gum) that are difficult if
not impossible to find elsewhere.
1-800-777-1324
email: [email protected].
Http://www.beyondacentury.com
3. Dave’s Power Store: The Power Store offers the best prices on nutritional products around
from all the major companies as well as their own in-house brand. They also publish an excellent
newsletter (both hardcopy and online) to help individuals keep up to date on cutting edge nutrition
and supplementation.
1-800-382-9611
email: [email protected]
http://www.thepowerstore.com/
4. The Scientific Bodybuilding Journal: The SBJ is a bimonthly magazine that the author
contributes to regularly. It is pro-ketogenic and focuses on training and supplementation for the
natural bodybuilder.
Contact Vince Martin at:
[email protected] for information about subscriptions.
http://www.io.com/~vinnie/index.html
5. The Lowcarb-l mailing list: For individuals with access to the internet, there is a mailing list
dedicated to exercising on a low-carbohydrate diet. To subscribe, send email to:
[email protected]
with the message.
subscribe lowcarb-l
in it.
6. The Low carb technical list: This mailing list exists for the dissemination of technical
information regarding low-carbohydrate diets. To subscribe, send email to:
[email protected]
with the message
subscribe lowcarb
in it.
7. “Everyday Low Carb Cookery” by Alex Haas is a collection of lowcarb recipes for use with any
of the popular lowcarb diets.
The price for each book is $19.95 (American dollars) plus Shipping and
Handling (priority mail insured within the U.S.). Note that I take
personal checks and money orders.
310
Shipping and handling (within the U.S.) - $5.00 (American) per book
Shipping and handling (to Canada) $8.00 (American) per book
Shipping and handling (anywhere else) - $12.00 (American) per book
For gifts for the holidays, there is a 10% discount on orders of 3 or more
books.
Send orders to:
Alex Haas
P.O. Box 7802
Talleyville, DE 19803-7802
U.S.A.
311
Glossary
Acetyl-CoA: An intermediate in energy metabolism, produced from the breakdown of free fatty
acids, glucose and protein.
Adenosine Diphosphate: The by-product of the breakdown of adenosine triphosphate.
Adenosine Monophosphate: The by-product of the breakdown of adenosine diphosphate.
Adenosine Triphosphate (ATP): The principle form of stored energy in the body. Composed of an
adenosine molecule and three phosphate molecules.
Amino acids (AAs): The building blocks of proteins of which there are 20.
Anabolic: A general term which refers to the building of larger substances from smaller
substances.
Branch chain amino acids (BCAAs): The amino acids valine, leucine, and isoleucine.
Carbohydrate (CHO): Organic substances made up of carbon, hydrogen and oxygen, which
provide energy to the body.
Carnitine Palmityl Transferase 1 (CPT-1): Carries free fatty acids into the mitochondria of cells
for burning.
Catabolic: A general term which refers to the breaking down of larger substances into smaller
substances.
Cholesterol: A steroid compound most often associated with triglycerides. Cholesterol is used in
the body for the synthesis of cell membranes.
Cyclical ketogenic diet (CKD): A diet which alternates periods of ketosis with periods of high
carbohydrate intake.
De Novo Lipogenesis (DNL): A process by which excess carbohydrate is converted to
triglycerides in the liver.
Diabetic ketoacidosis: A potentially fatal condition occurring only in Type 1 (insulin dependent)
diabetics as a consequence of high blood glucose but low insulin concentrations.
Fat mass (FM): Bodyfat stored in adipose tissue under the skin.
Glucagon: A hormone released from the pancreas which raises blood glucose when it drops too
low.
Glucose: A single chain carbohydrate molecule, found circulating in the bloodstream.
Gluconeogenesis: An anabolic process where amino acids, lactate, pyruvate and glycerol are
converted into glucose in the liver.
Glycogen: A storage form of carbohydrates in the body, found in muscle and liver.
Glycogenesis: An anabolic process where glucose is formed into glycogen. This occurs in muscle
312
or in the liver.
Glycolysis: A catabolic process where glycogen is broken down into glucose.
Insulin: A hormone released from the pancreas which lowers blood glucose when it raises too high.
Ketone body (KB), also ketone: Ketone bodies are water-soluble substances which can be used by
most tissues of the body as an alternative fuel to carbohydrate.
Ketogenesis: The production of ketone bodies in the liver from the incomplete breakdown of free
fatty acids.
Ketogenic diet (KD): Any diet which causes the accumulation of ketone bodies in the
bloodstream. Generally defined as any diet containing less than 100 grams per day of
carbohydrate.
Ketonemia: Ketonemia refers to the buildup of ketones in the bloodstream to such a point that a
metabolic state of ketosis occurs.
Ketonuria: Ketonuria refers to the buildup and subsequent excretion of ketones in the urine.
Ketosis: A metabolic state where ketone bodies have built up in the bloodstream to a point that
the body changes its overall metabolism from one based primarily on carbohydrate to one based
on fat.
Lactate threshold (LT): The exercise intensity above which lactic acid accumulates rapidly,
causing fatigue.
Lactic acid: A by-product of high-intensity exercise.
Lean body mass (LBM): Everything in the body except adipose tissue. LBM includes muscle,
bone, organs, the brain, water, glycogen, minerals, etc.
Lipogenesis: An anabolic process where free fatty acids and glycerol are made into triglyceride.
Lipolysis: A catabolic reaction which refers to the breaking down of triglycerides into free fatty
acids and glycerol.
Macronutrients: Protein, carbohydrate and fat.
Malonyl-CoA: An intermediate in fat synthesis. Malonyl-CoA regulates free fatty acid use in the
liver and muscle and is the determining factor in ketone body formation in the liver..
Micronutrients: Vitamins and minerals.
Mitochondria: The powerhouse of the cell, where free fatty acids are burned to produce energy.
Protein: Substances used in the body primarily for tissue repair. Proteins are made up of amino
acids.
Protein synthesis: An anabolic process where amino acids are formed into larger proteins.
Proteolysis: A catabolic process where proteins are broken down into amino acids.
313
Targeted Ketogenic Diet (TKD): A compromise approach for those who can not use the CKD (for
a variety of reasons) but who need to sustain high intensity activities (such as weight training).
Triglyceride (TG): Organic substances composed of three free fatty acid (FFA) molecules and a
glycerol molecule.
Total body mass (TBM): The total weight of the body, including fat and lean body mass.
314
Index
A
Acetoacetate
formation of 29
Ketostix and 162
Acetyl-CoA
breakdown of FFA 32,185
condensation to ketones 29,32-33,185
N-acetyl-cysteine
false ketosis and 34-35,164
Acidosis, see ketoacidosis
Adenosine
caffeine and 294
Adenosine diphosphate (ADP)
production of ammonia 188
production from ATP 177,201,202
resynthesis of ATP 202
Adenosine monophosphate (AMP)
production of ammonia 188
Adenosine triphosphate (ATP)
breakdown 202
energy storage and 1 77-178,202
fatigue and 191,211,214
FFA breakdown and 185,213
production via glycolysis 183,186,200,214
production of ammonia 188,191
resynthesis from CP 202
Adipose tissue
average amounts 19,112,181
catecholamines and 212
FFA mobilization and 185-186
FFA storage and 19,293
lactic acid and 186
Adrenaline, see catecholamines
Aerobic exercise
adaptations to 180
basic fitness 260
catecholamines and 180,190
circuit training 254
energy production 178,180
fat loss 229-235
fatigue 183,184,191
FFA utilization 129, 182,187
gender differences 189
glucagon 190
glucose use 182,187
glycogen levels 120,121
glycogen resynthesis 132
guidelines 241-244
insulin and 190
intramuscular triglycerides and 188
ketogenic diet and 124,168,192-196
315
lactate threshold and 200
mass gains and 273
muscle loss and 1 81,188
pre-contest bodybuilders and 280-283
post-exercise ketosis and 33,225-227
protein utilization and 188
shift in fiber type and 175,181
strength training and 217-218
warm-up and 254,255
yohimbine and 297
Alanine
blood concentrations of 41,44
gluconeogenesis and 20,44,49
release from muscle 41,44
Alcohol
fat loss and 23,55,116
ketoacidosis and 33,36-37,55,115
ketosis and 53,55,115
Alpha-lipoic acid 302-303
pre-contest bodybuilders and 285
Amino acids (AAs) 107
blood concentrations 41
energy production and 187
free pool 107,187
Ammonia 188, 191
kidneys and 47,78
Anabolism
aerobic exercise and 189
carb-load and 137-144
GH and 25
insulin, glucagon and 24,155,270
IGF-1 and 25
ketones and 48
liver glycogen and 26,139
overfeeding and 138
Antioxidants 289
Appetite
exercise and 235
fiber and 298
citric acid and 116
ketogenic diet and 64,74,95,101
B
Bicarbonate
buffering of lactate and 200,203,214
decreased buffering capacity 203
FFA release and 186
nitrogen sparing and 48
Biological Value (BV) of protein 107
Blood glucose
amount of 19,181
carbohydrates, see glucose
catecholamines and 201,212,226
exercise and 124,186,190,225-227
fasting and 39,164
glucagon and 23,30
glucometers and 162,164
glycemic index and 105,309
GH and 24
insulin and 23-24,30,125,185,190,201
ketoacidosis and 34,35
ketogenic diet and 35,39,164,193,271
liver glycogen and 26,30,184,225
protein and, see glucose
Type II diabetes and 170
Bodybuilding
aerobics and 181,217,235,241-243,281
body composition and 88-90
contest prep and 134,136,219,278-287
interval training and 201,245
ketogenic diets and 15,46,152,155,167
lactic acid and 121
mass gains and 270-273
powerlifters and 207-208
training and 207,213,250,254,272
Body composition
carb-load and 136
effect of ketogenic diet 53-67
measurement of 89-91,158-162
Bodyfat
bodybuilders and 278
carb-load and 133,136
cholesterol levels and 75,170
location of 89
liver glycogen and 26
maintenance of 73,156
measurement of 89-91,158-162
versus bodyweight 82,87-88
Bodyweight
bodyfat and 82,87-88
calculating desired 88
energy balance and 92
maintenance of 92
maintenance calories and 94
protein intake and 57,108-109
resting energy expenditure and 93
setting calories and 97-98
transient increase 89,153
water loss and 82,158,167
yohimbe dose 297
Branch chain amino acids (BCAAs)
McArdle’s disease and 188
oxidation during exercise 188
production of glutamine 188
Brown adipose tissue (BAT) 293
C
Caffeine
adenosine and 294
ephedrine and 281,284-285
FFA mobilization 116
insulin and 116
ketosis and 116
yohimbe and 297
Calcium
cramping and 282
intake on ketogenic diet 80
muscle damage and 210
optic neuropathy and 82
osteoporosis and 81
pyruvate and 299
supplements 80,289
Caloric intake
Atkins diet and 15,94-95
calculation of 92-93,95-97,117
calorie cycling 149
carb-load and 135,142,150,285-286
cholesterol intake and 103
dietary fat and 112-113
de novo lipogenesis and 22
impact of exercise and 229,231-233
fat loss and 91,94-95,97-98,101102,152,169
Hydroxycitric acid and 304
immune system and 81
ketogenic diets and 14,64,73
macronutrient intake and 101-103
metabolic rate and 95-97,102
micronutrient intake and 78-79,289
muscle growth and 212
pre-contest preparation 280,284
protein requirements and 60,108,135
PSMF and 63
thyroid levels and 48-49
weight gain and 91,94,98-99,153,
155,270
Cancer
ketogenic diet and 14
fiber and 79
Carbohydrate
alcoholic ketoacidosis and 35
bodily stores 19,181
carb-load and 120-121,130-136,142-143,
149-150,155,167,189,195,
267, 270-271,280
creatine and 304,307
316
daily requirements 42,44-45
weight training and 211,213
de novo lipogenesis from 21-22,135-136,
yohimbine and 296
303-304
Central nervous system
digestion of 104
fuel use and 42
exercise and 12,75,120,123,126,168,182
stimulation via ECA 295
191,213,215-216,245,273-277 Cholesterol
fat loss and 65-66
bodyfat and 75
fat sparing effect of 20,23
intake of 103
from fiber 78,116-117,298
ketogenic diet and 75,170
glucose and, see glucose
ketosis and 111
glycemic index and 105,125,133,140,309
production in liver 112
insulin-resistance and 71-72,153,190
unsaturated fats and 114,290
intake of 102-106
weight loss/gain and 75
ketosis and 31,34,39,42,53,103-104,125,
Chromium picolinate 302-303
136-137,226
Pre-contest prep and 285
protein requirements and 56,107-109
Citric Acid 116
protein sparing effect of 20,46,58
Cortisol
TKD and 124-127
calorie intake and 138,212
thermic effect of 93
carbohydrates and 271
thyroid and 48
effects of 25,138,212
use of 23,26,40,72,139,154,194
exercise and 184,190
water weight and 62-64,81,88,148,153,
FFA breakdown and 29
158-159,167
ketogenic diet and 40,139
yohimbe and 297
muscle growth and 212,219
L-carnitine 299
Creatine monohydrate 304, 306-307
Carnitine palmityl transferase 1 (CPT-1)
pre-contest preparation 285
adaptations to 195
Creatine phosphate
FFA transport 32, 185
ATP-PC system 177,202
liver glycogen depletion 31
breakdown 202
malonyl-CoA levels 32
fatigue and 214
Catabolism
Cyclical ketogenic diet (CKD)
aerobic exercise and 189-190
adaptations to ketosis 136-137
cortisol and 25,212
adolescents and 171
insulin, glucagon and 24
advanced workout 266-269
ketones and 46-47
beginning trainees and 120,168,260
liver glycogen and 26,139,144
bodybuilders and 120,270,280
overfeeding and 138
body composition and 160-161,279
underfeeding and 106,138,212
carb-load and 131-135,142-143,167Catecholamines
168, 282,302
adrenoreceptors and 292
carbohydrate intake and 105,141
aerobic exercise and 181,190
creatine and 306
effects on ketosis 190,201,226
ending a 155-156
ephedrine and 294
endurance athletes and 277
excess post-exercise oxygen
ephedrine and 296
consumption 230
glycogen depletion and 128-131
fat breakdown and 25,30,185
insulin resistance and 72,168
gender differences and 189
interval training and 236,245
insulin and 190
ketosis and 225
intramuscular TG use 187
lean body mass and 68,138-140,
ketogenic diet and 41,193
270,280
liver glycogen and 116,184,212
long-term effects 71,137,212
thermogenesis and 292
plateaus 148-152
L-tyrosine and 296
powerlifters and 273-276
317
targeted CKD 271
weekly weight gain and 81,153,158-159
women and 189
lactate threshold and 182,200
protein requirements 108,188
training and 181,241,243,245,
276-277
D
Diabetes
chromium and 302
Insulin dependent diabetes mellitus
(IDDM) 21,24,34,170
ketoacidosis and 34-35
Non-insulin dependent diabetes mellitus
(NIDDM) 171
starvation 72,153
vanadyl sulfate and 303
Dehydration
fatigue and 191,277
ketogenic diet and 77,81,115,169
pre-contest preparation 286
protein synthesis and 140
weight training and 215-216,273
Diet
cyclical ketogenic, see cyclical
ketogenic diet
ending a 152-156
mass gains and 128,141,153,155,270
plateaus and 148-151
standard ketogenic, see standard
ketogenic diet
targeted ketogenic, see targeted
ketogenic diet
Dietary fat, see fat
Dietary fiber, see fiber
Dietary protein, see protein
Dipeptides
107
Disaccharides
104
Docosahexanoic acid (DHA)
290
E
Eicosanopentanoic acid (EPA) 290
Electrolytes
cramping 79
death and 79-80
excretion of 62,79
supplements 80
Endurance athletes
carbs and 124,132,134,168,192,195
diet and 166,185,194,195,276-277
fiber type and 175
heart rate and 180,242
weight training and 217,239
Energy balance 91,94-95,153,230-231
Ephedrine 293-296
pre-contest preparation 281
Epilepsy
ketogenic diet and 13,14,16,71,75,115
171
ketogenic ratio and 52-53
Essential fatty acids (EFAs) 113- 114,290
Exercise
aerobic, see aerobic exercise
fat loss and 12,23,67,97,229-238
interval, see interval training
ketosis and 31-33,225-228
protein requirements and 56,60
weight, see weight training
F
Fasting
adaptations to 38-39,43-44,46
appetite and 73
blood glucose and 164
cortisol and 212
catecholamines and 25
epilepsy and 13
fuel use and 20,40-44,112
insulin resistance and 72,153
ketosis and 13,19,32-33,36,225
nitrogen loss and 14,40,43-46,49,5354,56,107
overview of 38-39
weight loss and 14,40
Fat
body, see bodyfat
brown, see brown adipose tissue
dietary 22-23,32,44,52,55,64-65,68,
111-114,124,126-127,135,150,
154,163,281
essential, see essential fatty acids
unsaturated 75,111,113-114,139,
148,170
saturated 75,111,113-114,148,
170,290
318
Fed state 26
Fiber
cholesterol and 170
glycemic index and 105-106
intake 79,113,116-117,134
regularity and 78,289
supplements 78,289-290
Flax oil 113-114,290
Free fatty acids (FFAs)
adipose tissue and 11,23-24,29-30,35,138
aerobic exercise and 178,180-182,186,191
226
alcohol intake and 54,116
alpha-2 receptors and 293
blood levels of 40,193,225-226
brown adipose tissue and 293
caffeine and 116,294,297
L-carnitine and 299
catecholamines and 185,190
exercise intensity and 182
glucose-FFA cycle 22
GH and 24,190
insulin and 23,29-30,35,185,
190,225,281
ketogenesis and 11,28,30-31,185,
193,225-226
lactic acid and 186,226
metabolism of 185-186
nervous system and 11,21,41
use of 11,20,21-22,29-30,39-42,112,
175,180-182,186,191-193,281
yohimbe and 297
Free radicals 289
Fructose 104
carb-load and 133,139,141,
144,150,284
glycemic index and 309
liver glycogen and 126-127,144,
150,271
G
Galactose 104
Gender differences
aerobic exercise 189
bodyfat levels 88-89,278-279
calcium requirements and 80
cholesterol and 74
CKD and 159,189
319
fat loss and 230,232
hormones and 189,211-212,218
ketosis and 33
maximum heart rate and 241
metabolic rate and 92-94
protein requirements 109,188
weight training 218,211-212,232
Glucagon
carbohydrates and 11,53
exercise and 190,225-226
FFA and 24,29,40
insulin and 24,26,29-31,35,139,190
ketogenesis and 24,29,32,53,225
liver glycogen and 26,30,184
overfeeding and 138
protein and 24,53
underfeeding and 212
Gluconeogenesis
glycerol and 39,43
kidney and 20,43
lactate/pyruvate and 39,43,183
liver and 20,43
protein and 20,39,43-44,49
starvation and 38-39,43-44,49
Glucose
blood, see blood glucose
carbohydrates and 54
glycerol and 39,43
protein and 19-21,23-25,39,41,4346,53,55-56,58-59
Glutamine 306
ammonia and 188
carb load and 141,144,285,304,306
gluconeogenesis and 20,43,49,183
ketosis and 139,304,306
kidney and 43
liver glycogen and 139
Glycemic index (GI) 104-106,125,133,140,
270-271,285,309
Glycerol
adipose tissue and 24,29,43
bodybuilding and 286-287
gluconeogenesis and 39,43,55
triglycerides and 24,29,43-44,54,111,
113,138,185
Glycogen
creatine and 304
depletion with exercise 122-123,126,129131,251,268
fatigue and 183,191-192,195,203,214-216
FFA use and 23,120,151,193
glutamine and 139,304
hydroxycitric acid and 304
levels 19,22,120-121,128-131,181
liver 19,24-26,30,39,43,53,72,104,110,
139,150,170,184,190
malonyl-CoA and 31,182
McCardle’s disease 188,214
muscle 12,19,22,24,72,104,110
synthesis 121-122,132- 136,183
water weight and 62,64,81,158-159
Glycolysis 177-178,182-183,186,190, 194,
201-203,209,214,216-217
Growth hormone (GH)
aerobic exercise and 190
carbohydrates and 24,40
cortisol and 212
effects of 24,211
glutamine and 306
IGF-1 and 25,211-212
interval training and 201
ketogenic diet and 139
lactic acid and 201,211
weight training and 211,219,253
H
Hair loss 82
High density lipoprotein (HDL) 70
Hormone sensitive lipase (HSL) 185
Hypertension 80,168
beta-hydroxybutyrate 18
formation of 28,32
I
Infrared reactance 90
Inosine monophosphate (IMP) 188
Insulin
blood glucose and 23-24,30,125,185,
190,201
exercise and 190,201,225-227
FFA and 23,29-30,35,185,190,
225,281
glucagon and 24,26,29-31,35,139,190
ketogenesis and 24,29,32,53,225
overfeeding and 138,212
protein and 24,53
320
underfeeding and 212
Insulin dependent diabetes mellitus
(IDDM), see diabetes
Insulin-like growth factor-1 (IGF-1)
anabolism and 25
anabolism and 25
insulin and 25
muscle damage and 210,212
Insulin sensitivity
diabetes and 170
exercise and 125,190
glycogen depletion and 125
ketogenic diet and 153-154
supplements and 302-303
Interval training
adaptations to 200-201,217
aerobic interval training 243
bodybuilders and 245
catecholamines and 201,226
endurance athletes and 245
energy production 201-202
fat loss 229-231,235,245
fatigue 203
GH and 201
guidelines 245-247
injury and 245
insulin and 201
ketogenic diet and 122,236
post-exercise ketosis 227
shift in fiber type 175,201,245
warm-up 246
weight training and 217
K
Ketoacidosis 226
alcoholic 35,115-116
definition of 33
diabetic 34-35
treatment of 35
versus dietary ketosis 32,35
Ketogenic diet, see standard ketogenic diet
Ketogenesis
alcohol and 116
during ketoacidosis 34-35
insulin/glucagon ratio and 30,53
liver glycogen 31-32,144
malonyl-CoA and 31-32
maximal rate of 31,35
regulation of 30-31
Ketone bodies
aerobic exercise and 180-181,187,225
appetite and 73
brain and 11,21,28,42,44,75,137
formation of 28-31,32-33,111,185
functions of 11,21,28,45,62
insulin and 23,35,72,115,153
kidney function and 77
pregnancy and 171
protein breakdown and 46-47
uric acid and 76
use of 21,28,35,38,40-41
Ketosis
amino acids and 107
definition of 32
exercise, see post-exercise ketosis
gender differences, see gender
differences
glutamine and 306
hydroxycitric acid and 304
insulin resistance and 72,153
measurement of 33-34,162-163
post-workout carbohydrate and 271
protein sparing and 45-48
pyruvate and 299
Ketonemia 33-34,225
carbohydrate intake and 53
Ketonuria 33-34
caloric loss via 28,33,64
Ketostix (tm), see ketosis, measurement of
Kidney
ammonia and 47,78
gluconeogenesis and 20,43
glutamine and 43
ketones and 77
nitrogen sparing and 46
stones 77
L
Lactate
buffering of 183,200,203,214
fatigue and 183,200,203,214,268
FFA release and 186-187,226
gluconeogenesis and 39,42-44,183
glycogen resynthesis and 121,132
GH and 201,211
ketogenic diet and 193-194,203,276
muscle growth and 209
production of 175,177,183,191,200,
202,251
Lactate threshold 180,182-183,191,200
adrenaline threshold and 190
bodybuilders and 242,281
determination of 242
FFA utilization and 186
training and 184,200,218,242,245
Lactic acid, see lactate
Low density lipoprotein (LDL) 74
Lean body mass
body composition and 88
carb-load and 142
carbohydrates and 132-133,135
definition of 87
essential and non-essential 107
gaining 155
loss of 60,65-66,68,231,233
measurement of 108
metabolic rate and 233
protein intake and 67,108-109
water loss and 62,233
Leucine 188
Linoleic acid (LA) 113,290
alpha-linolenic acid (ALA) 113,290
M
Macronutrients
carbohydrate, see carbohydrate
fat, see fat
intake on ketogenic diet 101-103
ketosis and 52-54
thermic effect of feeding and 93
protein, see protein
ratios during carb-load 142
Magnesium, see electrolytes
Metabolic rate
components of 92-93
dieting and 64,67,98,148,231,233
energy balance and 91
ephedrine and 292
exercise and 98,231-232
fat intake and 113
ketogenic diet and 48,61,64,102
lean body mass and 230,232-233
maximum allowed deficit and 98
protein intake and 67
321
thyroid and 25,47-49
Monoamine oxidase inhibitor (MAOI) 295,297
N
Nitrogen
balance of 56-59,109
kidney and 46
losses of 43-46,48,58,109
protein and 44,55-59,67,107-109
retention 135
sparing 47-48,54-56,58,60
Non-insulin dependent diabetes mellitus
(NIDDM), see diabetes
Noradrenaline, see catecholamines
O
Oleic acid 290
Omega-3 fatty acids 290
Omega-6 fatty acids 290
P
Peptides 107
pH
buffering of low 34,203,214
force production and 214
FFA release and 186
ketoacidosis and 34,35
ketone infusion and 47
ketosis and 34,35,203
lactic acid and 183
nitrogen sparing and 47
uric acid stones and 77
Polysaccharides 104
Polyunsaturated fats, see unsaturated fats
Potassium, see electrolytes
Powerlifting
aerobic exercise and 181,275
bodybuilding versus 207-208
ketogenic diet and 273
training and 207,213,254
Pregnancy 170-171
Protein
aerobic exercise and 180,187-188
appetite and 73
biological value (BV) 107
bodily stores 19,181
caloric intake and 60,108,135
calcium loss and 80
carb-load and 134-135,139,141-143
carbohydrates and 56,107-109
digestion of 107
glucagon and 24,53
gluconeogenesis from 20,39,43-44,49
insulin and 23,53
intake of 57,102-103,108-110,270
ketosis and 38,45,52-53,106,110,155
kidney damage 77,169
post-workout 126-127,271,284-285
requirements 55-56,58,107-109,
117,188
sparing, see nitrogen sparing
synthesis 23,25,98-99,137-140,155,
208,210-211,231
thermic effect of 93
uric acid and 76
uses of 107
Protein sparing modified fast (PSMF) 6364,171
Pyruvate
glycolysis and 178,183,200
supplements 299
R
Resting energy expenditure (REE) 92
Respiratory quotient (RQ)
ketogenic diet and 193,195
glycogen supercompensation and 193
S
Saturated fatty acids 75,111,113-114,148,
170,290
Sodium, see electrolytes
Standard ketogenic diet (SKD) 101-118
carbohydrate intake, see
carbohydrate
chromium and 302
endurance athletes and 124,276-277
exercise and 85,123-124,168,215,
236,245
fat intake, see fat
glycogen levels and
glycogen resynthesis and 121
lean body mass and 68
protein intake, see protein
Starvation, see fasting
response 231
Sucrose 104-105,126-127,133,150,271,309
T
Targeted ketogenic diet (TKD) 124-127
322
carbohydrate intake, see carbohydrate
creatine and 307
CKD and 271
exercise and 120,122,124,126,168-169,
189,236,242,245,260,264,277
fat intake, see fat
glycogen levels and 120
glycogen resynthesis and 121-122
protein intake, see protein
Thermic effect of activity (TEA) 92
Thermic effect of feeding (TEF) 92,94
Thermogenesis 292,294
unsaturated fats and 114,148
Thyroid hormones
ECA and 295
carbohydrates and 48,139,212
metabolic rate and 49
protein sparing and 48
protein synthesis and 48,138
L-tyrosine and 296,298
Triglyceride (TG)
blood 74-75
breakdown of 29-30,44,138,185
dietary, see fat
intramuscular 181,186-188
storage 138
Tripeptides 107
U
Unsaturated fatty acids
carb-load and 141
cholesterol and 76,114,170
EFAs and 113
fat loss and 114,148
Uric acid 77-78
V
Vanadyl sulfate 303
pre-contest carb-up 285
Vitamins, see micronutrients
W
Water intake
endurance athletes and 277
ketosis and 115,162
kidney stones and 77
pre-contest preparation and 282-286
uric acid stones and 77
Weight, see also bodyweight
323
bodyfat, see bodyfat
energy balance, see caloric intake
Weight training
adaptations to 206-207
aerobic exercise and 217,239
body composition and 87-88
catecholamines and 211-213,226
cortisol and 212
detraining and 219
endurance training and 217-218
energy production 177-178,213
fat loss 97,229-233,235
fatigue 124,213-215
gender differences, see gender
differences
glycogen depletion during 122,129
GH 211,219,253
guidelines and definitions 247-257
IGF-1 and 212
ketogenic diet and 214,216
metabolic rate and 232
muscle growth and 98,138,208211,213
post-exercise ketosis 226
protein intake and 60,110
sample workouts 260-269
shift in fiber type 175
testosterone and 211-212
warm-up 254-255
Y
Yohimbe 296-298
aerobics and exercise and 281


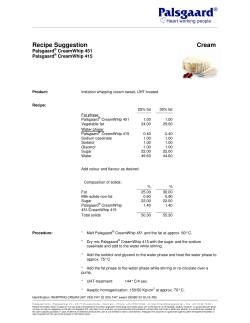


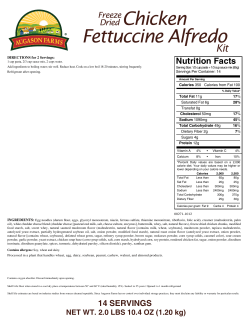


© Copyright 2026