
The Shootout at the OK N
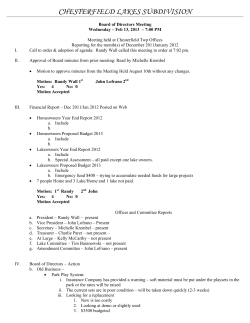
Pee
N
____
_
The Shootout at the OK N-P
Corral Lagoon
D. W. Schindler
Redfield Ratio
16N:1P (moles), 7N:1P (wt)
Redfield, A.C., The biological control
of chemical factors in the environment,
American Scientist, 1958
Dedicated to
Val Smith
Experimental Lakes Area (ELA)
Winnange
Lake
L261
L382
L 223
L226
L227
L302
L114
L303
L239
ELA Station
Teggau
Lake
ASLO 1971
Shootout at the C-P
Lagoon
The detergent
industry
promoted the view
that carbon, not
phosphorus caused
eutrophication,
based on bottle,
mesocosm and
nutrient ratio studies
that showed carbon
to be limiting.
Lake 227
Before nutrient addition
After adding P+N
(1969-1988)
or P alone (1989-2014)
Proc. Nat. Acad. Sci. USA
Eutrophic Lakes
Oligotrophic Lakes
Carbon limitation did not mean that Carbon control was necessary.
First Shootout at the N-P Lagoon-SIL 1974
L 226N
P+N+C
L 226S
N+C
Schindler Science 1974
Nitrogen Limited
in bottles
ELA Whole-Lake Nutrient Experiments
Total 79 Lake-Years of nutrient additions
Increased Loading
Reductions in Loading
Phosphorus, no N
Phosphorus
Lake 261, 1973-1976
Lake 303, 1977Lake 227, 1989-2014
Lake 261, 1977Nitrogen , no P
Lake 304, 1973-4, 1977Lake 226SW, 1973-1980
Lake 226NE, 1981Lake 302N, 1981-1986
Nitrogen
Lake 304, 1973-74
Lake 227, 1989-2014
Phosphorus + nitrogen
Lake 302N, 1987Lake 227, 1969-1988
Lake 226SW, 1981Lake 304, 1971-1972 &75-76
Lake 303, 1975-1976
Lake 226NE, 1973-1980
ELA Lakes-Summary of Responses
Additions
Adding N +P gave rapid positive response.
Adding N-deficient N+P gave slower positive response.
Adding P alone gave very slow, but positive response.
Adding N without P did not cause a response.
Deletions
If P or P+ N was reduced, algae tracked the decline in P,
leaving excess NO3 (denitrified).
If N alone was reduced, no change occurred in biomass.
High N:P
Low N:P
Low N:P
10 Meter Diameter
Levine and Schindler 1992 Limnol. Oceanogr. 37: 917-935.
Nitrogen Control Theory Resurfaces
like a Phoenix in the New Millenium
Control of Lacustrine Phytoplankton by Nutrients: Erosion of
the Phosphorus Paradigm. W. M. Lewis, Jr. and W. A.
Wurtsbaugh 2008. Internat. Rev. Hydrobiol. 93 (4–5) 446–465.
Controlling eutrophication: Nitrogen and phosphorus.
DJ Conley et al. 2009. Science 323: 1014-1015.
Algal blooms:
Noteworthy nitrogen.
.
H. Paerl et al. 2014. Nature 346: 175. .
Where P control has worked – partial list of case histories
Lake Erie
Lake Ontario
There are NO examples of
Lake Michigan
where decreasing
Lake Huron
Lake Superior
Lake Onondaga, NY
Lake Geneva, Switzerland
successfully
Lake Lucerne, Switzerland
reduced eutrophication
Lake Zurich, Switzerland
Lake Constance, Switzerland
Lake Norrviken, Sweden
Lake Malaren, Sweden
Conclusion: P paradigm has
Lake Hjalmaren, Sweden
increased in strength, not
Lake Vattern, Sweden
Lake Vanern, Sweden
eroded!
Lake Mjosa, Sweden
Schindler 2012 Proc. Roy.
Gravenhurst Bay, Muskoka
Soc. London (B) 279: 4322Kootenay Lake, BC
Moses Lake, Washington
4333.
Several ELA lakes
Stockholm Archipelago -G. Brat tberg, Vatten 42, 141-153 (1986)
nitrogen loading has
of a lake!
Moses Lake Washington
“Long-term, whole lake experiments in which the
nutrient inputs are manipulated and the lake
response in situ is observed are the only reliable
way to judge the relative importance of each
nutrient.”
“…. Targeting both N and P may not only be much
costlier than necessary, but may even promote
blooms of N-fixing cyanobacteria, especially in
cases of high internal P loading.”
E. B. Welch 2009 Lake Reserv. Manage.
Mean phosphorus concentrations in Lake Norrviken
after diversion of sewage effluents in 1969.
I. Ahlgren 1977.
Dove and Chapra 2015 Limnol. Oceanogr. 60(2) (in press)
Total P, mg/m3
Great Lakes do not need N control!
Chl a mg/m3
Dove and Chapra 2015 Limnol. Oceanogr. 60(2) (in press)
Proximate nutrient limitation- where nutrient addition
stimulates a biological process, such as productivity.
Ultimate nutrient limitation- where additions of a
nutrient can change ecosystem properties.
Vitousek et al. 2010. Terrestrial phosphorus limitation:
mechanisms, implications,and nitrogen–phosphorus
interactions. Ecological Applications 20(1): 5–15.
The Message for Limnologists and Oceanographers:
Results of short-term bioassays (hours to months)
are proximate measures. They are unlikely to accurately
predict the long-term response of ecosystems to
nutrient addition or removal.
Using results from nutrient additions to predict the
results of nutrient removal may not be valid, due to hysteresis.
Twisted Nitrogen Logic in Proximate Assays:
1. When carbon was limiting in bottle bioassays,
we didn’t conclude that carbon must be controlled.
2. If silica was limiting, we didn’t conclude that silica
must be controlled.
3. Then why do we conclude that if nitrogen is limiting,
it must be controlled?
A culturally-eutrophic lake is proximately
nitrogen-limited because it has been
over-fertilized with phosphorus.
HIGH
N:P
N:P
Low
No N
Schindler et al 2008
PNAS 105: 11254-11258,
Paterson et al. 2011
L&O 56: 1545-1547.
224
Refuting more nonsense.
Decrease in N is entirely due
to the DON fraction, not
denitrification
224 in 2013
Nfix+Nfrt (110kg/yr)
200
200
N F ixa tio n
N F ixa tio n
N F e rtiliz a tio n
N F e rtiliz a tio n
N (kg)
N (kg)
150
150
100
100
50
50
0
0
1975
1975
1980
1980
1985
1985
1990
1990
1995
1995
2000
2000
2005
2005
2010
2010
era r
YY
ea
Fixation is now similar to the sum of fertilizer+ fixation
in the 1980s, and is still increasing.
Lake 227 Nitrogen Flux to Water Column. Lehnherr 2013.
%
23
9
33
52
3
12
Total 427
Denitrification is unmeasurable. No measurable nitrate is
present in summer. N:P in Total Nutrient Load = 427/24.5 = 17.4 (wt)
Lessons from the Experimental Lakes
Short-term nitrogen limitation does not mean that
nitrogen must be controlled, it means the lake has
been overfertilized with phosphorus.
Bottle bioassays tell us nothing about the long-term
(years) processes that correct deficiencies
of nitrogen and carbon in whole lakes. MetaAnalyses do not make them ecosystem scale.
Mesocosms can tell some features of a lake’s
response, but still underestimate slow biogeochemical processes and successional changes.
The Costs of a Mistake are Huge
Baltic Sea
“The costs to reduce 15,016 t/yr of P and 133,170 t/yr
of N according to HELCOM would be 3300 million
Euro/yr (0.45 trillion $US). That is 2900 million
Euro/yr higher than the “optimal” strategy advocated
in this work.” (P alone control = 400 million Euros).
Lars Hakanson 2009.
Lake Winnipeg (5% of P loading)
New treatment costs to remove
N and P from Winnipeg sewage = $365 Million.
Emperor Nitrogen
is very scantily
clad!
You are living
in a
House of
Cards,
Boys!
On close inspection,
Phoenix turns out
To be Icarus.
N
N
Proposal: A NEW SHOOTOUT AT THE N-P LAGOON:
A POSSIBLE SOLUTION FOR VANILLA ASLO MEETINGS?
Rules:
Only ecosystem scale experiments or case histories where
N or P has been decreased for several years.
Bottles, mesocosms and nutrient ratio data are prohibited.
Each paper 40 min, followed by 20 minutes of debate.
Lakes at first shootout, coastal waters at second.
Any hands not holding a weapon will be tied, to prevent
hand- waving!
Mesocosm Experiments-Deficiencies
• Cannot assess ecosystem phenomena that require
months or years to adapt, ie some successional and new
sediment-water equilibria.
• Are difficult to scale to properly assess sediment-water
and hypolimnion-epilimnion exchanges.
Conclusion: Can point the direction of
response if properly scaled ( a big if).


© Copyright 2026