
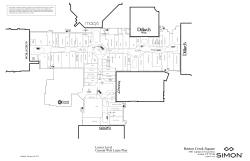
BRAZIL
Fig. 1: Employment by Major Economic Activity
('000s), 2002-2007
100,000
Agriculture, Forestry,
Fishing
Mining and Quarrying
90,000
Manufacturing
80,000
Electricity, Gas and
Water Supply
70,000
Construction
60,000
Wholesale and Retail
Trade
Hotels and
Restaurants
50,000
Transport, Storage,
Communications
40,000
Business Services
30,000
Public Administration,
Defence
Education
10,000
Health and Social
Work
Social and Personal
Services
0
2002
2004
Other Services
2006
Source: ILO Laborsta; Persons aged 10 years and over. Sep. of each year. 2003: Break. Prior to 2003: Excl.
rural population of Rondõnia,Acre, Amazonas, Roraima, Pará and Amapá.
Fig. 2: Sectoral Value Added
(Million Reals, Current Prices)
900,000
800,000
Public Admin, Health
& Education
Real Estate & Bus.
Serv.
700,000
Other Services
600,000
Financial Services
500,000
Information Services
400,000
Transport, Storage &
Communication
300,000
Wholesale & Retail
Trade
200,000
Utilities
100,000
Construction
Manufacturing
Q1-2010
Q3-2009
Q1-2009
Q3-2008
Q1-2008
Q3-2007
Q1-2007
Q3-2006
Q1-2006
Q3-2005
Q1-2005
Q3-2004
Q1-2004
Q3-2003
Q1-2003
Q3-2002
Q1-2002
Q3-2001
Q1-2001
Q3-2000
0
The agriculture sector serves as the backbone of Brazil’s economy, with nearly 70 per cent of the
country’s land suitable for cultivation. Agriculture comprises approximately 6 per cent of Brazil’s total
GDP and accounts for more than 18 per cent of the country’s total workforce (see Figs.1 & 2). The
number of workers in agriculture, Brazil’s largest employment sector, has exceeded 16 million since
2002, reaching a peak level of nearly 17.5 million workers in 2005. Since then, employment has
declined, reaching 16.2 million workers in 2007 (see Fig. 3).
Production of sugar cane, the country’s largest crop, increased from nearly 390 million tons in 2003 to
more than 690 million tons in 2008. Soybean production has also increased from 51.5 million tons in
2003 to nearly 60 million tons in 2008. Other important crops in terms of production include wheat and
maize which are important for livestock production. Brazil is the second largest beef producing country,
after the United States. The share of agricultural production in Brazil’s exports has typically averaged
around 25 per cent, although it climbed to 31 per cent in 2008, with the composition of exports affected
by a shift in demand from products such as coffee and orange juice to a larger demand for soybeans,
sugar and livestock products. While the European Union and United States remain the largest export
markets, an increasing share of Brazil’s agricultural exports are to developing and emerging markets
including Argentina and China. The majority of agricultural production in Brazil, however, serves the
domestic market.
Foreign direct investment flows in the agricultural sector reached 71 million in 2002, with investments
coming mainly from the Netherlands, Germany, the United States, and neighbouring Latin American
countries including Argentina and Uruguay. The structure of employment in the Brazilian agricultural
sector is mainly characterized by small holder producers, with more than 75 per cent of farms
employing less than 4 workers. In contrast, large-scale agricultural establishments employing 500 or
more workers account for more than 35 per cent of employment within the industry. While the structure
of the industry is mainly comprised of small scale farming operations, employment levels are
concentrated in large scale enterprises.
Working conditions for employees within
the sector show that Brazil’s agricultural
labour force on average works longer
hours for lower wages as compared to
the overall economy. Average monthly
earnings for agricultural workers were
409 real in 2003, compared to an
average of 885 real per month across
the total economy. While hours of work
have in contrast been slightly higher,
measuring on average, 43.8 hours per
week in 2007 compared to 41.3 hours
per week for all major economic
activities.
Fig. 3: Employment in Agriculture
('000s), 2002-2007
19,000
17,000
15,000
13,000
11,000
9,000
7,000
5,000
2002
2003
2004
2005
2006
2007
Source: ILO Laborsta; Persons aged 10 years and over.
Mining
Agriculture, Forestry
& Fishing
Source: IBGE. Natiional Accounts.
Sectoral Activities Department
BRAZIL
20,000
Q1-2000
Agriculture
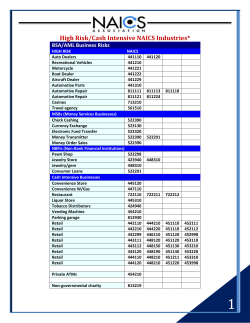
Key Labour Market Indicators (2009)
Manufacturing: Food, Beverages & Tobacco
Fig. 4: Employment in Manufacturing and
Food , Bev. & Tobacco ('000s), 2002-2007
14,000
1,800
12,000
1,600
1,400
10,000
1,200
8,000
1,000
6,000
800
600
4,000
400
2,000
200
0
0
2002 2003 2004 2005 2006 2007
Food, Bev. & Tobacco (right-axis)
Manufacturing
Source: ILO Laborsta; Persons aged 10 years and over.
Economically Active Population:
Total: 23,148,000
Men: 12,502,000
Women: 10,647,000
The manufacturing industry, Brazil’s third largest
employment sector overall, employed more than 13 million
workers in 2007, increasing from 10.6 million workers in
2002, and contributed more than 13 per cent to GDP in
2008 (see Figs. 1 & 2). Major sub-sectors in Brazilian
manufacturing include apparels and textiles, chemicals and
chemical products, and fabricated metal products. However,
the food, beverages and tobacco industry represents the
largest manufacturing sub-sector in the country, with a
production value of more than 10.8 billion USD.
Labour Force Participation Rate:
Total: 56.7%
Men: 66.0%
Women: 48.6%
Unemployment Rate:
Total: 8.1%
Men: 6.5%
Women: 9.9%
Employment in food, beverages and tobacco manufacturing
reached 1.5 million in 2007, accounting for more than 15 per
cent of manufacturing sector employment. Between 2002
and 2007, employment increased at an average annual rate
of 3.8 per cent while total manufacturing employment grew
at an average annual rate of 4.5 per cent (see Fig. 4).
Brazil is the world’s leading producer and exporter of refined sugar and
alcohol, and the leading exporter of processed meat, orange juice and
instant-coffee. Exports of Brazilian tobacco reached 2.6 billion USD in 2008,
up from 1.5 billion USD in 2003, while exports in refined cane sugar
increased from 0.8 billion USD in 2003 to nearly 2 billion USD in 2008.
Manufactured soybean oil and orange juice exports also increased over the
same period from 1.1 billion USD and 0.3 billion USD to 1.9 and 0.8 billion
USD, respectively.
FDI in the food, beverage and tobacco industry reached 1.9 billion USD in
2002. Major foreign companies including Nestlé, Syngenta, Kraft, Cargill,
Pepsi and Coca-Cola have entered the industry. However, the industry is also
characterized by important Brazilian food companies such as JBS, the largest
multi-national food company.
National companies such as Guarana
Antarctica and Dolly also retain important market shares in the beverage
industry. Despite the presence of large, often foreign-owned enterprises
employing more than 500 workers, the structure of the food, beverage and
tobacco industry is driven by the small and medium enterprises that comprise
more than 85 per cent of companies in the sector. Large enterprises do
contribute significantly to overall employment in the industry, especially within
the tobacco and beverage manufacturing sub-sectors.
Working time in the food, beverage and tobacco industry, at 45.8 hours per
week, was slightly higher than the national averages for manufacturing and
the total economy, which were 43.6 and 41.3 hours per week, respectively in
2007. Manufacturing wages averaged 902 real per month in 2002, above the
national average for all major economic activities which was 885 real per
month in that year.
Sectoral Activities Department
17,000
Fig. 5: Employment in Wholesale & Retail
Trade ('000s), 2002 - 2007
16,500
16,000
15,500
15,000
14,500
14,000
13,500
13,000
12,500
12,000
2002
2003
2004
2005
2006
Commerce is one of the most dynamic sectors in
Brazil. Boosted by high economic growth and an
expanding GDP, rising consumer incomes and
spending, Brazil’s retail industry has experienced
dramatic growth over the last decade. As an emerging
middle-income economy, Brazil is experiencing a rise
in income levels that will drive consumption growth, in
turn facilitating increased employment in commerce.
The more than 16 million people employed in the
sector in 2007, represented an increase of nearly 3
million workers since 2002 (see Fig. 5). The second
largest employment sector after agriculture, commerce
employment has been growing at a 3.7 per cent
average annual rate, compared to the national allindustry average of 2.8 per cent between 2002 and
2007.
2007
Brazil’s 2008 merchandise exports exceeded USD 197
billion, with imports over USD 182 billion. Main trading
partners include the European Union, the United States, China and Argentina. Domestically, food sales
presently comprise more than 50 per cent of retail sales, but, in keeping with the normal changing patterns of
expenditure related to rising incomes, the share of consumer expenditure on non-food and other basic items
is increasing, including on apparel, pharmaceuticals and automotive products.
Source: ILO Laborsta; Persons aged 10 years and over.
Small businesses dominate the retail market, with the majority of firms employing fewer than four workers.
However, a few large retail chains, notably Brazil’s Pao de Açucar, the French retailer Carrefour and the USbased retailer Wal-Mart are increasing their market shares, although the overall retail market is considered
relatively mature and consolidated for an emerging market. FDI flows in the sector reached more than USD
1.5 billion in 2002, with investment mainly from France, the Netherlands, Germany, the US and neighboring
Latin American countries. Brazilian companies are responding to competition from foreign companies by
improving their operations, adopting new, more modern retail formats, and expanding their store networks.
In terms of working conditions, wages lag behind the national all-industry average. The 2002 retail average
wage of 565 real per month was substantially lower than the all-industry average of 885 real per month. In
contrast, average working time in commerce, at 44.6 hours per week in 2007, is much higher than the allindustry average of 41.3 hours per week.
Other Sources: Central Bank of Brazil; Instituto Brasileiro de Geografia e Estatística (IBGE); UNCTAD.
BRAZIL
The Ministry of Agriculture, Livestock and Food Supply also reports that 30
per cent of the Brazilian economy is either directly or indirectly connected to
the food and beverage industry with 17 million rural and urban jobs involved
in machinery manufacture, processing, marketing and distribution.
Wholesale & Retail Trade
Brazil
Table 1: Value added GDP by Major Activity, (Constant Prices, Million Reals) ) & % Share in Total Value Added
2000
2001
2002
2003
2004
2005
2006
2007
2008
2009
294,870.3
325,534.0
369,455.5
424,987.0
485,374.5
536,809.8
592,370.8
665,336.0
751,220.3
785,753.8
100.0%
100.0%
100.0%
100.0%
100.0%
100.0%
100.0%
100.0%
100.0%
100.0%
Agriculture, Forestry &
Fishing
14,310.3
16,704.8
21,063.0
27,154.8
28,798.5
26,290.8
27,891.3
31,816.8
37,817.0
40,988.3
4.9%
5.1%
5.7%
6.4%
5.9%
4.9%
4.7%
4.8%
5.0%
5.2%
Mining
4,067.8
4,113.5
5,104.8
6,312.5
7,999.5
11,342.0
14,716.3
13,417.3
20,663.0
8,978.3
1.4%
1.3%
1.4%
1.5%
1.6%
2.1%
2.5%
2.0%
2.8%
1.1%
Manufacturing
43,983.5
47,911.8
53,640.5
66,238.8
80,056.0
83,324.0
88,346.8
97,405.0
99,937.3
104,697.3
14.9%
14.7%
14.5%
15.6%
16.5%
15.5%
14.9%
14.6%
13.3%
13.3%
14,091.0
14,871.5
16,804.8
17,233.5
21,217.0
22,556.8
24,072.0
27,800.3
32,051.5
34,344.5
4.8%
4.6%
4.5%
4.1%
4.4%
4.2%
4.1%
4.2%
4.3%
4.4%
8,688.3
8,396.5
10,551.5
12,591.3
16,170.8
17,597.8
19,103.5
20,447.8
22,083.0
23,591.3
2.9%
2.6%
2.9%
3.0%
3.3%
3.3%
3.2%
3.1%
2.9%
3.0%
27,068.8
29,886.0
32,347.8
38,940.0
45,940.8
51,448.5
58,402.0
69,342.8
79,418.8
80,266.0
9.2%
9.2%
8.8%
9.2%
9.5%
9.6%
9.9%
10.4%
10.6%
10.2%
12,435.3
14,109.0
15,252.5
17,188.5
19,584.0
22,869.3
24,664.0
27,445.8
32,482.3
34,503.5
4.2%
4.3%
4.1%
4.0%
4.0%
4.3%
4.2%
4.1%
4.3%
4.4%
9,206.8
9,779.8
11,342.5
13,337.5
16,036.5
18,309.5
19,256.5
21,932.8
23,121.0
24,616.3
3.1%
3.0%
3.1%
3.1%
3.3%
3.4%
3.3%
3.3%
3.1%
3.1%
Financial Services
15,226.8
19,042.3
23,763.5
26,055.8
24,225.3
32,484.3
36,604.8
43,902.0
48,287.3
48,994.5
5.2%
5.8%
6.4%
6.1%
5.0%
6.1%
6.2%
6.6%
6.4%
6.2%
Other Services
39,354.0
41,590.3
46,395.0
51,589.5
57,636.0
63,560.0
73,668.8
81,410.0
90,736.5
105,124.0
13.3%
12.8%
12.6%
12.1%
11.9%
11.8%
12.4%
12.2%
12.1%
13.4%
28,849.8
29,856.0
32,585.3
35,442.3
37,793.5
41,481.5
44,034.5
48,614.3
52,089.8
56,847.3
9.8%
9.2%
8.8%
8.3%
7.8%
7.7%
7.4%
7.3%
6.9%
7.2%
38,130.3
43,392.0
49,432.0
55,569.3
61,106.5
69,299.0
77,845.3
88,431.0
100,389.3
112,574.0
12.9%
13.3%
13.4%
13.1%
12.6%
12.9%
13.1%
13.3%
13.4%
14.3%
Total GDP
Construction
Utilities
Wholesale & Retail
Trade
Transport, Storage &
Communication
Information Services
Real Estate & Bus.
Serv.
Public Admin, Health &
Education
Source: IBGE.
Notes: Sectors are classified according to the national classification of industrial sectors as reported by the national source. Sum of individual sectors may not equal total due to
rounding and other adjustments introduced by the national source.
Share in Sectoral Value Added, 2000
Public Admin,
Health &
Education 12.9%
Share in Sectoral Value Added, 2008
Agriculture,
Forestry & Fishing
4.9%
Mining 1.4%
Real Estate &
Bus. Serv. 9.8%
Public Admin,
Health &
Education 13.4%
Manufacturing
14.9%
Agriculture,
Forestry & Fishing
5.0%
Mining 2.8%
Manufacturing
13.3%
Real Estate &
Bus. Serv. 6.9%
Construction
4.3%
Construction
4.8%
Other Services
13.3%
Source: IBGE.
Wholesale &
Retail Trade
10.6%
Wholesale &
Retail Trade 9.2%
Financial Services
5.2%
Information
Services 3.1%
Utilities
2.9%
Other Services
12.1%
Utilities
2.9%
Financial Services
6.4%
Transport, Storage
& Communication
4.2%
Source: IBGE.
1
Information
Services 3.1%
Transport, Storage
& Communication
4.3%
Table 2: World Merchandise Exports (Thousand USD, Current Prices)
2000
2001
2002
2003
2004
2005
2006
2007
2008
2009
Total All Products
55,118,914.0
58,286,592.8
60,438,649.9
73,203,221.8
96,677,246.4
118,528,688.1
137,806,190.3
160,648,869.7
197,942,442.9
152,994,742.8
All Food Items
12,807,691.5
16,012,833.6
16,779,364.9
20,886,644.8
26,955,232.2
30,432,088.3
34,341,254.2
42,125,122.9
54,303,267.8
51,850,818.9
11,896,114.9
15,011,197.8
15,738,120.5
19,749,608.4
25,478,183.5
28,657,523.5
32,515,743.1
39,783,912.8
51,450,616.4
48,706,820.6
Food
Beverages & Tobacco
Agricultural Raw Materials
Ores, Metals, Precious Stones & Non-Monetary
Gold
Ores & Metals
Fuels
Coal, Coke, & Briquettes
Petroleum, Petroleum Products & Related Materials
Gas, Natural & Manufactured
911,576.6
1,001,635.7
1,041,244.3
1,137,036.3
1,477,048.7
1,774,564.8
1,825,511.1
2,341,210.1
2,852,651.4
3,143,998.3
2,656,779.1
2,426,759.9
2,406,527.9
3,329,209.4
3,912,324.1
4,620,148.4
5,186,433.8
6,161,655.0
7,096,425.6
5,808,279.7
6,053,083.1
5,435,831.4
5,744,668.0
6,668,596.6
9,166,616.9
12,428,125.1
16,641,650.8
19,808,364.1
26,481,026.4
20,498,507.1
5,574,457.5
5,007,712.2
5,282,562.1
6,246,648.0
8,642,319.4
11,857,558.7
15,868,815.2
18,886,144.2
25,330,627.6
19,002,394.9
908,356.8
2,092,485.9
2,951,212.7
3,796,184.7
4,421,889.2
7,100,399.3
10,590,271.3
13,296,908.2
18,689,262.4
13,657,483.2
226.3
206.3
287.5
259.8
259.1
707.7
816.3
1,070.1
1,333.2
573.2
905,995.0
2,091,626.0
2,931,186.6
3,769,412.6
4,405,676.4
7,044,225.4
10,574,838.5
13,271,056.2
18,635,931.8
12,552,181.6
2,135.5
653.6
19,738.6
26,512.3
15,953.8
55,466.1
14,616.5
24,599.5
4,871.6
8,641.2
Electric Current
:
:
:
:
:
:
:
182.3
47,125.8
1,096,087.2
Manufactured Goods
31,619,401.3
31,132,627.8
31,333,368.0
37,290,479.4
50,748,394.0
61,765,852.1
68,430,971.5
74,972,442.5
86,545,715.3
58,380,036.7
Chemicals
3,565,101.5
3,237,623.9
3,623,836.0
4,395,703.1
5,755,638.8
7,302,815.7
9,275,803.6
10,681,553.3
12,627,130.8
10,485,984.8
Machinery & Transport Equipment
15,416,315.7
15,618,238.0
14,744,643.2
17,016,186.6
24,277,176.6
30,560,065.3
33,405,184.0
36,285,526.0
41,823,244.8
26,322,258.3
Iron & Steel
3,632,901.6
3,144,879.8
3,857,228.3
4,985,313.4
7,096,250.8
9,066,759.3
9,453,590.1
10,145,405.1
13,659,435.2
7,437,795.0
Textile Fibres, Yarn, Fabrics & Clothing
1,269,036.4
1,354,552.0
1,233,867.2
1,716,586.8
2,145,810.9
2,270,432.2
2,163,076.2
2,406,540.1
2,483,305.4
1,935,271.1
Other Manufactured Goods
12,637,984.1
12,276,765.9
12,964,888.9
15,878,589.7
20,715,578.6
23,902,971.1
25,749,983.8
28,005,363.2
32,095,339.7
21,571,793.6
Source: UNCTADStat. Data presented according to SITC Rev.3 and standard UNCTAD product groupings.
2
Table 3: World Merchandise Imports (Thousand USD, Current Prices)
2000
2001
2002
2003
2004
2005
2006
2007
2008
2009
Total All Products
55,850,546.4
55,601,756.9
47,242,654.1
48,325,649.7
62,835,613.5
73,600,375.5
91,342,783.5
120,620,871.2
173,196,633.8
127,647,330.8
All Food Items
3,664,855.5
3,163,010.5
3,169,108.0
3,383,995.9
3,028,743.1
3,209,855.0
4,095,229.1
5,553,987.7
7,556,996.3
6,708,023.8
3,510,123.1
2,993,497.2
3,019,782.3
3,235,278.0
2,855,784.1
3,008,874.4
3,820,762.3
5,216,382.1
7,189,335.0
6,301,087.3
154,732.4
169,513.2
149,325.7
148,717.9
172,959.0
200,980.6
274,466.8
337,605.6
367,661.4
406,936.6
1,097,099.0
750,492.5
705,823.8
843,673.8
1,105,992.1
1,131,055.3
1,391,388.8
1,712,179.1
2,133,237.7
1,499,595.9
1,714,028.3
1,616,848.3
1,320,678.9
1,582,358.0
2,435,654.0
2,844,583.7
4,589,109.5
5,840,192.3
7,479,397.4
3,612,368.8
1,706,631.9
1,609,979.1
1,318,087.2
1,579,394.8
2,431,608.0
2,840,497.8
4,584,959.8
5,834,150.8
7,463,436.1
3,602,320.2
8,289,681.8
7,725,858.9
6,981,437.9
7,460,231.3
11,448,435.4
13,464,840.7
17,141,451.7
22,319,644.7
34,287,503.8
18,864,120.6
635,256.6
706,320.2
795,269.8
950,112.4
1,424,456.0
1,649,112.8
1,746,068.4
1,837,630.3
3,693,312.7
2,261,941.2
6,741,686.0
6,255,263.1
5,448,101.5
5,764,763.7
9,039,285.7
10,753,704.5
13,619,639.0
18,340,897.5
26,840,408.0
14,192,395.6
Food
Beverages & Tobacco
Agricultural Raw Materials
Ores, Metals, Precious Stones & Non-Monetary
Gold
Ores & Metals
Fuels
Coal, Coke, & Briquettes
Petroleum, Petroleum Products & Related Materials
Gas, Natural & Manufactured
912,739.2
764,275.5
738,066.7
745,355.1
984,693.6
1,062,023.3
1,756,179.3
2,107,938.3
3,710,025.0
2,358,668.8
Electric Current
:
:
:
:
:
:
19,565.0
33,178.6
43,758.1
51,115.1
Manufactured Goods
41,084,866.1
42,345,530.9
35,064,881.6
35,055,348.6
44,816,789.0
52,949,976.4
64,125,604.5
77,121,573.1
121,738,852.7
96,963,210.2
Chemicals
9,999,330.1
10,213,087.0
9,576,789.8
10,494,903.2
13,833,824.6
14,643,190.7
16,482,242.3
22,920,634.6
33,979,118.2
25,250,283.4
Machinery & Transport Equipment
23,370,611.6
24,456,627.5
18,889,370.6
18,055,879.9
22,498,254.8
27,859,592.5
34,187,550.6
36,588,078.3
62,230,139.9
50,959,143.3
631,424.4
702,381.7
535,284.4
565,373.8
738,071.1
1,177,829.1
1,774,775.0
2,397,897.3
4,339,482.2
3,137,145.8
Textile Fibres, Yarn, Fabrics & Clothing
1,662,056.3
1,302,013.6
1,084,272.4
1,132,585.5
1,506,811.7
1,633,635.2
2,268,642.0
3,076,478.9
4,074,008.9
3,710,544.9
Other Manufactured Goods
7,714,924.4
7,675,816.3
6,598,721.2
6,504,565.5
8,484,709.6
10,447,193.2
13,455,811.5
17,612,860.2
25,529,594.5
20,753,783.6
Iron & Steel
Source: UNCTADStat. Data presented according to SITC Rev.3 and standard UNCTAD product groupings.
3
Table 4: Total Employment by Major Economic Activity (thousands) & % Share in Total Employment
2002
2003
2004
2005
2006
2007
78,958.9
80,163.5
84,596.3
87,189.0
89,318.0
100.0%
100.0%
100.0%
100.0%
100.0%
100.0%
15,952.5
16,225.2
17,330.0
17,387.0
16,864.0
16,207.2
20.2%
20.2%
20.5%
19.9%
18.9%
17.9%
324.0
343.0
403.9
444.0
400.0
371.7
0.4%
0.4%
0.5%
0.5%
0.4%
0.4%
254.5
313.0
325.4
318.0
343.0
378.5
0.3%
0.4%
0.4%
0.4%
0.4%
0.4%
10,678.1
10,877.4
11,723.6
12,336.0
12,497.0
13,105.1
13.5%
13.6%
13.9%
14.1%
14.0%
14.4%
313.7
332.4
353.6
359.0
396.0
362.7
0.4%
0.4%
0.4%
0.4%
0.4%
0.4%
5,616.1
5,219.8
5,354.4
5,642.0
5,837.0
6,107.0
7.1%
6.5%
6.3%
6.5%
6.5%
6.7%
Wholesale and Retail Trade
13,553.1
14,215.6
14,653.2
15,503.0
15,748.0
16,308.9
17.2%
17.7%
17.3%
17.8%
17.6%
18.0%
Hotels and Restaurants
2,931.7
2,892.9
3,023.1
3,187.0
3,395.0
3,350.9
3.7%
3.6%
3.6%
3.7%
3.8%
3.7%
3,692.2
3,724.6
3,894.2
3,967.0
4,064.0
4,374.0
4.7%
4.6%
4.6%
4.5%
4.6%
4.8%
982.6
1,025.2
999.7
1,007.0
1,071.0
1,181.4
Total Employment
Agriculture, Hunting and Forestry
Fishing
Mining and Quarrying
Manufacturing
Electricity, Gas and Water Supply
Construction
Transport, Storage, Communications
Financial Intermediation
90,786.0
1.2%
1.3%
1.2%
1.2%
1.2%
1.3%
4,261.5
4,494.1
4,719.7
4,937.0
5,431.0
5,499.3
5.4%
5.6%
5.6%
5.7%
6.1%
6.1%
3,870.7
3,989.9
4,203.9
4,267.0
4,452.0
4,504.2
4.9%
5.0%
5.0%
4.9%
5.0%
5.0%
Education
4,303.9
4,353.7
4,569.2
4,684.0
4,856.0
5,052.3
5.5%
5.4%
5.4%
5.4%
5.4%
5.6%
Health and Social Work
2,758.8
2,817.6
2,840.2
2,977.0
3,162.0
3,327.1
3.5%
3.5%
3.4%
3.4%
3.5%
3.7%
3,148.5
2,982.0
3,498.3
3,301.0
3,800.0
3,711.3
4.0%
3.7%
4.1%
3.8%
4.3%
4.1%
6,110.1
6,154.6
6,472.5
6,666.0
6,782.0
6,731.7
7.7%
7.7%
7.7%
7.6%
7.6%
7.4%
5.1
4.0
4.1
7.0
4.0
3.4
0.0%
0.0%
0.0%
0.0%
0.0%
0.0%
202.0
198.4
227.4
198.0
218.0
209.4
0.3%
0.2%
0.3%
0.2%
0.2%
0.2%
Real Estate, Rental, Business Services
Public Administration, Defence
Social and Personal Services
Private Households Employment
Extra-Territorial Organizations
Not classifiable by economic activity
Note: Persons aged 10 years and over. Sep. of each year. 2003: Break. Prior to 2003: Excl. rural population of Rondõnia,Acre, Amazonas, Roraima, Pará
and Amapá. Sectors are classified according to ISIC Rev.3, as reported in ILO Laborsta. Sum of individual sectors may not equal total due to rounding. Total
employment is comprised of all persons above a specific age who during a specified brief period were either in paid employment at work, with a job but not at
work, or self-employed. This category covers not only employees (wage earners and salaried employees), but also employers, own-account workers,
members of producers’ cooperatives, contributing family workers and workers not classifiable by status. Data are non-seasonally adjusted.
Source: ILO Laborsta.
4
Share of Employment by Sector, 2002
Private
Households
7.7%
Soc. &
Pers.Serv.
4.0%
Health &
Social Work
3.5%
Extra-Territ.
Org. 0.0%
Share of Employment by Sector, 2007
Private
Households
7.4%
Soc. &
Pers.Serv.
4.1%
Not classifiable
0.3%
Agr. Hunting &
For.
20.2%
Education
5.5%
Not classifiable
0.2%
Agr. Hunting &
For.
17.9%
Health & Social
Work 3.7%
Fishing
0.4%
Education
5.6%
Fishing
0.4%
Mining &
Quarrying
0.3%
Public Admin.
& Defence
4.9%
Extra-Territ.
Org. 0.0%
Mining &
Quarrying
0.4%
Manufacturing
14.4%
Public Admin.
& Defence
5.0%
Manufacturing
13.5%
Real Estate &
Bus. Serv.
6.1%
Real Estate &
Bus. Serv.
5.4%
Electricity, Gas
& Water Supply
0.4%
Fin. Int. 1.2%
Transport,
Storage, Com.
4.7%
Hotels & Rest.
3.7%
Source: ILO Laborsta.
Wholesale &
Retail Trade
17.2%
Construction
7.1%
Electricity, Gas
& Water Supply
0.4%
Construction
6.7%
Fin. Int.
1.3%
Transport,
Storage, Com.
4.8%
Hotels & Rest.
3.7%
Wholesale &
Retail Trade
18.0%
Source: ILO Laborsta.
Table 5: Paid Employment in Manufacturing (thousands)
2002
2003
2004
2005
2006
2007
Recycling
26.0
41.0
50.0
63.0
61.0
68.9
Furniture; Manufacturing NEC
542.0
506.0
520.0
544.0
528.0
561.1
Other Transport Equipment
79.0
83.0
103.0
98.0
120.0
108.9
Motor Vehicles, Trailers and Semi-Trailers
377.0
408.0
441.0
484.0
479.0
506.6
Precision Instruments, Watches and Clocks
81.0
85.0
93.0
96.0
109.0
88.3
Communication Equipment and Apparatus
97.0
90.0
121.0
112.0
114.0
136.6
Electrical Machinery, Apparatus NEC
103.0
110.0
164.0
170.0
140.0
121.5
Office, Accounting, Computing Machinery
28.0
33.0
31.0
45.0
30.0
41.7
Machinery and Equipment NEC
444.0
514.0
582.0
598.0
560.0
647.9
Fabricated Metal Products NEC
523.0
502.0
570.0
525.0
608.0
747.3
Basic Metals
254.0
284.0
289.0
312.0
344.0
356.2
Other Non-Metallic Mineral Products
532.0
475.0
514.0
543.0
534.0
528.0
Rubber and Plastics Products
257.0
279.0
300.0
347.0
339.0
359.5
Chemicals and Chemical Products
506.0
619.0
685.0
619.0
678.0
788.4
Petroleum Refining and Related Products
113.0
107.0
125.0
116.0
111.0
183.1
Printing and Publishing
300.0
308.0
318.0
327.0
334.0
329.6
Paper and Paper Products
157.0
172.0
182.0
168.0
190.0
220.4
Wood and Wood Products
434.0
402.0
452.0
426.0
439.0
405.7
Leather Products and Footwear
614.0
685.0
735.0
708.0
745.0
786.3
Clothing
684.0
737.0
839.0
868.0
875.0
911.1
Textiles
468.0
350.0
366.0
397.0
410.0
446.7
Tobacco Products
18.0
18.0
17.0
16.0
13.0
16.5
1,273.0
1,204.0
1,366.0
1,410.0
1,479.0
1,541.3
Food Products & Beverages
Note: Persons aged 15 years and over. Excl. armed forces. Sectors are classified according to ISIC Rev.3, as reported in ILO Laborsta. Sum of
individual sectors may not equal total due to rounding. Paid employment refers to workers in jobs where the incumbents hold explicit (written or oral)
or implicit employment contracts which give them a basic remuneration which is not directly dependent upon the revenue of the unit for which they
work, typically wages and salaries. Data are non-seasonally adjusted.
Source: ILO Laborsta.
5
Table 6: Average Monthly Earnings (Brazilian Real)
2000
2001
2002
Total Economy
766.5
829.9
885.4
Agriculture, Hunting & Forestry
334.2
379.7
409.3
Fishing
361.9
399.4
407.4
Mining & Quarrying
909.4
1,350.4
1,517.5
Manufacturing
763.1
844.6
901.9
Electricity, Gas & Water Supply
1,926.3
2,083.0
2,300.3
Construction
566.3
600.4
637.2
Wholesale & Retail Trade
488.7
528.0
564.6
Hotels and Restaurants
362.7
390.7
420.8
Transport, Storage & Communications
873.1
900.0
924.3
Financial Intermediation
2,257.0
2,049.5
2,195.9
Real Estate, Renting & Business Activities
689.2
734.6
788.1
Public Administration & Defence; Compulsory Social Security
976.3
1,086.6
1,161.0
Education
975.8
1,088.5
1,161.8
Health & Social Work
668.9
731.4
793.3
Other Community, Social & Personal Service Activities
669.8
686.5
733.4
Households with Employed Persons
216.2
259.9
292.1
1,536.3
1,776.0
2,214.3
Extra-Territorial Organizations & Bodies
Source: ILO Laborsta. Sectors are classified according to ISIC Rev.3, as reported in ILO Laborsta. Sum of individual sectors may not equal total due to rounding.
Table 7: Average Usual Weekly Working Hours
2002
2003
2004
2005
2006
2007
Total
42.2
42.0
41.9
41.7
41.4
41.3
Agriculture, Hunting and Forestry
46.0
45.8
45.2
44.4
44.0
43.8
Fishing
53.0
52.9
51.4
49.1
48.2
47.5
Mining and Quarrying
44.7
44.8
46.2
45.0
45.2
44.9
Manufacturing
44.2
44.2
44.1
43.9
43.9
43.6
Electricity, Gas and Water Supply
42.0
42.1
42.0
41.7
41.4
41.4
Construction
44.8
44.6
44.6
44.1
43.9
43.7
Wholesale and Retail Trade
45.5
45.4
45.1
44.9
45.0
44.6
Hotels and Restaurants
45.4
45.2
45.1
44.9
44.7
44.1
Transport, Storage and Communications
47.2
47.1
46.6
46.5
46.4
45.9
Financial Intermediation
39.3
39.6
39.2
39.2
39.0
39.3
Real Estate, Renting and Business Activities
42.4
42.0
42.3
42.2
41.6
41.6
Public Administration and Defence; Compulsory Social Security
39.6
39.3
39.1
39.1
38.8
38.9
Education
32.5
33.0
32.8
32.5
32.6
33.0
Health and Social Work
39.1
39.0
39.1
39.0
39.0
38.8
Other Community, Social and Personal Service Activities
40.3
40.5
40.4
40.1
39.8
39.3
Households with Employed Persons
39.0
38.0
37.8
37.6
36.9
36.8
Extra-Territorial Organizations and Bodies
42.9
35.2
39.4
36.8
35.5
43.3
Not classifiable by economic activity
39.5
40.7
39.9
43.2
42.2
41.0
Source: ILO Laborsta. Sectors are classified according to ISIC Rev.3, as reported in ILO Laborsta. Sum of individual sectors may not equal total due to
rounding.
6


© Copyright 2026