
Constellium N.V. Form 6-K Current Report Filed 2015-03-27
SECURITIES AND EXCHANGE COMMISSION FORM 6-K Current report of foreign issuer pursuant to Rules 13a-16 and 15d-16 Amendments Filing Date: 2015-03-27 | Period of Report: 2015-03-27 SEC Accession No. 0001193125-15-109497 (HTML Version on secdatabase.com) FILER Constellium N.V. CIK:1563411| IRS No.: 000000000 | Fiscal Year End: 1231 Type: 6-K | Act: 34 | File No.: 001-35931 | Film No.: 15731371 SIC: 3341 Secondary smelting & refining of nonferrous metals Mailing Address Business Address TUPOLEVLAAN 41-61 TUPOLEVLAAN 41-61 SCHIPHOL-RIJK P7 1119NW SCHIPHOL-RIJK P7 1119NW 31-20-654-97-80 Copyright © 2015 www.secdatabase.com. All Rights Reserved. Please Consider the Environment Before Printing This Document UNITED STATES SECURITIES AND EXCHANGE COMMISSION Washington, D.C. 20549 FORM 6-K REPORT OF FOREIGN PRIVATE ISSUER PURSUANT TO RULE 13a-16 OR 15d-16 UNDER THE SECURITIES EXCHANGE ACT OF 1934 For the month of March 2015 Commission File Number: 001-35931 Constellium N.V. (Translation of registrants name into English) Tupolevlaan 41-61, 1119 NW Schiphol-Rijk The Netherlands (Address of principal executive office) Indicate by check mark whether the registrant files or will file annual reports under cover of Form 20-F or Form 40-F: Form 20-F x Form 40-F ¨ Indicate by check mark if the registrant is submitting the Form 6-K in paper as permitted by Regulation S-T Rule 101(b)(1): Yes ¨ No x Indicate by check mark if the registrant is submitting the Form 6-K in paper as permitted by Regulation S-T Rule 101(b)(7): Yes ¨ No x Copyright © 2013 www.secdatabase.com. All Rights Reserved. Please Consider the Environment Before Printing This Document INFORMATION CONTAINED IN THIS FORM 6-K REPORT This report on Form 6-K is being furnished for the purpose of providing a copy of the registrants audited consolidated financial statements for the year ended December 31, 2014. This report also includes a copy of the registrants management report on internal controls over financial reporting dated March 25, 2015 and a copy of the independent registered public accounting firms report on the consolidated financial statements for the year ended December 31, 2014, dated March 25, 2015. The audited consolidated financial statements for the year ended December 31, 2014, managements report on internal controls over financial reporting and the independent registered public accounting firms report on the consolidated financial statements, will also be filed as part of Constellium N.V.s Annual Report on Form 20-F for the year ended December 31, 2014. Exhibit Index No. Description 99.1 Report of management on internal controls over financial reporting 99.2 Report of independent registered public accounting firm 99.3 Audited consolidated financial statements for the year ended December 31, 2014 Copyright © 2013 www.secdatabase.com. All Rights Reserved. Please Consider the Environment Before Printing This Document SIGNATURE Pursuant to the requirements of the Securities Exchange Act of 1934, the registrant has duly caused this report to be signed on its behalf by the undersigned, thereunto duly authorized. CONSTELLIUM N.V. (Registrant) March 27, 2015 By: /s/ Didier Fontaine Name: Didier Fontaine Title: CFO Copyright © 2013 www.secdatabase.com. All Rights Reserved. Please Consider the Environment Before Printing This Document Exhibit 99.1 Managements report on internal controls over financial reporting The management of Constellium N.V. (Constellium or the Company), including the Chief Executive Officer and Chief Financial Officer, is responsible for establishing and maintaining adequate internal controls over financial reporting, as defined in the Securities Exchange Act of 1934, as amended, Rule 13a-15(f). The Companys internal control over financial reporting is a process designed to provide reasonable assurance regarding the reliability of financial reporting and the preparation of financial statements for external purposes in accordance with International Financial Reporting Standards (IFRS) as issued by the International Accounting Standards Board (IASB) and as endorsed by the European Union (EU). The Companys internal control over financial reporting includes those policies and procedures that (i) pertain to the maintenance of records that, in reasonable detail, accurately and fairly reflect the transactions and dispositions of the assets of the Company; (ii) provide reasonable assurance that transactions are recorded as necessary to permit preparation of financial statements in accordance with IFRS, and that receipts and expenditures of the Company are being made only in accordance with authorizations of management and directors of the Company; and (iii) provide reasonable assurance regarding prevention or timely detection of unauthorized acquisition, use or disposition of the Companys assets that could have a material effect on the financial statements. Because of its inherent limitations, internal control over financial reporting may not prevent or detect misstatements. Also, projections of any evaluation of the effectiveness of internal control to future periods are subject to the risk that controls may become inadequate because of changes in conditions, and that the degree of compliance with the policies or procedures may deteriorate. Constelliums management has assessed the effectiveness of the Companys internal controls over financial reporting as of December 31, 2014 based on the criteria established in Internal Control Integrated Framework (2013) issued by the Committee of Sponsoring Organizations of the Treadway Commission (COSO) and, based on such criteria, Constelliums management has concluded that, as of December 31, 2014, the Company´s internal control over financial reporting is effective. Attestation report of the registered public accounting firm. The effectiveness of the Companys internal control over financial reporting as of December 31, 2014 has been audited by PricewaterhouseCoopers Audit, an independent registered public accounting firm, as stated in their report which appears herein. March 25, 2015 /s/ Pierre Vareille Pierre Vareille Chief Executive Officer /s/ Didier Fontaine Didier Fontaine Chief Financial Officer Copyright © 2013 www.secdatabase.com. All Rights Reserved. Please Consider the Environment Before Printing This Document Exhibit 99.2 Report of Independent Registered Public Accounting Firm To the board of directors and shareholders of Constellium N.V. In our opinion, the accompanying consolidated statements of financial position and the related consolidated statement of income, comprehensive income / (loss), changes in equity and cash flows present fairly, in all material respects, the financial position of Constellium N.V. and its subsidiaries at December 31, 2014 and December 31, 2013, and the results of their operations and their cash flows for each of the three years in the period ended December 31, 2014 in conformity with International Financial Reporting Standards as issued by the International Accounting Standards Board and in conformity with International Financial Reporting Standards as adopted by the European Union. Also in our opinion, the Company maintained, in all material respects, effective internal control over financial reporting as of December 31, 2014, based on criteria established in Internal Control - Integrated Framework 2013 issued by the Committee of Sponsoring Organizations of the Treadway Commission (COSO). The Companys management is responsible for these financial statements, for maintaining effective internal control over financial reporting and for its assessment of the effectiveness of internal control over financial reporting. Our responsibility is to express opinions on these financial statements and on the Companys internal control over financial reporting based on our audits which was an integrated audit in 2014. We conducted our audits in accordance with the standards of the Public Company Accounting Oversight Board (United States). Those standards require that we plan and perform the audits to obtain reasonable assurance about whether the financial statements are free of material misstatement and whether effective internal control over financial reporting was maintained in all material respects. Our audits of the financial statements included examining, on a test basis, evidence supporting the amounts and disclosures in the financial statements, assessing the accounting principles used and significant estimates made by management, and evaluating the overall financial statement presentation. Our audit of internal control over financial reporting included obtaining an understanding of internal control over financial reporting, assessing the risk that a material weakness exists, and testing and evaluating the design and operating effectiveness of internal control based on the assessed risk. Our audits also included performing such other procedures as we considered necessary in the circumstances. We believe that our audits provide a reasonable basis for our opinions. A companys internal control over financial reporting is a process designed to provide reasonable assurance regarding the reliability of financial reporting and the preparation of financial statements for external purposes in accordance with generally accepted accounting principles. A companys internal control over financial reporting includes those policies and procedures that (i) pertain to the maintenance of records that, in reasonable detail, accurately and fairly reflect the transactions and dispositions of the assets of the company; (ii) provide reasonable assurance that transactions are recorded as necessary to permit preparation of financial statements in accordance with generally accepted accounting principles, and that receipts and expenditures of the company are being made only in accordance with authorizations of management and directors of the company; and (iii) provide reasonable assurance regarding prevention or timely detection of unauthorized acquisition, use, or disposition of the companys assets that could have a material effect on the financial statements. PricewaterhouseCoopers Audit, SA, 63, rue de Villiers, 92208 Neuilly-sur-Seine Cedex Téléphone: +33 (0)1 56 57 58 59, Fax: +33 (0)1 56 57 58 60, www.pwc.fr Société dexpertise comptable inscrite au tableau de lordre de Paris - Ile de France. Société de commissariat aux comptes membre de la compagnie régionale de Versailles. Société Anonyme au capital de 2 510 460 . Siège social : 63, rue de Villiers 92200 Neuillysur-Seine. RCS Nanterre 672 006 483. TVA n° FR 76 672 006 483. Siret 672 006 483 00362. Code APE 6920 Z. Bureaux : Bordeaux, Grenoble, Lille, Lyon, Marseille, Metz, Nantes, Neuilly-Sur-Seine, Nice, Poitiers, Rennes, Rouen, Strasbourg, Toulouse. Copyright © 2013 www.secdatabase.com. All Rights Reserved. Please Consider the Environment Before Printing This Document Page 2 Because of its inherent limitations, internal control over financial reporting may not prevent or detect misstatements. Also, projections of any evaluation of effectiveness to future periods are subject to the risk that controls may become inadequate because of changes in conditions, or that the degree of compliance with the policies or procedures may deteriorate. Neuilly-sur-Seine, France PricewaterhouseCoopers Audit /s/ Olivier Lotz Olivier Lotz Partner March 25, 2015 Copyright © 2013 www.secdatabase.com. All Rights Reserved. Please Consider the Environment Before Printing This Document Exhibit 99.3 CONSOLIDATED FINANCIAL STATEMENTS Year ended December 31, 2014 Copyright © 2013 www.secdatabase.com. All Rights Reserved. Please Consider the Environment Before Printing This Document CONSOLIDATED INCOME STATEMENT (in millions of Euros) Notes Revenue Cost of sales Gross profit Selling and administrative expenses Research and development expenses Restructuring costs Other (losses) / gains - net Income from operations Other expenses Finance income Finance costs Finance costs - net Share of (loss) / profit of joint-ventures Income before income tax Income tax expense Net Income from continuing operations Discontinued operations Net Income / (Loss) from discontinued operations Net Income for the period Net Income attributable to: Owners of the Company Non-controlling interests Net Income 4, 5 6 6 6 22 8 1 10 26 11 33 Year ended December 31, 2014 3,666 (3,183 483 (200 (38 (12 (83 150 30 (88 (58 (1 91 (37 54 Year ended December 31, 2013 ) ) ) ) ) ) ) ) ) 3,495 (3,024 471 (210 (36 (8 (8 209 (27 17 (67 (50 3 135 (39 96 Year ended December 31, 2012 ) ) ) ) ) ) ) ) ) 3,610 (3,136 474 (212 (36 (25 62 263 (3 4 (64 (60 (5 195 (46 149 54 4 100 (8 141 51 3 54 98 2 100 139 2 141 ) ) ) ) ) ) ) ) ) ) Earnings per share attributable to the equity holders of the Company (in Euros per share) Notes From continuing and discontinued operations Basic Diluted From continuing operations Basic Diluted From discontinued operations Basic Diluted Year ended December 31, 2014 Year ended December 31, 2013 Year ended December 31, 2012 12 12 0.48 0.48 1.00 0.99 1.55 1.55 12 12 0.48 0.48 0.96 0.95 1.64 1.64 12 12 0.04 0.04 (0.09 (0.09 The accompanying notes are an integral part of these consolidated financial statements. -1- Copyright © 2013 www.secdatabase.com. All Rights Reserved. Please Consider the Environment Before Printing This Document ) ) CONSOLIDATED STATEMENT OF COMPREHENSIVE INCOME / (LOSS) (in millions of Euros) Notes Net Income Other Comprehensive (Loss) / Income Items that will not be reclassified subsequently in the Consolidated Income Statement Remeasurement on post-employment benefit obligations Deferred tax on remeasurement on post-employment benefit obligations Cash flow hedges Deferred tax on cash flow hedges Items that may be reclassified subsequently in the Consolidated Income Statement Currency translation differences Other Comprehensive (Loss) / Income Total Comprehensive (Loss) / Income Attributable to: Owners of the Company Non-controlling interests Total Comprehensive (Loss) / Income Year ended December 31, 2014 Year ended December 31, 2013 54 21 Year ended December 31, 2012 100 141 ) 72 (80 14 9 (3 ) (9 (13 (130 (76 ) ) ) 63 163 (64 77 (80 4 (76 ) 161 2 163 75 2 77 (137 ) The accompanying notes are an integral part of these consolidated financial statements. -2- Copyright © 2013 www.secdatabase.com. All Rights Reserved. Please Consider the Environment Before Printing This Document ) ) 16 ) CONSOLIDATED STATEMENT OF FINANCIAL POSITION (in millions of Euros) Notes At December 31, 2014 At December 31, 2013 Assets Non-current assets Intangible assets (including goodwill) Property, plant and equipment Investments in joint ventures Deferred income tax assets Trade receivables and other Other financial assets 13 14 26 27 16 25 28 632 21 190 48 33 952 21 408 1 177 60 7 674 Current assets Inventories Trade receivables and other Other financial assets Cash and cash equivalents 15 16 25 17 Assets classified as held for sale 33 432 568 57 989 2,046 14 328 483 25 233 1,069 21 3,012 1,764 2 162 (207 (43 6 (37 2 162 (132 32 4 36 Total Assets Equity Share capital Share premium Retained deficit and other reserves Equity attributable to owners of the Company Non-controlling interests 18 18 Liabilities Non-current liabilities Borrowings Trade payables and other Deferred income tax liabilities Pension and other post-employment benefit obligations Other financial liabilities Provisions Current liabilities Borrowings Trade payables and other Income taxes payable Other financial liabilities Provisions ) 19 20 27 21 25 22 1,205 31 654 40 61 1,991 326 35 1 507 36 65 970 19 20 47 872 11 71 49 1,050 8 22 646 19 24 38 749 9 3,049 3,012 1,728 1,764 25 22 Liabilities classified as held for sale ) ) 33 Total Liabilities Total Equity and Liabilities The accompanying notes are an integral part of these consolidated financial statements. -3- Copyright © 2013 www.secdatabase.com. All Rights Reserved. Please Consider the Environment Before Printing This Document ) CONSOLIDATED STATEMENT OF CHANGES IN EQUITY Share capital (in millions of Euros) As at January 1, 2012 Net income Other comprehensive loss Total Comprehensive Income Transactions with the Owners Share equity plan Other As at December 31, 2012 As at January 1, 2013 Net income Other comprehensive income Total Comprehensive Income Transactions with the Owners Share premium distribution(A) MEP shares changes Share equity plan Prorata share issuance Interim dividend distribution(A) IPO Primary offering IPO Over-allotment IPO Fees Transactions with non-controlling interests As at December 31, 2013 Remeasurement 98 (22 (64 (64 98 (86 Share capital (in millions of Euros) Share premium Share premium 98 2 (98 154 25 (17 2 162 Foreign currency translation reserve ) ) ) (14 ) (14 ) ) ) ) Foreign currency translation reserve Remeasurement (86 63 63 Other reserves ) (14 ) (14 2 (179 ) 139 139 (115 139 (64 75 1 (2 1 (40 1 (2 (41 ) (1 1 (40 98 98 ) 1 ) ) Noncontrolling interests ) ) ) ) Total Owners of the Company Retained losses 1 (23 Retained losses Other reserves ) Total Owners of the Company ) Total equity 2 2 2 (113) 141 (64 ) 77 4 1 (2 ) (37 ) Noncontrolling interests Total equity (41 98 63 161 ) 4 2 2 (37 ) 100 63 163 (5 ) (2 ) (147 ) (103 (1 1 (147 154 25 (17 ) ) (103) (1 ) 1 (147) 154 25 (17 ) (96 32 ) ) ) (2 4 ) (2 ) 36 (A) On March 13, 2013, the Board of directors approved a distribution to the Companys shareholders. On March 28, 2013 a distribution was made of 103 million. On May 21, 2013 an interim dividend was paid for 147 million on preference shares. Share capital (in millions of Euros) As at January 1, 2014 Net income Other comprehensive loss Total Comprehensive Loss Transactions with the Owners Share equity plan MEP shares changes Transactions with noncontrolling interests As at December 31, 2014 Share premium Cash flow hedges Remeasurement 2 162 (23 (123 (123 2 162 (146 Foreign currency translation reserve ) ) ) 6 6 (14 (14 (14 6 (28 ) Other reserves ) ) ) ) Total Owners of the Company Retained losses 1 (96 51 51 4 1 6 (45 ) 32 51 (131 (80 ) ) 4 1 ) (43 The accompanying notes are an integral part of these consolidated financial statements. Copyright © 2013 www.secdatabase.com. All Rights Reserved. Please Consider the Environment Before Printing This Document Noncontrolling interests ) Total equity 4 3 1 4 36 54 (130) (76 ) 4 1 (2 6 ) (2 ) (37 ) -4- Copyright © 2013 www.secdatabase.com. All Rights Reserved. Please Consider the Environment Before Printing This Document CONSOLIDATED STATEMENT OF CASH FLOWS (in millions of Euros) Notes Cash flows from / (used in) operating activities Net income from continuing operations Adjustments Changes in working capital: Inventories Trade receivables Margin calls Trade payables Other working capital Changes in other operating assets and liabilities: Provisions Income tax paid Pension liabilities and other post-employment benefit obligations Net cash flows from operating activities Cash flows (used in) / from investing activities Purchases of property, plant and equipment Proceeds from disposals, including joint-venture Investment in joint-venture Proceeds from finance lease Other investing activities Net cash flows used in investing activities Cash flows from / (used in) financing activities Net proceeds received from issuance of share Interim dividend paid Withholding tax reimbursed / (paid) Distribution of share premium to owners of the Company Interest paid Net cash flows used in factoring Proceeds received from Term Loan and Senior Notes Repayment of Term Loan Proceeds of other loans Payment of deferred financing costs Transactions with non-controlling interests Other financing activities Net cash flows from / (used in) financing activities Net increase in cash and cash equivalents Cash and cash equivalents - beginning of period Effect of exchange rate changes on cash and cash equivalents 23 22 16 19 19 19 19 19 17 Cash and cash equivalents end of period Year ended December 31, 2014 Year ended December 31, 2013 54 241 96 133 149 81 41 9 4 (1 (9 35 26 7 20 27 (95 (48 11 170 (33 ) ) (12 (27 (49 212 ) ) ) (17 (29 (43 184 ) ) ) (31 (28 (40 246 ) ) ) (199 (2 (19 6 (2 (216 ) ) ) (144 7 6 (1 (132 ) (126 8 (13 (131 ) 20 (39 1,153 (331 13 (27 (2 (34 753 749 236 6 ) ) ) ) ) ) ) ) 991 Less: Cash and cash equivalents classified as held for sale Cash and cash equivalents as reported in the Statement of Financial Position Year ended December 31, 2012 33 (2 17 989 162 (147 (20 (103 (36 351 (156 2 (8 (2 43 95 142 (1 Copyright © 2013 www.secdatabase.com. All Rights Reserved. Please Consider the Environment Before Printing This Document ) ) ) ) ) ) ) ) ) ) 236 ) (3 233 The accompanying notes are an integral part of these consolidated financial statements. -5- ) ) (28 (49 154 (148 6 (14 (7 (86 29 113 142 ) 142 ) ) ) ) ) ) ) ) NOTES TO THE CONSOLIDATED FINANCIAL STATEMENTS NOTE 1 - GENERAL INFORMATION Constellium is a global leader in the design and manufacture of a broad range of innovative specialty rolled and extruded aluminum products, serving primarily the aerospace, packaging and automotive end-markets. The Group has a strategic footprint of manufacturing facilities located in the United States, Europe and China, operates 22 production facilities, 10 administrative and commercial sites and one R&D center and has approximately 8,900 employees. In connection with the initial public offering explained hereafter, the Company was converted from a private company with limited liability (Constellium Holdco B.V.) into a public company with limited liability (Constellium N.V.). On May 16, 2013, the Group increased its shares nominal value from 0.01 to 0.02 per share. The business address (head office) of Constellium N.V. is Tupolevlaan 41-61, 1119 NW Schiphol-Rijk, the Netherlands. Unless the context indicates otherwise, when we refer to we, our, us, Constellium, the Group and the Company in this document, we are referring to Constellium N.V. and its subsidiaries. Initial public offering On May 22, 2013, Constellium completed an initial public offering (the IPO) of Class A ordinary shares; the shares began trading on the New York Stock Exchange on May 23, 2013, and on the professional segment of Euronext Paris on May 27, 2013. Constellium offered a total of 13,333,333 of its Class A ordinary shares, nominal value 0.02 per share and the selling shareholders offered 8,888,889 of Class A ordinary shares, nominal value 0.02 per share. The underwriters exercised their over-allotment option to purchase an additional 2,251,306 Class A ordinary shares at a public offering price of $15.00 per share. The exercise of the IPO overallotment option brought the total number of Class A ordinary shares sold in the initial public offering to 24,473,528. The total proceeds received by the Company from the IPO were 179 million. Fees related to the IPO amounted to 44 million, of which 17 million were accounted for as a deduction to share premium and 27 million expensed of which 24 million were recognized in Other expenses. Secondary public offerings On November 11, 2013, Constellium completed a public offering of Class A ordinary shares. The selling shareholders offered a total of 17,500,000 Class A ordinary shares at a price of $17.00 per share. 16,691,355 of the Class A ordinary shares were sold by an affiliate of Rio Tinto Plc. and 808,645 by Omega management GmbH & co. KG. The underwriters have exercised their option to purchase an additional 2,625,000 Class A ordinary shares from an affiliate of Rio Tinto Plc. bringing the total number of Class A ordinary shares sold in this offering to 20,125,000. On December 12, 2013, Constellium completed a public offering of Class A ordinary shares by an affiliate of Rio Tinto Plc. Constellium offered 8,345,713 Class A ordinary shares at a price of $19.80 per share. The underwriters have exercised their option to purchase an additional 1,251,847 Class A ordinary shares. The exercise of the option brought the total number of Class A ordinary shares sold in this offering to 9,597,560. The Company did not receive any of the proceeds from these offerings of ordinary shares (including any ordinary shares sold pursuant to the underwriterss option to purchase additional ordinary shares). The total number of outstanding ordinary shares did not change as a result of the offering. Fees related to these offerings amounted to 3 million in 2013 and recognized in Other expenses. On February 10, 2014, Constellium completed a third secondary public offering of 25,000,000 of our Class A ordinary shares at a price to the public of $22.50 per share. The shares were offered by Apollo Funds. On March 10, 2014, Constellium completed a fourth secondary public offering of 12,561,475 of our Class A ordinary shares at a price to the public of $27.75 per share. The shares were offered by Apollo Funds. After this offering, Apollo Funds ceased to hold any of Constellium ordinary shares. -6- Copyright © 2013 www.secdatabase.com. All Rights Reserved. Please Consider the Environment Before Printing This Document NOTE 2 - SUMMARY OF SIGNIFICANT ACCOUNTING POLICIES a. Statement of compliance The consolidated financial statements of Constellium N.V. and its subsidiaries have been prepared in accordance with International Financial Reporting Standards (IFRS) as issued by the International Accounting Standards Board (IASB) and as endorsed by the European Union (EU). The Groups application of IFRS results in no difference between IFRS as issued by the IASB and IFRS as endorsed by the EU. (http://ec.europa.eu/internal_market/accounting/ias/index_en.htm) The consolidated financial statements have been authorized for issue by the Board of Directors at its meeting held on March 11, 2015. b. Application of new and revised International Financial Reporting Standards (IFRS) Standards and Interpretations with an application date for the Group as of January 1, 2014: Amendment to IAS 32 Financial instruments: Presentation on offsetting financial assets and liabilities. This amendment clarifies that the right of set-off must not be contingent on a future event. It must also be legally enforceable for all counterparties in the normal course of business, as well as in the event of default, insolvency or bankruptcy. The amendment also considers settlement mechanisms. The amendment did not have a significant effect on the group financial statements. Amendments to IAS 36 Impairment of assets on the recoverable amount disclosures for non-financial assets. This amendment removed certain disclosures on the recoverable amount of cash generated units which had been included in IAS 36 by the issue of IFRS 13. Amendments to IAS 39 Financial instruments: Recognition and measurement on the novation of derivatives and the continuation of hedge accounting. This amendment considers legislative changes to over-the-counter derivatives and the establishment of central counterparties. Under IAS 39 novation of derivatives to central counterparties would result in discrepancies of hedge accounting. The amendment provides relief from discontinuing hedge accounting when novation of a hedge instrument meets specified criteria. The Group has applied the amendment and there is no impact on the financial statements. IFRIC 21 Levies sets out the accounting for an obligation to pay a levy if the liability is within the scope of IAS 37 Provisions. The interpretation addresses what the obligating event is that gives rise to pay a levy and when a liability should be recognized. The application of this interpretation has no material effect on the Groups financial statements. c. New standards and interpretations not yet mandatorily applicable The Group has not applied the following new, revised and amended standards and interpretations that have been issued but are not yet effective and which could affect the Groups future consolidated financial statements: IFRS 9, Financial instruments, addresses the classification, measurement and recognition of financial assets and financial liabilities. It replaces the guidance in IAS 39 that relates to the classification and measurement of financial instruments. Modifications introduced by IFRS 9 relate primarily to: classification and measurement of financial assets. The basis of classification depends on the entitys business model and the contractual cash flow characteristics of the financial asset. depreciation of receivables, now based on the expected credit losses model. hedge accounting. The standard is effective for accounting periods beginning on or after January 1, 2018. IFRS 15, Revenue from contracts with customers deals with revenue recognition and establishes principles for reporting information to users of financial statements about the nature, amount, timing and uncertainty of revenue and cash flows arising from an entitys contracts with customers. Revenue is recognized when a customer obtains control of a good or service and thus has the ability to direct the use and obtain the benefits from the good or service. The standard replaces IAS 18 Revenue and IAS 11 Construction contracts and related interpretations. The standard is effective for accounting periods beginning on or after January 1, 2017. The impact of these standards on the Groups results and financial situation is currently being evaluated. Copyright © 2013 www.secdatabase.com. All Rights Reserved. Please Consider the Environment Before Printing This Document d. Presentation of the operating performance of each operating segment and of the Group In accordance with IFRS 8 Operating Segments, operating segments are based upon product lines, markets and industries served, and are reported in a manner consistent with the internal reporting provided to the chief operating decision-maker (CODM). The CODM, who is responsible for allocating resources and assessing performance of the operating segments, has been identified as the Chief Executive Officer. The profitability and financial performance of the operating segments is measured based on Adjusted EBITDA, as it illustrates the underlying performance of continuing operations by excluding non-recurring and non-operating items. -7- Copyright © 2013 www.secdatabase.com. All Rights Reserved. Please Consider the Environment Before Printing This Document Adjusted EBITDA is defined in NOTE 4 - Operating Segment Information. e. Principles governing the preparation of the consolidated financial statements Basis of consolidation These consolidated financial statements include all the assets, liabilities, equity, revenues, expenses and cash flows of the entities and businesses controlled by Constellium. Subsidiaries are entities over which the Group has control. The Group controls an entity when the Group has power over the investee, is exposed to, or has rights to variable returns from its involvement with the entity and has the ability to affect those returns through its power over the entity. Subsidiaries are fully consolidated from the date on which control is transferred to the Group. They are deconsolidated from the date that control ceases. Investments in joint arrangements are classified as either joint ventures or joint operations depending on the contractual rights and obligations of each investor. The Group accounts for its investments in joint ventures under the equity method. Acquisitions The Group applies the acquisition method to account for business combinations. The consideration transferred for the acquisition of a subsidiary is the fair value of the assets transferred, the liabilities assumed and the equity interests issued by the Group. The consideration transferred includes the fair value of any asset or liability resulting from a contingent consideration arrangement. Identifiable assets acquired and liabilities and contingent liabilities assumed in a business combination are measured initially at their fair values at the acquisition date. The amount of non-controlling interest is determined for each business combination and is either the fair value (full goodwill method) or the present ownership instruments proportionate share in the recognized amounts of the acquirees identifiable net assets, resulting in recognition of only the share of goodwill attributable to equity holders of the parent (partial goodwill method). Goodwill is initially measured as the excess of the aggregate of the consideration transferred and the amount of non-controlling interest over the net identifiable assets acquired and liabilities assumed. If this consideration is lower than the fair value of the net assets of the subsidiary acquired, the difference is recognized as a gain in Other gains / (losses) - net in the Consolidated Income Statement. On acquisition, the Group recognizes the identifiable acquired assets, liabilities and contingent liabilities (identifiable net assets) of the subsidiaries on the basis of fair value at the acquisition date. Recognized assets and liabilities may be adjusted during a maximum of 12 months from the acquisition date, depending on new information obtained about the facts and circumstances existing at the acquisition date. Significant assumptions used in determining allocation of fair value include the following valuation approaches: the cost approach, the income approach and the market approach which are determined based on cash flow projections and related discount rates, industry indices, market prices regarding replacement cost and comparable market transactions. Cash-generating units The reporting units (which generally correspond to an industrial site), the lowest level of the Groups internal reporting, have been identified as its cash-generating units. Goodwill Goodwill arising on a business combination is carried at cost as established at the date of the business combination less accumulated impairment losses, if any. Goodwill is allocated and monitored at the operating segments level which are the groups of cash-generating units that are expected to benefit from the synergies of the combination. The operating segments represent the lowest level within the Group at which the goodwill is monitored for internal management purposes. Copyright © 2013 www.secdatabase.com. All Rights Reserved. Please Consider the Environment Before Printing This Document On disposal of the relevant cash-generating units, the attributable amount of goodwill is included in the determination of the gain in disposal. -8- Copyright © 2013 www.secdatabase.com. All Rights Reserved. Please Consider the Environment Before Printing This Document Impairment of goodwill A cash-generating unit or a group of cash-generating units to which goodwill is allocated is tested for impairment annually, or more frequently when there is an indication that the unit (or group of units) may be impaired. The net carrying value of the cash-generating unit (or the group of cash-generating units) is compared to its recoverable amount, which is the higher of the value in use and the fair value less cost to sell. Value in use calculations use cash flow projections based on financial budgets approved by management and covering usually a 5 year period. Cash flows beyond this period are estimated using a perpetual long-term growth rate for the subsequent years. The value in use is the sum of discounted cash flows and the terminal residual value. Discount rates are determined using the weightedaverage cost of capital of each operating segment. Any impairment loss of goodwill is recognized for the amount by which the cash-generating units (or group of units) carrying amount exceeds its recoverable amount. The impairment loss is allocated first to reduce the carrying amount of any goodwill allocated to the cash-generating unit (or group of cash-generating units) and then, to the other assets of the unit (or group of units) pro rata on the basis of the carrying amount of each asset in the unit (or group of units). Any impairment loss is recognized in Other gains / (losses) net in the Consolidated Income Statement. An impairment loss recognized for goodwill cannot be reversed in subsequent periods. Non-current assets (and disposal groups) classified as held for sale & Discontinued operations IFRS 5 Non-current Assets Held for Sale and Discontinued Operations defines a discontinued operation as a component of an entity that (i) generates cash flows that are largely independent from cash flows generated by other components, (ii) is held for sale or has been sold, and (iii) represents a separate major line of business or geographic areas of operations. Assets and liabilities are classified as held for sale when their carrying amount will be recovered principally through a sale transaction rather than through continuing use. This condition is regarded as met only when the sale is highly probable and the non-current asset (or disposal group) is available for immediate sale in its present condition. Assets and liabilities are stated at the lower of carrying amount and fair value less costs to sell if their carrying amount is to be recovered principally through a sale transaction rather than through continuing use. Assets and liabilities held for sale are reflected in separate line items in the Consolidated Statement of Financial Position of the period during which the decision to sell is made. The results of discontinued operations are shown separately in the Consolidated Income Statement. Foreign currency transactions and foreign operations Functional currency Items included in the consolidated financial statements of each of the entities and businesses of Constellium are measured using the currency of the primary economic environment in which each of them operates (their functional currency). Foreign currency transactions: Transactions denominated in currencies other than the functional currency are converted to the functional currency at the exchange rate in effect at the date of the transaction. Foreign exchange gains and losses resulting from the settlement of such transactions and from the translation at year-end exchange rates of monetary assets and liabilities denominated in foreign currencies are recognized in the income statement, except when deferred in other comprehensive income as qualifying cash flow hedges and qualifying net investment hedges. Foreign exchange gains and losses that relate to borrowings and cash and cash equivalents are presented within Finance costs - net. Foreign exchange gains and losses that relate to commercial transactions are presented in Costs of Sales. Copyright © 2013 www.secdatabase.com. All Rights Reserved. Please Consider the Environment Before Printing This Document All other foreign exchange gains and losses, including those that relate to foreign currency derivatives hedging commercial transactions, are presented within Other gains / (losses) net. Foreign operations: presentation currency and foreign currency translation In the preparation of the consolidated financial statements, the year-end balances of assets, liabilities and components of equity of Constelliums entities and businesses are translated from their functional currencies into Euros, the presentation currency of the Group, at the respective year-end exchange rates; and the revenues, expenses and cash flows of Constelliums entities and businesses are translated from their functional currencies into Euros using average exchange rates for the period. -9- Copyright © 2013 www.secdatabase.com. All Rights Reserved. Please Consider the Environment Before Printing This Document The net differences arising from exchange rate translation are recognized in the Other Comprehensive Income. The following table summarizes the main exchange rates used for the preparation of the consolidated financial statements of the Group: Year ended December 31, 2014 Closing rate Average rate Foreign exchange rate for 1 Euro US Dollars Swiss Francs Czech Koruna USD CHF CZK 1.2141 1.2024 27.7348 1.3264 1.2146 27.5352 Year ended December 31, 2013 Closing rate Average rate 1.3791 1.2276 27.4273 1.3271 1.2308 25.9471 Year ended December 31, 2012 Closing rate Average rate 1.3220 1.2070 25.1256 1.2847 1.2051 25.1256 Revenue recognition Revenue is measured at the fair value of the consideration received or receivable. Revenue from product sales, net of trade discounts, allowances and volume-based incentives, is recognized once delivery has occurred provided that persuasive evidence exists that all of the following criteria are met: The significant risks and rewards of ownership of the product have been transferred to the buyer; Neither continuing managerial involvement to the degree usually associated with ownership, nor effective control over the goods sold, has been retained by Constellium; The amount of revenue can be measured reliably; It is probable that the economic benefits associated with the sale will flow to Constellium; and The costs incurred or to be incurred in respect of the sale can be measured reliably. The Group also enters into tolling agreements whereby the clients loan the metal which the Group will then manufacture for them. In these circumstances, revenue is recognized when services are provided as of the date of redelivery of the manufactured metal. Amounts billed to customers in respect of shipping and handling are classified as revenue where the Group is responsible for carriage, insurance and freight. All shipping and handling costs incurred by the Group are recognized in cost of sales. Deferred tooling revenue and related costs Certain automotive long term contracts include the design and manufacture of customized parts. To manufacture such parts, certain specialized or customized tooling is required. The Group accounts for the tooling revenue and related costs provided by third party manufacturers in accordance with the provisions of IAS 11 Construction Contracts, i.e. revenue and expenses are recognized on the basis of percentage of completion of the contract. Research and development costs Research expenditures are recognized as expenses in the Consolidated Income Statement as incurred. Costs incurred on development projects are recognized as intangible assets when the following criteria are met: It is technically feasible to complete the intangible asset so that it will be available for use; Management intends to complete and use the intangible asset; There is an ability to use the intangible asset; It can be demonstrated how the intangible asset will generate probable future economic benefits; Adequate technical, financial and other resources to complete the development and use or sell the intangible asset are available; and The expenditure attributable to the intangible asset during its development can be reliably measured. Where development expenditures do not meet these criteria, they are recognized as expenses in the Consolidated Income Statement when incurred. Development costs previously recognized as expenses are not recognized as an asset in a subsequent period. Copyright © 2013 www.secdatabase.com. All Rights Reserved. Please Consider the Environment Before Printing This Document Other gains / (losses) - net Other gains / (losses) - net include realized and unrealized gains and losses on derivatives accounted for at fair value through profit or loss and unrealized exchange gains and losses from the remeasurement of monetary assets and liabilities. Other gains / (losses) - net separately identifies other unusual, infrequent or non-recurring items. Such items are those that in managements judgment need to be disclosed by virtue of their size, nature or incidence. In determining whether an event or transaction is specific, management considers quantitative as well as qualitative factors such as the frequency or predictability of occurrence. This is consistent with the way that financial performance is measured by management and reported to the Board and Executive Committee and assists in providing a meaningful analysis of the trading results of the Group. The directors believe that this presentation aids the readers understanding of the financial performance. -10- Copyright © 2013 www.secdatabase.com. All Rights Reserved. Please Consider the Environment Before Printing This Document Interest income and expense Interest income is recorded using the effective interest rate method on loans receivable and on the interest bearing components of cash and cash equivalents. Interest expense on short and long-term financing is recorded at the relevant rates on the various borrowing agreements. Borrowing costs (including interest) incurred for the construction of any qualifying asset are capitalized during the period of time that is required to complete and prepare the asset for its intended use. Share-based payment arrangements Equity-settled share-based payments to employees and others providing similar services are measured at the fair value of the equity instruments at the grant date. The fair value determined at the grant date of the equity-settled share-based payments is expensed on a straight-line basis over the vesting period, based on the Groups estimate of equity instruments that will eventually vest, with a corresponding increase in equity. At the end of each reporting year, the Group revises its estimate of the number of equity instruments expected to vest. Property, plant and equipment Recognition and measurement Property, plant and equipment acquired by the Company are recorded at cost, which comprises the purchase price (including import duties and non-refundable purchase taxes), any costs directly attributable to bringing the asset to the location and condition necessary for it to be capable of operating in the manner intended by management and the estimated close down and restoration costs associated with the asset. Borrowing costs directly attributable to the acquisition or construction of a Property, plant and equipment are included in the cost. Subsequent to the initial recognition, property, plant and equipment is measured at cost less accumulated depreciation and impairment if any. Costs are capitalized into construction work in progress until such projects are completed and the assets are available for use. Subsequent costs Enhancements and replacements are capitalized as additions to property, plant and equipment only when it is probable that future economic benefits associated with them will flow to the Company and the cost of the item can be measured with reliability. Ongoing regular maintenance costs related to property, plant and equipment are expensed as incurred. Depreciation Land is not depreciated. Property, plant and equipment are depreciated over the estimated useful lives of the related assets using the straight-line method as follows: Buildings 10 50 years; Machinery and equipment 3 40 years; and Vehicles 5 8 years. Impairment tests for property, plant and equipment and intangible assets Property, plant and equipment and intangible assets subject to depreciation and amortization are reviewed for impairment if there is any indication that the carrying amount of the asset (or group of assets to which it belongs) may not be recoverable. The recoverable amount is based on the higher of fair value less costs to sell (market value) and value in use (determined using estimates of discounted future net cash flows of the asset or group of assets to which it belongs). Assets that are not subject to depreciation or amortization (such as goodwill) are tested for impairment at least annually. Financial instruments (i) Financial assets Copyright © 2013 www.secdatabase.com. All Rights Reserved. Please Consider the Environment Before Printing This Document Financial assets are classified as follows: (a) at fair value through profit or loss, and (b) loans and receivables. The classification depends on the purpose for which the financial assets were acquired. Management determines the classification of Constelliums financial assets at initial recognition. (a) At fair value through profit or loss: These are financial assets held for trading. A financial asset is classified in this category if it is acquired principally for the purpose of selling in the short term. Derivatives are also categorized as held for trading except when they are designated as hedging instruments in a hedging relationship that qualifies for hedge accounting in accordance with IAS 39. Assets in this category are classified as current assets if expected to be settled within 12 months; otherwise, they are classified as non-current. Financial assets carried at fair value through profit or loss, are initially recognized at fair value and transaction costs are expensed in the Consolidated Income Statement. (b) Loans and receivables: These are non-derivative financial assets with fixed or determinable payments that are not quoted in an active market. They are classified as current or non-current assets based on their maturity date. Loans and receivables are comprised of Trade receivables and other and non-current and current loans receivable in the Consolidated Statement of Financial Position. Loans and receivables are carried at amortized cost using the effective interest method, less any impairment. -11- Copyright © 2013 www.secdatabase.com. All Rights Reserved. Please Consider the Environment Before Printing This Document (ii) Financial liabilities Borrowings and other financial liabilities (excluding derivative liabilities) are recognized initially at fair value, net of transaction costs incurred and directly attributable to the issuance of the liability. These financial liabilities are subsequently measured at amortized cost using the effective interest rate method. Any difference between the amounts originally received (net of transaction costs) and the redemption value is recognized in the Consolidated Income Statement using the effective interest method. (iii) Derivative financial instruments Derivatives that are classified as held for trading are initially recognized at their fair value on the date at which the derivative contract is entered into and are subsequently remeasured to their fair value at the date of each Consolidated Statement of Financial Position, with the changes in fair value included in Other gains / (losses) net (see NOTE 8 - Other gains / (losses) - net). The Group has no derivatives designated for hedge accounting treatment, except for forward derivatives contracted to hedge the foreign currency risk on the estimated U.S dollar purchase price of the Wise entities (see NOTE 3 Acquisition of Wise entities). These foreign currency derivatives are designated as a hedge in a cash flow hedge relationship that qualifies for hedge accounting in accordance with IAS 39. The portion of the gain or loss on the hedging instrument that is determined to be an effective cash flow hedge is recognized in Other Comprehensive Income and the ineffective portion is recognized in Other gains / (losses) - net. (iv) Fair value Fair value is the price that would be received to sell an asset or paid to transfer a liability in an orderly transaction between market participants at the measurement date. Where available, relevant market prices are used to determine fair values. The Group periodically estimates the impact of credit risk on its derivatives instruments aggregated by counterparties. Credit Value Adjustments are calculated for asset derivatives at fair value. Debit Value Adjustments are calculated for credit derivatives at fair value. The fair value method used is based on historical probability of default, provided by leading rating agencies. (v) Offsetting financial instruments Financial assets and liabilities are offset and the net amount reported in the Consolidated Statement of Financial Position when there is a legally enforceable right to offset the recognized amounts and there is an intention to settle on a net basis or realize the asset and settle the liability simultaneously. Leases Constellium as the lessee Leases in which a significant portion of the risks and rewards of ownership are retained by the lessor are classified as operating leases. Various buildings, machinery and equipment from third parties are leased under operating lease agreements. Under such operating lease agreements, the total lease payments are recognized as rent expense on a straight-line basis over the term of the lease agreement, and are included in Cost of sales or Selling and administrative expenses, depending on the nature of the leased assets. Leases of property, plant and equipment where the Group has substantially all the risks and rewards of ownership are classified as finance leases. Various equipment from third parties are leased under finance lease agreements. Under such finance leases, the asset financed is recognized in Property, Plant and Equipment and the financing is recognized as a financial liability. Constellium as the lessor Certain land, buildings, machinery and equipment are leased to third parties under finance lease agreements. During the period of lease inception, the net book value of the related assets is removed from property, plant and equipment and a Finance lease receivable is recorded at the lower of the fair value and the aggregate future cash payments to be received from the lessee computed at an interest rate implicit in the lease. As the Finance lease receivable from the lessee is due, interest income is recognized. Inventories Inventories are valued at the lower of cost and net realizable value, primarily on a weighted-average cost basis. Copyright © 2013 www.secdatabase.com. All Rights Reserved. Please Consider the Environment Before Printing This Document Weighted-average costs for raw materials, stores, work in progress and finished goods are calculated using the costs experienced in the current period based on normal operating capacity (and include the purchase price of materials, freight, duties and customs, the costs of production, which includes labor costs, materials and other expenses which are directly attributable to the production process and production overheads). Trade accounts receivable Recognition and measurement Trade accounts receivable are recognized initially at fair value and subsequently measured at amortized cost using the effective interest method, less provision for impairment (if any). -12- Copyright © 2013 www.secdatabase.com. All Rights Reserved. Please Consider the Environment Before Printing This Document Impairment An impairment allowance of trade receivables is established when there is objective evidence that the Group will not be able to collect all amounts due. Indicators of impairment would include financial difficulties of the debtor, likelihood of the debtors insolvency, late payments, default or a significant deterioration in creditworthiness. The amount of the provision is the difference between the assets carrying value and the present value of the estimated future cash flows, discounted at the original effective interest rate. The expense (income) related to the increase (decrease) of the impairment allowance is recognized in the Consolidated Income Statement. When a trade receivable is deemed uncollectible, it is written off against the impairment allowance account. Subsequent recoveries of amounts previously written off are credited in the Consolidated Income Statement. Factoring arrangements In a non-recourse factoring arrangement, where the Group has transferred substantially all the risks and rewards of ownership of the receivables, the receivables are de-recognized from the statement of financial position. Where trade accounts receivable are sold with limited recourse, and substantially all the risks and rewards associated with these receivables are retained, receivables continue to be included in the Consolidated Statement of Financial Position. Inflows and outflows from factoring agreements in which the Group does not derecognize receivables are presented on a net basis as cash flows from financing activities. Arrangements in which the Group derecognizes receivables result in changes in trade receivables which are reflected as cash flows from operating activities. Cash and cash equivalents Cash and cash equivalents are comprised of cash in bank accounts and on hand, short-term deposits held on call with banks and other short-term highly liquid investments with original maturities of three months or less that are readily convertible into known amounts of cash and which are subject to insignificant risk of changes in value, less bank overdrafts that are repayable on demand, provided there is a right of offset. Share capital Ordinary shares are classified as equity. Incremental costs directly attributable to the issue of new ordinary shares or options are shown in equity as a deduction, net of tax, from the proceeds. Trade payables Trade payables are initially recorded at fair value and classified as current liabilities if payment is due in one year or less. Provisions Provisions are recorded for the best estimate of expenditures required to settle liabilities of uncertain timing or amount when management determines that a legal or constructive obligation exists as a result of past events, it is probable that an outflow of resources will be required to settle the obligation, and such amounts can be reasonably estimated. Provisions are measured at the present value of the expected expenditures to be required to settle the obligation. The ultimate cost to settle such liabilities is uncertain, and cost estimates can vary in response to many factors. The settlement of these liabilities could materially differ from recorded amounts. In addition, the expected timing of expenditure can also change. As a result, there could be significant adjustments to provisions, which could result in additional charges or recoveries affecting future financial results. Types of liabilities for which the Group establishes provisions include: Close down and restoration costs Estimated close down and restoration costs are accounted for in the year when the legal or constructive obligation arising from the related disturbance occurs and it is probable that an outflow of resources will be required to settle the obligation. These costs are based on the net present value of estimated future costs. Provisions for close down and restoration costs do not include any additional obligations which are expected to arise from future disturbance. The costs are estimated on the basis of a closure plan including feasibility and engineering studies, are updated annually during the life of the operation to reflect known developments (e.g. revisions to cost estimates and to the estimated lives of operations) and are subject to formal review at regular intervals each year. Copyright © 2013 www.secdatabase.com. All Rights Reserved. Please Consider the Environment Before Printing This Document The initial closure provision together with subsequent movements in the provisions for close down and restoration costs, including those resulting from new disturbance, updated cost estimates, changes to the estimated lives of operations and revisions to discount rates are capitalized within Property, plant and equipment. These costs are then depreciated over the remaining useful lives of the related assets. The amortization or unwinding of the discount applied in establishing the net present value of the provisions is charged to the Consolidated Income Statement as a financing cost in each accounting year. Environmental remediation costs Environmental remediation costs are accounted for based on the estimated present value of the costs of the Groups environmental clean-up obligations. Movements in the environmental clean-up provisions are presented as an operating cost within Cost of sales. Remediation procedures may commence soon after the time at which the disturbance, remediation process and estimated remediation costs become known, and can continue for many years depending on the nature of the disturbance and the technical remediation. -13- Copyright © 2013 www.secdatabase.com. All Rights Reserved. Please Consider the Environment Before Printing This Document Restructuring costs Provisions for restructuring are recorded when Constelliums management is demonstrably committed to the restructuring plan and where such liabilities can be reasonably estimated. The Group recognizes liabilities that primarily include one-time termination benefits, or severance, and contract termination costs, primarily related to equipment and facility lease obligations. These amounts are based on the remaining amounts due under various contractual agreements, and are periodically adjusted for any anticipated or unanticipated events or changes in circumstances that would reduce or increase these obligations. These costs are charged to restructuring costs in the Consolidated Income Statement. Legal, tax and other potential claims Provisions for legal claims are made when it is probable that liabilities will be incurred and when such liabilities can be reasonably estimated. For asserted claims and assessments, liabilities are recorded when an unfavorable outcome of a matter is deemed to be probable and the loss is reasonably estimable. Management determines the likelihood of an unfavorable outcome based on many factors such as the nature of the matter, available defenses and case strategy, progress of the matter, views and opinions of legal counsel and other advisors, applicability and success of appeals, process and outcomes of similar historical matters, amongst others. Once an unfavorable outcome is considered probable, management weights the probability of possible outcomes and the most reasonable loss is recorded. Legal matters are reviewed on a regular basis to determine if there have been changes in managements judgment regarding the likelihood of an unfavorable outcome or the estimate of a potential loss. Depending on their nature, these costs may be charged to Cost of sales or Other gains / (losses) net in the Consolidated Income Statement. Included in other potential claims are provisions for product warranties and guarantees to settle the net present value portion of any settlement costs for potential future legal actions, claims and other assertions that may be brought by Constelliums customers or the end-users of products. Provisions for product warranty and guarantees are charged to Cost of sales in the Consolidated Income Statement. In the accounting year when any legal action, claim or assertion related to product warranty or guarantee is settled, the net settlement amount incurred is charged against the provision established in the Consolidated Statement of Financial Position. The outstanding provision is reviewed periodically for adequacy and reasonableness by Constellium management. Management establishes tax reserves and accrues interest thereon, if deemed appropriate; in expectation that certain tax return positions may be challenged and that the Group might not succeed in defending such positions, despite managements belief that the positions taken were fully supportable. Pension, other post-employment healthcare plans and other long term employee benefits Payments to defined contribution retirement benefit plans are recognized as an expense when employees have rendered service entitling them to the contributions. Constelliums contributions to defined contribution pension plans are charged to the Consolidated Income Statement in the year to which the contributions relate. This expense is included in Cost of sales, Selling and administrative expenses or Research and development costs, depending on its nature. For defined benefit plans, the retirement benefit obligation recognized in the Consolidated Statement of Financial Position represents the present value of the defined benefit as reduced by the fair value of plan assets. The effects of changes in actuarial assumptions and experience adjustments are charged or credited to Other comprehensive income / (loss). The amount charged to the Consolidated Income Statement in respect of these plans (including the service costs and the effect of any curtailment or settlement, net interest costs) is included within the income / (loss) from operations. The defined benefit obligations are assessed in accordance with the advice of qualified actuaries. The most significant assumption used in accounting for pension plans is the discount rate. Post-employment benefit plans relate to health and life insurance benefits to retired employees and in some cases to their beneficiaries and covered dependants. Eligibility for coverage is dependent upon certain age and service criteria. These benefit plans are unfunded and are accounted for as defined benefit obligations, as described above. Other long term employee benefits include jubilees and other long-term disability benefits. For these plans, actuarial gains and losses arising in the year are recognized immediately in the Consolidated Income Statement. Taxation The current income tax expense is calculated on the basis of the tax laws enacted or substantively enacted at the Consolidated Statement of Financial Position date in the countries where the Company and its subsidiaries operate and generate taxable income. Copyright © 2013 www.secdatabase.com. All Rights Reserved. Please Consider the Environment Before Printing This Document The Group is subject to income taxes in the Netherlands, France, and numerous other jurisdictions. Certain of Constelliums businesses may be included in consolidated tax returns within the Company. In certain circumstances, these businesses may be jointly and severally liable with the entity filing the consolidated return, for additional taxes that may be assessed. -14- Copyright © 2013 www.secdatabase.com. All Rights Reserved. Please Consider the Environment Before Printing This Document Deferred income tax assets and liabilities are recognized for the estimated future tax consequences attributable to temporary differences between the financial statement carrying amounts of existing assets and liabilities and their respective tax bases. This approach also requires the recognition of deferred income tax assets for operating loss carryforwards and tax credit carryforwards. The effect on deferred tax assets and liabilities of a change in tax rates and laws is recognized as tax income in the year when the rate change is substantively enacted. Deferred income tax assets and liabilities are measured using tax rates that are expected to apply in the year when the asset is realized or the liability is settled, based on the tax rates and laws that have been enacted or substantively enacted at the date of the Consolidated Statement of Financial Position. Deferred income tax assets are recognized only to the extent that it is probable that future taxable profit will be available against which the temporary differences can be utilized. Presentation of financial statements The consolidated financial statements are presented in millions of Euros. Certain reclassifications may have been made to prior year amounts to conform to current year presentation. f. Judgments in applying accounting policies and key sources of estimation uncertainty Many of the amounts included in the consolidated financial statements involve the use of judgment and/or estimation. These judgments and estimates are based on managements best knowledge of the relevant facts and circumstances, giving consideration to previous experience. However, actual results may differ from the amounts included in the consolidated financial statements. Key sources of estimation uncertainty that have a significant risk of causing a material adjustment to the carrying amounts of assets and liabilities within the next financial year include the items presented below. Pension, other post-employment benefits and other long-term employee benefits The present value of the defined benefit obligations depends on a number of factors that are determined on an actuarial basis using a number of assumptions. The assumptions used in determining the defined benefit obligations and net pension costs include the discount rate and the rate of future compensation increases. In making these estimates and assumptions, management considers advice provided by external advisers, such as actuaries. Any material changes in these assumptions could result in a significant change in employee benefit expense recognized in the Consolidated Income Statement, actuarial gains and losses recognized in equity and prepaid and accrued benefits. Details of the key assumptions applied are set out in NOTE 21 - Pension liabilities and Other Post-employment Benefit Obligations. Taxes Significant judgment is sometimes required in determining the accrual for income taxes as there are many transactions and calculations for which the ultimate tax determination is uncertain during the ordinary course of business. The Group recognizes liabilities based on estimates of whether additional taxes will be due. Where the final tax outcome of these matters is different from the amounts that were recorded, such differences will impact the current and deferred income tax provisions, results of operations and possibly cash flows in the year in which such determination is made. Management judgment is required to determine the extent to which deferred tax assets can be recognized. In assessing the recognition of deferred tax assets, management considers whether it is more likely than not that the deferred tax assets will be utilized. The deferred tax assets will be ultimately utilized to the extent that sufficient taxable profits will be available in the periods in which the temporary differences become deductible. This assessment is conducted through a detailed review of deferred tax assets by jurisdiction and takes into account the scheduled reversals of taxable and deductible temporary differences, past, current and expected future performance deriving from the budget, the business plan and tax planning strategies. Deferred tax assets are not recognized in the jurisdictions where it is less likely than not that sufficient taxable profits will be available against which the deductible temporary differences can be utilized. Provisions Provisions have been recorded for: (a) close-down and restoration costs; (b) environmental remediation and monitoring costs; (c) restructuring programs; (d) legal and other potential claims including provisions for product income tax risks, warranty and guarantees, at amounts which represent managements best estimates of the expenditure required to settle the obligation at the date of the Consolidated Statement of Financial Position. Expectations will be revised each year until the actual liability is settled, with any difference accounted for in the year in which the revision is made. Main assumptions used are described in NOTE 22 - Provisions. Copyright © 2013 www.secdatabase.com. All Rights Reserved. Please Consider the Environment Before Printing This Document Purchase Accounting Business combinations are recorded in accordance with IFRS 3 using the acquisition method. Under this method, upon the initial consolidation of an entity over which the Group has acquired exclusive control, the identifiable assets acquired and the liabilities assumed are recognized at their fair value on the acquisition date. -15- Copyright © 2013 www.secdatabase.com. All Rights Reserved. Please Consider the Environment Before Printing This Document Therefore, through a number of different approaches and with the assistance of external independent valuation experts, the Group identified what it believes is the fair value of the assets and liabilities at the acquisition date. These valuations include a number of assumptions, estimations and judgments. Quantitative and qualitative information is further disclosed in NOTE 3 - Acquisition of Wise Entities. Significant assumptions which were used in determining allocation of fair value included the following valuation approaches: the cost approach, the income approach and the market approach which were determined based on cash flow projections and related discount rates, industry indices, market prices regarding replacement cost and comparable market transactions. While the Company believes that the estimates and assumptions underlying the valuation methodologies were reasonable, different assumptions could have resulted in different fair values. NOTE 3 - ACQUISITION OF WISE ENTITIES On October 3, 2014, Constellium announced that it had signed a definitive agreement to acquire 100% of Wise Metals Intermediate Holdings LLC (Wise), a private aluminum sheet producer located in Muscle Shoals, Alabama, United States of America. The closing of the acquisition took place on January 5, 2015. The transaction is therefore not included in the Groups consolidated financial statements as of December 31, 2014. In accordance with IFRS 3, Constellium will recognize the assets acquired and liabilities assumed, measured at fair value at the acquisition date, in its 2015 consolidated financial statements. The cash consideration amounts to 345 million, including expected contractual price adjustments. On November 19, 2014, Constellium contracted forward derivatives to hedge the foreign currency risk on the estimated U.S. dollar purchase price. These derivatives have been designated within a cash-flow hedge relationship that qualifies for hedge accounting in accordance with IAS 39. As a result, the fair value of these instruments, classified in Other Comprehensive Income for 9 million as of December 31, 2014, reduced the purchase price by 14 million at the acquisition date. With the assistance of an independent expert, Constellium has performed the preliminary valuation studies necessary to estimate, on a preliminary basis, the fair values as of January 5, 2015 of the assets acquired and liabilities assumed. These estimated fair values are subject to change, for a maximum 12 month period from the acquisition date, based upon managements final determination of the assets acquired and liabilities assumed. The following table reflects the preliminary goodwill arising as a result of the preliminary allocation of purchase price to the Wise assets acquired and liabilities assumed as of January 5, 2015: (in millions of Euros) Intangible assets Property, plant and equipment Net deferred tax assets Trade receivables and other Inventories Other financial assets Cash and cash equivalents Total assets acquired Borrowings Trade payables and other Pension and other post-employment benefit obligations Other financial liabilities Provisions and contingent liabilities Total liabilities assumed Net assets acquired at fair value Preliminary goodwill Total cash consideration net of hedge impact Estimated fair value 130 658 24 165 227 7 22 1,233 (999 (157 (8 (2 (55 (1,221 12 333 345 ) ) ) ) ) ) The preliminary valuation has resulted in the recognition of new intangible assets: customer relationships and technology. Property, Plant and Equipment, Inventories, Provisions and Borrowings have been remeasured at fair value. Copyright © 2013 www.secdatabase.com. All Rights Reserved. Please Consider the Environment Before Printing This Document The resulting and preliminary goodwill amounts to 333 million and is mainly supported by the leading position in the can and growing automotive markets in North America, and by the expected synergies between Wise and other existing Constellium activities, in particular in terms of production capacity, commercial base and purchasing, R&D and manufacturing functions. -16- Copyright © 2013 www.secdatabase.com. All Rights Reserved. Please Consider the Environment Before Printing This Document Had the acquisition of Wise taken place as of January 1, 2014, Constellium would have recognized a combined revenue of 4,663 million and a combined net income of 45 million for the year 2014. Acquisition costs were recognized as expenses in the line Other gains / (losses) - net of the Groups consolidated income statement (34 million as of December 31, 2014, of which 1 million paid in 2014). NOTE 4 - OPERATING SEGMENT INFORMATION Management has defined Constelliums operating segments based upon product lines, markets and industries it serves, and prepares and reports operating segment information to the Constellium chief operating decision maker (CODM) (see NOTE 2 Summary of Significant Accounting Policies) on that basis. Effective January 1, 2014, we changed the measure of profitability for our segments under IFRS 8 Operating segments from Management Adjusted EBITDA to Adjusted EBITDA. The Groups operating segments are described below. Aerospace and Transportation (A&T) A&T focuses on thick-gauge rolled high value-added products for customers in the aerospace, marine, automotive and masstransportation markets and engineering industries. A&T operates eight facilities in three countries. Packaging and Automotive Rolled Products (P&ARP) P&ARP produces and provides thin-gauge rolled products for customers in the beverage and closures, automotive, customized industrial sheet solutions and high-quality bright surface product markets. P&ARP operates two facilities in two countries. Automotive Structures and Industry (AS&I) AS&I focuses on specialty products and supplies a variety of hard and soft alloy extruded products, including technically advanced products, to the automotive, industrial, energy, electrical and building industries, and to manufacturers of mass transport vehicles and shipbuilders. AS&I operates fifteen facilities in seven countries. Holdings & Corporate Holdings & Corporate include the net cost of Constelliums head office and corporate support functions. Intersegment elimination Intersegment trading is conducted on an arms length basis and reflects market prices. The accounting principles used to prepare the Companys operating segment information are the same as those used to prepare the Groups consolidated financial statements. Segment Revenue (in millions of Euros) A&T P&ARP AS&I Holdings & Corporate(A) Total Year ended December 31, 2014 Revenue Third and Segment Inter segment related revenue elimination parties 1,197 1,576 921 31 3,725 (5 (8 (46 (59 ) ) ) ) 1,192 1,568 875 31 3,666 Year ended December 31, 2013 Revenue Third and Segment Inter segment related revenue elimination parties Year ended December 31, 2012 Revenue Third and Segment Inter segment related revenue elimination parties 1,204 1,480 859 21 3,564 1,188 1,561 910 13 3,672 (7 (8 (54 (69 ) ) ) ) 1,197 1,472 805 21 3,495 (6 (7 (49 (62 ) ) ) ) 1,182 1,554 861 13 3,610 (A) Includes revenue from metal supply to plants in Ham and Saint Florentin which are considered as third parties since their disposal in the second quarter of 2013. -17Copyright © 2013 www.secdatabase.com. All Rights Reserved. Please Consider the Environment Before Printing This Document Reconciliation of Adjusted EBITDA to Net Income (in millions of Euros) A&T P&ARP AS&I Holdings & Corporate Adjusted EBITDA Metal price lag(A) Wise acquisition costs (B) Start-up and development costs(C) Gains on Ravenswood OPEB plan amendments Income tax contractual reimbursements Ravenswood CBA renegociation Swiss pension plan settlements Apollo management fees Share Equity Plans Restructuring costs Losses on disposal Unrealized (losses) / gains on derivatives Unrealized exchange gains / (loss) from the remeasurement of monetary assets and liabilities - net Depreciation and impairment Other Income from operations Other expenses Finance costs - net Share of (loss) / profit of joint-ventures Income before income tax Income tax expense Net Income from continuing operations Net income / (loss) from discontinued operations Net Income Notes 3 8, 21 8 8 8 32 8, 23 8 8 6 10 11, 23 Year ended December 31, 2014 91 118 73 (7 275 27 (34 (11 9 8 6 (4 (12 (5 (53 1 (49 (8 150 (58 (1 91 (37 54 54 Year ended December 31, 2013 ) ) ) ) ) ) ) ) ) ) ) ) 120 105 58 (3 280 (29 (7 11 (2 (2 (8 (5 12 2 (32 (11 209 (27 (50 3 135 (39 96 4 100 Year ended December 31, 2012 ) ) ) ) ) ) ) ) ) ) ) ) 106 92 46 (21 223 (16 58 (7 (8 (3 (1 (25 61 (1 (14 (4 263 (3 (60 (5 195 (46 149 (8 141 ) ) ) ) ) ) ) ) ) ) ) ) ) ) ) (A) Represents the financial impact of the timing difference between when aluminum prices included within Constellium revenues are established and when aluminum purchase prices included in cost of sales are established. The Group accounts for inventory using a weighted average price basis. This adjustment is to remove the effect of volatility in LME prices. The calculation of the Group metal price lag adjustment is based on an internal standardized methodology calculated at each of Constellium manufacturing sites. It is calculated as the average value of product recorded in inventory, which approximates the spot price in the market, less the average value transferred out of inventory, which is the weighted average of the metal element of cost of goods sold, by the quantity sold in the period. (B) On January 5, 2015 Constellium acquired Wise Metals Intermediate Holdings LLC (refer to NOTE 3 Acquisition of Wise entities). As of December 31, 2014 costs relating to the acquisition amounted to 34 million (17 million of transaction fees and 17 million related to the financing of the acquisition). (C) Start-up costs relating to new sites and business development initiatives of which 6 million related to the expansion of the site in Van Buren, U.S, and 5 million related to Body in White growth project both in Europe and the U.S. Copyright © 2013 www.secdatabase.com. All Rights Reserved. Please Consider the Environment Before Printing This Document Entity-wide information about product and services Year ended December 31, 2014 (in millions of Euros) Aerospace rolled products Transportation, Industry and other rolled products Packaging rolled products Automotive rolled products Specialty and other thin-rolled products Automotive extruded products Other extruded products Other Total revenue Year ended December 31, 2013 Year ended December 31, 2012 667 655 584 525 1,160 225 542 1,138 162 598 1,196 144 183 413 462 31 3,666 172 334 471 21 3,495 214 355 506 13 3,610 -18- Copyright © 2013 www.secdatabase.com. All Rights Reserved. Please Consider the Environment Before Printing This Document Segment capital expenditure Year ended December 31, 2014 (in millions of Euros) A&T P&ARP AS&I Holdings & Corporate Capital expenditure (71 (74 (48 (6 (199 Year ended December 31, 2013 ) ) ) ) ) (53 (37 (49 (5 (144 Year ended December 31, 2012 ) ) ) ) ) (42 (39 (40 (5 (126 ) ) ) ) ) Segment assets Segment assets are comprised of total assets of Constellium by segment, less investments in joint-ventures, deferred tax assets, other financial assets (including cash and cash equivalents) and assets of the disposal group classified as held for sale. At December 31, 2014 (in millions of Euros) A&T P&ARP AS&I Holdings & Corporate Segment Assets Unallocated: Adjustments for investments in joint-ventures Deferred income tax assets Other financial assets (including cash and cash equivalents) Assets of disposal group classified as held for sale Total Assets At December 31, 2013 697 390 333 288 1,708 551 373 267 109 1,300 21 190 1 177 1,079 265 14 3,012 21 1,764 Information about major customers Included in revenue arising from the P&ARP segment for the year ended December 31, 2014, is revenue of approximately 406 million (year ended December 31, 2013: 378 million; year ended December 31, 2012: 441 million) which arose from sales to the Groups largest customer. No other single customers contributed 10% or more to the Groups revenue for 2014, 2013 and 2012. NOTE 5 - INFORMATION BY GEOGRAPHIC AREA The Group reports information by geographic area as follows: revenues from third and related parties are based on destination of shipments and property, plant and equipment are based on the physical location of the assets. Year ended December 31, 2014 (in millions of Euros) Revenue third and related parties France Germany United Kingdom Switzerland Other Europe United States Canada Asia and Other Pacific All Other Total 533 1,035 336 85 755 524 51 174 173 3,666 -19- Copyright © 2013 www.secdatabase.com. All Rights Reserved. Please Consider the Environment Before Printing This Document Year ended December 31, 2013 535 961 346 88 742 448 53 142 180 3,495 Year ended December 31, 2012 596 1,073 275 98 723 471 56 136 182 3,610 At December 31, 2014 (in millions of Euros) Property, plant and equipment France Germany Switzerland Czech Republic Other Europe United States All Other Total At December 31, 2013 290 99 34 21 3 179 6 632 180 87 23 18 2 96 2 408 NOTE 6 - EXPENSES BY NATURE (in millions of Euros) Notes Raw materials and consumables used(A) Employee benefit expenses Energy costs Repairs and maintenance expenses Sub-contractors Freight out costs Consulting and audit fees Operating supplies (non capitalized purchases of manufacturing consumables) Operating lease expenses Depreciation and impairment Other expenses Total Cost of sales, Selling and administrative expenses and Research and development expenses 7 Year ended December 31, 2014 Year ended December 31, 2013 Year ended December 31, 2012 (1,952 (708 (149 (88 (78 (80 (40 ) ) ) ) ) ) ) (1,860 (670 (150 (80 (80 (75 (50 ) ) ) ) ) ) ) (1,987 (701 (140 (91 (66 (66 (43 ) ) ) ) ) ) ) (64 (20 (49 (193 ) ) ) ) (63 (16 (32 (194 ) ) ) ) (58 (16 (14 (202 ) ) ) ) (3,421 ) (3,270 ) (3,384 ) (A) The Company manages fluctuations in raw materials prices in order to protect manufacturing margins through the purchase of derivative instruments (see NOTE 24 - Financial Risk Management and NOTE 25 - Financial Instruments). These expenses are split as follows: Year ended December 31, 2014 (in millions of Euros) Cost of sales Selling and administrative expenses Research and development expenses Total Cost of sales, Selling and administrative expenses and Research and development expenses Year ended December 31, 2013 Year ended December 31, 2012 (3,183 (200 (38 ) ) ) (3,024 (210 (36 ) ) ) (3,136 (212 (36 ) ) ) (3,421 ) (3,270 ) (3,384 ) NOTE 7 - EMPLOYEE BENEFIT EXPENSES (in millions of Euros) Wages and salaries(A) Pension costs - defined benefit plans Other post-employment benefits Share equity plan expenses Total Employee benefit expenses Notes 21 21 32 Year ended December 31, 2014 (661 (26 (17 (4 (708 Year ended December 31, 2013 ) ) ) ) ) Copyright © 2013 www.secdatabase.com. All Rights Reserved. Please Consider the Environment Before Printing This Document (628 (28 (12 (2 (670 Year ended December 31, 2012 ) ) ) ) ) (653 (29 (18 (1 (701 ) ) ) ) ) (A) Wages and salaries exclude restructuring costs and include social security contributions. -20- Copyright © 2013 www.secdatabase.com. All Rights Reserved. Please Consider the Environment Before Printing This Document NOTE 8 - OTHER GAINS / (LOSSES) NET (in millions of Euros) Notes Realized losses on derivatives Unrealized (losses) / gains on derivatives at fair value through Profit and Loss - net(A) Unrealized exchange gains / (losses) from the remeasurement of monetary assets and liabilities net Swiss pension plan settlements Ravenswood OPEB pension plan amendments Ravenswood CBA renegotiation(B) Income tax contractual reimbursements Losses on disposal(C) Wise acquisition costs Other - net Total Other (losses) / gains - net Year ended December 31, 2014 Year ended December 31, 2013 Year ended December 31, 2012 (13 ) (31 4 (53 ) 12 61 4 21 21 1 6 9 8 (5 (34 (2 (83 ) ) ) ) 2 11 (5 3 (8 (1 (8 58 (7 4 62 11 3 ) ) ) (45 ) ) ) ) (A) The gains or losses are made up of unrealized losses or gains on derivatives entered into with the purpose of mitigating exposure to volatility in foreign currency and LME prices (refer to NOTE 24 - Financial Risk Management for a description of the Groups risk management). (B) In 2012, Constellium Ravenswood Rolled Products entered into a period of renegotiation of the Collective bargaining agreement (CBA). The negotiation and the settlement of the new CBA involved additional costs which would not be incurred in the ordinary course of business. (C) On October 27, 2014, the Group sold its plant in Tarascon sur Ariège, France and incurred a 7 million loss. The plant generated revenues of 9 million in 2014 (12 million in 2013). In September 2014, the plant in Sierre, Switzerland disposed fixed assets and generated gains on disposal for 2 million. In 2013, the sale of the Groups plants in Ham and Saint Florentin, France, was completed. NOTE 9 - CURRENCY GAINS / (LOSSES) The currency gains and losses are included in the consolidated financial statements as follows: Consolidated income statement (in millions of Euros) Notes Included in Cost of sales Included in Other (losses) / gains - net Included in Finance costs Total 10 Realized exchange losses on foreign currency derivatives - net Unrealized exchange (losses) / gains on foreign currency derivatives - net Exchange (losses) / gains from the remeasurement of monetary assets and liabilities net Total Year ended December 31, 2014 11 (52 2 (39 Year ended December 31, 2013 Year ended December 31, 2012 ) (2 23 2 23 (12 ) (18 (12 ) 13 20 (15 (39 ) ) 10 23 (3 (1 ) Copyright © 2013 www.secdatabase.com. All Rights Reserved. Please Consider the Environment Before Printing This Document ) 1 19 (21 (1 ) ) ) ) ) Foreign currency translation reserve Year ended December 31, 2014 (in millions of Euros) Foreign currency translation reserve January 1 Effect of exchange rate changes net Foreign currency translation reserve December 31 (14 (14 (28 Year ended December 31, 2013 ) ) ) (14 (14 ) ) See NOTE 24 - Financial Risk Management and NOTE 25 - Financial Instruments for further information regarding the Companys foreign currency derivatives and hedging activities. -21- Copyright © 2013 www.secdatabase.com. All Rights Reserved. Please Consider the Environment Before Printing This Document NOTE 10 - FINANCE COSTS - NET (in millions of Euros) Notes Finance income: Realized and unrealized gains on debt derivatives at fair value(D) Realized and unrealized exchange gains on financing activities - net Other finance income Total Finance income Finance costs: Interest expense on borrowings(A) Interest expense on factoring arrangements(B) Exit fees and unamortized arrangement fees(C) Realized and unrealized losses on debt derivatives at fair value(D) Realized and unrealized exchange losses on financing activities - net(D) Other finance expense Total Finance costs Finance costs - net Year ended December 31, 2014 Year ended December 31, 2013 Year ended December 31, 2012 9 29 4 9 1 30 11 2 17 4 4 19 16 19 (32 (9 (15 9 9 (27 (5 (88 (58 ) ) ) ) ) ) ) (22 (10 (21 ) ) ) (17 (15 (7 ) ) ) (13 ) (18 ) (1 (67 (50 ) ) ) (3 (4 (64 (60 ) ) ) ) (A) Includes at December 31, 2014: (i) 24 million of interests expensed during the year related to the 2013 term loan and to the Senior Notes for respectively 7 million and 17 million; and 6 million of interests accrued related to the Senior Notes; (ii) 2 million of interest expenses related to the U.S. Revolving Credit Facility. Includes at December 31, 2013: (i) 3 million of interests expensed during the year related to the 2012 term loan and 17 million of interests accrued during the year related to the 2013 term loan; (ii) 2 million of interest expenses related to the U.S. Revolving Credit Facility. Includes at December 31, 2012: (i) 6 million of interests expensed during the year related to the 2011 term loan and 9 million of interests expensed during the year related to the 2012 term loan; (ii) 2 million of interest expenses related to the U.S. Revolving Credit Facility. (B) Includes interests and amortization of deferred financing costs related to trade accounts receivable factoring programs (see NOTE 16 - Trade Receivables and Other). (C) During the second quarter of 2014, Constellium issued Senior Notes and repaid the 2013 term loan. Arrangement fees of the 2013 term loan which were not amortized under the effective rate method, and exit fees, were fully recognized as financial expenses during this period. As of December 31, 2014, exit and arrangement fees amounted respectively to 6 million and 9 million. During the first quarter of 2013, Constellium issued the 2013 term loan facility and repaid the 2012 term loan. Arrangement fees of the 2012 term loan which were not amortized under the effective rate method, and exit fees, were fully recognized as financial expenses during this period. As of December 31, 2013, exit and arrangement fees amounted respectively to 8 million and 13 million. During the second quarter of 2012, Constellium issued the 2012 term loan facility and repaid the 2011 term loan. Arrangement fees of the 2011 term loan which were not amortized under the effective rate method, and exit fees, were fully recognized as financial expenses during this period. As of December 31, 2012, exit and arrangement fees amounted respectively to 5 million and 2 million. (D) During the second quarter of 2014, the cross currency swap was settled when the 2013 term loan was repaid. The resulting realized loss offset the realized gain on the settled U.S. dollar 2013 Term Loan. In addition, the Group hedged the dollar exposure relating to the principal of the U.S. Dollar Senior Notes. The principal of the U.S. Dollar Senior Notes is hedged by using floating-floating cross currency basis swaps indexed on floating Euro and U.S. Dollar interest rates. Changes in the fair value of hedges related to this translation exposure were recognized within finance income in the consolidated income statement and offset the unrealized losses related to U.S Dollar Senior Notes revaluation. Copyright © 2013 www.secdatabase.com. All Rights Reserved. Please Consider the Environment Before Printing This Document NOTE 11 - INCOME TAX The current and deferred components of income tax are as follows: (in millions of Euros) Current tax expense Deferred tax expense Total income tax expense Year ended December 31, 2014 (34 (3 (37 Year ended December 31, 2013 ) ) ) (29 (10 (39 -22- Copyright © 2013 www.secdatabase.com. All Rights Reserved. Please Consider the Environment Before Printing This Document Year ended December 31, 2012 ) ) ) (30 (16 (46 ) ) ) Using a composite statutory income tax rate applicable by tax jurisdiction, the income tax can be reconciled as follows: (in millions of Euros) Income before income tax Composite statutory income tax rate applicable by tax jurisdiction Income tax expense calculated at composite statutory tax rate applicable by tax jurisdiction Tax effect of: Changes in recognized and unrecognized deferred tax assets Other(A) Income tax expense Effective income tax rate Year ended December 31, 2014 Year ended December 31, 2013 91 Year ended December 31, 2012 135 195 31.0 % 36.0 % 38.6 % (28 ) (48 ) (75 ) (3 (6 (37 41 ) ) ) % 1 8 (39 29 ) % 28 1 (46 24 ) % (A) Including non-deductible items and certain contractual reimbursements. Our composite statutory income tax rate of 31.0% in the year ended December 31, 2014, 36.0% in the year ended December 31, 2013 and of 38.6% in the year ended December 31, 2012 resulted from the statutory tax rates (i) in France of 38.0% in 2014 and in 2013 and 36.1% in 2012, (ii) in the United States of 43% in 2014, 40.1% in 2013 and 41.2% in 2012, (iii) in Germany of 29% in 2014, in 2013 and in 2012, (iv) in the Netherlands of 25% in 2014, in 2013 and in 2012 and (v) in Czech Republic of 19% in 2014, in 2013 and in 2012. The 5.0% decrease in our composite tax rate from 2013 to 2014 and the 2.6% decrease in our composite tax rate from 2012 to 2013 resulted from a lower weight of profits in higher tax rate jurisdictions most notably France and in the United States combined with a higher weight of profits in lower tax rate jurisdictions most notably in Czech Republic in 2014. NOTE 12 - EARNINGS PER SHARE Earnings (in millions of Euros) Earnings used to calculate basic and diluted earnings per share from continuing operations Earnings used to calculate basic and diluted earnings per share from discontinued operations Earnings attributable to equity holders of the parent used to calculate basic and diluted earnings per share Year ended December 31, 2014 Year ended December 31, 2013 Year ended December 31, 2012 51 94 147 4 (8 51 98 139 ) Number of shares see NOTE 18 Share Capital Year ended December 31, 2014 Weighted average number of ordinary shares used to calculate basic earnings per share(A) Effect of other dilutive potential ordinary shares(B) Weighted average number of ordinary shares used to calculate diluted earnings per share Year ended December 31, 2013 Year ended December 31, 2012 104,639,342 687,530 98,219,458 671,487 89,442,416 105,326,872 98,890,945 89,442,416 (A) Based on the total number of all classes of shares (former A, B1 and B2) until the IPO on May 22, 2013, and on the total number of Class A ordinary shares from the IPO (See NOTE 18 Share Capital). Prior to the IPO, the Class B ordinary shares were included in the basic and diluted earnings per share calculation as the Class A and Class B ordinary shares had equal rights to profit allocation and dividends and Class B ordinary shares, once issued, could not be repurchased nor cancelled by the Company without the consent of the holder. In connection with our IPO, the Management Equity Plan (MEP) was frozen so that there Copyright © 2013 www.secdatabase.com. All Rights Reserved. Please Consider the Environment Before Printing This Document could be no additional issuances or reallocations thereunder of Class B ordinary shares among MEP participants. In addition, from the date of the IPO, at the request of the MEP participants and in certain circumstances, the Company was committed to repurchase these shares, and may subsequently cancel them (including the related accumulated rights to profit). Accordingly, from the IPO date, Class B ordinary shares have been excluded from the calculation of the weighted average number of ordinary shares used to calculate the basic earnings per share. As Class B ordinary shares are ultimately converted into Class A ordinary shares when the Company does not have to repurchase them, they are included in the calculation of the weighted average number of ordinary shares used to calculate the diluted earnings per share. -23- Copyright © 2013 www.secdatabase.com. All Rights Reserved. Please Consider the Environment Before Printing This Document (B) Includes B shares as they give rights to profit allocation and dividends and potential new ordinary shares to be issued as part of the Co-investment plan, the Equity award plan, the Free Share and the Shareholding Retention Program. (See NOTE 32 Share Equity Plan). All potential dilutive new ordinary shares were taken into account into the diluted earnings per share. There were no instrument excluded from the computation of diluted earnings per share because their effect was antidilutive. Earnings per share attributable to the equity holders of the company (in Euros per share) From continuing and discontinued operations Basic Diluted From continuing operations Basic Diluted From discontinued operations Basic Diluted Year ended December 31, 2014 Year ended December 31, 2013 Year ended December 31, 2012 0.48 0.48 1.00 0.99 1.55 1.55 0.48 0.48 0.96 0.95 1.64 1.64 0.04 0.04 (0.09 (0.09 ) ) NOTE 13 - INTANGIBLE ASSETS (including GOODWILL) Goodwill in the amount of 11 million (relating solely to the acquisition of the entities and business of Rio Tinto Engineered Aluminium Products on January 4, 2011) has been allocated to the Groups operating segment Aerospace and Transportation (A&T) 5 million, Packaging and Automotive Rolled Products (P&ARP) 4 million and Automotive Structures and Industry (AS&I) 2 million. During the years ended December 31, 2014 and 2013, no other material movements occurred in intangible assets, including goodwill. Impairment tests for goodwill As of December 31, 2014, 2013 and 2012, the recoverable amount of the operating segments has been determined based on value-in-use calculations and significantly exceeded their carrying value. NOTE 14 - PROPERTY, PLANT AND EQUIPMENT Property, plant and equipment balances and movements are comprised as follows: Land and Property Rights (in millions of Euros) Net balance at January 1, 2014 Additions Disposals Depreciation expense Impairment losses Transfer during the year Exchange rate movements Net balance at December 31, 2014 At December 31, 2014 Cost Less accumulated depreciation and impairment Net balance at December 31, 2014 Machinery and Equipment Buildings 1 1 28 15 (2 18 2 61 1 1 67 (6 61 ) ) -24- Copyright © 2013 www.secdatabase.com. All Rights Reserved. Please Consider the Environment Before Printing This Document 252 31 (42 128 14 383 459 (76 383 Construction Work in Progress ) ) 119 208 (1 (147 4 183 183 183 Other ) ) Total 8 (2 ) (2 ) 4 408 254 (46 ) (1 ) (3 ) 20 632 12 (8 ) 4 722 (90 ) 632 Land and Property Rights (in millions of Euros) Net balance at January 1, 2013 Additions Disposals Depreciation expense Transfer during the year Reclassified as Assets held for sale Exchange rate movements Net balance at December 31, 2013 At December 31, 2013 Cost Less accumulated depreciation and impairment Net balance at December 31, 2013 Machinery and Equipment Buildings 1 1 20 1 (3 11 (1 28 1 1 32 (4 28 ) ) ) 154 40 (3 (24 89 (4 252 Construction Work in Progress 115 115 (1 (108 (2 119 ) ) ) 287 (35 252 Other ) ) ) 119 119 ) Total 13 1 (4 ) (2 ) 8 302 156 (3 ) (31 ) (9 ) (1 ) (6 ) 408 14 (6 ) 8 453 (45 ) 408 Building, machinery and equipment includes the following amounts where the Group is a lessee under a finance lease: (in millions of Euros) Buildings under finance lease Machinery and equipment under Finance lease Total At December 31, 2014 Gross Accumulated value depreciation Net 16 16 32 (1 (1 ) ) At December 31, 2013 Gross Accumulated value depreciation Net 16 15 31 3 3 3 3 In 2014, the Group contracted two finance leases under a sale-leaseback transaction in Constellium Automotive USA, LLC, in order to finance specific equipment in Novi and the expansion of Van Buren buildings for respectively 10 million and 16 million. The future aggregate minimum lease payments under non-cancellable finance leases are as follows: (in millions of Euros) Less than 1 year 1 to 5 years More than 5 years Total At December 31, 2014 6 19 15 40 At December 31, 2013 1 2 3 The present value (PV) of future aggregate minimum lease payments under non-cancellable finance leases are as follows: (in millions of Euros) Less than 1 year 1 to 5 years More than 5 years Total At December 31, 2014 5 18 8 31 Copyright © 2013 www.secdatabase.com. All Rights Reserved. Please Consider the Environment Before Printing This Document At December 31, 2013 1 2 3 Depreciation expense and impairment losses Total depreciation expense and impairment losses relating to property, plant and equipment are included in the Consolidated Income Statement as follows: Year ended December 31, 2014 (in millions of Euros) Cost of sales Selling and administrative expenses Total (42 (5 (47 Year ended December 31, 2013 ) ) ) (28 (3 (31 Year ended December 31, 2012 ) ) ) (8 (6 (14 ) ) ) The amount of contractual commitments for the acquisition of property, plant and equipment is disclosed in NOTE 28 - Commitments. -25- Copyright © 2013 www.secdatabase.com. All Rights Reserved. Please Consider the Environment Before Printing This Document NOTE 15 - INVENTORIES Inventories are comprised of the following: At December 31, 2014 (in millions of Euros) Finished goods Work in progress Raw materials Stores and supplies Net realizable value adjustment Total inventories 122 164 122 30 (6 432 At December 31, 2013 84 136 91 23 (6 328 ) ) Constellium records inventories at the lower of cost and net realizable value. Increases / (decreases) in the net realizable value adjustment on inventories are included in Cost of sales in the Consolidated Income Statement. NOTE 16 - TRADE RECEIVABLES AND OTHER Trade receivables and other are comprised of the following: (in millions of Euros) Trade receivables - third parties - gross Impairment allowance Trade receivables - third parties - net Trade receivables - related parties Total Trade receivables - net Finance lease receivables Deferred financing costs - net of amounts amortized Deferred tooling related costs Current income tax receivables Other taxes Restricted cash(A) Other Total Other receivables Total Trade receivables and Other At December 31, 2014 Non-current Current 434 (3 431 431 5 3 10 15 50 54 137 568 22 2 1 10 13 48 48 At December 31, 2013 Non-current Current ) 26 3 3 13 9 6 60 60 365 (3 362 1 363 5 3 12 41 35 24 120 483 ) (A) Relating to a pledge given to the State of West Virginia as a guarantee for certain workers compensation obligations for which the company is self-insured. Aging The aging of total trade receivables - net is as follows: (in millions of Euros) Current 1 30 days past due 31 60 days past due 61 90 days past due Greater than 91 days past due Total Trade receivables net At December 31, 2014 415 13 1 1 1 431 At December 31, 2013 345 15 2 1 363 Impairment allowance The Group periodically reviews its customers account aging, credit worthiness, payment histories and balance trends in order to evaluate trade accounts receivable for impairment. Management also considers whether changes in general economic conditions and in Copyright © 2013 www.secdatabase.com. All Rights Reserved. Please Consider the Environment Before Printing This Document the industries in which the Group operates in particular, are likely to impact the ability of the Groups customers to remain within agreed payment terms or to pay their account balances in full. Revisions to the impairment allowance arising from changes in estimates are included as either additional allowance or recoveries, with the corresponding expense or income included in Selling and administrative expenses. An impairment allowance amounting to 0.5 million was recognized during the year ended December 31, 2014 (0.1 million during the year ended December 31, 2013). None of the other amounts included in Other receivables was deemed to be impaired. -26- Copyright © 2013 www.secdatabase.com. All Rights Reserved. Please Consider the Environment Before Printing This Document The maximum exposure to credit risk at the reporting date is the carrying value of each class of receivable shown above. The Group does not hold any collateral from its customers or debtors as security. Currency concentration The composition of the carrying amounts of total Trade receivables - net by currency is shown in Euro equivalents as follows: (in millions of Euros) Euro U.S. Dollar Swiss Franc Other currencies Total Trade receivables net At December 31, 2014 207 199 11 14 431 At December 31, 2013 188 155 10 10 363 Factoring arrangements The Group entered into factoring arrangements with third parties for the sale of certain of the Groups accounts receivable in Germany, Switzerland and France. Under these programs, Constellium agrees to sell to the factor eligible accounts receivable, for working capital purposes, up to a maximum financing amount of 350 million, allocated as follows: 115 million collectively available to Germany and Switzerland; and 235 million available to France. Under these arrangements, most of accounts receivable are sold with recourse. Sales of most of these receivables do not qualify for derecognition under IAS 39 Financial Instruments: Recognition and Measurement, as the Group retains substantially all of the associated risks and rewards. Where the Group has transferred substantially all the risks and rewards of ownership of the receivable, the receivables are derecognized from the statement of financial position. Under the agreements, as of December 31, 2014, the total carrying amount of the original assets factored is 323 million (December 31, 2013: 259 million) of which: 229 million (December 31, 2013: 207 million) recognized on the Consolidated Statement of Financial Position; 94 million (December 31, 2013: 52 million) derecognized from the Consolidated Statement of Financial Position as the Group transferred substantially all of the associated risks and rewards to the factor. As at December 31, 2014 and December 31, 2013, there was no amount due to the factor relating to trade account receivables sold. Interest costs and other fees Under both the Germany/Switzerland and France factoring agreements, interest is charged at the three-month EURIBOR (Euro Interbank Offered Rate) or LIBOR (London Interbank Offered Rate) rate plus 1.95% from November 8, 2013, (previously 2.25%) and is payable monthly. Other fees include an unused facility fee of 1% per annum (calculated based on the unused amount of the net position, as defined in the agreements). Additional factoring commissions and administration fees (based on the volume of sold receivables) are also assessed and payable monthly. During the year ended December 31, 2014, Constellium incurred 9 million in interest and other fees (10 million during the year ended December 31, 2013) from these arrangements that are included as finance costs (see NOTE 10 - Finance Costs - Net). Additionally, under each of the factoring agreements, the Group paid a one-time, up-front arrangement fee of 2.25% of the initial aggregate maximum financing amount of 300 million (for both agreements), which totaled 7 million. These arrangement fees plus an additional 7 million in legal and other fees related to the factoring agreements are being amortized as finance costs over a period of five years (see NOTE 10 - Finance Costs - Net). During the year ended December 31, 2014, 2 million of such costs was amortized as finance costs (3 million during the years ended December 31, 2013, and December 31, 2012). At December 31, 2014, the Group had 3 million (5 million as at December 31, 2013, and 8 million as at December 31, 2012) in unamortized up-front and legal fees related to the factoring arrangements (included in deferred financing costs). Copyright © 2013 www.secdatabase.com. All Rights Reserved. Please Consider the Environment Before Printing This Document Covenants The factoring arrangements contain certain affirmative and negative covenants, including relating to the administration and collection of the assigned receivables, the terms of the invoices and the exchange of information, but do not contain restrictive financial covenants other than a Group level minimum liquidity covenant that is tested quarterly. The Group was in compliance with all applicable covenants as of and for the years ended December 31, 2014 and 2013. -27- Copyright © 2013 www.secdatabase.com. All Rights Reserved. Please Consider the Environment Before Printing This Document Intercreditor agreement On January 4, 2011, the Group entered into an Intercreditor Agreement between the French, German and Swiss sellers of the Groups receivables under the various accounts receivable factoring programs described above and the purchasers of those receivables. In accordance with the requirements of the Intercreditor Agreement, the parent company of the sellers has guaranteed amounts sold under the factoring program to the purchasers of such accounts receivable with recourse. The Intercreditor Agreement remains in effect for any seller of receivables until all of the factoring agreements for such seller are terminated. Deferred financing costs The Group incurs certain financing costs with third parties associated with its factoring arrangements and U.S. Revolving Credit facility. Amortization of these deferred finance costs is included in Finance costs - net in the Consolidated Income Statement. Costs incurred and amortization recognized throughout the periods presented are shown in the table below. (in millions of Euros) Financing costs incurred and deferred Up-front facility arrangement fees Other direct expenses Total incurred and deferred Less: amounts amortized during the year 2014 2013 2012 2011 Deferred financing costs at December 31 Year ended December 31, 2014 U.S. Revolving Factoring Credit Arrangements Facility Other Total Year ended December 31, 2013 U.S. Revolving Factoring Credit Arrangements facility Total Year ended December 31, 2012 U.S. Revolving Factoring Credit Arrangements facility Total 7 7 3 2 3 10 12 7 7 3 2 10 9 7 7 3 2 10 9 14 5 3 22 14 5 19 14 5 19 (1 ) (4 (4 (5 (4 (3 (3 (2 (1 (5 ) (4 ) 2 5 (2 (3 (3 (3 3 ) ) ) ) (1 (1 (2 (1 ) ) ) ) ) ) ) ) (3 (3 (3 ) ) ) 5 (1 (2 (1 ) ) ) 1 (4 (5 (4 ) ) ) 6 ) ) 8 ) ) 2 10 Finance lease receivables The Company is the lessor on certain finance leases with third parties for certain of its property, plant and equipment located in Sierre, Switzerland and up to June 2013 in Teningen, Germany. The following table shows the reconciliation of the Groups gross investments in the leases to the net investment in the leases as at December 31, 2012, 2013 and 2014. (in millions of Euros) Within 1 year Between 1 and 5 years Later than 5 years Total Finance lease receivables Year ended December 31, 2014 Gross Unearned Net investment interest investment in the lease income in the lease Year ended December 31, 2013 Gross Unearned Net investment interest investment in the lease income in the lease Year ended December 31, 2012 Gross Unearned Net investment interest investment in the lease income in the lease 6 23 (1 (1 ) ) 5 22 6 22 6 (1 (2 ) ) 5 20 6 8 28 11 (2 (3 ) ) 6 25 11 29 (2 ) 27 34 (3 ) 31 47 (5 ) 42 Interest received in the year ended December 31, 2014, totaled 1 million (1 million for the year ended December 31, 2013, and 2 million for the year ended December 31, 2012). -28Copyright © 2013 www.secdatabase.com. All Rights Reserved. Please Consider the Environment Before Printing This Document NOTE 17 - CASH AND CASH EQUIVALENTS At December 31, 2014 (in millions of Euros) Cash in bank and on hand Deposits Total Cash and cash equivalents At December 31, 2013 168 821 989 232 1 233 As at December 31, 2014, cash in bank and on hand includes a total of 8 million held by subsidiaries that operate in countries where capital control restrictions prevent the balances from being available for general use by the Group (6 million as at December 31, 2013). As at December 31, 2014, deposits include proceeds drawn under the Senior Notes issued in December 2014, to be used for the acquisition of Wise entities (See Note 3 Acquisition of Wise entities) and for Body In White growth project. NOTE 18 - SHARE CAPITAL As at December 31, 2014, authorized share capital consists of 398,500,000 Class A ordinary shares and 1,500,000 Class B ordinary shares. A Shares Number of shares B Shares In millions of Euros Preference Shares Share capital Share premium As of January 1, 2014 104,076,718 950,337 5 2 162 Shares converted Shares cancelled As of December 31, 2014 842,228 104,918,946 (842,228) 108,109 (5 2 162 ) According to Dutch law and the articles of association of Constellium N.V., the following characterizations, rights and obligations are attached to the shares: Constellium N.V. shares are divided in two classes: A shares and B shares; Class A ordinary shares can be held by anyone approved by the general meeting of shareholders; and Class B ordinary shares can only be held by (i) German limited partnerships which have entered into an agreement pursuant to a management equity plan, or (ii) the Company itself. All of the Companys shares have a stated nominal value of 0.02 per share. All shares attract one vote and none are subject to any vesting restrictions. The Class A ordinary shares and Class B ordinary shares are entitled to an equal profit allocation. At the applicable MEP interest vesting date (the vesting conditions being summarized in NOTE 32 - Share Equity Plan), the related Class B ordinary shares are thereby converted into Class A ordinary shares. There are no other circumstances whereby Class B ordinary shares might be converted into Class A ordinary shares. On May 16, 2013, the Group issued preference shares to existing shareholders and repurchased them for no consideration after dividend payment. All the preference shares were cancelled in August 2014. During 2014, 842,228 Class B ordinary shares were converted to Class A ordinary shares, of which 749,417 related to Management Equity Plan accelerated vesting implemented during the second quarter of 2014. On July 8, 2014, Constellium N.V. repurchased the 108,109 Class B shares from Omega Management Gmbh & Co K.G, which may be subsequently cancelled. Copyright © 2013 www.secdatabase.com. All Rights Reserved. Please Consider the Environment Before Printing This Document At December 31, 2014 Class A and B Shares Free Float Bpifrance Other(A) Total 89,396,158 12,846,969 2,783,928 105,027,055 At December 31, 2013 Class A and B Shares Free Float Apollo Funds Bpifrance Other Total 50,526,761 37,561,475 12,846,969 4,091,850 105,027,055 (A) Of which 108,109 B shares held by Constellium N.V. -29- Copyright © 2013 www.secdatabase.com. All Rights Reserved. Please Consider the Environment Before Printing This Document % 85.12 % 12.23 % 2.65 % 100.00% % 48.11 % 35.76 % 12.23 % 3.90 % 100.00% NOTE 19 - BORROWINGS 19.1. Analysis by nature (in millions of Euros) 2013 Term loan facility(A) In U.S. Dollar In Euro Constellium N.V. and Constellium France SAS Senior Notes In U.S. Dollar (due 2024) (B) In Euro (due 2021) (B) In U.S. Dollar (due 2023) (C) In Euro (due 2023) (C) Constellium N.V. U.S. Revolving Credit Facility(D) In U.S. Dollar Constellium Rolled Products Ravenswood, LLC Unsecured Credit Facility(E) Constellium N.V. Others(F) Total Borrowings Of which: Non-current Current Amount At December 31, 2014 Type of Nominal rate rate 326 296 324 236 Fixed Fixed Fixed Fixed 5.75 4.63 8.00 7.00 34 Floating 36 1,252 Effective rate Amount Effective rate 252 72 Floating Floating 4.75 % 5.25 % 6.48 % 7.33 % 2.54 % 18 Floating 3.03 % 6 348 % % % % At December 31, 2013 Type of rate Spread 6.26 5.16 8.61 7.54 % % % % 1,205 47 326 22 (A) Represents amounts drawn under the previous term loan facility. On March 25, 2013, Constellium N.V. entered into a $210 million (equivalent to 152 million at the year-end exchange rate) and 45 million seven-year floating rate term loan facility. The proceeds were primarily used to repay the previous variable rate term loan facility entered into on May 25, 2012, which was therefore terminated. At the same date, Constellium France entered into a $150 million (equivalent to 109 million at the year-end exchange rate) and 30 million seven-year floating rate term loan facility. The 2013 term loan was guaranteed by certain of the Group subsidiaries and includes negative, affirmative and financial covenants. (B) Represents amounts drawn under the Senior Notes. On May 7, 2014, Constellium N.V. issued a $400 million Senior Notes due 2024 (the U.S. Dollar Notes equivalent to 330 million at the year-end exchange rate excluding arrangement fees and accrued interests) and a 300 million Senior Notes due 2021 (the Euro Notes) offering. The proceeds were primarily used to repay the 2013 term loan which was therefore terminated. As of December 31, 2014, amounts under the Senior Notes are net of arrangement fees related to the issuance of the notes totaling 12 million (including 6 million relating to the U.S. Dollar notes and 6 million relating to the Euro Notes) and include accrued interests for 4 million (including 2 million relating to the U.S. Dollar notes and 2 million relating to the Euro Notes). (C) Represents amounts drawn under the Senior Notes. On December 19, 2014, Constellium N.V. issued a $400 million Senior Notes due 2023 (the U.S. Dollar Notes equivalent to 330 million at the year-end exchange rate excluding arrangement fees and accrued interests) and a 240 million Senior Notes due 2023 (the Euro Notes) offering. As of December 31, 2014, amounts under the Senior Notes are net of arrangement fees related to the issuance of the notes totaling 12 million (including 7 million relating to the U.S. Dollar notes and 5 million relating to the Euro Notes) and include accrued interests for 2 million (including 1 million relating to the U.S. Dollar notes and 1 million relating to the Euro Notes). The whole of the Senior Notes are guaranteed on a senior unsecured basis by certain of the subsidiaries. Senior Notes include negative covenants. Copyright © 2013 www.secdatabase.com. All Rights Reserved. Please Consider the Environment Before Printing This Document (D) Represents amounts drawn under the U.S. Revolving Credit Facility. On May 25, 2012, Constellium Holdco II B.V., Constellium Holdings I, LLC and Constellium Rolled Products Ravenswood, LLC subsidiaries of Constellium N.V. entered into a $100 million (equivalent to 82 million at the year-end exchange rate), five-year secured asset-based variable rate revolving credit facility and letter of credit facility (the ABL facility). At December 31, 2014 the net maximum U.S. Revolving Credit Facility Balance amounts to $94 million (equivalent to 78 million at the year-end exchange rate). The proceeds from this ABL facility were used to repay amounts owed under the previous ABL facility entered into by Constellium Rolled Product Ravenswood, LLC on January 4, 2011. Certain assets of the Borrower have been pledged as collateral for the ABL Facility. As of December 31, 2014, the Group used the letter of credit for about $1 million ($1 million at the year ended December 31, 2013). U.S. Revolving Credit Facility is fully classified as a current item. -30- Copyright © 2013 www.secdatabase.com. All Rights Reserved. Please Consider the Environment Before Printing This Document As of December 31, 2014, the Group had $51 million (equivalent to 42 million at the closing exchange rate) of unused borrowing availability under the U.S. Revolving Credit Facility (at December 31, 2013: $40 million, equivalent to 29 million at the closing exchange rate). (E) In 2014, Constellium N.V. entered into a 120 million unsecured revolving credit facility with maturity May 2017. (F) Includes finance lease liabilities and other miscellaneous borrowings. During the third and the fourth quarters in 2014, Constellium Automotive LLC contracted two leases under a sale-leaseback transaction for respectively $11 million and $19 million (equivalent respectively to 10 million and 16 million at the year-end exchange rate). 19.2. Currency concentration The composition of the carrying amounts of total non-current and current borrowings (net of unamortized arrangement fees) in Euro equivalents is denominated in the currencies shown below: (in millions of Euros) U.S. Dollar Euro Swiss Franc Total borrowings net of unamortized debt financing costs At December 31, 2014 At December 31, 2013 709 539 4 270 76 2 1,252 348 19.3. Movements in borrowings (in millions of Euros) Balance at the opening Repayments of Term Loan(A) Proceeds received from Term Loan and Senior Notes(B) Proceeds received from U.S. Revolving Credit Facility Deferred arrangement fees(C) Unamortized arrangement fees(D) Movement in interests accrued Translation differences Movement in other financial debt(E) Balance at the closing At December 31, 2014 348 (331 At December 31, 2013 ) 1,153 13 (24 9 6 44 34 1,252 158 (156 ) 351 ) 2 (9 13 (12 1 348 ) ) (A) As of December 31, 2013, the amount includes the repayment of the 2012 term loan ($199 million of the net U.S dollar principal equivalent to 154 million at March 25, 2013 exchange rate) and the principal repayment. As of December 31, 2014, the amount includes the repayment of the 2013 term loan ($356 million of the net U.S dollar principal, equivalent to 257 million at May 7, 2014 exchange rate and 74 million of the net Euro principal) and the principal repayment. (B) As of December 31, 2013, the amount represents the value of the 2013 term loan at March 25, 2013 exchange rate (U.S. Dollar Term Loan for $360 million equivalent to 276 million at March 25, 2013 exchange rate and Euro Term Loan for 75 million). As of December 31, 2014, the amount represents the value of the Senior Notes at May 7, 2014 exchange rate and at December 19, 2014 exchange rate (U.S. Dollar Notes for $800 million equivalent to 613 million and Euro Notes for 540 million). (C) As of December 31, 2013, the Group recognized 9 million of arrangement fees related to 2013 term loan. As of December 31, 2014, the Group recognized 24 million of arrangement fees net of amount amortized related to the Senior Notes. Arrangement fees are integrated in the effective interest rate calculation. (D) As of December 31, 2013 and due to the early repayment of the 2012 term loan, 13 million of arrangement fees which were not amortized, were fully recognized as financial expenses (see NOTE 10 Finance costs Net). Copyright © 2013 www.secdatabase.com. All Rights Reserved. Please Consider the Environment Before Printing This Document As of December 31, 2014 and due to the early repayment of the 2013 term loan, 9 million of arrangement fees which were not amortized at the date of the issuance of Senior Notes, are fully recognized as financial expenses. (see NOTE 10 Finance costs Net). (E) As of December 31, 2014, other financial debt includes a new finance leases for $30 million (equivalent to 26 million at year-end exchange rate). -31- Copyright © 2013 www.secdatabase.com. All Rights Reserved. Please Consider the Environment Before Printing This Document 19.4. Main features of the Groups borrowings Interest 2013 Term Loan The interest rate under both U.S. Dollar term loan facilities is the applicable U.S. Dollar interest rate (U.S. Dollar Libor) for the interest period subject to a floor of 1.25% per annum, plus a margin of 4.75% per annum. The interest rate under both Euro term loan facilities is the applicable Euro interest rate (Euribor) for the interest period subject to a floor of 1.25% per annum, plus a margin of 5.25% per annum. Senior Notes Interest under Senior Notes issued in May 2014 accrue at a rate of 5.750% per annum on the U.S. Dollar Notes (Due 2024) and 4.625% per annum on the Euro Notes (Due 2021) and will be paid semi-annually on May 15 and November 15 of each year, starting on November 15, 2014. Interest under Senior Notes issued in December 2014 accrue at a rate of 8.00% per annum on the U.S. Dollar Notes (Due 2023) and 7.00% per annum on the Euro Notes (Due 2023) and will be paid semi-annually on January 15 and July 15 of each year, starting on July 15, 2015. U.S. Revolving Credit Facility Under the ABL Facility, interest charged is dependent upon the type of loan as follows: (a) Base Rate Loans will bear interest at an annual rate equal to the sum of the British Banker Association LIBOR Rate (U.S. Dollar LIBOR) plus an applicable margin comprised between 0.5% and 1.0% of the base rate, which is the greater of: (i) the prime rate in effect on any given day and (ii) the federal funds rate in effect on any given day plus 0.5%. (b) Eurodollar Rate Loans will bear interest at an annual rate equal to the sum of the Eurodollar Rate (essentially U.S. Dollar LIBOR) plus the applicable margin comprised between 1.5% and 2.0%; Unsecured Credit Facility Borrowings under the Unsecured Credit Facility will bear interest at the Eurocurrency rate plus a margin of 2.50% per annum. Accrued interest on each borrowings shall be payable on demand and in the event of any repayment or prepayment of any loan, accrued interest on the principal amount repaid or prepaid shall be payable on the date of such repayment or prepayment. Foreign exchange Exposure 2013 Term Loan It is the Group policy to hedge all non-functional currency loans and deposits. In line with this policy the U.S. Dollar loans were hedged through cross currency interest rate swaps and rolling foreign exchange forwards. The notional of the cross-currency interest rate swaps amounted to $308 million on December 31, 2013. The remaining balance of the term loan was hedged by simple rolling foreign exchange forwards. The cross currency swaps had a negative fair value of 26 million at December 31, 2013. Changes in the fair value of hedges related to this translation exposure were recognized within financial costs in the consolidated income statement. The cross currency swaps associated with this repaid term loan was settled in 2014 for 26 million and is presented in Other Financing Activities in the cash flow statement. Senior Notes The notional of the Dollar Notes issued in May 2014 is hedged through cross currency swaps and rolling foreign exchange forwards. The notional of the cross currency basis swaps amounted to $320 million on December 31, 2014. The remaining balance of the U.S. Dollar Notes is hedged by simple rolling foreign exchange forwards. Changes in the fair value of hedges related to this translation exposure are recognized within financial costs in the consolidated income statement. The positive fair value of hedging instrument is 29 million as of December 31, 2014. The notional of the U.S. Dollar Notes issued in December 2014 was placed in U.S. Dollar short term deposits. Copyright © 2013 www.secdatabase.com. All Rights Reserved. Please Consider the Environment Before Printing This Document Financing cost 2013 Term Loan A $2 million (equivalent to 1 million at the issue date of the term loan) and 1 million original issue discount (OID) were deducted from the Term Loan at inception. Constellium N.V. received a net amount of $209 million (162 million at the issue date of the Term Loan) and 45 million. Constellium France received a net amount of $149 million (115 million at the issue date of the Term Loan) and 30 million. In addition, the Group incurred debt fees of 8 million. Debt fees and OID are integrated into the effective interest rate of the term loan. Interest expenses are included in finance costs. As of December 31, 2014 and due to the early payment of the 2013 term loan, the Group incurred exit fees for $6 million (equivalent to 4 million at the issue date of the private offering) and 2 million. Exit fees are included in finance cost. -32- Copyright © 2013 www.secdatabase.com. All Rights Reserved. Please Consider the Environment Before Printing This Document Senior Notes A $16 million (equivalent to 13 million at December 31, 2014 and net of amount amortized) and 11 million arrangement fees net of amount amortized were deducted from the private offerings. Arrangement fees are integrated in the effective interest rate calculation of the private offerings. U.S. Revolving Credit Facility The 3 million U.S. Revolving Credit Facility expenses incurred in 2012 were included in Deferred financing costs and are amortized as interest expense in Finance costs net. A fronting fee of 0.125% per annum of the face amount of each letter of credit is expensed as incurred and payable in arrears on the last day of each calendar quarter after the letter of credit issuance. Unsecured Credit Facility As of December 31, 2014, transaction costs related to the Unsecured Revolving Facility are capitalized and amortized over the maturity of the credit facility (May 2017). The related fees are amortized over 36 months as a finance expense. In addition, the Group incurs commitment fees related to the Unsecured Credit Facility, equal (i) the average of the daily difference between the commitments and the aggregate principal amount of all outstanding loans, times; (ii) 1.00% per annum. Covenants Senior Notes The private offerings contain customary terms and conditions, including amongst other things, limitation on incurring or guaranteeing additional indebtness, on paying dividends, on making other restricted payments, on creating restriction on dividend and other payments to us from certain of our subsidiaries, on incurring certain liens, on selling assets and subsidiary stock, and on merging. The Group was in compliance with all applicable affirmative covenants as of and for the period ended December 31, 2014. U.S. Revolving Credit Facility This facility contains a minimum availability covenant that requires Constellium Rolled Products Ravenswood, LLC to maintain excess availability of at least the greater of (a) $10 million and (b) 10% of the aggregate revolving loan commitments. It also contains customary events of default. Constellium Rolled Products Ravenswood, LLC was in compliance with all applicable covenants as of and for the period ended December 31, 2014. Factoring facilities The factoring facility has a minimum liquidity covenant. As of December 31, 2014 the Company was in compliance. NOTE 20 - TRADE PAYABLES AND OTHER (in millions of Euros) Trade payables Third parties Related parties Total Trade payables Other payables Employees entitlements Deferred revenue Taxes payable other than income tax Total Other At December 31, 2014 Non-current Current 5 16 10 31 659 659 51 111 32 19 213 Copyright © 2013 www.secdatabase.com. All Rights Reserved. Please Consider the Environment Before Printing This Document At December 31, 2013 Non-current Current 1 16 18 35 411 58 469 32 119 13 13 177 Total Trade payables and Other 31 872 35 646 NOTE 21 - PENSION AND OTHER POST-EMPLOYMENT BENEFIT OBLIGATIONS For the years ended December 31, 2014 and 2013, actuarial valuation were performed with the support of an independent expert and are reflected in the consolidation financial statements as described in NOTE 2.e Principles governing the preparation of the consolidated financial statements. Description of the plans The Group operates a number of pensions, other post-employment benefits and other long-term employee benefit plans. Some of these plans are defined contribution plans and some are defined benefit plans, with assets held in separate trustee-administered funds. Benefits paid through pension trusts are sufficiently funded to ensure the payment of benefits to retirees when they become due. -33- Copyright © 2013 www.secdatabase.com. All Rights Reserved. Please Consider the Environment Before Printing This Document Pension plans Constelliums pension obligations are in the U.S., Switzerland, Germany, and France. Pension benefits are generally based on the employees service and highest average eligible compensation before retirement and are periodically adjusted for cost of living increases, either by company practice, collective agreement or statutory requirement. Other post-employment benefits (OPEB) The Group provides health care and life insurance benefits to retired employees and in some cases to their beneficiaries and covered dependents, mainly in the U.S.. Eligibility for coverage is dependent upon certain age and service criteria. These benefit plans are unfunded. Other long-term employee benefits Other long term employee benefits include jubilees in France and Switzerland, other long-term disability benefits in the U.S. and medical care in France. Description of risks Our pension plan assets consist primarily of funds invested in listed stocks and bonds. Our estimates of liabilities and expenses for pensions and other post-employment benefits incorporate a number of assumptions, including discount rate, longevity estimate and inflation rate. The defined benefit plans expose the Group to actuarial risks such as: investment risk, interest rate risk, longevity risk and change in law governing the employee benefit obligations. Investment risk The present value of funded defined benefit obligations is calculating using a discount rate determined by reference to high quality corporate bond yields. If the return on plan asset is below this rate, it will increase the plan deficit. Interest risk A decrease in the discount rate will increase the defined benefit obligation. As at December 31, 2014, impacts of the change on the defined benefit obligation of a 0.50% increase / decrease in the discount rates are calculated by using a proxy based on the duration of each scheme, as follows: (in millions of Euros) France Germany Switzerland United States Total sensitivity on Defined benefit obligations 0.50% increase in discount rates (9 (10 (17 (28 (64 0.50% decrease in discount rates ) ) ) ) ) 10 10 20 32 72 Longevity risk The present value of the defined benefit obligation is calculated by reference to the best estimate of the mortality of plan participants. An increase in the life expectancy of the plan participants will increase the plans liability. Main events (related impact being recorded in Other gains / (losses) net, see NOTE 8) In 2014, the Swiss pension plan was modified to reflect updated conversion factors with transitional rates until 2022. This amendment resulted in the immediate recognition of negative past service cost of 6 million. In 2012, 2013 and 2014, the Group implemented certain plan amendments that had the effect of reducing benefits for the participants in the Constellium Rolled Products Ravenswood Retiree Medical and Life Insurance Plan. These amendments resulted in the immediate recognition of negative past service cost of 9 million in 2014, 11 million in 2013 and of 58 million in 2012. Copyright © 2013 www.secdatabase.com. All Rights Reserved. Please Consider the Environment Before Printing This Document During the first quarter of 2012, the Group withdrew from the foundation which administered its employee benefit plans in Switzerland and joined a commercial multi-employer foundation. This change led to a partial liquidation which triggered a settlement. Consequently, related assets and liabilities were transferred to the new foundation and employees benefits were also adjusted. The settlement resulted in an 8 million loss. -34- Copyright © 2013 www.secdatabase.com. All Rights Reserved. Please Consider the Environment Before Printing This Document Year ended December 31, 2014 Year ended December 31, 2013 Year ended December 31, 2012 Rate of Rate of Rate of Rate of Rate of Rate of increase increase increase increase increase increase in in Discount in in Discount in in Discount salaries pensions rate Inflation salaries pensions rate Inflation salaries pensions rate Inflation 1.75 % 1.15 % 1.25 % 1.75 % 2.35 % 1.25 % 2.00 % 1.95 % 1.25 % Switzerland U.S. Hourly pension Salaried pension OPEB(A) 3.80 % France Retirements Other benefits 1.75 % Germany 2.75 % 2.00 % 1.80 % 4.15 4.25 4.05 % % % 1.90 1.55 2.00 % % % 1.90 % 1.80 % 3.80 % 2.00 % 2.75 % 2.00 % 2.10 % 4.95 5.15 4.85 % % % 3.50 3.50 2.00 % % % 3.50 % 2.10 % 3.80 % 2.50 % 2.75 % 1.10 % 2.00 % 2.10 % 4.15 4.35 4.05 % % % 3.20 3.20 2.00 % % % 3.20 % 2.10 % (A) Other main financial assumptions used for the OPEB (healthcare plans, which are predominantly in the U.S.), were: Medical trend rate: pre 65: 7.00% starting in 2015 reducing to 5.00% by the year 2022 and post 65: 6.50% starting in 2015 grading down to 5.00% by 2022, and Claims costs based on individual company experience. For both pension and healthcare plans, the post-employment mortality assumptions allow for future improvements in life expectancy. Amounts recognized in the Consolidated Statement of Financial Position At December 31, 2014 Pension Other benefits benefits Total (in millions of Euros) Present value of funded obligation Fair value of plan assets Deficit of funded plans Present value of unfunded obligation Net liability arising from defined benefit obligations (612 330 (282 (127 (409 ) ) ) ) (245 ) (245 ) (612) 330 (282) (372) (654) At December 31, 2013 Pension Other benefits benefits Total (485 277 (208 (104 (312 ) ) ) ) (195 ) (195 ) (485) 277 (208) (299) (507) Movements in the present value of the Defined Benefit Obligations At December 31, 2014 Pension Other benefits benefits Total (in millions of Euros) Defined Benefit Obligations at beginning of year Net decrease in liabilities from disposals Current service cost Interest cost Actual plan participants contributions Past service cost Immediate recognition of (losses) / gains arising over the year Actual benefits paid out Remeasurement due to changes in demographic assumptions Remeasurement due to changes in financial assumption Experience gain / (loss) Exchange rate (loss) / gain Classified as held for sale Defined Benefit Obligations at end of year Of which: Funded Unfunded (589 (14 (21 (5 6 29 (14 (101 3 (33 (739 ) ) ) ) ) ) ) ) (612 ) (127 ) (195 (4 (9 7 (4 15 (12 (16 (1 (26 (245 ) (784) (18 ) (30 ) (5 ) 13 (4 ) 44 (26 ) (117) 2 (59 ) (984) (644 3 (15 (19 (5 30 (1 44 4 11 3 (589 (245 ) (612) (372) (485 ) (104 ) -35Copyright © 2013 www.secdatabase.com. All Rights Reserved. Please Consider the Environment Before Printing This Document ) At December 31, 2013 Pension Other benefits benefits Total ) ) ) ) ) ) ) ) ) ) ) ) ) (234 1 (5 (9 11 1 16 (1 17 8 (195 ) ) (878) 4 (20 ) (28 ) (5 ) 11 1 46 (2 ) 61 4 19 3 (784) (195 ) (485) (299) ) ) ) Movements in the fair value of plan assets At December 31, 2014 Pension Other benefits benefits Total (in millions of Euros) Plan assets at beginning of year Remeasurement return on plan assets Interests income Actual employer contributions Actual plan participants contributions Actual benefits paid out Actual administrative expenses paid Exchange rate gain / (loss) Fair value of plan assets at end of year 277 11 10 34 5 (29 ) (1 ) 23 330 277 11 10 49 5 (44 ) (1 ) 23 330 15 (15 ) At December 31, 2013 Pension Other benefits benefits Total 267 9 8 28 5 (31 ) (1 ) (8 ) 277 15 (15 ) 267 9 8 43 5 (46 ) (1 ) (8 ) 277 Variation of the net pension liabilities At December 31, 2014 Pension Other Benefits Benefits Total (in millions of Euros) Net (liability) recognized at beginning of year Total amounts recognized in the Consolidated Income Statement Total amounts recognized in the SoCI Actual employer contributions Exchange rate (loss) / gain Net decrease from disposals Classified as held for sale Net (liability) recognized at end of year (312 (20 (101 34 (10 (409 ) ) ) ) ) (195 (10 (29 15 (26 (245 ) ) ) ) ) (507) (30 ) (130) 49 (36 ) (654) At December 31, 2013 Pension Other Benefits Benefits Total (377 ) (28 ) 56 27 3 4 3 (312 ) (234 ) (1 ) 16 16 8 (195 ) (611) (29 ) 72 43 11 4 3 (507) Amounts recognized in the Consolidated Income Statement Year ended December 31, 2014 Pension Other benefits benefits Total (in millions of Euros) Service cost Current service cost Past service cost (Losses) arising from plan settlements Net interests Immediate recognition of (losses) / gains arising over the period Administrative expense Total (costs) / income recognized in the Consolidated Income Statement (14 ) 6 (11 ) (4 7 (9 ) (1 (4 ) ) (20 ) ) (10 ) Year ended December 31, 2013 Pension Other benefits benefits Total (18) 13 (20) (15 ) (12 ) (5 11 (8 (4 ) (1 ) (1 1 (30) (28 ) ) (1 ) ) ) Year ended December 31, 2012 Pension Other benefits benefits Total (20) 11 (20) (15 ) 20 (28 ) (13 ) (5 ) 55 (13 ) (20) 75 (28) (26) 1 (1 ) 1 1 (29) (36 ) 38 2 The expenses shown in this table are included as employee costs in the Consolidated Income Statement within employee benefit expense and in Other gains/(losses) - net (See NOTE 7 - Employee Benefit Expenses and NOTE 8 - Other Gains / (Losses) - Net). -36- Copyright © 2013 www.secdatabase.com. All Rights Reserved. Please Consider the Environment Before Printing This Document Analysis of amounts recognized in the Consolidated Statement of Comprehensive Income (SoCI) At December 31, 2014 Pension Other benefits benefits Total (in millions of Euros) Cumulative amount of losses recognized in the SoCI at beginning of year Liability losses due to changes in assumptions Liability losses / (gains) due to changes in financial assumptions Liability experience (gains) / losses arising during the year Asset (gains) arising during the year Exchange rate losses /(gains) Total losses / (gains) recognized in SoCI Cumulative amount of losses recognized in the SoCI at end of year 27 14 102 (4 ) (11 ) 4 105 132 4 11 17 1 3 32 36 At December 31, 2013 Pension Other benefits benefits Total 31 25 119 (3 ) (11 ) 7 137 168 83 1 (44 (4 (9 (56 27 20 1 (16 ) (1 ) (16 ) 4 ) ) ) ) 103 2 (60 ) (4 ) (9 ) (1 ) (72 ) 31 Defined benefit obligations by countries At December 31, 2014 (in millions of Euros) France Germany Switzerland U.S. Defined Benefit Obligations (139 (148 (224 (473 (984 At December 31, 2013 ) ) ) ) ) (111 (127 (185 (361 (784 ) ) ) ) ) Value of plan assets at year end by major classes of assets The following table shows the fair value of plans assets classified under the appropriate level of the fair value hierarchy: (in millions of Euros) Equities Bonds Property Other Total fair value of plan assets At December 31, 2014 U.S. Switzerland Total At December 31, 2013 U.S. Switzerland Total 83 70 5 3 161 65 60 4 1 130 40 75 19 35 169 123 145 24 38 330 34 65 15 33 147 99 125 19 34 277 The actual return on plan assets was 21 million in 2014 (17 million in 2013). (in millions of Euros) Cash and cash equivalents Equity Bonds Government bonds Corporate bonds Other investments Real estate Hedge fund Insurance contracts Other Total Level 1 At December 31, 2014 Level 2 Level 3 Total Level 1 At December 31, 2013 Level 2 Level 3 Total 2 84 1 39 78 1 66 1 144 68 4 53 4 121 20 6 6 196 4 4 115 19 19 24 6 4 25 330 19 12 168 1 2 90 19 19 19 12 1 21 277 Cash Flows Contributions to plans Copyright © 2013 www.secdatabase.com. All Rights Reserved. Please Consider the Environment Before Printing This Document 3 123 69 30 99 Contributions to pension plans totaled 34 million for the year ended December 31, 2014 (27 million for the year ended December 31, 2013). Contributions to other benefits totaled 15 million for the year ended December 31, 2014 (16 million for the year ended December 31, 2013). Expected contributions to pension for the year ending December 31, 2015 amount to 29 million and other post-employment benefits (healthcare obligations) amount to 16 million. -37- Copyright © 2013 www.secdatabase.com. All Rights Reserved. Please Consider the Environment Before Printing This Document Benefit payments Benefit payments expected to be paid to pension, other post-employment benefit plans participants and other benefits, are as follows: Estimated benefits payments (in millions of Euros) Year ended December 31, 2015 2016 2017 2018 2019 to 2024 Total 46 47 48 50 329 520 OPEB amendments During the third quarter of 2012, the Group implemented certain plan amendments that had the effect of reducing benefits of the participants in the Constellium Rolled Products Ravenswood Retiree Medical and Life Insurance Plan. In February 2013, five Constellium retirees and the United Steelworkers union filed a class action lawsuit against Constellium Rolled Products Ravenswood, LLC in a federal district court in West Virginia, alleging that Constellium Rolled Products Ravenswood, LLC improperly modified retiree health benefits. The Group believes that these claims are unfounded, and that Constellium Rolled Products Ravenswood, LLC had a legal and contractual right to make the applicable modification. NOTE 22 - PROVISIONS (in millions of Euros) At January 1, 2014 Additional provisions Amounts used Unused amounts reversed Unwinding of discounts At December 31, 2014 Current Non-current Total Provisions (in millions of Euros) At January 1, 2013 Additional provisions Amounts used Unused amounts reversed Others Unwinding of discounts At December 31, 2013 Current Non-current Total Provisions Close down, environmental and restoration costs 48 1 (2 (4 4 47 3 44 47 Restructuring costs ) ) Close down, environmental and restoration costs 56 1 (1 (6 (1 (1 48 3 45 48 10 8 (7 (1 10 8 2 10 Legal claims, tax and other costs ) ) Restructuring costs ) ) ) ) 19 3 (10 (2 10 5 5 10 Copyright © 2013 www.secdatabase.com. All Rights Reserved. Please Consider the Environment Before Printing This Document 45 15 (3 (4 53 38 15 53 Total ) ) Legal claims, tax and other costs ) ) 47 13 (9 (6 45 30 15 45 103 24 (12 ) (9 ) 4 110 49 61 110 Total ) ) 122 17 (20 ) (14 ) (1 ) (1 ) 103 38 65 103 Close down, environmental and restoration costs The Group records provisions for the estimated present value of the costs of its environmental clean-up obligations and close down and restoration efforts based on the net present value of estimated future costs of the dismantling and demolition of infrastructure and the removal of residual material of disturbed areas, using an average discount rate of 1.21%. A change in the discount rate of 0.50% would impact the provision by 2million. It is expected that these provisions will be settled over the next 40 years depending on the nature of the disturbance and the technical remediation plans. -38- Copyright © 2013 www.secdatabase.com. All Rights Reserved. Please Consider the Environment Before Printing This Document Restructuring costs The Group records provisions for restructuring costs when management has a detailed formal plan, is demonstrably committed to its execution and can reasonably estimate the associated liabilities. The related expenses are included in Restructuring costs in the Consolidated Income Statement. Legal claims, tax and other costs At December 31, 2014 (in millions of Euros) Maintenance and customers related provisions(A) Litigations(B) Disease claims(C) Other Total 14 28 6 5 53 At December 31, 2013 18 17 6 4 45 (A) These provisions include 7 million (7 million in 2013 and 13 million in 2012) related to general equipment maintenance, mainly linked to the Groups leases. These provisions also include 1 million (3 million in 2013 and in 2012) related to product warranties and guarantees and 6 million (6 million in 2013 and 5 million in 2012) related to late delivery penalties. These provisions are expected to be utilized in the next five years. (B) The Group is involved in litigation and other proceedings, such as civil, commercial and tax proceedings, incidental to normal operations. It is not anticipated that the resolution of such litigation and proceedings will have a material effect on the future results, financial position, or cash flows of the Group. (C) Since the early 1990s, certain activities of the Groups businesses have been subject to claims and lawsuits in France relating to occupational diseases resulting from alleged asbestos exposure, such as mesothelioma and asbestosis. It is not uncommon for the investigation and resolution of such claims to go on over many years as the latency period for acquiring such diseases is typically between 25 and 40 years. For any such claim, it is up to the social security authorities in each jurisdiction to determine if a claim qualifies as an occupational illness claim. If so determined, the Group must settle the case or defend its position in court. As at December 31, 2014, 9 cases in which gross negligence is alleged (faute inexcusable) remain outstanding (10 as at December 31, 2013), the average amount per claim being 0.3 million. The average settlement amount per claim in 2014 and 2013 was 0.1 million. It is not anticipated that the resolution of such litigation and proceedings will have a material effect on the future results from continuing operations, financial condition, or cash flows of the Group. -39- Copyright © 2013 www.secdatabase.com. All Rights Reserved. Please Consider the Environment Before Printing This Document NOTE 23 - CASH FLOWS (in millions of Euros) Notes Cash flows from / (used in) operating activities Net income from continuing operations Adjustments Income tax expense Finance costs net Depreciation and impairment Restructuring costs and other provisions Defined benefit pension costs Unrealized losses / (gains) on derivatives net and from remeasurement of monetary assets and liabilities net Losses on disposal and assets classified as held for sale Share of (profit) / loss of joint-ventures Other Total Adjustments Changes in working capital Inventories Trade receivables Margin calls Trade payables Other working capital Total Changes in working capital Changes in other operating assets and liabilities Provisions Income tax paid Pension liabilities and other postemployment benefit obligations Total Changes in other operating assets and liabilities Net cash flows from operating activities Year ended December 31, 2014 Year ended December 31, 2013 Year ended December 31, 2012 54 96 149 21 37 58 49 6 29 39 50 32 (8 29 46 60 14 16 (2 ) 4, 8 52 (14 (60 ) 5 5 241 6 (3 2 133 11 10 6 25 22 ) ) 5 2 81 (95 (48 11 170 (33 5 ) ) (12 (27 ) ) (17 (29 ) ) (31 (28 ) ) (49 ) (43 ) (40 ) (88 212 ) (89 184 ) (99 246 ) ) 41 9 4 (1 (9 44 ) ) ) 35 26 7 20 27 115 NOTE 24 - FINANCIAL RISK MANAGEMENT The Groups financial risk management strategy focuses on minimizing the cost and cash flow impacts of volatility in foreign currency exchange rates, metal prices and interest rates, while maintaining the financial flexibility the Group requires in order to successfully execute the Groups business strategies. Due to Constelliums capital structure and the nature of its operations, the Group is exposed to the following financial risks: (1) market risk (including foreign exchange risk, commodity price risk and interest rate risk); (2) credit risk and (3) liquidity and capital management risk. a. Market risk (i) Foreign exchange risk Net assets, earnings and cash flows are influenced by multiple currencies due to the geographic diversity of sales and the countries in which the Group operates. The Euro and the U.S. dollar are the currencies in which the majority of sales are denominated. Operating costs are influenced by the currencies of those countries where Constelliums operating plants are located and also by those currencies in which the costs of imported equipment and services are determined. The Euro and U.S. dollar are the most important currencies influencing operating costs. The policy of the Group is to hedge committed and highly probable forecasted foreign currency operational transactions. The Group uses foreign exchange forwards for this purpose. Copyright © 2013 www.secdatabase.com. All Rights Reserved. Please Consider the Environment Before Printing This Document In June 2011, the Group entered into a multiple-year frame agreement with a major customer for the sale of fabricated metal products in U.S. Dollars. In line with its hedging policy, the Group entered into significant foreign exchange derivative transactions to forward sell U.S. dollars versus the euro following the signing of the multiple-year frame agreement to match these future sales. As at December 31, 2014, our largest foreign exchange derivative transactions related to this contract. -40- Copyright © 2013 www.secdatabase.com. All Rights Reserved. Please Consider the Environment Before Printing This Document The notional principal amounts of the outstanding foreign exchange contracts at December 31, 2014 - with maturities ranging between 2015 and 2018 - were as follows: Forward Exchange contracts in currency millions Currency CHF CZK EUR GBP JPY SGD USD 23 (28 82 (5 (1,012 (144 Foreign Exchange Swap contracts in currency millions ) ) ) ) 2 768 116 (1 (583 8 (186 ) ) ) A negative balance represents a net currency sale, whereas a positive balance represents a net currency purchase. Except for limited non-recurring transactions, hedge accounting is not applied and therefore the mark-to-market impact is recorded in Other gains/(losses) - net. In the year ended December 31, 2013, the impact of the Groups hedging strategy in relation to foreign currency led to unrealized gains on derivatives of 21 million which related primarily to the exposure on the multiple year sale agreement for fabricated products in U.S. dollars by a euro functional subsidiary of the group. In the year ended December 31, 2014, the impact of these derivatives was an unrealized loss of 41 million as the U.S. dollar appreciated against the euro in the second half of 2014. The offsetting gain related to the forecasted sales are not visible due to the sales not yet being recorded in the books of the Group. As the U.S. dollar appreciates against the euro, the derivative contracts entered into with financial institutions have a negative mark-tomarket. Our financial derivative counterparties require margin should our mark-to-market exceed a pre-agreed contractual limit. In order to protect from the potential margin calls for significant market movements, the Group holds a significant liquidity buffer in cash or in availability under its various borrowing facilities, enters into derivatives with a large number of financial counterparties and monitors margin requirements on a daily basis for adverse movements in the U.S. dollar versus the euro. At December 31, 2014, the margin requirement related to foreign exchange hedges amounted to zero (11 million at December 31, 2013). Throughout the year 2014, there were no margins posted related to foreign exchange hedges. During 2012, the Group has decided to limit the liquidity risk arising from potential margin calls on operational hedges by entering into a portfolio of foreign exchange zero cost collars (combinations of bought calls and sold puts). As of December 31, 2014, the Group still had $198 million of these collars (as of December 31, 2013: $398 million), with maturities ranging between 2015 and 2016. Borrowings are principally in U.S. dollars and euros (see NOTE 19 Borrowings). It is the policy of the Group to hedge all nonfunctional currency debt and cash. The Group entered into cross currency basis swaps to hedge the foreign exchange inherent in our financing. As of December 31, 2014, the notional outstanding on the cross currency basis swaps was $320 million (233 million). The unrealized gain related to the economic hedges of the USD loans amounted to 30 million during the year ended December 31, 2014. Foreign exchange sensitivity: Risks associated with exposure to financial instruments A 10% weakening in the December 31, 2014, closing Euro exchange rate against U.S. Dollar on the value of financial instruments held by the Group at December 31, 2014, would have decreased earnings (before tax effect) as shown in the table below (excluding Wise purchase hedging result): At December 31, 2014 (in millions of Euros) Cash and cash equivalents and restricted cash Trade receivables Trade payables Borrowings Metal derivatives (net) Foreign exchange derivatives (net) (A) Copyright © 2013 www.secdatabase.com. All Rights Reserved. Please Consider the Environment Before Printing This Document Sensitivity impact 45 22 (14 (77 (2 (54 ) ) ) ) Cross currency swaps Total 29 (51 ) (A) The foreign exchange derivative largely hedge items that are not already on the balance sheet (forecast U.S. Dollar receivables in euros functional currency entities) The amounts shown in the table above may not be indicative of future results since the balances of financial assets and liabilities may change. -41- Copyright © 2013 www.secdatabase.com. All Rights Reserved. Please Consider the Environment Before Printing This Document A 10% weakening in the December 31, 2014, closing Euro exchange rate against Swiss Franc on the value on trade receivable is 1 million and on trade payable is (6) million. A 10% change in the closing Euro exchange rate against currencies other than U.S. Dollar or Swiss Franc does not have a material impact on earnings. (ii) Commodity price risk The Group is subject to the effects of market fluctuations in the price of aluminum, which is the Groups primary metal input and a significant component of its output. The Group is also exposed to silver, copper and natural gas in a less significant way. The Group has entered into derivatives contracts to manage these risks and carries those instruments at their fair values on the Consolidated Statement of Financial Position. As of December 31, 2014, the notional principal amount of aluminum derivatives outstanding was 133,875 tons (approximately $269 million) - 129,350 tons at December 31, 2013, (approximately $247 million) - with maturities ranging from 2015 to 2019, copper derivatives outstanding was 3,000 tons (approximately $24 million) - 4,200 tons at December 31, 2013 (approximately $33 million) with maturities ranging from 2015 to 2016, silver derivatives 270,027 ounces (approximately $6 million) - 261,785 ounces at December 31, 2013 (approximately $6 million) - with maturities in 2015, and 3,465,000 MMBtu of natural gas futures (approximately $13 million) - 900,000 MMBtu at December 31, 2013 (approximately $3 million) with maturities from 2015 to 2016. The value of the contracts will fluctuate due to changes in market prices but is intended to help protect the Groups margin on future conversion and fabrication activities. At December 31, 2014, these contracts are directly with external counterparties. When the Group is unable to align the price and quantity of physical aluminum purchases with that of physical aluminum sales, it enters into derivative financial instruments to pass through the exposure to metal price fluctuations to financial institutions at the time the price is set. Therefore, the Group has purchased fixed price aluminum forwards to offset the exposure of LME volatility on its fixed price sales agreements for the supply of metal. The Group does not apply hedge accounting and therefore any mark-to-market movements are recognized in Other gains / (losses) net. In the year ended December 31, 2013, 7 million of unrealized losses were recorded in relation to LME futures due to a decline in the LME price of aluminum. In the year ended December 31, 2014, 7 million of unrealized losses were recorded in relation to LME futures due to a decline in the LME price of aluminum, with the revaluation of the underlying transaction continuing partially offbalance sheet for the sales which had not yet been invoiced and recognized as revenue. As the LME price for aluminum falls, the derivative contracts entered into with financial institution counterparties have a negative mark-to-market. The Groups financial institution counterparties may require margin calls should the negative mark-to-market exceed a pre-agreed contractual limit. In order to protect from the potential margin calls for significant market movements, the Group enters into derivatives with a large number of financial counterparties and monitors margin requirements on a daily basis for adverse movements in aluminum prices. As of December 31, 2014, the margin requirement related to aluminum hedges was zero (as of December 31, 2013, margin posted on aluminum hedges was also zero). Throughout the year 2014, there was no margin posted related to aluminum hedges. Commodity price sensitivity: risks associated with derivatives The net impact on earnings and equity of a 10% increase or decrease in the market price of aluminum, based on the aluminum derivatives held by the Group at December 31, 2014 (before tax effect), with all other variables held constant was estimated to 20 million gains or losses (17 million at December 31, 2013). The balances of such financial instruments may change in future periods however, and therefore the amounts shown may not be indicative of future results. (iii) Interest rate risk Interest rate risk refers to the risk that the value of financial instruments held by the Group and that are subject to variable rates will fluctuate, or the cash flows associated with such instruments will be impacted due to changes in market interest rates. The Groups interest rate risk arises principally from borrowings. Borrowings issued at variable rates expose the Group to cash flow interest rate risk which is partially offset by cash and cash equivalents deposits (including short-term investments) earning interest at variable interest rates. Borrowings issued at fixed rates expose the Group to fair value interest rate risk. Copyright © 2013 www.secdatabase.com. All Rights Reserved. Please Consider the Environment Before Printing This Document Interest rate sensitivity: risks associated with variable-rate financial instruments The impact (before tax effect) on profit (loss) for the period of a 50 basis point increase or decrease in the LIBOR or EURIBOR interest rates, based on the variable rate financial instruments held by the Group at December 31, 2014, with all other variables held constant, was estimated to be less than 1 million for the periods ended December 31, 2014 and December 31, 2013. The balances of such financial instruments may not remain constant in future periods however, and therefore the amounts shown may not be indicative of future results. -42- Copyright © 2013 www.secdatabase.com. All Rights Reserved. Please Consider the Environment Before Printing This Document b. Credit risk Credit risk is the risk that a counterparty will not meet its obligations under a financial instrument or customer contract, leading to a financial loss. The Group is exposed to credit risk with financial institutions and other parties as a result of cash-in-bank, cash deposits and the mark-to-market on derivative transactions and from customer trade receivables arising from Constelliums operating activities. The maximum exposure to credit risk at the reporting date is the carrying value of each class of financial asset as described in NOTE 25 - Financial Instruments. The Group does not generally hold any collateral as security. Credit risk related to deposits with financial institutions Credit risk with financial institutions is managed by the Groups Treasury department in accordance with a Board approved policy. Constellium management is not aware of any significant risks associated with financial institutions as a result of cash and cash equivalents deposits (including short-term investments) and financial derivative transactions. The number of financial counterparties is tabulated below showing our exposure to the counterparty by rating type (Parent company ratings from Moodys Investor Services). At December 31, 2014 Number of Exposure financial (in millions of counterparties(A) Euros) Rated Aa or better Rated A Rated Baa Total 3 7 2 12 233 764 5 1,002 At December 31, 2013 Number of Exposure financial (in millions of counterparties(A) Euros) 2 7 1 10 16 222 1 239 (A) Financial Counterparties for which the Groups exposure is below 250k have been excluded from the analysis. Credit risks related to customer trade receivables The Group has a diverse customer base geographically and by industry. The responsibility for customer credit risk management rests with Constellium management. Payment terms vary and are set in accordance with practices in the different geographies and endmarkets served. Credit limits are typically established based on internal or external rating criteria, which take into account such factors as the financial condition of the customers, their credit history and the risk associated with their industry segment. Trade accounts receivable are actively monitored and managed, at the business unit or site level. Business units report credit exposure information to Constellium management on a regular basis. Over 80% of the Groups trade account receivables are insured by insurance companies rated A31 or better. In situations where collection risk is considered to be above acceptable levels, risk is mitigated through the use of advance payments, bank guarantees or letters of credit. Historically we have a very low level of customer default as a result of long history of dealing with our customer base and an active credit monitoring function. 1 Rating from Moodys Investor Services. See NOTE 16 - Trade Receivables and Other for the aging of trade receivables. c. Liquidity and capital risk management The Groups capital structure includes shareholders equity, borrowings from related parties and various third-party financing arrangements (such as credit facilities and factoring arrangements). Constelliums total capital is defined as total equity plus net debt. Net debt includes borrowings due to third parties less cash and cash equivalents. Constelliums overriding objectives when managing capital are to safeguard the business as a going concern, to maximize returns for its owners and to maintain an optimal capital structure in order to minimize the weighted cost of capital. All activities around cash funding, borrowings and financial instruments are centralized within Constelliums Treasury department. Direct external funding or transactions with banks at the operating plant entity level are generally not permitted, and exceptions must be approved by Constelliums Treasury department. Copyright © 2013 www.secdatabase.com. All Rights Reserved. Please Consider the Environment Before Printing This Document The liquidity requirements of the overall Company are funded by drawing on available credit facilities, while the internal management of liquidity is optimized by means of cash pooling agreements and/or intercompany loans and deposits between the Companys operating entities and central Treasury. The contractual agreements that the Group has with derivative financial counterparties require the posting of collateral once a certain threshold has been reached. In order to protect the Group from the potential margin calls for significant market movements, the Group holds a significant liquidity buffer in cash or availability under its various borrowing facilities, enters into derivatives with a large number of financial counterparties, entered into a series of zero cost collars (see section 24.a (i)) and monitors margin requirements on a daily basis for adverse movements in the U.S. dollar versus the euro and in aluminum prices. -43- Copyright © 2013 www.secdatabase.com. All Rights Reserved. Please Consider the Environment Before Printing This Document The table below shows undiscounted contractual values by relevant maturity groupings based on the remaining period from December 31, 2014, and December 31, 2013, to the contractual maturity date. At December 31, 2014 Less than Between 1 Over 1 year and 5 years 5 years (in millions of Euros) Financial assets : Cross currency interest rate swaps 7 23 At December 31, 2014 Less than Between 1 Over 1 year and 5 years 5 years (in millions of Euros) Financial liabilities: Borrowings(A) Cross currency interest rate swaps Net cash flows from derivatives liabilities related to currencies and metal(B) Trade payables and other (excludes deferred revenue) At December 31, 2013 Less than Between 1 Over 1 year and 5 years 5 years At December 31, 2013 Less than Between 1 Over 1 year and 5 years 5 years 92 304 1,456 41 6 94 21 341 73 840 1,005 43 21 368 1,456 18 633 698 9 17 141 341 (A) Borrowings include the U.S. Revolving Credit Facility which is considered short-term in nature and is included in the category Less than 1 year and undiscounted forecasted interests on the Term Loan. (B) Foreign exchange options have not been included as they are not in the money. See NOTE 19 Borrowings, for further details on borrowings and credit facilities. See NOTE 16 Trade receivables and others, for further details on factoring arrangements. Derivative financial instruments The Group enters into derivative contracts to manage operating exposure to fluctuations in foreign currency, aluminum, copper, silver and natural gas prices. The tables below show the undiscounted contractual values and terms of derivative instruments. At December 31, 2014 Less than Between 1 1 year and 5 years Total (in millions of Euros) Assets - Derivative Contracts(A) Aluminum future contracts Currency derivative contracts Cross currency interest rate swap(B) Total Liabilities - Derivative Contracts(A) Aluminum future contracts Copper future contracts Silver and natural gas future contracts Currency derivative contracts Cross currency interest rate swaps(B) Total At December 31, 2013 Less than Between 1 1 year and 5 years Total 2 41 7 50 11 23 34 2 52 30 84 1 12 13 7 7 1 19 20 16 2 3 52 73 2 3 39 44 18 5 3 91 117 8 10 6 24 2 2 5 21 30 10 2 15 27 54 (A) Foreign exchange options have not been included as they are not in the money. (B) The principal of the U.S. Dollar Notes issued in May 2014 is hedged by using floating-floating cross currency basis swaps indexed on floating Euro and U.S. Dollar interest rates. At December 31, 2014, the Group recognize a positive fair value of the hedging instrument for 30 million (undiscounted amount). The principal of the U.S. Dollar loans issued in March 2013 were hedged through cross currency interest rate swaps and rolling foreign exchange forwards. The cross currency swaps had a negative fair value of 27 million (undiscounted amount) at December 31, 2013. -44Copyright © 2013 www.secdatabase.com. All Rights Reserved. Please Consider the Environment Before Printing This Document NOTE 25 - FINANCIAL INSTRUMENTS The tables below show the classification of financial assets and liabilities, which includes all third and related party amounts. Financial assets and liabilities by categories (in millions of Euros) Notes Cash and cash equivalents Trade receivables and Finance Lease receivables Other financial assets Total financial assets (in millions of Euros) Trade payables Borrowings Other financial liabilities Total financial liabilities 17 16 Notes 20 19 At December 31, 2014 At Fair Value Loans and through Profit receivables and loss(A) 989 458 7 1,454 At Fair Value through Profit and loss(A) 659 1,252 1,911 Total 989 458 90 1,537 83 83 At amortized costs At December 31, 2013 At Fair Value Loans and through Profit receivables and loss Total 233 394 32 659 21 21 At amortized costs 659 1,252 111 2,022 111 111 233 394 11 638 469 348 817 Total At Fair Value through Profit and loss Total 469 348 60 877 60 60 Other financial assets and Other financial liabilities are detailed as follows: At December 31, 2014 Non-current Current Total (in millions of Euros) At December 31, 2013 Non-current Current Total Derivatives Margin calls Other(B) Other financial assets 33 33 50 7 57 83 7 90 7 7 14 11 25 21 11 32 Derivatives Other financial liabilities 40 40 71 71 111 111 36 36 24 24 60 60 (A) Except for derivatives hedging the foreign currency risk associated to Wise purchase price. (See NOTE 3 Acquisition of Wise entities) (B) Corresponds to advance payments related to finances leases contracted for the expansion of the site in Van Buren, U.S. Fair values All the derivatives are presented at fair value in the balance sheet. The carrying value of the Groups borrowings is the redemption value at maturity. The fair value of the ABL and December 2014 Senior Notes is approximately the carrying value. The fair value of the May 2014 Senior Notes accounts for 87.0% of the carrying value and amounts to 540 million as of December 31, 2014. The fair values of other financial assets and liabilities approximate their carrying values, as a result of their liquidity or short maturity. Margin calls Constellium Finance SAS and Constellium Switzerland AG entered into agreements with some financial institutions in order to define applicable rules with regards to the setting-up of derivative trading accounts. On a daily or weekly basis (depending on the arrangement with each financial institution), all open currency or metal derivative contracts are revalued to the current market price. When the change in fair value reaches a certain threshold (positive or negative), a margin call occurs resulting in the Group making or receiving back a cash payment to/from the financial institution. The cash deposit related to margin calls made by the Group is nil as of December 31, 2014 (11 million at December 31, 2013). Copyright © 2013 www.secdatabase.com. All Rights Reserved. Please Consider the Environment Before Printing This Document Valuation hierarchy The following table provides an analysis of financial instruments measured at fair value, grouped into levels based on the degree to which the fair value is observable: Level 1 valuation is based on quoted prices (unadjusted) in active markets for identical financial instruments, it includes aluminum futures that are trade on the LME; Level 2 valuation is based on inputs other than quoted prices included within Level 1 that are observable for the assets or liabilities, either directly (i.e. prices) or indirectly (i.e. derived from prices), it includes foreign exchange derivatives. The method used to calculate the fair value mainly consists on discounted cash flow; and Level 3 valuation is based on inputs for the asset or liability that are not based on observable market data (unobservable inputs). -45- Copyright © 2013 www.secdatabase.com. All Rights Reserved. Please Consider the Environment Before Printing This Document At December 31, 2014 (in millions of Euros) Level 1 Level 2 2 22 81 89 Level 1 Level 2 1 12 20 48 Other financial assets Other financial liabilities Level 3 Total 83 111 At December 31, 2013 (in millions of Euros) Other financial assets Other financial liabilities Level 3 Total 21 60 NOTE 26 - INVESTMENTS IN JOINT VENTURES At December 31, 2014 As at January 1 Group share in profit / (loss) Change in consolidation scope Effects of changes in foreign exchange rates As at December 31 1 (1 19 2 21 At December 31, 2013 2 (1 1 ) ) The Group holds a 49.85% interest in a joint-venture named Rhenaroll S.A. (located in Biesheim, France), specialized in the chromeplating, grinding and repairing of rolling mills rolls and rollers. As of December 31, 2014, the revenue of Rhenaroll amounted to 3 million (3 million as of December 31, 2013). The entitys net income was immaterial both in 2014 and 2013. Quiver Ventures LLC, a joint-venture in which Constellium holds a 51% interest, was created during the fourth quarter of 2014. This joint-venture will supply Body-in-White aluminum sheet to the North American automotive industry through a facility located in Bowling Green, Kentucky. The joint venture did not operate in 2014, production being scheduled to start in the first half of 2016. These investments in joint ventures are accounted for under the equity method. Rhenaroll S.A. and Quiver Ventures LLC are private companies and there are no quoted market prices available for their shares. (in millions of Euros) % interest Rhenaroll S.A. Quiver Ventures LLC Investments in joint ventures Group share of joint ventures net assets At December 31, At December 31, 2014 2013 49.85 % 51.00 % 1 20 21 Group share of joint ventures profit / (loss) Year ended Year ended 2014 2013 1 1 (1 (1 ) ) NOTE 27 - DEFERRED INCOME TAXES (in millions of Euros) Shown in the Consolidated Statement of Financial Position: Deferred income tax assets Deferred income tax liabilities Net deferred income tax assets At December 31, 2014 At December 31, 2013 190 190 177 (1 176 ) The following table shows the changes in net deferred income tax assets (liabilities) for the years ended December 31, 2014 and 2013. (in millions of Euros) Balance at beginning of year Net deferred income tax assets acquired Deferred income taxes recognized in the Consolidated Income Statement Year ended December 31, 2014 Year ended December 31, 2013 176 (3 Copyright © 2013 www.secdatabase.com. All Rights Reserved. Please Consider the Environment Before Printing This Document 194 ) (10 ) Effects of changes in foreign currency exchange rates Deferred income taxes recognized directly in other comprehensive income Other Balance at end of year 3 (1 ) 11 3 190 (9 2 176 ) -46- Copyright © 2013 www.secdatabase.com. All Rights Reserved. Please Consider the Environment Before Printing This Document Opening Balance Acquisitions /Disposals Year ended December 31, 2014 (in millions of Euros) Deferred tax (liabilities) / assets in relation to: Long-term assets Inventories Pensions Derivative valuation Tax losses Carried forward Other (A) Total 28 11 74 3 8 52 176 Recognized in Profit or loss OCI (19 (7 3 21 2 (3 (3 ) ) ) ) FX 14 (3 ) 11 Other (3 ) 1 4 2 (1 ) 3 (4 ) 7 3 Closing balance 2 5 95 21 12 55 190 (A) Mainly non-deductible provisions. Year ended December 31, 2013 (in millions of Euros) Opening Balance Deferred tax assets / (liabilities) in relation to: Long-term assets Inventories Pensions Derivative valuation Tax losses Carried forward Other (A) Total Acquisitions /Disposals 75 16 62 9 6 26 194 Recognized in Profit or loss OCI (9 22 (6 5 (22 (10 ) ) ) ) FX (9 ) (9 ) Other Closing balance (1 ) (1 ) (38 ) (5 ) (3 ) 48 2 28 11 74 3 8 52 176 FX Other Closing balance 18 18 75 16 62 9 6 26 194 (A) Mainly non-deductible provisions. Year ended December 31, 2012 (in millions of Euros) Opening Balance Deferred tax (liabilities) / assets in relation to: Long-term assets Inventories Pensions Derivative valuation Tax losses Carried forward Other Total 121 (14 45 30 (6 176 Acquisitions /Disposals ) ) Recognized in Profit or loss OCI (47 ) 31 1 (21 ) 6 14 (16 ) 16 16 1 (1 ) Based on the expected taxable income of the entities, the Group believes that it is more likely than not that a total of 599 million ( 516 million at December 31, 2013; 497 million at December 31, 2012) of deductible temporary differences, unused tax losses and unused tax credits will not be used. Consequently, net deferred tax assets have not been recognized. The related tax impact of 193 million ( 153 million at December 31, 2013; 175 million at December 31, 2012) is attributable to the following: (in millions of Euros) Tax losses In 2014 In 2015 In 2016 In 2017 In 2018 In 2019 and after (limited) Unlimited Unused tax credits At December 31, 2014 (72 (1 (1 (1 (54 (15 Copyright © 2013 www.secdatabase.com. All Rights Reserved. Please Consider the Environment Before Printing This Document At December 31, 2013 ) ) ) ) ) ) (62 (2 (2 (40 (18 ) ) ) ) ) Deductible temporary differences Depreciation and Amortization Pensions (A) Other Total (121 (8 (112 (1 (193 (A) Increase mostly related to Switzerland and the United States. -47- Copyright © 2013 www.secdatabase.com. All Rights Reserved. Please Consider the Environment Before Printing This Document ) ) ) ) ) (91 (9 (77 (5 (153 ) ) ) ) ) Substantially all of the tax losses not expected to be used reside in the Netherlands, in France and in Switzerland. The holding companies in the Netherlands have been generating tax losses over the past three years, and these holding companies are not expected to generate sufficient taxable profits in the foreseeable future to utilize these tax losses before they expire in the years from 2018 to 2021. The tax losses not expected to be utilized in France relate to losses generated by certain of our French companies prior to joining the tax consolidation group created on January 1, 2012. Although tax losses do not expire in France and although the French tax consolidation group is profitable, tax losses generated prior to joining the tax group by loss-generating companies can only be utilized on a standalone basis. It is more likely than not that these loss-making companies will not be able to utilize their losses on a stand-alone basis in the foreseeable future. Consequently, the related deferred tax assets have not been recognized. The tax losses not expected to be utilized in Switzerland relate to losses, generated by one of our Swiss entities, that will expire in the years from 2019 to 2021. Due to the adverse consequences of certain 2014 agreements which will terminate beyond 2019, this Swiss entity is not expected to generate sufficient taxable profits over the next coming years to utilize these losses before they expire. Substantially all the unrecognized deferred tax assets on deductible temporary differences on pension relate to the United States and to the Swiss entity. In assessing the recoverability of these deferred tax assets we have carefully considered the available positive and negative evidence, and determined that the positive evidence (such as recent profits, which were positively impacted by non-recurring favorable items) is less objectively verifiable and still carries less weight than the negative evidence (such as long history of operating losses, specific unfavorable agreements and lack of long term visibility on future operating profits) in the assessment of long term deferred tax asset recognition. NOTE 28 - COMMITMENTS Non-cancellable operating leases commitments The Group leases various buildings, machinery, and equipment under operating lease agreements. Total rent expense was 19 million for the year ended December 31, 2014 (17 million for the year ended December 31, 2013). The future aggregate minimum lease payments under non-cancellable operating leases are as follows: At December 31, 2014 (in millions of Euros) Less than 1 year 1 to 5 years More than 5 years Total non-cancellable operating leases minimum payments At December 31, 2013 14 31 5 9 26 3 50 38 Capital expenditure commitments At December 31, 2014 (in millions of Euros) Property, Plant and equipment Total capital expenditure commitments 132 132 -48- Copyright © 2013 www.secdatabase.com. All Rights Reserved. Please Consider the Environment Before Printing This Document At December 31, 2013 46 46 NOTE 29 - RELATED PARTY TRANSACTIONS The following table describes the nature and amounts of related party transactions included in the Consolidated Income Statement. (in millions of Euros) Year ended December 31, 2014 Notes Revenue(A) Metal supply(B) Exit fees Interest expense(C) Realized exchange loss on other financial items Unrealized exchange (loss) on financing activities Finance costs net Realized gains on derivatives Other Gains net 10, 19 8 Direct expenses related to acquisition, separation and IPO(D) Year ended December 31, 2013 2 (473 (15 Year ended December 31, 2012 6 (583 (2 (6 (7 (15 ) ) ) ) ) ) ) (A) The Group sells products to certain subsidiaries and affiliates of Rio Tinto. (B) Purchases of metal from certain subsidiaries and affiliates of Rio Tinto, net of changes in inventory levels, are included in Cost of sales in the Consolidated Income Statement. (C) Until May 2012, the Group incurred interest expense on borrowings due to Apollo Omega and Bpifrance. (D) Representing transaction costs, equity fees and other termination fees of the management agreement paid to the Owners. The following table describes the nature and year-end related party balances of amounts included in the Consolidated Statement of Financial Position, none of which is secured by pledged assets or collateral. (in millions of Euros) Trade receivables Trade payables Notes 16 20 At December 31, 2014 At December 31, 2013 1 58 Transactions with Rio Tinto are unrelated since December 12, 2013 (see NOTE 1 General information). NOTE 30 - KEY MANAGEMENT REMUNERATION The Groups key management comprises the Board members and the Executive committee members effectively present during 2014. The Board members have been included for the period they were considered as Board member or member of the Executive Committee. Key management personnel referred above as Executive committee members are those persons having authority and responsibility for planning, directing and controlling the activities of the entity, directly or indirectly including Vice-Presidents of key activities of the Group. The costs reported below are the compensation and benefits incurred for the Key management: Short term benefits include their base salary plus bonus. Directors fees include annual director fees and Board/Committee attendance fees. Share base payments include the portion of the IFRS 2 expense allocated to key management. Post-employment benefits mainly include pension costs. Termination benefits: departure costs paid in the course of the year. Copyright © 2013 www.secdatabase.com. All Rights Reserved. Please Consider the Environment Before Printing This Document As a result, the aggregate compensation for the Groups key management is comprised of the following: (in millions of Euros) Year ended December 31, 2014 Short-term employee benefits Directors fees Share base payments Post-employment benefits Termination benefits Employer social contributions Total Year ended December 31, 2013 7 1 3 1 1 1 14 -49- Copyright © 2013 www.secdatabase.com. All Rights Reserved. Please Consider the Environment Before Printing This Document 8 2 1 1 1 13 Year ended December, 31, 2012 8 2 1 11 NOTE 31 - SUBSIDIARIES AND OPERATING SEGMENTS The following is a list of the Groups principal subsidiaries. They are wholly-owned subsidiaries of Constellium and are legal entities for which all or a substantial portion of the operations, assets, liabilities, and cash flows are included in the continuing operations of the consolidated reporting Group as of December 31, 2014. Entity Country Cross Operating Segment Constellium France S.A.S. (A&T, P&ARP and Holdings & Corporate) Constellium Singen GmbH (AS&I and P&ARP) Constellium Valais S.A. (AS&I and A&T) Ownership France Germany Switzerland 100 100 100 % % % U.S. 100 % China Czech Republic Germany France Slovak Republic 54 100 100 100 100 % % % % % A&T Constellium Aviatube Constellium China Constellium Italy S.p.A Constellium Japan KK Constellium Property and Equipment Company, LLC Constellium Rolled Products Ravenswood, LLC Constellium South East Asia Constellium Ussel S.A.S. France China Italy Japan U.S. U.S. Singapore France 100 100 100 100 100 100 100 100 % % % % % % % % P&ARP Constellium Deutschland GmbH Constellium Neuf Brisach S.A.S. Germany France 100 100 % % Holdings & Corporate C-TEC Constellium Technology Center Constellium Finance S.A.S. Constellium France Holdco S.A.S. Constellium Germany Holdco GmbH & Co. KG Constellium Germany Holdco Verwaltungs GmbH Constellium Holdco II B.V. Constellium Holdco III B.V. Constellium Paris S.A.S. Constellium UK Limited Constellium U.S. Holdings I, LLC Constellium U.S. Holdings II, LLC Constellium Switzerland AG Constellium W S.A.S. Engineered Products International S.A.S. France France France Germany Germany Netherlands Netherlands France United Kingdom U.S. U.S. Switzerland France France 100 100 100 100 100 100 100 100 100 100 100 100 100 100 % % % % % % % % % % % % % % AS&I Constellium Automotive USA, LLC Constellium Engley (Changchun) Automotive Structures Co Ltd. Constellium Extrusions Decin S.r.o. Constellium Extrusions Deutschland GmbH Constellium Extrusions France S.A.S. Constellium Extrusions Levice S.r.o. Refer to NOTE 4 - Operating Segment Information for definition and description of operating segments. -50- Copyright © 2013 www.secdatabase.com. All Rights Reserved. Please Consider the Environment Before Printing This Document NOTE 32 - SHARE EQUITY PLANS Share based payment Management equity plan (MEP) The Company implemented a MEP for Constellium management in order to align their interests with the ones of the shareholders and to enable the selected managers to participate in the long-term growth of Constellium. The MEP was implemented at the beginning of 2011, with an effective date of 4 February 2011, through the establishment of a management investment company, Omega Management GmbH & Co. KG (Management KG). The selected managers were invited to invest as limited partners in Management KG to have the opportunity to hold interests in the Companys shares indirectly through this limited partnership. As a consequence, the selected Company Management is holding partnership interests in due proportion to their initial investment. These MEP interests (related to ordinary B shares) are definitely acquired and vested by tranche according to year of service and performance: The service vesting is a 20% vesting per year over a 5 year period if the share equity plan participant continues employment with Constellium through the applicable vesting date, and The performance-vesting tranches generally vest in respect of the financial year that includes the share equity plan participants effective investment date and each of the following four financial years only if the share equity plan participant continues employment with Constellium through the end of the applicable year and Constellium attains certain Management Adjusted EBITDA targets in respect of that financial year. In 2014, the accelerated vesting of the remaining non-vested portion of the Class B ordinary shares was approved. As a consequence, the fully vested Class B ordinary shares that were held through the management investment company, Omega Management GmbH & Co. KG (Management KG) have been converted into Class A ordinary shares. In accordance with IFRS 2 Share based payments, the difference between the fair value at the grant date and the acquisition amount of the Class B ordinary shares is accounted for, over the vesting period of the related MEP partnership interests, in the consolidated income statement, with a corresponding increase in equity. As of December 31, 2014, Management KG held 2.55% of the overall share capital of Constellium, consisting of 2,675,809 Class A ordinary shares. Restricted stock unit (RSU) plans Free share program In 2013, a free share program was granted to all employees in the U.S., France, Germany, Switzerland and the Czech Republic. Under this program, each eligible employee was granted an award of 25 RSU under the Constellium 2013 Equity Plan that will vest and be settled in Class A ordinary shares on the second anniversary of our initial public offering, subject to the applicable employee remaining employed by the Company or its subsidiaries through that date. Shareholding Retention Program In 2013, a shareholding retention program was implemented in order to encourage critical members of our senior management team to maintain a significant portion of their current investment under the Companys MEP. Beneficiaries of the MEP were awarded a one-time retention award under the Constellium 2013 Equity plan consisting of a grant of RSU with a grant date value equal to a specified percentage of the recipients annual base salary. The RSU will vest and be settled for our Class A ordinary shares on the second anniversary of the date of grant, subject to the recipient remaining continuously employed with the Group through that date and, for MEP participants, subject to the retention of at least 75% of interest in Class A ordinary shares under the MEP. Equity Awards Plan In May 2013, two non-employee directors were granted an award of 8,816 RSU with an aggregate grant date value of 0.1 million. The service vesting tranche vests 50% on each anniversary date of the equity award grant date. Copyright © 2013 www.secdatabase.com. All Rights Reserved. Please Consider the Environment Before Printing This Document In March and May 2014, three employees were granted 51,000 restricted stock units with an aggregate grant date value of 1.3 million. These RSU will vest 100% after a 2 year period if the employees are continuously employed from the grant date through the end of the 2 year period. In June 2014, four board members were granted an award of 2,205 RSU each with an aggregate grant date value of 0.2 million. The service vesting tranche vests 50% on each anniversary date of the equity award grant date. In September 2014, seven employees were granted 33,000 RSU with an aggregate grant date value of 0.7 million. These RSU will vest 100% after a 2 year period if the employees are continuously employed from the grant date through the end of the 2 year period. -51- Copyright © 2013 www.secdatabase.com. All Rights Reserved. Please Consider the Environment Before Printing This Document Co-investment Plan In March 2014, the company provided the opportunity to selected managers to invest part of their 2013 bonus paid in 2014 and to enter into a co-investment plan. The selected managers who effectively decided to invest part of their bonus into ordinary shares, were granted performance based RSU in an amount equal to a specified multiple (the vesting multiplier) of ordinary shares (71,490) invested as part of this plan. These performance RSU will vest after a two year period from grant date if the three following conditions are simultaneously met: The performance condition is Total Shareholder Return (TSR) related as the vesting multiplier will be in a range from 0 to 7 depending on the TSR evolution over the two year vesting period; The selected managers must be continuously employed by the Company through the end of the 2 year vesting period; and The selected managers who have invested into this co-investment plan must continue to hold 100% of the shares they initially purchased through this program until the end of the 2 year vesting period. Expense recognized during the year In accordance with IFRS 2, an expense is recognized over the vesting period. The estimate of this expense is based upon the fair value of a Class A ordinary share at the grant date. The total expense related to Share Equity Plans for the year ended December 31, 2014 and 2013, amounted to 4 million and 2 million respectively. Movements in the number of potential shares: 2014 As at January 1 Granted Forfeited Exercised Expired As at December 31 2013 659,942 92,820 (48,914 ) 703,848(A) 683,206 (23,264 ) 659,942 Potential shares are summarized as follows: Grant-date Expiry date RSU 2013-05 Free Share Program 2013-05 Equity Awards Plan 2013-10 Shareholding Retention Program Total at December 31, 2013 2014-03 Shareholding Retention Program 2014-05 Shareholding Retention Program 2014-06 Equity Awards plan 2014-09 Shareholding Retention Program Total at December 31, 2014 2015-05 2015-05 2015-10 2016-03 2016-05 2016-06 2016-09 Initial number of shares Forfeited in 2013 192,800 8,816 481,590 683,206 16,000 35,000 8,820 33,000 776,026(A) 192,800 8,816 (23,264) (48,914) 409,412 611,028 16,000 35,000 8,820 33,000 (23,264) (48,914) 703,848 Forfeited in 2014 Outstanding number of shares Fair value per share at grant date(B) 10.6 $ 14.7 13.0 $ 21.1 22.0 30.6 21.1 (A) The co-investment plan is not included as the number of RSU is unknown until the end of the vesting period. The potential rights associated to each of the 71,490 ordinary shares invested as part of this plan has been evaluated using the Monte Carlo method, and amounted to $76.60 per share at grant date. (B) Fair value is the quoted market price at grant date. -52- Copyright © 2013 www.secdatabase.com. All Rights Reserved. Please Consider the Environment Before Printing This Document NOTE 33 - DISPOSALS, DISPOSALS GROUP CLASSIFIED AS HELD FOR SALE In October 2014, the sale of Constellium Sabart in France was completed generating a loss recorded in Other Gains / (Losses). (See NOTE 8 Other Gains / (Losses) Net) The Group continues the disposal plan of another company from the Aerospace and Transportation operating segment; and therefore kept the related assets and liabilities as held for sale. As at December 31, 2014, the committed disposal plan is still in progress. At December 31, 2014 (in millions of Euros) Assets of disposal group classified as held for sale Inventories Trade receivable and other Cash and Cash equivalents Other Liabilities of disposal group classified as held for sale Provisions Pensions and other post-employment benefit obligations Trade payable and other Other At December 31, 2013 4 5 2 3 14 6 8 3 4 21 3 5 8 3 6 9 NOTE 34 - SUBSEQUENT EVENTS On January 5, 2015, Constellium N.V. completed its acquisition of Wise Metals Intermediate Holdings LLC (Wise), a private aluminum sheet producer located in Muscle Shoals, Alabama. With the closing of the acquisition, Constellium now has access to 450,000 metric tons (kt) of hot mill capacity from the widest strip mill in North America, reinforcing its position on the can market and positioning Constellium to continue to grow in the North American Body-in-White market. (See NOTE 3 Acquisition of Wise entities) -53- Copyright © 2013 www.secdatabase.com. All Rights Reserved. Please Consider the Environment Before Printing This Document


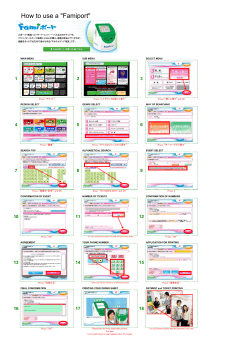

© Copyright 2026