
Genetic variation for seed yield and some of agro
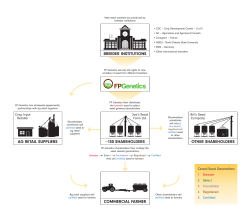
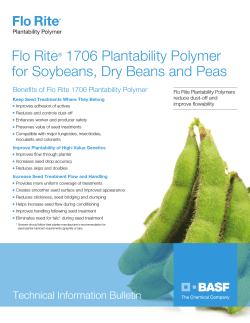
COBISS Code 1.01 DOI: 10.14720/aas.2015.105.1.08 Agrovoc descriptors: vicia faba, faba beans, varieties, crop yield, yield factors, seeds, genotypes, indigenous organisms, seed characteristics, plant breeding, selection, genes, environmental factors, heritability, agronomic characters Agris category code: f03, f62 Genetic variation for seed yield and some of agro-morphological traits in faba bean (Vicia faba L.) genotypes Peyman SHARIFI1 Received March 08, 2014; accepted February 23, 2015. Delo je prispelo 08. marca 2014, sprejeto 23. februarja 2015. ABSTRACT IZVLEČEK An investigation was carried out to select the most successful faba bean genotype(s) and to estimate the heritability for seed yield and some of agro-morphological traits. The results of analysis of variance indicated that the studied genotypes differed significantly for all of the traits. For 100-seed weight, two north's of Iran landraces (G1 and G2) and two improved breeding cultivars containing France (G4) and Barrakat (G10) possessed the heaviest seed weight, 161.33, 139, 119.67 and 166 g, respectively. G1 and G10 presented the highest values for dry seed weight (473.98 and 495.44 g m-2, respectively). G1 and G10 showed significantly higher magnitude values of the other traits. Broad sense heritability (h2) estimates were generally high to moderate for all of the studied traits. The highest estimates of broad sense heritability was inscribed as 98 % for pod length, dry seed length and dry seed width and 0.95 for hundred seed weight. The estimated broad-sense heritability was 0.80 for dry seed yield per m2. These results suggested that the environmental factors had a small effect on the inheritance of traits with high heritability. High estimates of heritability indicated that selection based on mean would be successful in improving of these traits. High heritability indicate an additive gene action for the traits, and hence, possible trait improvement through selection. Path coefficient analysis indicated that the traits containing day to harvesting, pod length, hundred seed weight and number of stems per plant play major role in seed yield determination of faba bean. Attention should be paid to these characters for augmentation of seed yield and these traits could be used as selection criteria in faba bean breeding programs. These findings indicate that selection for each or full of the above traits would be accompanied by high yielding ability under such conditions. GENETSKA VARIABILNOST PRIDELKA SEMEN IN NEKATERIH AGRONOMSKO-MORFOLOŠKIH LASTNOSTI GENOTIPOV BOBA (Vicia faba L.) Key words: additive gene action, breeding, faba bean, genetic variation, selection Raziskava je bila opravljena za izbor najdonosnejših genotipov boba z namenom oceniti heritabilnost oz. dednostni delež pridelka semen in nekaterih agronomsko-morfoloških lastnosti. Rezultati dobljeni z analizo variance so pokazali, da se vsi obravnavani genotipi značilno razlikujejo v vseh proučevanih lastnostih. Za maso 100-semen sta se izkazali najboljši dve akcesiji iz severnega Irana, (G1 in G2) in dve izboljšani sorti,’France’ (G4) ‘Barrakat’ (G10), katerih masa je znašala, 161.33, 139, 119.67 in 166 g. Genotipa G1 in G10 sta imela največjo maso suhih semen na enoto površine (473.98 in 495.44 g m-2). Ista genotipa sta izkazala tudi večje vrednosti pri drugih analiziranih lastnostih. Ocene dednostnega deleža v širšem smislu (h2) so bile na splošno velike do zmerne za vse analizirane lastnosti. Največji delež k splošni dednosti so v vrednosti 98 % prispevali dolžina strokov, dolžina in širina suhega zrna in 0.95 masa stotih semen. Ocenjena splošna dednost za pridelek suhih semen na enoto površine je bila 0.80. Ti rezultati so pokazali, da so imeli okoljski dejavniki majhen vpliv na lastnost z velikim dednostnim deležem. Velike ocene dednostnega deleža so pokazale, da je selekcija, ki bi temeljila na povprečnih vrednostih lastnosti primerna za njihovo izboljšanje. Velik dednostni delež lastnosti označuje aditivni učinek genov in možno izboljšanje lastnosti s selekcijo. Analiza združevanja lastnosti je pokazala, da so imele lastnosti, ki so vključevale število dni do žetve, dolžino stroka, maso stotih semen in število stebel na rastlino največjo vlogo pri določanju pridelka semen boba. V žlahniteljskih programih s selekcijo bi bilo potrebno posvečati pozornost tistim lastnostim boba, ki prispevajo k povečanju pridelka semen. Izsledki te raziskave kažejo, da mora biti izbrana in spremljanja vsaka ali vse analizirane lastnosti, ki imajo vpliv na velikost pridelka v danih razmerah. Ključne besede: aditivno delovanje genov, žlahtnjenje, bob, genetska variabilnost, selekcija 1 Department of Agronomy and Plant Breeding, Rasht Branch, Islamic Azad University, Rasht, Iran; email: [email protected] Acta agriculturae Slovenica, 105 - 1, marec 2015 str. 73 - 83 Peyman SHARIFI 1 INTRODUCTION Faba bean (Vicia faba L.), an autogamous plant with partial outcross ranging from 20 to 80 %, is a diploid plant with a relatively few number of large chromosomes (2n = 2x = 12) (Al-Barri and Shtaya, 2013; Basheer et al., 2013; Terzopoulos et al., 2008). It is originated in between the oriental Mediterranean countries and Afghanistan (Cubero, 1974) and most commonly included in the diets of inhabitants of the Middle East, the Mediterranean region, China and Ethiopia, and it can be used as a vegetable, green or dried, fresh or canned (Bond et al., 1985). The species is genetically isolated, tolerating no exchange of genes with any other species including its close relative Vicia narbonensis (Hawtin and Hebblethwaite, 1983). Genetic variability of faba bean is quite large. The great part of variability may be due to the presence of intermediate crossing system between autogamy and allogamy (Hanelt and Mettin, 1989). Yield improvement is a major breeding objective of most crop improvement programs in faba bean. The success of an autogamous plant breeding program depends on the choice of genotypes capable of producing progeny with desired trait combinations. Yield in faba bean, similar to the other crops, is a complex trait and constitute by many of morphological and physiological traits that correlated each other. Plant height, number of stems and pods per plant, biological yield, harvest index, 100-seed weight, days to flowering and maturity are the most important traits in faba bean improvement for increasing seed yield due to direct and indirect correlation with seed yield (Loss and Siddique, 1997) The genetic improvement of crop desired traits depends on the nature and magnitude of genetic variability and interactions involved in the inheritance of these traits which can be estimated using experimental design techniques. Many researchers studied heritability for seed yield, yield components and the other agro-morphological traits in faba bean. Seed yield is a complex trait that is quantitatively inherited with low heritability value (Bond, 1966). The low heritability and consequent limited genetic advance for yield in response to selection had led many scientists to search for characters which are associated with yield but which are more highly heritable (De 74 Acta agriculturae Slovenica, 105 - 1, marec 2015 Pace, 1979). Toker (2004) grown eight faba bean genotypes at in order to estimate the broad-sense heritability, and the heritability for plant height, number of stems and pods per plant, seed yield, biological yield, 100-seed weight, days to flowering and maturity estimated as 83, 63, 43, 62, 52, 99, 97 and 97 %, respectively. Alghamdi (2007) carried out a research in order to determine the genetic behavior of six faba bean genotypes and the results revealed that the studied genotypes significantly differed for all of the traits including plant height, number of pods per plant, number of seeds per plant, seed weight per plant and seed yield. The highest estimates of broad sense heritability were obtained for flowering date (0.986), number of pods per plant (0.96), number of seeds per plant (0.957) and maturity date (0.905), respectively. Hanna and Hayes (1966) showed low heritability for number of pods per plant (0.24), number of seeds per plant (0.23) and seed weight (0.46), respectively. El-Kadi (1968) indicated that the broad-sense heritability ranged from 6.6 to 52.1 % for seed yield, 48.1 to 65.1 % for number of stems per plant, 42.8 to 63.9 % for number of pods per plant, 51.6 to 62.2 % for plant height and 48.0 to 86.2 % for seed index. El-Kady and Khalil (1979) revealed that broad-sense heritability estimates ranged from 36.2 to 90.6 %, 10.6 to 50.9 % and 27.1 to 62.0 % for seed yield, number of seeds per plant and seed weight per plant, respectively. Abo El-Zahab et al. (1980) studied broad-sense heritability for number of pods per plant, number of seeds per pod, seed weight per plant and seed yield. Their findings indicated that heritability values were 88.4, 99.9, 84.3 and 21.3 % respectively. Bora et al. (1998) stated that the high heritability was followed by high genetic advance for fruiting stems per plant, number of pods per plant and seed yield per plant, indicating the scope for their improvement through selection. Ibrahim (2010) indicated narrow-sense heritability was high for 100-seed weight and low for seed yield per plant. Kalia and Sood (2004) revealed high broad-sense heritability estimates (0.97) along with high genetic advance (126 %) for pod yield. The present investigation aimed at the agronomic performance of ten faba bean genotypes in order to employ the most successful genotype(s) in a breading program. Heritability via variance Genetic variation for seed yield and some of agro-morphological traits in faba bean (Vicia faba L.) genotypes components for seed yield and some of agromorphological traits were also determined on faba bean genotypes in lowland of the north region of Iran. 2 MATERIALS AND METHODS This study was carried out during 2011 and 2012 in Shanderman, Iran (longitude, 49° 55´ E; latitude, 37° 27´ N; altitude, 71 m above sea level; climate, wet). Experimental material comprised 10 genotypes of faba bean that some of their features is given in Table 1. 2.1 Experimental field area The sowing of seeds was conducted in 8 December 2011 by hand. Field experiments were conducted in a randomized complete block design with three replications. Each plot consisted of four rows with 6 m long and distance between rows was 50 cm. The seeding rate was 15 plants per m2. Forty five kilogram nitrogen, phosphorus and potassium per hectare were applied as compose fertilizer including 15 kg ha-1 from any of fertilizers (15-1515) prior to sowing. All recommended agronomic practices were followed to raise good crop. The following statistical model was adopted for experimental design: Yij Gi R j ij Where, µ: general mean; Rj: effect of jth block (j = 1, 2, 3); Gi: effect of ith genotype (i = 1, 2 ... 10) and eijk: experimental Error. 2.2 Estimated characters Fifteen plants of each plot were harvested by hand and weight of seed and pod per plant were measured before and at physiological maturity stage for all of the genotypes. The characters via day to pod initiation (DP), day to harvesting (DH) and plant height (PH) were also calculated before harvesting. The remainder of plants in each plot were harvested by hand at harvest maturity stage and pod length (PL), number of dry seeds per pod (DSP), dry seed length (LS), dry seed width (SW), hundred seed weight (HSW), number of stems per plant (StP), number of pods per plant (PP), number of pods per stem (PSt), number of seeds per stem (SSt) and number of seeds per pod (SP) were measured on ten plants selected randomly from all plots. Dry seed yield per m2 (SY) and dry seed weight per plant were weighed in maturity harvesting stage. 2.3 Statistical analysis The analysis of variance was carried out according to Steel and Torrie (1980) in data after collecting and means comparison of any traits in genotypes were performed by the least significant difference (LSD) test. The genotypic and phenotypic variances ( g and 2 p2 ) were calculated from the partitioning mean squares expectation (Table 2) as follows: g2 MSg MSe r p2 g2 e2 / r Where, g and r are number of genotype and 2 2 replication, respectively; p , g and e2 are components of variance for phenotypic, genotypes and error, respectively. Broad sense heritability (h2B) was estimated as: genotypic variance/phenotypic variance (Roy, 2000): g2 H 2 p 2 Entire analyses were performed with the Statistical Analysis System (SAS) Software and Excel. GGE (genotype main effect plus genotype-byenvironment interaction) biplots are commonly used to analyze two-way data where rows and columns represent different experimental units (e.g. genotypes and traits). The mean values for genotypes across traits are used to form a Acta agriculturae Slovenica, 105 - 1, marec 2015 75 Peyman SHARIFI symmetrical data matrix from which the first two PC are extracted (Yan and Hunt 2002). All biplots presented in this paper were generated using the software GGE biplot package that runs in a windows environment, an earlier version of which Table 1. was described in Yan (2001). GGE-biplot was carried out on seven genotypes (g1, g2, g3, g5, g6, g9 and g10) and three remained genotypes (g4, g7 and g8) were excluded from biplot analysis according to their similarity to the other genotypes. Information of some of important traits on studied genotypes Genotype number 1 Genotype name - 2 - 3 France Origin North of Iran (Guilan) North of Iran (Mazandaran) France 4 Filip3 Syria 5 Filip5 Syria 6 - 7 - 8 - 9 - 10 Barrakat Lorestan (Khorramabad) Lorestan (Borujerd1) Lorestan (Borujerd2) Lorestan (Borujerd3) Iran/ Gurgaon Breedng status Autochthonous landrace Autochthonous landrace Improved breeding cultivars Improved breeding cultivars Improved breeding cultivars Autochthonous landrace Autochthonous landrace Autochthonous landrace Autochthonous landrace Improved breeding cultivars Seed structure Large Large Intermediate Small Small Small Small Small Small Large 3 RESULTS AND DISCUSSION 3.1 Analysis of variances Significance of mean squares due to different sources of variability for studied traits is summarized in Table (2). Results indicated that the studied genotypes differed significantly for all of the traits except plant height, weight of pod per plant before physiological maturity stage, number of stem per plant, number of pod per plant and ratio of pod weight per plant before physiological maturity stage. 3.2 Genotypes' mean performance The mean performances for different traits of ten faba bean genotypes are given in Table (3). Mean comparison were performed by least significant differences (LSD). Data revealed that the genotype 5 and 8 possessed the earliest pod initiation (140.33 day) and maturity date (167.67 day), respectively. On the other hand, G9 and G1 took 76 Acta agriculturae Slovenica, 105 - 1, marec 2015 146 and 175.33 days to pod initiation and maturity date, respectively. Respecting to plant height, G10 possessed the tallest plants (88.5 cm) whereas, G2 presented the shortest plants (76.21 cm). With regards to pod length, G10 owned the tallest pods (15.49). On the other side, G6 possessed the shortest ones (5.65). For weight of seed per plant before physiological stage, G2 revealed heaviest seed weight (33.22 g). For ratio of seed length to width, G1 showed the highest ratio (1.51). For number of stems per plant, number of pods per plant and number of pods per stem, G1 recorded 4.46, 12.19 and 2.77, respectively. Results indicated that the G10 possessed the highest values for number of seeds per pod, dry seed length, dry seed width, weight of pod per plant at physiological maturity stage, weight of seed per plant at physiological maturity stage, weight of pod per plant before physiological maturity stage, hundred seed weight, number of seed per plant and Genetic variation for seed yield and some of agro-morphological traits in faba bean (Vicia faba L.) genotypes number of seed per stem. For the ratios of seed per pods before and at the physiological stages and ratio of seeds per plant before physiological stage G9 had the highest ratio values 0.59, 0.64 and 0.27, respectively. G2 possessed the highest values of pod per plant ratio before physiological stage. For 100-seed weight, G1, G2, G3 and G10 possessed the heaviest seed weight 161.33, 139, 119.67 and 166 g, respectively. On the other hand, the other genotypes possessed the lowest values. G1 and G10 presented the highest value for dry seed yield, 473.98 and 495.44 g m-2, respectively. On the other hand, G7 exhibited the lowest value for dry seed yield (106.63 g m-2). From the above mentioned results, it could be deduced that G10 followed by G1 indicated the tallest plants and pods, highest number of pods, seeds, seeds weight per plant and dry seed yield (g m-2). These results express that the selection prospects within this genotype to improve the performance through breeding program. Table 2: Analysis of variance for some of morphological traits in some of faba bean genotypes SOV R G E CV SOV df 2 9 18 DP DH PH (cm) PL (cm) DSP LS (cm) WS (cm) 0.4ns 24.7* 38.75ns 1.09ns 0.04ns 0.008ns 0.0008ns 16.03** 18.01* 88.49ns 28.80** 1.82** 0.806** 0.35** 3.18 5.63 116.86 0.7 0.15 0.02 0.007 1.24 1.39 13.45 10.23 11.44 8.92 7.35 df SY WPo/Pl(ph) WSe/Pl(ph) WPo/Pl(bph) WSe/Pl(bph) HSW L/W (g/m2) (g/ plant) (g/ plant) (g/ plant) (g/ plant) (g) R 2 5661.45ns 458.88ns 111.73ns 0.033** 0.0068ns 295.43ns 0.0053ns G 9 63438.15** 8173.14** 1527.88** 0.009ns 0.0106* 7671.87** 0.0152** E 18 12450.91 932.6 271.28 0.011 0.0039 409.14 0.0029 CV 47.66 41.39 45.20 24.08 36.37 22.52 3.94 SOV df StP PP PSt SSt Se/Po(Ph) Se/Po(bPh) Se/Pl(bph) Po/Pl(bph) R 2 0.03ns 20.29ns 0.77ns 42.18* 0.0022ns 0.014ns 0.0068ns 0.03ns G 9 1.23ns 14.68ns 1.25** 28.85* 0.005** 0.068** 0.0106* 0.0089ns E 18 0.77 10.98 0.39 9.9 0.0011 0.013 0.0039 0.0103 CV 24.98 38.15 24.77 43.6 6.5 27.68 36.37 24.08 SY: Dry Seed Weight per m2; DP: Day to Pod initiation; DH: Day to Harvesting; PH: Plant Height; PL: Pod Length; LS: Dry Seed Length; WS: Dry Seed Width; DSP: Number of Seed per Plant; WPo/Pl(ph): Weight of Pod per Plant at Physiological maturity Stage; WSe/Pl(ph): Weight of Seed per Plant at Physiological maturity Stage; WPo/Pl(bph): Weight of Pod per Plant before Physiological maturity Stage; WSe/Pl(bph): Weight of Seed per Plant before Physiological maturity Stage; HSW: Hundred Seed Weight; L/W: Ratio of Seed Length to Width; StP: Number of Stem per Plant; PP: Number of Pod per Plant; SP: Number of Seed per Plant; PSt: Number of Pod per Stem; SSt: Number of Seed per Stem; Se/Po(Ph): Ratio of Seed Weight per Pod at Physiological maturity Stage; Se/Po(bPh): Ratio of Seed Weight per Pod before Physiological maturity Stage; Se/Pl(bph): Ratio of Seed Weight per Plant before Physiological maturity Stage; Po/Pl(bph): Ratio of Pod Weight per Plant before Physiological maturity Stage. ns, not significant *, significant at the 0.05 probability level **, significant at the 0.01 probability level Acta agriculturae Slovenica, 105 - 1, marec 2015 77 Peyman SHARIFI Table 3: Averaged performance for some of morphological traits in faba bean genotypes Genotype DP DH PH (cm) PL DSP LS (cm) WS (cm) number 1 142.67 175.33 86.33 8.70 2.40 2.30 1.52 2 140.67 172.33 76.21 9.80 3.22 2.12 1.51 3 141.00 173.33 77.33 10.17 3.46 1.82 1.38 4 144.33 171.33 77.67 5.93 3.12 1.13 0.81 5 140.33 170.00 74.33 8.07 3.46 1.55 1.21 6 144.67 169.67 84.83 5.65 2.76 1.18 0.90 7 147.00 171.00 74.25 6.30 3.37 1.17 0.85 8 144.33 167.67 85.25 5.85 2.81 1.13 0.86 9 146.00 168.00 76.79 5.81 3.43 1.14 0.80 10 142.00 173.33 88.50 15.49 5.30 2.37 1.66 143.30 171.20 80.15 8.18 3.33 1.59 1.15 Mean SE 0.731 0.774 1.717 0.979 0.246 0.164 0.108 LSD(1%) 4.19 5.57 25.41 1.97 0.89 0.34 0.19 WPo/Pl(ph) WSe/Pl(ph) Wpo/Pl(bph) WSe/Pl(bph) HSW Genotype SY (g/ plant) (g/ plant) (g/ plant) (g/ plant) (g) number (g/ m2) 1 315.9867 128.00 64.60 100.89 26.11 161.33 2 162.2253 92.80 47.37 114.00 33.22 139.00 3 204.0678 68.97 32.22 51.33 11.44 119.67 4 107.4393 56.23 30.27 70.78 27.56 48.67 5 88.15763 61.27 27.83 38.33 14.67 65.33 6 112.1333 34.83 18.73 33.67 17.89 48.00 7 71.08951 35.22 19.78 50.83 29.00 52.87 8 87.13008 33.07 19.13 31.56 17.22 50.00 9 82.35512 33.48 19.43 25.33 18.56 47.33 10 330.2933 193.97 85.03 175.89 30.67 166.00 73.78 36.44 69.26 22.63 89.82 Mean 156.0878 SE 45.985 16.506 7.136 15.133 2.382 15.995 LSD(1%) 262.25 71.77 38.71 0.23 0.15 47.54 Genotype StP PP SP PSt SSt Se/Po(Ph) Se/Po(bPh) Se/Pl(bPh) number 1 4.46 12.19 43.11 2.77 9.22 0.50 0.27 0.11 2 4.31 9.69 43.44 2.19 8.19 0.51 0.34 0.17 3 3.31 5.18 15.67 1.67 4.48 0.47 0.23 0.10 4 2.76 10.27 33.11 3.72 11.32 0.54 0.41 0.19 5 2.64 6.03 12.11 2.35 5.64 0.45 0.39 0.18 6 3.86 8.67 16.44 2.19 4.08 0.56 0.52 0.18 7 3.23 10.69 23.39 3.19 6.79 0.57 0.53 0.23 8 3.17 7.04 17.33 2.18 5.18 0.56 0.56 0.21 9 3.24 9.58 17.33 3.03 4.36 0.59 0.64 0.27 10 4.16 7.50 50.78 1.85 12.91 0.44 0.19 0.09 3.51 8.68 2.95 2.51 7.22 0.52 0.41 0.17 Mean SE 0.203 0.700 0.426 0.204 0.980 0.017 0.048 0.018 LSD(1%) 2.06 7.78 3.12 1.46 7.4 0.08 0.27 0.15 SE: Standard error; LSD: Least significant differences 3.3 Genetic parameter Estimates of phenotypic and genotypic variances and broad sense heritability from the partition of 78 Acta agriculturae Slovenica, 105 - 1, marec 2015 L/W 1.51 1.40 1.32 1.39 1.29 1.30 1.38 1.32 1.43 1.42 1.38 0.022 0.13 Po/Pl(bPh) 0.41 0.50 0.44 0.48 0.45 0.35 0.42 0.37 0.35 0.47 0.42 0.017 0.24 mean squares are presented in Table (4). Data indicated that the extent of phenotypic and genotypic variances varied from trait to another. Genetic variation for seed yield and some of agro-morphological traits in faba bean (Vicia faba L.) genotypes Broad sense heritability (h2) estimates were generally high to moderate for all of studied traits. The highest estimates of broad sense heritability was inscribed as 98 % for pod length, dry seed length and dry seed width and 0.95 for hundred seed weight. The estimated broad-sense heritability was 0.80 for dry seed yield per m2. These results suggested that the environmental factors had a small effect on the inheritance of traits with high heritability. High estimates of heritability indicated that selection based on mean would be successful in improving these traits. The lowest value of h2 was observed for number of stems and pods per plant with 037 and 0.25, respectively. The estimated traits before maturity stage containing weight of pod per plant at physiological maturity stage, weight of seed per plant at physiological maturity stage and weight of seed per plant before physiological maturity stage had moderate heritability. The moderate value of heritability for number of pods per stem, number of seeds per stem and number of seeds per pod were 0.69, 0.66 and 0.68, respectively. In agreement with the results of this work, Toker (2004) recorded high to moderate heritability for traits containing days to flowering and maturity, 100-seed weight and seed yield and low heritability for number of stems and pods per plant. The results of this research are also similar to the results of Alghamdi (2007), Hanna and Hayes (1966), El-Kadi (1968), El-Kady and Khalil (1979), Bora et al. (1998), Ibrahim (2010) and Kalia and Sood (2004). The magnitude of heritability was affected by the type of genetic material and yield level of environment due to the fact that the plant height, number of stems and pods per plant, dry seed yield, 100-seed weight, days to pod initiation and maturity of plants are created by the effects of genes and environment. Table 4: Estimated some of genotypic and phenotypic parameters for studied traits in faba bean Traits DP DH PL (cm) DSP LS (cm) WS (cm) SY (g/m2) WPo/Pl(ph) WSe/Pl(ph) WSe/Pl(bph) HSW (g) L/W StP PP PSt SSt SP Genotypic variance 4.28 4.13 9.37 0.56 0.26 0.11 16995.75 2413.51 418.87 0.0022 2420.91 0.0041 0.15 1.23 0.29 6.32 1.23 3.4 Path coefficient analysis The results of correlation coefficients between seed yield per m2 and were positively significant via the traits containing DH, PL, HSW, L/W, NStPl, NSeSt and NSePl. The significant negative correlation coefficient was detected between seed yield and days to pod initiation. The advantage of path analysis is that it permits the partitioning of the correlation coefficient into its components. One component is the path coefficient Phenotypic variance 5.34 6.00 9.60 0.61 0.27 0.12 21146.05 2724.38 509.29 0.0035 2557.29 0.0051 0.41 4.89 0.42 9.62 1.82 Broad-sense Heritability 0.80 0.69 0.98 0.92 0.98 0.98 0.80 0.89 0.82 0.63 0.95 0.81 0.37 0.25 0.69 0.66 0.68 (or standardized partial regression coefficient) that measures the direct effect of a predictor variable upon its response variable. The other component is the indirect effect(s) of a predictor variable on the response variable through the predictor variables (Dewey and Lu, 1959). The results showed that the coefficient of determination were 54 % (Table 5). It represents the influence of the traits involved in the study on total variability of dry seed yield. Path coefficient analysis indicated that the traits containing day to harvesting (p=0.244), pod length Acta agriculturae Slovenica, 105 - 1, marec 2015 79 Peyman SHARIFI (p=0.303), hundred seed weight (p=0.206) and number of stems per plant (p=0.216) play major role in seed yield determination of faba bean. This result concur with Alghamdi (2007) detected significant positive correlations between seed yield and each of number of pods per plant, number of seeds per plant, seed weight per plant and biological yield. In confirming with we results, Berhe et al., (1998) indicated the number of seeds per plant and 100-seed weight were the major direct contributors to seed yield per plant. These results also agree with those of Tadesse et al. (2011) and Ulukan et al. (2003) that found out days to maturity, number of pod per plants, seed per pod, thousand seed weight and plant height, pod length, and grain number per pod had high positive direct effect on seed yield per plot. Table 5: Path coefficients for seed yield components in faba bean. The diagonal under line numbers is direct effects of any trait on seed yield Traits DP DH PH PL HSW L/W StP SSt SP DP DH PH PL HSW L/W NStPl NSeSt NSePl -0.019 -0.073 -0.006 -0.166 -0.098 0.014 -0.084 0.006 0.002 0.005 0.244 0.007 0.151 0.122 0.037 0.095 -0.017 -0.002 0.003 0.059 0.032 0.089 0.027 0.013 0.111 -0.008 0.001 0.011 0.121 0.009 0.303 0.156 0.020 0.085 -0.015 0.004 0.009 0.144 0.004 0.229 0.206 0.033 0.099 -0.012 0.003 -0.003 0.099 0.004 0.068 0.075 0.092 0.049 -0.015 0.002 0.007 0.107 0.016 0.120 0.095 0.020 0.216 -0.009 0.002 0.003 0.132 0.008 0.149 0.080 0.044 0.062 -0.032 0.005 0.008 0.115 0.010 0.236 0.125 0.028 0.077 -0.026 0.006 R2=0.54 The symbol of traits is the same as in Table 2 3.5 Biplot analysis The polygon view of the biplot will be displayed (Figure 1). This view helps identify cultivars with the highest values for one or more traits. The scores of three traits containing PH, NStPl and LW fell in the genotype 10 sector, suggesting that this cultivar had highest or near-highest values for these three traits. Genotype 1 had the highest values for PH, NStPl and L/W. Since the biplot did not explain all the variation, these predictions may not exactly reflect the observed numbers. Nonetheless, cultivars that are among the top with regard to a trait can be identified with confidence. Yan and Kang (2003) demonstrated the numerous utilities of genotype and genotype-by-environment (GGE) biplot in visual analysis of genotype-bytrait data for evaluating cultivars based on traits and comparing cultivars as packages of traits. Sharifi and Safari Motlagh (2011) and Sharifi (2012) were also used biplot techniques for analysis the data obtained from diallel crosses in rice. Mohammadi and Amri (2011) examined the 80 Acta agriculturae Slovenica, 105 - 1, marec 2015 Overall effects (r) -0.43 0.650 0.330 0.697 0.719 0.372 0.578 0.453 0.581 1 R 2 =0.56 performance of 13 durum (Triticum turgidum L. var. durum Desf.) genotypes on the basis of multiple traits by biplot method. The tester vectors (Figure 2) are the lines that originate from the biplot origin and reach markers of the traits. Since the cosine of the angle between the vectors of any two traits approximates the correlation coefficient between them, this view of the biplot is best for visualizing the interrelationship among traits. Figure 2 suggests close positively associations among PL, L/W, HSW, DH, NStPl and dry seed yield per m2. Plant height indicated a weak but positive correlation with dry seed yield. GGE biplot were also used for identifying traits that are closely associated with, and therefore can be used in indirect selection for, a target trait (Yan and Kang, 2003). Oladejo et al. (2011) used biplot method to determine the interrelationships among physiological traits of thirty cowpea cultivars and identify suitable traits for indirect selection for improved crop yield. Genetic variation for seed yield and some of agro-morphological traits in faba bean (Vicia faba L.) genotypes Figure 1: Biplot analysis indicating polygon view for some of traits in faba bean genotypes g1: Autochthonous landrace (Guilan); g2: Autochthonous landrace (Mazandaran); g3: France; g5: Filip5; g6: Autochthonous landrace (Khorramabad); g9: Autochthonous landrace (Borujerd); g10: Barrakat Figure 2: Biplot analysis indicating relationships between some of traits in faba bean genotypes. g1: Autochthonous landrace (Guilan); g2: Autochthonous landrace (Mazandaran); g3: France; g5: Filip5; g6: Autochthonous landrace (Khorramabad); g9: Autochthonous landrace (Borujerd); g10: Barrakat Acta agriculturae Slovenica, 105 - 1, marec 2015 81 Peyman SHARIFI 4 CONCLUSION This study indicated that agro-morphological traits were significantly differed in the investigated faba bean genotypes. Among the 10 faba bean genotypes used in this study, G1 and G10 showed significantly higher magnitude values than other genotypes. G1 and G10 are an autochthonous landrace from Guilan, Iran and improved breeding variety, naming Barrakat, respectively. The variability among the faba bean genotypes was expected because of their different origins. Heritability of large number of traits was high and moderate. High estimates of heritability indicated that selection based on mean would be successful in improving these traits. High heritability indicate an additive gene action and, hence, possible trait improvement through selection. Some of genotypes such as G5, G7, G8 and G9 can be crosses with G1 and G10 and used their offspring's for breeding programs such as QTL mapping, diallel analysis and generation mean analysis. 5 ACKNOWLEDGMENTS This work was the part of first author’s research project “Study yield and some of agronomic traits in faba bean (Vicia faba L.) genotypes on Guilan and Lorestan province” which supported by “Islamic Azad University, Rasht Branch, Youngh Researchers Club” in Guilan province. 6 REFERENCES Abo-El-Zahab A.A., Ashor A.M., El-Hadeedy K.H. (1980). Comparative analysis of growth, development and yield of five field bean cultivars (Vicia faba L.) Z. Acker-und Pflanzenbau. 149: 113. Alghamdi S.S. (2007). Genetic Behavior of Some Selected Faba Bean Genotypes. African Crop Science Conference Proceedings. 8: 709-714. Al-Barri T., Shtaya M.J.Y., (2013). Phenotypic characterization of faba bean (Vicia faba L.) landraces grown in Palestine. Journal of Agricultural Science; 5: 110-117. Basheer-Salimia R., Shtaya M., Awad M., Abdallah J., Hamdan Y. (2013). Genetic diversity of Palestine landraces of faba bean (Vicia faba) based on RAPD markers. Genetics and Molecular Research 12 (3): 3314-3323; DOI: 10.4238/2013.September.3.8 Berhe, A., Bejiga, G., Mekonnen, D., (1998). Associations of some characters with seed yield in local varieties of Faba bean. African Crop Science Journal. 6: 197-204. Bond D.A., Lawes D.A., Hawtin G.C., Saxena M.C., Stephens J.H. (1985). Faba bean (Vicia faba L.). In: Summerfield RJ, Roberts EH (Eds) Grain Legume Crops, Collins, London: 199-265. Bond D.A. (1966). Yield and components of yield in diallel crosses between inbred lines of winter beans (Vicia faba). Journal of Agricultural Science of 82 Acta agriculturae Slovenica, 105 - 1, marec 2015 Cambridge. 67: 335-336; DOI: 10.1017/S0021859600017329 Bora G.C., Gupta S.N., Tomer Y.S., Singh S. (1998). Genetic variability, correlation and path analysis in faba bean (Vicia faba). Indian Journal of Agricultural Sciences. 68(4): 212-214. Cubero, J.I. (1974). The evolution of vicia faba. Theoretical and Applied Genetics, 45: 47-51; DOI: 10.1007/BF00283475 De Pace C. (1979). Characteristics with significant correlation to seed yield and broad bean population grown in Southern Italy. In: Semi Current research on Vicia faba in Western Europe. Ed BABND, GR Scarascia Mugnozza and M.H. Poulsen, Pub. EECEUR, 6244 En., Luxembourg: 144-167. Dewey D.R., Lu K.H. (1959). A correlation and path coefficient analysis of components of crested wheat grass seed production. Agronomy Journal. 51: 515– 518; DOI: 10.2134/agronj1959.00021962005100090002x El-Kady D.A. (1968). Genotypic and phenotypic variability and their implications in Vicia faba L. breeding. M.Sc. Thesis, Cairo University: 138 p. El-Kady M.A.K., Khalil S.A. (1979). Behaviour of seed yield components in cross between broad bean cultivars and selection for superior yield. Egyptian Journal of Agronomy. 4: 159-170. Genetic variation for seed yield and some of agro-morphological traits in faba bean (Vicia faba L.) genotypes Hanelt P., Metin D. 1989. Biosystematics of the genus Vicia L. (Leguminosae). Annual review of ecological systems, 20: 199-223. Hanna A.S., Hayes J.D. (1966). Genetic studies in field beans, Vicia faba L. I. Genetic variability in flower, pod and seed characters in a cross between two inbred lines. Z. Pflanzenzuchtg. 56: 285-294. Hawtin G.C., Hebblethwaite P.D. (1983). The faba bean (Vicia faba L.).: A basis for improvement, (P.D. Hebblethwaite, ed). Butterworths, London, UK. pp 3-22. Ibrahim H.M. (2010). Heterosis, Combining Ability and Components of Genetic Variance in Faba Bean (Vicia faba L.). Meteorology, Environment and Arid Land Agriculture Environmental Science. 21(1): 35-50. Kalia P., Sood S.H. (2004). Genetic variation and association analysis for pod yield and other agronomic and quality characters in an Indian Himalayan collection of broad bean (Vicia faba L.). SABRAO Journal of Breeding and Genetics. 36(2): 55-61. Loss S.P., Siddique K.H.M. (1997). Adaptation of faba bean (Vicia faba L.) to dryland Mediterranean-type environments. I. Seed yield and yield components. Field Crops Research. 52: 17-28; DOI: 10.1016/S0378-4290(96)03455-7 Mohammadi R., Amri A. (2011). Graphic Analysis of Trait Relations and Genotype Evaluation in Durum Wheat. Journal of Crop Improvement. 25: 680–696. Oladejo A.S., Akinwale R.O., and Obisesan I.O. (2011). Interrelationships between grain yield and other physiological traits of cowpea cultivars. African Crop Science Journal. 19: 189 – 200. Roy D. (2000). Plant breeding analysis and exploitation of variation. Alpha Science. 798 p. Sharifi P. (2012). Graphic analysis of salinity tolerance traits of rice (Oryza sativa L.) using biplot method. Cereal Research Communications. 40(3): 416–424; DOI: 10.1556/CRC.40.2012.3.3 Sharifi P., Safari Motlagh M.R. (2011). Biplot analysis of diallel crosses for cold tolerance in rice at the germination stage. Crop and Pasture Science. 62(2): 169–176; DOI: 10.1071/CP10207 Steel R.G.D., Torrie J.H. (1980). Principles and Procedures of Statistics. McGraw-Hill Book Company, Inc., New York: 633 p. Tadesse T., Fikere M., Legesse T., Parven A. (2011). Correlation and path coefficient analysis of yield and its component in faba bean (Vicia faba L.) germplasm. International Journal of Biodiversity and Conservation. 3: 376-382. Terzopoulos P.J., Bebeli P.J. (2008). Genetic diversity analysis of Mediterranean faba bean (Vicia faba L.) with ISSR markers. Field Crops Research. 108: 3944; DOI: 10.1016/j.fcr.2008.02.015 Toker C. (2004). Estimates of broad-sense heritability for seed yield and yield criteria in faba bean (Vicia faba L.). Hereditas. 140: 222-225; DOI: 10.1111/j.1601-5223.2004.01780.x Ulukan H., Mustafa G., Siddik K. (2003). A Path Coefficient Analysis Some Yield and Yield Components in Faba Bean (Vicia faba L.) Genotypes. Pakistan Journal of Biological Sciences. 6: 1951-1955; DOI: 10.3923/pjbs.2003.1951.1955 Yan W. (2001). GGE biplot – a Windows application for graphical analysis of multienvironment trial data and other types of two-way data. Agronomy Journal 93: 1111–1118; DOI: 10.2134/agronj2001.9351111x Yan W., Hunt L.A. (2002). Biplot analysis of diallel data. Crop Science. 42: 21–30; DOI: 10.1201/9781420040371 Yan W., Kang M. (2003). GGE Biplot Analysis: A Graphical Tool for Breeders, Geneticists, and Agronomists. CRC Press, 288 pages. Acta agriculturae Slovenica, 105 - 1, marec 2015 83


© Copyright 2026