
Q1 quarterly report
News Release
Release
News
May 7, 2015
TELUS reports strong results for first quarter 2015
Revenue and earnings growth driven by both wireless and wireline data
81,000 net new wireless postpaid, TV and high-speed Internet subscribers
Industry-leading customer loyalty with monthly postpaid wireless churn of 0.91 per cent seventh consecutive quarter below 1.0 per cent
$664 million returned to shareholders this year through April 2015
Quarterly dividend increased 10.5 per cent to 42 cents per share
Vancouver, B.C. – TELUS Corporation’s consolidated operating revenue grew 4.6 per cent in the first
quarter of 2015, from a year earlier. Earnings before interest, income taxes, depreciation and amortization
1
(EBITDA) increased by 5.4 per cent to $1.1 billion. Net income of $415 million was higher by 10 per cent,
while basic earnings per share (EPS) rose by 11.5 per cent to $0.68.
Darren Entwistle, TELUS Executive Chair said “The positive start to 2015 continues to reflect our team’s
world-leading engagement and ongoing commitment to delivering the best customer experience amongst our
global telecom industry peers each and every day. Indeed, their unwavering dedication in this regard was
reflected in the net addition of 81,000 new wireless postpaid, TV and high-speed subscribers in the first
quarter.”
Mr. Entwistle added, “Our strong results underscore the efficacy of our 15 year strategy focusing on the
growth of wireless and wireline data technologies and services. This focus, combined with client service
excellence, continues to support our ongoing ability to return significant amounts of cash to our shareholders
through our multi-year share purchase and dividend growth programs. Indeed, through the first four months
of 2015, TELUS has returned $664 million to shareholders, building on the more than $3.4 billion returned
over the prior two years. Moreover, I am pleased to announce that we are once again raising our quarterly
dividend to 42 cents per share, a 10.5 per cent increase year-over-year. This is our ninth dividend increase
since announcing our multi-year dividend growth program in May 2011.”
TELUS President and CEO Joe Natale said, “Our persistent focus on customer service continues to
distinguish TELUS from the competition and provide customers with a clear choice. Once again we
demonstrated the impact strong customer loyalty can have on financial performance, as both our wireless
and wireline operations experienced revenue and customer growth. Importantly, our monthly postpaid
wireless churn of 0.91 per cent remained below one per cent for the seventh consecutive quarter and is the
lowest of any national carrier by a substantial margin. These results validate our strategy and motivate and
inspire our team to continue to deliver for our customers and shareholders.”
John Gossling, TELUS Executive Vice-President and CFO said, “Our consistent financial results and strong
operational performance continue to be supported by our investment grade balance sheet. During this recent
period of an unprecedented number of spectrum auctions, capital markets have confidently supported our
strategy of investing in this core long-term asset. As a result, we have enhanced the company’s future
growth opportunities while simultaneously strengthening our balance sheet by extending our average term to
maturity to an impressive 11.1 years and lowering our average cost of long-term debt to an industry-best
4.42 per cent.”
1
CONSOLIDATED FINANCIAL HIGHLIGHTS
C$ and in millions, except per share amounts
(unaudited)
Operating revenues
Operating expenses before depreciation and amortization
(1)
EBITDA
(1)(2)
EBITDA excluding restructuring and other like costs
Net income
(3)
Adjusted net income
Basic earnings per share (EPS)
(3)
Adjusted EPS
Capital expenditures
(4)
Free cash flow
(5)
Total customer connections
(1)
(2)
(3)
(4)
(5)
Three months ended
March 31
2015
3,028
1,893
1,135
1,152
415
427
0.68
0.70
635
271
13.868
2014
2,895
1,818
1,077
1,085
377
383
0.61
0.62
496
291
13.527
Per cent
change
4.6
4.1
5.4
6.2
10.1
11.5
11.5
12.9
28.0
(6.9)
2.5
EBITDA does not have any standardized meaning prescribed by IFRS-IASB. We have issued guidance on and
report EBITDA because it is a key measure used to evaluate performance at a consolidated and segmented level.
For further definition and explanation, see Section 11.1 in the accompanying 2015 first quarter Management’s
discussion and analysis.
For the first quarter of 2015 and 2014, restructuring and other like costs were $17 million and $8 million respectively.
Adjusted net income and Adjusted EPS do not have any standardized meaning prescribed by IFRS-IASB. These
terms are defined in this news release as excluding (after income taxes): 1) restructuring and other like costs. For
further analysis of the aforementioned items see Section 1.3 in the accompanying 2015 first quarter Management’s
discussion and analysis.
Free cash flow does not have any standardized meaning prescribed by IFRS-IASB. For definition and explanation,
see Section 11.1 in the accompanying 2015 first quarter Management’s discussion and analysis.
The sum of active wireless subscribers, network access lines (NALs), high-speed Internet access subscribers and
TELUS TV subscribers (Optik TV™ and TELUS Satellite TV® subscribers), measured at the end of the respective
periods based on information in billing and other systems. Effective January 1, 2014, subscriber connections have
been restated to exclude 25,000 dial-up Internet subscribers and include 222,000 Public Mobile prepaid subscribers
in the opening subscriber balances. TELUS acquired 100% of Public Mobile, a Canadian wireless communications
operator focused on the Toronto and Montreal markets, in November 2013.
Consolidated revenue growth was generated by higher data revenue in both wireless and wireline
operations. Wireless data revenue was up 19 per cent, leading to overall network revenue growth of 6.4 per
cent, while wireline data revenue was up 7.2 per cent from a year ago. In wireless, data revenue was driven
by subscriber growth, increased customer adoption of higher-rate two-year rate plans, higher data usage as
a result of continued smartphone growth and other data-centric devices, increased data roaming and the
expansion of TELUS’ LTE network coverage. Wireline data revenue growth was generated by an increase in
Internet and enhanced data service revenue from continued high-speed Internet subscriber growth and
higher revenue per customer, TELUS TV subscriber growth, as well as growth in business process
outsourcing services and TELUS Health revenues.
In the quarter, TELUS attracted 37,000 new wireless postpaid customers, 23,000 high-speed Internet
subscribers, and 21,000 TELUS TV customers. These gains were partially mitigated by the loss of wireless
prepaid customers and network access lines. TELUS’ total wireless subscriber base is up 3.1 per cent from a
year ago to 8.3 million (which includes Public Mobile subscribers in both periods), high-speed Internet
connections are up 5.8 per cent to 1.5 million, and TELUS TV subscribers are up 11 per cent to 937,000.
TELUS’ ongoing focus on putting customers first delivered a year-over-year improvement of 8 basis points in
monthly postpaid wireless subscriber churn to 0.91 per cent. This is the seventh consecutive quarter this
important metric was below 1 per cent.
4
Free cash flow of $271 million was lower by 6.9 per cent from a year ago as higher EBITDA and lower
income tax payments were offset by high capital expenditures due mainly to investments in wireless and
wireline broadband infrastructure to support TELUS’ long-term growth.
2
The company’s net debt to EBITDA - excluding restructuring and other like costs ratio has increased to 2.30
times at the end of the quarter due to the acquisition of significant additional spectrum which has been
auctioned in unprecedented amounts over the past 15 months. We have revised our long-term financial
objective to 2.00 to 2.50 times (previously 1.50 to 2.00 times). The company believes that this new range
optimizes our cost of capital and puts TELUS’ leverage in line with global peers. The company’s strategy is
to maintain investment grade credit ratings in the range of BBB+ or the equivalent.
In the first quarter of 2015, TELUS returned $400 million to shareholders including $244 million in dividends
paid and $156 million in share purchases under its 2015 normal course issuer bid (NCIB) program. Through
the end of April, TELUS has returned $664 million to shareholders, including $487 million in dividends paid
and the purchase of 4.3 million shares for $177 million under its 2015 NCIB program.
This news release contains statements about financial and operating performance of TELUS (the Company) and
future events, including with respect to future dividend increases and normal course issuer bids through 2016 and
the 2015 annual targets and guidance that are forward-looking. By their nature, forward-looking statements
require the Company to make assumptions and predictions and are subject to inherent risks and uncertainties.
There is significant risk that the forward-looking statements will not prove to be accurate. Readers are cautioned
not to place undue reliance on forward-looking statements as a number of factors could cause actual future
performance and events to differ materially from those expressed in the forward-looking statements. Accordingly,
this news release is subject to the disclaimer and qualified by the assumptions (including assumptions for the
2015 annual targets and guidance, semi-annual dividend increases through 2016 and our ability to sustain and
complete our multi-year share purchase program through 2016), qualifications and risk factors referred to in the
accompanying first quarter Management’s discussion and analysis and in the 2014 annual report, and in other
TELUS public disclosure documents and filings with securities commissions in Canada (on SEDAR at sedar.com)
and in the United States (on EDGAR at sec.gov). Except as required by law, TELUS disclaims any intention or
obligation to update or revise forward-looking statements, and reserves the right to change, at any time at its sole
discretion, its current practice of updating annual targets and guidance.
3
Corporate Highlights
In the first quarter of 2015, TELUS made significant contributions and investments in communities and the
Canadian economy on behalf of customers, shareholders and team members:
•
•
•
•
•
•
•
Paid, collected and remitted a total of $510 million in taxes to Federal, Provincial and municipal
governments in Canada consisting of corporate income taxes, sales taxes, property taxes, employer
portion of payroll taxes and various regulatory fees. Since 2002, the company has remitted
approximately $16 billion in these taxes.
Purchased AWS-3 wireless spectrum across Canada’s most populated provinces for $1.5 billion. Since
the beginning of 2014, we have purchased wireless spectrum licences for $2.6 billion in the 700 MHz,
and AWS-3 spectrum auctions, and paid annual spectrum renewal fees of $58 million to the Canadian
federal government. Since 2002, total tax and spectrum remittances to Federal, Provincial and municipal
governments in Canada totaled approximately $20 billion.
Invested $635 million in capital expenditures in communities across Canada and more than $27 billion
since 2000.
Spent $1.8 billion in total operating expenses, including goods and service purchased of $1.2 billion, and
since 2000, spent $85 billion and $56 billion respectively in these areas.
Generated a total team member payroll of $684 million, including payroll taxes of $245 million, and since
2000, total team member payroll totaled $34 billion.
In 2015 through April, paid total dividends of $487 million to individual shareholders, mutual fund owners,
pensioners and institutional investors, and purchased 4.3 million shares for $177 million on behalf of
shareholders under our 2015 share purchase program.
Returned $11.5 billion to shareholders through its dividend and share purchase programs from 2004
through April 2015, including $6.9 billion in dividends and $4.6 billion in share buybacks.
Operating Highlights
TELUS wireless
• Wireless network revenues increased by $92 million or 6.4 per cent to $1.54 billion in the first quarter of
2015, when compared to the same period a year ago. This growth was driven by a 19 per cent increase
in data revenue, reflecting subscriber growth, increased customer adoption of higher-rate two-year plans,
higher data usage from a continued increase in smartphone adoption and other data-centric devices,
increased data roaming and the expansion of TELUS’ LTE network coverage.
• Blended ARPU increased by 3.2 per cent to $62.34, reflecting TELUS’ eighteenth consecutive quarter of
year-over-year growth.
• Monthly postpaid subscriber churn declined 8 basis points year-over-year to 0.91 per cent and blended
monthly churn was down 22 basis points to reach 1.28 per cent. TELUS’ low blended churn rate reflects the
Company’s successful customers first service approach, investments in customer retention as well as a
greater proportion of postpaid clients in TELUS’ subscriber base.
• Total wireless net additions of 8,000 decreased by 2,000 over the same period a year ago. Postpaid net
additions of 37,000 decreased by 11,000, while prepaid net losses of 29,000 improved by 9,000 yearover-year. The total wireless subscriber base was up 3.1 per cent or 250,000 from a year ago to 8.3
million. Higher-value postpaid subscribers represent approximately 86 per cent of TELUS’ total
subscriber base.
• Wireless EBITDA excluding restructuring and other like costs increased by $57 million or 8.0 per cent over
last year to $750 million due primarily to network revenue growth and operational efficiency initiatives
including the integration of Public Mobile, partially offset by higher retention costs and higher customer service
and distribution channel expenses.
• Wireless EBITDA less capital expenditures decreased by $29 million to $496 million in the quarter as higher
EBITDA was offset by an increase in capital expenditures mainly due to our investments in wireless
broadband infrastructure, including the deployment of 700 MHz spectrum.
4
TELUS wireline
• External wireline revenues increased by $16 million or 1.2 per cent to $1.36 billion in the first quarter of 2015,
when compared with the same period a year ago. This growth was generated by increased data service
revenue, partially offset by continued declines in legacy voice revenues and lower data and voice equipment
sales.
• Data revenues increased by $61 million or 7.2 per cent, due to higher Internet and enhanced data revenues
from continued high-speed Internet subscriber growth and higher revenue per customer, a higher TELUS TV
subscriber base, growth in business process outsourcing services, and increased TELUS Health revenues.
• Total TV net additions of 21,000 were lower by 6,000 from the same quarter last year, as expansion of
TELUS’ addressable high-speed broadband footprint, increasing broadband speeds and improvements in
customer churn rate were offset by business additions in the first quarter of 2014, the effects of slower
subscriber growth for paid TV services and increasing competition from over-the-top services.
• High-speed Internet net additions of 23,000 increased by 2,000 over the same quarter a year ago. The highspeed subscriber base of 1.5 million is up 82,000 or 5.8 per cent from a year ago, reflecting expansion of our
broadband coverage, the pull-through effect of Optik TV and lower churn.
• Total network access lines (NALs) declined by 25,000 in the quarter compared to a loss of 24,000 a year ago.
Residential NAL losses of 20,000 reflect an improvement of 4,000 over the same period a year ago, while
business NAL losses were 5,000, compared to no losses in the same period a year ago. The improvement in
residential NAL losses reflects the ongoing success of TELUS’ customers first initiatives and bundling
strategy, offset by ongoing wireless and Internet substitution and competition.
• Wireline EBITDA excluding restructuring and other like costs of $402 million increased by $10 million or 2.8
per cent year-over-year. The improvement reflects continued growth in high-speed Internet and enhanced
data, TELUS TV, business process outsourcing services and TELUS Health revenues, as well as improving
margins and ongoing operating efficiency initiatives.
• Wireline EBITDA less capital expenditures decreased by $52 million to $4 million as higher EBITDA was
more than offset by higher capital expenditures that are supporting TELUS’ long-term growth. Capital
expenditures increased over the same period last year due to continued investments in broadband network
infrastructure, including connecting more homes and businesses directly to our fibre optic broadband network
and extending the reach and functionality of our healthcare solutions, and investments in system resiliency
and reliability and to support business service growth.
Dividend Declaration - increased to 42 cents per quarter, up 10.5 per cent from a year ago
The TELUS Board of Directors has declared a quarterly dividend of 42 cents ($0.42) Canadian per share on
the issued and outstanding Common Shares of the Company payable on July 2, 2015 to holders of record at
the close of business on June 10, 2015.
This second quarter dividend represents a four cent or 10.5 per cent increase from the $0.38 quarterly
dividend paid on July 2, 2014.
About TELUS
TELUS (TSX: T, NYSE: TU) is Canada’s fastest-growing national telecommunications company, with $12.1
billion of annual revenue and 13.9 million customer connections, including 8.3 million wireless subscribers,
3.1 million wireline network access lines, 1.5 million high-speed Internet subscribers and 937,000 TELUS TV
customers. TELUS provides a wide range of communications products and services, including wireless,
data, Internet protocol (IP), voice, television, entertainment and video, and is Canada's largest healthcare IT
provider.
In support of our philosophy to give where we live, TELUS, our team members and retirees have contributed
more than $396 million to charitable and not-for-profit organizations and volunteered and more than 6 million
hours of service to local communities since 2000. Created in 2005 by Executive Chairman Darren Entwistle,
TELUS’ 11 community boards across Canada have led the company’s support of grassroots charities and
will have contributed $47 million in support of 3,700 local charities organizations by the end of 2014,
enriching the lives of more than two million Canadian children and youth. TELUS was honoured to be named
the most outstanding philanthropic corporation globally for 2010 by the Association of Fundraising
Professionals, becoming the first Canadian company to receive this prestigious international recognition.
For more information about TELUS, please visit telus.com.
5
Media relations:
Shawn Hall
(604) 619-7913
[email protected]
Investor relations:
Paul Carpino
(647) 837-8100
[email protected]
Access to Quarterly results information
Interested investors, the media and others may review this quarterly earnings news release, management’s
discussion and analysis, quarterly results slides, audio and transcript of the investor webcast call,
supplementary financial information, and our full 2014 annual report at telus.com/investors.
TELUS' first quarter 2015 conference call is scheduled for May 7, 2015 at 3:30pm ET (1:30pm MT,
12:30pm PT) and will feature a presentation followed by a question and answer period with investment
analysts. Interested parties can access the webcast at telus.com/investors. A telephone playback will be
available on May 7 until June 20 at 1-855-201-2300. Please use reference number 1178137# and access
code 92105#. An archive of the webcast will also be available at telus.com/investors and a transcript will be
posted on the website within a few business days.
6
TELUS CORPORATION
Management’s discussion and analysis
2015 Q1
7
Caution regarding forward-looking statements
This document contains forward-looking statements about expected events and the financial and operating performance of TELUS
Corporation. The terms TELUS, the Company, we, us or our refer to TELUS Corporation and where the context of the narrative
permits or requires, its subsidiaries. Forward-looking statements include statements relating to annual targets, outlook, guidance and
updates, our multi-year dividend growth program, our multi-year share purchase program, and trends. Forward-looking statements are
typically identified by the words assumption, goal, guidance, objective, outlook, strategy, target and other similar expressions, or future
or conditional verbs such as aim, anticipate, believe, predict, could, expect, intend, may, plan, seek, should, strive and will. By their
nature, forward-looking statements do not refer to historical facts, are subject to inherent risks and require us to make assumptions.
There is significant risk that forward-looking statements will not prove to be accurate. Accordingly, readers are cautioned not to place
undue reliance on forward-looking statements. Except as required by law, we disclaim any intention or obligation to update or revise
any forward-looking statements. An update to our assumptions for 2015 is presented in Section 9 Update to assumptions in this
Management’s discussion and analysis (MD&A).
Factors that could cause actual performance to differ materially from the forward-looking statements made herein and in other
TELUS filings include, but are not limited to, the following:
•
Competition including: continued intense rivalry across all services among established telecommunications companies, new
entrants, cable-TV providers, other communications companies and growing over-the-top (OTT) services; the potential entry of
new competitors; competition for wireless spectrum; our ability to continue to retain customers through an enhanced customer
service experience; network access line (NAL) losses; subscriber additions and retention volumes and associated costs for
wireless, TV and high-speed Internet services; pressures on wireless average revenue per subscriber unit per month (ARPU) from
market conditions and government actions, flat-rate pricing trends for voice and data, inclusive long distance plans for voice, and
increasing availability of Wi-Fi networks for data; and our ability to obtain and offer content on a timely basis across multiple
devices on wireless and TV platforms at a reasonable cost.
•
Regulatory decisions and developments including: the federal government’s stated intention to further increase wireless
competition, including through a fourth national wireless provider, and reduce roaming costs on wireless networks in Canada; the
Canadian Radio-television and Telecommunications Commission (CRTC) wireless wholesale services review that determined the
CRTC will regulate wholesale GSM-based domestic roaming rates; future spectrum auctions (including limitations on established
wireless providers, spectrum set-aside favouring new entrant carriers and other advantages provided to new and foreign
participants, and the amount and cost of spectrum acquired); restrictions on the purchase, sale and transfer of spectrum licences;
the outcome of the CRTC review of mandated wireline wholesale services, including consideration of mandated competitor
access to fibre-to-the-premises facilities; increased subsidy requirements for telecommunications facilities in Yukon, Nunavut and
the Northwest Territories, and possible changes to the scope and nature of basic service obligations, including higher minimum
Internet access speeds; the CRTC’s new code of conduct for TV services; vertical integration by competitors into broadcast
content ownership and timely and effective enforcement of related regulatory safeguards; ongoing monitoring and compliance with
restrictions on non-Canadian ownership of TELUS Common Shares; modification, interpretation and application of tower sharing
and roaming rules; and the non-harmonization of provincial consumer protection legislation, particularly in light of the CRTC
mandatory national Wireless Code (the Code), which came into effect on December 2, 2013, and possible operational challenges
from the Code, resulting from two-year and three-year customer contracts ending coterminously in 2015.
•
Technological substitution including: reduced utilization and increased commoditization of traditional wireline voice local and long
distance services from impacts of OTT applications and wireless substitution, and overall slower subscriber growth in the wireline
segment; increasing numbers of households that have only wireless and/or Internet-based telephone services; continuation of
wireless voice ARPU declines through, among others, substitution to messaging and OTT applications, such as Skype;
substitution to Wi-Fi services from wireless services; and OTT Internet protocol (IP) services that may displace TV and
entertainment services or impact revenue.
•
Technology including: subscriber demand for data that challenges wireless networks and spectrum capacity levels; our reliance on
legacy systems and information technology; technology options, evolution paths and roll-out plans for wireline and wireless
networks (including broadband initiatives, such as fibre to the home, and wireless small-cell deployment); our reliance on wireless
network access agreements; choice of suppliers and suppliers’ ability to maintain and service their product lines; supplier
concentration and market power for network equipment, TELUS TV and wireless handsets; the performance of long-term
evolution (LTE) wireless technology; our expected long-term need for additional spectrum capacity through future spectrum
auctions and from third parties to address increasing demand for data; deployment and operation of new wireless networks and
success of new products, new services and supporting systems; network reliability and change management (including migration
risks, related to technology and customer retention, to new, more efficient Internet data centres (IDCs) and realizing the expected
benefits); timing of decommissioning of certain legacy wireline networks, systems and services to reduce operating costs; timing of
decommissioning of CDMA and iDEN wireless networks to redeploy spectrum and reduce operating costs, and the associated
subscriber migration costs and customer retention risks; availability of resources and ability to build out adequate broadband
capacity; and success of upgrades and evolution of TELUS TV® technology, which depend on third-party suppliers.
•
Economic growth and fluctuations including: the strength and persistence of economic growth in Canada that may be influenced
by economic developments outside of Canada; future interest rates; inflation; impacts from low oil prices; pension investment
returns, funding and discount rates; and Canada: U.S. dollar exchange rates.
8
•
Capital expenditure levels and potential outlays for spectrum licences in spectrum auctions or from third parties, due to our
wireless deployment of LTE spectrum acquired and future technologies, wireline broadband initiatives, investments in network
resiliency and reliability, subscriber demand for data, new IDC initiatives and the Industry Canada wireless spectrum auction for
2.5 GHz (2500 – 2690 MHz) band, which is expected to conclude in May 2015.
•
Financing and debt requirements including our ability to carry out refinancing activities and ability to maintain investment grade
credit ratings in the range of BBB+ or the equivalent.
•
Ability to sustain dividend growth program of circa 10% per annum through 2016 and ability to sustain and complete multi-year
share purchase program through 2016. These programs may be affected by factors such as regulatory decisions and
developments, competitive environment, economic performance in Canada, our earnings and free cash flow and levels of capital
expenditures and spectrum licence purchases. Quarterly dividend decisions are subject to our Board of Directors’ (Board)
assessment and determination based on the Company’s financial position and outlook. The share purchase program may be
affected by a change in our intention to purchase shares and the assessment and determination of our Board from time to time.
Consequently, there can be no assurance that these programs will be maintained through 2016.
•
Human resource matters including: recruitment, retention and appropriate training in a highly competitive industry; and the future
outcome of collective bargaining for the contract with the Telecommunications Workers Union (TWU), United Steel Workers Local
Union 1944, which expires at the end of 2015.
•
Ability to successfully implement cost reduction initiatives and realize planned savings, net of restructuring and other like costs,
without losing customer service focus or negatively affecting business operations. Initiatives include: our earnings enhancement
program to drive improvements in earnings before interest, income taxes, depreciation and amortization (EBITDA); business
integrations; business process outsourcing; internal offshoring and reorganizations; procurement initiatives; and real estate
consolidation.
•
Process risks including: our reliance on legacy systems and ability to implement and support new products and services and
business operations; our ability to implement effective change management for system replacements and upgrades, process
redesigns and business integrations; implementation of complex large enterprise deals that may be adversely impacted by
available resources, system limitations and degree of co-operation from other service providers; our ability to successfully manage
operations in foreign jurisdictions; information security and privacy breaches, including data loss or theft of data; and real estate
joint venture re-development risks.
•
Tax matters including: complex tax laws that may be subject to interpretation by the tax authorities that may differ from our
interpretations; changes in tax laws, including tax rates; elimination of income tax deferrals through the use of different tax yearends for operating partnerships and corporate partners; and international tax complexity and compliance.
•
Business continuity events including: our ability to maintain customer service and operate our networks in the event of human
error or human-caused threats, such as electronic attacks and equipment failures that could cause various degrees of network
outages; supply chain disruptions; natural disaster threats; epidemics and pandemics; and the completeness and effectiveness of
business continuity and disaster recovery plans and responses.
•
Litigation and legal matters including: our ability to defend successfully against investigations, claims and lawsuits, including class
actions pending against us; and the complexity of legal compliance in domestic and foreign jurisdictions.
•
Acquisitions or divestitures including: our ability to successfully integrate acquisitions or complete divestitures in a timely manner
and realize expected strategic benefits.
•
Health, safety and environmental developments and other risk factors discussed herein and listed from time to time in our reports
and public disclosure documents, including our annual report, annual information form and other filings with securities
commissions or similar regulatory authorities in Canada (on SEDAR at sedar.com) and in our filings with the Securities and
Exchange Commission (SEC) in the United States, including Form 40-F (on EDGAR at sec.gov). Section 10: Risks and risk
management in our annual 2014 MD&A and this MD&A are incorporated by reference in this cautionary statement.
9
Management’s discussion and analysis
May 7, 2015
Contents
Section
Description
1.
Introduction
1.1 Preparation of the MD&A
1.2 The environment in which we operate
1.3 Consolidated highlights
2.
Core business and strategy
3.
Corporate priorities for 2015
4.
Capabilities
4.1 Principal markets addressed and competition
4.2 Operational resources
4.3 Liquidity and capital resources
4.4 Changes in internal control over financial reporting
5.
Discussion of operations
5.1 General
5.2 Summary of consolidated quarterly results and trends
5.3 Consolidated operations
5.4 Wireless segment
5.5 Wireline segment
6.
Changes in financial position
7.
Liquidity and capital resources
7.1 Overview
7.2 Cash provided by operating activities
7.3 Cash used by investing activities
7.4 Cash provided (used) by financing activities
7.5 Liquidity and capital resource measures
7.6 Credit facilities
7.7 Sale of trade receivables
7.8 Credit ratings
7.9 Financial instruments, commitments and contingent liabilities
7.10 Outstanding share information
7.11 Transactions between related parties
8.
Accounting matters
8.1 Critical accounting estimates
8.2 Accounting policy developments
9.
Update to assumptions
10.
Risks and risk management
10.1 Regulatory matters
11.
Definitions and reconciliations
11.1 Non-GAAP and other financial measures
11.2 Wireless operating indicators
1. Introduction
Our discussion in this section is qualified in its entirety by the Caution regarding forward-looking statements at the
beginning of this Management’s discussion and analysis (MD&A).
1.1 Preparation of the MD&A
The following sections are a discussion of the consolidated financial position and financial performance of TELUS for the
three-month period ended March 31, 2015 and should be read together with TELUS’ March 31, 2015 condensed interim
consolidated financial statements (subsequently referred to as the interim consolidated financial statements). The
generally accepted accounting principles (GAAP) we use are the International Financial Reporting Standards (IFRS) as
issued by the International Accounting Standards Board (IASB). Our interim consolidated financial statements comply
with IFRS-IASB and Canadian GAAP and have been prepared in accordance with International Accounting Standard 34,
Interim Financial Reporting. Our use of the term IFRS in this MD&A is a reference to these standards. In our discussion,
we also use certain non-GAAP financial measures, such as earnings before interest, income taxes, depreciation and
amortization (EBITDA), to evaluate our performance, monitor compliance with debt covenants and manage our capital
structure. These measures are defined, qualified and reconciled with their nearest GAAP measures in Section 11.1. All
amounts are in Canadian dollars, unless otherwise specified.
10
Our disclosure controls and procedures are designed to provide reasonable assurance that all relevant information is
gathered and reported to senior management on a timely basis, so that appropriate decisions can be made regarding
public disclosure. This MD&A and the interim consolidated financial statements were reviewed by TELUS’ Audit
Committee and authorized by the Board of Directors for issuance on May 7, 2015.
1.2 The environment in which we operate
Economic growth
We estimate that economic growth in Canada will be 2.1% in 2015 and 2.2% in 2016, based on a composite of
estimates from Canadian banks and other sources. The Bank of Canada’s April 2015 Monetary Policy Report estimated
economic growth for Canada at 1.9% in 2015 and 2.5% in 2016. In respect of the national unemployment rate, Statistics
Canada’s Labour Force Survey reported a rate of 6.8% for March 2015 (6.6% reported for December 2014 and 6.9%
reported for March 2014).
Regulatory developments
There were a number of regulatory developments in the first quarter of 2015. See Section 10.1 Regulatory matters.
1.3 Consolidated highlights
AWS-3 and 2500 MHz spectrum auctions
In March 2015, we purchased 15 wireless spectrum licences across Canada’s most-populated provinces in Industry
Canada’s AWS-3 wireless spectrum auction. The licences, acquired for $1.5 billion ($3.02/MHz/POP, where POP refers
to person of population), equate to a national average of 15 MHz and are complementary to the 16.1 MHz of national
AWS spectrum we purchased in 2008 that is now the foundation of our 4G wireless network. The AWS-3 acquisitions
increased our spectrum holdings by 16% by adding 20 MHz of spectrum in each of Quebec, British Columbia, Alberta,
Saskatchewan and Manitoba, as well as 10 MHz of spectrum in Southern Ontario. AWS-3 spectrum is well-suited for
delivering both coverage and added capacity in urban and rural environments and we expect to incorporate it into our
existing network within the next three years. We paid a $302 million deposit in the first quarter of 2015 for the AWS-3
spectrum licences, and remitted the balance of $1,209 million in April 2015.
TELUS is participating in Industry Canada’s 2500 MHz spectrum auction that began on April 14, 2015. Under the
auction rules, all participants are limited by a 40 MHz cap on bidding on this spectrum in each licence region. In those
regions where carriers exceed the spectrum cap, they will not be required to relinquish any existing spectrum holdings,
however, they will not be allowed to purchase any additional spectrum holdings. As TELUS does not currently hold any
such spectrum, the auction provides us with an opportunity to materially increase our spectrum holdings and provide
additional capacity for our long-term evolution (LTE) wireless network. The auction of liberated and unallocated
2500 MHz spectrum represents less than half the band, but no less than 60 MHz, in each market. Bell and Rogers’ ability
to bid is significantly restricted in many licence areas by their present 2500 MHz spectrum holdings.
Changes to the Board of Directors
Effective February 1, 2015, Lisa de Wilde, the Chief Executive Officer of TVO and Chair of the Toronto International Film
Festival, joined our Board of Directors. A strong believer in the power of media to engage, inform and serve the public
good, Lisa’s career has been dedicated to cultivating a strong Canadian media sector and championing the cause of
educational broadcasters across the country.
On April 2, 2015, we announced that Charlie Baillie, an independent director who has served since 2003, has
decided to retire and will not be standing for re-election at the 2015 annual general meeting (AGM). In addition to his
other duties as a Board and committee member, Charlie served as Chair of the Human Resources and Compensation
Committee from 2007 to 2014. His efforts have been important in allowing us to properly consider the interests of our
various shareholders and facilitating a deeper understanding of our approach to executive compensation.
At the 2015 AGM, we are proposing Sabi Marwah as a new independent nominee for election. Sabi retired as Vice
Chairman and Chief Operating Officer of the Bank of Nova Scotia (Scotiabank) in 2014. As Vice Chairman, Sabi was
actively involved in developing the bank’s strategic plans and was responsible for its financial and administrative
functions.
New $1.75 billion debt offering
On March 27, 2015, we announced the closing of a debt offering of $1.75 billion in senior unsecured notes in three
series: a $250 million 1.50% offering due March 27, 2018, a $1.0 billion 2.35% offering due March 28, 2022 and a
$500 million 4.40% offering due January 29, 2046. The net proceeds were used to fund the remaining $1.2 billion of the
purchase price of the AWS-3 spectrum licences, with the remaining balance used for general corporate purposes. These
debt issues, combined with those in the third quarter of 2014, contributed to the increase in our average term to maturity
of long-term debt (excluding commercial paper) to approximately 11.1 years at March 31, 2015 (10.9 years at
December 31, 2014). Additionally, our weighted average cost of long-term debt declined to 4.42% at March 31, 2015, as
compared to 4.72% at December 31, 2014.
11
Sale of TELUS office tower in Vancouver, B.C.
In February 2015, we announced that Vancouver, B.C.-based Avigilon Corp., a global provider of end-to-end
security solutions, agreed to purchase TELUS’ existing office building on Robson Street in downtown Vancouver for
$42 million. We expect the sale to close in the fourth quarter of 2015. TELUS team members will be moving from the
Robson Street building to the new TELUS Garden office re-development in downtown Vancouver in the May to July
2015 timeframe.
Share purchase programs
On September 23, 2014, the Toronto Stock Exchange (TSX) approved our 2015 normal course issuer bid (2015 NCIB)
to purchase and cancel up to 16 million of our Common Shares with a value of up to $500 million over a 12-month
period, commencing October 1, 2014. Such purchases may be made through the facilities of the TSX, the New York
Stock Exchange (NYSE) and alternative trading platforms or otherwise as may be permitted by applicable securities laws
and regulations. This represents up to 2.6% of the Common Shares outstanding at the date of the 2015 NCIB notice to
the TSX. The Common Shares will be purchased only when and if we consider it advisable. As of April 30, 2015,
pursuant to our 2015 NCIB, we had purchased approximately 7.1 million Common Shares for cancellation for
$292 million, at an average price of $40.86 per share.
For additional information on our multi-year share purchase program, see Section 4.3. Also see Caution
regarding forward-looking statements – Ability to sustain and complete multi-year share purchase program
through 2016.
Consolidated highlights
Three-month periods ended March 31 ($ millions, unless noted otherwise)
2015
2014
Change
3,028
679
562
415
2,895
614
512
377
4.6 %
10.6 %
9.8 %
10.1 %
Net income per Common Share
Basic (basic EPS) ($)
Diluted ($)
Dividends declared per Common Share ($)
0.68
0.68
0.40
0.61
0.60
0.36
11.5 %
13.3 %
11.1 %
Basic weighted-average Common Shares outstanding (millions)
608
622
(2.3)%
Consolidated statements of income
Operating revenues
Operating income
Income before income taxes
Net income
Consolidated statements of cash flows
Cash provided by operating activities
Cash used by investing activities
Capital expenditures (excluding spectrum licences)1
Cash provided (used) by financing activities
718
598
20.1 %
(926)
(635)
(827)
(496)
(12.0)%
(28.0)%
1,727
(55)
n/m
13,868
1,135
17
1,152
38.0
271
2.30
13,527
1,077
8
1,085
37.5
291
1.97
Other highlights
Subscriber connections2 (thousands)
EBITDA3
Restructuring and other like costs included in EBITDA3
EBITDA – excluding restructuring and other like costs3
EBITDA – excluding restructuring and other like costs margin4 (%)
Free cash flow3
Net debt to EBITDA – excluding restructuring and other like costs3 (times)
2.4 %
5.4 %
112.5 %
6.2 %
0.5 pts.
(6.9)%
0.33
Notations used in MD&A: n/m – Not meaningful; pts. – Percentage points.
1. Capital expenditures (excluding spectrum licences) include assets purchased, but not yet paid for, and consequently differ from cash payments
for capital assets, excluding spectrum licences, on the interim consolidated statements of cash flows.
2. The sum of active wireless subscribers, network access lines (NALs), high-speed Internet access subscribers and TELUS TV subscribers
(Optik TV™ and TELUS Satellite TV® subscribers), measured at the end of the respective periods based on information in billing and other
systems. Effective January 1, 2014, subscriber connections have been restated to exclude 25,000 dial-up Internet subscribers and include
222,000 Public Mobile prepaid subscribers in the opening subscriber balances. TELUS acquired 100% of Public Mobile, a Canadian wireless
communications operator focused on the Toronto and Montreal markets, in November 2013.
3. Non-GAAP and other financial measures. See Section 11.1.
4. EBITDA – excluding restructuring and other like costs, as a percentage of operating revenues.
12
Operating highlights
•
Consolidated operating revenues increased year over year by $133 million or 4.6% in the first quarter of 2015.
This includes year-over-year growth in wireless network revenues of $92 million or 6.4% in the first quarter of 2015,
and year-over-year growth in wireless equipment and other revenues of $25 million or 22% in the first quarter of
2015. The increase in wireless network revenue resulted from growth in the wireless subscriber base, an increased
proportion of higher-rate two-year plans in the revenue mix and higher wireless data usage from the continued
adoption of smartphones and other data-centric wireless devices, partly offset by a decline in wireless voice revenue
due to the increased adoption of unlimited nationwide voice plans and continued, but moderating, substitution of
voice to data services. Wireline data revenues increased year over year by $61 million or 7.2% in the first quarter of
2015, due to revenue growth in Internet and enhanced data services, TELUS TV, business process outsourcing and
TELUS Health services, net of lower data equipment sales. The increase in wireline data revenues was partly offset
by ongoing declines in legacy wireline voice service and equipment revenues.
Wireless blended average revenue per subscriber unit per month (ARPU) was $62.34 in the first quarter of
2015, up $1.92 or 3.2% from the same period in 2014. The increase was driven by the effects of higher-rate twoyear plans, growth in data usage, a more favourable postpaid subscriber mix and increased data roaming, partly
offset by a decline in voice revenue. Postpaid subscribers represented 86.2% of the total subscriber base at
March 31, 2015, compared to 84.6% at March 31, 2014.
•
During the 12-month period ended March 31, 2015, our subscriber connections increased by 341,000 or 2.4%.
This reflects 12-month increases in wireless subscribers (3.1%), TELUS TV subscribers (11%) and high-speed
Internet subscribers (5.8%), partly offset by a 2.7% decline in total NALs.
Our postpaid wireless subscriber net additions were 37,000 in the first quarter of 2015, a decrease of 11,000
from the first quarter of 2014. The decrease reflects slower market growth and increased competitive intensity, partly
offset by a reduction in our postpaid churn rate. Our monthly postpaid subscriber churn rate was 0.91% in the
first quarter of 2015, as compared to 0.99% in the first quarter of 2014. Our blended churn rate was 1.28% in the first
quarter of 2015, as compared to 1.50% in the first quarter of 2014. These improvements in churn rates were due to
our continued focus on customers first initiatives and clear and simple approach.
•
Consolidated EBITDA increased year over year by $58 million or 5.4% in the first quarter of 2015. EBITDA –
excluding restructuring and other like costs increased year over year by $67 million or 6.2% in the first quarter of
2015, reflecting growth in wireless network revenues and wireline data revenues, improving Internet, TELUS TV,
TELUS Health and business process outsourcing service margins and executing on our operational efficiency
initiatives, all partly offset by higher wireless retention costs and continued declines in legacy wireline voice
revenues.
•
Operating income increased year over year by $65 million or 11% in the first quarter of 2015 as a result of EBITDA
growth and a decrease in total depreciation and amortization expenses. The decrease in total depreciation and
amortization expenses resulted from asset life adjustments arising from our continuing program of asset life studies,
net of growth in capital assets.
•
Income before income taxes increased year over year by $50 million or 9.8% in the first quarter of 2015, as higher
operating income was partly offset by an increase in financing costs. The increase in financing costs resulted from
the increase in average long-term debt outstanding, partly offset by a lower weighted average cost of long-term debt.
•
Income taxes increased year over year by $12 million or 8.9% in the first quarter of 2015, primarily reflecting higher
income before income taxes.
•
Net income increased year over year by $38 million or 10% in the first quarter of 2015 as a result of the factors
described above. Excluding the effects of restructuring and other like costs, net income increased year over year by
$44 million or 11% in the first quarter of 2015.
Analysis of Net income
Three-month periods ended March 31 ($ millions)
2015
2014
Change
Net income
Add back (deduct):
Restructuring and other like costs, after income taxes
415
377
38
12
6
6
Net income excluding the above items
427
383
44
13
•
Basic earnings per share (basic EPS) increased year over year by $0.07 or 12% in the first quarter of 2015. The
reduction in the number of shares outstanding, as a result of our NCIB program, net of share option exercises,
contributed approximately $0.02 to the year-over-year increase in basic EPS, with the balance driven mainly by
higher EBITDA. Excluding the effects of restructuring and other like costs, basic EPS increased year over year by
$0.08 or 13% in the first quarter of 2015.
Analysis of basic EPS
Three-month periods ended March 31 ($)
•
2015
2014
Change
Basic EPS
Add back (deduct):
Restructuring and other like costs, after income taxes, per share
0.68
0.61
0.07
0.02
0.01
0.01
Basic EPS excluding the above items
0.70
0.62
0.08
Dividends declared per Common Share were $0.40 in the first quarter of 2015, up 11% from the first quarter of
2014. On May 6, 2015, the Board declared a second quarter dividend of $0.42 per share on the issued and
outstanding Common Shares, payable on July 2, 2015, to shareholders of record at the close of business on
June 10, 2015. The second quarter dividend increased by $0.04 per share or 9.5% from the $0.38 per share
dividend declared one year earlier, and increased by $0.02 per share or 5.0% from the $0.40 per share dividend
declared in February 2015, consistent with our multi-year dividend growth program described in Section 4.3.
Liquidity and capital resource highlights
•
Net debt to EBITDA – excluding restructuring and other like costs was 2.30 times at March 31, 2015, up from
1.97 times at March 31, 2014, as the increase in net debt was partly offset by growth in EBITDA – excluding
restructuring and other like costs (see Section 7.5 Liquidity and capital resource measures). Our financial objectives,
which are reviewed annually, include a revised objective range for this ratio of 2.00 to 2.50 times, which we believe is
consistent with maintaining investment grade credit ratings in the range of BBB+ or the equivalent and providing
reasonable access to capital. In the short term, we may permit this ratio to go outside the objective range (for longterm investment opportunities), but will endeavour to return it to the objective range as we believe that the objective
range is supportive of our strategy. We are well in compliance with the leverage ratio covenant in our credit facilities,
which states that we may not permit our net debt to operating cash flow ratio to exceed 4.00:1.00 (see Section 7.6
Credit facilities).
•
Cash provided by operating activities increased year over year by $120 million or 20% in the first quarter of 2015.
The increase primarily reflected higher consolidated EBITDA and lower income tax payments, partly offset by higher
share-based compensation payments and interest paid.
•
Cash used by investing activities increased year over year by $99 million or 12% in the first quarter of 2015,
mainly due to increased capital expenditures and a larger deposit for the AWS-3 spectrum licence auction concluded
in March, as compared to the deposit for the 700 MHz spectrum licence auction concluded in March 2014, net of a
decrease in cash used for acquisitions and related investments. Capital expenditures (excluding spectrum
licences) increased year over year by $139 million in the first quarter of 2015, mainly due to our continued focus on
investing in wireless and wireline broadband infrastructure to enhance our network coverage, speed and capacity to
support growth in wireless and data services. These investments include the deployment of 700 MHz spectrum and
LTE network expansion, and readying the network and systems for the future retirement of legacy technologies.
•
Cash provided by financing activities was $1,727 million in the first quarter of 2015, primarily due to $1.75 billion
of debt issues in March 2015, as described above. This compares to cash used by financing activities of $55 million
in the first quarter of 2014.
In the first three months of 2015, we returned $400 million in cash to shareholders, consisting of $244 million in
dividends paid and $156 million in share purchases pursuant to our 2015 NCIB program. In comparison, during the
first quarter of 2014, we returned $381 million to shareholders, consisting of $222 million in dividends paid and
$159 million in share purchases. For additional details on our multi-year dividend growth and share purchase
programs, see Section 4.3 and Section 7.4.
•
Free cash flow was $271 million in the first quarter of 2015, a year-over-year decrease of $20 million. EBITDA
growth and lower income tax payments were more than offset by higher capital expenditures (excluding spectrum
licences), share-based compensation payments and interest paid.
14
2. Core business and strategy
Our discussion in this section is qualified in its entirety by the Caution regarding forward-looking statements at the
beginning of this MD&A.
Our core business was described in our annual 2014 MD&A. The following are business updates grouped under our
strategic imperatives.
Focusing relentlessly on growth markets of data, IP and wireless
External wireless revenues and wireline data revenues totalled $2.6 billion in the first three months of 2015, up by
$178 million or 7.4% from the same period in 2014, while wireline voice and other revenues and Other operating income
totalled $0.4 billion in the first quarter of 2015, down $45 million or 9.0% from the same period in 2014. Combined
wireless revenues and wireline data revenues represented 85% of TELUS’ consolidated revenues for the first three
months of 2015, as compared to 83% in the same period in 2014.
Providing integrated solutions that differentiate TELUS from our competitors
Continuing with our long-standing clear and simple approach to wireless pricing and putting our customers first, we
are no longer charging the incoming short messaging service (SMS) fee for customers roaming outside Canada. Our
customers can now receive unlimited incoming text messages free of charge and feel more comfortable using their
mobile phones while travelling abroad.
In March 2015, we carried out a national launch of TELUS Business Connect™, an integrated businesscommunications solution for small businesses. This cloud-based solution provides businesses with a full suite of
communications tools for both office and mobile use, including an automated attendant, call routing, teleconferencing
and video-conferencing and toll-free numbers, as well as a wireless back-up for office Internet access. Business Connect
allows users to use a single number across their mobile phone, tablet, desk phone and computers through voice over IP
(VoIP) technology.
Building national capabilities across data, IP, voice and wireless
In March 2015, we were a successful bidder on 15 wireless spectrum licences across the most populous Canadian
provinces in Industry Canada’s AWS-3 wireless spectrum auction. AWS-3 spectrum is a valuable addition to our
spectrum portfolio and is vital to handling the growing demand of streaming video and other data-intensive features of
the latest smartphones.
Partnering, acquiring and divesting to accelerate the implementation of our strategy and focus our
resources on core business
In the first quarter of 2015, we partnered with Jasper Technologies Inc., a California-based global Internet of Things
(IoT) platform leader to implement IoT self-serve solutions for our own IoT platform, the TELUS Control Centre. The
new platform aims to help Canadian businesses simplify the deployment and management of IoT services by offering
automated device provisioning, real-time diagnostics, integrated billing and cost-management features. The TELUS
Control Centre will help manage the entire life cycle of an IoT service, enabling companies to introduce new business
models, go to market faster and scale over time to meet market demand. It will be offered alongside our IoT
Marketplace, an online portal through which companies can browse IoT applications.
In February 2015, we partnered with Public Safety Canada to launch the #BeAppSafe campaign to inform,
educate and inspire action among Canadians to secure the personal information they store on the Internet and their
mobile devices. Through our work with Public Safety Canada and TELUS WISE (wise Internet and smartphone
education), we are committed to educating Canadians and their families about Internet and smartphone safety.
TELUS WISE is the first program of its kind in Canada. Since its inception in 2013, we have educated more than
500,000 Canadians on how to stay safe online.
In March 2015, we partnered with Alcatel-Lucent as a first customer for Enterprise Small Cell solution, the small
cell technology capable of extending LTE and Wi-Fi connectivity and coverage into offices and other densely
populated buildings. This technology will help relieve the congestion and offload traffic from the macro cell network to
deliver seamless connectivity and high performance to public and enterprise indoor environments.
Also in March 2015, we completed our acquisition of Medesync, a certified electronic medical records (EMR)
product, which will bring a bilingual web-based interface to our EMR portfolio in Quebec. Medesync uses the latest cloudbased and mobile technologies to bring access to EMRs to physicians from any computer or mobile device. Medesync’s
EMR technology features a number of tools for managing and accessing all aspects of a clinic’s operations, including
scheduling, prescribing, billing and electronic lab results.
15
Going to market as one team under a common brand, executing a single strategy
Our top corporate priority is putting customers first as we strive to consistently deliver exceptional client experiences and
become the most recommended company in the markets we serve. In April 2015, the Commissioner for Complaints for
Telecommunications Services (CCTS) issued its first mid-year report and, once again, TELUS received significantly
fewer customer complaints. At only 4.4% of the total complaints submitted to the CCTS, TELUS had the lowest number
of complaints when compared to other national wireless carriers in Canada. Complaints against TELUS decreased 46%
from mid-year 2014, continuing our trend of consistent improvement since 2011 and resulting in the CCTS removing
TELUS from the list of the five brands with the highest number of complaints. In addition, Koodo Mobile demonstrated a
26% reduction in customer complaints from mid-year 2014. At only 1.4%, Koodo Mobile leads Canada’s flanker brands
in the lowest number of complaints submitted to the CCTS.
3. Corporate priorities for 2015
Our corporate priorities for 2015 were listed in our annual 2014 MD&A.
4. Capabilities
Our discussion in this section is qualified in its entirety by the Caution regarding forward-looking statements at the
beginning of this MD&A.
4.1 Principal markets addressed and competition
For a full discussion of our principal markets and an overview of competition, please refer to Section 4.1 of our annual
2014 MD&A.
4.2 Operational resources
For a discussion of our Operational resources, please refer to Section 4.2 of our annual 2014 MD&A. The following
discussion reflects changes that occurred since then.
In the first quarter of 2015, we continued to deliver leading customer churn on a global basis. The first quarter of
2015 represents the seventh consecutive quarter that our monthly postpaid churn rate was below 1%. Blended churn of
1.28% in the first quarter of 2015 is among our lowest first quarter churn rates since we became a national carrier 15
years ago. This further exemplifies the success of our differentiated customers first culture and our ongoing focus on
delivering outstanding customer service, coupled with attractive new products and services.
Wireless segment
During the first quarter of 2015, we acquired 15 wireless licences in Industry Canada’s AWS-3 wireless spectrum
auction. These acquisitions increased our spectrum holdings by 16% by adding 20 MHz of spectrum in each of Quebec,
British Columbia, Alberta, Saskatchewan and Manitoba, as well as 10 MHz of spectrum in Southern Ontario. AWS-3
spectrum is well-suited for delivering both coverage and added capacity in urban and rural environments and we expect
to incorporate it into our existing network within the next three years. As well, in 2014, we acquired and commenced the
deployment of the 700 MHz wireless spectrum, which we have begun to operationalize for the benefit of our customers.
Over the past two spectrum auctions, we have increased our national spectrum holdings by more than 40% to support
our top corporate priority of putting customers first. Wireless data consumption has been increasing rapidly and we have
responded by investing to extend the capacity of our network to support the additional data consumption and growth in
our wireless customer base.
At March 31, 2015, our 4G LTE network covered 92% of Canada’s population, up from more than 81% of the
population covered at March 31, 2014. Outside of LTE coverage areas, the LTE devices we offer also operate on our
HSPA+ network, which covered 99% of Canada’s population at March 31, 2015.
Wireline segment
We continue to invest in urban and rural communities with commitments to deliver broadband network capabilities to as
many Canadians as possible. We are expanding our fibre footprint by connecting more homes and businesses directly to
fibre. We also increased broadband Internet speeds, expanded our IP TV video-on-demand library and high-definition
content and enhanced marketing of data products and bundles. As well, we have continued to invest in our state-of-the
art Internet data centres (IDCs), creating an advanced and regionally diverse computing infrastructure in Canada. At
March 31, 2015, our high-speed broadband coverage reached more than 2.8 million households in B.C., Alberta and
Eastern Quebec.
16
4.3 Liquidity and capital resources
Capital structure financial policies
Our objective when managing capital is to maintain a flexible capital structure that optimizes the cost and availability of
capital at acceptable risk.
In the management of capital and in its definition, we include Common Share equity (excluding Accumulated other
comprehensive income), Long-term debt (including long-term credit facilities, commercial paper backstopped by longterm credit facilities and any associated hedging assets or liabilities, net of amounts recognized in Accumulated other
comprehensive income), Cash and temporary investments, and securitized trade receivables.
We manage our capital structure and make adjustments to it in light of changes in economic conditions and the risk
characteristics of our telecommunications infrastructure. To maintain or adjust our capital structure, we may adjust the
amount of dividends paid to holders of Common Shares, purchase shares for cancellation pursuant to our normal course
issuer bids (NCIBs), issue new shares, issue new debt, issue new debt to replace existing debt with different
characteristics and/or increase or decrease the amount of trade receivables sold to an arm’s-length securitization trust.
We monitor capital utilizing a number of measures, including the net debt to EBITDA – excluding restructuring and
other like costs ratio and the dividend payout ratios. See definitions in Section 11.1.
Financing and capital structure management plans
Report on financing and capital structure management plans
Pay dividends to the holders of Common Shares under our multi-year dividend growth program
•
On May 6, 2015, a second quarter dividend of $0.42 per share was declared on our issued and outstanding common shares,
payable on July 2, 2015, to shareholders of record at the close of business on June 10, 2015. The second quarter dividend
for 2015 reflects an increase of $0.04 per share or 9.5% from the $0.38 per share dividend paid in July 2014 and an increase
of $0.02 per share or 5.0% from the $0.40 per share dividend declared in February 2015.
Purchase Common Shares under our multi-year NCIB
•
On September 23, 2014, we received approval from the Toronto Stock Exchange (TSX) for a new NCIB program (2015
NCIB) to purchase and cancel up to 16 million of our Common Shares with a value of up to $500 million over a 12-month
period, commencing October 1, 2014. Such purchases are made through the facilities of the TSX, the New York Stock
Exchange (NYSE) and alternative trading platforms or otherwise as may be permitted by applicable securities laws and
regulations. This represents up to 2.6% of the Common Shares outstanding at the date of the 2015 NCIB notice to the TSX.
The Common Shares will be purchased only when and if we consider it advisable. As of April 30, 2015, we have purchased
approximately 7.1 million Common Shares for cancellation for $292 million under this NCIB, at an average price of $40.86 per
share.
•
We have also entered into an automatic share purchase plan (ASPP) with a broker for the purpose of permitting us to
purchase our Common Shares under our NCIB program at times when we would not be permitted to trade in our shares,
including regularly scheduled quarterly blackout periods. Such purchases will be determined by the broker in its sole
discretion based on parameters that we established prior to any blackout period, in accordance with TSX rules and applicable
securities laws. The ASPP has been approved by the TSX, was implemented on October 1, 2014 and may be implemented
from time to time thereafter. During the month ended April 30, 2015, 0.5 million of our Common Shares were purchased by
way of the ASPP at a cost of $21 million. All other purchases under the 2015 NCIB will be at the discretion of the Company.
•
There can be no assurance that we will complete our 2015 NCIB or renew the NCIB program for 2016. See Caution
regarding forward-looking statements – Ability to sustain and complete multi-year share purchase program through 2016.
Use proceeds from securitized trade receivables (Short-term borrowings), bank facilities, commercial paper and cash
retained through dividend reinvestment, as needed, to supplement free cash flow and meet other cash requirements
•
We increased our commercial paper issued and outstanding to $519 million at March 31, 2015 from $130 million at
December 31, 2014.
•
Proceeds from securitized trade receivables were $100 million at March 31, 2015 (March 31 and December 31, 2014 –
$100 million).
Maintain compliance with financial objectives
We comply with all objectives:
•
Maintain investment grade credit ratings in the range of BBB+ or the equivalent – On May 7, 2015, investment grade credit
ratings from the four rating agencies that cover TELUS were in the desired range.
•
Net debt to EBITDA — excluding restructuring and other like costs ratio of 2.00 to 2.50 times – We have revised our
objective for this measure to 2.00 to 2.50 times from 1.50 to 2.00 times. At March 31, 2015, this ratio was inside this revised
range. See Section 7.5 Liquidity and capital resource measures.
•
Dividend payout ratio of 65 to 75% of sustainable net earnings on a prospective basis – See Section 7.5 Liquidity and capital
resource measures.
•
Generally maintain a minimum $1 billion in unutilized liquidity – See Section 7.6 Credit facilities.
17
4.4 Changes in internal control over financial reporting
There were no changes in internal control over financial reporting that have materially affected, or are reasonably likely to
materially affect, our internal control over financial reporting.
5. Discussion of operations
Our discussion in this section is qualified in its entirety by the Caution regarding forward-looking statements at the
beginning of this MD&A.
5.1 General
Our operating segments and reportable segments are wireless and wireline. Segmented information in Note 5 of the
interim consolidated financial statements is regularly reported to our Chief Executive Officer (CEO) (the chief operating
decision-maker).
5.2 Summary of consolidated quarterly results and trends
Summary of quarterly results
($ millions, except per share amounts)
2015 Q1
2014 Q4
2014 Q3
2014 Q2
2014 Q1
2013 Q4
2013 Q3
2013 Q2
Operating revenues
3,028
3,128
3,028
2,951
2,895
2,948
2,874
2,826
Operating expenses
Goods and services purchased
Employee benefits expense
Depreciation and amortization
1,284
609
456
1,476
651
468
1,333
630
459
1,268
610
444
1,222
596
463
1,349
648
461
1,237
602
445
1,222
606
446
Total operating expenses
2,349
2,595
2,422
2,322
2,281
2,458
2,284
2,274
Operating income
Financing costs
679
117
533
115
606
124
629
115
614
102
490
110
590
109
552
132
Income before income taxes
Income taxes
562
147
418
106
482
127
514
133
512
135
380
90
481
125
420
134
Net income and Net income
attributable to Common Shares
415
312
355
381
377
290
356
286
Net income per Common Share:
Basic (Basic EPS)
Diluted
0.68
0.68
0.51
0.51
0.58
0.58
0.62
0.62
0.61
0.60
0.47
0.46
0.56
0.56
0.44
0.44
Dividends declared per
Common Share
0.40
0.40
0.38
0.38
0.36
0.36
0.34
0.34
1,135
1,001
1,065
1,073
1,077
951
1,035
998
17
26
30
11
8
33
15
39
1,152
718
271
1,027
917
337
1,095
1,037
219
1,084
855
210
1,085
598
291
984
726
136
1,050
1,084
365
1,037
707
192
Additional information:
EBITDA1
Restructuring and other like costs
included in EBITDA1
EBITDA — excluding restructuring and
other like costs1
Cash provided by operating activities
Free cash flow1
1.
See Section 11.1 Non-GAAP and other financial measures.
Trends
The consolidated revenue trend continues to reflect year-over-year increases in: (i) wireless network revenues generated
from a growing subscriber base and higher average revenue per subscriber unit (ARPU) driven by an increased
proportion of higher-rate two-year plans, growth in data usage, a more favourable postpaid subscriber mix and increased
data roaming, partly offset by a decline in voice revenue; (ii) wireless equipment revenue that has generally increased
due to sales of higher-value smartphones and retention volumes; and (iii) growth in wireline data revenues, driven by
Internet, enhanced data services, TELUS TV, business process outsourcing and TELUS Health services. This growth
exceeded the continued declines in wireless voice revenues and wireline voice and other revenues.
18
Increasing wireless network revenues reflect growth from subscriber additions, an increased proportion of higherrate two-year plans, growth in data usage and higher data roaming revenues, partly offset by declines in voice revenue.
Data revenue growth reflects increased data consumption driven by the higher adoption of smartphones, tablets and
other wireless devices, as well as greater use of applications and other wireless data, and the expansion of our LTE
network. Consequently, monthly blended ARPU has increased year over year for 18 consecutive quarters. The data
revenue growth trend is impacted by competitive pressures driving larger allotments of data provided in rate plans,
including data sharing, unlimited messaging rate plans and off-loading of data traffic to increasingly available Wi-Fi
hotspots. We introduced two-year wireless rate plans in July 2013, which have impacted acquisition and retention trends,
as well as data usage, as subscribers optimize unlimited talk and text and shared data plans, and which we expect will
increase the frequency of subscribers updating their devices and services. ARPU is expected to continue to increase
over time as our customer base renews to the two-year plans that recover device subsidies in two years instead of three
years, and as data usage continues to grow. However, the outcome is highly dependent on competition and consumer
behaviour, government decisions, device selection and other factors. Additionally, the implementation of the CRTC
national Wireless Code continues to cause operational challenges due to two-year and three-year customer contracts
that will end coterminously beginning in June 2015.
Historically, there has been significant third and fourth quarter seasonality with respect to higher wireless subscriber
additions, an increase in related acquisition costs and equipment sales, and higher retention costs due to contract
renewals. Typically, these impacts can also be more pronounced around iconic device launches. Wireless EBITDA
usually decreases sequentially from the third to the fourth quarter, due to continued competitive intensity and seasonal
loading volumes. Subscriber additions have typically been lowest in the first quarter. Historically, monthly wireless ARPU
has experienced seasonal sequential increases in the second and third quarters, reflecting higher levels of usage and
roaming in spring and summer, followed by seasonal sequential declines in the fourth and first quarters. This seasonal
effect on ARPU is expected to diminish in the future, as unlimited nationwide voice plans become prevalent and
chargeable usage and long distance spikes become less pronounced.
The trend of increasing wireline data revenue reflects growth in high-speed Internet and enhanced data services,
including increases in usage and adoption of higher-speed services, the continuing but moderating expansion of the
TELUS TV subscriber base (up 11% in the 12-month period ended March 31, 2015), growth in business process
outsourcing, growth in TELUS Health solutions and certain rate increases. Higher Internet service revenues are due to a
larger high-speed Internet subscriber base (up 5.8% in the 12-month period ended March 31, 2015), bundling of offers
with Optik TV and certain rate increases. A general trend of declining wireline voice revenues and network access lines
(NALs) is due to competition from voice over IP (VoIP) service providers (including cable-TV competitors), resellers and
facilities-based competitors, as well as technological substitution to wireless and IP-based services and applications.
Business NAL losses have been moderating, in part due to large customer installations, and investments in service and
customer offerings in the small and medium-sized business (SMB) markets.
The trend in Goods and services purchased expense reflects increasing wireless equipment expenses associated
with a higher-value smartphones in the sales mix and higher retention volumes, and increasing content costs due to a
growing wireline TELUS TV subscriber base, partly offset by lower wireless network operating expenses from operational
efficiency initiatives.
The trend in Employee benefits expense reflects increases in compensation, partly offset by a decrease in wireless
full-time equivalent (FTE) employees and higher capitalized labour costs associated with increased capital expenditures,
as described in Section 7.3. Employee benefits expense includes employee-related restructuring costs, which tend to
fluctuate from quarter to quarter.
The general trend in depreciation and amortization is flat, as underlying increases related to growth in capital assets
from acquisitions, the expansion of our broadband footprint and enhanced LTE network coverage are offset by
adjustments related to our continuing program of asset life studies. The sequential decrease in the first quarter of 2015
includes effects of asset life revisions in 2014, as disclosed in Note 1(j) in our 2014 Consolidated financial statements,
net of growth in capital assets.
The general trend in financing costs reflects an increase in long-term debt outstanding associated with significant
investments in wireless spectrum licences acquired in Industry Canada auctions in 2014 and 2015. Financing costs
include long-term debt prepayment premiums of approximately $13 million in the third quarter of 2014 and $23 million in
the second quarter of 2013. Employee defined benefit net interest expense has increased for 2015, primarily due to the
increase in the defined benefit plan deficit at December 31, 2014, as compared to the defined benefit plan surplus at
December 31, 2013. Employee defined benefit plan net interest had decreased in 2014, relative to 2013, due to a
decrease in the discount rate for the employee defined benefit pension plans and their associated deficit at the end of
2012 moving to a nominal surplus at the end of 2013. Financing costs for the eight periods shown include varying
amounts of foreign exchange gains or losses and varying amounts of interest income.
19
The trend in net income reflects the items noted above, as well as adjustments arising from legislated income tax
changes and adjustments recognized in the current period for income tax of prior periods, including any related after-tax
interest on reassessments. The trend in basic earnings per share (basic EPS) also reflects the impact of share
purchases under our NCIB program.
The trend in cash provided by operating activities reflects growth in consolidated EBITDA and lower income tax
payments in 2015, net of higher interest expenses related to our financing activities. The trend in free cash flow reflects
the factors in cash provided by operating activities, as well as increases in capital expenditures (excluding spectrum
licences), but excludes the effects of certain changes in working capital, such as trade accounts receivable and trade
accounts payable. Our expenditures on spectrum licences are expected to continue in the second quarter of 2015, due
to remittance of the $1.2 billion final payment for the AWS-3 licences in April 2015 and our participation in the 2500 MHz
spectrum auction that is expected to conclude in May.
5.3 Consolidated operations
The following is a discussion of our consolidated financial performance. Segmented information in Note 5 of the interim
consolidated financial statements is regularly reported to our CEO (the chief operating decision-maker). We discuss the
performance of our segments in Section 5.4 Wireless segment, Section 5.5 Wireline segment and capital expenditures in
Section 7.3 Cash used by investing activities.
Operating revenues
Three-month periods ended March 31 ($ millions)
2015
2014
Change
Service
Equipment
2,829
182
2,702
172
4.7 %
5.8 %
Revenues arising from contracts with customers
Other operating income
3,011
17
2,874
21
4.8 %
(19.0)%
3,028
2,895
4.6 %
Consolidated Operating revenues increased by $133 million or 4.6% in the first quarter of 2015 when compared to the
first quarter of 2014, as follows:
•
Service revenue increased year over year by $127 million or 4.7% in the first quarter of 2015. The increase reflects
growth in the wireless subscriber base; higher wireless data usage from continued adoption of smartphones and
other data-centric wireless devices; an increased proportion of higher-rate two-year plans in the wireless network
revenue mix; higher wireline Internet, enhanced data and TELUS TV services revenues due to subscriber growth;
and increased wireline business process outsourcing and TELUS Health services revenues; all of which were partly
offset by continuing declines in wireless and wireline voice revenues.
•
Equipment revenue increased year over year by $10 million or 5.8% in the first quarter of 2015. The increase in
wireless equipment revenues was $28 million, reflecting higher retention volumes and higher-value smartphones in
the sales mix, partly offset by lower gross additions. Wireline data and voice equipment revenues decreased by
$18 million due to declines in business spending and government fiscal year-end spending.
•
Other operating income decreased year over year by $4 million or 19% in the first quarter of 2015 due to a
reduction in recoveries of employee costs under eligible government-sponsored programs and a decrease in
amounts recognized from the regulatory price cap deferral account for provisioning broadband Internet services to
eligible rural and remote communities.
Operating expenses
Three-month periods ended March 31 ($ millions)
2015
2014
Change
Goods and services purchased
Employee benefits expense
Depreciation
Amortization of intangible assets
1,284
609
347
109
1,222
596
346
117
5.1 %
2.2 %
0.3 %
(6.8)%
2,349
2,281
3.0 %
Consolidated Operating expenses increased by $68 million or 3.0% in the first quarter of 2015, as compared to the first
quarter of 2014, as follows:
•
Goods and services purchased increased year over year by $62 million or 5.1% in the first quarter of 2015. This
reflects an increase in wireless subscriber retention costs to 12.1% of wireless network revenue (compared with
10.7% in the first quarter of 2014), as well as an increase in wireless customer service and distribution channel
expenses, higher TELUS TV content costs and higher non-labour restructuring and other like costs, net of a
20
decrease in wireless network operating costs and lower wireline equipment cost of sales associated with lower
equipment revenues.
•
Employee benefits expense increased year over year by $13 million or 2.2% in the first quarter of 2015, mainly due
to $16 million higher wages and salaries, a $6 million increase in employee defined benefit pension plan expenses
and a $4 million increase in share-based compensation expenses, partly offset by an $11 million increase in
capitalized labour costs. The increase in wages and salaries includes higher costs to support increased business
process outsourcing revenue, net of a decrease in the number of wireless full-time equivalent employees (FTEs)
from our ongoing operational efficiency initiatives, including the integration of Public Mobile.
•
Depreciation increased year over year by $1 million in the first quarter of 2015 as growth in capital assets (such as
broadband and TELUS TV-related assets and the wireless LTE network) was offset by the impact of our continuing
program of asset life studies.
•
Amortization of intangible assets decreased year over year by $8 million or 6.8% in the first quarter of 2015. The
decrease reflects $20 million of software asset life adjustments arising from our continuing program of asset life
studies and fully amortized intangible assets, partly offset by an increase of $12 million from growth in the intangible
asset base.
Operating income
Three-month periods ended March 31 ($ millions)
2015
2014
Change
679
614
10.6 %
Operating income increased by $65 million or 11% in the first quarter of 2015 when compared to the same period in
2014. This was composed of a $54 million increase in wireless EBITDA, a $4 million increase in wireline EBITDA and the
$7 million decrease in total depreciation and amortization expenses.
Financing costs
Three-month periods ended March 31 ($ millions)
Interest expenses
Employee defined benefit plans net interest
Foreign exchange (gains) losses and interest (income)
2015
2014
Change
117
7
(7)
102
1
(1)
14.7 %
n/m
n/m
117
102
14.7 %
Financing costs increased by $15 million or 15% in the first quarter of 2015 when compared to the same period in 2014,
due to the following factors:
•
Interest expenses increased year over year by $15 million or 15% in the first quarter of 2015, primarily due to the
increase in average long-term debt balances outstanding, partly offset by a reduction in the effective interest rate.
•
Employee defined benefit plans net interest is calculated for each year based on the net defined benefit surplus
(deficit) at December 31 of the respective previous year. Employee defined benefit net interest expense increased
by $6 million year over year in the first quarter of 2015, primarily due to the increase in the defined benefit plan deficit
at December 31, 2014, as compared to the defined benefit plan surplus at December 31, 2013.
•
Foreign exchange (gains) losses and interest (income) fluctuate from period to period. Foreign exchange gains
were $7 million in the first quarter of 2015, resulting from operational hedges for the U.S. dollar. Foreign exchange
gains were $NIL in the first quarter of 2014. Interest income was $NIL in the first quarter of 2015 and $1 million in the
first quarter of 2014.
As a result of financing activities over the past 12 months, our weighted average interest rate on long-term debt
(excluding commercial paper) was 4.42% at March 31, 2015, as compared to 4.89% one year earlier. For details on our
first quarter 2015 financing activities, see Long-term debt issues and repayments in Section 7.4.
Income taxes
Three-month periods ended March 31 ($ millions, except tax rates)
Basic blended income tax expense at weighted average statutory income tax rates
Other
2015
2014
Change
148
(1)
134
1
10.4 %
n/m
Income taxes
147
135
8.9 %
Blended weighted average federal, provincial and non-Canadian statutory tax rate (%)
Effective tax rate (%)
26.3
26.2
26.2
26.3
0.1 pts.
(0.1)pts.
Total income tax expense increased by $12 million or 8.9% in the first quarter of 2015 when compared to the same
period in 2014, resulting primarily from the increase in income before income taxes.
21
Comprehensive income
Three-month periods ended March 31 ($ millions)
2015
2014
Change
Net income
Other comprehensive income (loss) (net of income taxes):
Items that may be subsequently reclassified to income
Item never subsequently reclassified to income –
Employee defined benefit plans re-measurements
415
377
10.1 %
3
6
(50.0)%
237
162
46.3 %
Comprehensive income
655
545
20.2 %
Comprehensive income increased by $110 million or 20% in the first quarter of 2015 when compared to the same period
in 2014, primarily due to increases in employee defined benefit plan re-measurements and net income. Items that may
be subsequently reclassified to income are composed of changes in the unrealized fair value of derivatives designated
as cash flow hedges, foreign currency translation adjustments arising from translating financial statements of foreign
operations, and changes in the unrealized fair value of available-for-sale investments.
5.4 Wireless segment
Wireless operating indicators
At March 31
2015
20141
Subscribers (000s):
Postpaid
Prepaid
7,145
1,144
6,799
1,240
5.1 %
(7.7)%
8,289
8,039
3.1 %
Postpaid proportion of subscriber base (%)
HSPA+ population coverage2 (millions)
LTE population coverage2 (millions)
86.2
35.6
33.1
84.6
34.9
28.8
1.6 pts.
2.0 %
14.9 %
Periods ended March 31
2015
2014
223
104
234
138
(4.7)%
(24.6)%
327
372
(12.1)%
37
(29)
48
(38)
(22.9)%
23.7 %
Total
Subscriber gross additions (000s):
Postpaid
Prepaid
Total
Subscriber net additions (000s):
Postpaid
Prepaid
Total
Blended ARPU, per month3 ($)
Change
Change
8
10
(20.0)%
62.34
60.42
3.2 %
1.28
0.91
392
12.1
485
1.50
0.99
346
10.7
446
(0.22) pts.
(0.08) pts.
13.3 %
1.4 pts.
8.7 %
3
Churn, per month (%)
Blended
Postpaid
COA4 per gross subscriber addition3 ($)
Retention spend to network revenue3 (%)
Retention volume3 (000s)
1. Effective January 1, 2014, prepaid subscribers, total subscribers and associated operating statistics (gross additions, net additions, blended
ARPU, blended churn and COA per gross subscriber addition) have been adjusted for inclusion of 222,000 Public Mobile subscribers in the
opening subscriber balances, and subsequent Public Mobile subscriber changes.
2. Including network access agreements with other Canadian carriers.
3. See Section 11.2 Wireless operating indicators. These are industry measures useful in assessing operating performance of a wireless
company, but are not measures defined under IFRS-IASB.
4. Cost of acquisition.
Operating revenues – Wireless segment
Three-month periods ended March 31 ($ in millions, except ratios)
2015
2014
Change
Network revenues
Equipment and other
1,535
137
1,443
112
6.4 %
22.3 %
External operating revenues
Intersegment network revenue
1,672
14
1,555
13
7.5 %
7.7 %
Total operating revenues
1,686
1,568
7.5 %
53
48
5 pts.
Data revenue to network revenues (%)
Total wireless operating revenues increased by $118 million or 7.5% in the first quarter of 2015 when compared to the
same period in 2014. The increase reflects growth in both network and equipment revenues.
22
Network revenues from external customers increased year over year by $92 million or 6.4% in the first quarter of
2015. Data network revenue increased year over year by 19% in the first quarter of 2015, reflecting growth in the
subscriber base, an increased proportion of higher-rate two-year plans in the revenue mix, higher data usage from
continued adoption of smartphones and other data-centric wireless devices, increased data roaming and the expansion
of our LTE network coverage. Voice network revenue decreased year over year by 5.3% in the first quarter of 2015 due
to the increased adoption of unlimited nationwide voice plans and continued but moderating substitution to data services.
•
Monthly blended ARPU was $62.34 in the first quarter of 2015, reflecting an increase of $1.92 or 3.2% from the first
quarter of 2014. The increase was due to the effects of higher-rate two-year plans, growth in data usage, a more
favourable postpaid subscriber mix and increased data roaming revenues, partly offset by declines in voice revenue
due to the increased adoption of unlimited nationwide voice plans.
•
Gross subscriber additions were 327,000 in the first quarter of 2015, reflecting a decrease of 45,000 from the first
quarter of 2014. Postpaid gross additions were 223,000 in the first quarter of 2015, down 11,000 from the first
quarter of 2014 due to slower market growth and industry-wide efforts to focus on retaining subscribers, which leads
to fewer customers switching carriers, partly offset by higher tablet loading. Prepaid gross additions were 104,000 in
the first quarter of 2015, reflecting a decrease of 34,000 from the comparable period in 2014, primarily due to higher
Public Mobile gross additions in the first quarter of 2014.
•
Net subscriber additions were 8,000 in the first quarter of 2015, reflecting a decrease of 2,000 from the same
period in 2014 due to lower gross subscriber additions, partly offset by a reduction in our postpaid churn rate.
Postpaid net additions were 37,000 in the first quarter of 2015, down 11,000 from the first quarter of 2014 due to
factors described above in gross subscriber additions, partly offset by a reduction in our postpaid churn rate to
0.91%. Prepaid subscribers decreased by 29,000 in the first quarter of 2015, as compared to a decrease of 38,000
in the same period of 2014. Prepaid losses reflect conversions to postpaid services, market saturation with respect
to prepaid services and continued competitive intensity in the lower end of the market typically served by prepaid
plans.
•
Our average monthly postpaid subscriber churn rate was 0.91% in the first quarter of 2015, as compared to
0.99% in the first quarter of 2014. Our blended monthly subscriber churn rate was 1.28% in the first quarter of 2015,
as compared to 1.50% in the same period of 2014. The improvement in churn rates was due to our continued focus
on our customers first initiatives and clear and simple approach, which differentiates TELUS in an intensely
competitive market, as well as due to early renewals and upgrades resulting from retention efforts. The improvement
in the blended churn rate also reflects a greater proportion of postpaid clients in our subscriber base.
Equipment and other revenues increased year over year by $25 million or 22% in the first quarter of 2015, mainly
due to higher retention volumes and higher-value smartphones in the sales mix, partly offset by lower gross additions.
Intersegment revenue in the wireless segment represents network services provided to the wireline segment. Such
revenues are eliminated upon consolidation along with the associated expenses.
Operating expenses – Wireless segment
Three-month periods ended March 31 ($ in millions)
2015
2014
Change
Goods and services purchased:
Equipment sales expenses
Network operating expenses
Marketing expenses
Other 1
348
184
90
158
294
193
83
139
18.4 %
(4.7)%
8.4 %
13.7 %
Employee benefits expense1
162
169
(4.1)%
Total operating expenses
942
878
7.3 %
1.
Includes restructuring and other like costs. See Section 11.1 Non-GAAP and other financial measures.
Wireless segment expenses increased by $64 million or 7.3% in the first quarter of 2015 when compared to the same
period in 2014.
Equipment sales expenses increased year over year by $54 million or 18% in the first quarter of 2015, reflecting
increased retention volumes and higher-value smartphones in the sales mix, partly offset by lower gross additions.
•
Retention costs as a percentage of network revenue were 12.1% in the first quarter of 2015, as compared to
10.7% in the first quarter of 2014. The increase was driven by greater retention volumes, including early renewals
and upgrades, and associated commissions, as well as higher per-unit subsidy costs due to increased competitive
intensity and a continued preference for higher-value smartphone devices.
23
•
COA per gross subscriber addition was $392 in the first quarter of 2015, an increase of $46 from the comparable
period in 2014, mainly due to an increase in per-unit subsidy costs reflecting increased competitive intensity, a
greater proportion of higher-value smartphones in the sales mix and higher commissions.
Network operating expenses decreased year over year by $9 million or 4.7% in the first quarter of 2015, due to
lower network maintenance and support costs resulting from the turn down of the Public Mobile CDMA network in the
third quarter of 2014, as well as lower data content share fees, partly offset by higher roaming costs driven by volumes.
Marketing expenses increased year over year by $7 million or 8.4% in the first quarter of 2015, primarily due to
higher commissions expenses driven by higher retention volumes, as well as an increase in advertising and promotions
expenses.
Other goods and services purchased increased year over year by $19 million or 14% in the first quarter of 2015,
reflecting higher bad debt provisions to support the growing subscriber base, the expansion of our distribution channels,
higher non-labour restructuring and other like costs, as well as increases in external labour and administrative costs.
Employee benefits expense decreased year over year by $7 million or 4.1% in the first quarter of 2015, reflecting a
$3 million decrease in wages and salaries and a $4 million increase in capitalized labour costs. The decrease in salaries
and wages primarily reflects a reduction in the number of FTEs from our ongoing operational efficiency initiatives,
including the integration of Public Mobile.
EBITDA – Wireless segment
Three-month periods ended March 31 ($ millions, except margins)
2015
2014
Change
EBITDA
Restructuring and other like costs included in EBITDA
744
6
690
3
7.8 %
100.0 %
EBITDA – excluding restructuring and other like costs
750
693
8.0 %
EBITDA margin (%)
EBITDA margin – excluding restructuring and other like costs (%)
44.1
44.5
44.0
44.2
0.1 pts.
0.3 pts.
Wireless EBITDA increased by $54 million or 7.8% in the first quarter of 2015 when compared to the same period in
2014. Wireless EBITDA – excluding restructuring and other like costs increased year over year by $57 million or 8.0%.
The increase in EBITDA reflects network revenue growth driven by a larger customer base and higher ARPU, as well as
ongoing operational efficiency initiatives including the integration of Public Mobile, partly offset by higher retention spend
and increased customer service and distribution channel expenses.
5.5 Wireline segment
Wireline operating indicators
At March 31 (000s)
2015
2014
Change
High-speed Internet subscribers
TELUS TV subscribers
1,498
937
1,416
842
5.8 %
11.3 %
Network access lines (NALs):
Residential
Business
1,536
1,608
1,619
1,611
(5.1)%
(0.2)%
3,144
3,230
(2.7)%
Total wireline subscriber connections
5,579
5,488
1.7 %
Three-month periods ended March 31 (000s)
2015
2014
Change
High-speed Internet subscriber net additions
23
21
9.5 %
TELUS TV subscriber net additions
Net NAL gains (losses):
Residential
Business
21
27
(22.2)%
(20)
(5)
(24)
—
16.7 %
n/m
(25)
(24)
(4.2)%
19
24
(20.8)%
Total NALs
Total NAL losses
Total wireline subscriber
connections net additions
24
Operating revenues – Wireline segment
Three-month periods ended March 31 ($ in millions)
2015
2014
Change
903
382
56
842
413
67
7.2 %
(7.5)%
(16.4)%
Revenues arising from contracts with customers
Other operating income
1,341
15
1,322
18
1.4 %
(16.7)%
External operating revenues
Intersegment revenue
1,356
43
1,340
41
1.2 %
4.9 %
Total operating revenues
1,399
1,381
1.3 %
Data service and equipment
Voice service
Other services and equipment
Total wireline operating revenues increased by $18 million or 1.3% in the first quarter of 2015 when compared to the
same period in 2014. The increase reflects continued growth in data revenue resulting from a larger subscriber base,
partly offset by ongoing declines in legacy voice and equipment revenues, as well as continued competitive pressures
from over-the-top (OTT) services and in the business sector.
Revenues arising from contracts with customers increased year over year by $19 million or 1.4% in the first quarter
of 2015.
•
Data service and equipment revenues increased year over year by $61 million or 7.2%, primarily due to:
(i) increased Internet and enhanced data service revenues resulting from an 5.8% increase in high-speed Internet
subscribers over 12 months, customer upgrades to faster Internet speeds and larger-usage rate plans, subscribers
coming off of promotional offers and higher revenue per customer from upgrades to faster high-speed Internet plans
and certain rate increases; (ii) increased TELUS TV revenues resulting from an 11% subscriber growth over 12
months; (iii) growth in business process outsourcing revenues; and (iv) increased TELUS Health revenues. These
increases were partly offset by declines in video-conferencing revenues and data equipment sales, largely reflecting
lower business spending and government fiscal year-end spending.
•
Voice service revenues decreased year over year by $31 million or 7.5% in the first quarter of 2015. The decrease
reflects the ongoing decline in legacy revenues from technological substitution, increased competition, greater use of
inclusive long distance plans and lower long distance minutes of use. We experienced a 2.7% decline in NALs in the
12-month period ended March 31, 2015.
•
Wireline subscriber connections net additions were 19,000 in the first quarter of 2015, down from 24,000 from
the comparable period in 2014.
•
•
Net additions of high-speed Internet subscribers were 23,000 in the first quarter of 2015, up 2,000 from the first
quarter of 2014, as a result of the expansion of our high-speed broadband footprint in urban and rural
communities. The net additions also reflect the pull-through impact from the continued adoption of Optik TV and
improvements in our customer churn rate. Net additions of TELUS TV subscribers were 21,000 in the first
quarter of 2015, down 6,000 from the same period in 2014, as expansion of our addressable high-speed
broadband footprint, increasing broadband speeds and improvements in our customer churn rate were offset by
business additions in the first quarter of 2014, the effects of slower subscriber growth for paid TV services and
increasing competition from OTT services. Continued focus on expanding our addressable Optik TV and highspeed Internet footprint, connecting more homes and business directly to fibre, and bundling these services
together, resulted in combined Internet and TV subscriber growth of 177,000 or 7.8% over the last 12 months.
•
Residential NAL losses of 20,000 in the first quarter 2015 improved from 24,000 NAL losses in the first quarter
of 2014 due to our continuing customers first initiatives and service bundle offers. The residential NAL losses
continue to reflect the ongoing, but moderating, trend of substitution to wireless and Internet-based services,
including losses to competitors, partially mitigated by the success of Optik TV and bundled service offerings.
•
Business NAL losses were 5,000 in the first quarter of 2015 as compared to no losses experienced in the first
quarter of 2014. This continues to reflect increased competition in the business sector, while in the first quarter of
2014, we benefited from implementation of new lines for large customers. NAL losses also reflect conversion of
voice lines to more efficient IP services.
Other services and equipment decreased year over year by $11 million or 16% in the first quarter of 2015,
reflecting the elimination of charges for paper bills and declines in voice equipment sales.
Other operating income decreased year over year by $3 million or 17% in the first quarter of 2015 as a result of a
reduction in recoveries of employee costs under eligible government-sponsored programs and a decrease in amounts
recognized from the regulatory price cap deferral account for provisioning broadband Internet services to eligible rural
and remote communities.
25
Intersegment revenue represents services provided to the wireless segment. Such revenue is eliminated upon
consolidation along with the associated expenses.
Operating expenses – Wireline segment
Three-month periods ended March 31 ($ millions)
Goods and services purchased1
Employee benefits expense1
Total operating expenses
1.
2015
2014
Change
561
447
567
427
(1.1)%
4.7 %
1,008
994
1.4 %
Includes restructuring and other like costs. See Section 11.1 Non-GAAP and other financial measures
Total wireline operating expenses increased by $14 million or 1.4% in the first quarter of 2015 when compared to the
same period in 2014, due to the following factors:
•
Goods and services purchased decreased year over year by $6 million or 1.1% in the first quarter of 2015. This
reflects a decrease in equipment cost of sales associated with lower equipment revenues, as well as reduced
advertising and promotions costs, partly offset by costs associated with growth in our subscriber base, including
higher TV content costs and higher external labour requirements, and higher non-labour restructuring and other like
costs.
•
Employee benefits expense increased year over year by $20 million or 4.7% in the first quarter of 2015, primarily
due to a $19 million increase in wages and salaries, as well as increases in employee defined benefit pension plan
and share-based compensation expenses, partly offset by a $7 million increase in capitalized labour costs. The
increase in salaries and wages includes higher costs to support increased business process outsourcing revenue.
EBITDA – Wireline segment
Three-month periods ended March 31 ($ millions, except margins)
EBITDA
Restructuring and other like costs included in EBITDA
2015
2014
Change
391
11
387
5
1.3 %
120.0 %
EBITDA – excluding restructuring and other like costs
402
392
2.8 %
EBITDA margin (%)
EBITDA – excluding restructuring and other like costs margin (%)
28.0
28.8
28.0
28.3
— pts.
0.5 pts.
Wireline EBITDA increased year over year by $4 million or 1.3% in the first quarter of 2015. EBITDA and EBITDA margin
reflect similar rates of increase in revenues and in operating expenses including restructuring and other like costs.
EBITDA – excluding restructuring and other like costs increased by 2.8%, as compared to a revenue increase of 1.3%,
reflecting improving margins in data services, including Internet, TELUS TV, TELUS Health and business process
outsourcing services, as well as execution on cost efficiency programs.
26
6. Changes in financial position
Financial position at:
($ millions)
Mar. 31
2015
Dec. 31
2014
Change
Current assets
Cash and temporary
investments, net
1,579
60
1,519
Accounts receivable
1,388
1,483
(95)
Change includes:
n/m %
See Section 7 Liquidity and capital resources
(6)% An increase in operating revenues offset by a decrease in
days outstanding in wireless and wireline receivables
Income and other taxes
receivable
Inventories
19
97
(78)
(80)%
315
320
(5)
(2)%
Prepaid expenses
334
199
135
Real estate joint venture
advances
Derivative assets
127
—
127
22
27
(5)
100
1,934
100
2,019
—
(85)
27
2
25
Dividends payable
243
244
(1)
Advance billings and
customer deposits
Provisions
743
753
(10)
115
126
(11)
Current maturities of longterm debt
644
255
389
n/m %
An increase in commercial paper for general corporate
purposes
Working capital
(22)
(1,313)
1,291
n/m %
Working capital increased due to an increase in Cash and
temporary investments, an increase in Prepaid expenses;
amounts from real estate joint venture advances
reclassified to current assets, and a decrease in Accounts
payable and accrued liabilities.
Working capital decreased due to a decrease in accounts
receivable, a decrease in net income and other taxes
receivable/payable, and an increase in Current maturities
of long-term debt
Current liabilities
Short-term borrowings
Accounts payable and
accrued liabilities
Income and other taxes
payable
(Current assets subtracting
Current liabilities)
Reflects movement of a receivable to income and other
taxes payable
A decrease in the number of wireless handsets and
accessories, partly offset by an increase in the average unit
costs resulting from a higher-value mix of smartphones
68 % Prepayment of statutory employee benefits, annual
wireless licence fees and maintenance contracts net of
amortization
n/m % Amounts reclassified from Non-current assets
(19)% Decrease due to maturation of restricted share units
partially offset by increase in U.S. currency hedging items
— % See Section 7.7 Sale of trade receivables
(4)% Decrease in payroll and other employee-related liabilities
and restricted stock unit liability, partly offset by increased
accrued liabilities for the NCIB automatic share purchase
plan (ASPP), timing of accounts payable payments and
interest payable
n/m % Current income tax expense in 2015, offset by the last
instalment payment of 2014 income taxes and payments of
2015 tax instalments
n/m % A reduction in shares outstanding as a result of our NCIB
program
(1)%
Decrease arising from a lower number of wireless handsets
shipped to external distribution channels
(9)% Primarily employee-related restructuring disbursements in
excess of associated expenses partly offset by other
restructuring expenses in excess of disbursements
27
Financial position at:
($ millions)
Mar. 31
2015
Dec. 31
2014
Change
Change includes:
Non-current assets
Property, plant and
equipment, net
9,282
9,123
159
Intangible assets, net
7,818
7,797
21
302
—
302
3,761
3,757
4
—
120
(120)
Real estate joint ventures
Other long-term assets
22
312
21
213
1
99
5 % See Transactions between related parties in Section 7.11
46 % An increase in pension and post-retirement assets resulting
from returns on plan assets
Non-current liabilities
Provisions
351
342
9
10,795
9,055
1,740
707
931
(224)
3 % A portion of other restructuring costs expensed in the period
was classified as non-current, and an increase in asset
retirement obligations arising from interest accretion
19 % See Section 7.4 Cash provided (used) by financing
activities for a discussion of our financing activities
(24)% Primarily a reduction in pension and post-retirement plan
deficits resulting from returns on plan assets
Deferred income taxes
1,944
1,936
8
Owners’ equity
Common equity
7,678
7,454
224
AWS-3 spectrum licences
deposits
Goodwill, net
Real estate joint venture
advances
Long-term debt
Other long-term liabilities
2 % See Capital expenditures in Section 7.3 Cash used by
investing activities and Depreciation in Section 5.3
n/m % See Capital expenditures in Section 7.3 Cash used by
investing activities and Amortization of intangible assets in
Section 5.3
n/m % See Section 7.3
n/m % An increase due to an acquisition of an electronic medical
records (EMR) provider
(100)% The reclassification of real estate joint venture advances to
Current assets
n/m % An increase in temporary differences for employee defined
benefit plan re-measurements recorded in Other
comprehensive income, partially offset by a net reduction in
other temporary differences
3%
Net income of $415 and Other comprehensive income of
$240, net of dividend declarations of $243 and share
purchase activity under our NCIB program of $189
7. Liquidity and capital resources
Our discussion in this section is qualified in its entirety by the Caution regarding forward-looking statements at the
beginning of this MD&A.
7.1 Overview
In the first quarter of 2015, we paid a $302 million deposit for the wireless spectrum licences acquired in the AWS-3
spectrum auction that took place in March 2015, representing 20% of the total purchase price. On March 24, 2015, we
publicly issued $1.75 billion in senior unsecured notes in three series and the proceeds were used to fund the balance of
$1,209 million for the AWS-3 spectrum licences in April 2015 and for general corporate purposes.
In addition, in the first quarter we paid dividends of $244 million to the holders of Common Shares and returned
$156 million of cash to shareholders through share purchases under our 2015 NCIB. On April 1, 2015, we paid dividends
of $243 million to the holders of Common Shares, and during the month of April, purchased 0.5 million of our Common
Shares by way of the automatic share purchase plan (ASPP) at a cost of $21 million.
Our capital structure financial policies, financing plan and report on financing and capital structure management
plans are described in Section 4.3.
Cash flows
Three-month periods ended March 31 ($ millions)
2015
2014
Change
Cash provided by operating activities
Cash used by investing activities
Cash provided (used) by financing activities
718
(926)
1,727
598
(827)
(55)
20 %
(12)%
n/m %
Increase (decrease) in Cash and temporary investments, net
Cash and temporary investments, net, beginning of period
1,519
60
(284)
336
n/m %
(82.1)%
Cash and temporary investments, net, end of period
1,579
52
n/m %
28
7.2 Cash provided by operating activities
Cash provided by operating activities increased year over year by $120 million or 20% in the first quarter of 2015.
Analysis of changes in cash provided by operating activities
($ millions)
First
quarter
Cash provided by operating activities, three-month period ended March 31, 2014
Year-over-year changes:
Higher EBITDA (see Section 5.4 Wireless segment and Section 5.5 Wireline segment)
Higher share-based compensation cash outflows, net of expense
Lower employer contributions to defined benefits plans, net of expense
Lower restructuring disbursements, net of restructuring costs
Higher interest paid
Lower interest received
Lower income taxes paid, net of recoveries received
Other operating working capital changes
598
Cash provided by operating activities, three-month period ended March 31, 2015
718
58
(39)
8
8
(24)
(1)
109
1
•
Employer contributions to employee defined benefit plans decreased as a result of returns on plan assets, changes
in discount rates and the utilization of letters of credit.
•
Income taxes paid, net of refunds received, decreased in the first quarter of 2015, mainly reflecting a lower final
income tax payment for the 2014 income tax year than was required in the first quarter of 2014 for the 2013 income
tax year.
7.3 Cash used by investing activities
Cash used by investing activities increased year over year by $99 million or 12% in the first quarter of 2015 and included
the following:
•
A year-over-year increase of $65 million in Cash payments for capital assets (excluding spectrum licences) in the
first quarter of 2015. This was composed of:
o
A year-over-year increase of $139 million in capital expenditures in the first quarter of 2015 (see table and
discussion below)
o
A comparative increase in Accounts payable and accrued liabilities of $74 million in the first quarter of 2015 that
reflected payment timing differences in respect of capital expenditures.
•
Payment of the $302 million deposit in the first quarter of 2015 for the AWS-3 spectrum licences acquired in Industry
Canada’s March 2015 auction. This compares to a deposit of $229 million in the first quarter of 2014 for 700 MHz
licences acquired in Industry Canada’s spectrum auction that ended in March 2014. The balance of $1,209 million
for the AWS-3 spectrum licences was paid in April 2015, while the $914 million balance for the 700 MHz spectrum
auction held in 2014 was paid in April 2014.
•
Business acquisitions and related investments to complement our existing lines of business, totalling $4 million in the
first quarter of 2015 (first quarter of 2014 – $37 million).
•
Advances and contributions to the real estate joint ventures, net of receipts, in the amount of $7 million in the first
quarter of 2015 (first quarter of 2014 – $14 million), primarily reflecting advances under construction credit facilities
commensurate with construction progress.
29
Capital expenditure measures
Three-month periods ended March 31 ($ millions, except capital intensity)
2015
2014
Change
248
387
165
331
635
496
28.0 %
500
15
28
21
581
11
24
17
(13.9)%
4 pts.
4 pts.
4 pts.
1
Capital expenditures excluding spectrum licences
Wireless segment
Wireline segment
Consolidated
EBITDA less capital expenditures (excluding spectrum licences)2
Wireless segment capital intensity (%)
Wireline segment capital intensity (%)
Consolidated capital intensity2 (%)
50.3 %
16.9 %
(1)
Capital expenditures include assets purchased, but not yet paid for, and therefore differ from Cash payments for capital assets, as presented
on the interim consolidated statements of cash flows.
(2)
See calculation and description in Section 11.1 Non-GAAP and other financial measures.
Wireless segment capital expenditures increased year over year by $83 million or 50% in the first quarter of 2015, due
to the continued investment in wireless broadband infrastructure to enhance our network coverage, speed and capacity,
including the deployment of 700 MHz spectrum, as well as investments in efficiency initiatives. We continue to invest in
system and network resiliency and reliability in support of our ongoing customers first initiatives and to ready the network
and systems for future retirement of legacy assets. Wireless EBITDA less capital expenditures was $496 million in the
first quarter of 2015, compared to $525 million in the same period of 2014, as the increase in capital expenditures more
than offset growth in EBITDA.
Wireline segment capital expenditures increased year over year by $56 million or 17% in the first quarter of 2015,
primarily due to continuing investments in broadband infrastructure, which supports Optik TV and high-speed Internet
subscriber growth and faster Internet speeds, and extends the reach and functionality of our healthcare solutions. We
also continued our investments in system resiliency and reliability and to support business service growth. Wireline
EBITDA less capital expenditures was $4 million in the first quarter of 2015, down from $56 million in the first quarter of
2014, as the increase in capital expenditures was only slightly offset by growth in EBITDA.
7.4 Cash provided (used) by financing activities
Net cash provided by financing activities was $1.7 billion in the first quarter of 2015, as compared to $55 million net cash
used by financing activities in the same period in 2014. Financing activities included the following:
Dividends paid to the holders of Common Shares
Dividends paid to the holders of Common Shares were $244 million in the first quarter of 2015, an increase of $22 million
from the first quarter of 2014. The increase reflects higher dividend rates under our dividend growth program, offset by
lower outstanding shares resulting from shares purchased and cancelled under our normal course issuer bid (NCIB)
program.
Purchase of Common Shares for cancellation
In the first quarter of 2015, we purchased approximately 3.8 million shares under our 2015 NCIB program. In
April 30, 2015, we purchased approximately 0.5 million shares for $21 million. See Section 4.3 for details of our planned
multi-year share purchase program through 2016.
Normal course issuer bid in 2015
Period
Common Shares
purchased and
cancelled
Average purchase
price per share ($)
Purchase costs
($ millions)
Increase (decrease)
in Accounts payable
($ millions)
Cash outflow
($ millions)
First quarter
April
3,793,200
491,600
41.06
42.63
156
21
—
—
156
21
Total
4,284,800
41.24
177
—
177
Short-term borrowings
Short-term borrowings are composed primarily of amounts advanced to us from an arm’s-length securitization trust
pursuant to the sale of trades receivables in securitization transactions (see Section 7.7 Sale of trade receivables).
Proceeds were $100 million throughout the first quarter of 2015.
30
Long-term debt issues and repayments
Long-term debt issues, net of repayments, in the first quarter of 2015 were $2.1 billion and were composed of:
• A March 24, 2015, public issue of $1.75 billion in senior unsecured notes in three series: a $250 million offering at
1.50% due March 27, 2018, a $1.0 billion offering at 2.35% due March 28, 2022, and a $500 million offering at
4.40% due January 29, 2046. The net proceeds were used to fund a portion of the $1.5 billion purchase price of the
AWS-3 wireless spectrum licences and the remainder was used for general corporate purposes.
• A net increase in commercial paper by $389 million to $519 million, as at March 31, 2015.
In comparison, Long-term debt issues, net of repayments, in the first quarter of 2014 were composed of a net
increase in commercial paper to $626 million at March 31, 2014. Subsequent to the first quarter ended March 31, 2014,
on April 4, 2014, we issued $1 billion in senior unsecured notes in two series: a $500 million offering at 3.20% due
April 5, 2021, and a $500 million offering at 4.85% due April 5, 2044. The net proceeds were used to repay the
$914 million of indebtedness drawn to fund a portion of the purchase price of the 700 MHz spectrum licences and the
remainder was used for general corporate purposes.
These debt issues, combined with those in the third quarter of 2014, increased our average term to maturity of longterm debt (excluding commercial paper) to approximately 11.1 years at March 31, 2015, compared to approximately
9.2 years at March 31, 2014. Additionally, our weighted average cost of long-term debt (excluding commercial paper)
was 4.42% at March 31, 2015, as compared to 4.89% at March 31, 2014, as a result of our 2014 and 2015 re-financing
activities.
At March 31, 2015, no amounts were drawn against our five-year revolving credit facility (but $519 million was
utilized to backstop outstanding commercial paper). Our commercial paper program provides low-cost funds and is fully
backstopped by this five-year committed credit facility (see Section 7.6 Credit facilities).
7.5 Liquidity and capital resource measures
Net debt was $10.0 billion at March 31, 2015, an increase of $1.8 billion when compared to one year earlier, resulting
from our re-financing activities in 2014 and incremental debt issued (primarily for the acquisition of 700 MHz and
AWS-3 spectrum licences and redemption of higher-rate debt), partly offset by an increase in Cash and temporary
investments (pending final payment of approximately $1.2 billion for AWS-3 spectrum licences in April 2015).
Fixed-rate debt as a proportion of total indebtedness was 95% at March 31, 2015, up from 91% one year earlier,
due to our 2014 re-financing activities and financing of 700 MHz and AWS-3 spectrum licence purchases with fixed-rate
debt.
Net debt to EBITDA – excluding restructuring and other like costs ratio was 2.30 times for the 12-month period
ended March 31, 2015, up from 1.97 times one year earlier, resulting from an increase in net debt due to the issuance of
incremental debt primarily for the acquisition of spectrum licences, which is being auctioned in unprecedented amounts,
partly offset by growth in EBITDA – excluding restructuring and other like costs. Our revised financial objective for this
measure, which is reviewed annually, is 2.00 to 2.50 times (previously 1.50 to 2.00 times). We revised the financial
objective for this measure, as we believe that this new objective range optimizes our cost of capital in line with global
peers. Our strategy is to maintain investment grade credit ratings in the range of BBB+ or the equivalent. We are well in
compliance with the leverage ratio covenant in our credit facilities, which states that we may not permit our net debt to
operating cash flow ratio to exceed 4.00:1.00 (see Section 7.6 Credit facilities).
31
Liquidity and capital resource measures
As at, or 12-month periods ended, March 31
2015
2014
Change
10,011
4,358
462
8,202
4,156
411
1,809
202
51
95
11.1
2.30
91
9.2
1.97
4 pts.
1.9
0.33
5.2
9.4
5.4
10.1
(0.2)
(0.7)
67
67
68
69
(1)pt.
(2)pts.
1
Components of debt and coverage ratios ($ millions)
Net debt
EBITDA – excluding restructuring and other like costs
Net interest cost2
Debt ratios
Fixed-rate debt as a proportion of total indebtedness (%)
Average term to maturity of long-term debt (excluding commercial paper) (years)
Net debt to EBITDA – excluding restructuring and other like costs1 (times)
Coverage ratios1 (times)
Earnings coverage
EBITDA – excluding restructuring and other like costs interest coverage2
Other measures (%)
Dividend payout ratio of adjusted net earnings1
Dividend payout ratio1
1.
See Section 11.1 Non-GAAP and other financial measures.
2.
The figure for the 12-month period ended March 31, 2014 has been restated.
Earnings coverage ratio for the 12-month period ended March 31, 2015 was 5.2 times, down from 5.4 times one
year earlier. Higher borrowing costs reduced the ratio by 0.8, while growth in income before borrowing costs and income
taxes increased the ratio by 0.6.
EBITDA – excluding restructuring and other like costs interest coverage ratio for the 12-month period ended
March 31, 2015 was 9.4 times, down from 10.1 times one year earlier. An increase in net interest costs (including the
September 2014 long-term debt prepayment premium) reduced the ratio by 1.1, while growth in EBITDA – excluding
restructuring and other like costs increased the ratio by 0.4. See Section 7.6 Credit facilities.
Dividend payout ratios: Our financial objective is 65 to 75% of sustainable earnings on a prospective basis. The
basic and adjusted dividend payout ratios for the 12-month periods ended March 31, 2015 and 2014 were consistent
with the objective range.
7.6 Credit facilities
At March 31, 2015, we had available liquidity of $1.7 billion from unutilized credit facilities, as well as $400 million
available under our trade receivables securitization program (see Section 7.7). This adheres to our objective of generally
maintaining at least $1 billion of available liquidity.
Revolving credit facility
We have a $2.25 billion (or U.S. dollar equivalent) revolving credit facility with a syndicate of 15 financial institutions that
was renewed in the second quarter of 2014 and expires on May 31, 2019. The revolving credit facility is used for general
corporate purposes, including the backstop of commercial paper, as required.
TELUS credit and other bank credit facilities at March 31, 2015
($ millions)
Expiry
1
Five-year revolving facility
1.
May 31, 2019
Size
2,250
Outstanding
undrawn
letters of
credit
Drawn
—
—
Backstop for
commercial
paper
program
519
Available
liquidity
1,731
Canadian dollars or U.S. dollar equivalent.
Our revolving credit facility contains customary covenants, including a requirement that we not permit our
consolidated leverage ratio to exceed 4.00 to 1.00 (our ratio was approximately 2.30 to 1.00 at March 31, 2015) and not
permit our consolidated coverage ratio (EBITDA to interest expense on a trailing 12-month basis) to be less than
2.00 to 1.00 (approximately 9.43 to 1.00 at March 31, 2015 and expected to remain well above the covenant) at the end
of any financial quarter. There are certain minor differences in the calculation of the leverage ratio and coverage ratio
under the revolving credit facility, as compared with the calculation of Net debt to EBITDA – excluding restructuring and
other like costs and EBITDA – excluding restructuring and other like costs interest coverage. Historically, the calculations
have not been materially different. The covenants are not impacted by revaluation of Property, plant and equipment,
Intangible assets or Goodwill for accounting purposes. Continued access to our credit facilities is not contingent on
maintaining a specific credit rating.
32
Commercial paper
TELUS Corporation has an unsecured commercial paper program, which is backstopped by our revolving credit facility,
enabling us to issue commercial paper up to a maximum aggregate amount of $1.2 billion, which is to be used for
general corporate purposes, including capital expenditures and investments. Our ability to reasonably access the
commercial paper market in Canada is dependent on our credit ratings (see Section 7.8 Credit ratings).
Other letter of credit facilities
At March 31, 2015, we had $307 million of uncommitted letter of credit facilities, of which $181 million was utilized. We
have also arranged incremental letters of credit to allow us to participate in Industry Canada’s AWS-3 auction and
2500 MHz auction which were held in March 2015 and commenced in April 2015, respectively. Concurrent with funding
the purchase of the AWS-3 spectrum licences on April 21, 2015, $65 million of these incremental lines of credit were
extinguished. Under the terms of the auctions, communications between bidders that would provide insights into bidding
strategies, including reference to preferred blocks, technologies or valuations, are precluded until the deadlines for the
final payments in the auctions. Disclosure of the precise amount of our letters of credit could be interpreted as a signal of
bidding intentions. The maximum amount of letters of credit for the two auctions combined that we could be required to
deliver is approximately $200 million.
7.7 Sale of trade receivables
TELUS Communications Inc., a wholly owned subsidiary of TELUS, is a party to an agreement with an arm’s-length
securitization trust associated with a major Schedule I Canadian bank, under which it is able to sell an interest in certain
of its trade receivables for an amount up to a maximum of $500 million. The agreement is in effect until
December 31, 2016 and available liquidity was $400 million at March 31, 2015. (See Note 19 of the interim consolidated
financial statements.) Sales of trade receivables in securitization transactions are recognized as collateralized Short-term
borrowings and thus do not result in our de-recognition of the trade receivables sold.
TELUS Communications Inc. is required to maintain at least a BB credit rating by DBRS Ltd. or the securitization
trust may require the sale program to be wound down prior to the end of the term. The necessary credit rating was
exceeded as of May 7, 2015.
7.8 Credit ratings
On March 19, 2015, DBRS Ltd. issued a press release stating that it had placed TELUS Corporation’s issuer rating,
Notes rating and commercial paper rating, as well as the senior debentures rating for TELUS Communications Inc.,
under review with negative implications due to actual and anticipated changes in the Company’s debt and interest
coverage ratios. Specifically, DBRS cited the, then potential, issuance of debt to fund the acquisition of the AWS-3
spectrum licences as an event that would affect the Company’s financial risk profile. There can be no assurance that
DBRS, or any other rating agency, will not downgrade its ratings of TELUS. DBRS’s announcement limits our ability to
access the commercial paper markets in Canada. The Company expects that it will be able to continue to access shortterm funding from other available sources. There were no changes to our investment grade credit ratings during the first
quarter of 2015 or as of May 7, 2015. We believe adherence to most of our stated financial objectives and the resulting
investment grade credit ratings, coupled with our efforts to maintain a constructive relationship with banks, investors and
credit rating agencies, continue to provide reasonable access to capital markets.
7.9 Financial instruments, commitments and contingent liabilities
Financial instruments
Our financial instruments and the nature of certain risks that they may be subject to were described in Section 7.9 of our
2014 MD&A.
Liquidity risk
As of the date of this MD&A, we can offer $1.25 billion of debt or equity securities pursuant to a shelf prospectus that is
effective until December 2016.
At March 31, 2015, we had credit facilities available, including a $2.25 billion facility expiring on May 31, 2019 (see
Section 7.6 Credit facilities). We also had $1,579 million in cash and temporary investments at March 31, 2015. We
believe that our investment grade credit ratings contribute to reasonable access to capital markets.
Commitments and contingent liabilities
Purchase obligations
As at March 31, 2015, our contractual commitments related to the acquisition of property, plant and equipment were
$309 million through to December 31, 2016, as compared to $321 million over a period ending December 31, 2015,
primarily driven by the increase in commitments related to broadband expansion.
33
Indemnification obligations
At March 31, 2015, we had no liability recorded in respect of indemnification obligations.
Claims and lawsuits
A number of claims and lawsuits (including class actions) seeking damages and other relief are pending against us. As
well, we have received or are aware of certain possible claims (including intellectual property infringement claims)
against us and, in some cases, numerous other wireless carriers and telecommunications service providers.
Management is of the opinion, based upon legal assessment and information presently available, that it is unlikely
that any liability, to the extent not provided for through insurance or otherwise, would have a material effect in relation to
our financial position and the results of our operations, excepting items disclosed in Note 23(b) of the interim
consolidated financial statements.
7.10 Outstanding share information
Outstanding shares (millions)
Common Shares
Common Share options
Exercisable Common Share options
March 31, 2015
605
4
2
April 30, 2015
605
4
2
7.11 Transactions between related parties
Investments in significant controlled entities
As at March 31, 2015, TELUS Corporation controlled 100% of the equity of TELUS Communications Inc., which, in turn,
ultimately controlled 100% of the equity of TELUS Communications Company and TELE-MOBILE COMPANY. This is
unchanged from December 31, 2014.
Transactions with key management personnel
Our key management personnel have authority and responsibility for overseeing, planning, directing and controlling our
activities, and consist of our Board of Directors and our Executive Leadership Team, including our Executive Chair. Total
compensation expense amounts for key management personnel were $11 million in the first quarter of 2015, as
compared to $10 million in the first quarter of 2014. The increase resulted from higher share-based compensation arising
from differing Common Share price movements in the respective periods. See Note 24(b) of the interim consolidated
financial statements for additional detail.
Transactions with defined benefit pension plans
We made employer contributions to defined benefit pension plans as shown in the table in Section 7.2. We also provided
management and administrative services to our defined benefit pension plans. Charges for these services were on a
cost recovery basis and were immaterial.
Transactions with real estate joint ventures
In the first quarter of 2015, we had transactions with real estate joint ventures, which are related parties to us, as set out
in Note 18 of our interim consolidated financial statements. Commitments and contingent liabilities for the real estate joint
ventures include construction-related contractual commitments through to 2018 (approximately $148 million at
March 31, 2015) and construction credit facilities ($369 million with two Canadian financial institutions as 50% lender and
TELUS as 50% lender). The TELUS Garden joint venture has sales contracts in place for substantially all units in the
residential tower and, at March 31, 2015, the proportion of space leased in the office tower was approximately 93%.
8. Accounting matters
8.1 Critical accounting estimates
Our significant accounting policies are described in Note 1 of the Consolidated financial statements dated
December 31, 2014. Our critical accounting estimates and significant judgments are described in Section 8.1 of our
annual 2014 MD&A. The preparation of financial statements in conformity with IFRS-IASB requires us to make
estimates, assumptions and judgments that affect the reported amounts of assets and liabilities and disclosure of
contingent assets and liabilities at the date of the financial statements, as well as the reported amounts of revenues and
expenses during the reporting period. Actual results could differ from those estimates. Our critical accounting estimates
and significant judgments are generally discussed with the Audit Committee each quarter.
34
8.2 Accounting policy developments
Revenue from contracts with customers: IFRS 15, Revenue from Contracts with Customers, is required to be applied
for years beginning on or after January 1, 2017. The International Accounting Standards Board and the Financial
Accounting Standards Board of the United States worked on this joint project to clarify the principles for the recognition of
revenue and to develop the common revenue standard. The new standard was released in May 2014 and supersedes
existing standards and interpretations, including IAS 18, Revenue. We are currently assessing the impacts and transition
provisions of the new standard.
On April 28, 2015, the International Accounting Standards Board proposed deferring the required application date by
one year to January 1, 2018, following a similar proposal earlier in the month by the Financial Accounting Standards
Board. There is no assurance that the International Accounting Standards Board will bring such proposed deferral into
effect.
The effects of the new standard and the materiality of those effects will vary by industry and entity. Like many other
telecommunications companies, we currently expect to be materially affected by its application, primarily in respect of the
timing of revenue recognition, the classification of revenue, the capitalization of costs of obtaining a contract with a
customer and possibly the capitalization of the costs of contract fulfilment (as defined by the new standard). The timing of
revenue recognition and the classification of our revenues as either service or equipment, will be affected due to the
allocation of consideration in multiple element arrangements (solutions for our customers that may involve the delivery of
multiple services and products occurring at different points in time and/or over different periods of time) no longer being
affected by limitation cap methodology.
The effects of the timing of revenue recognition and the classification of revenue are expected to be most
pronounced in our wireless segment. Although the measurement of the total revenue recognized over the life of a
contract will be largely unaffected by the new standard, the prohibition of the use of the limitation cap methodology will
accelerate the recognition of such revenue, relative to both the associated cash inflows from customers and our current
practice (using the limitation cap methodology). Although the underlying transaction economics would not differ, during
sustained periods of growth in the number of wireless subscriber connection additions, assuming comparable contractlifetime per unit cash inflows, revenues would appear to be greater than under current practice (using the limitation cap
methodology). Wireline segment results arising from transactions that include the initial provision of subsidized hardware
will be similarly affected.
Similarly, the measurement, over the life of a contract, of total costs of contract acquisition and contract fulfilment will
be unaffected by the new standard, which will affect both our wireless and wireline segments. The new standard will
result in such costs of contract acquisition and contract fufilment, to the extent that they are material, being capitalized
and subsequently recognized as an expense over the life of a contract on a rational, systematic basis consistent with the
pattern of the transfer of goods or services to which the asset relates. Although the underlying transaction economics
would not differ, during sustained periods of growth in the number of customer connection additions, assuming
comparable per unit costs of contract acquisition and contract fulfilment, absolute profitability measures would appear to
be greater than under the current practice of immediately expensing such costs.
Our operations and associated systems are complex and the accounting for millions of our multi-year contracts with
our customers will be affected. Significantly, so as to effect the associated accounting, incremental compilation of
historical data will be needed for the millions of our already existing multi-year contracts with our customers that are
expected to be in-scope for purposes of transitioning to the new standard. Our current estimate of the time and effort
necessary to develop and implement the accounting policies, estimates, judgments and processes (including
incremental requirements of our information technology systems) necessary to comply with the new standard is
expected to span a period of time ending no earlier than mid-2016. As a result, at this time, it is not possible to make
reasonable quantitative estimates of the effects of the new standard.
Other issued standards: Other issued standards required to be applied for periods beginning on or after
January 1, 2015, are expected to have no significant effect on our financial performance.
9. Update to assumptions
Our discussion in this section is qualified in its entirety by the Caution regarding forward-looking statements at the
beginning of this MD&A.
The assumptions for our 2015 outlook, as described in Section 9 General trends, outlook and assumptions of our
annual 2014 MD&A, remain the same.
35
10. Risks and risk management
Our discussion in this section is qualified in its entirety by the Caution regarding forward-looking statements at the
beginning of this MD&A. Our principal risks and uncertainties that could affect our future business results and our
associated risk mitigation activities were described in our annual 2014 MD&A. Certain updates follow.
10.1 Regulatory matters
The following are updates to Section 10.4 Regulatory matters in our annual 2014 MD&A.
Our telecommunications, broadcasting and radiocommunication services are regulated under federal legislation by the
Canadian Radio-television and Telecommunications Commission (CRTC), the Minister of Industry and the Minister of
Canadian Heritage. These regulations relate to, among other matters, rates, terms and conditions for the provision of
telecommunications services, licensing of broadcasting services, licensing of spectrum and restrictions on ownership and
control by non-Canadians. The outcome of regulatory proceedings, reviews, appeals and other developments could
have a material impact on our operating procedures and profitability.
Radiocommunication licences and wireless roaming and tower sharing requirements
Additional wireless spectrum licences to be auctioned in August 2015
On May 1, 2015, the Industry Minister announced that unallocated licences from the recent 700 MHz and AWS-3
auctions would be made available in a new auction to be held in August 2015.
Health Canada Safety Code 6
On March 13, 2015, Health Canada published revised guidelines for recommended human exposure to radiofrequency
(RF) electromagnetic energy (i.e. energy from various electronic devices such as wireless handsets, Wi-Fi and
broadcasting and cellular towers). The guidelines are referred to as Safety Code 6 and are among the most rigorous in
the world. It is a condition of TELUS’ spectrum licences to comply with Safety Code 6 limits. TELUS is reviewing the
revised limits and is undertaking any necessary measures for compliance.
Compliance with radio authorization conditions and telecommunications regulations
Industry Canada regulates, among other matters, the allocation and use of radio spectrum in Canada and licenses radio
apparatus and frequency bands and/or radio channels within various frequency bands to service providers and private
users. Industry Canada also establishes the terms and conditions attaching to such radio authorizations, including
restrictions on licence transfers, coverage obligations, research and development obligations, annual reporting, and
obligations concerning mandated roaming and antenna site sharing with competitors.
While we believe that we are substantially in compliance with our radio authorization conditions, there can be no
assurance that we will be found to comply with all radio authorization conditions, or if found not to be compliant, that a
waiver will be granted or that the costs to be incurred to achieve compliance will not be significant. Any failure to comply
with the radio authorization conditions could result in the revocation of our licences and/or imposition of fines.
On December 18, 2013, the federal government announced that it would be amending both the Telecommunications
Act and the Radiocommunication Act to give the CRTC and Industry Canada the power to impose administrative
monetary penalties (AMPs). The generalized AMP amendment to the Telecommunications Act applies to contraventions
of provisions of the Act or any decision or regulation made by the CRTC under the Act. The amendment allows the
CRTC to impose an administrative monetary penalty on a corporation in an amount not to exceed $10 million for a first
contravention and up to $15 million for a subsequent contravention. The Radiocommunication Act AMPs amendment is
more focused, applying to unauthorized operation of radio apparatus, contraventions of new requirements concerning
jammers and contraventions of auction rules, standards and procedures. On December 16, 2014, Bill C-43, Economic
Action Plan 2014 Act, No. 2, received royal assent and the provisions governing administrative monetary penalties are
now in effect. On March 27, 2015, the CRTC issued Compliance and Enforcement and Telecom Information Bulletin
CRTC 2015-111, Guidelines regarding the general administrative monetary penalties regime under the
Telecommunications Act, in which it outlined its approach to compliance and enforcement, as well as how it intends to
use its new powers to impose administrative monetary penalties.
Risk mitigation: We continue to strive to comply with all licence and renewal conditions and we plan to participate in
future wireless spectrum auctions. We have advocated to the federal government for a level playing field in respect of
spectrum auction rules, such that established wireless companies like TELUS can bid on an equal footing with others for
spectrum blocks available at auction or are able to purchase spectrum licences available for sale from entrants.
36
Regulatory and federal government reviews
The CRTC has held public proceedings to review, among other issues, wireline wholesale services (including the
appropriateness of mandating competitor access to our fibre-to-the-premises (FTTP) facilities), wireless wholesale
services and the regulatory framework relating to television broadcasting. It has also announced its intention to hold
future proceedings on satellite and other transport services and basic telecommunications services (including the
national contribution mechanism).
Wireline wholesale services review
In December 2014, the CRTC concluded a major review of the existing regulatory framework for wireline wholesale
services initiated by Telecom Notice of Consultation CRTC 2013-551, Review of wholesale services and associated
policies. A decision is expected in the second quarter of 2015. The decision may change aspects of the current
regulatory framework for wireline wholesale services. Among other matters, it will address the question of whether
competitors that choose not to build their own FTTP facilities should enjoy regulated access to the FTTP facilities owned
by TELUS and other large telephone and cable companies. These changes could negatively impact our future business
strategies.
Satellite and other transport services
In Telecom Regulatory Policy CRTC 2013-771 released on December 18, 2013, the CRTC identified the high cost of
satellite transport as an impediment to meeting its broadband target and announced its intention to conduct an inquiry
into satellite services. The inquiry, launched on February 6, 2014, was recently concluded and the final report of the
Inquiry Officer was released on April 9, 2015 simultaneously with the release of Telecom Notice of Consultation CRTC
2015-134, Review of basic telecommunications services. In that Notice, the CRTC confirmed that its review of basic
telecommunications services will include a review of the satellite transport infrastructure in Yukon, Nunavut and the
Northwest Territories and whether a mechanism should be established to fund satellite and/or other transport facilities
(see Basic telecommunications services below).
Wireless wholesale services review
On June 19, 2014, Section 27.1 of the Telecommunications Act came into effect. This section caps wholesale wireless
roaming rates charged to Canadian carriers for voice, data and text roaming services. This wholesale roaming cap was
put in place while the CRTC was reviewing whether the wholesale mobile wireless market is sufficiently competitive and,
if not, what regulatory measures are required. On May 5, 2015, the CRTC issued its decision in the wireless wholesale
services review. The main determination is that the CRTC will regulate wholesale GSM-based domestic roaming rates
that TELUS, Rogers and Bell charge new entrant wireless carriers. Interim tariffs are to be filed by TELUS, Rogers and
Bell by June 4, 2015, based on the current maximum rate each carrier respectively charges for wholesale GSM-based
domestic roaming. Proposed final tariff rates based on the CRTC’s Phase II costing approach are to be filed by each of
TELUS, Rogers and Bell by November 4, 2015. The CRTC has also recommended that the Governor in Council repeal
the wholesale roaming cap established by Section 27.1 of the Telecommunications Act. It is not expected that the
CRTC’s decision will have a material impact on TELUS’ operations.
Basic telecommunications services
On April 9, 2015, the CRTC issued Telecom Notice of Consultation CRTC 2015-134 announcing a two-phased
proceeding to determine what telecommunications services (e.g. voice and broadband) are required by all Canadians to
participate in the digital economy. The first phase of the review is an information-gathering phase in which the CRTC will
review its policies on basic telecommunications services and gather information to better understand which
telecommunications services are being offered across Canada and whether any areas are underserved or unserved.
The first phase will close June 30, 2015. The second phase of the review will begin in the fall of 2015 at which time the
CRTC will hold a further consultation to collect comments from Canadians regarding the issues identified. The details of
this phase will be announced at a later date. Following the second phase, a public hearing will be held commencing
April 11, 2016. Among other things, the review will include whether there should be changes to the national contribution
mechanism under which basic telecommunications services in high-cost serving areas are subsidized. It is too early to
determine what impact the outcome of this proceeding will have on TELUS.
Public consultation on television broadcasting and distribution (Let’s Talk TV review)
In September 2014, the CRTC concluded a review of the regulatory framework relating to television broadcasting. A
number of issues were discussed in this proceeding, including the CRTC’s proposal to increase the ability of consumers
to choose to subscribe to programming services on a service-by-service basis, whether to require contribution payments
from currently exempted content providers and how to set wholesale rates for programming services in an environment
that promotes greater choice for consumers. The CRTC has now released all of the substantial policy decisions related
to this consultation, namely Broadcasting and Telecom Regulatory Policy CRTC 2014-576 prohibiting 30-day
cancellation policies, followed by January releases of Broadcasting Regulatory Policy CRTC 2015-24 relating to overthe-air transmission of television signals and local programming, and Broadcasting Regulatory Policy CRTC 2015-25
relating to measures to address issues related to simultaneous substitution. In March 2015, the CRTC released
37
Broadcasting Regulatory Policy CRTC 2015-86, which focused on measures to promote the creation of Canadian
content, Broadcasting Regulatory Policy CRTC 2015-96, which set out a new regulatory framework to promote greater
choice for consumers in the selection of programming services, and Broadcasting Regulatory Policy CRTC 2015-104,
which announced a new consumer code for television services for which the Commissioner for Complaints for
Telecommunications Services would act as ombudsman. TELUS believes its approach to television is very similar to that
outlined in these policy decisions and does not expect them to have a material impact on our operations.
Risk mitigation: We will continue to encourage the CRTC to reduce the scope of network facilities subject to mandated
competitor access. If competitor access to FTTP infrastructure is mandated as a result of the wireline wholesale services
review proceeding, potential future FTTP investments by carriers of all kinds would be discouraged.
We will be participating in both the satellite and basic telecommunications services proceedings and will be arguing
against an additional industry-funded subsidy mechanism flowing to Yukon, Nunavut and the Northwest Territories or
other areas of Canada.
We participated in the wireless wholesale services review proceeding to demonstrate that the wireless marketplace
is competitive and there is no need for additional CRTC regulation in respect of wireless wholesale services, including
roaming rates and rates for access to wireless towers and sites.
We are reviewing and enhancing our compliance programs, practices and procedures in view of the broadened
administrative monetary penalties under the Telecommunications Act and the Radiocommunication Act that are now in
effect.
We are participating in the basic telecommunications services review and will emphasize that any enhancements to
the current basic service objective would require associated changes to the current subsidy regime, or a new regime
altogether, to fully fund any new minimum service requirements.
We participated in the CRTC’s consultation to amend the regulatory framework applicable to television and
supported the CRTC’s goal to make greater choice available to our TV customers. We focused on changes to the
regulatory framework needed to address concerns related to vertical integration in the broadcasting sector and artificially
high wholesale prices for programming services maintained through the sale of services in large packages (which does
not reflect consumer demand for any specific service in the large bundle). Our approach to television services is very
much aligned with the recent CRTC policy decisions, described above. These decisions assist us in dealing with
concerns related to on vertical integration in the broadcasting industry.
CRTC national Wireless Code/Provincial consumer protection legislation
On June 3, 2013, the CRTC issued The Wireless Code, Telecom Regulatory Policy CRTC 2013-271, which established
a mandatory code of conduct for providers of retail mobile wireless voice and data services to individuals and small
businesses. The Wireless Code applies across Canada and sets baseline requirements for customer rights and service
provider responsibilities. It deals with issues such as clarity and content of mobile wireless service contracts, application
of early cancellation fees, mandatory caps on data and roaming charges, and removal of cancellation fees after two
years.
Although the Wireless Code went into effect on December 2, 2013 and applies to mobile wireless service contracts
signed, amended, renewed or extended after that date, the CRTC has also stated that the Wireless Code will apply to all
wireless contracts, no matter when they were entered into, on June 3, 2015. This could mean that, as of June 3, 2015,
the Wireless Code will apply retrospectively to all retail mobile wireless service contracts with individuals and small
businesses, including those in place prior to December 2, 2013. Contracts that have device balances that are reduced
over a period greater than 24 months, which is the case for any three-year mobile wireless service contracts that have
not yet expired by June 3, 2015, would not comply with the Wireless Code.
The Federal Court of Appeal granted TELUS and other major wireless service providers leave to appeal the
retrospective application of the Wireless Code. The appeal was heard on November 12, 2014 and a decision is expected
from the Court by May 12, 2015. Should retrospective application of the Wireless Code be required, we may experience
a negative impact on our financial results in the future, as certain of our clients on three-year contracts may be able to
avoid paying the remaining device balance if they terminate their contracts early.
Several provinces have passed consumer protection legislation relating to wireless services, including Ontario and
Quebec. There is a risk of significant compliance costs for us and other wireless service providers, particularly since the
federal and provincial rules are not fully harmonized.
38
Risk mitigation: We support the CRTC’s national Wireless Code requirements to standardize the terms and conditions
of service and to reduce compliance costs, but we are appealing the retrospective aspects of the Wireless Code. The
Code went into effect on December 2, 2013 and we adjusted our practices as necessary to achieve compliance with the
Code’s requirements by the effective date. In addition, we launched new two-year plans on July 30, 2013, ahead of the
required implementation date for the two-year contract maximum. Because we are subject to federal laws and
regulations like the Wireless Code, there may be occasions where compliance with provincial legislation is not required.
In such cases, we manage our compliance costs by carefully assessing whether compliance with provincial legislation
promotes our customers first philosophy and aligns with the federal standards we must follow.
Broadcasting distribution undertakings
We hold licences from the CRTC to operate terrestrial broadcasting distribution undertakings to serve various
communities in B.C. and Alberta (renewed in 2009 for a second full seven-year term), and in Eastern Quebec (renewed
in 2011 for a second full seven-year term). We also hold a licence to operate a national video on demand undertaking
(renewed until August 31, 2016). In July 2014, the CRTC approved our application for a licence to operate a national
pay-per-view service (scheduled to expire on August 31, 2020).
Enforcement of vertical integration (VI) framework
In September 2011, the CRTC announced a policy framework to address concerns relating to the potential incentive for
anti-competitive behaviour by companies that own both programming services and distribution networks (vertically
integrated broadcasting companies). The CRTC subsequently introduced a new code of conduct through amendments
to the various broadcasting regulations and exemption orders.
Following the CRTC’s Let’s Talk TV proceeding discussed above, the CRTC further expanded its ability to deal with
anti-competitive conduct by replacing the code of conduct with a new wholesale code that will be made enforceable by
regulation. This new wholesale code includes many new provisions to address abusive practices by vertically integrated
broadcasting companies regarding the carriage of their programming services. In Broadcasting and Telecom Decision
CRTC 2015-26: Complaint against Bell Mobility Inc. and Quebecor Media Inc., Videotron Ltd. and Videotron G.P.
alleging undue and unreasonable preference and disadvantage in regard to the billing practices for their mobile TV
services Bell Mobile TV and illico.tv, the CRTC directed Bell Mobility and Videotron to stop giving their mobile television
services an unfair advantage in the marketplace to the disadvantage of other Internet content by exempting their own
mobile television services from their standard monthly data charges. Bell Mobility has sought and been granted leave to
appeal this decision at the Federal Court of Appeal.
Without timely and strict enforcement of the vertical integration safeguards, there is a risk that vertically integrated
competitors could unfairly raise programming costs for non-vertically integrated companies such as TELUS, and/or
attempt to withhold content on digital media platforms, such as Internet and mobile platforms, or otherwise disadvantage
us in our ability to attract and retain wireless or Optik TV customers.
Risk mitigation: Our strategy is to aggregate, integrate and make accessible content and applications for customers’
enjoyment. We do not believe it is necessary to own content to make it accessible to customers on an economically
attractive basis, provided there is timely and strict enforcement of the CRTC’s regulatory vertical integration safeguards
to prevent undue preference by vertically integrated competitors.
We support a regime under the Broadcasting Act that ensures all Canadian consumers continue to have equitable
access to broadcast content irrespective of the distributor or platform they choose. We continue to advocate for the
timely and strict enforcement of the CRTC vertical integration safeguards and for further meaningful safeguards, as
required.
11. Definitions and reconciliations
11.1 Non-GAAP and other financial measures
We have issued guidance on and report certain non-GAAP measures that are used to evaluate the performance of
TELUS and its segments, as well as to determine compliance with debt covenants and to manage our capital structure.
As non-GAAP measures generally do not have a standardized meaning, they may not be comparable to similar
measures presented by other issuers. Securities regulations require such measures to be clearly defined, qualified and
reconciled with their nearest GAAP measure.
Capital intensity: This measure is calculated as capital expenditures (excluding spectrum licences) divided by total
operating revenues. This measure provides a basis for comparing the level of capital expenditures to those of other
companies of varying size within the same industry.
39
Dividend payout ratio: This basic measure is defined as the quarterly dividend declared per share for the most recently
completed quarter, as reported in the interim consolidated financial statements, multiplied by four and divided by the sum
of basic earnings per share for the most recent four quarters for interim reporting periods (divided by annual basic
earnings per share for fiscal years).
Calculation of Dividend payout ratio
Twelve-month periods ended March 31 ($)
Numerator – Annualized first quarter dividend declared per Common Share
Denominator – Net income per Common Share
Ratio (%)
2015
2014
1.60
2.39
1.44
2.08
67
69
Dividend payout ratio of adjusted net earnings: More representative of a sustainable calculation is the historical ratio
based on reported earnings per share adjusted to exclude income tax-related adjustments, long-term debt prepayment
premiums and items adjusted for in EBITDA. Our financial objective for the annual dividend payout ratio is on a
prospective basis, rather than on a trailing basis, and is 65 to 75% of sustainable earnings on a prospective basis (see
Section 4.3).
Calculation of Dividend payout ratio of adjusted net earnings
Twelve-month periods ended March 31 ($)
Numerator – Annualized first quarter dividend declared per Common Share
Adjusted net earnings ($ millions):
Net income attributable to Common Shares
Add back long-term debt prepayment premium after income taxes
Add back net unfavourable (deduct net favourable) income tax-related adjustments
Denominator – Adjusted net earnings per share
Adjusted ratio (%)
2015
2014
1.60
1.44
1,463
10
(6)
1,309
17
8
1,467
1,334
2.40
2.12
67
68
Earnings coverage: This measure is defined in the Canadian Securities Administrators’ National Instrument 41-101 and
related instruments, and is calculated as follows:
Calculation of Earnings coverage
Twelve-month periods ended March 31 ($ millions, except ratio)
2015
2014
Net income attributable to Common Shares
Income taxes
Borrowing costs (Interest on Long-term debt plus Interest on Short-term borrowings and other plus longterm debt prepayment premium)
1,463
513
1,309
484
465
408
Numerator
Denominator – Borrowing costs
2,441
465
2,201
408
5.2
5.4
Ratio (times)
EBITDA (earnings before interest, income taxes, depreciation and amortization): We have issued guidance on and
report EBITDA because it is a key measure used to evaluate performance at a consolidated level and the contribution of
our two segments. EBITDA is commonly reported and widely used by investors and lending institutions as an indicator of
a company’s operating performance and ability to incur and service debt, and as a valuation metric. EBITDA should not
be considered an alternative to Net income in measuring TELUS’ performance, nor should it be used as an exclusive
measure of cash flow. EBITDA as calculated by TELUS is equivalent to Operating revenues less the total of Goods and
services purchased expense and Employee benefits expense.
We may also calculate an adjusted EBITDA to exclude items of an unusual nature that do not reflect our ongoing
operations, that should not, in our opinion, be considered in a valuation metric or that should not be included in an
assessment of our ability to service or incur debt. In respect of the TELUS Garden residential real estate partnership,
which is included in the wireline segment, we do not anticipate retaining an ownership interest in the TELUS Garden
residential condominium following completion of construction. For the TELUS Garden residential real estate partnership,
in the first quarter of 2015 and 2014, we recorded equity losses of $NIL.
40
EBITDA reconciliation
Three-month periods ended March 31 ($ millions)
Net income
Financing costs
Income taxes
Depreciation
Amortization of intangible assets
EBITDA
2015
2014
415
117
147
347
109
377
102
135
346
117
1,135
1,077
EBITDA – excluding restructuring and other like costs: We report this measure as a supplementary indicator of our
operating performance. It is also utilized in the calculation of Net debt to EBITDA – excluding restructuring and other like
costs and EBITDA – excluding restructuring and other like costs interest coverage.
Calculation of EBITDA – excluding restructuring and other like costs
Three-month periods ended March 31 ($ millions)
2015
2014
EBITDA
Restructuring and other like costs included in EBITDA
1,135
17
1,077
8
EBITDA – excluding restructuring and other like costs
1,152
1,085
EBITDA – excluding restructuring and other like costs interest coverage: This measure is defined as EBITDA –
excluding restructuring and other like costs, divided by Net interest cost, calculated on a 12-month trailing basis. This
measure is similar to the coverage ratio covenant in our credit facilities (see Section 7.6).
EBITDA less capital expenditures (excluding spectrum licences): We report this measure as a supplementary
indicator of our operating performance. We calculate it as a simple proxy for cash flow at a consolidated level and for our
two segments. EBITDA less capital expenditures may be used for comparison to the reported results for other
telecommunications companies over time and is subject to the potential comparability issues of EBITDA described
above.
Calculation of EBITDA less capital expenditures (excluding spectrum licences)
Three-month periods ended March 31 ($ millions)
EBITDA
Capital expenditures (excluding spectrum licences)
EBITDA less capital expenditures (excluding spectrum licences)
2015
2014
1,135
(635)
1,077
(496)
500
581
Free cash flow: We report this measure as a supplementary indicator of our operating performance. It should not be
considered an alternative to the measures in the interim consolidated statements of cash flows. Free cash flow excludes
certain working capital changes (such as trade receivables and trade payables), proceeds from divested assets and
other sources and uses of cash, as found in the interim consolidated statements of cash flows. It provides an indication
of how much cash generated by operations is available after capital expenditures (excluding purchases of spectrum
licences) that may be used to, among other things, pay dividends, repay debt, purchase shares or make other
investments. Free cash flow may be supplemented from time to time by proceeds from divested assets or financing
activities.
Free cash flow calculation
Three-month periods ended March 31 ($ millions)
EBITDA
Restructuring costs net of disbursements
Items from the interim consolidated statements of cash flows:
Share-based compensation
Net employee defined benefit plans expense
Employer contributions to employee defined benefit plans
Interest paid
Interest received
Capital expenditures (excluding spectrum licences)
Free cash flow before income taxes
Income taxes paid, net of refunds
Free cash flow
2015
2014
1,135
(7)
1,077
(15)
(23)
28
(27)
(85)
—
(635)
16
22
(29)
(61)
1
(496)
386
(115)
515
(224)
271
291
41
The following reconciles our definition of free cash flow with Cash provided by operating activities.
Free cash flow reconciliation with Cash provided by operating activities
Three-month periods ended March 31 ($ millions)
Free cash flow
Add (deduct):
Capital expenditures (excluding spectrum licences)
Adjustments to reconcile to Cash provided by operating activities
Cash provided by operating activities
2015
2014
271
291
635
(188)
496
(189)
718
598
Net debt: We believe that net debt is a useful measure because it represents the amount of Short-term borrowings and
long-term debt obligations that are not covered by available Cash and temporary investments. The nearest IFRS
measure to net debt is Long-term debt, including Current maturities of Long-term debt. Net debt is a component of the
Net debt to EBITDA – excluding restructuring and other like costs ratio.
Calculation of Net debt
At March 31 ($ millions)
2015
2014
Long-term debt including current maturities
Debt issuance costs netted against long-term debt
Cash and temporary investments
Short-term borrowings
11,439
51
(1,579)
100
8,120
34
(52)
100
Net debt
10,011
8,202
Net debt to EBITDA – excluding restructuring and other like costs: This measure is defined as net debt at the end
of the period divided by 12-month trailing EBITDA – excluding restructuring and other like costs. We have revised our
long-term financial objective for this measure to a range of 2.00 to 2.50 times, from 1.50 to 2.00 times (see Section 7.5
Liquidity and capital resource measures).
Net interest cost: This measure is the denominator in the calculation of EBITDA – excluding restructuring and other like
costs interest coverage. Net interest cost is defined as financing costs, excluding employee defined benefit plans net
interest and recoveries on redemption and repayment of debt, calculated on a 12-month trailing basis. No recoveries on
redemption and repayment of debt were recorded in the 12-month periods ended March 31, 2015 and 2014. Expenses
recorded for the long-term debt prepayment premium, if any, are included in net interest cost. Net interest cost was
$462 million in the 12-month period ended March 31, 2015 and $411 million in the 12-month period ended March 31,
2014.
Restructuring and other like costs: With the objective of reducing ongoing costs, we incur associated incremental,
non-recurring restructuring costs. We may also incur atypical charges when undertaking major or transformational
changes to our business or operating models. We include incremental external costs incurred in connection with
business acquisition activities in other like costs.
Components of Restructuring and other like costs
Three-month periods ended March 31 ($ millions)
2015
2014
Goods and services purchased
Employee benefits expense
12
5
—
8
Restructuring and other like costs included in EBITDA
17
8
11.2 Wireless operating indicators
The following measures are industry metrics that are useful in assessing the operating performance of a wireless
telecommunications entity, but do not have a standardized meaning under IFRS-IASB.
Average revenue per subscriber unit per month (ARPU) is calculated as network revenue divided by the average
number of subscriber units on the network during the period and expressed as a rate per month.
Churn per month is calculated as the number of subscriber units deactivated during a given period divided by the
average number of subscriber units on the network during the period and is expressed as a rate per month. A TELUS or
Koodo brand prepaid subscriber is deactivated when the subscriber has no usage for 90 days following expiry of the
prepaid credits.
Cost of acquisition (COA) consists of the total of the device subsidy (the device cost to TELUS less the initial charge to
the customer), commissions, and advertising and promotion expenses related to the initial subscriber acquisition during a
given period. As defined, COA excludes costs to retain existing subscribers (retention spend).
42
COA per gross subscriber addition is calculated as cost of acquisition divided by gross subscriber activations during
the period.
Retention spend to network revenue represents direct costs associated with marketing and promotional efforts
(including device subsidies and commissions) aimed at the retention of the existing subscriber base, divided by network
revenue.
Retention volume represents the number of subscriber units retained in the period through marketing and promotional
efforts that result in client upgrades or contract renewals.
Wireless subscriber unit (subscriber) is defined as an active recurring revenue-generating unit (e.g. cellular phone,
tablet or mobile Internet key) with a unique subscriber identifier (SIM or IMEI number) that has access to the wireless
voice and/or data networks for communication. In addition, TELUS has a direct billing or support relationship with the
user of each device. Subscriber units exclude machine-to-machine (M2M) devices (a subset of the Internet of Things),
such as those used for asset tracking, remote control monitoring and meter readings, vending machines and wireless
automated teller machines.
43
condensed interim consolidated statements of income and
other comprehensive income
(unaudited)
Three months
Periods ended March 31 (millions except per share amounts)
OPERATING REVENUES
Service
Equipment
2015
$
Revenues arising from contracts with customers
Other operating income
OPERATING EXPENSES
Goods and services purchased
Employee benefits expense
Depreciation
Amortization of intangible assets
2014
2,829
182
$
2,702
172
3,011
17
2,874
21
3,028
2,895
1,284
609
347
109
1,222
596
346
117
2,349
2,281
OPERATING INCOME
Financing costs
679
117
614
102
INCOME BEFORE INCOME TAXES
Income taxes
562
147
512
135
NET INCOME
415
377
(4)
3
10
(3)
7
(4)
3
6
237
162
240
168
OTHER COMPREHENSIVE INCOME
Items that may subsequently be reclassified to income
Change in unrealized fair value of derivatives designated as cash flow hedges
Foreign currency translation adjustment arising from translating financial statements of
foreign operations
Change in unrealized fair value of available-for-sale financial assets
Item never subsequently reclassified to income
Employee defined benefit plan re-measurements
COMPREHENSIVE INCOME
$
655
$
545
NET INCOME PER COMMON SHARE
Basic
Diluted
$
$
0.68
0.68
$
$
0.61
0.60
TOTAL WEIGHTED AVERAGE COMMON SHARES OUTSTANDING
Basic
Diluted
608
610
622
624
44
condensed interim consolidated statements of financial position
As at (millions)
ASSETS
Current assets
Cash and temporary investments, net
Accounts receivable
Income and other taxes receivable
Inventories
Prepaid expenses
Real estate joint venture advances
Current derivative assets
(unaudited)
March 31,
2015
$
Non-current assets
Property, plant and equipment, net
Intangible assets, net
AWS-3 spectrum licences deposits
Goodwill, net
Real estate joint venture advances
Real estate joint ventures
Other long-term assets
1,579
1,388
19
315
334
127
22
December 31,
2014
$
60
1,483
97
320
199
—
27
3,784
2,186
9,282
7,818
302
3,761
—
22
312
9,123
7,797
—
3,757
120
21
213
21,497
21,031
$
25,281
$
23,217
$
100
1,934
27
243
743
115
644
$
100
2,019
2
244
753
126
255
LIABILITIES AND OWNERS’ EQUITY
Current liabilities
Short-term borrowings
Accounts payable and accrued liabilities
Income and other taxes payable
Dividends payable
Advance billings and customer deposits
Provisions
Current maturities of long-term debt
Non-current liabilities
Provisions
Long-term debt
Other long-term liabilities
Deferred income taxes
Liabilities
Owners’ equity
Common equity
3,806
3,499
351
10,795
707
1,944
342
9,055
931
1,936
13,797
12,264
17,603
15,763
7,678
$
25,281
7,454
$
23,217
45
condensed interim consolidated statements of cash flows
(unaudited)
Three months
2015
2014
Periods ended March 31 (millions)
OPERATING ACTIVITIES
Net income
Adjustments to reconcile net income to cash provided by
operating activities:
Depreciation and amortization
Deferred income taxes
Share-based compensation expense
Net employee defined benefit plans expense
Employer contributions to employee defined benefit plans
Other
Net change in non-cash operating working capital
$
Cash provided by operating activities
415
$
377
456
(73)
(23)
28
(27)
(4)
(54)
463
19
16
22
(29)
(22)
(248)
718
598
INVESTING ACTIVITIES
Cash payments for capital assets, excluding spectrum licences
Cash payments for spectrum licences deposits
Cash payments for acquisitions and related investments
Real estate joint ventures advances and contributions
Real estate joint venture receipts
Proceeds on dispositions
Other
(613)
(302)
(4)
(8)
1
5
(5)
(548)
(229)
(37)
(14)
—
5
(4)
Cash used by investing activities
(926)
(827)
FINANCING ACTIVITIES
Dividends paid to holders of Common Shares
Purchase of Common Shares for cancellation
Issuance and repayment of short-term borrowings
Long-term debt issued
Redemptions and repayment of long-term debt
Other
(244)
(156)
—
2,847
(711)
(9)
(222)
(159)
(300)
761
(135)
—
Cash provided (used) by financing activities
1,727
(55)
CASH POSITION
Increase (decrease) in cash and temporary investments, net
Cash and temporary investments, net, beginning of period
1,519
60
(284)
336
Cash and temporary investments, net, end of period
$
1,579
$
52
SUPPLEMENTAL DISCLOSURE OF OPERATING
CASH FLOWS
Interest paid
$
(85)
$
(61)
Interest received
$
—
$
1
Income taxes paid, net
$
(115)
$
(224)
46
segmented information
Three-month periods ended
March 31 (millions)
Operating revenues
External revenue
Intersegment revenue
(unaudited)
Wireless
2015
$
Wireline
2015
2014
$
$
$
1,356
43
1,399
$
1,340
41
1,381
$
—
(57)
(57)
$
—
(54)
(54)
$
3,028
—
3,028
$
2,895
—
2,895
EBITDA 1
$
744
$
690
$
391
$
387
$
—
$
—
$
1,135
$
1,077
CAPEX, excluding spectrum
licences 2
$
248
$
165
$
387
$
331
$
—
$
—
$
635
$
496
EBITDA less CAPEX, excluding
spectrum licences
$
496
$
525
$
4
$
56
$
—
$
—
$
500
$
581
$
3,028
1,284
609
1,135
347
109
679
117
562
$
2,895
1,222
596
1,077
346
117
614
102
512
$
Operating revenues (above)
Goods and services purchased
Employee benefits expense
EBITDA (above)
Depreciation
Amortization
Operating income
Financing costs
Income before income taxes
1
2
$
2014
1,555
13
1,568
$
$
Consolidated
2015
2014
1,672
14
1,686
$
$
Eliminations
2015
2014
$
$
$
Earnings before interest, income taxes, depreciation and amortization (EBITDA) does not have any standardized meaning prescribed by IFRS-IASB and is
therefore unlikely to be comparable to similar measures presented by other issuers; we define EBITDA as operating revenues less goods and services
purchased and employee benefits expense. We have issued guidance on, and report, EBITDA because it is a key measure that management uses to
evaluate the performance of our business and is also utilized in measuring compliance with certain debt covenants.
Total capital expenditures (CAPEX).
47
News Release
TELUS Corporation
NOTICE OF CASH DIVIDEND
NOTICE IS HEREBY GIVEN that the Board of Directors has declared a quarterly
dividend of forty-two cents ($0.42) Canadian per share on the issued and outstanding
Common shares payable on July 2, 2015 to holders of record at the close of business
on June 10, 2015.
By order of the Board
Monique Mercier
EVP – Corporate Affairs, Chief Legal Officer and Corporate Secretary
Vancouver, British Columbia
May 6, 2015
Contact: Investor Relations
1-800-667-4871
[email protected]
-30-
48

![[WCR-300S] How to Change the Wireless Network Name(SSID)](http://cdn1.abcdocz.com/store/data/000232989_1-c13ffbaf9a88e423608ef46454e68925-250x500.png)
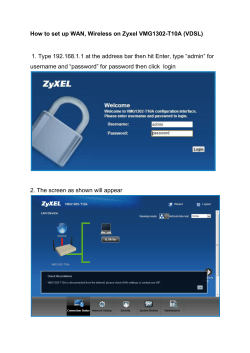
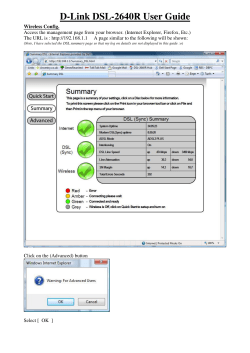


© Copyright 2026