
Regional air quality impacts of hydraulic fracturing and shale natural
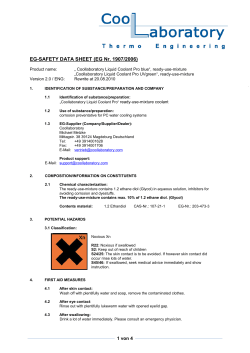
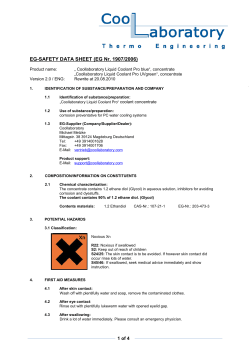
Atmospheric Environment 110 (2015) 144e150
Contents lists available at ScienceDirect
Atmospheric Environment
journal homepage: www.elsevier.com/locate/atmosenv
Regional air quality impacts of hydraulic fracturing and shale natural
gas activity: Evidence from ambient VOC observations
Timothy Vinciguerra a, Simon Yao a, Joseph Dadzie a, Alexa Chittams a, Thomas Deskins a,
Sheryl Ehrman a, *, Russell R. Dickerson b
a
b
Department of Chemical and Biomolecular Engineering, University of Maryland, College Park, MD 20742, USA
Department of Atmospheric and Oceanic Science, University of Maryland, College Park, MD 20742, USA
h i g h l i g h t s
Ambient VOC measurements from EPA PAMS sites were analyzed.
Ethane concentrations have increased recently in the Baltimore/Washington area.
Shale natural gas operation emissions appear to be transported downwind.
a r t i c l e i n f o
a b s t r a c t
Article history:
Received 20 October 2014
Received in revised form
23 March 2015
Accepted 25 March 2015
Available online 26 March 2015
Over the past decade, concentrations of many anthropogenic pollutants have been successfully reduced,
improving air quality. However, a new influx of emissions associated with hydraulic fracturing and shale
natural gas operations could be counteracting some of these benefits. Using hourly measurements from
Photochemical Assessment Monitoring Stations (PAMS) in the Baltimore, MD and Washington, DC areas,
we observed that following a period of decline, daytime ethane concentrations have increased significantly since 2010, growing from ~7% of total measured nonmethane organic carbon to ~15% in 2013. This
trend appears to be linked with the rapidly increasing natural gas production in upwind, neighboring
states, especially Pennsylvania and West Virginia. Ethane concentrations failed to display this trend at a
PAMS site outside of Atlanta, GA, a region without new widespread natural gas operations.
© 2015 Elsevier Ltd. All rights reserved.
Keywords:
Hydraulic fracturing
Ethane
Natural gas
1. Introduction
As global energy demands continue to grow, new and alternative energy sources have been sought out. One emerging energy
source, natural gas, is gaining favor over coal because of lower
emissions of CO2 and significantly lower nitrogen oxides (NOx) and
sulfur oxides (SOx) (deGouw et al., 2014; EPA, 2014a). In the United
States, natural gas production has quickly increased and its cost has
dropped, making it an economically viable energy source (EIA,
2014a). Because of these advantages, natural gas usage is expected to grow rapidly and displace coal as the second largest
source of energy by 2025 (ExxonMobil, 2014).
* Corresponding author.
E-mail addresses: [email protected] (T. Vinciguerra), [email protected]
(S. Yao), [email protected] (J. Dadzie), [email protected] (A. Chittams),
[email protected] (T. Deskins), [email protected] (S. Ehrman), russ@atmos.
umd.edu (R.R. Dickerson).
http://dx.doi.org/10.1016/j.atmosenv.2015.03.056
1352-2310/© 2015 Elsevier Ltd. All rights reserved.
An increasingly popular method of obtaining natural gas resources is through the combination of horizontal drilling to allow
access a large amount of the shale, followed by hydraulic fracturing,
where a mixture of water, sand, and chemical additives is pumped
at high pressure to free and extract natural gas trapped within shale
layers (USGS, 2014). According to the U.S. Energy Information
Agency (EIA) the amount of natural gas obtained from shale gas
wells in the United States has tripled between 2009 and 2012 (EIA,
2014b), providing more than a third of total U.S. natural gas production by 2012 (EIA, 2014c). The major shale plays which account
for more than 60% of total U.S. shale gas production since 2010 are
the Barnett in Texas, the Haynesville in Texas and Louisiana, and the
Marcellus, centered in Pennsylvania and West Virginia where about
a third of natural gas production since 2013 has occurred (EIA,
2014d).
Although its composition can vary due to geographical location,
shale gas is predominately, and sometimes almost entirely,
methane, a greenhouse gas with climate implications (Bullin and
T. Vinciguerra et al. / Atmospheric Environment 110 (2015) 144e150
Krouskop, 2009). Compared to coal, combustion of natural gas for
generating electricity produces only about half the CO2 and reduces
climate forcing, but only if less than about 3% of the methane escapes into the atmosphere (Howarth et al., 2011; Alvarez et al.,
2012). Several studies have been conducted to determine the total leakage-based emissions from natural gas operations; estimates
range from as low as 0.42% up to 17.3% (Allen et al., 2013; Caulton
et al., 2014; Howarth et al., 2011; Karion et al., 2013; Kirchgessner
et al., 1997; Petron et al., 2012; Pieschl et al., 2013; Schneising
et al., 2014). In 2013 the Intergovernmental Panel on Climate
Change increased the 100 year global warming potential of
methane to be 28 to 34 times greater than that of CO2 (IPCC, 2013).
Thus, it is vital to quantify the leakage rate, and apply necessary
control technologies to curtail emissions.
In addition to climate impacts from methane emissions, air
quality can also be affected by natural gas operations and the
numerous emission sources associated with the drilling, hydraulic
fracturing, and production processes and associated equipment. In
the Mid-Atlantic States, the Marcellus shale in the Appalachian
basin is estimated to contain 4 1012 m3 of unproved technically
recoverable shale gas (EIA, 2012). A modeling effort for this shale
play by Roy et al. (2014) considered numerous emission sources
such as completion venting, a process in which fluid and debris are
cleared from the well, and the natural gas and diesel engines
powering various trucks, compressors, drilling rigs, and pumps.
This study predicted that for the year 2020, Marcellus shale activities would, on average, account for 12% of the total NOx and volatile
organic compound (VOC) emissions and 14% of the total particulate
matter (PM) in the region, and these emissions could complicate
attainment of PM and ozone standards.
Along with these standard emissions associated with drilling
and fracturing a well, there are other sources related to hydraulic
fracturing to consider. When liquid unloadings are performed to
clear a well bore of accumulated liquids for increased production,
methane can be released to the atmosphere, and most of the
methane emitted in these instances comes from a small fraction of
wells which are frequently unloaded (Allen et al., 2014). Large
emissions of VOCs have been observed on oil and gas well pads
because of leaks from dehydrators, storage tanks, compressor stations, and pneumatic devices and pumps, as well as evaporation
and flow back pond water (Warneke et al., 2014). Another nonnegligible source of methane emissions are abandoned wells e
those no longer active in the natural gas production process. There
are an estimated 300,000e500,000 abandoned wells in Pennsylvania, and it has been suggested that they could account for up to
7% of Pennsylvania's 2010 anthropogenic methane emissions (Kang
et al., 2014).
While the consequences for localized pollution from emissions
associated with hydraulic fracturing processes are certainly of significance, the transport of these emissions to downwind regions is
also a major issue, especially for major metropolitan areas already
struggling to attain current standards (Kemball-Cook et al., 2010).
Although the State of Maryland does not currently have extensive
shale natural gas operations within its borders (MDE, 2015), the
neighboring states including Pennsylvania and West Virginia house
thousands of wells responsible for a tenfold increase in natural gas
production volumes from 2009 to 2013 (PADEP, 2014). Fig. 1 shows
counties in neighboring states where new unconventional natural
gas wells were drilled from 2005 through 2012, the most recent
year for which well production information is available for all four
states, and is also indicative of regions where hydraulic fracturing
occurs.
Ethane emissions in the Northern Hemisphere are mainly
anthropogenic with about 70% originating from fossil fuels (mostly
evaporative), and biomass burning and biofuel use making up the
145
remainder of emission sources (Simpson et al., 2012). In northwestern Pennsylvania with nearby areas of oil and gas production,
Pekney et al. (2014) observed average ethane concentrations of 9.2,
10.3, and 15.9 ppb. These concentrations are well above the ~1 ppb
Northern Hemisphere background concentration of ethane
(Rinsland et al., 1987; Rudolph et al., 1996) and indicate the local
impact of emissions from oil and gas wells. The transport of
emissions by prevailing winds is a well-documented occurrence
affecting Maryland and other East coast states (Hains et al., 2008;
He et al., 2013a, 2013b, 2014; Ryan et al., 1998; Taubman et al.,
2004, 2006). A back-trajectory investigation by Taubman et al.
(2006) found that the majority of wind trajectories arriving in the
Mid-Atlantic U.S. passed through the regions where hydraulic
fracturing now occurs. Wind data collected at the wind profiler in
Beltsville, MD also show a high frequency of winds arriving from
the northwest and west (Fig. 2). Additional wind roses are available
in the supporting information (Figs. S1eS3). In this paper, we
quantify how observed concentrations of ethane monitored in
Baltimore, MD and Washington, DC, have risen as a likely result of
the development of the Marcellus Shale Play.
2. Methods
The U.S. Environmental Protection Agency (EPA) has established
numerous sites for monitoring pollutants. Following the 1990 Clean
Air Act Amendments, Photochemical Assessment Monitoring Stations (PAMS) were created to monitor ozone, its precursors of NOx
and VOCs, and surface meteorology in regions of ozone nonattainment (EPA, 2014b). The monitor at Essex, MD was set up to
track emissions for the Baltimore ozone nonattainment area. This is
the monitor closest to the Marcellus shale which provides a historical record of VOC measurements with hourly resolution. During
the summer months of June, July, and August when ozone levels
can often be hazardous to human health, concentrations are
recorded every hour, providing a rich dataset for analysis. A suite of
56 VOCs are measured by GC-FID and calibrated weekly to maintain
analytical precision to within ± 5% (Acefaw Belay, MDE, personal
communication). Although methane is not included, ethane is
measured and can be used as a tracer for fugitive natural gas production emissions, as the ethane recovered from natural gas production is separated from the methane ultimately distributed
commercially. The composition varies geographically, but ethane
makes up a significant portion (3e16%) of the Marcellus shale gas
(Bullin and Krouskop, 2009). Methane, with an atmospheric
photochemical lifetime of about a decade, is relatively well mixed
in the troposphere. Ethane, with a photochemical lifetime of
several weeks (Blake and Blake, 2003), is essentially inert with
respect to photochemical loss on time scales of transport from the
sources to the monitors (1e2 days), but still shows strong spatial
and temporal gradients, making it a useful tracer.
In addition to the Essex, MD location, another Mid-Atlantic
PAMS location with similar surroundings and conditions was
considered: McMillan Reservoir in Washington, DC. Like Maryland,
Washington, DC does not currently have hydraulic fracturing operations within its borders, but could easily be affected by transported emissions from neighboring states. Measurements from
1996 to 2013 are shown for these locations. A site outside the city of
Atlanta, Georgia in Rockdale County was selected to serve as a
control environment, as its air quality is influenced by urban
emissions from heavy motor vehicle traffic and natural gas delivery,
as well as biogenic emissions, similar to the Baltimore/Washington
region, but Georgia and nearby states do not have extensive natural
gas production. At this location, measurements from 1996 to 2013
are also shown.
As the boundary layer collapses following sunset, the
146
T. Vinciguerra et al. / Atmospheric Environment 110 (2015) 144e150
Fig. 1. Number of total unconventional natural gas wells drilled by county in the Marcellus shale region from 2005 through 2012. The northern and southeast counties of
Pennsylvania contain the most newly-drilled wells. Essex, MD and McMillan Reservoir (DC) monitor locations are also shown.
Daytime TNMOC at Essex, MD
200
Total NMOC (ppbC)
175
150
125
100
75
50
19
9
19 6
9
19 7
98
19
9
20 9
00
20
0
20 1
0
20 2
0
20 3
0
20 4
05
20
0
20 6
07
20
0
20 8
09
20
1
20 0
1
20 1
12
20
13
25
Fig. 2. Wind rose showing wind velocity frequencies and direction at 503 m AGL
provided by the wind profiler at Beltsville, MD. Wind velocities are taken from daytime
hours (10am e 7pm) during the month of July in years 2012e2014. Winds are predominantly from the west where natural gas operations have increased in recent years.
concentrations of ethane increase due to the change in mixing
volume. Because of this strong dependency on boundary layer
height, only the concentrations during local daytime hours from
10am to 7pm were considered since the boundary layer depth
should show little long-term trend. For each site, each year
analyzed in this study contains at least 200 concentration observations from at least two different months, with the exception of
June only for 2010 and August only for 2013 at Rockdale County.
3. Results and discussion
3.1. Trend analysis
The historical decline of total non-methane organic compounds
(TNMOC) at Essex, MD (Fig. 3) shows that strategies to curtail VOC
emissions from sources such as solvent usage, gasoline storage and
Fig. 3. Daytime TNMOC concentrations at Essex, MD from 1996 to 2013 are shown by
box and whisker plots. The box provides the 25th and 75th percentiles, with the
median represented by the red bar, and the whiskers extend to the 10th and 90th
percentiles. (For interpretation of the references to colour in this figure legend, the
reader is referred to the web version of this article.)
distribution, and other industrial processes have been successful
(MDE, 2011; EPA, 2015). In Fig. 4a, Essex, MD ethane concentrations
followed this same general downward trend continuing for about a
decade beginning in 1996. However, around the same time that
hydraulic fracturing operations began in surrounding states (circa
2009), ethane concentrations stopped decreasing, and were unmistakably increasing by 2012 and 2013 (Fig. 4).
To test for the possibility that ethane is increasing at Essex, MD
because of a local source, the site at McMillan Reservoir in Washington, DC was also considered. Fig. 4b shows an increase in ethane
concentrations at McMillan Reservoir during the most recent years,
despite several years exhibiting a decreasing trend. This new trend
of increased ethane concentrations at more than one location
suggests that several downwind areas could be affected by the
transport of fugitive emissions and other pollutants associated with
natural gas operations.
T. Vinciguerra et al. / Atmospheric Environment 110 (2015) 144e150
Daytime Ethane at McMillan Reservoir
Daytime Ethane at Essex, MD
(a)
10
147
(b)
14
8
Ethane (ppbC)
Ethane (ppbC)
12
6
4
10
8
6
4
2
2
19
9
19 6
9
19 7
9
19 8
9
20 9
0
20 0
01
20
0
20 2
0
20 3
0
20 4
05
20
0
20 6
07
20
0
20 8
0
20 9
1
20 0
11
20
1
20 2
13
19
9
19 6
9
19 7
9
19 8
99
20
0
20 0
0
20 1
0
20 2
0
20 3
0
20 4
0
20 5
0
20 6
07
20
0
20 8
0
20 9
1
20 0
1
20 1
1
20 2
13
0
Daytime Ethane at Rockdale, GA
7
(c)
Ethane (ppbC)
6
5
4
3
2
1
19
9
19 6
9
19 7
98
19
9
20 9
0
20 0
0
20 1
0
20 2
0
20 3
0
20 4
0
20 5
0
20 6
07
20
0
20 8
0
20 9
1
20 0
11
20
1
20 2
13
0
Fig. 4. From 1996 to 2013, hourly daytime ethane concentrations from a) Essex, MD, b) McMillan Reservoir (DC), and c) Rockdale County, GA are presented by box and whisker plots
with the same statistical parameters as Fig. 3.
In contrast (Fig. 4c), ethane concentrations have continued to
trend slightly downward since 1996, and no discernible increasing
trend is evident in the Atlanta region in the more recent years. If
increased ethane concentrations were attributable to sources other
than natural gas production and associated operations, then this
site should show similar increases, but the State of Georgia has no
major hydraulic fracturing activity within its borders or in neighboring states. TNMOC plots for the McMillan and Rockdale sites are
available in the supporting information (Figs. S4 and S6).
Another approach taken was considering how the diurnal cycle
of ethane has shifted at the Essex, MD site. Fig. 5 demonstrates the
departure of concentrations of ethane from a previously established baseline over the most recent years. While there are year-toyear differences in ethane concentrations from 2004 to 2010 shown
in Fig. 4a, the overall trend is nearly flat for the time period. As a
result the concentrations from these years were averaged together
to establish the lowest placed diurnal cycle seen as the (in web
version) blue squares in Fig. 5. The overall concentrations of ethane
have increased annuallye in the past three years the baseline has
increased by 1.1 ppbC. This sudden rise, especially given that
TNMOC is decreasing, is indicative of a rapidly growing emission
source such as natural gas operations.
Finally, the ratio of ethane to TNMOC at Essex, MD was examined and compared to natural gas production in the Marcellus shale
Fig. 5. The diurnal cycle of ethane at Essex, MD showing the geometric mean concentration at each hour. Concentrations of ethane from 2004 to 2010 were averaged to
establish a period unaffected by natural gas operations, and subsequent years show a
continuing departure from this baseline.
148
T. Vinciguerra et al. / Atmospheric Environment 110 (2015) 144e150
10
0.2
8
6
0.15
4
2
0.1
0
0.05
r2=0.82
20
00
20
0
20 1
02
20
03
20
0
20 4
05
20
06
20
07
20
0
20 8
09
20
1
20 0
11
20
12
20
13
Ethane (ppbC)/TNMOC (ppbC)
12
Marcellus Shale Production (Bcf/day)
Ratio of Ethane/TNMOC at Essex, MD
0.25
Fig. 6. The ratio of ethane to TNMOC observed at Essex, MD is shown by box and
whisker plots with the same statistical parameters as Fig. 3. In addition, the production
rates from the Marcellus shale in Pennsylvania and West Virginia are shown in green. A
strong correlation was observed with an r2 value of 0.82. (For interpretation of the
references to colour in this figure legend, the reader is referred to the web version of
this article.)
(Fig. 6). From 2000 to 2007, the median amount of ethane remained
around 7e8% of the total NMOC, but rose quickly after 2010 to
nearly 15% by 2013. The upwind production rates exhibit a similar
rapid increase. For each year, the median production rate from June
through August was compared to the median observation at Essex,
MD during the same months. With r2 ¼ 0.82, a strong correlation
was found between the Essex, MD ethane to total ratio and natural
gas production in the Marcellus shale. Likewise, a positive correlation of r2 ¼ 0.59 was found when daytime ethane concentrations
at Essex, MD from June, July, and August of 2010e2013 were
compared to production rates from the Marcellus shale (Fig. 7).
Additional ratio (Figs. S5 and S7) and correlation (Figs. S8eS10)
plots are available in the supporting information.
3.2. Other measured VOCs at Essex, MD
In both Essex, MD and Washington, DC, the sum of observed
VOC (TNMOC) has generally decreased over the past decades,
leveling off since about 2009 (Figs. 3 and S4). Rockdale County, GA,
has shown no discernable trend (Fig. S6). Propane has shown no
increase in Essex, but has increased in Washington, DC (Figs. S11
and S12). The diversified uses of propane such as cooking, heating, and equipment and vehicular use (EIA, 2015a) might hide slight
increases from upwind natural gas operations. From the limited
measurements of well gas composition available in the public
domain, propane is estimated to make up about 5% of wet Marcellus shale gas (Conder and Lawlor, 2014; Foster, 2013; Pace Global,
2010); the driest reported regional composition was 1% propane
(Bullin and Krouskop, 2009). Only 30% of the shale gas produced in
Pennsylvania since 2010 is wet gas (down from 35% in 2009)
(PADEP, 2014), indicating shale gas propane is much less abundant
as ethane. At the Atlanta site, the ethane to propane ratio is near
unity, much lower than that found in natural gas, reflecting the use
of propane fuel in urban areas (Figs. S13 and S14). The ratio of
ethane to propane in Essex is rising to approach the natural gas
emissions ratio (Fig. S21). Total production of propane and propylene in the East Coast region slightly increased in 2013 (EIA,
2015b), but a production increase at natural gas plants (EIA,
2015c) has been offset by an overall decline from refineries (EIA,
2015d), and thus, industrial emissions are expected to have
remained relatively constant. The Sasol refinery in Baltimore was
taken out of service in July 2007, and this removed source of VOCs
might also hide slight recent increases from upwind sources
(Christopher Wheeling, MDE, personal communication).
Concentrations of n-butane have decreased significantly from
initial values in 1996, but slight increases in 2012 and 2013 were
observed (Fig. S15). Concentrations of n-pentane, isopentane,
ethylene, and benzene have continued to decrease from 1996
(Figs. S16eS19). Isoprene, a dominant VOC from biogenic sources,
shows no trend (Fig. S20).
The ratios of ethane to n-butane, n-pentane, and ethylene were
also investigated (Figs. S22eS24) and demonstrated an increasing
trend from around 2011, similar to what is seen in Fig. 4. Finally, the
ratio of isopentane to n-pentane was evaluated (Fig. S25). Gilman
et al. (2013) showed this ratio to be lower in regions with natural
gas production and greater in urban environments. Essex, MD had a
median ratio of 2.7 from 2000 to 2003, but the median ratio has
since decreased to about 2, indicating an influence of natural gas
production.
3.3. Statistical analysis
2010−2013 Observed Ethane vs. Production
Essex, MD Median Ethane (ppbC)
8
7
6
2010
2011
2012
2013
5
4
3
2
r = 0.59
2
2
4
6
8
Marcellus Shale Prouduction (Bcf/day)
10
Fig. 7. Monthly summer values from 2010 through 2013 of observed daytime ethane
concentrations at Essex, MD vs. Marcellus Shale production. The uncertainty bars
provide the 25th and 75th percentiles of measured ethane during each month.
It is necessary to apply statistical tests for significance. Because
of the lognormal distribution of ethane concentrations, nonparametric tests were performed using the JMP Pro 10.0.2 statistical
software. The Essex, MD PAMS hourly daytime ethane concentrations from 2004 to 2013 were collected and grouped by year for
comparisons. To test for differences between years, the KruskaleWallis test (McBean and Rovers, 1998) was used to determine if
daytime ethane concentrations during at least one year were
different from the concentrations during other years. The result
returned a p-value less than 0.0001, indicating at least one of the
years contained significantly different concentrations.
To determine which year(s) had significantly different daytime
ethane concentrations when compared to other years, the SteelDwass post-hoc test (SAS Institute Inc., 2013) was used, assuming
a 95% confidence interval. The results (Table S2) suggest that, in
general, the years of 2005, 2007, 2012, and 2013 had ethane concentrations significantly different from each of the other years.
Looking at Fig. 4a, it can be inferred that the years of 2005 and 2007
had significantly lower ethane concentrations, while 2012 and 2013
have significantly higher concentrations. It is also significant that a
p-value less than 0.0001 was returned when comparing 2013 to
T. Vinciguerra et al. / Atmospheric Environment 110 (2015) 144e150
2012, indicating that ethane concentrations in 2013 were already
significantly greater than they were a year prior.
This procedure was repeated for daytime ethane concentrations
from 2004 to 2013 at the other two sites. At McMillan Reservoir,
ethane concentrations in 2005, 2006, 2007 and 2009 were significantly lower than in the other years, and in 2011, 2012, and 2013
ethane concentrations were significantly greater (Table S4).
McMillan Reservoir observed significant ethane concentration increases in recent years, but unlike Essex, these ethane concentrations have not significantly increased over each passing year. At the
Rockdale County site, ethane concentrations were significantly
lower in 2005, 2006, and 2012 and significantly greater in 2008 and
2011 (Table S6). The shift from significantly greater in 2011 to lower
in 2012 suggests long-term effects are not causing increases in
ethane concentrations at this location. Descriptive statistics for
daytime ethane concentrations from all three sites are also available in the supporting information (Tables S1, S3, and S5).
3.4. Local natural gas sources
The recent increase in ethane concentrations at Essex, MD has
been demonstrated and coincides with the spread of wells promoting increased natural gas production, but it is also important to
rule out other possible local natural gas sources. Landfills and waste
water treatment plants are known sources of methane, but do not
emit ethane (Aydin et al., 2011). Natural gas storage fields exist in
Garrett County, MD (~250 km west of Essex, MD) but there is no
evident recent change in usage (EIA, 2014e), and it is unlikely that
these storage fields have started to degrade so quickly since 2009
(Cleveland, 2004).
The use of compressed natural gas in the transportation sector
was also considered. Only ~0.5% of total Maryland natural gas
consumption is used for vehicles, whose usage peaked in 2006 and
2008, only to decline rapidly thereafter (EIA, 2014f). Additionally,
while other metropolitan areas chose to convert public transportation vehicles to use natural gas, the Maryland Transit Authority instead switched diesel buses to diesel-electric hybrid buses
(MDOT, 2013). The state of Maryland has ten compressed natural
gas fueling stations: seven have been operational prior to 2006, two
recently added stations are located more than 60 km away, and one
was opened in 2012 over 10 km away from the Essex, MD receptor
(DOE, 2014). Although nearby leaks from these stations could be
significant, none of them are in the immediate vicinity of the
monitor.
Finally, fugitive emissions from pipeline leaks were evaluated as
a source responsible for the observed increase in atmospheric
ethane concentration. Information on methane loss for local utility
companies was ambiguous, but Maryland's total natural gas consumption has remained nearly constant from 1997 to 2013 (EIA,
2014e). If fugitive loss rates were constant, fugitive emissions
would also be expected to remain constant during this time period.
4. Conclusion
Recently, ethane concentrations have significantly increased at
Essex, Maryland, and the emissions associated with hydraulic
fracturing operations appear to be the only plausible source for this
trend. This indicates that a substantial fraction of natural gas is
escaping uncombusted, and the signal is detectable hundreds of
kilometers downwind. This effect was also noticed in nearby
Washington, DC, but not outside Atlanta, GA, a city without upwind
hydraulic fracturing. As shale natural gas production continues to
expand, this increasing trend will continue in downwind regions
until more efficient control technologies are applied. Although
ethane is not a criteria pollutant, additional pollutants are likely
149
transported at increasing rates; these could cause ozone and PM to
rise and complicate attainment of air quality standards for major
urban centers downwind. The observed increase in ethane (1.1
ppbC) corresponds to an expected regional increase in methane of
~5 ppb. In future analyses, we will evaluate concentrations of
shorter-lived (e.g., NOx) monitored closer to natural gas operations,
and incorporate back-trajectory analysis and source apportionment
to further evaluate the influence of natural gas operations on
climate and regional air quality.
Acknowledgments
The ambient measurements used in this paper are available
from the U.S. Environmental Protection Agency and can be obtained
from: https://ofmext.epa.gov/AQDMRS/aqdmrs.html. The Marcellus shale production data are available from the U.S. Energy Information Administration and can be obtained from: http://www.eia.
gov/naturalgas/weekly/img/ShaleGas-201406.xlsx. This work was
supported by the Maryland Department of the Environment
(Contract number U00P4400742), the National Aeronautics and
Space Administration's Air Quality Applied Sciences Team (Grant
number NNX12AI18G), and the National Science Foundation (CBET1438400). Wind rose plots provided courtesy of Konstantin Y.
Vinnikovb.
Appendix A. Supplementary data
Supplementary data related to this article can be found at http://
dx.doi.org/10.1016/j.atmosenv.2015.03.056.
References
Allen, D.T., Torres, V.M., Thomas, J., Sullivan, D.W., Harrison, M., Hendler, A.,
Herndon, S.C., Kolb, C.E., Fraser, M.P., Hill, A.D., Lamb, B.K., Miskimins, J.,
Sawyer, R.F., Seinfeld, J.H., 2013. Measurements of methane emissions at natural
gas production sites in the United States. Proc. Natl. Acad. Sci. U. S. A. 110 (44),
17768e17773. http://dx.doi.org/10.1073/pnas.1304880110.
Allen, D.T., Sullivan, D.W., Zavala-Araiza, D., Pacsi, A.P., Harrison, M., Keen, K.,
Fraser, M.P., Hill, A.D., Lamb, B.K., Sawyer, R.F., Seinfeld, J.H., 2014. Methane
emissions from process equipment at natural gas production sites in the United
States: liquid unloadings. Environ. Sci. Technol. http://dx.doi.org/10.1021/
es504016r.
Alvarez, R.A., Pacala, S.W., Winebrake, J.J., Chameides, W.L., Hamburg, S.P., 2012.
Greater focus needed on methane leakage from natural gas infrastructure. Proc.
Natl. Acad. Sci. U. S. A. 109 (17), 6435e6440. http://dx.doi.org/10.1073/
pnas.1202407109.
Aydin, M., Verhulst, K.R., Saltzman, E.S., Battle, M.O., Montzka, S.A., Blake, D.R.,
Tang, Q., Prather, M.J., 2011. Recent decreases in fossil-fuel emissions of ethane
and methane derived from firn air. Nature 476 (7359), 198e201. http://
dx.doi.org/10.1038/nature10352.
Belay, Acefaw, Maryland Department of the Environment, personal communication,
[email protected].
Blake, N.J., Blake, D.R., 2003. Tropospheric chemistry and compositionjVOCs:
overview. Encycl. Atmos. Sci. 2438e2446. http://dx.doi.org/10.1016/B0-12227090-8/00422-X.
Bullin, K.A., Krouskop, P.F., 2009. Compositional variety complicates plans for processing US shale gas. Oil Gas J. 107 (10), 50e57.
Caulton, D.R., Shepson, P.B., Santoro, R.L., Sparks, J.P., Howarth, R.W., Ingraffea, A.R.,
Cambaliza, M.O.L., Sweeney, C., Karion, A., Davis, K.J., Stirm, B.H., Montzka, S.A.,
Miller, B.R., 2014. Toward a better understanding and quantification of methane
emissions from shale gas development. Proc. Natl. Acad. Sci. U. S. A. 111 (17),
6237e6242. http://dx.doi.org/10.1073/pnas.1316546111.
Cleveland, C.J. (Ed.), 2004. Natural Gas Transportation and Storage, Encyclopedia of
Energy. Elsevier Science & Technology.
Conder, M.W., Lawlor, K.A., 2014. Production Characteristics of Liquids-rich
Resource Plays Challenge Facility Design. In: The American Oil and Gas
Reporter.
deGouw, J.A., Parrish, D.D., Frost, G.J., Trainer, M., 2014. Reduced emissions of CO2,
NOx, and SO2 from U.S. power plants owing to switch from coal to natural gas
with combined cycle technology. Earth’s Future 2, 75e82. http://dx.doi.org/
10.1002/2013EF000196.
ExxonMobil, 2014. The Outlook for Energy: a View to 2040.
Foster, J., 2013. Can Shale Gale Save the Naphtha Crackers? Platts. http://www.
platts.com/IM.Platts.Content/InsightAnalysis/IndustrySolutionPapers/
ShaleGasReport13.pdp (accessed 12.03.15.).
150
T. Vinciguerra et al. / Atmospheric Environment 110 (2015) 144e150
Gilman, J.B., Lerner, B.M., Kuster, W.C., de Gouw, J.A., 2013. Source signature of
volatile organic compounds from oil and natural gas operations in Northeastern
Colorado. Environ. Sci. Technol. 47, 1297e1305. http://dx.doi.org/10.1021/
es304119a.
Hains, J.C., Taubman, B.F., Thompson, A.M., Stehr, J.W., Marufu, L.T., Doddridge, B.,
Dickerson, R.R., 2008. Origins of chemical pollution derived from Mid-Atlantic
aircraft profiles using a clustering technique. Atmos. Environ. 42 (8),
1727e1741. http://dx.doi.org/10.1016/j.atmosenv.2007.11.052.
He, H., Hembeck, L., Hosley, K.M., Canty, T.P., Salawitch, R.J., Dickerson, R.R., 2013a.
High ozone concentrations on hot days: the role of electric power demand and
NOx emissions. Geophys. Res. Lett. 40 (19), 5291e5294. http://dx.doi.org/
10.1002/grl.50967.
He, H., Stehr, J.W., Hains, J.C., Krask, D.J., Doddridge, B.G., Vinnikov, K.Y., Canty, T.P.,
Hosley, K.M., Salawitch, R.J., Worden, H.M., Dickerson, R.R., 2013b. Trends in
emissions and concentrations of air pollutants in the lower troposphere in the
Baltimore/Washington airshed from 1997 to 2011. Atmos. Chem. Phys. 13 (15),
7859e7874. http://dx.doi.org/10.5194/acp-13-7859-2013.
He, H., Loughner, C.P., Stehr, J.W., Arkinson, H.L., Brent, L.C., Follette-Cook, M.B.,
Tzortziou, M.A., Pickering, K.E., Thompson, A.M., Martins, D.K., Diskin, G.S.,
Anderson, B.E., Crawford, J.H., Weinheimer, A.J., Lee, P., Hains, J.C.,
Dickerson, R.R., 2014. An elevated reservoir of air pollutants over the MidAtlantic States during the 2011 DISCOVER-AQ campaign: airborne measurements and numerical simulations. Atmos. Environ. 85, 18e30. http://dx.doi.org/
10.1016/j.atmosenv.2013.11.039.
Howarth, R.W., Santoro, R., Ingraffea, A., 2011. Methane and the greenhouse-gas
footprint of natural gas from shale formations. Clim. Change 106 (4),
679e690. http://dx.doi.org/10.1007/s10584-011-0061-5.
Intergovernmental Panel on Climate Change, 2013. IPCC Fifth Assessment Report
(AR5). Working Group 1, the Physical Science Basis.
Kang, M., Kanno, C.M., Reid, M.C., Zhang, X., Mauzerall, D.L., Celia, M.A., Chen, Y.,
Onstott, T.C., 2014. Direct measurements of methane emissions from abandoned oil and gas wells in Pennsylvania. Proc. Natl. Acad. Sci. U. S. A. http://
dx.doi.org/10.1073/pnas.1408315111.
Karion, A., Sweeney, C., Petron, G., Frost, G., Hardesty, R.M., Kofler, J., Miller, B.R.,
Newberger, T., Wolter, S., Banta, R., Brewer, A., Dlugokencky, E., Lang, P.,
Montzka, S.A., Schnell, R., Tans, P., Trainer, M., Zamora, R., Conley, S., 2013.
Methane emissions estimate from airborne measurements over a western
United States natural gas field. Geophys. Res. Lett. 40 (16), 4393e4397. http://
dx.doi.org/10.1002/grl.50811.
Kemball-Cook, S., Bar-Ilan, A., Grant, J., Parker, L., Jung, J., Santamaria, W.,
Mathews, J., Yarwood, G., 2010. Ozone impacts of natural gas development in
the Haynesville shale. Environ. Sci. Technol. 44, 9357e9363. http://dx.doi.org/
10.1021/es1021137.
Kirchgessner, D., Lott, R., Cowgill, R., Harrison, M., Shires, T., 1997. Estimate of
methane emissions from the US natural gas industry. Chemosphere 35 (6),
1365e1390. http://dx.doi.org/10.1016/S0045-6535(97)00236-1.
Maryland Department of the Environment, 2011. State of Maryland 8-Hour Ozone
Reasonably Available Control Technology (RACT) State Implementation Plan.
Maryland Department of the Environment, 2015. Proposed Action on Regulations e
26.19.01 oil and Gas exploration and production. Md. Regist. 42 (1), 94e116.
Maryland Department of Transportation, 2013. Consolidated Transportation Program: 2013 State Report on Transportation, FY 2013e2018.
McBean, E.A., Rovers, F.A., 1998. Statistical Procedures for Analysis of Environmental
Monitoring Data and Risk Assessment. Prentice Hall, Upper Saddle River, N. J.
Pace Global, 2010. NiSource Gas Transmission and Storage Presentation to
WVONGA Spring Meeting. Referenced in: Weisman, C. (2013) The US Shale Oil
& Gas Revolution, Groundwater & Environmental Services, Inc. http://www.
atlantapipeliners.com/wp-content/uploads/2012/09/2013_03_11-The-USShale-Oil-and-Gas-Revolution.pdf (accessed 12.03.15.).
Peischl, J., Ryerson, T.B., Brioude, J., Aikin, K.C., Andrews, A.E., Atlas, E., Blake, D.,
Daube, B.C., de Gouw, J.A., Dlugokencky, E., Frost, G.J., Gentner, D.R., Gilman, J.B.,
Goldstein, A.H., Harley, R.A., Holloway, J.S., Kofler, J., Kuster, W.C., Lang, P.M.,
Novelli, P.C., Santoni, G.W., Trainer, M., Wofsy, S.C., Parrish, D.D., 2013. Quantifying sources of methane using light alkanes in the Los Angeles basin, California. J. Geophys. Research-Atmospheres 118 (10), 4974e4990. http://dx.doi.org/
10.1002/jgrd.50413.
Pekney, N.J., Veloski, G., Tamilia, J., Rupp, E., Wetzel, A., 2014. Measurement of atmospheric pollutants associated with oil and natural gas exploration and production activity in Pennsylvania's Allegheny National Forest. J. Air & Waste
Manag.
Assoc.
64
(9),
1062e1072.
http://dx.doi.org/10.1080/
10962247.2014.897270.
Pennsylvania Department of Environmental Protection, 2014. PA DEP Oil & Gas
Reporting Website: Production Reports by County. https://www.
paoilandgasreporting.state.pa.us/publicreports/Modules/Production/
ProductionByCounty.aspx (accessed 24.09.14.).
Petron, G., Frost, G., Miller, B.R., Hirsch, A.I., Montzka, S.A., Karion, A., Trainer, M.,
Sweeney, C., Andrews, A.E., Miller, L., Kofler, J., Bar-Ilan, A., Dlugokencky, E.J.,
Patrick, L., Moore Jr., C.T., Ryerson, T.B., Siso, C., Kolodzey, W., Lang, P.M.,
Conway, T., Novelli, P., Masarie, K., Hall, B., Guenther, D., Kitzis, D., Miller, J.,
Welsh, D., Wolfe, D., Neff, W., Tans, P., 2012. Hydrocarbon emissions characterization in the Colorado Front Range: a pilot study. J. Geophys. Research-Atmospheres 117. http://dx.doi.org/10.1029/2011JD016360.
Rinsland, C.P., Zander, R., Farmer, C.B., Norton, R.H., Russell, J.M., 1987. Concentrations of ethane (C2H6) in the lower stratosphere and upper troposphere and
acetylene (C2H2) in the upper troposphere deduced from atmospheric trace
molecule spectroscopy/Spacelab 3 spectra. J. Geophys. Research-Atmospheres
92 (D10), 11951e11964. http://dx.doi.org/10.1029/JD092iD10p11951.
Roy, A.A., Adams, P.J., Robinson, A.L., 2014. Air pollutant emissions from the
development, production, and processing of Marcellus Shale natural gas. J. Air &
Waste Manage. Assoc. 64 (1), 19e37.
Ryan, W.F., Doddridge, B.G., Dickerson, R.R., Morales, R.M., Hallock, K.A.,
Roberts, P.T., Blumenthal, D.L., Anderson, J.A., Civerolo, K.L., 1998. Pollutant
transport during a regional O3 episode in the mid-Atlantic states. J. Air & Waste
Manage. Assoc. 48 (9), 786e797.
Rudolph, J., Koppmann, R., Plass-Dulmer, C., 1996. The budgets of ethane and tetrachroloethane: Is there evidence for an impact of reactions with chlorine
atoms in the troposphere? Atmos. Environ. 30 (10e11), 1887e1894. http://
dx.doi.org/10.1016/1352-2310(95)00385-1.
SAS Institute Inc, 2013. JMP® 11 Basic Analysis.
Schneising, O., Burrows, J.P., Dickerson, R.R., Buchwitz, M., Reuter, M.,
Bovensmann, H., 2014. Remote sensing of fugitive methane emissions from oil
and gas production in North American tight geologic formations. Earth's Future.
Simpson, I.J., Andersen, M.P.S., Meinardi, S., Bruhwiler, L., Blake, N.J., Helmig, D.,
Rowland, F.S., Blake, D.R., 2012. Long-term decline of global atmospheric ethane
concentrations and implications for methane. Nature 488, 490e494. http://
dx.doi.org/10.1038/nature11342.
Taubman, B.F., Marufu, L.T., Piety, C.A., Doddridge, B.G., Stehr, J.W., Dickerson, R.R.,
2004. Airborne characterization of the chemical, optical, and meteorological
properties, and origins of a combined ozone/haze episode over the eastern U.S.
J. Atmos. Sci. 61 (14), 1781e1793.
Taubman, B.F., Hains, J.C., Thompson, A.M., Marufu, L.T., Doddridge, B.G., Stehr, J.W.,
Piety, C.A., Dickerson, R.R., 2006. Aircraft vertical profiles of trace gas and
aerosol pollution over the mid-Atlantic United States: statistics and meteorological cluster analysis. J. Geophys. Research-Atmospheres 111 (D10). http://
dx.doi.org/10.1029/2005JD006196.
U.S. Department of Energy, 2014. Alternative Fuels Data Center: Data Downloads.
http://www.afdc.energy.gov/data_download (accessed 24.09.14.).
U.S. Energy Information Administration, 2012. Annual Energy Outlook 2012 Early
Release Overview.
U.S. Energy Information Administration, 2014a. Annual Energy Outlook 2014.
U.S. Energy Information Administration, 2014b. Shale Gas Production. http://www.
eia.gov/dnav/ng/ng_prod_shalegas_s1_a.htm (accessed 24.09.14.).
U.S. Energy Information Administration, 2014c. U.S. Natural Gas Gross Withdrawals
and Production. http://www.eia.gov/dnav/ng/ng_prod_sum_dcu_NUS_a.htm
(accessed 24.09.14.).
U.S. Energy Information Administration, 2014d. Natural Gas Weekly Update. http://
www.eia.gov/naturalgas/weekly/ (accessed 24.09.14.).
U.S. Energy Information Administration, 2014e. Underground Natural Gas Storage
Capacity. http://www.eia.gov/dnav/ng/ng_stor_cap_dcu_SMD_a.htm (accessed
22.12.14.).
U.S. Energy Information Administration, 2014f. Natural Gas Consumption by End
Use. http://www.eia.gov/dnav/ng/NG_CONS_SUM_DCU_SMD_A.htm (accessed
24.09.14.).
U.S. Energy Information Administration, 2015a. Propane Explained: Use of Propane.
http://www.eia.gov/energyexplained/index.cfm?page¼propane_use (accessed
07.01.15.).
U.S. Energy Information Administration, 2015b. 4-Week Avg East Coast (PADD 1)
Refiner, Blender, and Gas Plant Net Production of Propane and Propylene.
http://www.eia.gov/dnav/pet/hist/LeafHandler.ashx?
n¼PET&s¼WPRNPP12&f¼4 (accessed 12.03.15.).
U.S. Energy Information Administration, 2015c. East Coast (PADD 1) Gas Plant
Production of Propane and Propylene. http://www.eia.gov/dnav/pet/hist/
LeafHandler.ashx?n¼PET&s¼MPRFPP11&f¼M (accessed 12.03.15.).
U.S. Energy Information Administration, 2015d. East Coast (PADD 1) Refinery Net
Production of Propane and Propylene. http://www.eia.gov/dnav/pet/hist/
LeafHandler.ashx?n¼PET&s¼MPRRX_R10_1&f¼M (accessed 12.03.15.).
U.S. Environmental Protection Agency, 2014a. Air Emissions. http://www.epa.gov/
cleanenergy/energy-and-you/affect/air-emissions.html (accessed 24.09.14.).
U.S. Environmental Protection Agency, 2015. National Emissions Inventory (NEI) Air
Pollutant Emissions Trends Data. http://www.epa.gov/ttnchie1/trends/
(accessed 11.01.15.).
U.S. Environmental Protection Agency, 2014b. Photochemical Assessment Monitoring
Stations
(PAMS),
http://www.epa.gov/ttnamti1/pamsmain.html.
(accessed 24.09.14.).
U.S. Geological Survey, 2014. Hydraulic Fracturing. http://energy.usgs.gov/OilGas/
UnconventionalOilGas/HydraulicFracturing.aspx (accessed 24.09.14.).
tron, G., Kofler, J., Zahn, A.,
Warneke, C., Geiger, F., Edwards, P.M., Dube, W., Pe
Brown, S.S., Graus, M., Gilman, J.B., Lerner, B.M., Peischl, J., Ryerson, T.B., de
Gouw, J.A., Roberts, J.M., 2014. Volatile organic compound emissions from the
oil and natural gas industry in the Uintah Basin, Utah: oil and gas well pad
emissions compared to ambient air composition. Atmos. Chem. Phys. 14,
10977e10988. http://dx.doi.org/10.5194/acp-14-10977-2014.
Wheeling, Christopher, Maryland Department of the Environment, personal
communication, [email protected].


© Copyright 2026