
Selecting and Documenting Mortality Assumptions for Pensions
A PUBLIC POLICY PRAC TICE NOTE Selecting and Documenting Mortality Assumptions for Pensions Revised June 2015 American Academy of Actuaries Pension Committee A PUBLIC POLICY PRACTICE NOTE Selecting and Documenting Mortality Assumptions for Pensions1 Revised June 2015 Developed by the Pension Committee of the American Academy of Actuaries The American Academy of Actuaries is an 18,500+ member professional association whose mission is to serve the public and the U.S. actuarial profession. The Academy assists public policymakers on all levels by providing leadership, objective expertise, and actuarial advice on risk and financial security issues. The Academy also sets qualification, practice, and professionalism standards for actuaries in the United States. 1 Includes other post-retirement benefit plans. PENSION COMMITTEE PRACTICE NOTE 2015 2015 Pension Committee Mike Pollack, Chairperson Ellen Kleinstuber, Vice Chairperson Margaret Berger Bruce Cadenhead Charles Clark Timothy Geddes William Hallmark Scott Hittner Jeffrey Litwin Tonya Manning Timothy Marnell Gerard Mingione A. Donald Morgan Keith Nichols Nadine Orloff Andrew Peterson Steven Rabinowitz Maria Sarli Mitchell Serota James Shake Joshua Shapiro Mark Spangrud Lane West Carol Zimmerman 1850 M Street N.W., Suite 300 Washington, D.C. 20036-5805 © 2015 American Academy of Actuaries. All rights reserved. PENSION COMMITTEE PRACTICE NOTE 2015 TABLE OF CONTENTS Introduction ..........................................................................................................................1 I. Mortality and Mortality Improvement Assumptions ........................................................3 II. Disclosure and Documentation .......................................................................................7 III. Questions and Answers ..................................................................................................9 Appendix 1 Published Mortality Tables and Mortality Improvement Scales ................................25 Appendix 2 Discussion of Experience-Based Mortality and Credibility .......................................36 American Academy of Actuaries www.actuary.org PENSION COMMITTEE PRACTICE NOTE 2015 INTRODUCTION This practice note is not a promulgation of the Actuarial Standards Board, is not an actuarial standard of practice (ASOP) or an interpretation of an ASOP, and is not meant to be a definitive statement as to what constitutes generally accepted practice in the area under discussion. Actuaries are not in any way bound to comply with practice notes or to conform their work to the practices described in practice notes. Events occurring subsequent to the publication of this practice note may make the practices described in the practice note irrelevant or obsolete. This practice note was prepared by the Pension Committee (Committee) of the American Academy of Actuaries (Academy) to provide information to actuaries on current and emerging practices in the selection and documentation of the mortality assumptions for measuring obligations of defined benefit pension plans and other post-retirement benefits plans. The intended users of this practice note are the members of actuarial organizations governed by the ASOPs promulgated by the Actuarial Standards Board. Measurements of defined benefit pension plan obligations include calculations that assign plan costs to time periods, actuarial present value calculations, and estimates of the magnitude of future plan obligations. This practice note does not apply to individual benefit calculations or individual benefit statement estimates. The application of the information contained herein is intended to cover U.S. tax-qualified and non-qualified plans, and governmental and non-governmental plans for which the actuary is subject to ASOP No. 35, Selection of Demographic and Other Noneconomic Assumptions for Measuring Pension Obligations. This practice note may be helpful when setting assumptions, or providing advice on setting assumptions, for funding (where permitted by law), and for financial accounting. In general, this note refers to an actuary selecting assumptions, but also generally refers to an actuary giving advice on selecting assumptions. This practice note does not cover the selection and documentation of investment return assumptions, other economic assumptions, or non-mortality demographic assumptions. Mortality rates that are appropriate for measuring pension obligations are not necessarily appropriate for measuring life insurance or individual annuity contracts. The issues involved in selecting mortality assumptions for life insurance (both individual and group) or individual annuity contracts are not addressed in this practice note. Similar considerations generally apply to selection of mortality rates for pension and postretirement medical valuations, but with some differences that are discussed in this practice note. This practice note is intended to assist actuaries by describing some approaches for selecting and documenting mortality assumptions that the Committee believes could be employed to comply with ASOP No. 35. ASOP No. 4, Measuring Pension Obligations American Academy of Actuaries 1 www.actuary.org PENSION COMMITTEE PRACTICE NOTE 2015 and Determining Pension Plan Costs or Contributions, and ASOP No. 6, Measuring Retiree Group Benefits Obligations and Determining Retiree Group Benefits Program Periodic Costs or Actuarially Determined Contributions, address broader measurement issues for pension and other post-retirement benefit plans and provide guidance for coordinating and integrating the elements of these measurements that are not addressed in this practice note. 2,3,4 This practice note replaces the October 2011 version and has been updated to reflect a new mortality improvement scale (BB) published by the Retirement Plans Experience Committee (RPEC) of the Society of Actuaries in September 2012 and to reflect a new mortality table RP-2014 and mortality improvement scale MP-2014 published by the Society of Actuaries in October 2014 (with the RP-2014 report revised in November 2014). The introduction to the RP-2014 Report states two ultimate objectives of the study that produced both RP-2014 and MP-2014 5: 1. To propose an updated set of mortality assumptions that would supersede both the RP-2000 base tables and mortality projection Scales AA, BB and BB-2D, and 2. To provide new insights into the composition of gender-specific pension mortality by factors such as type of employment (e.g., collar), salary/benefit amount, health status (i.e., healthy or disabled), and duration since event. Actuaries are encouraged to read the publications of the Society of Actuaries concerning pension mortality tables and mortality improvement scales. As of the publication date of this practice note, this material is available at http://www.soa.org/professionalinterests/pension/resources/pen-mortality-resources.aspx. The Committee welcomes any suggested improvements for future updates of this practice note. Suggestions may be sent to the pension policy analyst of the American Academy of Actuaries at 1850 M St. NW, Suite 300, Washington, DC 20036 or by emailing [email protected]. 2 In the event of a conflict between the guidance provided in ASOP No. 4 and the guidance provided in ASOP Nos. 27 and 35, ASOP No. 4 governs. 3 In December 2010, the Actuarial Standards Board (ASB) adopted revisions to Actuarial Standard of Practice No. 41, Actuarial Communications (“ASOP No. 41”). ASOP No. 41 affects the actuary’s responsibility regarding required disclosures concerning assumptions and regarding prescribed assumptions. Actuaries are encouraged to familiarize themselves with the requirements of ASOP No. 41. 4 At the date of this practice note, ASOP Nos. 4, 6, and 35 have been revised and there are new versions that are effective for any actuarial work product with a measurement date on or after December 31, 2014, March 31, 2015, and June 30, 2015, respectively (although earlier compliance is encouraged). This practice note reflects the new provisions of these ASOPs, even though they may not be effective until after this practice note is published. 5 Society of Actuaries, “RP-2014 Mortality Tables Report,” page 5. American Academy of Actuaries 2 www.actuary.org PENSION COMMITTEE PRACTICE NOTE 2015 I. Mortality and Mortality Improvement Assumptions General Requirements of ASOP No. 35 The Actuarial Standards Board (ASB) originally adopted ASOP No. 35 in 1999. The ASOP was revised in September 2007 to be consistent with the other standards providing guidance on measuring pension obligations, again in September 2010, and most recently in September 2014. ASOP No. 35, Section 3.1 provides that an “actuary should use professional judgment to estimate possible future outcomes based on past experience and future expectations and select assumptions based upon application of that professional judgment.” According to Section 3.3.5 of ASOP No. 35, a reasonable assumption is one that: • • • • • Is appropriate for the purpose of the measurement; Reflects the actuary’s professional judgment; Takes into account historical and current demographic data that is relevant as of the measurement date; Reflects the actuary’s estimate of future experience, the actuary’s observation of the estimates inherent in market data (if any), or a combination thereof; and Has no significant bias (i.e., it is not significantly optimistic or pessimistic), except when provisions for adverse deviation or plan provisions that are difficult to measure are included and disclosed or when alternative assumptions are used for the assessment of risk. ASOP No. 35 outlines a general process an actuary should follow for selecting demographic assumptions and generally describes the following in Section 3.3: • • • • • Identify the type of assumption that is appropriate for the specific measurement; Consider the relevant assumption universe (e.g., published studies or tables, credible plan or plan sponsor experience, other studies or reports, relevant information from plan sponsor or other sources about future expectations, etc.) from which a specific assumption may be selected; Consider the assumption format and whether it is appropriate to use different assumptions for different segments of the covered population; Select the specific assumption from the appropriate assumption universe; and Confirm the reasonableness of the selected assumption. An actuary need not follow this entire process at every measurement date for every assumption if, in the actuary’s professional judgment, previously selected assumptions continue to be reasonable (Section 3.3 of ASOP No. 35). Each individual demographic assumption selected by the actuary should satisfy the standard. With respect to any particular measurement, each demographic assumption selected by the actuary should be consistent with the others unless the assumption, considered individually, is not material. American Academy of Actuaries 3 www.actuary.org PENSION COMMITTEE PRACTICE NOTE 2015 ASOP No. 35 applies not just when an actuary selects an assumption, but also when an actuary gives advice on selecting an assumption; in general, this note refers to an actuary selecting assumptions, but also generally refers to when an actuary gives advice on selecting assumptions. In addition, Section 3.17 of ASOP No. 4 provides guidance on the actuary’s responsibility with regard to prescribed assumptions selected by a plan sponsor (such as employer-selected assumptions to comply with Statements of Financial Accounting Standards). Many sections of ASOP Nos. 35 and 4 do not apply to prescribed assumptions set by law (i.e., statutes, regulations, or other legally binding authority), such as Internal Revenue Code Regulation 1.430(h)(3)-1; however, certain disclosures are required for prescribed assumptions set by law as described in Section 4 of ASOP No. 4. Because of the uncertain nature of the items for which assumptions are selected, more than one reasonable assumption may exist for measuring the same contingency, resulting in a range of reasonable assumptions that may be developed both by an individual actuary and across actuarial practice. The actuary may select one reasonable assumption, or may provide results using alternative reasonable assumptions to show the effect of the difference in assumptions. ASOP No. 35, Section 3.10 discusses other considerations when selecting a demographic assumption, including: • • • • • • It may be appropriate to adjust the assumption to provide for adverse deviation or plan provisions that are difficult to measure, as discussed in ASOP No. 4; The actuary should consider the balance between refined assumptions and materiality and is not required to use a particular type of assumption or a more refined assumption when, in the actuary’s professional judgment, such use or selection is not expected to produce materially different results; The actuary should balance refined assumptions and the cost of using the refined assumptions (for example, while actuaries working with small plans may use results of general research to comply with ASOP No. 35, they are not precluded from using relevant plan-specific facts); The combined effect of all nonprescribed assumptions selected by the actuary should be reasonable (for example, if events are not material individually but are material when considered together, the assumptions should reflect these events); Although assumptions should reflect knowledge as of the measurement date, an actuary may (but is not required to) reflect any changes in circumstances after the measurement date; and When the actuary is selecting or giving advice on selecting an assumption, the actuary may incorporate the views of experts, but the assumption selection or advice should reflect the actuary’s professional judgment. General Framework of Mortality Assumptions Selection of a mortality assumption generally involves a two-step process: (1) choosing an appropriate set of base mortality tables, and (2) selection of (past and future) mortality improvement rates. American Academy of Actuaries 4 www.actuary.org PENSION COMMITTEE PRACTICE NOTE 2015 Selecting Mortality and Mortality Improvement Assumptions Section 3.5.3 of ASOP No. 35 provides guidance on the selection of the mortality and mortality improvement assumptions and generally states that the actuary should consider factors such as: • • • Whether to use different assumptions before and after retirement (for example, for some small plans it may be reasonable to assume no mortality before retirement); Whether different assumptions should be used for disabled lives, considering the plan’s definition of disability and/or administration of disability provisions; and Whether assumptions should differ for certain participant subgroups and beneficiaries. The ASOP also states, “the actuary should consider the effect of mortality improvement both prior to and subsequent to the measurement date” and should do the following: • • Adjust mortality rates to reflect mortality improvement before the measurement date; however, the published mortality table without improvement can be used if, in the actuary’s professional judgment, it reflects expected mortality at the measurement date; and Include an assumption as to expected mortality improvement after the measurement date and disclose the assumption, even if the actuary concludes that it is reasonable to assume no future mortality improvement for a particular population; the ASOP notes that an actuary’s uncertainty about the occurrence or magnitude of future mortality improvement does not by itself mean that an assumption of no future mortality improvement is reasonable. When choosing a reasonable mortality assumption, actuaries often reflect published mortality tables (see Appendix 1 for a list of published pension mortality tables), unlike when choosing other demographic assumptions. They may choose to adjust those published mortality tables, however, to reflect various characteristics of the covered group, and to provide for expectations of future mortality improvement (both up to and after the measurement date). If the plan population has sufficient credibility to justify its own mortality table or, in the case of partially credible data, to make an adjustment to a published table to reflect this experience (see Appendix 2), then the use of such a table may also be appropriate. Factors that can be considered in selecting and/or adjusting a base mortality table include: • • • • the demographics of the covered group; the size of the group; the statistical credibility of its experience; and historical mortality improvement from when the experience was collected to the measurement date. American Academy of Actuaries 5 www.actuary.org PENSION COMMITTEE PRACTICE NOTE 2015 A more explicit discussion of these factors can be found in Section III of this practice note. Published Tables Appendix 1 contains descriptions of several pension mortality tables and mortality improvement scales published in the past 25 years. The inclusion of any particular table should not be considered an indication of current best practice. American Academy of Actuaries 6 www.actuary.org PENSION COMMITTEE PRACTICE NOTE 2015 II. Disclosure and Documentation Required disclosures about the mortality assumptions in pension actuarial communications are described in ASOP Nos. 4, 6, 35, and 41, and generally include the following: • • • • • • Specific information about each material assumption that was used in the measurement and whether the assumption represents an estimate of future experience, the actuary’s observation of estimates inherent in market data, or a combination thereof. The information should provide sufficient detail so that another actuary reading the communication can make an assessment about the level and pattern of the assumed rates. The disclosure of the mortality assumption should include a description of the specific provision made for future mortality improvement; if no such provision was made, that also is explicitly disclosed. The actuary should also disclose any explicit adjustment made for adverse deviation as discussed in Section 3.10.1 of ASOP No. 35 or for valuing plan provisions that are difficult to measure as discussed in ASOP No. 4; Identification of the party responsible for each material assumption; where the communication is silent about such responsibility, the actuary who signed the communication will be assumed to have taken responsibility for that assumption; For nonprescribed mortality assumptions, a brief summary of the information and analysis used to select the assumptions that were used for the specific calculation, which may include specific approaches used, sources of external advice, and how past experience and future expectations were considered. The disclosure is provided for situations when the actuary provides advice to another party involved with the selection of the mortality assumption; For assumptions prescribed by law, the applicable law under which the report was prepared, the assumptions that are prescribed by that law and disclosure that the report was prepared in accordance with that law; Discussion of any material changes in the significant assumptions from the previous measurement, including a description of the changes, their general effects, in words or numerically, as appropriate, and for nonprescribed assumptions, a brief explanation of the information and analysis that led to those changes; Discussion of any relevant event that meets the following conditions: - It becomes known to the actuary after the date through which data or other information has been considered in developing the findings included in the report; - It becomes known to the actuary before the actuary’s report is issued; - It may have a material effect on the actuarial findings if it were reflected in the actuarial findings; and - It is impractical to revise the report before it is issued. Also, if the actuary learns of changes to data or other information (on or before the information date) after some findings have been communicated but before the report is completed, the actuary should communicate those changes and their American Academy of Actuaries 7 www.actuary.org PENSION COMMITTEE PRACTICE NOTE 2015 • • • implications to any intended user to whom the actuary has communicated findings. Identification of any prescribed assumptions, including their sources: - Identification of any prescribed assumptions set by another party that significantly conflict with what the actuary judges to be reasonable for the purpose of the measurement (note that for this purpose, a reasonable assumption is not limited to what the actuary would have selected); and - Identification of any prescribed assumptions set by another party that the actuary is unable to evaluate (within the scope of the assignment) for reasonableness. Statement when the actuary relied on other sources and thereby disclaims responsibility for the assumption, including the assumption that was set by another party, the party who set the assumption, the reason the party rather than the actuary set the assumption, and either (i) that the assumption significantly conflicts with what, in the actuary’s professional judgment, would be reasonable for the calculation, or (ii) that the actuary was unable to judge the reasonableness of the assumption without performing a substantial amount of additional work beyond the scope of the assignment and did not do so, or that the actuary was not qualified to judge the reasonableness of the assumption; and Discussion of any deviation from the procedures in ASOP No. 35, including the nature, rationale, and effect of the deviation. Nothing in ASOP No. 35 is intended to require the actuary to disclose confidential information. If the form and content of an actuarial communication is in a prescribed form that does not accommodate these disclosures (such as for a required government form), Section 4.2 of ASOP No. 41 states that the “actuary should make these disclosures in a separate communication (such as a cover letter to the principal), requesting that both communications be disseminated together where practicable.” The actuary also may want to document the assumption selection in internal work papers. This documentation may describe the assumptions selected for the analysis and the rationale for the assumption selection, including the basis for selecting these assumptions, the process used to review them, and the results of any experience or gain/loss analysis; the effect of any special events; and the effect of any assumption changes. American Academy of Actuaries 8 www.actuary.org PENSION COMMITTEE PRACTICE NOTE 2015 III. Questions and Answers Unless otherwise indicated, the following questions and answers relate to selecting a nonprescribed mortality assumption for an uninsured defined benefit pension plan (or other post-retirement benefit plan). As discussed above, “selecting” in this context includes providing advice to a plan sponsor as part of the plan sponsor’s selection of a mortality table and a mortality improvement scale assumption. Q1. What are some of the demographic characteristics that may be considered when selecting a base mortality table? A1. Actuaries will sometimes choose separate tables for different demographic groups or reflect the demographics of the entire covered group in selecting or adjusting a published table and/or published improvement scale. Demographic experience under the plan may be considered if it is fully or partially credible (see Appendix 2). The types of characteristics one might want to consider for mortality adjustments include: • • • • • • • • • Collar (White, Blue) Income Level Gender Occupation Status (Active, Retired, Disabled, Inactive, Beneficiary, etc.) Early vs. normal retirement Country of residence or other more specific geographic location Form of payment Presence of medical coverage As an example, more hazardous occupations and occupations with higher physical job demands may exhibit higher rates of mortality. A list of other factors can be found at: http://www.soa.org/files/research/projects/farm-phase2-paper.pdf A plan may be able to reflect its own experience if it is of sufficient size (see Q&A 9). In the U.K., the use of generalized linear models (GLMs) to help better track and understand longevity exposure in pension plans has been increasing. Understanding longevity exposure is a significant issue for U.K.-based plans, especially because of mandatory benefit indexing and the growing pension settlement market. Instead of just counting deaths and dividing by exposures, these models help actuaries understand the many correlations in the data. Although this type of analysis is not prevalent in the United States, it may be something for actuaries to consider, especially for large plans. “A Practitioner’s American Academy of Actuaries 9 www.actuary.org PENSION COMMITTEE PRACTICE NOTE 2015 Guide to Generalized Linear Models” can be found on the Casualty Actuarial Society Part 9 syllabus at www.casact.org/pubs/dpp/dpp04/04dpp1.pdf. Q2. What external restrictions apply to the selection of a base mortality table? A2. The following are some of the situations in which the choice of mortality assumption is restricted: • Under IRS funding standards for many single employer pension plans, the actuary is only allowed to reflect mortality differences for gender, age, and benefit commencement when using the prescribed mortality table to calculate contributions. • When determining lump sums in tax-qualified U.S. pension plans, assumptions (including mortality) meet the minimum present value rules in the Internal Revenue Code. • When determining optional forms of payment in tax-qualified U.S. pension plans, actuarial assumptions are unisex (Norris and other decisions). 6 Q3. What is the process for selecting appropriate mortality and mortality improvement assumptions? A3. ASOP No. 35 outlines five primary steps in selecting assumptions (Section 3.3 of ASOP No. 35). Generally, the actuary should: • • • • • Identify the type of assumption that is appropriate for the specific calculation; Consider the relevant assumption universe; Consider the assumption format; Select the specific assumptions; and Confirm that the selected assumption is reasonable, which includes the following characteristics: - Is appropriate for the measurement; - Reflects the actuary’s professional judgment; - Takes into account historical and current demographic data that is relevant as of the measurement date; - Reflects the actuary’s estimate of future experience, the actuary’s observation of the estimates inherent in market data (if any), or a combination thereof; and - Has no significant bias (i.e., it is not significantly optimistic or pessimistic), except when provisions for adverse deviation or plan 6 “Los Angeles Dept. of Water & Power v. Manhart, 435 U.S. 702, which held unequal pension plan contributions for male and female employees based on actuarial tables reflecting women’s greater life spans violated the sex discrimination prohibitions of Title VII of the Civil Rights Act of 1964. Arizona Governing Committee for Tax Deferred Annuity & Deferred Compensation Plans v. Norris, 463 U.S. 1073, extended this nondiscrimination principle to unequal benefits payments” (Source: Justia.com U.S. Supreme Court Center under Syllabus at http://supreme.justia.com/cases/federal/us/487/223/case.html). American Academy of Actuaries 10 www.actuary.org PENSION COMMITTEE PRACTICE NOTE 2015 provisions that are difficult to measure are included and disclosed or when alternative assumptions are used for the assessment of risk. Refer to the remaining Q&A’s for further information. Q4. May actuaries take into consideration mortality tables that are based on the experience of the entire general population? A4. Those who are employed are generally healthier than those who are not employed. Mortality based on the general population will, on average, therefore exhibit higher rates of mortality than the rates exhibited by the subset of working participants. A general population mortality table may be useful when valuing a group that includes non-workers (such as participants in a social insurance program). Q5. Separate tables are available for the purpose of measuring life insurance (both individual as well as group coverages). When are such tables useful in measuring pension or other post-retirement benefit plans? A5. Individual life insurance tables reflect an element of underwriting and some antiselection. While those tables may be appropriate for valuing and pricing individual life products, they are generally not appropriate for valuing pension or other post-retirement benefit plans. Tables used to determine life insurance statutory reserves are also unlikely to be appropriate for valuing pension or other post-retirement benefit plans. Group life insurance tables show a higher rate of mortality than would be expected for group annuity tables. Life tables also may include a margin for adverse experience, which in the case of a life insurance table results in an increase in the expected mortality rate. Q6. What is the difference between a table used to measure group annuity mortality and a table used to measure individual annuity mortality? A6. Individual annuities are generally purchased by individuals who think they will live a long time. Group annuities are generally purchased by employers or plans for groups of individuals who are not given a choice of whether or not the annuity will be purchased. Mortality experience under individual annuity contracts, therefore, tends to be lower (that is, people are expected to live longer) than group annuity experience due to anti-selection by the purchasers of individual contracts. On the other hand, group annuity mortality tables reflect the anticipated experience of a group of employed persons. While the use of a group annuity table is generally more appropriate for valuing a pension plan, the use of an individual annuity table may be appropriate for predicting the mortality of principals of smaller organizations. Q7. Are there different types of group annuity mortality tables (i.e., tables used by insurance companies to set prices and establish reserves for group annuity contracts)? American Academy of Actuaries 11 www.actuary.org PENSION COMMITTEE PRACTICE NOTE 2015 A7. Yes. Different types of group annuity mortality tables are used depending on the purpose of the actuarial measurement. There are reserving tables that are used to determine statutory reserves and what is called “surplus strain” (or the amount of capital used to support the sale of a particular group annuity contract). The tables used for these purposes include a load for adverse experience, i.e., for lower-thanexpected mortality. The GAR-94 Table is one such table (see Appendix 1 for more information about this table). Section 6.C of the 2013 NAIC “Model Rule (Regulation) for Recognizing a New Annuity Mortality Table for use in Determining Reserve Liabilities for Annuities” requires the use of the GAR-94 table for determining the minimum standard of measurement for any group annuity purchases on or after the date adopted by a state. Section 7 requires the use of Scale AA applied from 1994. The other type of group annuity mortality table does not include a load for adverse experience and is typically used to price a group annuity contract and to set Generally Accepted Accounting Principles (GAAP) reserves. These tables reflect an estimate of the anticipated mortality experience for the group being measured. The GAM-94 Basic with Scale AA applied on a generational basis is one example of a table that does not have a load for adverse experience built in. For more information on published mortality tables, see Appendix 1. Q8. Is it ever appropriate to assume no mortality? A8. In most cases, a mortality assumption is appropriate. However, the absence of a pre-retirement mortality assumption may be reasonable if the small size of the pension population does not justify the use of a mortality assumption for the period prior to assumed retirement. (See ASOP No. 35, Section 3.5.3(a).) This approach can also be used to simplify the measurement when the use of a preretirement mortality table would not be expected to produce a materially different result (such as when a death benefit is provided that is equal to the actuarial reserve under the actuarial funding method). Q9. When is plan experience significant enough to be reflected in the mortality assumption? A9. For most plans, the plan population is not large enough to generate fully credible experience data. In those cases, published tables are available. When the plan population is sufficiently large, the mortality assumptions can reflect solely the plan’s experience or a blend of the plan’s experience and a published table. See the discussion on credibility theory in Appendix 2. For plan populations that are large enough to have partial credibility, or for which experience has been observed over an extended period, the actuary may attempt to validate whether a published table (adjusting for the period between the actual plan mortality experience and the year of the published American Academy of Actuaries 12 www.actuary.org PENSION COMMITTEE PRACTICE NOTE 2015 table) aligns with the plan’s mortality levels. The actuary also may consider the extent to which the published table (or an adjusted version of the published table) provides a margin for mortality improvement. Validating the published mortality table is an important starting point, even when a projection will be applied. Q10. Should improvements in mortality be assumed for non-disabled participants? A10. ASOP No. 35 indicates that the effect of mortality improvement before and after the measurement date should be considered. Data from mortality and demographic studies can be considered when determining the likelihood and extent of mortality improvement in the future. Past experience indicates mortality rates have consistently improved. There are many unknowns, however, such as whether there is a limit to mortality improvement, how the rate of mortality improvement is expected to change, what new factors may emerge to replace the non-recurring causes of past mortality improvement (e.g., significant reductions in smoking, introduction of Medicare and Medicaid, widespread use of antibiotics and statins, etc.), and whether changes in economic trends and the rollout of the Affordable Care Act will have an effect. The actuary should consider adjusting base mortality rates to reflect mortality improvement from the effective date of any base table used through the measurement date. The published mortality table without improvement can be used, however, if, in the actuary’s professional judgment, it reflects expected mortality rates at the measurement date. The actuary should include an assumption of expected future mortality improvement after the measurement date. Section 3.5.3(ii) of ASOP No. 35 states, “the existence of uncertainty about the occurrence or magnitude of future mortality improvement does not by itself mean that an assumption of zero future improvement is a reasonable assumption.” Demographics and plan design are considerations when evaluating future mortality improvement. For example, the significance of the mortality improvement assumption increases when: • The plan provides benefits to a group that is predominately comprised of active lives who are not expected to elect a lump sum distribution of their benefit. 7 7 Though the lump sum conversion basis is typically prescribed by the plan, when measuring the liability related to a lump sum benefit, the actuary (or the plan sponsor) may need to make an assumption as to the future mortality table that will apply under the plan’s basis. However, as the lump sum conversion would typically be a plan provision, its application may be prescribed, rather than calling for the actuary to make an assumption. American Academy of Actuaries 13 www.actuary.org PENSION COMMITTEE PRACTICE NOTE 2015 • The plan provides benefits that increase over time (e.g., pension plans that grant automatic cost-of-living increases and many post-retirement medical plans that do not have a cap on company cost increases). Estimating the level of future mortality improvement might involve consideration of specific demographic and other circumstances such as: • When the application of mortality improvement for some or all future years is precluded by law, or the purpose of the measurement calls for stated or mandated assumptions; • When the characteristics of the plan population differ from those of the general population and such differences might affect the projected rate of mortality improvement. Examples might include high-/low-paid populations or particular industries or collars; • When the plan’s benefits primarily are paid in a lump sum form for which a future change in mortality basis may not need to be reflected (for example, IRS-mandated assumptions for pension funding where anticipated changes are not reflected in current year results, or where a plan specifies an alternative lump sum basis using a fixed table); and • When the pre-retirement death benefit has roughly the same present value as the benefit payable under some other decrement(s) (e.g., turnover) such that the effect of mortality improvements would not be material. There is a large body of data and research regarding mortality improvement. Pension actuaries are encouraged to become familiar with these data and research findings. The Society of Actuaries has collected some of this information at http://www.soa.org/professionalinterests/pension/resources/pen-mortality-resources.aspx. Q11. Should improvements in mortality be assumed for disabled participants? A11. The factors that have driven mortality improvement in general can also affect the disabled population. According to the SOA report on MP-2014 mortality improvement scale, the RPEC “encourages the application of Scale MP-2014 (or an appropriately parameterized RPEC_2014 model) on a generational basis to all pension-related mortality tables, including those covering disabled lives.” 8 A discussion of their rationale can be found in Section 6.2 of the same report. 9 This is a change from the recommendations provided in the SOA report on RP-2000. (See Q&A 20.) Q12. What resources are available to assist in choosing a mortality projection scale? 8 9 Society of Actuaries, “Mortality Improvement Scale MP-2014 Report,” page 5. Society of Actuaries, “Mortality Improvement Scale MP-2014 Report,” page 21. American Academy of Actuaries 14 www.actuary.org PENSION COMMITTEE PRACTICE NOTE 2015 A12. There are several resources to assist actuaries in selecting mortality projection scales, including those listed below. More information about the more recent tables, and the sources of data for those tables, can be found in Appendix 1. • The Society of Actuaries published a new mortality improvement scale, Scale • • • • • MP-2014 10, in October 2014. This is a two-dimensional gender-specific scale that varies by age as well as by calendar year. In that report, as noted in Q&A 11, Scale MP-2014 is recommended for use with mortality table RP-2014 and all pension-related mortality tables, and is intended to replace both Scale AA and interim Scales BB and BB-2D. Interim Scale BB was published in September 2012 and was intended to provide a temporary alternative to Scale AA. For example, if the RP-2000 table is the underlying base mortality table, Scale BB was intended to apply on a generational basis from 2000. Scale BB is a one-dimensional approximation of Scale BB-2D. Scale BB was intended to be temporary and was replaced by Scale MP-2014. In addition, MP-2014 is based on two more recent years of data than Scale BB-2D (2008 and 2009) and was developed using a similar model, but one that has a number of computational techniques that are intended to be simpler and more transparent than those used in developing Scale BB-2D. Scale AA, which was originally developed based on data through 1993 for use with the 1994 pension and annuitant tables, was a commonly used mortality improvement scale table prior to the issuance of MP-2014. A summary of various scales that predate Scale AA can be found in Table I, pages 228/229 at http://www.soa.org/library/research/transactions-reports-ofmortality-moribidity-and-experience/1980-89/1988/january/tsr889.pdf The Social Security Administration (SSA) recently made available historical rates of mortality for 1900-2010, as well as projected probabilities of death from 2011-2090 based on the intermediate assumptions of the 2014 Trustees Report. The historical probabilities include the information from which the MP-2014 tables were developed. Future rates of improvement used by the SSA may be inferred from the projected death probabilities. This information may be found at http://www.ssa.gov/OACT/HistEst/DeathProbabilities2014.html. Studies by other professionals, such as demographers, can also be helpful in determining the rate and duration of past mortality improvements. While experts expect a continued long-term trend of mortality improvements, others believe that rates of mortality improvement will ultimately decline, given factors such as obesity, sedentary lifestyles, drug-resistant bacteria and the possibility of pandemic diseases. Experts also point to the declining influence of factors that drove past 10 Society of Actuaries, “Mortality Improvement Scale MP-2014 Report.” American Academy of Actuaries 15 www.actuary.org PENSION COMMITTEE PRACTICE NOTE 2015 mortality improvement (which included significant reductions in smoking, widespread use of antibiotics and statins, expansion of Medicare and Medicaid, etc.). However, other factors may emerge to drive future improvements. Actuaries are encouraged to review the available materials to assist in their selection of a particular improvement scale or method and disclose any information used and analysis performed as the rationale for the assumption selection. 11 Each of these and other factors can be considered in selecting a mortality improvement scale and the time period over which it is to be applied. • Appendix B of the paper on the development of the UP-94 Table (see Appendix 1) explores some issues in choosing a mortality improvement scale. New information that is issued from the Society of Actuaries, as well as relevant studies from other organizations, is likely to become available subsequent to the issuance of this practice note. Q13. What is the difference between a static and generational mortality projection? A13. A static projection is a projection of the base mortality rates to a specific date or equivalently for a specific number of years. The same mortality rates at any given age apply to everyone. For example, if a 15-year static projection is used, the mortality rate at age 65 is the age 65 rate from the base table with 15 years of projected mortality improvement applied. Similarly, the mortality rate at age 66 will be the age 66 rate from the base table, also with 15 years of projected improvement in mortality. These same age 65 and 66 rates will be applied to all participants at ages 65 and 66, regardless of their current age. A generational projection generates a unique table for each year of birth cohort. For example, the mortality rate at age 65 for someone now age 40 will be the current age 65 rate with 25 years of projection applied. For the same person, the mortality rate at age 66 will be the current age 66 rate with 26 years of projection. By comparison, the mortality rate at age 65 for someone now age 50 will be the current age 65 rate with 15 years of projection applied. Generational tables theoretically more accurately replicate the anticipated pattern of improvement in mortality rates, but may also be somewhat more difficult to use than a static projection. Relative to a generational projection, a comparable static projection will overstate liability for some participants and understate it for others. While a static projection may be less accurate for each individual 11 For examples, see the information the Society of Actuaries has collected at http://www.soa.org/pensionmortality. American Academy of Actuaries 16 www.actuary.org PENSION COMMITTEE PRACTICE NOTE 2015 participant, it may still produce a reasonable result for a larger diverse group. The use of generational tables may improve the accuracy of benefit payment projections and liability forecasts. Also, generational tables do not need to be updated as frequently as static tables to be kept up-to-date with mortality improvements. In theory, if a generational projection scale reasonably matches actual rates of mortality improvement, the generational tables would never need to be updated. In practice, the base rates and mortality improvement scale will likely be updated periodically to account for new information that has become available since the last update. Q14. What factors support the use of a static mortality table without projection of future mortality improvement? A14. In general, use of static tables was common in the past due to technological limitations. However, with general advances in computing power and updates in actuarial valuation system capabilities, simplifications such as these may not be as necessary in the future. Nonetheless, in some cases a static table with sufficient margin for mortality improvements can be appropriate. For example, the GAM-94 Static table (see Appendix I) employs this technique, as did several older tables (e.g., GA-51, GAM-71 and GAM-83). As of the date this practice note was published, these tables are generally not representative of more recent mortality experience; nonetheless, the actuary may feel comfortable reflecting one of these older tables with mortality improvements explicitly built in (for example, using a static table with a setback or other adjustment), depending on the characteristics of the group for which benefits are being measured and the purpose of the measurement. But the use of such tables should be carefully considered to make sure they are still appropriate Q15. If using static projection of mortality improvement, for how many years would one project that improvement? A15. The magnitude of future improvement in mortality, and for how long that improvement may persist, are issues that are subject to much debate, as discussed in many other areas of this practice note. This question and the response below presume that there will be perpetual improvements and addresses how this view might be approximated on a static basis. The papers for the RP-2000 and UP-94 tables (see Appendix 1) indicate that a static projection to the duration of the liabilities provides an appropriate approximation of future mortality improvement. 12 (See Q&A 16 for a discussion 12 TSA 95, page 833. found at http://www.soa.org/library/research/transactions-of-society-ofactuaries/1990-95/1995/january/tsa95v4722.pdf. American Academy of Actuaries 17 www.actuary.org PENSION COMMITTEE PRACTICE NOTE 2015 of duration.) Note that this projection is for a specified number of years (“n”), for which the number of years is equal to (a) the number of years from the date of the table to the measurement date, plus (b) the duration of the liabilities (see Q&A 16). If static projections are used, different projections can be used in certain circumstances, such as for different groups of participants or for pre-benefit commencement periods vs. post-benefit commencement periods. Duration varies with the discount rate, increasing as the rate decreases, which may affect the evaluation of an appropriate static projection period. Beginning with the Scale BB report, questions were raised within the actuarial community with regard to the continued suitability of a static estimation of generationally projected mortality. Furthermore, the implementation of a 2D projection scale makes determining the appropriate static estimation period more difficult, because the rate of improvement varies not only by age but also by calendar year. Q16. If duration is used to establish a static projection, how can duration be determined? A16. Several different methods can be used to approximate duration. One method can be found at http://www.soa.org/files/research/exp-study/rp00_mortalitytables.pdf (Chapter 7, sixth page). Q17. What is the difference between one- and two-dimensional mortality improvement? A17. One-dimensional mortality improvement rates are gender-specific and reflect differences in mortality improvement due to age. Two-dimensional mortality improvement rates are also gender-specific, but reflect differences in mortality improvement both due to age and calendar year (CY). The change in underlying mortality rates for a given age, x, and a CY, y, can be seen by arranging these rates into a two-dimensional array (f(x,y)) that reflects the change in underlying mortality rates at age x between CY y-1 and CY y . The MP-2014 projection scale was developed in a two-dimensional manner. To develop the mortality rate (q x ) for a given year (y), the base rate from the RP2014 table q(x,2014) is adjusted by the improvement rate for each year for age x [ q(x,y+1) = (q(x,y)*(1-(f(x,y+1)) ]. As an example, the mortality decrement for a male healthy annuitant aged 70 in year 2018 is equal to: q(70,2014)*(1f(70,2015))*(1-f(70,2016))*(1-f(70,2017))*(1-f(70,2018)) = .01677*(1.01740)*(1-.01580)*(1-.01430)*(1-.013) = .01578. Please see Q&A C3 in the Scale BB Q&A Document for additional information on two-dimensional American Academy of Actuaries 18 www.actuary.org PENSION COMMITTEE PRACTICE NOTE 2015 projection scales. 13 Q18. What are the important considerations in selecting a two-dimensional mortality improvement scale? A18. In the Scale MP-2014 report, the RPEC outlines three key concepts 14 inherent in the underlying model used to develop the MP-2014 mortality improvement scale: • Short-term mortality improvement rates are based on recent experience; • Long-term mortality improvement rates are based on expert opinion; and • Short-term mortality improvement rates blend smoothly into the assumed long-term rates over an appropriate transition period. In the study that developed Scale MP-2014, the RPEC found mortality improvement varies by gender, age, and year of birth and thus recommends a two dimensional gender-specific table be used in pension valuations. The table supports both a short-term and long-term view of mortality improvement. The short-term view considers recent experience, which the RPEC felt was the best predictor of future near-term mortality improvement rates. The long-term view was based on expert opinion and analysis of longer-term mortality patterns. Scale MP-2014 uses an ultimate mortality improvement of 1.0 percent to age 85, followed first by a linear decrease to 0.85 percent at age 95, and then a linear decrease to zero at age 115. It also transitions smoothly from the short-term to long-term assumptions over a period of 20 years (from 2007 to 2027). The Scale MP-2014 Report stated the experience “contains information from a variety of sources. It may or may not reflect the experience of any individual company.” 15 The Scale MP-2014 Report also indicated that “as with all forwardlooking actuarial assumptions, the selection of future mortality improvement rates involves a certain degree of subjectivity. While RPEC considers the committee-selected set of assumptions underpinning Scale MP-2014 to be its best estimate, the Committee is fully aware that any number of future developments (e.g., medical breakthroughs, environmental changes and societal factors) could result in actual future rates of mortality improvement varying significantly from projected levels. Actuaries may conclude that alternative mortality improvement scales, including those developed from assumption sets other than that selected by RPEC for Scale MP-2014, lie within an appropriate assumptions universe for modeling mortality improvement, Accordingly, the RPEC_2014 model described in Section 3 was specifically designed to enable users to develop gender-specific two-dimensional mortality improvement rates based on alternate assumption sets for a variety of purposes, including model 13 Society of Actuaries, “Questions and Answers Regarding Mortality Improvement Scale BB,” page 16. Society of Actuaries, “Mortality Improvement Scale MP-2014 Report,” page 3. 15 Society of Actuaries, “Mortality Improvement Scale MP-2014 Report,” cover page. 14 American Academy of Actuaries 19 www.actuary.org PENSION COMMITTEE PRACTICE NOTE 2015 assumption sensitivity analysis.” 16 Q19. How do differences for annuitant, employee, and beneficiary experience affect the choice of mortality assumption? A19. The RP-2014 report, as did the RP-2000 report, indicates a difference between employee and annuitant mortality. These differences may or may not be material in a given situation (depending on the assumed form of payment, small or large plan, etc.). The RP-2014 report mentioned that sufficient female beneficiary data was available to develop stand-alone female beneficiary tables and indicated that the female beneficiary experience differed significantly from that of healthy, female retirees. However, a sufficient amount of male beneficiary data was not available and thus RPEC decided not to produce a stand-alone beneficiary table and instead developed “Healthy Annuitant” mortality tables that reflect the experience of both retirees and beneficiaries. Q20. How does the type of retirement (e.g., early, normal, disability) affect the choice of mortality assumption? A20. A study of group annuity experience of insurance companies indicated that early retirees tend to exhibit higher rates of mortality than those who retiree on or after their normal retirement date. 17 Mortality rates for disabled lives are generally higher than for those who retire from active service, and mortality rates vary depending on the type of disability. An actuary may consider reflecting expected variations in disability mortality rates based upon a plan’s specific eligibility criteria (e.g., higher mortality rates may be appropriate for a plan that requires a participant to be eligible for Social Security disability rather than for a plan that requires merely a determination that the participant cannot perform the requirements of their current job). The RP-2014 Report included updated mortality tables for disabled retirees (ages 18 through 120) that reflected various disability eligibility criteria. With respect to disability, the MP-2014 Report states “Analysis performed by OCACT [Office of the Chief Actuary at the Social Security Administration] on SSA [Social Security Administration] disabled mortality rates indicated that recent mortality improvement trends for disabled lives in the United States have generally been similar to those for non-disabled lives. The similarity in mortality improvement trends is confirmed on page 41 of the 2012 OASDI Trustees’ Report: ‘“Over the last 20 years, the rates of benefit termination [for disabled lives] due to death have declined very gradually, and generally have mirrored the improving mortality 16 Society of Actuaries, “Mortality Improvement Scale MP-2014 Report,” page 19. Report of Group Annuity Experience Committee Mortality Experience, Society of Actuaries, for 20012002, page 6, available at: http://www.soa.org/research/experience-study/group-annuities/resrch-01-02group-annuity-reprt.aspx . Neither the RP-2014 nor the MP-2014 reports address this issue. 17 American Academy of Actuaries 20 www.actuary.org PENSION COMMITTEE PRACTICE NOTE 2015 experience for the overall population.’” 18 Q21. When is it appropriate to use unisex tables? A21. Gender typically is reflected in the mortality assumptions for measurements of pension obligations except where prohibited by law. A unisex table is generally appropriate when determining the benefits under optional forms of payment (such as a lump sum form of payment, a qualified joint and survivor annuity, or a qualified joint and survivor death benefit). Once the benefits are determined, they are generally measured using sex-distinct tables. If a unisex table is used for other purposes, documenting the reason why such an assumption is appropriate in internal workpapers can be useful. See the answer to Question 2 for other considerations regarding the use of gender. Q22. When is it appropriate to use select and ultimate mortality assumptions? A22. Select and ultimate assumptions may be appropriate when the rate of mortality is affected by the length of time after a particular event, such as disability. Disability mortality tables generally include a higher probability of death and a probability of recovery in the years immediately following the disability. 19 There may also be a return-to-work effect to be considered. If the disability benefit is a deferred benefit, then a select and ultimate assumption may not be needed if the deferral period is longer than the select period. Q23. Is it appropriate to reflect the collar of the covered work force in the mortality assumption? A23. Considering collar when selecting a mortality assumption is used by some actuaries but is not universal. The collar effect was studied and discussed in preparation of the RP-2000 and the RP-2014 mortality tables (see Appendix 1). In the development of the RP-2014 tables, the collar effects were found to be more pronounced in males than in females and tended to diminish with advancing age. Q24. Is it appropriate to reflect the industry or sector of the population? A24. The paper on RP-2000 (see Appendix 1) indicated that, in general, the industry of the population was not found to be a consistent predictor of mortality in the data collected. However, it may be appropriate to consider industry in selecting a mortality assumption, if the data supports that type of adjustment. The RP-2014 18 Society of Actuaries, “Mortality Improvement Scale MP-2014 Report,” page 21. “RPEC’s analysis of mortality by duration indicated that mortality rates in the early years of disability were considerably higher than those in subsequent years. However, because of the lack of data necessary to produce credible rates, RPEC decided against developing death rates that vary by duration.” Society of Actuaries “RP-2014 Mortality Tables Report,” revised November 2014, Section 4.4. 19 American Academy of Actuaries 21 www.actuary.org PENSION COMMITTEE PRACTICE NOTE 2015 and MP-2014 reports do not address this issue. Q25. Is it appropriate to reflect salary level or amount of benefit? A25. Although the work in connection with RP-2014 showed that salary level and benefit amounts are statistically significant indicators of differences in base mortality rates for nondisabled lives, the RPEC believes that the use of collarbased tables is generally more practical than the use of amount-based tables. 20 Q26. How could mortality experience be monitored? A26. If fully or partially credible experience can be obtained for a plan or a specified group of plan participants, an analysis of actual plan mortality experience vs. assumed experience could be conducted and regularly documented. See Appendix 2 for a discussion of credibility theory. Some actuaries review the pattern and size of actuarial gains and losses from the mortality decrement, with a more thorough analysis conducted if the results of the analysis indicate that experience may be deviating from the assumption. This analysis typically includes adjusting for the current-year gains that would be expected if using a static approximation of a generational mortality table. Other special events (e.g., plan spinoffs, mergers, or work force reductions) might trigger a need for additional review and documentation of the selection of actuarial assumptions. In some cases, the occurrence of the event could significantly alter the future experience of the plan and, in those cases, assumption changes may be warranted to better reflect that future experience. Q27. When is it appropriate to use mortality rates that are amount-weighted vs. headcount-weighted? A27. The RP-2014 mortality rates were all based on amount-weighted exposures and deaths. In the report, RPEC indicated that they believe the use of amountweighted mortality rates continues to be appropriate for the measurement of pension plan obligations. However, RPEC also indicated that the use of headcount-weighted mortality rates might be more suitable and possibly produce more accurate results in certain applications, such as for estimates of average age at death, projections of retirement plan populations, and the measurement of obligations for retirement programs with relatively flat benefit structures (such as some post-retirement medical and life insurance plans). 21 Q28. What is appropriate to disclose in the actuarial communication regarding the selection of a mortality assumption? 20 21 Society of Actuaries, “RP-2014 Mortality Tables Report,” revised November 2014, section 1.5, page 8. Society of Actuaries,“RP-2014 Mortality Tables Report,” revised November 2014, section 13.5, page 52. American Academy of Actuaries 22 www.actuary.org PENSION COMMITTEE PRACTICE NOTE 2015 A28. See Section II of this practice note. Q29. What might be documented in internal actuarial workpapers regarding the selection of a mortality assumption? A29. Guidance regarding documentation is contained primarily in Section 3.8 of ASOP No. 41, Actuarial Communications. In addition to the documentation required by the ASOPs, documentation in internal workpapers could describe the assumptions selected for the analysis, the process used to review the assumptions, the results of any experience or gain/loss analysis, the effect of any special events, the effect of any assumption changes, and the basis for the selection of the assumptions used in the analysis. This is one possible approach; alternative approaches also may be appropriate. Q30. When performing a forecast valuation for which the future-year valuations use a prescribed mortality assumption, when is it appropriate to use a nonprescribed mortality assumption in the forecast? A30. A forecast valuation involves the development of multiple valuations for multiple future years. This type of valuation uses two sets of assumptions, and the mortality assumption can be different for each set: • Valuation Assumptions (which may use prescribed assumptions for funding calculations), and • Forecast Assumptions. In a forecast valuation, the participant data are rolled forward each year using the Forecast Assumptions. This is followed by a valuation as of the future valuation date using the Valuation Assumptions. This two-step process is repeated throughout the study period. If the actuary believes the prescribed table is not the best estimate of the underlying mortality of the applicable population, then he or she may use a nonprescribed mortality table for the Forecast Assumptions. For the Valuation Assumption set, the actuary also may need to make an assumption as to the future prescribed assumptions. Q31. What are some sample disclosures of a mortality table and mortality improvement assumption? A31. The disclosure will depend on the mortality table and mortality improvement assumptions used. The MP-2014 Report said that “to preempt any misunderstanding in connection to projection scales based on alternate assumption sets, the name ‘Scale MP2014’ should be reserved exclusively for the rates displayed in Appendix A, which are based on the committee-selected assumption set described in Section 4. Any other set of two-dimensional mortality rates based on the RPEC_2014 model should explicitly identify (1) the assumed gender-specific long-term rates American Academy of Actuaries 23 www.actuary.org PENSION COMMITTEE PRACTICE NOTE 2015 for all ages between 20 and 120, (2) the assumed beginning and ending calendar years for each of the age/period and cohort convergence periods, and (3) the relative weighting percentages for the age/period (horizontal) and year-of-birth cohort (diagonal) interpolations.” 22 Some examples follow. Note that these examples are for illustrative purposes only and are not standards or safe harbors. Example A: RP-2014 and generational projection of mortality improvement using MP-2014 Separate rates for non-annuitants (based on RP-2014 “Employees” table without collar or amount adjustments, generationally projected using Scale MP-2014) and annuitants (based on RP-2014 “Healthy Annuitants” table without collar or amount adjustments, generationally projected using Scale MP-2014). Example B: RP-2014 blue-collar with generational improvement but with a change to the ultimate rate of mortality improvement from that used in MP-2014 Separate rates for non-annuitants (based on RP-2014 “Employees” table with blue collar adjustment and without amount adjustment, projected generationally as described below) and annuitants (based on RP-2014 “Healthy Annuitants” table with blue collar adjustment and without amount adjustment, projected generationally as described below). The generational mortality projection was determined using the same data, assumptions, and methods as was used for Scale MP-2014, except the ultimate mortality improvement assumed to age 85 was 0.7 percent instead of 1.0 percent, grading down to 0 percent by age 115. The convergence period was unchanged, so rates during the convergence period were also reduced to reach the ultimate rate of 0.7 percent by 2027. 22 Society of Actuaries, “MP-2014 Mortality Tables Report,” page 5. American Academy of Actuaries 24 www.actuary.org PENSION COMMITTEE PRACTICE NOTE 2015 Appendix 1 Published Mortality Tables and Mortality Improvement Scales (2015) The following is a summary of materials published by the task forces and committees that were responsible for publishing the various tables. For more details on each table, refer to the reports for each table. Table Name: RP-2014 Mortality Tables Table Location: The RP-2014 Table report can be found at this location: www.soa.org/research/experience-study/pension/research-2014-rp.aspx or http://www.soa.org/professional-interests/pension/resources/pen-mortalityresources.aspx Purpose: To provide a comprehensive review of recent mortality experience of uninsured private retirement plans in the United States. Common Naming Convention: RP-2014. Data Used to Develop Table: Approximately 10.5 million life-years of exposure and over 220,000 deaths, all from uninsured private pension plans subject to the funding rules of the Pension Protection Act of 2006. The experience is for calendar years 2004 through 2008. Data were projected to 2014 based on Scale MP-2014 mortality improvement rates. Public plan experience was excluded in developing the table. Margins: None Different Variations of Tables: Separate tables were developed by gender for employees, healthy annuitants (including retirees and beneficiaries, combined), and disabled retirees. The study also looked at the effect of collar and size of annuity/salary. The following is a brief discussion of factors to consider about these different variations: • 23 Employees vs. AnnuitantsThe report recommends separate tables be used for employees and annuitants. The report does not include a “combined” table as was present in the RP-2000 report and instead encourages actuaries “to blend appropriately selected RP-2014 Employee and Annuitant tables, taking plan-specific demographic information into account.” 23 Society of Actuaries “RP-2014 Mortality Tables Report,” revised November, 2014, Section 1.3. American Academy of Actuaries 25 www.actuary.org PENSION COMMITTEE PRACTICE NOTE 2015 Table Name: RP-2014 Mortality Tables (Continued) • • • • • Healthy vs. Disabled RetireesUse of the table for healthy annuitants may overstate liabilities if used for healthy and disabled retirees; the disability mortality table includes all disabled retirees, regardless of whether they are eligible for Social Security. Thus, the disabled life table may not be appropriate if valuing a group of disabled participants with a different definition of disability. Also, although the analysis determined that mortality rates in the early years of disability were considerably higher than those in subsequent years, the RP-2014 disability mortality rates do not vary by duration because of lack of credible data. “RPEC performed a number of logistic regressions on the final Disabled Retiree dataset. Although some variations in mortality by collar and amount were identified, those variations were significantly less pronounced than those found in the nondisabled populations.” 24 White vs. Blue vs. Mixed CollarCollar is a significant predictor of mortality in this data. As for the RP-2000 table, collar was set to blue if more than 70 percent of participants were hourly and/or union and to white if more than 70 percent of participants were both salaried and non-union. All others were defined as mixed collar. The RP-2014 standard (no collar) table reflects the data for all three groups. AmountSize of annuity/salary is a significant predictor of mortality in these data. The study analyzed quartile-based mortality trends for both Employees and Annuitants based on annual salary and annual retirement benefit amount, respectively. The quartile breakpoints were developed based on gender-specific “head count” exposure, and not based on exposure weighted by either salary or benefit amount. Some participants, such as terminated vested participants, have lower benefit amounts due to short service or other factors rather than due to income level. Also benefit levels tend to decrease in real value over time because few plans provide automatic cost-of-living adjustments. Combined Effect of Collar and Amount—Combined tables were not produced because the RPEC decided the extra complexity was not warranted given the high degree of correlation between collar and amount. Although the work in connection with RP-2014 confirmed that both collar and amount quartile are statistically significant indicators of differences in base mortality rates for nondisabled lives, the RPEC believed that the use of collar-based tables will generally be more practical that the use of amount-based tables. OtherIndustry (SIC) code was not analyzed in this study. Uses: Uninsured private retirement plans in the United States. Projection Scale: The RP-2014 Table Report recommends Scale MP-2014 for generationally projecting rates beyond 2014 or an appropriately parameterized version of the RPEC_2014 model. The report also recommends the use of the same improvement scale for disabled lives. 24 Society of Actuaries, “RP-2014 Mortality Tables Report,” revised November 2014, Section 4.4. American Academy of Actuaries 26 www.actuary.org PENSION COMMITTEE PRACTICE NOTE 2015 Table Name: RP-2014 Mortality Tables (Continued) Approximation based on a static projection of mortality rates to a specific duration: RPEC did not provide any recommendations in this regard. Relationship to Other Tables: 25 The RP-2014 table with Scale MP-2014 produces a deferred to 62 annuity due values with a discount rate of 6.0 percent of between 3.0 percent (age 55) and 4.4 percent (age 65) percent higher for males, and between 6.3 percent (age 55) and 5.5 percent (age 65) higher for females than RP-2000 with generational mortality improvement projection using Scale AA based on individuals at these ages in 2014. 25 Society of Actuaries, “RP-2014 Mortality Tables Report,” revised November 2014, section 12.2. American Academy of Actuaries 27 www.actuary.org PENSION COMMITTEE PRACTICE NOTE 2015 Table Name: RP-2000 Mortality Tables Table Location: The RP-2000 Table report, supplemental report, and additional notes can be found at this location: www.soa.org/research/experience-study/pension/research-rp-2000-mortalitytables.aspx or http://www.soa.org/professional-interests/pension/resources/pen-mortalityresources.aspx Purpose: To provide a suitable table for calculating Current Liabilities for singleemployer retirement programs following the Retirement Protection Act of 1994 (RPA). Common Naming Conventions: RP-2000, RP-2000 projected to YEAR (for table projected to YEAR) While the RP-2000 report did not suggest the same type of naming conventions as the UP-94 tables, the following would be appropriate: • • • Table projected to a specific year without further projection: RP-2000@YEAR; The generational table: RP-2000G; Generational table already projected to a specific year with the projection continuing thereafter: RP-2000G@YEAR. Data Used to Develop Table: Nearly 11 million life-years of exposure and more than 190,000 deaths, all from uninsured pension plans subject to RPA Current Liability rules. The experience is from more than 100 pension plans that submitted data for plan years 1990 through 1994. Data were projected to 2000 based on data from the Social Security Administration and federal Office of Personnel Management. Margins: None Different Variations of Tables: Separate tables were developed by gender for employees, healthy annuitants (including retirees and beneficiaries), and disabled retirees. The study also looked at the effect of collar and size of annuity. Following is a brief discussion of factors to consider about these different variations: • • Employees vs. AnnuitantsThe report recommends separate tables be used for employees and annuitants. Healthy vs. Disabled RetireesUse of the table for healthy annuitants may overstate liabilities if used for healthy and disabled retirees; the disability mortality table includes all disabled retirees, regardless of whether they are eligible for Social Security. Thus, the disabled life table may not be appropriate if valuing a group of disabled participants with a different definition of disability. American Academy of Actuaries 28 www.actuary.org PENSION COMMITTEE PRACTICE NOTE 2015 Table Name: RP-2000 Mortality Tables (Continued) • • • • White vs. Blue vs. Mixed CollarCollar is a significant predictor of mortality in this data. Collar was set to blue if more than 70 percent of participants were hourly and/or union and to white if more than 70 percent of participants were salaried and nonunion. All others were defined as mixed collar. Size of AnnuitySize of annuity is a significant predictor of mortality in these data. Small annuities were considered to be less than $6,000 per year and large to be more than $14,400 per year, with medium being between those two amounts. Note that some participants, such as terminated vested participants, have lower benefit amounts due to short service or other factors rather than due to income level. Also note that benefit levels tend to decrease in real value over time because few plans provide automatic cost-of-living adjustments. Combined Effect of Collar and Size of AnnuityThere was no practical way to reflect both of these effects in the mortality tables. OtherIndustry (SIC) code was not found to be a consistent predictor of mortality in these data. Uses: Uninsured, single employer, private sector pension plans. Projection Scale: The RP-2000 Table Report recommends Scale AA for projecting rates beyond 2000 (same table as is recommended for UP-94 and GAR-94). Approximation: The Society of Actuaries’ Committee on Retirement Plans Experience found that a static projection for n years, where n is the duration of the liabilities, is a very close approximation of the full generational table. Relationship to Other Tables: 26 The GAM-83, GAR-94, and UP-94 tables (for annuitants) were developed by amount of annuity and not by number of lives. The RP2000 Table was developed by amount of annuity, where available, and then the amount of annuity was estimated for those records providing only lives. In general, the RP-2000 annuity values are between 2 and 9 percent higher for males and between 3 and 5 percent lower for females than GAM-83. For males under 80, the RP-2000 values are within 4 percent of the UP-94 projected to 2000. For females, the RP-2000 values are 2 to 4 percent lower than UP-94 projected to 2000. 26 Chapter 8 of “The RP-2000 Mortality Tables Report.” American Academy of Actuaries 29 www.actuary.org PENSION COMMITTEE PRACTICE NOTE 2015 Table Name: The 1994 Uninsured Pensioner Mortality Table Table Location: The UP-94 Table report, including a discussion of the development and appropriate use of Scale AA (page 827), was issued in the 1995 Transactions of the Society of Actuaries (Volume 47) and can be found at this location: http://www.soa.org/library/research/transactions-of-society-of-actuaries/199095/1995/january/tsa95v4721.pdf Purpose: Update UP-84 table. Common Naming Conventions: UP-94, UP-94 @ YEAR (for table projected to YEAR (e.g., 2008)), UP-94G (for a generational table), UP-94G @ YEAR (for generational table already projected to YEAR which will continue to be projected). Data Used to Develop Table: Experience collected for this study was sufficiently close to insurance experience used for the GAR-94 Table, so the same underlying data were used for both (see GAR-94, below). Margins: None Uses: Tool to develop mortality assumptions for a population under study, primarily for the use of actuaries of uninsured plans. This is the latest table reflecting public plan experience. The independent RPEC Data Review Team has stated a public plan mortality study is needed. 27 Projection Scale: The factors for projecting mortality improvement beyond 1994 are based on the average of the CSRS and Social Security mortality improvement trends from 1977 to 1993, with adjustments, and are referred to as “Scale AA.” Rule of Thumb: The task force found that a static projection for n years, where n is the duration of the liabilities, is a very close approximation of the full generational table. Relationship to Other Tables: The UP-94 Table is the same as the GAM-94 Table, except it excludes the 7 percent margin added (5 percent for random variation in mortality rates and 2 percent for other contingencies). Unisex: The task force did not recommend the use of unisex factors for purposes of valuing pension plans. As noted above, the UP-94, GAM-94, and GAR-94 tables are based on the same data. For a paper on issues in choosing among these tables, see: http://www.soa.org/library/research/transactions-of-society-of-actuaries/199095/1995/january/tsa95v4720.pdf 27 RPEC Response to Comments on RP-2014 Mortality Tables Exposure Draft (November 2014, p. 3). American Academy of Actuaries 30 www.actuary.org PENSION COMMITTEE PRACTICE NOTE 2015 Table Names: 1994 Group Annuity Mortality Table and 1994 Group Annuity Reserving Table Table Location: The GAM-94 and GAR-94 Table report was issued in the 1995 Transactions of the Society of Actuaries (Volume 47) and can be found at this location: http://www.soa.org/library/research/transactions-of-society-of-actuaries/199095/1995/january/tsa95v4722.pdf Purpose: Update the Group Annuity Reserve Valuation Standard (previously based on GAM 83), incorporating generational mortality for the first time. Goal was to develop a table that would last for at least 15 years. Common Naming Conventions: “GAM-94 Basic” (static, unloaded mortality table for calendar year 1994, Table 13 of TSA), “GAM-94 Static” (static, loaded mortality table for calendar year 1994, Table 18 of TSA), and GAR-94 (combination of GAM-94 Static and Scale AA). Data Used to Develop Table: 1986−1990 data (insured annuitant experience from 11 large insurance companies for those at or over age 66 and the CSRS for those under age 66 and Actuarial Study No. 107 for under 25 and over 95), projected to 1994 based on CSRS experience from 1987 to 1993. Margins in GAM-94 Static: 7 percent added (5 percent for random variation in mortality rates and 2 percent for other contingencies). Uses: Determining reserves for insured group annuities. Projection Scale: See UP-94, above. Relationship to Other Tables: The GAM-94 Static Table is the same as the UP-94 Table, except it includes a 7 percent margin (see above). In Revenue Ruling 2001-62, the IRS published a variation of the GAM-94 table, projected to 2002 with Scale AA, blended 50 percent male and 50 percent female. This table did not include the 7 percent load for adverse experience that was included in the GAM-94 table. Therefore, the table in Revenue Ruling 2001-62 is not the same as the GAR-94 or GAM-94 tables. As noted above, the UP-94 and GAR-94 tables are based on the same data. For a paper on issues in choosing between these tables see the following 1995 Transactions of the Society of Actuaries (Volume 47): http://www.soa.org/library/research/transactions-of-society-of-actuaries/199095/1995/january/tsa95v4720.pdf American Academy of Actuaries 31 www.actuary.org PENSION COMMITTEE PRACTICE NOTE 2015 Mortality Improvement Scale Name: MP-2014 Scale Location: The Mortality Improvement Scale MP-2014 was issued by the Society of Actuaries in a report titled “Mortality Improvement Scale MP-2014 Report” in conjunction with mortality tables RP-2014. www.soa.org/research/experience-study/pension/research-2014-mp.aspx RPEC Recommendations: RPEC recommends that users carefully consider the committee-selected assumption set described in Section 4 of the Scale MP-2014 report and encourages the application of Scale MP-2014 (or an appropriately parameterized RPEC_2014 model) on a generational basis to all pension-related mortality tables, including those for disabled lives. Purpose: Provide a scale to project mortality rates from 2007 forward and include historical Social Security-based experience from 1951. Data Used to Develop Scale: The short-term assumption was based on the Social Security Administration (SSA) mortality dataset 28 gender-specific mortality rates through calendar year 2009 for ages 0 through 120. The long-term assumption is based on the RPEC’s review of relevant mortality topics and an assessment of U.S. mortality improvement rates. Since the data used for this scale were from the SSA, public plan actuaries could consider whether it is appropriate to use Scale MP-2014 for future mortality improvement in a public pension plan. In the study that developed Scale MP-2014, the Society of Actuaries’ RPEC found mortality improvement varies by gender, age, and year of birth and thus recommends a two dimensional gender-specific table be used in pension valuations. The scale supports both a short-term and long-term view of mortality improvement. The short-term view considers recent experience, which the RPEC felt was the best predictor of future nearterm mortality improvement rates. The long-term view was based on expert opinion. The MP-2014 scale uses an ultimate mortality improvement of 1.0 percent to age 85, a linear decrease to 0.85 percent at age 95, and a linear decrease to zero at age 115. It also transitions smoothly from the short-term to long-term assumptions over a period of 20 years beginning in 2007. The MP-2014 Report states the experience “contains information from a variety of sources. It may or may not reflect the experience of any individual company.” 29 The MP2014 Report also indicated that “as with all forward-looking actuarial assumptions, the selection of future mortality improvement rates involves a certain degree of subjectivity. While RPEC considers the committee-selected set of assumptions underpinning Scale MP-2014 to be its best estimate, the Committee is fully aware that any number of future developments (e.g., medical breakthroughs, environmental changes and societal factors) could result in actual future rates of mortality improvement varying significantly from 28 29 Society of Actuaries, “Mortality Improvement Scale MP-2014 Report,” page 4. Society of Actuaries, “Mortality Improvement Scale MP-2014 Report,” cover page. American Academy of Actuaries 32 www.actuary.org PENSION COMMITTEE PRACTICE NOTE 2015 Mortality Improvement Scale Name: MP-2014 (Continued) projected levels. Actuaries may reasonably conclude that alternative mortality improvement scales, including those developed from assumption sets other than that selected by RPEC for Scale MP-2014, lie within an appropriate assumptions universe for modeling mortality improvement. Accordingly, the RPEC_2014 model described in Section 3 was specifically designed to enable users to develop gender-specific twodimensional mortality improvement rates based on alternate assumption sets for a variety of purposes, including model assumption sensitivity analysis.” 30 Common Naming Conventions: The RPEC requests that actuaries who build a scale that is different than the scales published in the MP-2014 report not refer to it using the term MP-2014. Instead, the phrase “Scale MP-2014” should be reserved exclusively for the rates displayed in Appendix A of the MP-2014 report. More Frequent Updates: RPEC anticipates that it will update this table triennially, at which point the latest SSA mortality data would be integrated and the committee-selected assumption set would be reviewed for continued appropriateness. 30 Society of Actuaries, “Mortality Improvement Scale MP-2014 Report,” page 19. American Academy of Actuaries 33 www.actuary.org PENSION COMMITTEE PRACTICE NOTE 2015 Mortality Improvement Scale Name: Scale BB Scale Location: The Mortality Improvement Scale BB Report (September 2012), including a discussion of the development and appropriate use of Scale BB, was issued by the Society of Actuaries in the “Mortality Improvement Scale BB Report”: http://www.soa.org/professional-interests/pension/resources/pen-mortalityresources.aspx or http://www.soa.org/Research/Experience-Study/Pension/research-mortalityimprove-bb.aspx Retirement Plans Experience Committee (RPEC) recommendations: RPEC recommends use of Scale BB projected generationally over a static projection period. However RPEC believes that the use of static projections may be an adequate approximation of the generational approach in certain situations (such as actuarially equivalent optional forms, certain regulatory purposes and for valuations of smaller plans or plans whose primary form of benefit payment is lump sum). Purpose: Provide an interim scale as an alternative to Scale AA. Data Used to Develop Scale: The final scales are based on the SSA mortality dataset gender-specific mortality rates through calendar year 2007 for ages 0 through 120. Scale Development: Two-dimensional tables of gender-specific rates were developed based on the SSA data and a future long-term mortality improvement rate of 1.0 percent up to age 90 was assumed. These tables were converted to the one-dimensional Scale BB tables. The derivation of Scale BB is described beginning on page 13 of the Report. The two-dimensional scale (BB-2D) and rates used to develop the one-dimensional Scale BB can be found at http://www.soa.org/Files/Xls/research-full2d-mi-rates.xls. American Academy of Actuaries 34 www.actuary.org PENSION COMMITTEE PRACTICE NOTE 2015 Mortality Improvement Scale Name: Scale AA Scale Location: A discussion of the development of Scale AA is included in the GAM-94 and GAR-94 Table report (page 885), which was issued in the 1995 Transactions of the Society of Actuaries (Volume 47): http://www.soa.org/library/research/transactions-of-society-of-actuaries/199095/1995/january/tsa95v4722.pdf In addition, a discussion of the appropriate use of Scale AA is included in the UP-94 Table report (page 827), which was issued in the 1995 Transactions of the Society of Actuaries (Volume 47): http://www.soa.org/library/research/transactions-of-society-of-actuaries/199095/1995/january/tsa95v4721.pdf Purpose: Provide a scale to project mortality rates beyond the date of the 1994 mortality tables. Data Used to Develop Scale: Social Security Administration (SSA) 107 and Civil Service Retirement System (CSRS) mortality reduction trends (1977-1993), with additional data provided by the Office of the Actuary at the SSA, including central death rates for fiveyear age groups for each calendar year over the period 1960-1988. Scale Development: A blend of the CSRS and Social Security mortality improvement trends from 1977 to 1993, with a minimum of 0.5 percent for ages under 85 and a maximum of 2.0 percent for ages under 60, as well as other minor adjustments. American Academy of Actuaries 35 www.actuary.org PENSION COMMITTEE PRACTICE NOTE 2015 Appendix 2 Discussion of Experience-Based Mortality and Credibility This Appendix discusses: • • General considerations in developing experience-based mortality rates, and Three approaches used by pension actuaries to determine the credibility given to mortality experience. These are some of the methods used to determine the credibility of experience data, as outlined in Appendix 1 of Actuarial Standard of Practice No. 25 (http://www.actuarialstandardsboard.org/pdf/asops/asop025_174.pdf). Considerations in Developing Experience-Based Mortality Rates Hundreds of thousands of lives are generally needed to build a fully credible mortality table from scratch, so only the largest plans can consider that option. In this section, we discuss the case where an actuary has enough fully credible experience to develop a custom mortality table for a plan by multiplying the mortality rates in a published table by the ratio of actual to expected deaths (and grading into q x equal to 100 percent at the last age). A single ratio can be developed for an entire table, or separate ratios can be determined for ranges of ages (e.g. five-year age bands). (See later discussion for adjustments needed if the experience is only partially credible.) The actuary generally starts by choosing a published table to use as the base for this calculation. For example, a blue-collar or white-collar (as applicable) table may be appropriate. In some cases, the published table is used with an age set-back (or setforward) so that the expected deaths are closer to the actual number of deaths. Finetuning could be achieved by further multiplying the adjusted q x values by the ratio of actual deaths to expected deaths. The experience-based rates are generally weighted by benefit or liability amount, as participants with higher amounts typically have lower mortality. This practice is especially important if a wide range of socioeconomic status is represented in the experience data. Experience studies usually focus on older ages (i.e., retirement eligible) because the mortality rates at younger ages are relatively small and may have only a small effect on the resulting measurement of the benefit obligations. Large plans might have enough data to determine the ratios for different age groupings, for males and females separately, or for the annuitant and non-annuitant tables separately. For the very high ages where there is little experience, one technique is to consider experience just below age x (e.g., age 90) to develop rates through age x, and then phase American Academy of Actuaries 36 www.actuary.org PENSION COMMITTEE PRACTICE NOTE 2015 the modified table into the published table from age x over some phase-in period (e.g., 10 years). Limited Fluctuation Approach to Credibility The “limited fluctuation approach” to credibility is commonly used in determining the mortality assumption for pension valuations, and is so called because it limits the probable effect of random fluctuations in the experience data on the resulting assumption. Full Credibility The first step is to solve for the volume of experience needed so that the data has full credibility (in other words, the mortality rates of a published table can be adjusted to fully reflect the ratio of actual to expected mortality experience). One chooses a small constant “r” (say 0.05) and a large confidence level “p” (say 0.90), and determines how much experience is needed so that: Probability [ |Actual Deaths - Expected Deaths| / Expected Deaths <= r ] = p In words, there is a 90 percent probability (p=0.90) that the sample (experience) mortality rate will be within 5 percent (r=0.05) of the true (expected) mortality rate. Below we show the derivation for the case where all experience is equally weighted and all deaths have the same probability. In actuality, similar results hold for the more typical situations as well, with some adjustments to the number of required deaths. For example, see the Benjamin article (in the reference at the end of this Appendix), which derives an adjustment factor to apply to the q values in a mortality table. (For the population in Benjamin’s example, the number of deaths would be 1,635 rather than the 1,082 amount in the simple example below.) Thus, for simplicity, let’s assume the experience consists of N participants, all equally weighted, with a probability of death equal to q. The actual number of deaths can generally be assumed to be a binomial distribution, with mean (expected deaths) equal to N*q and standard deviation equal to the square root of N*q*(1-q). If N is large enough, this binomial distribution can be approximated by a normal distribution with the same mean and standard deviation. Thus, we can rearrange the equation above so that the expression to the left of the inequality is the absolute value of a random variable that is approximately normal with a mean of 0 and a standard deviation of 1: Probability {|(Actual Deaths – N*q) / sqrt[N*q*(1-q)]| <= r * sqrt[N*q/(1-q)]} = p This equation can be solved for N using known facts about the normal distribution. For example, with p = 0.90, r * sqrt[N*q/(1-q) equals 1.645 (a two-tailed normal probability with 5 percent in each tail). Supposing further that r = 0.05, N*q/(1-q) equals (1.645/.05) ^ 2 = 1,082. Assuming q is relatively small (hence 1-q close to 1), we can be 90 percent American Academy of Actuaries 37 www.actuary.org PENSION COMMITTEE PRACTICE NOTE 2015 confident that actual experience will be within 5 percent of expected experience when the expected number of deaths (N*q) is 1,082. Note that the actual number of deaths is often used in lieu of the expected number of deaths in determining the full credibility threshold. It is also worth noting that because this approach is based on experience related to total number of deaths, conclusions do not necessarily carry over with equal precision to resulting life expectancies or present values generated by mortality tables inferred from that aggregate rate. A sample with 1,100 deaths would be sufficient to estimate to within 5 percent the aggregate mortality rate 90 percent of the time—as detailed above. Assume that analysis indicated the sample population’s aggregate mortality was 6 percent lower than a published table predicts. We have no statistical reason to conclude that life expectancy (or present value factors) generated by a mortality table that is a 94 percent load (6 percent lower mortality) of the published table will be within 5 percent of true life expectancy 90 percent of the time, especially at higher ages where data tends to be sparse and q x not small. Partial Credibility When N is less than the number required for full credibility, this approach uses a formula of the form: Z * plan’s actual experience + (1 – Z) * published mortality. The larger the number of deaths, the greater the value of Z. The partial credibility factor, Z, is determined as: Z = sqrt (Actual deaths / required deaths for full credibility). The rationale is based on comparing this to the principles used when combining observations in the physical sciences, for which each observation’s weighting is based on the reciprocal of its standard deviation. Since the standard deviation varies linearly with the square root of the number of deaths, the amount of credibility varies inversely with the square root of the number of deaths. Thus, for example, if the ratio of the actual number of deaths to the number needed for full credibility is ¼, Z would equal ½. An important consideration in this method is that the published table represents the actuary’s best estimate assumptions before reflecting the experience data. (Otherwise, one would be double-counting the experience.) The published table would generally be a variation of a recently published set of tables, based on the characteristics of the plan population, or the table used in the previous valuation. In situations with a small volume of experience (e.g., Z is less than 0.25 or there are fewer than 100 deaths), actual experience is often entirely disregarded and only the published mortality is used. American Academy of Actuaries 38 www.actuary.org PENSION COMMITTEE PRACTICE NOTE 2015 Alternative Approach An alternative approach, similar to limited fluctuation, is also used by pension actuaries. This approach only uses the plan’s experience if there is a statistically significant difference between the plan’s actual number of deaths and the expected number of deaths under published mortality. Using classical statistical methods, the null hypothesis is that the mortality of the plan matches that of the published mortality table, and the analysis tests that hypothesis by comparing the actual number of deaths (a random variable) with the expected number of deaths (given by the published table). As part of the analysis, it is necessary to set the number of standard deviations by which to judge whether the difference between actual and expected deaths is due merely to random fluctuation. That is, mortality differences might be considered statistically significant if the ratio of actual to expected deaths exceeds (or is less than) 1 by more than a certain number of standard deviations. The number of standard deviations used to make this judgment would determine the likelihood of making an incorrect assessment as to whether the actual mortality experience matches the published table. For example, if the analysis used 1.645 standard deviations, for situations in which the plan’s true mortality matches the published table against which it is being tested, the data would incorrectly lead to the conclusion that the plan’s mortality experience is more than the published mortality table only 5 percent of the time. Similarly the data would incorrectly lead to the conclusion that the plan’s mortality experience is less than the published mortality table only 5 percent of the time. If 1.962 standard deviations were used, the 5 percent thresholds would change to 2.5 percent. Example Assume that a sample population of 5,000 people has 100 expected deaths using the published mortality table. Assume, as discussed in the prior section, that the standard deviation is approximately 10 (the square root of Nq(1-q)≈Nq). Also assume that the actuary uses 1.96 standard deviations to test the null hypothesis. The actual deaths would have to be greater than 119.6 (100 + 10 x 1.96), or almost 20 percent more, to conclude that the plan’s mortality was higher than the published table’s mortality. Similarly, actual deaths less than 80.4 (100 – 10 x 1.96) would lead to the conclusion the plan’s mortality was lower than the published table. If the sample population were larger by a factor of 100 (i.e., 500,000 people), expected deaths would be 10,000 and the standard deviation would be 100 deaths. In this case, actual deaths would have to be greater than 10,196 (10,000 + 100 x 1.96), or about 2 percent more, to conclude that the plan’s mortality was higher than reflected in the published table. American Academy of Actuaries 39 www.actuary.org PENSION COMMITTEE PRACTICE NOTE 2015 Thus, a medium-sized plan requires a much greater discrepancy in actual vs. expected deaths before it can be concluded that mortality does not match a given published table, and that it would be appropriate to use its own experience to develop a custom mortality table. A large plan could base the mortality assumption on its own experience with much smaller deviations from the published table. Note that this method does not have to imply 100 percent credibility for the experience data. The rejection of the null hypothesis—that the published table probabilities generated the observed mortality data—does not necessarily imply that the true probabilities are given by the experience data. Concluding the published table is “wrong” is not the same as concluding the experience data is “right.” The correct answer could well be somewhere in between, or could even be outside the range between expected and actual. Bayesian methods Bayesian approaches attempt to address the question of a “best estimate” that is not exactly equal to expected or actual mortality by assuming a (prior) probability distribution for the plan’s true mortality, and calculating a posterior (conditional) distribution for the true morality given the observed data. These calculations lead to a weighted average estimate for the mean of the conditional distribution similar to the partial credibility formula under limited fluctuation discussed above: Z * plan’s actual experience + (1 – Z) * published mortality. However, Z is not based on a square root formula, but is of the form: Z = N/(N+M) where N is experience sample size and M is the “sample size” of the prior distribution for true mortality. Selecting a logical value for M, and working through the resulting estimation formulae, is beyond the scope of this practice note. Those interested in additional information can research academic literature regarding Bayesian estimation of binomial observations, which typically uses a Beta distribution as the assumed prior distribution. References www.soa.org/files/research/projects/research-2008-benjamin.pdf American Academy of Actuaries 40 www.actuary.org

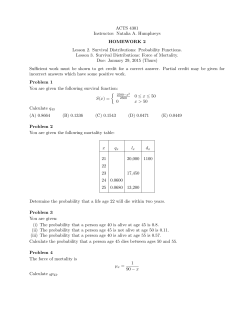


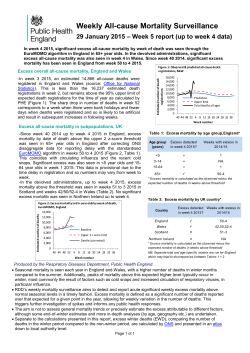


© Copyright 2026