
SHAPE INFLUENCE IN MEDICAL IMAGE SEGMENTATION WITH COLONOGRAPHY
SHAPE INFLUENCE IN MEDICAL IMAGE SEGMENTATION WITH
APPLICATION IN COMPUTER AIDED DIAGNOSIS IN CT
COLONOGRAPHY
By
Haiyong Xu
A Dissertation Submitted to the Graduate Faculty of
WAKE FOREST UNIVERSITY GRDUATE SCHOOL OF ARTS AND SCIENCES
In Partial Fulfillment of the Requirements
for the Degree of
DOCTOR OF PHILOSOPHY
Biomedical Engineering
May 2011
Winston-Salem, North Carolina
Approved By:
Peter Santago II, Ph.D., Advisor and Chairman
Examining Committee:
Yaorong Ge, Ph.D.
Robert J. Plemmons, Ph.D.
H. Donald Gage, Ph.D.
James J. Perumpillichira, M.D.
ACKNOWLEDGEMENTS
I would like to thank my advisor, Dr. Peter Santago, who has guided me to the
interesting and challenging research field of pattern recognition and medical image
processing. This dissertation would not have been possible without his constant support
on my research interests and inspiring discussions. I believe his emphases on high
quality and significant clinical impacts make me a better engineer.
I would like to thank Dr. Yaorong Ge for the fruitful discussions on technology
and methodology. His experience and expertise on CT Colonography helped me find
effective ways in solving many issues in my research.
The other members of my advisory committee, Dr. Robert Plemmons, Dr. H.
Donald Gage, and M.D. James Perumpillichira have each provided valuable insights and
comments. Thanks to Dr. Plemmons for his lectures and discussions on numerical
analysis in mathematics. Dr. Gage and M.D. Perumpillichira deserve many thanks for
their efforts in reading CT Colonography studies.
I am grateful for all the faculty and staff in the biomedical engineering department
for their assistance. Special thanks to my colleagues working on the CTC project at
Virginia Tech. Dr. Christopher Wyatt is a guru in the advanced image processing field
and made considerable contributions to my research. Thanks to Dr. Jung Wook Suh and
Yuan Shen for their work upon which I can start my research.
On a more personal note, I would like to thank my wife, Xiaolu, who believed in
me and wholeheartedly supported me in my Ph.D. study. My lovely daughter, Claire,
brought so many laughs to my life.
ii
TABLE OF CONTENTS
LIST OF TABLES .......................................................................................................... v
LIST OF FIGURES ........................................................................................................ vi
LIST OF ABBREVIATIONS .......................................................................................... vii
ABSTRACT ................................................................................................................. viii
Chapter 1 Introduction ................................................................................................... 1
1.1
Problems and Significance ............................................................................... 1
1.2
Specific Aims .................................................................................................... 2
1.3
Research Overview .......................................................................................... 4
1.4
Novelty and Contribution................................................................................... 5
Chapter 2 Background................................................................................................... 7
2.1
Colorectal Cancer and Early Detection ............................................................. 7
2.2
Current Research Status of CTC CAD ............................................................ 12
2.2.1
Rationale for CTC CAD ............................................................................ 12
2.2.2
Research topics in CTC CAD ................................................................... 13
2.2.3
Research groups ..................................................................................... 17
2.3
Image Segmentation and Shape Prior Influence ............................................. 18
2.3.1
Interactive segmentation techniques ........................................................ 19
2.3.2
Active contour models and level set methods .......................................... 20
2.3.3
Shape model based image segmentation ................................................ 23
Chapter 3 Polyp Clustering .......................................................................................... 27
3.1
Introduction ..................................................................................................... 27
3.2
Method ........................................................................................................... 28
3.2.1
Score polyps ............................................................................................ 29
3.2.2
Cluster polyps into groups........................................................................ 30
3.2.3
Align polyps in each group ....................................................................... 32
3.2.4
Reassign polyps to a different group ........................................................ 36
3.3
Results ........................................................................................................... 37
3.3.1
Cluster polyps into groups........................................................................ 37
3.3.2
Align polyps in each group ....................................................................... 39
3.3.3
Reassign polyps to a different group ........................................................ 41
3.4
Conclusion ...................................................................................................... 42
iii
Chapter 4 Polyp Segmentation using Shape Prior Models........................................... 44
4.1
Introduction ..................................................................................................... 44
4.2
Method ........................................................................................................... 47
4.2.1
Construction of shape prior models .......................................................... 47
4.2.2
Polyp segmentation using shape prior models ......................................... 50
4.3
Results ........................................................................................................... 66
4.4
Discussions and Conclusion ........................................................................... 73
Chapter 5 False Positives Reduction in Polyp Detection ............................................. 75
5.1
Introduction ..................................................................................................... 75
5.2
Method ........................................................................................................... 78
5.2.1
Select and tune a pattern recognition algorithm ....................................... 78
5.2.2
Balance two classes in intermediate polyp candidates ............................. 79
5.2.3
Integrate polyp segmentation into polyp detection ................................... 80
5.3
Results ........................................................................................................... 82
5.4
Conclusion ...................................................................................................... 87
Chapter 6 Patient-level Analysis and Future Directions ............................................... 88
6.1
Patient-level Analysis ...................................................................................... 88
6.2
Conclusions and Future Directions ................................................................. 92
References .................................................................................................................. 95
Scholastic Vita ........................................................................................................... 102
iv
LIST OF TABLES
Table 3-1 Scores for reference polyps ......................................................................... 29
Table 3-2 Morphology score clusters ........................................................................... 38
Table 3-3 Location score clusters ................................................................................ 38
Table 3-4 The number of polyps in each polyp group after k-means clustering............ 39
Table 3-5 Hausdorff distances for aligned polyps ........................................................ 41
Table 3-6 Hausdorff distances in a polyp group ........................................................... 42
Table 5-1 Pattern recognition algorithms selection and tuning ..................................... 79
Table 5-2 Top classifiers according to different ranking criteria ................................... 83
Table 6-1 Potential patient-level, aggregated polyp features ....................................... 89
Table 6-2 Example results in feature discovery and selection...................................... 90
v
LIST OF FIGURES
Figure 1.1
Research topics in this dissertation ............................................................ 4
Figure 3.1
Four morphologic types of polyp .............................................................. 28
Figure 3.2
Sessile polyps on different locations ........................................................ 28
Figure 3.3
Extraction of a polyp region ..................................................................... 33
Figure 3.4
Histogram of polyps‟ morphology score and location score...................... 38
Figure 3.5
Polyp surfaces before alignment .............................................................. 40
Figure 3.6
Polyp surfaces after alignment. ................................................................ 41
Figure 3.7
Overlaid polyps before and after alignment .............................................. 41
Figure 4.1
The boundary between a polyp and its surrounding colon tissues ........... 45
Figure 4.2
An example of a level set image .............................................................. 47
Figure 4.3
An example of a shape prior model with three modes.............................. 49
Figure 4.4
Illustration of the two forces in the evolution of a level set function .......... 52
Figure 4.5
Four steps in segmenting a corpus callosum using ShapeGAC ............... 52
Figure 4.6
Five steps in segmenting a simulated polyp ............................................. 52
Figure 4.7
An example of weak edge leakage using the modified ShapeGAC .......... 54
Figure 4.8
An object with weak edges ...................................................................... 55
Figure 4.9
Extract a polyp surface from a colon surface ........................................... 65
Figure 4.10 Six training polyps used in constructing a shape prior model. .................. 66
Figure 4.11 Minimization of the objective function in ShapeRegistrationCV. ............... 67
Figure 4.12 Segmentation results of 19 polyps ........................................................... 71
Figure 4.13 Segment polyp surfaces with different initial positions. ............................ 72
Figure 4.14 User interface of the CTCCAD module in 3D Slicer. ................................ 73
Figure 5.1
Examples of three intermediate polyp candidates ................................... 77
Figure 5.2
A mean polyp surface overlaid with a segmented polyp surface .............. 82
Figure 5.3
Classification results from random oversampling and SMOTE. ................ 84
Figure 5.4
Illustration of the new features ................................................................. 86
Figure 6.1
Potential classifications of patient-level features ...................................... 90
Figure 6.2
Plot of minimum centerline distance to the lumen .................................... 92
vi
LIST OF ABBREVIATIONS
AAM
Active Appearance Model
ANN
Artificial Neural Network
ASM
Active Shape Mode
AUC
Area under the ROC Curve
CAD
Computer Aided Diagnosis
CRC
Colorectal Cancer
CT
Computed Tomography
CTC
CT Colonography
DFB
Distance from Boundary
DFR
Distance from Rectum
DICOM
Digital Imaging and Communications in Medicine
EC
Electronic Cleansing
EM
Expectation Maximization
GAC
Geodesic Active Contour
GPA
Generalized Procrustes Analysis
GVF
Gradient Vector Flow
ITK
Insight Segmentation and Registration Toolkit
MAC
Magnetostatic Active Contour
MAP
Maximum a Posteriori
MTANN
Massive Training Artificial Neural Network
PCA
Principal Component Analysis
PVE
Partial Volume Effect
ROC
Receiver Operating Characteristic
SMOTE
Synthetic Minority Over-sampling Technique
SVMs
Support Vector Machines
VTK
Visualization Toolkit
WEKA
Waikato Environment for Knowledge Analysis
vii
ABSTRACT
Haiyong Xu
SHAPE INFLUENCE IN MEDICAL IMAGE SEGMENTATION WITH APPLICATION IN
COMPUTER AIDED DIAGNOSIS IN CT COLONOGRAPHY
Dissertation under the direction of
Peter Santago II, Ph.D., Professor of Biomedical Engineering
Computer-aided diagnosis (CAD) is a procedure in medicine that assists
radiologists or physicians in the interpretation of medical images. The application of CAD
in screening colorectal cancer (CRC) has been studied for more than two decades. CRC
is the second most deadly form of cancer in men and women in the United States.
Nearly all CRC arises from polyps and is preventable if polyps are removed in their early
stage. Recent researches show that radiologists demonstrated higher accuracy in
finding polyps with CAD than without CAD. In this dissertation, we review the current
status of CAD research in CT Colonography (CTC) and propose a new method to
segment and detect polyps in CTC CAD.
Advanced polyp segmentation and detection methods can improve the cost
effectiveness of CTC by reducing the time used by radiologists in examining CTC
studies. With polyp segmentation, we can characterize a polyp by its size, height,
volume, and texture, all of which can be computed automatically. And this information is
valuable in discriminating polyps from false positive detections such as haustral folds,
residual stool, and the rectum tube.
We propose a model-based approach to segment and detect polyps. Initially, a
number of manually segmented polyps are aligned to remove the translation, rotation,
and scaling effects. A polyp shape model is constructed using the aligned polyps, among
which the shape variances are captured by principal component analysis. A model-
viii
based registration method is employed to transform and deform the polyp shape model
in order to match a polyp in a CTC study. In the final step, a polyp surface is identified by
a deformable registration. We evaluated our segmentation results by comparing them to
manually segmented polyp surfaces. The dice coefficient, which indicates the overlap
ratio, is 84.5%±3.7 for 19 polyps in 12 patients. In order to improve the polyp detection in
CAD, we derived a new feature, the magnitude of deformation from a polyp shape model
to a polyp candidate, from the segmentation results. Since we have both a polyp model
and a segmented polyp candidate, more features can be extracted to reduce false
positive detections in the future.
We contributed to the CTC CAD field as follows: 1) devised a new approach to
segment and detect polyps based on polyp shape models; 2) promoted the open source
development in CTC CAD by utilizing 3D Slicer, ITK, and VTK; 3) improved the
classification system design in CTC CAD by comparing a group of classifiers and tuning
their parameters.
ix
Chapter One
Introduction
1.1
Problems and Significance
Colorectal cancer (CRC) is the third most common and the second most deadly
form of cancer in men and women in the United States [1]. Colonoscopy can be used for
screening and is the follow-up procedure for any other screening test that indicates the
presence of CRC or adenomatous polyps. There are, however, significant drawbacks to
colonoscopy [2]. Unlike colonoscopy, computed tomographic colonography (CTC) is a
minimally invasive screening technique for CRC and avoids many of the problems
associated with colonoscopy [2]. Computer-aided diagnosis (CAD) in CTC is an active
research topic which is designed to reduce the interpretation time and sensitivity
variation among readers in CTC [3].
CAD for CT Colonography (CTC CAD) is maturing rapidly. In the laboratory
setting, sensitivities for detecting clinically significant polyps are as high as 85-100% with
less than 10 false positives per patient [4-10]. These sensitivities reach or exceed those
achieved by radiologists. Although high sensitivity is achievable in CTC CAD, there are
many challenges ahead and new and useful results are anticipated in the near future.
The major challenges are in the areas of increased sensitivities for small and flat polyps,
decreased false positive rate, electronic cleansing for the unprepared colon, and
matching of detections on the supine and prone exams. The second challenge,
decreased false positive rate, is addressed in this dissertation.
A relatively large number of false positive detections in CTC decrease its cost
effectiveness. In CTC CAD, a large number of false positives make radiologists spend
1
more time on examining false positive polyp candidates, which may hinder rather than
assist them in detecting polyps. Additionally, one common type of false positives in CTC
CAD is the rectum tube, which can be easily recognized by a radiologist as false
positives. Including many easily recognized false positives in CTC CAD may make
radiologists less confident in it as a helpful tool. Therefore, high false positive rate
prevents the wide application of CTC CAD in clinical environment.
Reducing false positive detections in CTC CAD can help radiologists in making
optimal patient referral, which is the primary goal of CTC as a screening technique for
CRC. The purpose of CTC CAD is to automatically locate possible polyps (polyp
candidates), annotate CT images, and present a list of locations of polyp candidates. A
radiologist can review the list of polyp candidates and make the final decision of a
colonoscopy referral. Less false positives in CTC CAD can reduce radiologists‟ burden in
unnecessary examination of false positives and make them focus on true positive
detections, both of which lead to more accurate patient referral. And improving the
referral accuracy can increase the cost effectiveness of CTC. As a consequence, CTC
would be widely adopted as an effective screening method to reduce the incidence and
mortality of CRC. A number of recent researches evaluated the performance of
radiologists assisted by CTC CAD [11-16]. And the results show that radiologists
demonstrated high accuracy with CTC CAD than without CTC CAD.
1.2
Specific Aims
We propose a new method to reduce false positives in CTC CAD. The idea is
that a polyp-looking surface can be obtained if a polyp candidate is a true positive
detection. Otherwise, for a false positive detection, the attempt to retrieve a polyp
surface in the polyp candidate region will fail. Specifically, we devise a polyp
segmentation method that can segment a polyp boundary in a polyp candidate region.
2
And features derived from the polyp segmentation results are used to reduce false
positives.
Specific Aim 1: Incorporate prior knowledge of polyp shape in polyp segmentation.
Polyp segmentation identifies the polyp boundary in a polyp candidate region.
With a polyp boundary, a variety of information of a polyp can be obtained, for example,
the polyp size and pixels inside a polyp. However, polyp segmentation is a challenging
task because the boundary between a polyp and its surrounding colon tissues is obscure.
This means the boundary is difficult to be obtained based on CT images signal alone.
We propose a method that incorporates the prior knowledge of polyp shape to address
this problem. In this method, manually segmented polyps are used to construct shape
prior models which represent shape variances in polyps. These models are then
integrated into a polyp segmentation process to help identifying the boundary between a
polyp and its surrounding colon tissues.
Specific Aim 2: Reduce false positives using new features derived from polyp
segmentation results.
The polyp segmentation generates a polyp boundary for each polyp candidate.
For a true positive candidate, the shape of the boundary is similar to a polyp which is
embedded in a shape model. For a false positive candidate, however, there is no polyp
in the candidate region and the shape of the boundary is apparently different from a
polyp. A number of features derived from a boundary in a segmentation result can be
used to measure the similarity between the boundary and a polyp in a model. Also,
additional features derived from the pixels inside or outside a boundary can be obtained.
These new features, which are not available in current CTC CAD, are complementary to
existing features to further reduce false positive detections in CTC CAD.
3
1.3
Research Overview
3
Chapter 2:
background
4
score polyps:
morphology
& location
PCA
polyp
scores
K-means
Chapter 3:
polyp
clustering
Chapter 4:
polyp
segmentation
align polyps
in a group
refined
polyp
group
polyp group 1
polyp group 2
……
refine a polyp
group
model-based
registration
polyp
model
Chan-Vese
CTC
image
deformable
registration
polyp
surface
deformation field
Chapter 5:
polyp
detection
5
select and tune
a classifier
balance the
training data
generate new
features
train a classifier to reduce false positives
Chapter 6:
patient-level
analysis
6
aggregated
polyp features
colon
features
feature
selection
Figure 1.1 Research topics in this dissertation.
Figure 1.1 highlights the research topics in this dissertation. Chapter two reviews
the background of CTC CAD and the image segmentation methods. In chapter three, we
conduct an experiment to cluster polyps into several groups such that all polyps within a
group are similar in terms of shapes. At first, polyp surfaces are visually examined by
three observers and the morphology and location scores are obtained for each polyp.
Then, polyps are clustered using the K-means algorithm according to their scores. Since
the scores cannot precisely describe polyp shapes, we align polyps within a group and
4
refine a group by removing polyps which cannot be aligned with other polyps in the
group. A refined polyp group is used in the polyp segmentation.
In chapter four, principal component analysis (PCA) is applied to a refined polyp
group to generate a polyp model. Then a model-based registration method is employed
to register the polyp model and CTC images in order to overlap the model on the images.
Concurrently, Chan-Vese model is used to segment colon surface in the CTC images.
Further, a deformable registration algorithm, which takes the outcomes of the modelbased registration and the Chan-Vese model as inputs, is used to generate a polyp
surface. The deformation registration also generates a deformation field which is used in
the polyp detection to derive new features.
In chapter five, a classifier is trained to reduce false positives in intermediate
polyp candidates. Two questions in the classification algorithms are addressed: 1) how
to select an appropriate algorithm and set its parameters for a particular classification
problem; 2) how to handle extremely unbalanced training data. In addition, new features
that are derived from the deformation field are evaluated in reducing false positives in
our CTC CAD.
Chapter six summarizes our initial work on patient-level analysis using two types
of features: aggregated polyp features and colon shape features. We conclude the
dissertation by discussing the future research directions on polyp segmentation, polyp
detection, and patient-level analysis.
1.4
Novelty and Contribution
To the best of the author‟s knowledge, this research is the first attempt in CTC
CAD field that incorporates the prior knowledge of polyp shape in segmenting polyps.
Although there are several publications on polyp segmentation methods, the field of how
to effectively integrate the polyp segmentation and polyp detection into one process has
5
not been explored. Therefore, this is also the first systematic study in utilizing the polyp
segmentation result to reduce false positive detections in CTC CAD.
In this dissertation, the following contributions have been made to the CTC CAD
field: 1) devised a new approach to segment and detect polyps based on polyp shape
models; 2) promoted the open source development in CTC CAD by utilizing 3D Slicer,
ITK, and VTK; 3) improved the classification system design in CTC CAD by comparing a
group of classifiers and tuning their parameters
6
Chapter Two
Background
The use of CT images as the screening tool for CRC was proposed as early as
1980 [17]. Over a decade later the term “virtual colonoscopy” was formally introduced in
[18]. Since then, great advances in software and hardware have occurred and a number
of clinical trials have been conducted to assess the feasibility of CTC as the screening
technique. In this chapter, we provide an overview of the screening techniques for CRC
and review the current research status of CTC CAD. Since one of the technical
challenges in this research is the polyp segmentation using shape prior models, we
review the state of the art image segmentation techniques with emphasis on the shape
prior influence in medical image segmentation.
2.1
Colorectal Cancer and Early Detection
CRC is the third most common and the second most deadly form of cancer in
men and women in the United States [1]. CRC largely can be prevented by the early
detection and removal of adenomatous polyps, and survival is significantly better when
colorectal cancer is diagnosed while still localized [2]. Modern screening techniques for
CRC can reduce the incidence and mortality of CRC through the detection and removal
of early-stage adenocarcinomas and adenomatous polyps [2]. Colonoscopy is the
current gold standard for the diagnosis for CRC [19]. CTC is a minimally invasive
screening technique and avoids many of problems associated with colonoscopy [2]. A
large amount of efforts have been made in CTC CAD by several research institutions
and business entities around the world to improve the CTC‟s efficacy as the screening
tool for CRC [2].
7
CRC arises from mucosal polyps. The two most common histological types of
polyp are hyperplastic and adenomatous. According to the traditional adenoma-tocarcinoma sequence, nearly all colorectal cancers arise from adenomatous polyps.
Clinical studies suggest that over 95% of colorectal carcinomas arise from those slowgrowing adenomatous polyps [20]. The progression of an adenoma into a carcinoma is
predicted to take about 10 years [17]. Consequently, polypectomy of colorectal
adenomas was shown to reduce the incidence of CRC by nearly 80% [21]. Progression
of an adenoma into cancer can be predicted by size, villous histology, degree of
dysplasia, and inherited or environmental factors [20]. The risk of a polyp being
cancerous increases as the size of the polyp increases. A study found that there is only
a 1.3% risk that a polyp less than 10 mm in diameter is a carcinoma [17]. In comparison,
a polyp 10 mm to 20 mm in size has a 9.5% chance of malignancy and a polyp greater
than 20 mm has a 46% chance of malignancy [17]. Polypectomy of polyps that are at
least 5 mm, 6mm to 8 mm, or 10 mm has been suggested by various experts [22-24].
CRC screening techniques
The goal of cancer screening is to reduce mortality through a reduction in
incidence of advanced disease. Today, there are a range of options for CRC screening
in the average-risk population, with current technology falling into two general categories:
stool tests, which include tests for occult blood or exfoliated DNA; and structural exams,
which include flexible sigmoidoscopy, double-contrast barium enema, colonoscopy,
computed tomographic colonography, and wireless capsule endoscopy. Stool tests are
best suited for the detection of cancer, while the structural exams can achieve the dual
goals of detecting adenocarcinoma as well as identifying adenomatous polyps. These
tests may be used alone or in combination to improve sensitivity or to ensure a complete
examination of the colon.
8
FOBT - Stool blood test is conventionally known as fecal occult blood test
(FOBT). Blood in the stool may originate from CRC or larger (>1 to 2cm) polyps. Despite
its low sensitivity and specificity, FOBT is a cost-effective screening method because of
the low unit expense, noninvasive process, and easy portability. A positive FOBT should
be followed by colonoscopy. If the test is negative, it should be repeated annually.
sDNA - Stool DNA test (sDNA) tests stool for the presence of known DNA
alterations in the adenoma-carcinoma sequence of colorectal carcinogenesis. Because
no single gene mutation is present in cells shed by every adenoma or cancer, a
multitarget DNA stool assay is required to achieve the adequate sensitivity. An sDNA
designed specifically for CRC and is commercially available is ProgenePlus from EXACT
Sciences, Marlborough, Massachusetts [25]. Since sDNA sampling is noninvasive and
lacks physical harm, patient and provider acceptance of this technique appears to be
high. A clear limitation of sDNA is that test sensitivity is based on a panel of markers that
appears to identify the majority of but not all CRC. Another limitation is that the unit cost
of the current test is much higher than the other stool tests.
FSIG - Flexible sigmoidoscopy (FSIG) is an endoscopic procedure that examines
the lower half of the colon lumen, which includes only rectum, sigmoid, and descending
colon. It is typically performed without sedation and with a more limited bowel
preparation than standard colonoscopy. The effectiveness of FSIG depends on the
completion of a high quality exam. The chief limitation of FSIG is that it does not
examine the entire colon. Therefore, the protective effect of FSIG is primarily limited to
the portion of the colon examined. Patients with positives testing findings need to be
followed up with colonoscopy. And if the test is negative, it should be repeated every five
years.
DCBE - The double-contrast barium enema (DCBE) evaluates the colon in its
entirety by coating the mucosal surface with high-density barium and distending the
9
colon with air. Multiple radiographs are acquired while varying the patient position during
direct fluoroscopic evaluation and with conventional radiographic equipment. The
potential benefits derived from the DCBE are that it evaluates the entire colon in almost
all cases and can detect most cancers and the majority of large polyps. However, the
acceptability of DCBE may be limited by the requirement for extensive colonic
preparation, and low sensitivity for significant adenomatous polyps. The use of DCBE for
CRC screening in average-risk adults is declining [26, 27] due to its labor-intensive
nature, the low reimbursement rate, and greater interest in newer and more complex
technologies such as computed tomography (CT).
Colonoscopy - Colonoscopy is one of the most commonly performed medical
procedures in the United States [2]. It allows direct inspection of the entire of colon and
same-session biopsy sampling or definitive treatment by polypectomy in the case of precancerous polyps and some early-stage cancers. In colonoscopy, patients generally
adopt a liquid diet one or more days before the examination, followed by either ingestion
of oral lavage solutions or saline laxatives to stimulate bowel movements until the bowel
is clean. The principal benefit of colonoscopy is that it allows for a full structural
examination of the colon and rectum in a single session and for the detection colorectal
polyps and cancers accompanied by biopsy or polypectomy. All other forms of screening,
if positive, require colonoscopy as a second procedure. Bowel preparation is a critical
element in the accuracy and cost-effectiveness of screening with colonoscopy, however,
is also the biggest concern by patients [19]. Other limitations of colonoscopy include the
need for patient sedation, incidence of perforation, failed cecal intubation, incompletion
of the procedure, and considerable polyp miss rate [2, 17, 19]. At present, colonoscopy
every 10 years is an acceptable option for CRC screening in average-risk adults
beginning at age 50 years [2].
10
CTC - Computed tomographic colonography (CTC), also referred as virtual
colonoscopy, is a minimally invasive imaging examination of the entire colon and rectum.
CTC uses CT to acquire images and employs advanced 2D and 3D techniques for
interpretation. Adequate bowel preparation and gaseous distention of the colon are
essential to ensure a successful examination, which is also a limitation that may
decrease patient adherence. Several clinical improvements in patient preparation,
technical advances in CT, and new developments in evaluation software have allowed
CTC to develop into a powerful diagnostic tool [28]. Despite its relatively early in
utilization, recent studies have demonstrated the efficacy of CTC in [23], [29], and [30].
The management of CTC findings is an important part of the CTC screening
technique. At this time, there is consensus that all patients with one or more polyps >=10
mm or three or more polyps >=6 mm should be referred for colonoscopy [31]. Patients
with one or two 6 to 9 mm polyps identified on CTC are also recommended to
colonoscopy. Patients who decline referral to colonoscopy or who are not good
candidates for colonoscopy should be offered surveillance with CTC. Screening of
average-risk adults with CTC should commence at age 50 years. The interval for repeat
exams after a negative CTC should be five years.
WCE - Wireless Capsule Endoscopy (WCS) is recently established methodology
that offers gastroenterologists the capability to examine the interior of the small intestine
and colon with a capsule. At one end of the capsule, there is a miniaturized color camera
and an optical dome with light-emitting diodes (LEDs). The camera can operate up to
8~10 hours and capture more than 50,000 images, which are then transmitted wirelessly
to a storage device worn by a patient. It is important to mention that WCE technology
has been used in colonoscopy (PillCam Colon from Given Imaging, Ltd., Israel).
However, the viewing and evaluation of each WCE video is a time-consuming process,
11
which makes the WCE methodology not widely efficient and acceptable for
gastroenterologists [32].
There are pros and cons to having a range of options for CRC screening. The
primary barriers to screening are lack of health insurance, lack of physician
recommendation, lack of awareness of the importance of CRC screening, and different
preferences and resistance to a particular technology in the population. These
challenges have been discussed in the past and they still are with us today.
2.2
Current Research Status of CTC CAD
2.2.1
Rationale for CTC CAD
Although CTC is emerging as a new non-invasive technique for CRC screening,
three factors limit the widespread utilization of this technique: (1) the need for colon
cleansing, (2) the readers‟ expertise required for interpreting the examination, (3) and
the unknown diagnostic performance when applied in a mass screening program [3].
CTC CAD addresses some of these issues of CTC.
The primary goal of CTC CAD is to locate possible polyps automatically and
present a list of locations of possible polyps to a reader. The secondary goal is to
improve per-polyp and per-patient sensitivity, to reduce interpretation time and to
decrease inter-observer variability with fewer false positives. With the help of CTC CAD,
CTC detection may provide some reliable improvement by bring high probability polyp
sites to the attention of a reader, or even by using CTC CAD alone. Computer algorithms
in CTC CAD are intrinsically immune to fatigue and experience variations, which are
major subjective reasons for inter- and intra-observer variations. In addition, CTC CAD
can reduce the CTC cost by shortening the interpretation time. Thus, with wide
12
application of CTC CAD, CTC may become a cost-effective method for colorectal cancer
screening.
2.2.2
Research topics in CTC CAD
A typical CTC CAD is a multi step procedure consisting of four steps:
segmentation of colonic wall, generation of intermediate polyp candidates, reduction of
false positives, and presentation of detections. The rest part in this subsection reviews
the current research status in these four fields. Other research topics that do not fall into
these fields, such as electronic cleansing, registration, etc., will be reviewed at the end of
this section.
Segmentation of colon wall – The task of extracting the colon wall from the
abdomen CT images is to prevent CTC CAD from processing non-colon tissue in
following steps. Several fully automated methods for colon segmentation have been
developed in [33-38]. One of the most difficult challenges in segmenting colon is the
partial volume effect (PVE). In [39], authors modeled PVE from statistical perspective.
Authors in [40] proposed an expectation maximization (EM) approach to estimate tissue
mixture percentages within each image voxel. In [41], authors presented a novel method
to model PVE and automatically classify CT image into material fractions by a scale and
rotation invariant edge model. This method uniquely combines robustness to noise,
global signal fluctuations, anisotropic resolution, non-cubic voxels, and ease of use. A
byproduct of colon segmentation is to generate colon centerline which is used in flythrough examination by radiologists. Automated generation of the colon centerline is
another challenge in CTC CAD. A method that determines a sub-voxel-level centerline
has been developed in [42]. In this method, the problem of collapsed portions of the
colon, where the lumen segmentation fails to produce a continuous centerline, is fixed
through segmentation of the outer wall of the colon. And the loops in the colon caused
13
by over-distention are detected and removed. Therefore, a complete centerline is
generated and can be used to automatically determine the amount of distention
throughout the colon and aid in CTC fly-through examination.
Generation of intermediate polyp candidates – After the extraction of colon,
possible polyp regions, called intermediate polyp candidates, are detected based on
geometric and/or photometric features characterizing these lesions. Various strategies
have been devised to identify possible polyp regions and the most popular approach is
based on curvature related features, such as shape index and curvedness proposed in
[43]. In [44], the authors used a rule based filter on geometric features to generate
possible polyp regions. In [45], the authors generated candidates by searching for
convex regions and fitting a sphere to the surface normal field. Recently, several new
approaches have been proposed in identifying polyp candidates including the detection
of protrusion by second principal curvature flow, projection features, and features
extracted from polyp segmentation. The method in [46] works by locally deforming the
colon surface until the second principal curvature becoming smaller than or equal to zero.
The novelty of this approach is that it removes protruding elements from the underlying
data while leaving the highly structured folds intact. Another new method in [47] is to
project a volume data of a polyp candidate region into a 2D image. And features are
extracted from both gray and color projection images. In this approach, the intensity
distribution or texture inside a polyp candidate region can be obtained to differentiate
false positives from true ones. A couple of polyp segmentation methods have been
proposed in order to extract features based on a polyp boundary [48-50]; A deformable
model based approach was adopted in [48, 49] to identify a polyp boundary and a multistaged probabilistic binary classification approach was employed in [50] to automatically
segment polyps.
14
Reduction of false positives – After generation of intermediate polyp candidates,
there are a large number of false positives in those candidates. This is because a high
sensitivity is desired in order to not miss polyps in the candidates, and usually a low
specificity is the consequence of high sensitivity at this step in CTC CAD. It is important
to reduce the number of false positives as much as possible while maintaining a high
sensitivity. Major sources of false positives in CTC CAD include haustral folds, residual
stool, rectal tube, ileocecal valve, and extra-colonic structures such as small bowel and
stomach. Various methods have been developed to reduce false positives, almost all of
which employed pattern recognition algorithms. A variety of features have been
employed that are extracted from a cluster of voxels, volumetric texture, CT attenuation,
wavelet coefficients, projection [47], and topographic height map. And a number of
pattern recognition algorithms have been utilized in CTC CAD, for example, linear
discriminant analysis (LDA), quadratic discriminant analysis (QDA), artificial neural
network (ANN), support vector machines (SVMs), ensemble of ANN, and SVMs. Several
methods were designed to reduce a specific type of false positives such as rectal tube
[51, 52] and ileocecal valve [53]. With the help of advanced methods in false positive
reduction, current state of the art CAD can reach sensitivity as high as 85-100% for
clinically significant polyps with less than 10 false positives per patient [15].
Presentation of detections – After reducing false positives, the CTC CAD
presents final polyp candidate as a list to a radiologist. Usually, in the presentation, 2D
images from CTC studies together with 3D volumetric representation are displayed to
assist users in image interpretation and making a final decision whether it is a true
positive or a false positive. The 2D images give radiologists an opportunity to assess the
native information in a CT study, such as CT pixel intensity. And the 3D representation
provides an intuitive way for radiologists to visually examine the polyp candidate region.
More information, for example, distance to anus, linear size and volume measurement,
15
are useful features in CTC CAD to assist radiologists in making a patient referral
decision. The remaining task of a radiologist is to either verify (true positives) or reject
(false positives) polyp candidates.
Electronic cleansing – Electronic cleansing (EC) is an emerging technique for
removal of tagged fecal materials in fecal tagging CTC images after the image
acquisition, and thus to avoid the physical bowel cleansing prior to CT scanning. Fecal
tagging is usually done by oral administration of a positive contrast agent (barium or
iodine) before CTC. EC can greatly relieve patients from discomfort and inconvenience
associates with cathartic preparation, therefore, to increase patients‟ preference to CTC.
In EC, challenges such as soft tissue structure degradation and pseudo enhancement of
soft tissue need to be addressed. In [54], the authors devised a structure-analysiscleansing method that uses local morphologic information to enhance fold-like and
polyp-like structures which are submerged in the tagged materials. Recently, authors in
[55] and [56] independently developed EC schemes that make use of dual-energy CT
images and demonstrated that non-cathartic dual-energy CTC has potential to improve
the quality of EC.
Other major research topics in CTC CAD include registration of supine and prone
CTC images, colon visualization, and colon flattening. Registration between supine and
prone CTC images can increase sensitivity of polyp detection [57] since some polyps
may be submerged in residue in one study. In [58], the authors proposed a method
based on feature matching of colon centerlines and non-rigid registration of lumen
surfaces which are represented as level set functions. A 3D visualization technique for
CTC, called fly-over navigation, was proposed in [59]. In fly-over navigation, which is
different from fly-through mode, the colon is split along its centerline into two halves, and
each half is assigned a virtual camera that performs virtual fly-over navigation. This new
technique can visualize nearly 100% of the colon‟s inner surface, and reduce
16
radiologists‟ interpretation time by ~50%. Colon flattening technique is to cut colon along
longitude and map the 3D inner surface to a 2D domain. In [60], the authors proposed a
shape preserving flattening method and integrated the flattened colon into CTC CAD to
assist 3D navigation. This flattened colon provides users with an overview of the entire
colon structure in a single 2D view, ensuring that no regions are missed by radiologists
due to folds or other structural obstructions.
2.2.3
Research groups
The Imaging Biomarkers and Computer-Aided Diagnosis Laboratory at NIH, led
by Dr. Summers, is one of the most active research groups in CTC CAD. They have
presented their work on various areas in CTC CAD integration, classification, polyp
database management, polyp size and height measurement, etc.
Dr. Yoshida at Massachusetts General Hospital, together with his previous
colleagues in University of Chicago, has made pioneering work in CTC CAD. Now, their
research efforts are focusing on the electronic cleansing technique.
A research group at Stony Brook University, led by Dr. Liang and Dr. Kaufman,
works on areas such as colon segmentation, feature discovery, polyp detection, and
visualization in CTC CAD. Their research work has made a huge contribution in a
commercial product called V3D Colon TM.
Dr. Suzuki leads a group at University of Chicago to conduct research on
computer-aided diagnosis of lesion in the abdomen, thorax, and heart. They applied
pattern recognition technique to reduce false positives in CTC CAD. And one of the most
important contributions from this group is the massive-training ANNs (MTANN).
Dr. Napel from the Radiology 3D Laboratory at Stanford University has
conducted research works on virtual endoscopy in past. Now, most of his research effort
17
on CTC CAD is related to pre-processing steps, for example, polyp enhancement and
image smoothing effect on polyp detection.
A research group, led by Dr. Vliet and Dr. Vos at Delft University of Technology
in Netherlands, are working actively in electronic cleansing area [61] and using second
principal curvature flow to detect polyps [46].
Mori Laboratory at Nagoya University in Japan has spent several years working
on haustral folds detection and teniae coli extraction in order to assist polyp detection in
CTC CAD. Their recent research is the registration of supine and prone CT images [62].
CT Colonography Research Group at Wake Forest University, led by Dr.
Santago, and Bioimaging Systems Lab at Virginia Tech, led by Dr. Wyatt, are working
together to conduct research on CTC areas as supine and prone CTC images
registration, polyp feature extraction, patient level analysis, and image guided
colonoscopy.
Beside these research entities, several software companies also contributed to
the CTC CAD field through rigorous implementation and pioneering research, for
example, iCAD, Viatronics, and Medicsight. On 4 August 2010, VeraLook™ from iCAD
became the first CTC CAD product received 510(k) clearance from the FDA [63]. This
may improve the effectiveness of CTC as CRC screening technique.
2.3
Image Segmentation and Shape Prior Influence
Segmentation of colon is one of the fundamental problems in CTC CAD, which
acts as the pre-step for all following processes such as visualization, feature extraction,
and false positives reduction. One of the most challenging tasks in this dissertation is
polyp segmentation. Before delving into the details of the proposed method, let us
review several image segmentation methods in this section with emphasis on the shape
prior influence in medical image segmentation.
18
Image segmentation is a challenging task and a myriad of methods have been
proposed and implemented since 1980s. They fall into two categories: automated and
interactive. Several novel interactive segmentation methods made a breakthrough in the
last decade. A recent study in liver segmentation from CT images shows that interactive
image segmentation methods reach higher accuracy than automated approaches and
have a better consistency of segmentation quality [64]. The state of the art techniques in
image segmentation area are those methods related to the graph cuts, which is an
interactive method, and the active contour models, which is regarded as a semiautomatic or automatic method depending on how the initial position is placed.
2.3.1
Interactive segmentation techniques
An early interactive image segmentation algorithm, called intelligent scissors [65],
or live-wire, allows a user to select a region of interest to be extracted using simple
mouse clicks. When a user clicks on proximity to an object boundary, a live-wire snaps
to and wrap around the object of interest. This provides instant feedback of the
segmentation result to users. In its mathematic formulation, Dijkstra algorithm is used to
calculate the shortest path between neighboring points. However, in the cases of low
contrast or noisy boundaries, the shortest path may shortcut the desired boundary. And
the algorithm requires a large number of user interactions to obtain a satisfactory result.
Intelligent scissors has been implemented in open source software ITK and GIMP [66,
67].
The graph cuts technique has been developed as a method for interactive
segmentation and gained great momentum since its introduction [68]. Similar to the
intelligent scissors, graph cuts views the image as a weighted graph. A user marks some
nodes as foreground and background and the algorithm performs a max-flow/min-cut
analysis to find the minimum-weight cut between the foreground and the background.
19
Problems with this technique are that it requires a lot of user interactions to achieve
desirable segmentation results and it is strongly affected by noises in an image. The
grab cuts method extends the graph cuts technique to segment color images and to
provide simpler user interaction [69]. However, in grayscale images, which are
commonly seen in medical fields, the grab cuts method does not perform well because
of its simpler mode of user interaction.
Recently, a novel method, called random walks, has been proposed for
performing multi-label, interactive image segmentation [70]. Similar to graph cuts, this
algorithm also models an image as a graph and requires users to define a small number
of pixels with labels (pre-labeled pixels). The algorithm analytically determines the
probability that a random walker starting at each unlabelled pixel will first reach one of
the pre-labeled pixels. By assigning each pixel to the label for which the greatest
probability is calculated, high-quality image segmentation may be obtained.
In [71], Bai and Sapiro proposed a method that computes weighted geodesic
distances from individual pixels to the user provided labels. The labels are roughly
placed in foreground and background regions of interest as the graph cuts does. The
geodesic distance from these scribbles is calculated to classify pixels. The GeoS
algorithm [72] further extends the geodesic framework [71] on improving the processing
speed and handle complex energy models. In [73], a common framework for seeded
image segmentation algorithms was presented, which yields two of the leading
interactive image segmentation methods, graph cuts and random walker, as special
cases.
2.3.2
Active contour models and level set methods
For those interactive segmentation methods, such as graph cuts, random walks,
and geodesic framework based algorithms, we can obtain satisfactory results through
20
many user interactions to indicate foreground and background. Given more user
interactions, the segmentation result is usually more precise. However, a relatively large
number of user interactions in these methods prevent them from being applied in
automated segmentation cases. By comparison, active contour models and level set
method only require an initial contour to be placed by a user. In several recently
proposed level set methods, this initial contour can be automatically placed evenly inside
an image. This property of less user interactions makes active contour models and level
set method applicable to the automated segmentation scenarios.
The original form of active contour models, or snakes, was proposed by Kass et
al. in [74]. This method, which belongs to parametric active contours, evolves a contour
based on internal and external forces. The internal forces, which are defined within the
contour, are designed to smooth the contour during evolution, and the external forces,
which are computed from the segmented image, are defined to move the contour toward
desired boundaries. In [75], the authors extended the active contour models to 3D as a
balloon model. Three key problems with the initial forms of active contour models are: 1)
the contours have difficulties progressing into boundary concavities; 2) the topologic
changes are difficult to be handled; 3) the initial contours need to be placed close to the
desired boundary in an image.
Several methods have been proposed to address the problem of boundary
concavities. The gradient vector flow (GVF) and generalized GVF (GGVF) were devised
as a new external force in [76]. This new external force is computed as a diffusion of the
gradient vector of a grayscale or binary edge map derived from an image. This GVF and
GGVF have a large capture range and are able to move contours into boundary
concavities. However, they fail to evolve active contours at saddle points, i.e., the
contour is tangent to the GVF force vector. In [77], the authors combined GVF and
geodesic active contour (GAC) to evolve contours. By considering the directions of
21
normalized GVF, the proposed method can continue expand or contract active contours
through GAC forces even the contour is tangent to the GVF force vector. A recent
method proposed in [78], which is called magnetostatic active contour model (MAC),
uses an external force field that is calculated from hypothesized magnetic interactions
between a contour and object boundaries. This external force field is calculated as the
contour evolves, therefore, MAC provides a dynamic force field whereas all previous
methods employed a static force field. This method greatly improves the active contour
models in capturing the complex geometries and dealing with difficult initializations,
weak edges, and broken boundaries. MAC was extended in [79] to include a level set
regularization term in order to handle topologic changes.
Another research direction of active contour models is to represent active
contours implicitly. Such active contour models are called geometric active contours.
Active contours are usually represented as a level set and the method to evolve the
implicit active contours is called level set method [80]. In [81], the authors introduced the
level set method by modeling the propagation of solid and liquid interface with curvature
dependent speeds. In [82], the authors improved the level set method to include an
additional speed term to stop the active contours in the vicinity of object boundaries,
which is similar to one of the most popular active contour models, geodesic active
contours. The authors in [83] proposed the geodesic active contours (GAC) based on
the relation between active contours and the computation of geodesics or minimal
distance curves. Beside constant and curvature dependent terms in the original level set
method, this geodesic formulation introduced a new term to the contour evolution model
that further attracts the deforming contour, either inside or outside, to an boundary in an
image.
All above level set methods make use of edge information in an image, such as
gradient and curvature, to evolve contours. They are called boundary-based level set
22
methods. In [84], the authors proposed a region-based approach that uses stopping
terms based on the Mumford-Shah segmentation formula. In contrast to boundary-based
schemes, the region-based approach tends to be less sensitive to noise and have less
local minima, both of which make it particularly well-suited in solving medical image
segmentation problems.
2.3.3
Shape model based image segmentation
In the previous sections, we discuss a number of image segmentation
approaches that use image information to extract boundaries, such as intensity, gradient,
curvature, etc. This image information, called low level information, may not be sufficient
to generate the desired segmentation in real world applications. For example, in medical
images, an object and its background may exhibit similar intensity, the intensity may not
be uniform inside an object due to inhomogeneity, and noise or partial occlusion of the
object will appear in 2D projections. These situations may mislead those methods, which
are entirely based on low level information, to a false segmentation. To address this
problem, prior knowledge about the shape of expected objects, called high level
information, is introduced in a number of approaches. In these approaches, training
samples, which consist of manually segmented objects, are used to build a model. This
model usually represents the shape variances from the collection of training samples.
During the segmentation of an image, the detected boundaries are constrained by both
the image features and the model. The model influence makes the boundary to vary only
in ways that have been seen in the training samples. Using this mechanism, problems
such as a weak edge between an object and the background, noise, and partial
occlusion, can be handled very well by utilizing the shape prior knowledge.
Active shape models (ASM) [85] and active appearance models (AAM) [86] are
one of the best known methods in the shape model based image segmentation field. In
23
ASM, an object or image structure to be segmented is represented by a set of points
(landmarks) which are placed manually on each training sample of the object. The point
set from different training objects are aligned to minimize the variance in distance
between corresponding points. A point distribution model (PDM) is derived by examining
the statistics of the position of the landmarks. Using principal component analysis, ASM
gives the average positions of the landmarks and has a number of parameters to control
several major modes of variation in training samples. To find the structure of interest in
an image and delineate its boundary, the search algorithm makes an adjustment along
the normal direction toward to the strongest image edge for each point on the current
active contour and uses a point set matching algorithm to choose the shape and pose
parameters. AAM includes texture information inside of the current active contour in
searching object boundaries. Since their introduction, ASM and AAM became the most
popular methods in the statistical shape model area and inspired a number of variant
forms.
In [87], the authors proposed a novel method that combines the shape prior with
level set method. Similar to ASM and AAM, the proposed method builds a shape prior
model using principle component analysis. However, this method employs geometric
contours, i.e. level set, rather than parametric contours which are used in ASM and AAM.
This eliminates one of the most notable problems in ASM and AAM – point
correspondence. In this proposed method, the authors extended the level set method by
incorporating shape information into the evolution process. To segment a structure from
an image, the algorithm evolves active contours based on image gradients and
curvature as the level set method does, and transforms and deforms the shape model
based on a maximum a posteriori (MAP) estimate of shape and pose, which comes from
the shape prior model.
24
Tsai et al. [88] proposed a shape based approach to segment medical images
using level set method. Different from [87] which uses the boundary-based level set
method, this approach uses the region-based level set method. The region-based
approach enjoys a number of properties over boundary-based technique, including
robustness to noise and initial contour placement. The authors integrated the shape prior
information into the level set equation, therefore, provided one functional to be optimized.
This is another difference to the method in [87] which has two terms to be optimized
sequentially: one is the energy functional defined in the level set method and the other is
MAP estimate of shape and pose.
PCA is used to model shape variances in all shape model based image
segmentation methods described above. The authors in [80] pointed out the limitation of
PCA in modeling shape priors: the level set representation is not a linear space and the
first few components are not sufficient to capture the variation in the space of the
embedded contours. Several alternative methods have been proposed to model the
shape variances. For example, a linear shape representation on the basis of harmonic
embedding has been studied in [89]; variational integrations of the shape priors based
on the assumption of Gaussian distribution was proposed in [90, 91]; a non-parametric
density estimation method to model shape distributions was developed in [92]; and
dynamic statistical shape priors for implicit shape representations were proposed in [92].
It is an ongoing research to discover a more effective way to capture shape variances in
training objects.
Several successful applications of shape model based medical image
segmentation techniques were reviewed in [64]. As the authors mentioned in the review
that the shape based segmentation techniques are mostly developed for research
purposes and there are no commercial products that employ 3D statistical shape models.
Several challenges, for example, how to build shape models on a large number of
25
training images and improve the robustness of the searching algorithm, need to be
solved in order to increase acceptance of this approach in clinic and lead to wider
application and benefit.
26
Chapter Three
Polyp Clustering
We propose a model-based polyp segmentation and detection method. This
model is constructed using polyps confirmed in CTC and colonoscopy. Based upon their
morphologic type and location, polyps present different shapes, which necessitates the
use of multiple models. It is difficult but important to determine the number of models
and to cluster polyps into groups such that polyps in each group could be used for
constructing a model. In this chapter, we describe an experiment that is designed to
cluster polyps into groups and then discuss a method that refines the polyp groups to
include similar polyps only in terms of their shapes. This results in polyp groups upon
which we can build models.
3.1
Introduction
Polyps have different morphologic types such as flat, sessile, pedunculated, and
large mass (Figure 3.1). Polyps are also growth of tissues in different locations including
colon surface, bottom of a fold, side of a fold, and top of a fold (Figure 3.2). The shape of
a polyp varies with its morphologic type as shown in Figure 3.1. Moreover, polyps of the
same morphologic type have different shape based upon their locations. We seek a
method to categorize polyps into different groups such that all polyps within a group are
similar in terms of their shapes.
We choose to categorize polyps into several groups for two main reasons. First,
polyps with different morphologic types and locations may have different shape. If we put
all polyps into one group and build a shape model based on them, the shape variance
among this model will be large. Such a model with large shape variance has many
27
parameters to control its shape and manipulating these parameters to obtain a certain
shape is extremely difficult. Conversely, we can build a model for each polyp in our polyp
database. But this approach would result in too many models, and how to select an
appropriate model to segment and detect a polyp would become another problem. This
is similar to the overfitting problem in pattern recognition. To address these problems,
we designed an experiment to analyze polyp shape in order to develop a method that
can cluster polyps into several groups each having small shape variance. At the same
time, this method should not generate too many groups. The goal of polyp shape
analysis is to cluster polyps in order to minimize the intra-group shape variance while
maximizing the inter-group shape variance. This can result in appropriate polyp models
for the segmentation process.
a
b
c
d
Figure 3.1 Four morphologic types of polyp: flat, sessile, pedunculated, and large mass
(from left to right). The first three types of polyps are scored from 1 to 10 as shown in
Table 3-1.
a
b
c
d
Figure 3.2 Sessile polyps on different locations: colon surface, fold bottom, fold side, fold
top (from left to right). These are scored from 1 to 10 as shown in Table 3-1.
3.2
Method
We have two datasets of CTC studies in which polyp locations in the DICOM
coordinate system were provided by radiologists. The WFU dataset contains 35 polyps
28
and the WRAMC dataset contains 75 polyps. In this experiment, we extract a subvolume
around a polyp and present it to observers, who are asked to give two scores based on
its morphology and location (described below) for each polyp.
3.2.1
Score polyps
We study the polyp shape variance due to the morphology and location
differences in this experiment. To analyze the morphology influences on polyp shape,
we focus on three morphologic polyp types: flat, sessile, and pedunculated (Figure 3.1).
Polyps which do not present regular shape, e.g. large mass, will not be included in our
polyp shape analysis. These three morphologic types of polyps are scored from 1 to 10
as shown in Table 3-1. To analyze the location influences on polyp shape, we model the
polyp location as a gradual transition from the colon surface, which is relatively flat, to
the top of a haustral fold, which has a ridge-like shape. Four typical locations of polyps
are: colon surface, bottom of a fold, side of a fold, and top of a fold. We score the polyp
location from 1 to 10 as shown in Table 3-1. In our polyp shape analysis, we have two
scores for each polyp: morphology score and location score.
Table 3-1 Scores for reference polyps
Morphology
Flat
Sessile
Score
1.0
5.0
Location
Colon surface
Fold bottom
Score
1.0
4.0
Pedunculated
10.0
Fold side
7.0
Fold top
10.0
For the initial trial of the experiment, three CTC researchers were recruited to
score polyps. We will recruit radiologists and residents in the future after validating the
proposed method. To generate a polyp surface from the original CTC images, a region
of interest, which is a 50mm x 50mm x 50mm volume of image data around a polyp, is
extracted from a CTC study. The polyp surface in this image is generated using the
marching cube algorithm [93]. The threshold for the marching cube algorithm is adjusted
29
between -500 and -800 according to each CTC study by a user. The polyp surface is
then presented to an observer using visualization software [94]. Each observer is
requested to provide two scores to the polyp regarding morphology and location as
defined in Table 3-1. Reference polyps used for this study are presented in Figure 3.1
and 3.2, and their respective scores are shown in Table 3-1. This information is provided
so that all the observers have a common baseline. Due to the use of image contrast
agent in CT scans and the limitation of the polyp surface visualization method, several
polyps that are merged in the contrast agent are hard to represent as a surface.
Therefore, these polyps are not scored in our experiment. Also, observers are asked not
to score a polyp if they cannot determine its morphology and/or location. Polyps that are
not scored are regarded as missing-value polyps. Because missing-value polyps are
either submerged in contrast agent or not very well defined in terms of morphology or
location (at least one observer found it difficult to determine its morphology score or
location score), we exclude them from our polyp clustering. We have 32 polyps in WFU
dataset and 54 polyps in WRAMC dataset for which both morphology and location
scores are provided by the three observers.
3.2.2
Cluster polyps into groups
To cluster polyp into groups according to their polyp scores, we make use of the
K-means algorithm. Since three observers were involved in this initial trial, each polyp
has three scores for both the morphology and location. One way to analyze these scores
is to calculate the mean morphology and location scores for each polyp and input the
mean scores to the K-means algorithm. Alternatively, these multiple scores from three
observers can be fed into the K-means algorithm. The disadvantage of the later method
is that each polyp will have three representations from the input data. The scores for
these three representations may be different because they come from different
30
observers. Therefore, these three representations may not be grouped within the same
cluster in K-means algorithm even though they represent the same polyp. If this happens,
additional efforts are required to determine which group a polyp belongs to after Kmeans clustering. We opt for the first approach which uses the mean scores as the input
because of its simplicity.
Usually a clustering algorithm requires users to specify the number of clusters,
e.g., the number k in K-means algorithm. However, our initial goal is to seek the number
of clusters in the polyp scores. To automatically detect the number of clusters, we tried
the EM (expectation maximization) algorithm in WEKA [95]. This EM algorithm
determines the number of clusters by evaluating the log-likelihood which is the
probability of each sample belonging to each of the clusters. The evaluation in
determining the number of clusters is done in the following steps:
1. The number of clusters is set to 1
2. The training set is split randomly into 10 folds.
3. EM is performed 10 times using the 10 folds cross validation method.
4. The log-likelihood is averaged over all 10 results.
5. If the log-likelihood increases, the number of clusters is increased by 1 and
the program continues at step 2.
After running the EM algorithm on the mean morphology and location scores, the
number of clusters selected by cross validation is always one with the cluster center
located at: morphology score = 4.5 and location score = 5.0. This means that when the
number of clusters is increased from one to two, the average log-likelihood of polyp
scores is also increased. One of the reasons why the EM failed in our case is because
the log-likelihood is not an appropriate metric to determine the quality of clusters of polyp
scores. Other metrics such as MDL (minimal description length) will be investigated in
the future in order to make EM algorithm work on our polyp scores data.
31
Therefore, we use the K-means algorithm with the number of clusters, k,
specified by users. We cluster polyps according to morphology scores and location
scores in two separate steps: polyps are clustered based on morphology scores in the
first step; polyps are clustered based on location scores in the second step. The Kmeans algorithm in Matlab is employed to cluster polyps. We do not cluster polyps
based on morphology scores and location scores together because it is hard to decide
the number of clusters for the K-means algorithm. In clustering based on morphology
scores, the number of clusters is set to three to represent flat, sessile, and pedunculated
polyps, and the start position for k-means algorithm is set to (1.0, 5.0, 10.0). In clustering
based on location scores, the number of clusters is set to four to represent colon surface,
bottom of a fold, side of a fold, and top of a fold, and the start position is set to (1.0, 4.0,
7.0, 10.0). The selection of three clusters for morphology scores and four clusters for
location scores is based on our knowledge after visual examination of tens of polyps in
our polyp database. And the start positions are set to the same as the scores in the
reference polyps in Table 3-1. After all polyps are clustered, we put polyps into one
group if they belong to the same morphology cluster and the same location cluster. For
example, polyps with morphology cluster of “flat” and location cluster of “colon surface”
are put into group one, polyp with morphology cluster of “flat” and location cluster of
“bottom of a fold” are put into group two, etc.
3.2.3
Align polyps in each group
For each polyp group generated in the clustering analysis, we align all polyps in
that group in order to minimize the translation, rotation, and scale differences among the
polyps. After alignment the position and orientation of polyps in a group are similar. Then
we calculate the mean image of the aligned polyps, and measure the distance between
a polyp surface in an aligned polyp to the polyp surface in the mean image. The mean
32
value of the distance in a polyp group is the metric to measure the shape variance in that
group. The overall process of the alignment is shown in Figure 3.3.
extraction
alignment
Figure 3.3 Extraction of a polyp region using a bounding box and alignment of extracted
polyp regions.
The inputs to the alignment algorithm are extracted images of the polyps in 3D.
The polyp region shown in Figure 3.1 and 3.2 cannot be used as inputs to the alignment
algorithm because there are too many surrounding tissues other than the polyp itself.
These surrounding tissues are useful in assisting observers in deciding polyp location
when scoring a polyp. But too many surrounding tissues causes the alignment algorithm
to focus on the surrounding tissues rather than the polyps. To address this problem, we
define a polyp region by manually adjusting a bounding box around the polyp (Figure
3.3). The pixels inside that bounding box are considered a polyp region and therefore
are extracted. After extraction, polyps have the same orientation, e.g., the polyp tip
points to up.
33
In the next step, we align polyp regions based on modified generalized
Procrustes analysis (GPA) algorithm. The GPA algorithm was designed to align objects
which are represented by landmarks. A landmark is a point in 2D or 3D spatial space.
The point coordinates of all landmarks are inputs to the GPA algorithm which translates,
rotates, and scales objects in order to maximize the overlap among all objects. In
medical imaging, landmarks are usually generated manually, which requires a user to
observe all images and designate points as landmarks on each image. The landmark
correspondence among all images is also set by a user. This manual process is time
consuming. And the inaccuracy of landmarks introduced by a user cannot be eliminated
in the GPA algorithm.
There are several alignment methods that are based on image registration
techniques and do not require landmarks. In [88], the authors proposed an energy
functional to simultaneously minimize the difference between any pair of binary images.
In [96], the authors proposed a non-rigid groupwise registration method to register brain
images. A registration method usually requires three core components:
1. a representation of the transformation
2. an objective function, and
3. an optimizer.
The optimizer seeks the optimal values for the transformation parameters in order to
minimize the objective function. In pairwise registration, there are few parameters
because there is only one image that needs to be transformed. In group-wise registration,
however, the number of parameters can be large if there are many images in a group.
For example, in 2D case, there are four transformation parameters in pairwise
registration: translation , translation , rotation angle , and scale ration s. In groupwise registration that contains 10 images, it requires
parameters in order to
register nine images to a reference image in that group. With this large number of
34
parameters, which can be regarded as a high dimensional space, it is difficult for an
optimizer to find the optimal values for each parameter.
We devise an alignment method with repeated registration procedures. In each
repetition of the registration procedure, we calculate a mean image based on current
transformed images and register each transformed image to that mean image. This is
similar to the GPA algorithm in which a mean configuration (a
matrix of Cartesian
coordinates of k landmarks in m dimensions) is calculated and each configuration is
superimposed to the mean configuration in order to align landmarks [97].
Different from the GPA algorithm, where all configurations have the same matrix
size, images being aligned are not of the same size. The images are cropped from
subvolume of polyp images as shown in Figure 3.3. Because polyps have different size,
the sizes of cropped images are not same. The mean image, whose pixel intensity is the
mean value of intensities of pixels in all images, is difficult to calculate if there are pixels
that are inside of one image but outside of others. The difficulty is aggravated when
there is a rotation transformation involved during the registration process. To address
this problem, we center all images to the origin of a coordinate system and set the size
of mean image to the size of the overlapped region of those centered images. Since
those cropped image are roughly pose to the same orientation, the initial mean image
will cover the center part of a polyp. This assures that the following repeated
registrations will succeed.
The registration of each image to the mean image follows a standard process.
The transformation is a similarity 3D transform, which contains seven parameters: three
translations, three rotations (using quaternion), and one scale. The objective function is
the mean square difference between two images. For the optimizer, we utilize the versor
transform optimizer in the ITK library [66]. The advantages of our alignment method are:
1. it does not require landmarks
35
2. there are few number of transformation parameters for the optimizer because
we register each image to the mean image in an individual registration
process.
Modified GPA algorithm:
1. Given N input images, calculate the mean image. The size of the mean
image is set to the size of overlapped region among N input images, and
pixel intensities are the mean value of N pixel intensities from N input images.
2. Register each input image to the mean image individually. After registration,
transform each input image to obtain a transformed image.
3. Repeat the steps 1 and 2 with transformed images as input images until the
number of repetition is larger than a number specified by users.
3.2.4
Reassign polyps to a different group
Polyp groups obtained from the k-mean algorithm are based on morphology
scores and location scores. However, in a polyp group, several polyps may not be
aligned very well to the others because morphology and locations scores do not
precisely describe polyp shape. We use the Hausdorff distance to define the goodness
of how a polyp fits in its group, and move “bad” polyps to another group based on the
Hausdorff distance.
Equation 3.1
The Hausdorff distance, defined in equation 3.1, is calculated between each
aligned polyp and the mean polyp. After aligning polyps, we obtain one mean polyp
image and several aligned polyp images. In this step, we generate polyp surfaces for the
mean image and aligned polyp images. The Hausdorff distance from each aligned polyp
36
surface to the mean polyp surface is calculated. If the Hausdorff distance for an aligned
polyp is large, which indicates that the polyp is not similar to the mean polyp, that polyp
is removed from its current polyp group. Then we align the remaining polyps in the polyp
group and calculate the Hausdorff distances again. We repeat this process until there
are two polyps left in the group. The removed polyp will be assigned to a new group if its
Hausdorff distance to the mean polyp of that group is small. Through this method, polyps
are reassigned to different polyp groups in order to maximize the shape similarity in each
group.
3.3
Results
3.3.1
Cluster polyps into groups
Figure 3.4 shows the 3D histograms for scores from each observer and for the
mean scores. The 3D histogram is generated with morphology score on the x-axis and
location score on the y-axis. The X-Y plane is divided into 10x10 bins, and the number of
polyps whose scores fall into each bin is plotted on the z-axis. From the plots we can
see several common features among the polyp scores from three observers: there are a
large number of polyps around the position where location score ranges from 1 to 2 and
morphology score ranges from 1 to 6; there are very few polyp scores at position where
location score ranges from 1 to 2 and morphology score ranges from 6 to 10; there are
many polyps where location score is 1 or 10. This information indicates that, in our polyp
database, there is a large number of polyps located on colon surface or top of a fold, and
most of these polyps are flat or sessile morphologic type.
37
Figure 3.4 Histogram of polyps‟ morphology score and location score. Plots (a) (b) (c)
are generated based on polyp scores from each observer. Plot (d) is generated based
on mean polyp scores.
After applying the k-means algorithm, we have three clusters for morphology
scores and four clusters for location scores. The center and the number of polyps for
each cluster are list in Table 3-2 and 3-3.
Table 3-2 Morphology score clusters
Cluster 1
Morphology score at
2.9
Number of polyps
36
center
Table 3-3 Location score clusters
Cluster 1
Location score at center
1.3
Number of polyps
32
Cluster
5.5
2
48
Cluster
9.0
3
2
Cluster
4.4
2
18
Cluster
7.2
3
16
38
Cluster
9.8
4
20
The scores at clusters‟ center and number of polyps in each cluster match what we have
learned from the histogram (Figure 3.3.d): many polyps are located on the colon surface
and the top of a fold; there are very few pedunculated polyps.
Based on the clustering results, we put polyps into one group if they belong to
the same morphology cluster and location cluster. There are 12 polyp groups, three
morphology clusters time four location clusters, and the number of polyps in each group
is shown in Table 3-4. Note that there are no polyps in two groups: the group of
pedunculated polyps on colon surface and the group of pedunculated polyps on side of a
fold. This is because there are very few pedunculated polyps in our experimental data.
We may need more example polyps for complete generalization.
Table 3-4 The number of polyps in each polyp group after k-means clustering
Colon surface Bottom of a fold Side of a fold
Top of a fold
Flat
18
5
5
8
Sessile
14
12
11
11
Pedunculated
0
1
0
1
3.3.2
Align polyps in each group
We show the alignment result from one polyp group here, which is the group that
contains sessile polyps located on the colon surface. There are a total of 14 polyps
clustered into this group. Eight of these polyps are from WFU data and six are from
WRAMC data. We use WFU dataset as training data and use WRAMC dataset as test
data in the polyp segmentation and polyp detection which will be described in chapters
four and five. Therefore, we only align those eight polyps from WFU dataset and
construct a shape model from them. In the alignment algorithm, the number of repetition
is set to four as the stopping criteria. This is based on our visual comparison of aligned
polyps that was generated with different repetitions from 1 to 20. The scale factor is set
to 100 in order to prevent the moving image from being scaled up.
39
The surfaces for polyp images before and after alignment are shown in Figures
3.5 and 3.6. Note that these polyps are centered in a 3D coordinate system and viewed
from the same position. We can see, in Figure 3.5, the sizes of the polyps are different.
After alignment, the polyp sizes are similar as shown in Figure 3.6. The scale effect in a
similarity transform is apparent after alignment. The translation effect is also observable.
Notice that the first polyp in Figure 3.5 is on the left side of the colon surface; all other
polyps in Figure 3.5 are positioned in the center. After alignment, all polyps are shifted
left in order to align with the first polyp. The rotation effect can be seen in the third polyp.
The last polyp failed to be aligned with other polyps (Figure 3.6) because this
polyp is scaled up during the alignment process. This suggests that this polyp should not
belong to this group. The seventh polyp in Figure 3.6 looks different from others due to
the contour process. This polyp is grown on a thin colon surface (~3mm in thickness)
whose CT intensity value is in the range of [-700, -550] (usually, colon tissue‟s CT
intensity value ranges from -700 to 100). So the colon surface is not included in the
surface generated by the marching cube algorithm with a threshold of -500.
Figure 3.5 Polyp surfaces before alignment.
40
Figure 3.6 Polyp surfaces after alignment.
Figure 3.7 Overlaid polyps before and after alignment, and the polyp of the mean image
after alignment (from left to right).
The overlapped polyp surfaces before and after alignment are shown in Figure
3.7. After alignment, the mean image, the last one in Figure 3.7, is calculated from
aligned polyp images.
3.3.3
Reassign polyps to a different group
The Hausdorff distances for eight aligned polyps in Figure 3.6 are listed in Table
3-5. The mean value of these Hausdorff distances is 3.4mm. We measure the polyp size
of the mean polyp in Figure 3.7, which is 10mm. Therefore, the mean Hausdorff distance
for those eight aligned polyps is 34% of the polyp size.
Table 3-5 Hausdorff distances for aligned polyps in Figure 3.6.
3.4mm
3.0mm
1.6mm
2.1mm
1.8mm 1.4 mm 6.8mm 7.0 mm
41
Among those eight aligned polyps, two of them with two largest Hausdorff
distances will be removed from this polyp group. Table 3-6 lists the Hausdorff distances
in a polyp group and the mean values after removing a polyp in each iteration. We select
polyps remaining in the third iteration as a group of polyps to construct a shape prior
model. This is because there is significant decrease of the largest Hausdorff distance
between the second and third iteration: from 7.4 to 3.0. The largest Hausdorff distance
after the third iteration is 3.0mm, which is relatively small to the size of the mean polyp,
10mm. The removed two polyps will be assigned to another polyp group after we align
all polyp groups in the future.
Table 3-6 Hausdorff distances
each row is highlighted.
Polyp
1
2
Iteration 1
3.4
3.0
Iteration 2
3.5
2.3
3.0
Iteration 3
2.0
Iteration 4
2.7
Iteration 5
2.4
2.4
Iteration 6
Iteration 7
3.4
in a polyp group. The polyp with the largest distance in
3
1.6
2.0
2.1
2.4
1.6
1.0
2.5
4
2.1
2.3
2.1
2.5
2.1
1.8
2.1
5
1.8
1.7
1.5
2.6
2.8
6
1.4
1.3
1.2
3.0
7
6.8
7.4
8
7.0
mean
3.4
3.0
2.0
2.6
2.2
1.7
2.3
Conclusion
In conclusion, we propose a method to study the polyp shape in order to cluster
similar polyps into groups. This method starts with scoring polyps based on its
morphology and location features. Then polyps are clustered into several groups using
the k-means algorithm. In the next step, a modified GPA algorithm is used to align
polyps in each polyp group. Finally, polyps are reassigned to different groups based on
their Hausdorff distances. From the alignment results for a polyp group, we conclude
that this method successfully clusters similar polyps into one group and differentiates
them from those which are not. In future, we will devise a method to merge polyps in
42
different groups into one group, and seek the optimal number of groups that minimizes
the intra-group shape variance while maximizing the inter-group shape variance.
43
Chapter Four
Polyp Segmentation using Shape Prior Models
Polyp segmentation can improve the efficacy of CTC CAD by providing additional
diagnostic information to radiologists such as polyp size. Because of the obscure
boundary between a polyp and its surrounding colon tissues in CTC images, the task of
polyp segmentation is difficult. In this chapter, we construct a shape prior model based
on polyps in one polyp group and propose a polyp segmentation method using this
model. We test the proposed method by segmenting 19 polyps. The segmentation
results are quantitatively evaluated by comparison with manually segmented polyp
surfaces.
4.1
Introduction
A complete description of a colorectal polyp includes both its location and its 3D
extent. Earlier approaches to CTC CAD mostly focus on polyp detection using geometric
features, and the polyp extent is left to the physician to determine visually. More recently,
automated and semi-automated methods for polyp segmentation have been proposed
as a way to increase the efficacy of CTC CAD as well as to provide additional diagnostic
information to radiologists[48-50]. Specifically, the inclusion of all voxels within the 3D
extent of polyps would allow new features to be obtained, for example intensity
distribution, volume, and texture. These new features could then be used to improve
polyp detection performance. Furthermore, accurate determination of polyp size is
important for determining treatment options. Current measurements made by
radiologists using the largest apparent dimension are subject to inter-operator variability.
Computer based generation of polyp size provides a more accurate estimate and
44
removes this variability. Finally, a complete description of a polyp that includes both its
location and all voxels that are associated with it is essential for creating a ground truth
polyp database for training, testing, and validating CTC CAD systems.
Polyp segmentation is a challenging task. Although the boundary between a
polyp and a colon lumen is apparent because of pixel intensity differences in CT images,
the boundary between a polyp and its surrounding colon tissues is hard to define. As
shown in Figure 4.1, the boundary between a polyp and its surrounding colon tissues is
obscure because there is no image contrast in that area. This is because a polyp is an
abnormal growth of tissue projecting from a colon wall, both of which are soft tissues and
have similar intensities in CT images. Lacking image contrast makes polyp segmentation
a difficult task in identifying the boundary between a polyp and colon tissues.
a clear boundary between a
polyp and colon lumen
an obscure boundary between
a polyp and colon tissues
Figure 4.1 The boundary between a polyp and its surrounding colon tissues is obscure,
even though the boundary between a polyp and colon lumen is apparent.
A number of polyp segmentation methods have been reported in the literature.
For example, Jerebko et al. [98] used a Canny operator and the Radon transform to
detect polyp boundaries. Yao et al. [48, 49] employed a deformable model and an
adaptive deformable model to segment polyps. Tan et al. [99] evolved geodesic active
contours with a modified speed function on the colon surface to detect polyp neck
regions. Nappi et al. [100] utilized a level set method to extract the polyp mass region.
Lu et al. [50] proposed a classification scheme to segment polyps. Recently, Grigorescu
et al. [101] took a histogram approach to determine the threshold that would separate
polyps from surrounding colon tissues. All these methods exploited only the local
45
information in images such as pixel intensity and gradient. Since the intensity and
gradient are insufficient in identifying a boundary between a polyp and colon tissues, the
boundary is not accurately extracted in above methods.
We propose a model based approach that incorporates prior knowledge of polyp
shapes into the segmentation process. The idea behind this approach is that we utilize a
shape prior model to determine the boundary between a polyp and its surrounding colon
tissues. At the same time, the boundary between a polyp and a colon lumen is
determined by pixel intensity and gradient features in a CT image. The proposed method
provides the segmentation result as a polyp surface which covers the protrusion part of a
polyp. The polyp surface together with the pose of a polyp, which is derived from the
shape prior model, can be utilized to measure polyp size and height automatically.
Incorporating shape information into geodesic active contours has been
proposed by Leventon et al. [87]. However, this method depends on an edge-function
and is susceptible to the weak edge leakage problem [102]. In the proposed method, we
integrate a model based registration method and a region based level set method, which
does not require an edge-function, to identify polyp boundaries. We organize this
chapter as follows: in the method section, the method of constructing shape prior models
is described in section 4.2.1; in section 4.2.2, we compare three polyp segmentation
methods that utilize shape prior models and describe the detailed steps for one of these
methods. In the results section, the segmentation results are evaluated by comparing
them to manually segmented polyp surfaces. And we conclude this chapter with
discussions on an alternative way to construct shape prior models.
46
4.2
Method
4.2.1
Construction of shape prior models
Polyps are aligned using the method described in chapter three (section 3.2.3).
PCA is utilized to generate the shape variances among aligned polyps. A shape prior
model is described by a mean image and a number of eigenvectors and eigenvalues
outputted from PCA.
We use level set images of aligned polyps as the input to PCA. A level set image
is a signed distance map with negative values inside an object, positive values outside
an object, and zero on an object boundary as shown in Figure 4.2. The pixel value in a
level set image equals to the distance from that pixel to the zero level curve in 2D or the
zero level surface in 3D. A level set image is computed based on a binary image which
is usually generated by manual segmentation. We generate binary images for aligned
polyps based on a user specified pixel intensity threshold around -500 Hounsfield units,
which can be adjusted by a user from case to case [103]. In an aligned polyp image,
pixels with intensity less than the threshold will be labeled as “0” and pixels with intensity
larger than or equal to the threshold will be labeled as “1”. These pixel labels, 0s and 1s,
are stored in a binary image. And this binary image can be manually modified pixel by
pixel as needed.
Figure 4.2 An example of a level set image. The curve represents the zero level curve in
this level set image.
Given a binary image, its level set image is computed using Euclidean distance
mapping [104]. Usually, a level set image is used to represent an object with a closed
47
boundary. However, a polyp is not closed since its boundary to colon tissues is not
clearly defined in an image. We devise a method to calculate a signed distance map for
a non-closed object in two steps. In the first step, we set those “0” pixels as background
and calculate a distance map for “1” pixels. In the second step, we set those “1” pixels
as background and calculate a distance map for “0” pixels. Then we calculate the final
distance map as:
The final distance map is a level set image with soft tissue pixels having negative values
and air pixels having positive values.
A shape prior model is constructed based on these level set images. A shape
prior model consisted of a mean image and a number of mode images. Given a group of
level set images
The mode images are
, the mean image
is calculated as:
principal components corresponding to the
largest
eigenvalues in PCA. The mode images represent shape variances among
level set
images. To compute mode images, an offset image from each level set image to the
mean image is calculated as:
Each offset image is vectorized and put into a matrix
Then PCA is applied to the matrix
. The
, corresponding to the largest
mode images. The number
as one column:
principal components of matrix
,
eigenvalues are de-vectorized to form
is selected based on the eigenvalues of the matrix . The
ratio between the summation of the largest
eigenvalues and the summation of all
48
eigenvalues is the metric to decide the number . This ratio indicates how many shape
variances are included in the
principal components.
Given a mean shape image and
mode images, a new shape can be created
according to the following equation:
Equation 4-1
In this equation,
is the mean image,
Through changing the value of
and mode images. Usually,
is a coefficient, and
is an eigenvector.
, a new shape is generated based on the mean image
ranges from
to
, where
is an eigenvalue
of the matrix . Figure 4.3 shows an example of a shape prior model with three modes.
Six new shapes listed in the first and last columns are generated through changing the
coefficient values
.
mean image:
mode 1:
mode 2:
mode 3:
Figure 4.3 An example of a shape prior model with three modes. Each row represents a
variance mode in a shape prior model. The mean image of the model is shown in the
49
second column. Two new shape images are generated for each mode by changing
coefficient in Equation 4-1 to
(the first column) and to
(the third column).
4.2.2
Polyp segmentation using shape prior models
Three segmentation methods are described and analyzed in this section: a
boundary based level set method, a region based level set method, and a model based
registration method. The first two methods do not successfully segment polyps in several
practical cases. The reason will be discussed shortly. The third method is the most
successful one among these three methods and is our proposed polyp segmentation
method using shape prior models. In this section, we briefly describe the boundary
based level set method and the region based level method. We focus our efforts on
analyzing these two methods to discover the root causes on why they failed to segment
polyps. Please refer to [83, 84, 87] for the detailed description.
4.2.2.1
A boundary based level set method with shape prior influence
Several boundary-based level set methods have been proposed as image
segmentation techniques [74-79], all of which require an edge to be present along the
boundary of an object in order to segment the object. In these methods, a feature image
is generated from the edge information with small pixel values around an edge and large
pixel values in non-edge areas (an example of a feature image can be found in Figure
4.7.b). Pixel values in a feature image is used to control the evolution speed of level sets,
i.e., a level set is moving slowly around an edge and fast in non-edge areas. With this
mechanism, a level set, the zero level set, will converge on the boundary of an object to
be segmented. Most level set methods utilize the curvature information to control the
smoothness of level sets. Geodesic active contours (GAC) [83] is a popular boundary
50
based level set method. It evolves level sets, either inside or outside, to a boundary in an
image through an additional term in its mathematic formulation. GAC is extended in [105]
by incorporating shape information into the level set evolution process. We call this
method ShapeGAC.
To incorporate shape information into the process of segmenting an object in an
image, ShapeGAC computes a prior on shape variation given a set of training instances
of an object. The prior on shape variation is folded into the level set evolution process of
GAC. In the traditional GAC, i.e. without the shape prior influence, level sets are evolved
according to a differential equation in Equation 4-2:
Equation 4-2
where
is a level set function with the zero level set,
in 2D or a surface in 3D;
, implicitly represents a curve
is a function of the image gradient (usually of the form
is a constant term that forces a zero level set to flow outward or inward;
curvature;
);
is the
is a term that further attracts level sets to a boundary. In this level set
formulation,
evolves over time at every point perpendicular to the level sets as a
function of the curvature and the image gradient at that point. In order to incorporate
shape information into the GAC, ShapeGAC adds a global shape force to the evolution
of level sets. At each step of the level sets evolution, ShapeGAC estimates the
maximum a posteriori (MAP) position and shape of the object in an image, based on the
shape prior model and the image information. The MAP estimate of the final shape is
combined with the GAC update,
function
, computed from Equation 4-2, to evolve the level set
over time. Figure 4.4 (from the original paper of ShapeGAC [87]) illustrates
how to combine MAP estimate of the final shape and the GAC update. Figure 4.5 shows
four steps in segmenting a corpus callosum in a MR image in [87].
51
Figure 4.4 Illustration of the two forces in the evolution of a level set function in
ShapeGAC. The
is the MAP estimate of the final shape. The is GAC update
computed from Equation 4-2.
and
are weight parameters to balance the influence
of the shape prior model and the GAC model.
Figure 4.5 Four steps in segmenting a corpus callosum using ShapeGAC. The red curve
is the zero level set of . The green curve is the next step in the curve evolution. The
yellow curve is the MAP estimate of the final curve. The cyan curve in the last image is
the GAC segmentation without the shape influence.
Figure 4.6 Five steps in segmenting a simulated polyp using the modified ShapeGAC.
The red curve is the zero level set of . The green curve is the MAP estimate of a shape
prior model.
There are two difficulties in applying ShapeGAC to segment polyps. First, the
ShapeGAC is designed to segment an object with a closed boundary. A polyp, however,
does not have a closed boundary because there is no edge between a polyp and
52
surrounding colon tissues in a CT image. Second, the weight parameters
in
ShapeGAC are constant. Appropriate values for these two weights are difficult to specify
when segmenting a polyp because a large part of a polyp boundary is obscure. We
modified the ShapeGAC to address those two problems in [106]. First, we manually add
a baseline to a polyp in training images in order to make a closed boundary for a polyp.
Second, we adaptively change the weights of
and
according to the edge
information during the evolution of level sets. In the modified version of ShapeGAC, we
would like to make the GAC model act as a major contributor where there is an edge,
e.g., the boundary between a polyp and colon lumen. But in the no-edge areas, such as
the boundary between a polyp and surrounding colon tissues, we would like the shape
prior model to be the major contributor in evolving level sets. (please refer to [106] for
the details) Figure 4.6 shows five steps in segmenting a simulated polyp using the
modified ShapeGAC.
Both ShapeGAC and the modified ShapeGAC fail to segment polyps in several
practical cases. The main cause of the failure is the weak-edge-leakage problem which
is a common disadvantage of boundary based level set methods [102]. Figure 4.7 shows
an example where a weak edge exists between a polyp and a haustral fold. The evolving
level sets are leaked to the nearby haustral fold because the weak edge in the feature
image (Figure 4.7.b) cannot stop the level sets from expanding. The segmentation result
(Figure 4.7.c) contains colon lumen at the weak edge region. To address this weakedge-leakage problem, a region based level set method is employed to segment polyps
with a shape prior model in the next section.
53
weak edge
weak edge
strong edge
strong edge
no edge
no edge
edge leakage in
weak edge areas
Figure 4.7 An example of weak edge leakage using the modified ShapgeGAC method.
(a) a CT slice of a polyp. (b) the feature image of (a). In this fetaure image, pixels
around an edge have small intensities (black) and pixels in non-edge regions have large
intensities (white). (c) the segmentation result (a red curve). (d) 3D representation of the
polyp in (a).
4.2.2.2
A region based level set method with shape prior influence
A region based level set method was proposed in [84] to segment an object
whose boundaries are not necessarily defined by image gradient, i.e., edge. This
method, called Chan-Vese model, employs a novel stopping term in the level sets
evolution based on the Mumford-Shah segmentation technique. This stopping term does
not depend on the gradient of an image, as the boundary based level set methods do,
but is instead related to a particular segmentation of the image. Therefore, the ChanVese model does not suffer from the weak-edge-leakage problem. Figure 4.8 in [84]
demonstrates the advantage of the Chan-Vese model over the GAC model in
segmenting an object with weak edges. In this example, the pixel intensity in the image
is gradually changed from black to white.
54
Figure 4.8 An object with weak edges. Top: results using the Chan-Vese model without
edge-function. Bottom: results using the GAC model with edge-function.
The Chan-Vese model divides an image into two regions, background and
foreground, with pixels inside the zero level set considered as foreground and pixels
outside the zero level set considered as background. Assume a simple case that an
image‟s background and foreground have piecewise-constant intensities. The basic idea
of the Chan-Vese model is that the difference between intensity of a foreground pixel (a
background pixel) and the mean intensity of the foreground (background) pixels is zero if
the zero level set correctly describes an object boundary in an image. The mathematic
formulation and numerical algorithm of the Chan-Vese model can be found in [84].
We try to incorporate shape prior information in the Chan-Vese model using the
same method as in ShapeGAC (Figure 4.4). However, the edge-independent stopping
term in the Chan-Vese model, which is strength of the method, becomes a limitation in
introducing a shape prior influence. In the Chan-Vese model, level sets are evolved
according to Equation 4-3 (we use the same notation here as the equation (9) in [84]):
Equation 4-3
In this equation,
is a level set function;
of foreground pixels and
is a pixel‟s intensity.
is the mean intensity
is the mean intensity of background pixels;
constant weights. In the implementation, we find that the values for terms
55
and
are
and
are very large in comparison to the level set function values on active
contours. Usually, the level set function value of active contours are close to zero, e.g.,
from -1 to 1. However, in CT images of a polyp, the values of those two terms,
and
, can reach as large as 40,000. It is difficult to update the level set
function using these large values. To address this problem, in the implementation of the
Chan-Vese model, the level set function is re-initialized after every iteration according to
the zero level set, which is updated according to the sign of those large values. The
update of the level set function, the term
in Figure 4.4, is always a constant value.
Therefore, we cannot introduce a shape prior influence by adding a weighted term as in
Figure 4.4.
The authors in [88] proposed a method that successfully incorporates shape
influence into the Chan-Vese model. The method integrates a shape prior model into the
energy functional of the Chan-Vese model introduce the model as an additional force in
evolving level sets. This method works when the shape variance in a model is relatively
small, such as prostate glands which are test samples in [88]. However, the shape
variance among polyps is much larger as we have demonstrated in chapter three (Figure
3.6). There is a significant difference between Tsai‟s method and our proposed
segmentation method. Tsai‟s method uses the boundary of the shape prior model as the
final segmentation result, which is inaccurate when the model is not deformed to be the
same as an object to be segmented. Our method can generate accurate segmentation
results even when the shape prior model cannot be deformed to be the same as an
object, which is common in practice. The details of the proposed method are described
in the following section.
56
4.2.2.3
The
Chan-Vese
model
with
shape
model
based
registration
(ShapeRegistrationCV)
Both methods mentioned above includes two forces that evolve level sets. The
first force comes from the image, i.e., a force derived from Equation 4-2 for GAC and a
force derived from Equation 4-3 for the Chan-Vese model. The second force is the
influence of a shape prior model. These two forces are weighted by two parameters,
and
. Striking a balance between these two forces is a difficult task. This is especially
true for polyp segmentation because a majority of polyp boundaries are obscure. A large
image force may cause a segmentation result containing many surrounding colon
tissues; and a large shape prior model force may cause a segmentation result so similar
to the model that it is not located on a polyp boundary in an image.
In this proposed method, we separate these two forces into two individual steps.
In the first step, we employ the Chan-Vese model to segment a polyp, which utilize the
image force only. As we mentioned before, since the boundary between a polyp and
colon lumen is well defined by image contrast, the Chan-Vese model can identify the
boundary very well. However, because there is no shape prior model influence in this
step, a segmentation result will contain a large amount of surrounding colon tissues (see
Figure 4.11 for examples). In the second step, we register a shape prior model to the
Chan-Vese segmentation result in order to estimate the location and pose of a polyp.
During the registration, a shape prior model is deformed and transformed to match the
segmentation result. The deformation is restrained such that a deformed model is a valid
polyp shape. The advantage of this separation of two forces into individual steps is that it
needs not strike balances between different forces. Since this method combines the
Chan-Vese
model
and
a
model
based
ShapeRegistrationCV.
57
registration
method,
we
call
it
In the first step of ShapeRegistrationCV, the traditional Chan-Vese model without
shape influence is used to segment a polyp. Initial level sets are constructed using a
user specified point inside a polyp. Since a polyp is pretty small region in a CTC
abdominal study, we only need segment a small subvolume around a polyp. In the
Chan-Vese model, we set the iteration to 20 in our experiment, which generates a
sufficient region around a polyp for the following step. The output from Chan-Vese model
is a binary image. The method in section 4.2.1 is used to generate a level set image for
the binary image. This level set image, we call it Chan-Vese segmentation image, is
used in the next step.
In the second step of ShapeRegistrationCV, we apply a model based registration
to estimate a polyp‟s location and pose. As described in chapter three (section 3.2.3), a
registration method usually requires three core components: representation of the
transformation, an objective function, and an optimizer. In ShapeRegistrationCV, we add
an additional component, a deformation restrained by a shape prior model, in the
registration framework:
1. a representation of a transformation,
2. a deformation restrained by a shape prior model,
3. an objective function, and
4. an optimizer.
Each component involved in the second step is described below.
1) Transformation: pose parameters
In a registration framework, the moving image and the fixed image are
represented in its own coordinate system. In our case, the Chan-Vese segmentation
image is represented in a global coordinate system which is identical to the DICOM
coordinate system [107], and the model image is represented in a local coordinate
58
system around the center of the Chan-Vese segmentation image. A transformation
transforms coordinates in the global coordinate system to coordinates in the local
coordinate system.
We employ a 3D similarity transformation in our method [93]. The parameters in
a 3D similarity transformation are defined as pose parameters. In general, a 3D similarity
transformation is composed of translation, rotation, and homogenous scaling. It can be
represented using matrices:
Equation 4-4
In above equation, the vector
contains coordinates in a 3D coordinate system;
is a rotation matrix,
vector. The transformation
is a scaling matrix, and
transforms coordinates
is a translation
to new coordinates
.
There are seven pose parameters in a 3D similarity transformation. The rotation
matrix is represented by a quaternion [108], which has three parameters to control the
rotation axis and angle:
. The scaling matrix has one parameter, , to control
the scaling factor. The translation vector has three parameters,
object along
axes. Therefore, the seven pose parameters in a 3D similarity
transformation are:
Using
, to translate an
.
to represent coordinates of a pixel in the Chan-Vese segmentation
image, the transformed model image,
, can be calculated as:
Equation 4-5
where
is the mean shape image represented in a local coordinate system.
59
2) Deformation: shape parameters
The deformation restrained by a shape prior model is represented by Equation 46:
Equation 4-6
In this equation,
coefficients
is the mean image,
is a coefficient, and
is an eigenvector. The
are shape parameters because they control the shape of a generated
level set function
. The number of shape parameters equals to the number of
modes, , in a shape prior model.
Using
to represent coordinates of a pixel in the Chan-Vese segmentation
image, the transformed and deformed model image,
, can be calculated as:
Equation 4-7
When deforming the mean shape image, the shape parameters,
restrained in the range of
are usually
to assure the deformed image to be a valid
polyp shape.
3) Objective function
In image registration, the objective function quantitatively measures how well the
transformed moving image fit the fixed image by comparing pixel values of two images.
Since both the moving image (the model image in our case) and the fixed image (the
Chan-Vese segmentation image in our case) are represented by level sets, their pixel
value differences are close to zero for successful matches between two images. We
select the mean square metric as the object function in our method. The mean square
metric computes the mean squared pair-wise difference in pixel intensities between two
60
images. The mean square metric,
between the Chan-Vese segmentation image,
, and the transformed and deformed model image is defined as:
Equation 4-8
where
is a vector of pose parameters;
is a vector of shape parameters;
number of pixels in the Chan-Vese segmentation image;
parameterized upon
; and
is the
is a transformation that is
is a vector that represents a pixel coordinates in the
Chan-Vese segmentation image.
Because the size of the Chan-Vese segmentation image is much larger than the
size of model image, we modify Equation 4-8 to improve the time efficiency. In the
modified equation, we compute the mean square metric on the overlapped region
between those two images using the inverse of the transformation
. We rewrite
Equation 4-8 as:
Equation 4-9
where
is the number of pixels in the model image;
is a vector that represents a
pixel coordinate in the model image coordinate system; and
is the inverse of
in
Equation 4-8. The Chan-Vese segmentation image is much larger than the model image,
which means
. Using an alternative form of the mean square metric in Equation 4-
9, we reduce the computational cost. The algorithm that computes the mean square
metric in Equation 4-9 is:
Algorithm 4-1: compute the mean square metric
1. For each pixel in the model image, do
2. {
61
3.
Compute pixel value,
4.
Transform the pixel to a point in the fixed image‟s coordinate system using
the inverse of
, in a deformed model image using Equation 4-6.
defined in Equation 4-4.
5.
Interpolate the Chan-Vese segmentation image to obtain the pixel value .
6.
Add the squared pixel value difference,
, to a summation:
7. }
8.
where
is the number of pixels in the model image.
During the deformation of the model image, the shape parameters should be
restrained in a valid range of
. Also, the situation that the model image is
translated to a position far from its initial position is discouraged. In other words, the
translation distance in the transformation should be small. In order to meet these
requirements, we revised the mean square metric to include three regularization terms
as in Equation 4-10:
Equation-4-10
In this equation,
values for translation;
is the regularized mean square metric; {
is the initial value for scaling; and {
values for translation and scaling. The regularization term
62
are initial
and
are current
restrains
shape
parameters
to
be
within
;
the
regularization
term
keeps the transformed model image close to its
initial position {
; and the regularization term
from shrinking. The {
prevents model image
are weights for those three regularization terms. This
regularized mean square metric,
, is used in the optimization step.
4) Optimizer
An optimizer is designed to seek optimal values for pose and shape parameters
that minimize the regularized mean square metric in Equation 4-10. There are seven
pose parameters and
shape parameters. Finding the pose and shape parameters that
minimize the objective function
is a nonlinear optimization problem. In principle, any
nonlinear optimization method could be applied. We employ a nonlinear optimization
algorithm, one plus one evolutionary optimizer [109], in our method. This optimizer can
locally adjusts search direction and step size, and provides a mechanism to step out of
non-optimal local minima.
In the one plus one evolutionary optimizer, a parameter vector consists of pose
and shape parameters:
. A parameter vector represents an individual in an
evolution strategy. The fitness of an individual is determined by its objective function
value
. In our case, small values yield a high fitness and vice versa. In each
optimization step, a child individual is generated by mutating a parent individual. The
mutation is a random vector of multi-dimensional normal distribution with mean of the
parent individual and covariance matrix
. The covariance matrix
at the beginning. It is increased by a factor
is an identity matrix
if the child individual results in a smaller
objective function value than its parent individual does, and it is reduced by a factor
63
if otherwise. The factor
in [109] and
is chosen between 1.01 and 1.1 as recommended
.
In ShapeRegistrationCV, a model based registration method integrates the four
components: transformation, deformation, objective function, and optimizer, in a
framework that iteratively solves a nonlinear optimization problem. To initialize the pose
and shape parameters, only the starting position of a polyp is required to be set by a
user. The initial rotation is set to identity, the initial scaling is set to 1.0, and the initial
shape parameters are set to 0.0. The final solution to the optimization problem is
provided as a parameter vector containing values for pose and shape parameters.
These values define a transformation and deformation that can be applied to the mean
image in the shape prior model. The transformed and deformed mean shape image can
be used as a polyp segmentation result.
An ideal polyp segmentation method will identify all the protrusion part of a polyp
without any surrounding colon tissues. However, the transformed and deformed mean
shape image does not precisely label a polyp boundary for two reasons. First, there is no
guarantee that the optimizer can find the global optimal values that can transform and
deform the mean shape image to be the same as a polyp to be segmented. This is
because either the shape prior model cannot be deformed to a particular polyp given
large polyp shape variances or the optimizer is trapped in a local minimum. Second, our
polyp shape prior model contains a small region of surrounding colon tissues besides
the protrusion part of a polyp (see Figure 4.3). These extra colon tissues are important in
assisting the optimizer to estimate polyp pose. But, they prevent us from obtaining a
precise segmentation of a polyp protrusion region.
64
3. Deformable registration
from the mean polyp to the
colon surface.
4. Polyp protrusion
region (green)
2. A colon surface
generated by the
Chan-Vese model
1. The mean polyp embedded
in a shape prior model. The
polyp protrusion region is
manually specified by a white
rectangular cube.
5. Polyp surface
(red)
Figure 4.9 Extract a polyp surface from a colon surface by deformable registration.
We address this problem by employing a deformable registration to extract a
polyp surface in the protrusion region of a polyp. The overall process is illustrated in
Figure 4.9. By observation of the colon surface generated by the Chan-Vese model, as
shown in Figure 4.9, we find that the colon surface precisely delineates a polyp
boundary in the protrusion region. By manually labeling the polyp protrusion region in the
mean image of a shape prior model and deformable registration between the mean
image and the Chan-Vese segmentation image, we can obtain a protrusion region in the
Chan-Vese segmentation image (green region in Figure 4.9). A subset of the colon
surface which is inside the protrusion region is extracted as a polyp surface (red surface
in Figure 4.9). We employ the demons algorithm [110, 111] as the deformable
registration method. In Figure 4.9, we can see that, through the deformable registration,
65
the rectangular protrusion region in the mean image (white rectangular cube) is
deformed to an approximately squared cube in the Chan-Vese segmentation image
(green region).
4.3
Results
We test the proposed polyp segmentation method with 19 polyps using one polyp
shape prior model. The model is constructed based on six training polyp (Figure 4.10),
which are found by the method described in chapter three. PCA is applied to the level
set images of six polyps; and three eigenvectors corresponding to the largest three
eigenvalues are selected as mode images. The summation of top three eigenvalues is
96% of the summation of total eigenvalues in PCA, which indicates that the shape prior
model represents 96% shape variances in the training polyps. Figure 4.3 shows the
three modes of shape variance among training polyps.
Figure 4.10 Six training polyps used in constructing a shape prior model.
In the experiment, the initial position of a polyp is provided by a user. The
weights for regularization terms in Equation 4-10 are set as follows:
. The initial translation (
in Equation 4-10) is equal to the initial
66
position of a polyp. The initial scale (
in equation 4-x) is set to 1.0 in most cases. In a
few cases of small polyps with size around 6mm the initial scale is set to 0.7. The
running time of three steps in the polyp segmentation process on a workstation,
equipped with 2.4GHz quad-core dual CPUs and 6.0 GB RAM, are as follows: 4
seconds in Chan-Vese segmentation, 24 seconds in shape model based registration,
and 5 seconds in deformation registration and polyp surface generation.
Figure 4.11 Minimization of the objective function in the second step of
ShapeRegistrationCV.
Figure 4.11 shows the minimization procedure of the objective function in the
second step of ShapeRegistrationCV. The regularized mean square metric in Equation
4-10 is used as the objective function in this experiment. From the figure we learn that
the objective function approaches its minimal value after about 200 iterations so that the
67
curve between 200 and 500 iterations is relatively flat. We set the optimizer‟s maximum
iteration to be 500 in order to provide a sufficient margin for the object function to reach
its minimal value.
Figure 4.12 shows the segmentation results of 19 polyps from WFU and WRAMC
datasets. For each row in this figure, a polyp name is shown in the first column; a slice of
CT image around a polyp center is shown in the second column; a colon surface
generated by the Chan-Vese model is shown in the third column; an automatically
segmented polyp surface is shown in the fourth column; and an automatically
segmented polyp surface (red) is overlapped with a manually segmented polyp surface
(blue) in the fifth column. The dice coefficient between two surfaces (red and blue) is
shown in the last column in each row. The dice coefficient is calculated according to
Equation 4-11:
Equation 4-11
where
is the area of an automatically segmented polyp surface (red surface),
is the area of a manually segmented polyp surface (blue surface), and the
is the area of the overlapped region between the red and blue surfaces.
WFU_1
88.7%
WFU_2
84.6%
68
WFU_9
90.0%
WFU_10
86.7%
WFU_16
88.6%
WFU_17
86.0%
WFU_18
85.2%
WFU_19
82.9%
WFU_20
81.6%
WFU_23
91.3%
69
WFU_29
85.4%
WFU_30
79.1%
WFU_34
86.9%
WRAMC_2
78.5%
WRAMC_55
85.2%
WRAMC_61
80.4%
WRAMC_64
85.0%
WRAMC_65
80.3%
70
WRAMC_66
79.7%
Figure 4.12 Segmentation results of 19 polyps. Each row, from left to right, shows a
polyp name, a CT slice around the polyp center, a colon surface generated from the
Chan-Vese model, an automatically segmented polyp surface, overlap between
automatically segmented (red) and manually segmented (blue) polyp surfaces, and the
dice coefficient between red and blue surfaces.
In order to assess how sensitive the polyp segmentation method is to the initial
position, we segment a polyp six times with different initial positions. Figure 4.13 shows
the six segmented polyp surfaces with the initial positions are represented as blue
triangles in a slice of CT images. The initial positions are placed at the center of the
polyp, inside the polyp but close to the boundary, and outside the polyp. In all cases, the
polyp segmentation method generates a polyp surface that contains the major part of the
polyp protrusion region. Therefore, the proposed polyp segmentation method can
reliably generate polyp surfaces despite inaccurate initial positions. This desirable
property plays a pivotal role in detecting polyps where initial positions are automatically
generated by a computer program (please refer to chapter four).
71
Figure 4.13 Segment polyp surfaces with different initial positions.
We implement the ShapeRegistrationCV method in an open source software
package 3D Slicer [112], which provides image analysis and visualization functions
based on ITK [66] and VTK [113]. An interactive module in 3D Slicer, called CTCCADx,
is implemented to assist CTC researchers in constructing polyp shape prior models and
assist radiologists in segmenting polyps. The main user interface of the CTCCADx
module is shown in Figure 4.14.
72
Figure 4.14 User interface of the CTCCAD module in 3D Slicer.
4.4
Discussions and Conclusion
We construct a polyp shape prior model based on level set images as described
in section 4.2.1. However, a level set image is hard to obtain in practice. Usually, a level
set image is generated based on a binary image which is obtained by manual
segmentation. The manual segmentation is time consuming and subjective. We seek a
method to construct a shape prior model that avoids the manual segmentation process.
In CTC studies, the CT image has consistent pixel intensities for colon tissues. We
implement a method that can construct a shape prior model using the original CT
images based on the PCA algorithm. In our experiment, the shape prior model
73
generated based on CT images presents almost identical shape variances as the one
generated based on level set images. This provides an opportunity to simplify the
process of constructing shape prior models in the future. However, differences in these
two shape prior models, the model built upon CT images and the model build upon level
set images, prevent the former model from being utilized in ShapeRegistrationCV
method. The differences are: 1) the pixel values in the mean shape image have a large
range in the former model than in the later; 2) eigenvalues in the former model are much
larger than the ones in the later. Using the former shape prior model in
ShapeRegistrationCV, the un-regularized mean square error is so large that the weights
for regularization terms in Equation 4-10 are hard to be determined. For example, the
weights,
in Equation 4-10, are set to 1000, 3000, 30000 in using a shape prior
model built on CT images. By comparison those weights are set to 0.01, 0.1, and 1.0 in
using a shape prior model built on level set images. How to integrate a shape prior
model which is built on CT images into the proposed polyp segmentation method will be
investigated in the future.
In conclusion, we propose a polyp segmentation method based on a shape prior
model of polyps. This method consists of three steps: Chan-Vese model segmentation to
segment colon tissues; shape model based registration to estimate a polyp‟s pose and
shape; and deformable registration to extract a polyp surface. After quantitative
evaluation of the polyp segmentation method by comparing automatically segmented
polyp surfaces and manually segmented polyp surfaces, we conclude that the proposed
method can reliably identify a polyp surface that is similar to a polyp embedded in a
shape prior model. In future, we will seek a method that can utilize parallel computing
techniques to improve the speed of the segmentation, and a mechanism that will enable
an interactive segmentation by a few mouse-clicks in order to improve the accuracy.
74
Chapter Five
False Positives Reduction in Polyp Detection
The purpose of CTC CAD is to assist radiologists in finding polyps. Recent
development of CTC CAD includes automated identification of polyps in CTC images.
The automatically identified polyps, polyp candidates, are provided by CTC CAD to a
radiologist who will make a final decision whether a candidate is a polyp or a false
detection. Reducing false detections in polyp candidates is essential in CTC CAD. This
chapter provides an overview of a CTC CAD system and describes a method that
utilizes pattern recognition techniques to reduce false detections. In our initial results, the
new features derived from polyp segmentation results significantly improve the detection
performance in our CTC CAD.
5.1
Introduction
A typical CTC CAD is a multi-step procedure consisting of four steps:
segmentation of colonic wall, generation of intermediate polyp candidates, reduction of
false positives, and presentation of detections. The first step, segmentation of colonic
wall extracts a colon wall from abdomen CT images. This step prevents CTC CAD from
processing non-colon tissue in the following steps. In the second step, possible polyp
regions, which are called intermediate polyp candidates, are detected based on
geometry and intensity properties characterizing polyps. Various approaches have been
devised to identify intermediate polyp candidates based on curvature related features,
such as the shape index and curvedness. After generation of intermediate polyp
candidates, usually there are a large number of false positives in the candidates. This is
because a high sensitivity is desired in order to avoid missing polyps in the candidates,
75
and a low specificity is usually the consequence of a high sensitivity at this step in CTC
CAD. It is important to reduce the number of false positives as much as possible while
maintaining a high sensitivity. In the third step, reduction of false positives, a number of
pattern recognition algorithms are employed to train a classifier, which is designed to
classify polyps from false positive detections in intermediate polyp candidates. In the last
step, polyp candidates that are generated from a trained classifier are presented to a
radiologist as the CAD detections. The location, 2D and 3D views, and the size or
volume measurements are common information displayed in the presentation step. A
radiologist can verify a detection in CAD as a polyp or reject it as a false positive
detection based on his examination of the polyp candidate region. Since the topic of this
chapter is false positive reduction, we describe the details of the third step in CTC CAD.
In the false positives reduction step, a pattern recognition algorithm is usually
employed to train a classifier in order to find polyps from intermediate polyp candidates.
A classifier is an algorithm that can assign each input to one of a given set of classes. In
our case, the input is an intermediate polyp candidate and the given set of classes
includes “polyp” and “false detection”. A classifier is trained to assign each intermediate
polyp candidate to the “polyp” or “false detection” class. In a training process, a number
of intermediate polyp candidates are examined and their class, “polyp” or “false
detection”, are determined by a domain expert. Intermediate polyp candidate in the
training data are fed to a classifier and the class of each candidate is provided to assist
the classifier in learning the statistics in the training data. A number of pattern
recognition algorithms can be found in [114].
An input to a classifier contains a number of properties called features. Features
play a pivotal role in determining the classification performance of a trained classifier. In
our CTC CAD, features of an intermediate polyp candidate are computed as the
following. An intermediate polyp candidate is represented by a cluster of voxels
76
scattered in a candidate region, as shown in Figure 5.1 [115]. A voxel in a cluster is
selected based on its shape index and mean curvature [116]. Then, for a cluster of
voxels, the statistical operations, including mean, maximum, minimum, variance, skew,
kurtosis, and contrast, are calculated on geometric properties such as shape index and
curvature. The statistical values are the features for each intermediate polyp candidate
[116]. Since these features are based on geometric properties, they are usually called
geometric features. Besides the geometric features, we derive new features from the
polyp segmentation results. The detailed description of the new features is provided in
the next section.
Figure 5.1 Examples of three intermediate polyp candidates. White dots represent
voxels used to represent a candidate.
In order to utilize pattern recognition techniques in reducing false positives in
CTC CAD, two challenges need be addressed. The first challenge is to select an
appropriate pattern recognition algorithm and set its parameters given a particular CTC
CAD dataset. The second challenge is to handle the class imbalance problem, which
means a highly imbalanced ratio of the positive and negative samples in a training
dataset. We take a practical approach to address these two challenges.
77
5.2
Method
5.2.1
Select and tune a pattern recognition algorithm
A pattern recognition algorithm is employed to reduce false positives in our CTC
CAD. There are a large variety of pattern recognition algorithms that makes the selection
of an appropriate algorithm difficult and application dependent. Additionally, each pattern
recognition algorithm usually has several parameters that need to be determined
practically. For example, the number of hidden nodes in an artificial neural network
should be determined based on how many features and samples in a training dataset.
Determining parameters for a specific pattern recognition algorithm is a process to tune
a classifier.
We address the issues of the selection of a pattern recognition algorithm and
tuning a classifier by applying several algorithms with different parameters for each
algorithm. Five pattern recognition algorithms are chosen based on their popularity in
pattern recognition and CTC CAD research fields [117]: C4.5 decision tree, artificial
neural network (ANN), support vector machines (SVMs), Bagging, and AdaBoost. For
each algorithm, different parameters are set to an individual classifier. Then ten-fold
cross validation results are used to compare each classifier‟s performance.
Table 5-1 provides a summary of the pattern recognition algorithms used and the
parameters explored for each algorithm. In C4.5, we manipulate the minimum number of
instances per leaf (MNIPL), which controls the complexity of the tree structure. In ANN,
we used a one-hidden-layer network with a sigmoid activation function for each node.
We manipulate two parameters, the number of hidden nodes and the number of training
epochs. In SVMs, we use two kernels, the polynomial and Gaussian radial basis function
(RBF). We manipulate parameters for each kernel, i.e., the exponent in the polynomial
kernel and the sigma in the Gaussian RBF kernel. In Bagging, we manipulate two
78
parameters, the number of iterations performed and the base component classifier
(REPTree [95], C4.5, and ANN). In AdaBoost, we choose as weak learners: decision
stumps [95], C4.5 decision tree, and ANN. And we manipulate the number of iterations
performed with each weak learner.
Table 5-1 Pattern recognition algorithms selection and tuning
Algorithm
Parameter 1
Values
Parameter 2
MNIPL
ANN
Number
of
2 to 100; step 20
Hidden Nodes
Bagging
AdaBoost
5.2.2
100 to 1000;
step 100
1500 to 15000;
step 500
C4.5
SVMs
Values
Training
Epochs
100
to
1000; step
300
Exponent in
Polynomial
1 to 5; step 1
Kernel
Sigma
in
0.01 to 0.2; step
Gaussian
0.05
RBF Kernel
C4.5
5 to
(MNIPL = 4500,
step 5
14000)
REPTree
Number of 5 to
Base Learner (MNIPL = 4500,
Iterations
step 5
14000)
5 to
ANN
step 5
C4.5
5 to
(MNIPL = 4500,
step 5
14000)
Number of
Weak Learner
5 to
Decision Stump Iterations
step 5
5 to
ANN
step 5
50;
50;
50;
50;
50;
50;
Balance two classes in intermediate polyp candidates
There are two classes in intermediate polyp candidates, “polyp” and “false
detection”, which are positive and negative candidates in our CTC CAD. Usually there
79
are much more negative candidates than positive ones in a training data. For example,
in the WFU dataset, there are only 31 positive candidates while there are over 24,000
negative candidates (the ratio of positive/negative is 0.0013). Directly training a classifier
with this highly imbalanced data would likely result in poor or skewed classification
performance.
We balance the two classes in a training dataset by oversampling positive
candidates to match the number of negative ones. Two oversampling methods, random
oversampling [118] and SMOTE [119], are employed. In the random oversampling
method, positive candidates are duplicated to generate additional samples. In SMOTE, a
synthetic sample is generated from linear interpolation of five samples. After
oversampling, the ratio between positive and negative candidates is 1:1. Therefore, the
training dataset in our CTC CAD is balanced.
5.2.3
Integrate polyp segmentation into polyp detection
We propose a polyp segmentation method in this dissertation and expect to
reduce false positives in polyp detection using the segmentation results. The idea of
using polyp segmentation results to detect polyps is the following. We segment a polyp
in an intermediate polyp candidate region. If the polyp segmentation process succeeds,
we classify the intermediate polyp candidate to the “polyp” class. Otherwise, we classify
the intermediate polyp candidate to the “false detection” class. Two issues need to be
addressed in order to integrate the polyp segmentation method in polyp detection.
The first issue is to automatically place an initial position in polyp detection. The
polyp detection is an automatic process whereas the polyp segmentation is a semiautomatic process since the initial position is provided by a user. In polyp segmentation,
a user provides the initial position by clicking inside a polyp in a CTC slice after visually
examining the slice. In polyp detection, we devise a method to automatically generate an
80
initial position for each intermediate polyp candidate. An initial position for a polyp should
be inside of the protrusion region of a polyp in order to make the polyp segmentation
method obtain a polyp surface. Also the initial position should not be close to the
boundary between a polyp and colon lumen, which is required by the Chan-Vese model
in polyp segmentation method. To meet these two requirements, we utilize the shape
index property of a voxel to automatically generate an initial position. Specifically, an
intermediate polyp candidate consists of a cluster of voxels scattered in a candidate
region. A voxel that has the largest value of the shape index is selected as a potential
position. Usually, such a voxel is located at the tip of a polyp and close to the boundary
between a polyp and colon lumen. Therefore, the potential position need be adjusted to
move it toward a polyp center. We adjust the potential position by moving it along its
image gradient direction, which usually points from colon lumen to a polyp center. In this
way, the adjusted potential position meets both requirements described above: locates
inside the protrusion region of a polyp and is not close to the boundary between a polyp
and colon lumen.
The second issue is to determine whether a polyp segmentation process in an
intermediate polyp candidate region is successful or failed. Polyp segmentation in a
region that contains a polyp, which is a “polyp” candidate, will succeed and polyp
segmentation in a region that does not contain a polyp, which is a “false detection”
candidate, will fail. We employ a classification scheme to differentiate a “polyp” from a
“false detection” based on new features derived from segmentation results. A
deformation field (please refer to the deformable registration step in section 4.2.2.3 of
chapter four) is used to derive new features: mean and variance of the deformation field
magnitude. A deformation field is a vector image whose pixel type is vector rather than
scalar in a 2D or 3D image [120]. For example, a gradient image in 2D is a vector image
with each pixel represented by two scalars: a gradient in X direction and a gradient in Y
81
direction. In the deformable registration step of the polyp segmentation method, a
deformation field is used to define the deformation from the mean polyp surface (the
surface in the center of Figure 4.9 in chapter four) to a segmented polyp surface (the red
surface in Figure 4.9 in chapter four). Figure 5.2 shows examples of the mean polyp
surface (translucent green) and a segmented polyp surface (red) for two intermediate
polyp candidates. As can be seen in this figure, the deformation between two surfaces
for a candidate labeled as a “polyp” is smaller than the deformation for a candidate
labeled as a “false detection”.
Figure 5.2 Examples of a mean polyp surface (translucent green) overlaid with a
segmented polyp surface (red). The top left shows two surfaces for an intermediate
polyp candidate labeled as “polyp”. The top right shows a different view of the surfaces.
The bottom left shows two surfaces for an intermediate polyp candidate labeled as “false
detection”. The bottom right shows a different view of the surfaces.
5.3
Results
According to Table 5-1, thousands of classifiers are trained and tested using 10-
fold cross validation in our experiment. To obtain the computational resources necessary
to accomplish this task in a reasonable amount of time, we used the computer cluster
system at Wake Forest University - DEAC Cluster [121]. To evaluate each classifier‟s
classification performance, we rank them based on the sensitivity, specificity, and area
82
under the ROC curve (AUC). Table 5-2 lists the ranking results. For each ranking
criterion, the top classifier with its parameters is listed in each row. The classifier‟s
sensitivity, specificity, and AUC are shown in each row, too. In Table 5-2, we noticed that
the ANN classifier in the second row has an extremely low sensitivity (0.09). This is
because, in the second row, we ranked the classifiers according to the specificity; and
this ANN classifier was selected as the top classifier due to its high specificity (0.99).
This ANN classifier was over-trained with 42 hidden nodes and 1000 training epochs. By
such observation, we concluded that the specificity alone is not an appropriate criterion
upon which we can select the best performing classifier. Therefore, we used the
combination of sensitivity, specificity, and AUC as the criteria and the C4.5 classifier with
4500 MNIPL (the last row in Table 5-2) was selected as the best performing classifier in
our CTC CAD.
Table 5-2 Top classifiers according to different ranking criteria
Rank
Criteria
Classification
Algorithm
sensitivity
Bagging
specificity
ANN
AUC
AdaBoost
sensitivity +
specificity
C4.5
sensitivity +
AUC
AdaBoost
specificity +
AUC
AdaBoost
sensitivity +
specificity +
AUC
C4.5
Classifier‟s
Parameters
base learner: C4.5 with
MNIPL=14000
iterations: 25
hidden nodes: 42
training epochs: 1000
weak
learner:
decision
stump
number of weak learners: 25
MNIPL: 45000
weak
learner:
decision
stump
number of weak learners: 10
weak learner: C4.5 with
MINIPL=4500
number of weak learners: 20
MNIPL: 4500
83
Sensitivity
Specificity
AUC
0.84
0.69
0.75
0.09
0.99
0.75
0.72
0.82
0.84
0.77
0.83
0.82
0.78
0.78
0.83
0.31
0.96
0.81
0.77
0.83
0.82
Figure 5.3 Classification results from random oversampling (left) and SMOTE
oversampling (right) methods.
To evaluate the difference between two oversampling methods of random
oversampling and SMOTE, we train a classifier using both randomly oversampled
training data and SMOTE training data. The trained classifier‟s sensitivity, specificity,
and area under ROC curve (AUC) are shown in Figure 5.3, where 5.3.a contains the
results using the randomly oversampled data and 5.3.b contains the results using
SMOTE data. Since five pattern recognition algorithms are applied in the experiment, we
choose one classifier from each algorithm. As can be seen in Figure 5.3, there are no
significant differences in the results obtained using the two different oversampling
methods. All results reported in this chapter are from runs utilizing the SMOTE
oversampling method.
In order to study the new features derived from polyp segmentation results, we
select ten CTC studies, which contains 11 polyps and 1315 intermediate polyp
candidates in our CTC CAD. We run the polyp segmentation method with a computer
generated initial positions for each intermediate polyp candidate. In 11 polyps, initial
positions are correctly generated for ten of them except for one polyp (the 55 th
intermediate polyp candidate in CTC-0035\102_085500 in the WFU dataset). A
deformation field is outputted in the segmentation process. The magnitude of each pixel
84
in the deformation field is calculated. And the mean and variance of the deformation field
magnitude for each polyp candidate are plotted in Figure 5.4. In this figure, intermediate
polyp candidates labeled as “polyp” are represented by red dots and candidates labeled
as “false detection” are represented by blue dots. As can be seen, positive intermediate
polyp candidates (“polyp”) have relatively small mean and variance. In comparison, a
majority of negative intermediate polyp candidates (“false detection”) have relatively
large mean and variance. This matches what we have visually observed from Figure 5.3
that the deformation of a “polyp” candidate is smaller than the deformation of a “false
detection” candidate.
We implement a rule-based classifier to reduce false positives using the new
features: the mean and variance of deformation field magnitude. This classifier classifies
a candidate as “polyp” if the mean is <= 1.54 and the variance is <= 0.07, where the
thresholds of 1.54 and 0.07 are selected from the maximum of mean and variance of
polyps (red dots) in Figure 5.3. Before the C4.5 classification, there are 160 intermediate
polyp candidates per study on average in our CTC CAD. After the C4.5 classification, 32
false positives per study with the sensitivity of 0.89 are obtained. Use the rule-based
classifier, we reduce 79% of the false positives in the C4.5 classifier and obtain 7 false
positives per study with the same sensitivity as the C4.5 classifier.
85
Figure 5.4 Illustration of the new features: the mean and variance of the deformation
field magnitude. X-axis is the mean of the deformation field magnitude and Y-axis is the
variance of the deformation field magnitude. Blue dots represent “false detection”
intermediate polyp candidates and red dots represents “polyp” candidates.
86
5.4
Conclusion
We apply five pattern recognition algorithms in reducing false positives in our
CTC CAD: C4.5 decision tree, ANN, SVMs, Bagging, and AdaBoost. For each algorithm,
we tune a classifier by manipulating its parameters in order to obtain an optimal
classification performance. A massive number of classifiers are trained and evaluated
according to various ranking criteria. Based on the criteria of sensitivity, specificity, and
AUC, we conclude that the C4.5 decision tree with 4500 minimum number of instances
per leaf (MNIPL) is the best performing classifier in our CTC CAD. Furthermore, we
address the class imbalance problem in CTC CAD by two oversampling techniques:
random oversampling and SMOTE. According to the results obtained in our experiment,
there is no significant difference in sensitivity, specificity, and AUC for classifiers that are
trained by randomly and SMOTE oversampled CTC data.
We integrate the polyp segmentation method into polyp detection by automating
the process of placing initial positions for intermediate polyp candidates. New features
such as the mean and variance of the deformation field magnitude are derived from
segmentation results. According to the initial results, we reduce 79% false positives in
the C4.5 classifier in our CTC CAD and obtain 7 false positives per study with the
sensitivity of 0.87 at last. Additional features can be derived from segmentation results to
improve the false positives reduction in future, for example, shape parameters
volume and texture information inside a segmented polyp surface.
87
,
Chapter Six
Patient-level Analysis and Future Directions
In this chapter, we conclude the dissertation with the discussion of patient-level
analysis and future research directions. Different from polyp-level analysis, patient-level
analysis focuses on information retrieved from a patient rather than individual polyps.
Two types of features are explored in this chapter. We analyze the preliminary results of
the patient-level analysis are discuss the potential research directions in polyp
segmentation, polyp detection, and patient-level analysis.
6.1
Patient-level Analysis
The goal of CTC as a screening technique is to reduce CRC mortality by
referring a subject with clinically significant polyps to colonoscopy for treatment. We
believe that the use of CTC for optimally referring patients to colonoscopy has not been
adequately addressed. There is a vast amount of data and meta-data available in a
subject‟s CTC study such as colon shape, colon centerline variation, etc. that are
currently completely ignored when evaluating whether a subject should be referred for
colonoscopy. A more optimal referral decision can be made than one based purely on
the presence or absence of polyps.
Patient-level analysis assists radiologists in making a referral decision based on
information retrieved from a patient rather than individual polyps. In comparison, polyplevel analysis focuses on features like shape index and curvature of one polyp candidate,
and is designed to recognize polyps without false detections. Patient-level analysis,
however, utilizes aggregated features of all polyp candidates in a CTC study, e.g.,
number and mean size of polyp candidates in a patient, to determine whether this
88
patient should be referred to colonoscopy. Besides the aggregated features, other
features such as colon shape, colon centerline variation, and registration results
between supine and prone studies, are valuable information in patient-level analysis.
We analyze two types of patient-level features from the CTC scan and have
results that suggest their usefulness in our system. The first type aggregates polyp
information. An interesting observation is that these features tend to discriminate
between positive and negative patients by comparing the features after polyp candidate
generation to the features after false positive reduction. We have not yet settled on the
most pertinent features; however, Table 6-1 describes the current 22 candidate
aggregate polyp features that we are investigating. Figure 6.1 shows some of the
discriminant capability if a few of these features visualizing only the simplest linear
discriminant function. (Note that these are based on 416 studies from the WRAMC
dataset.) Some early results are given in Table 6-2.
Table 6-1 Potential patient-level, aggregated polyp features
Feature
Comments
Number of polyp candidates/polyps
Candidates are before false
positive reduction, and polyp after.
Candidate/polyps size: mean/max/min/variance Before and after false positive
reduction
Confidence: mean/max/min/variance
Average of the TC and FC Below
TC Confidence: mean/max/min/variance
TC (true candidate) confidence
value for those polyp candidates
identified as polyps by false
positive reduction.
FC Confidence: mean/max/min/variance
FC (false candidate) confidence
value for those polyp candidates
identified as non-polyps by false
positive reduction.
89
Figure 6.1 Potential classifications of patient-level features. This represents an initial
attempt to distinguish positive and negative patients (positive = 1 or more polyps >= 6
mm). Using a naïve linear Bayes classifier, sensitivity/specificity are .87/.52 and .87/54
for the left and right plots.
Table 6-2 Example results in feature discovery and selection. Classifier is naïve Bayes.
Criterion
Visual inspection
Predictive
value/redundancy
Predictive
value/redundancy
Search
method
N/A
Best first
Random
Top features selected for
classification
Confidence mean,
# polyps after FP reduction
Polyp size mean after FP reduction,
Confidence min
Polyp size mean, polyp size mean
after FP reduction, confidence
variance
Sens.
Spec.
0.97
0.52
0.90
0.57
0.97
0.57
We have made progress in feature discovery and feature selection for patientlevel features, using a number of methods. We have also made excellent use of the
WEKA system (Waikato Environment for Knowledge Analysis, University of Waikato,
New Zealand). WEKA alone provides 13 criteria with 9 search methods, each with its
own parameter options, resulting in a large combinatoric problem even for this one part
of the overall system. Additionally, we have our own methods to incorporate and
potentially those from other software packages. As an example, we intuitively chose,
based on visualizing plots, the features in the left and right plots in Figure 6.1:
90
confidence mean, number of polyp candidates after FP reduction, and polyp candidate
mean size. Even this simple approach using a naïve linear Bayes classifier achieves per
patient sensitivity/specificity of .87/.52 and .87/.54. We expect that more complex
classifiers and optimal feature selection will offer considerable improvement. We have
also begun testing computational feature selection methods. As an example we use a
best-first search with a criterion that evaluates the worth of a subset of attributes by
considering the individual predictive ability of each feature along with the degree of
redundancy between them. Four features were selected (out of 22 possible in Table 6-1).
When the top two are used for classification, sensitivity/specificity are .97/.54. Keeping
this same algorithm but using an exhaustive search, two features are discovered, which
have no overlap with the four from the suboptimal approach. However, the results are
skewed for this approach by outliers, emphasizing the importance of visualizing and
interacting with the results of feature discovery. In another experiment, we use a random
search and found seven important features. Of the top four, only two overlapped with the
four found above. When combining feature selection with classifier design in the
optimization loop, it is clear that there is still much to uncover. By including this process
in the optimization loop for the entire system using cluster compute power, we hope to
uncover information that is not obvious in a less ambitious approach.
The second feature type that we propose is based on whole or regional colon
shape. We hypothesize that this may be a factor in polyp development due to fecal
clearance and perhaps other factors. Examples of possible features include colon
smoothness, diameter, colon length, number of folds, fold frequency and amplitude,
colon wall thickness, etc. Additionally, how polyp candidates group where they appear in
colon segments may be useful information. Further, the shape may describe a
phenotype that reflects an underlying genotype that is prone to polyps or cancer [122].
While our work is preliminary, our first effort is to use the centerline to describe the colon
91
shape. And for each voxel of the centerline, we calculate its distance from boundary
(DFB) -- colon wall, and distance from rectum (DFR). Figure 6.2 shows an example of
centerline with DFB and DFR information. In this diagram, a circle represents the closest
centerline voxel to its neighboring polyp candidate (negative after classification), a red
plus is for false positive polyp candidate after classification, and red star represents the
same for a true positive polyp candidate. We are investigating several properties of this
information, including the Fourier transform and wavelets for possible clues to colons
that may be at risk.
Figure 6.2 Plot of minimum centerline distance to the lumen. „+‟ is intermediate polyp
candidate. „o‟ is candidate after false positives reduction. „*‟ is a true positive confirmed
in colonoscopy. Frequency or wavelet analysis of signal shape could be indicative of
polyp or cancer risk. A hidden Markov model could be used for analysis.
6.2
Conclusions and Future Directions
In the polyp segmentation, we devised a new method to segment polyps using
shape prior models and implement a system that can construct a polyp shape model,
segment a polyp, and visualize segmentation results. Following topics can be
investigated in the future:
92
1. Build shape prior models that cover all types of polyps regarding to their
location and morphologic types.
2. Increase the speed of the segmentation process by utilizing parallel
computing techniques.
3. Improve the accuracy of segmented polyp surface by using interactive image
segmentation algorithms, such as the graph cuts.
In the polyp detection, we implement a method that select a pattern recognition
algorithm for a particular classification task and tune a classifier to decide its parameters.
By integrating the polyp segmentation method into the polyp detection, we significantly
reduce false positives in our CTC CAD using new features. Following topics can be
investigated in the future:
1. Improve the algorithm that automatically places an initial position in the polyp
detection.
2. Derive more features from the polyp segmentation results such as shape
parameters, polyp size, and volume/texture information inside a segmented
polyp surface.
In the patient-level analysis, we discover a number of features including
aggravated features from polyp information and colon shape features based on its
centerline variation. Several feature selection methods in WEKA are tested and the
results are encouraging. Following topics can be investigated in the future:
1. Obtain more patient-level features from the polyp segmentation and detection
results.
2. Integrate the registration results of supine and prone studies into the patientlevel analysis.
3. Improve the work-flow of patient-level analysis to provide assistive
information for radiologist in making a referral decision.
93
The research work in this dissertation has three major contributions to the CTC
CAD. First, we devised a new approach to segment and detect polyps based on polyp
shape models. Second, we promoted the open source development in CTC CAD by
utilizing 3D Slicer, ITK, and VTK. Third, we improved the classification system design in
CTC CAD by comparing a group of classifiers and tuning their parameters.
94
REFERENCES
[1]
[2]
[3]
[4]
[5]
[6]
[7]
[8]
[9]
[10]
[11]
[12]
[13]
[14]
[15]
A. Jemal, R. Siegel, E. Ward et al., “Cancer statistics, 2008,” CA: A Cancer
Journal for Clinicians, vol. 58, no. 2, pp. 71-96, 2008.
B. Levin, D. Lieberman, B. McFarland et al., “Screening and surveillance for the
early detection of colorectal cancer and adenomatous polyps, 2008: a joint
guideline from the American Cancer Society, the US multi-society task force on
colorectal cancer, and the American College of Radiology,” CA: A Cancer
Journal for Clinicians, vol. 58, no. 3, pp. CA.2007.0018-160, 2008.
D. Bielen, and G. Kiss, “Computer-aided detection for CT colonography: update
2007,” Abdominal Imaging, vol. 32, no. 5, pp. 571-581, 2007.
R. Summers, J. Yao, P. Pickhardt et al., “Computed tomographic virtual
colonoscopy computer-aided polyp detection in a screening population,”
Gastroenterology, vol. 129, no. 6, pp. 1832-1844, 2005.
H. Yoshida, Y. Masutani, P. MacEneaney et al., “Computerized detection of
colonic polyps at CT colonography on the basis of volumetric features: pilot
study,” Radiology, vol. 222, no. 2, pp. 327-336, 2002.
D. Paik, C. Beaulieu, G. Rubin et al., “Surface normal overlap: a computer-aided
detection algorithm with application to colonic polyps and lung nodules in helical
CT,” IEEE Transactions on Medical Imaging, vol. 23, no. 6, pp. 661-675, 2004.
G. Kiss, J. Cleynenbreugel, P. Suetens et al., "Computer aided diagnosis for CT
Colonography via slope density functions," Medical Image Computing and
Computer-Assisted Intervention - MICCAI 2003, R. Ellis and T. Peters, eds., pp.
746-753: Springer Berlin / Heidelberg, 2003.
L. Bogoni, P. Cathier, M. Dundar et al., “Computer-aided detection (CAD) for CT
colonography: a tool to address a growing need,” The British Journal of
Radiology, vol. 78, 2005.
Z. Wang, Z. Liang, L. Li et al., “Reduction of false positives by internal features
for polyp detection in CT-based virtual colonoscopy,” Medical Physics, vol. 32, no.
12, pp. 3602-3616, 2005.
E. Lawrence, P. Pickhardt, D. Kim et al., “Colorectal polyps: stand-alone
performance of computer-aided detection in a large asymptomatic screening
population,” Radiology, vol. 256, no. 3, pp. 791-798, 2010.
N. Petrick, M. Haider, R. Summers et al., “CT colonography with computer-aided
detection as a second reader: observer performance study,” Radiology, vol. 246,
no. 1, pp. 148-156, 2008.
S. Taylor, S. Halligan, D. Burling et al., “Computer-assisted reader software
versus expert reviewers for polyp detection on CT colonography,” American
Journal of Roentgenology, vol. 186, no. 3, pp. 696-702, 2006.
S. Halligan, D. Altman, S. Mallett et al., “Computed tomographic colonography:
assessment of radiologist performance with and without computer-aided
detection,” Gastroenterology, vol. 131, no. 6, pp. 1690-1699, 2006.
V. A. Fisichella, F. Jäderling, S. Horvath et al., “Computer-aided detection (CAD)
as a second reader using perspective filet view at CT colonography: effect on
performance of inexperienced readers,” Clinical Radiology, vol. 64, no. 10, pp.
972-982, 2009.
R. Summers, J. Liu, B. Rehani et al., “CT colonography computer-aided polyp
detection: effect on radiologist observers of polyp identification by CAD on both
the supine and prone scans,” Academic Radiology, vol. 17, no. 8, pp. 948-959,
2010.
95
[16]
[17]
[18]
[19]
[20]
[21]
[22]
[23]
[24]
[25]
[26]
[27]
[28]
[29]
[30]
[31]
[32]
[33]
[34]
A. Dachman, N. Obuchowski, J. Hoffmeister et al., “Effect of computer-aided
detection for CT colonography in a multireader, multicase trial,” Radiology, vol.
256, no. 3, pp. 827-835, 2010.
S. Frentz, and R. Summers, “Current status of CT Colonography,” Academic
Radiology, vol. 13, no. 12, pp. 1517-1531, 2006.
D. J. Vining, E. K. Grishaw, K. Liu, D. W. Gelfand, “Virtual colonoscopy,”
Radiology, vol. 193(P), pp. 446, 1994.
M. Hafner, “Conventional colonoscopy: technique, indications, limits,” Colon
Imaging, vol. 61, no. 3, pp. 409-414, 2007.
J. H. Bond, “Clinical evidence for the adenoma-carcinoma sequence, and the
management of patients with colorectal adenomas,” Seminars in Gastrointestinal
Disease, vol. 11, no. 4, pp. 176-184, 2000.
S. J. Winawer, A. G. Zauber, M. N. Ho et al., “Prevention of colorectal cancer by
colonoscopic polypectomy. the national polyp study workgroup,” The New
England Journal of Medicine, vol. 329, no. 27, pp. 1977-1981, 1993.
A. J. Aldridge, and J. N. Simson, “Histological assessment of colorectal
adenomas by size. are polyps less than 10 mm in size clinically important?,” The
European Journal of Surgery, vol. 167, no. 10, pp. 777-781, 2001.
P. Pickhardt, R. Choi, I. Hwang et al., “Computed tomographic virtual
colonoscopy to screen for colorectal neoplasia in asymptomatic adults,” The New
England Journal of Medicine, vol. 349, no. 23, pp. 2191-2200, 2003.
M. Macari, E. Bini, S. Jacobs et al., “Significance of missed polyps at CT
colonography,” American Journal of Roentgenology, vol. 183, no. 1, pp. 127-134,
2004.
D. Ahlquist, D. Sargent, C. Loprinzi et al., “Stool DNA and occult blood testing for
screen detection of colorectal neoplasia,” Annals of Internal Medicine, vol. 149,
no. 7, pp. 441-450, 2008.
H. El-Serag, L. Petersen, H. Hampel et al., “The use of screening colonoscopy
for patients cared for by the Department of Veterans Affairs,” Archives of Internal
Medicine, vol. 166, no. 20, pp. 2202-2208, 2006.
R. Robertson, J. Burkhardt, P. Powell et al., “Trends in colon cancer screening
procedures in the US medicare and tricare populations: 1999-2001,” Preventive
Medicine, vol. 42, no. 6, pp. 460-462, 2006.
T. Mang, A. Graser, W. Schima et al., “CT colonography: techniques, indications,
findings,” Colon Imaging, vol. 61, no. 3, pp. 388-399, 2007.
D. Kim, P. Pickhardt, A. Taylor et al., “CT Colonography versus Colonoscopy for
the detection of advanced neoplasia,” The New England Journal of Medicine, vol.
357, no. 14, pp. 1403-1412, 2007.
D. Johnson, M.-H. Chen, A. Toledano et al., “Accuracy of CT Colonography for
detection of large adenomas and cancers,” The New England Journal of
Medicine, vol. 359, no. 12, pp. 1207-1217, 2008.
D. H. Kim, P. J. Pickhardt, G. Hoff et al., “Computed tomographic colonography
for colorectal screening,” Endoscopy, vol. 39, no. 6, pp. 545-549, 2007.
A. Karargyris, and N. Bourbakis, “Wireless capsule endoscopy and endoscopic
imaging: a survey on various methodologies presented,” IEEE Engineering in
Medicine and Biology Magazine, vol. 29, no. 1, pp. 72-83, 2010.
H. Li, and P. Santago, “Automatic colon segmentation with dual scan CT
colonography,” J Digit Imaging, vol. 18, no. 1, pp. 42-54, 2005.
C. L. Wyatt, Y. Ge, and D. J. Vining, “Automatic segmentation of the colon for
virtual colonoscopy,” Computerized medical imaging and graphics, vol. 24, no. 1,
pp. 1-9, 2000.
96
[35]
[36]
[37]
[38]
[39]
[40]
[41]
[42]
[43]
[44]
[45]
[46]
[47]
[48]
[49]
[50]
[51]
D. Chen, M. R. Wax, L. Li et al., “A novel approach to extract colon lumen from
CT images for virtual colonoscopy,” Medical Imaging, IEEE Transactions on, vol.
19, no. 12, pp. 1220-1226, 2000.
J. Nappi, A. H. Dachman, P. MacEneaney et al., "Automated knowledge-guided
segmentation of colonic walls for computerized detection of polyps in CT
colonography," J Comput Assist Tomogr, 4, pp. 493-504, 2002.
H. Frimmel, J. Nappi, and H. Yoshida, “Centerline-based colon segmentation for
CT colonography,” Med Phys, vol. 32, no. 8, pp. 2665-72, Aug, 2005.
M. Franaszek, R. M. Summers, P. J. Pickhardt et al., “Hybrid segmentation of
colon filled with air and opacified fluid for CT colonography,” IEEE Trans Med
Imaging, vol. 25, no. 3, pp. 358-68, Mar, 2006.
P. Santago, and H. D. Gage, “Statistical models of partial volume effect,” IEEE
Trans Image Process, vol. 4, no. 11, pp. 1531-40, 1995.
S. Wang, L. Li, H. Cohen et al., “An EM approach to MAP solution of segmenting
tissue mixture percentages with application to CT-based virtual colonoscopy,”
Medical Physics, vol. 35, no. 12, pp. 5787-5798, 2008.
I. W. O. Serlie, F. M. Vos, R. Truyen et al., “Classifying CT image data into
material fractions by a scale and rotation invariant edge model,” Image
Processing, IEEE Transactions on, vol. 16, no. 12, pp. 2891-2904, 2007.
R. van Uitert, and R. Summers, “Automatic correction of level set based subvoxel
precise centerlines for virtual colonoscopy using the colon outer wall,” Medical
Imaging, IEEE Transactions on, vol. 26, no. 8, pp. 1069-1078, 2007.
H. Yoshida, and J. Nappi, “Three-dimensional computer-aided diagnosis scheme
for detection of colonic polyps,” Medical Imaging, IEEE Transactions on, vol. 20,
no. 12, pp. 1261-1274, 2001.
R. Summers, C. Beaulieu, L. Pusanik et al., “Automated polyp detector for CT
colonography: feasibility study,” Radiology, vol. 216, no. 1, pp. 284-290, 2000.
G. Kiss, J. Van Cleynenbreugel, M. Thomeer et al., “Computer-aided diagnosis in
virtual colonography via combination of surface normal and sphere fitting
methods,” European Radiology, vol. 12, no. 1, pp. 77-81, 2002.
C. van Wijk, V. van Ravesteijn, F. Vos et al., “Detection and segmentation of
colonic polyps on implicit isosurfaces by second principal curvature flow,” IEEE
Transactions on Medical Imaging, vol. 29, no. 3, pp. 688-698, 2010.
H. Zhu, Z. Liang, P. Pickhardt et al., “Increasing computer-aided detection
specificity by projection features for CT colonography,” Medical Physics, vol. 37,
no. 4, pp. 1468-1481, 2010.
J. Yao, M. Miller, M. Franaszek et al., “Colonic polyp segmentation in CT
colonography-based on fuzzy clustering and deformable models,” Medical
Imaging, IEEE Transactions on, vol. 23, no. 11, pp. 1344-1352, 2004.
J. Yao, and R. Summers, “Adaptive deformable model for colonic polyp
segmentation and measurement on CT colonography,” Medical Physics, vol. 34,
no. 5, pp. 1655-1664, 2007.
L. Lu, A. Barbu, M. Wolf et al., "Accurate polyp segmentation for 3D CT
colongraphy using multi-staged probabilistic binary learning and compositional
model," Computer Vision and Pattern Recognition, 2008, IEEE Conference on.
pp. 1-8, 2008.
K. Suzuki, H. Yoshida, J. Näppi et al., “Massive-training artificial neural network
(MTANN) for reduction of false positives in computer-aided detection of polyps:
suppression of rectal tubes,” Med Phys, vol. 33, no. 10, pp. 3814-3824, 2006.
97
[52]
[53]
[54]
[55]
[56]
[57]
[58]
[59]
[60]
[61]
[62]
[63]
[64]
[65]
[66]
[67]
[68]
W. Yang, J. Cai, J. Zheng et al., “User-friendly interactive image segmentation
through unified combinatorial user inputs,” IEEE Transactions on Image
Processing, vol. 19, no. 9, pp. 2470-2479, 2010.
R. Summers, J. Yao, and D. Johnson, “CT Colonography with computer-aided
detection: automated recognition of ileocecal valve to reduce number of falsepositive detections,” Radiology, vol. 233, no. 1, pp. 266-272, 2004.
W. Cai, M. Zalis, J. Näppi et al., “Structure-analysis method for electronic
cleansing in cathartic and noncathartic CT colonography,” Medical Physics, vol.
35, no. 7, pp. 3259-3277, 2008.
R. Carmi, G. Kafri, L. Goshen et al., "A unique noncathartic CT colonography
approach by using two-layer dual-energy MDCT and a special algorithmic colon
cleansing method," Nuclear Science Symposium Conference Record, 2008. NSS
'08. IEEE. pp. 4780-4783, 2008.
W. Cai, B. Liu, and H. Yoshida, "Dual-energy electronic cleansing for noncathartic CT colonography: a phantom study," SPIE Medical Imaging 2010:
Computer-Aided Diagnosis. p. 76240C, 2010.
J. Yee, N. Kumar, R. Hung et al., “Comparison of supine and prone scanning
separately and in combination at CT Colonography,” Radiology, vol. 226, no. 3,
pp. 653-661, 2003.
J. Suh, and C. Wyatt, “Deformable registration of supine and prone colons for
computed tomographic colonography,” Journal of Computer Assisted
Tomography, vol. 33, no. 6, pp. 902-911, 2009.
D. Chen, A. A. Farag, C. B. Sites et al., "A pilot study for verification of a novel
visualization approach for virtual colonoscopy," Proceedings of the MICCAI 2010
Workshop on Computational Challenges and Clinical Opportunities in Virtual
Colonoscopy and Abdominal Imaging, 2010.
W. Zeng, J. Marino, K. Chaitanya Gurijala et al., “Supine and prone colon
registration using quasi-conformal mapping,” IEEE Transactions on Visualization
and Computer Graphics, vol. 16, no. 6, pp. 1348-1357, 2010.
I. Serlie, F. Vos, R. Truyen et al., “Electronic cleansing for Computed
Tomography (CT) Colonography using a scale-invariant three-material model,”
IEEE Transactions on Biomedical Engineering, vol. 57, no. 6, pp. 1306-1317,
2010.
M. Oda, T. Kitasaka, H. Takabatake et al., "Synchronized display of virtual
colonoscopic views in supine and prone CT images," Proceedings of the 2010
MICCAI Workshop on Computational Challenges and Clinical Opportunities in
Virtual Colonoscopy and Abdominal Imaging, 2010.
FDA.
"http://www.fda.gov/MedicalDevices/ProductsandMedicalProcedures/DeviceAppr
ovalsandClearances/510kClearances/ucm225259.htm," 1 March, 2011.
T. Heimann, and H.-P. Meinzer, “Statistical shape models for 3D medical image
segmentation: A review,” Medical Image Analysis, vol. 13, no. 4, pp. 543-563,
2009.
E. Mortensen, and W. Barrett, "Intelligent scissors for image composition,"
SIGGRAPH '95: Proceedings of the 22nd annual conference on Computer
graphics and interactive techniques. pp. 191-198, 1995.
ITK. "http://www.itk.org."
GIMP. "http://.www.gimp.org."
Y. Boykov, O. Veksler, and R. Zabih, “Fast approximate energy minimization via
graph cuts,” IEEE Transactions on Pattern Analysis and Machine Intelligence, vol.
23, no. 11, pp. 1222-1239, 2001.
98
[69]
[70]
[71]
[72]
[73]
[74]
[75]
[76]
[77]
[78]
[79]
[80]
[81]
[82]
[83]
[84]
[85]
[86]
[87]
C. Rother, V. Kolmogorov, and A. Blake, “GrabCut: interactive foreground
extraction using iterated graph cuts,” ACM Transactions on Graphics, vol. 23, no.
3, pp. 309-314, 2004.
L. Grady, “Random walks for image segmentation,” IEEE Transactions on
Pattern Analysis and Machine Intelligence, vol. 28, no. 11, pp. 1768-1783, 2006.
X. Bai, and G. Sapiro, "A Geodesic Framework for Fast Interactive Image and
Video Segmentation and Matting," Computer Vision, 2007. ICCV 2007. IEEE
11th International Conference on. pp. 1-8, 2007.
A. Criminisi, T. Sharp, and A. Blake, "GeoS: geodesic image segmentation,"
Computer Vision – ECCV 2008. pp. 99-112, 2008.
A. Sinop, and L. Grady, "A seeded image segmentation framework unifying
graph cuts and random walker which yields a new algorithm," Computer Vision,
2007. ICCV 2007. IEEE 11th International Conference on. pp. 1-8, 2007.
M. Kass, A. Witkin, and D. Terzopoulos, “Snakes: active contour models,”
International Journal of Computer Vision, vol. 1, no. 4, pp. 321-331, 1988.
L. Cohen, and I. Cohen, “Finite-element methods for active contour models and
balloons for 2-D and 3-D images,” Pattern Analysis and Machine Intelligence,
IEEE Transactions on, vol. 15, no. 11, pp. 1131-1147, 1993.
C. Xu, and J. Prince, “Snakes, shapes, and gradient vector flow,” IEEE
Transactions on Image Processing, vol. 7, no. 3, pp. 359-369, 1998.
N. Paragios, O. Mellina-Gottardo, and V. Ramesh, “Gradient vector flow fast
geometric active contours,” IEEE Transactions on Pattern Analysis and Machine
Intelligence, vol. 26, no. 3, pp. 402-407, 2004.
X. Xie, and M. Mirmehdi, “MAC: magnetostatic active contour model,” IEEE
Transactions on Pattern Analysis and Machine Intelligence, vol. 30, no. 4, pp.
632-646, 2008.
X. Xie, “Active contouring based on gradient vector interaction and constrained
level set diffusion,” IEEE Transactions on Image Processing, vol. 19, no. 1, pp.
154-164, 2010.
D. Cremers, M. Rousson, and R. Deriche, “A review of statistical approaches to
level set segmentation: integrating color, texture, motion and shape,”
International Journal of Computer Vision, vol. 72, no. 2, pp. 195-215, 2007.
S. Osher, and J. Sethian, “Fronts propagating with curvature-dependent speed:
algorithms based on Hamilton-Jacobi formulations,” Journal of Computational
Physics, vol. 79, no. 1, pp. 12-49, 1988.
R. Malladi, J. Sethian, and B. Vemuri, “Shape modeling with front propagation: a
level set approach,” Pattern Analysis and Machine Intelligence, IEEE
Transactions on, vol. 17, no. 2, pp. 158-175, 1995.
V. Caselles, R. Kimmel, and G. Sapiro, “Geodesic active contours,” International
Journal of Computer Vision, vol. 22, no. 1, pp. 61-79, 1997.
T. Chan, and L. Vese, “Active contours without edges,” Image Processing, IEEE
Transactions on, vol. 10, no. 2, pp. 266-277, 2001.
T. F. Cootes, C. J. Taylor, D. H. Cooper et al., “Active shape models - their
training and application,” Computer Vision and Image Understanding, vol. 61, no.
1, pp. 38-59, 1995.
T. F. Cootes, G. J. Edwards, and C. J. Taylor, "Active appearance models," 5th
European Conference on Computer Vision, p. 484, 1998.
M. E. Leventon, W. L. Grimson, and O. Faugeras, "Statistical shape influence in
geodesic active contours," Computer Vision and Pattern Recognition, 2000.
Proceedings. IEEE Conference on. pp. 316-323, 2000.
99
[88]
[89]
[90]
[91]
[92]
[93]
[94]
[95]
[96]
[97]
[98]
[99]
[100]
[101]
[102]
[103]
[104]
[105]
[106]
A. Tsai, A. Yezzi, W. Wells et al., “A shape-based approach to the segmentation
of medical imagery using level sets,” Medical Imaging, IEEE Transactions on, vol.
22, no. 2, pp. 137-154, 2003.
A. Duci, A. J. Yezzi, S. K. Mitter et al., "Shape representation via harmonic
embedding," Computer Vision, 2003. Proceedings. Ninth IEEE International
Conference on. pp. 656-662 vol.1, 2003.
M. Rousson, and N. Paragios, "Shape priors for level set representations,"
Computer Vision — ECCV 2002, A. Heyden, G. Sparr, M. Nielsen et al., eds., pp.
416-418: Springer Berlin / Heidelberg, 2002.
M. Rousson, N. Paragios, and R. Deriche, "Implicit active shape models for 3D
segmentation in MR imaging," Medical Image Computing and Computer-Assisted
Intervention – MICCAI 2004. pp. 209-216, 2004.
D. Cremers, S. Osher, and S. Soatto, “Kernel density estimation and intrinsic
alignment for shape priors in level set segmentation,” International Journal of
Computer Vision, vol. 69, no. 3, pp. 335-351, 2006.
K. M. Will Schroeder, Bill Lorensen, Visualization Toolkit: an object-oriented
approach to 3D graphics, 4th edition ed.: Kitware, 2006.
Paraview. "http://www.paraview.org/."
I. Witten, and E. Frank, Data mining: practical machine learning tools and
techniques, Morgan Kaufmann series in data management systems: Morgan
Kaufmann, 2005.
S. K. Balci, P. Golland, W. M. Wells, "Non-rigid groupwise registration using Bspline deformation model," The Insight Journal - 2007 MICCAI Open Science
Workshop, 2007].
I. Dryden, and K. Mardia, Statistical shape analysis: Wiley, 1998.
A. Jerebko, S. Teerlink, M. Franaszek et al., "Polyp segmentation method for CT
Colonography computer-aided detection," SPIE Medical Imaging 2003. pp. 359369, 2003.
S. Tan, J. Yao, M. Ward et al., "Linear measurement of polyps in CT
Colonography using level sets on 3D surfaces," Engineering in Medicine and
Biology Society, 2009, Annual International Conference of the IEEE. pp. 36173620, 2009.
J. Näppi, H. Frimmel, A. Dachman et al., “Computerized detection of colorectal
masses in CT colonography based on fuzzy merging and wall-thickening
analysis,” Medical Physics, vol. 31, no. 4, pp. 860-872, 2004.
S. Grigorescu, S. Nevo, M. Liedenbaum et al., “Automated detection and
segmentation of large lesions in CT Colonography,” IEEE Transactions on
Biomedical Engineering, vol. 57, no. 3, 2010.
X. Xie, and M. Mirmehdi, "Geodesic colour active contour resistent to weak
edges and noise," Proceedings of the 14th British Machine Vision Conference.
pp. 399-408, 2003.
R. Summers, “Polyp size measurement at CT Colonography: what do we know
and what do we need to know?,” Radiology, vol. 255, no. 3, pp. 707-720, 2010.
T. Saito, and J.-I. Toriwaki, “New algorithms for euclidean distance
transformation of an n-dimensional digitized picture with applications,” Pattern
Recognition, vol. 27, no. 11, pp. 1551-1565, 1994.
A. Tsai, A. Yezzi, W. Wells et al., "Model-based curve evolution technique for
image segmentation," Computer Vision and Pattern Recognition, 2001. pp. I-463I-468 vol.1, 2001.
H. Xu, D. Gage, P. Santago et al., "Colorectal polyp segmentation based on
geodesic active contours with a shape-prior Model," Proceedings of the MICCAI
100
[107]
[108]
[109]
[110]
[111]
[112]
[113]
[114]
[115]
[116]
[117]
[118]
[119]
[120]
[121]
[122]
2010 Workshop on Computational Challenges and Clinical Opportunities in
Virtual Colonoscopy and Abdominal Imaging. pp. 169-174, 2010.
"Digital Imaging and Communications in Medicine (DICOM)," Part 3: Information
Object Definitions, National Electrical Manufacturers Association, 2010.
L.
Ibanes,
"Tutorial
on
Quaternions:
Part
I,"
www.itk.org/CourseWare/Training/QuaternionsI.pdf, 2001].
M. Styner, K. Rajamani, L.-P. Nolte et al., "Evaluation of 3D correspondence
methods for model building," Information Processing in Medical Imaging, pp. 6375, 2003.
J. P. Thirion, “Image matching as a diffusion process: an analogy with Maxwell's
demons,” Medical Image Analysis, vol. 2, no. 3, pp. 243-260, 1998.
T. Vercauteren, X. Pennec, A. Perchant et al., “Diffeomorphic demons using
ITK's finite difference solver hierarchy,” 2007 MICCAI Open Science Workshop,
2007.
Slicer. "http://www.slicer.org."
VTK, “http://www.vtk.org.”
R. Duda, P. Hart, and D. Stork, Pattern Classification (2nd Edition): WileyInterscience, 2001.
H. Xu, H. Gage, and P. Santago, "An open source implementation of colon CAD
in 3D slicer."
Y. Shen, and C. Wyatt, "Open implementation of feature extraction methods for
computer aided polyp detection with principal component analysis," 11th
International Conference on Medical Image Computing and Computer Assisted
Intervention. pp. 141-147, 2008.
X. Wu, V. Kumar, J. Ross Quinlan et al., “Top 10 algorithms in data mining,”
Knowledge and Information Systems, vol. 14, no. 1, pp. 1-37, 2008.
N. Japkowicz, and S. Stephen, “The class imbalance problem: A systematic
study,” Intelligent Data Analysis, vol. 6, no. 5, pp. 429-449, 2002.
N. V. Chawla, K. W. Bowyer, L. O. Hall et al., “SMOTE: Synthetic Minority Oversampling Technique,” Journal of Atrificial Intelligence Research, vol. 16, pp. 321347, 2002.
L. Ibanes, W. Schroeder, L. Ng et al., "The ITK Software Guide," 2005.
WFU DEAC. "http://www.deac.wfu.edu/."
E. Segal, C. Sirlin, C. Ooi et al., “Decoding global gene expression programs in
liver cancer by noninvasive imaging,” Nature Biotechnology, vol. 25, no. 6, pp.
675-680, 2007.
101
Scholastic Vita
Haiyong Xu
Education
Ph.D. 2011
Department of Biomedical Engineering
Wake Forest University, Winston-Salem, NC
M.Eng. 1998
Department of Computer Science and Engineering
Harbin Institute of Technology, China
B.Eng. 1996
Department of Automation Measurement and Control
Harbin Institute of Technology, China
Professional Memberships
BMES
Biomedical Engineering Society
MICCAI
Medical Image Computing and Computer Assisted Intervention
RSNA
Radiological Society of North America
SIIM
Society for Imaging Informatics in Medicine
SPIE
The Society of Photo-Optical Instrumentation Engineers
Awards and Scholarships
Graduate Fellowship, Wake Forest University
2006-2010
Professional Services
Journal reviewer: Medical Physics
Open-source community contributor: ITK, 3D Slicer
102
Publications
Peer-Reviewed Publications
H. Xu, H. D. Gage, and P. Santago, "An open source implementation of colon CAD
in 3D Slicer," in SPIE Medical Imaging 2010: Computer-Aided Diagnosis, vol. 7624, no.
1. 2010.
H. Xu, H. D. Gage, P. Santago, and Y. Ge, "Colorectal Polyp Segmentation based
on Geodesic Active Contours with a Shape-Prior Model," in Proceedings of the MICCAI
2010 Workshop on Computational Challenges and Clinical Opportunities in Virtual
Colonoscopy and Abdominal Imaging. 2010
Manuscripts in Preparation
H. Xu, P. Santago, and H. D. Gage, “Use WEKA to select and tune a classifier in
CTC CAD”
H. Xu and P. Santago, “An efficient group-wise registration method for polyp
shape analysis”
H. Xu, H. D. Gage, P. Santago, and Y. Ge, “Polyp segmentation based on shape
models in CTC CAD”
Abstracts and Presentations
H. Xu, H. D. Gage, C. L. Wyatt, Y. Shen, and P. Santago, "Design classification
system for computer-aided diagnosis in CT Colonography," in SIIM 2009 Annual Meeting.
2009.
H. Xu and P. Santago, “Polyp Segmentation and Detection in CT Colonography
Using Geodesic Active Contours with Shape Prior,” in 9th Annual Graduate Student
Research Symposium, School of Biomedical Engineering and Sciences, VT-WFU. 2010.
H. Xu and P. Santago, “3D Slicer based Virtual Colonoscopy CAD,” in 8th Annual
Graduate Student Research Symposium, School of Biomedical Engineering and
Sciences, VT-WFU. 2009.
H. Xu and P. Santago, “Using computer cluster to deal with model selection
problem in pattern classification field,” in 7th Annual Graduate Student Research
Symposium, School of Biomedical Engineering and Sciences, VT-WFU. 2008.
103


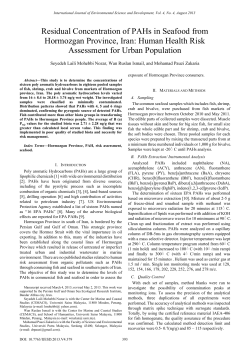


© Copyright 2026