
joining of ceramics and metals employing active metal brazing
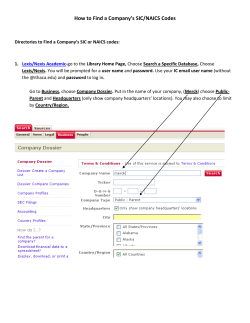
Scripta Materialia 52 (2005) 1169–1173
www.actamat-journals.com
Microstructural characterization of SiC ceramic and SiC–metal
active metal brazed joints
P. Prakash
a
a,*
, T. Mohandas a, P. Dharma Raju
b
Defence Metallurgical Research Laboratory, Metal Joining Group, Kanchanbagh Post, Hyderabad, Andhrapradesh 500058, India
b
Department of Metallurgical Engineering, NIT, Warangal, Andhrapradesh 506004, India
Received 26 October 2004; received in revised form 7 January 2005; accepted 20 January 2005
Available online 13 March 2005
Abstract
SiC ceramic is joined to itself, to stainless steels and to Inconel 718 using indigenously developed active brazing alloys. Detailed
interfacial product analysis by scanning electron microscopy, electron probe microanalysis and X-ray diffraction revealed that the
interfacial reactions are dependent on Ti concentration and the composition of the metal member in the ceramic–metal couple.
Ó 2005 Acta Materelia Inc. Published by Elsevier Ltd. All rights reserved.
Keywords: Brazing; EPMA; XRD; Ceramic; Ceramic–metal joints
1. Introduction
Previous studies [1] by the authors (PP and TM)
on active brazing of alumina ceramic to different
metals such as AISI 304SS, AISI 316SS (0.4 wt.%Ti),
Inconel 718 (0.75–0.9 wt.%Ti and 53 wt.%Ni), C.P Ti
(99 wt.%Ti) with indigenously developed 76.5 wt.%Ag–22.3 wt.%Cu–1.2 wt.%Ti (Ag–Cu–Ti) active brazing
alloy (ABA), revealed that the reactivity of titanium is
dependent on the metal member. This particular observation is in conformity with that reported by Vianco
et al. [2] and Raymundo and Eagar [3]. In this present
work, the authors attempt to study the effect of metal
substrate composition on the interfacial reaction when
SiC is used as the ceramic member employing the same
Ag–Cu–Ti filler alloy. In addition, the effect of Ti concentration in the filler alloy and the effect of solvent of
the brazing alloy is also investigated by carrying out
brazing studies with indigenously developed 77.9 wt.%
*
Corresponding author. Tel.: +91 402 458 6605; fax: +91 402 434
1439.
E-mail address: suramprakash@rediffmail.com (P. Prakash).
Cu–17.25 wt.%Ag–4.26 wt.% Ti (Cu–Ag–Ti) ABA. The
joining of engineering ceramics such as Al2O3, Si3N4
and AlN to themselves and to metals is well reported.
However, available data are scarce on the joining of
SiC ceramics [4–9] compared to other engineering
ceramics and the majority of the SiC joining studies
are confined to either SiC–SiC joining [6,7] or to SiCsimple metal systems like Ti [5] and Ni/Cr/Ni–Cr [8,9].
Thus, detailed work on SiC joining with some of the
familiar structural materials such as AISI 304SS, Inconel 718 etc. is not extensively reported, and the present
work is an attempt to fill this gap.
2. Experimental methods
The SiC employed is supplied by International Advanced Research Centre for Powder Metallurgy &
New Materials (ARCI), Hyderabad, in hot isostatic
pressed condition. The ceramic and the metal members
are employed as 5 mm thick discs. The nominal compositions of the metal members employed in this study are
presented in Table 1. The two types of ABA employed
1359-6462/$ - see front matter Ó 2005 Acta Materelia Inc. Published by Elsevier Ltd. All rights reserved.
doi:10.1016/j.scriptamat.2005.01.034
1170
P. Prakash et al. / Scripta Materialia 52 (2005) 1169–1173
Table 1
Nominal composition of base metal members (in wt.%)
Metal
C
Mn*
P*
S*
Si
Cr
Ni
Mo
Ti
Fe
Others
Type 304
Type 316
Inconel 718
0.08
0.08
0.64
2
2
–
0.045
0.045
–
0.03
0.03
–
1.00
1.00
–
18–20
16–18
18.5
8–10.5
10–14
Balance
–
2–3
3
–
0.4
0.75–0.9
Balance
Balance
18.5
–
–
Nb-5-1, Al-0.5
*
Maximum values.
Fig. 1. Brazing cycle.
are 100 lm thick foils, produced in-house. More details
about the process adopted in the manufacture of these
ABA alloys is published elsewhere [10]. All the samples
were polished on 800-grit paper, then cleaned with acetone, followed by etching with suitable acids and finally
ultrasonically cleaned with acetone. Samples were then
brazed in a high-vacuum brazing furnace with maximum temperature capability of 1200 °C at a vacuum
of 10 6 mbar. A constant dead weight of 20 g was
placed over the ceramic/metal assembly to ensure proper
alignment during brazing. All the samples were brazed
as per the brazing cycle shown in Fig. 1. Brazed samples
were subsequently cross-sectioned using an ISOMET
diamond saw, for metallographic characterization using
optical, scanning electron microscope (SEM), electron
probe microanalysis (EPMA) and X-ray diffraction
(XRD) techniques.
Fig. 2. BSE and X-ray image analysis of SiC–AgCuTi–SiC joint.
shows that the interfacial layer can be expected to comprise TiC [5,7], Ti–Si [5,6], Cu–Si and Cu–Ti (Fig. 2)
compounds, the XRD pattern of joint S1 shown in
Fig. 3 clearly indicates the presence of only two phases
namely TiC and Cu3Ti. The absence of Ti–Si compounds, is attributed to either the difference in the relative concentration of Ti available or to the process
condition employed in the earlier works or to both these
two factors. For example Naka et al. [5] had reported
the formation of Ti5Si3 and Ti5Si3Cx, in which SiC is diffusion bonded to SiC using pure Ti (>95 wt.%Ti) foil as
interlayer, whereas in the present study the Ti concen-
3. Results and discussions
Intensity in Counts
For convenience, the joints SiC–AgCuTi–SiC,
SiC–CuAgTi–SiC, SiC–AgCuTi–AISI 304SS, SiC–AgCuTi–AISI 316SS, SiC–AgCuTi–Inconel 718 and
SiC–CuAgTi–AISI 304SS are designated as S1, S2, S3,
S4, S5 and S6, respectively. The back scattered electron
(BSE) image and EPMA X-ray image analysis of joint
S1 (Fig. 2) clearly reveals the Ti diffusion and build up
at ceramic-filler alloy and filler alloy–metal interfaces,
which is intended, indicating the efficacy of indigenously
developed brazing alloy (Ag–Cu–Ti). Although preliminary investigation from the X-ray image analysis
(Fig. 2) and from the works reported earlier on SiC,
TiC
400
Cu3Ti
300
200
100
0
35
40
45
50
55
60
65
70
2θ
Fig. 3. XRD pattern of SiC–AgCuTi–SiC joint.
P. Prakash et al. / Scripta Materialia 52 (2005) 1169–1173
Fig. 4. BSE and X-ray image analysis of SiC–AgCuTi–AISI 304SS
joint.
Fig. 5. XRD pattern of SiC–AgCuTi–AISI 304SS joint.
Si
Cr
Ti
C
60
50
Atomic Wt%
tration in the filler is as low as 1.25 wt.%. In addition,
the joining temperature is also higher (1100–1500 °C)
in their work [5], than in the present work (930 °C).
The diffraction pattern of SiC–CuAgTi–SiC (S2), joined
at 1050 °C, owing to the higher melting point of Cu–Ag–
Ti ABA (950 °C) compared to that of Ag–Cu–Ti
(772 °C) ABA [10], is akin to that of S1, suggesting that
the change in Ti concentration (1.25–5 wt.%) or the
change in the solvent of the brazing alloy does not have
an effect on the interfacial product of SiC-SiC joint.
Fig. 4 shows the BSE and X-ray image analyses of
SiC–AgCuTi–AISI 304SS joint (S3). Comparison of
X-ray images of Cr, Fe and Ti clearly shows that Cr
and Fe had diffused from the stainless steel through
the active brazing alloy matrix (Ag–Cu) to the SiC interface, prior to the diffusion of active element Ti, as is evident from the clear shift in the segregation of Cr and Fe
towards SiC, over which Ti had segregated. Thus, as can
be predicted from the above observations, the XRD pattern of this joint shown in Fig. 5, shows that the interfacial reaction products consists of Cr23C6 as the major
phase together with CrSi2, Cr1.75Ni0.25Ti, Cr5Si3 and
FeSiC. Notably TiC is not observed in the XRD pattern, although the EPMA compositional analysis of this
joint shown in Fig. 6 shows a possibility of a TiC phase
about 4 lm wide. Nevertheless, Cr23C6 and Cr5Si3 are
identified as the major phases in this system, although
the presence of TiC is not completely ruled out. This
1171
40
30
SiC
304 SS
Filler region
20
10
0
0
5
10
15
20
25
30
35
Distance in microns
Fig. 6. EPMA compositional analysis of SiC–AgCuTi–AISI 304SS
joint.
is well in conformity with the observations of Jackson
et al. [8], in which SiC is diffusion coupled to Cr, who
reported the presence of several carbide phases including
Cr23C6 and Cr–Si compounds. Moreover the high negative free energy values (in kJ/mol) of Cr23C6 ( 1634.879)
[11] compared to TiC ( 247.092) [12] at the brazing temperature employed in this study (930 °C) and the higher
concentration of Cr (18 wt.%) available than the Ti
availability (1.25 wt.%) further substantiates our current
claim that in this particular system, Cr proactively reacts
with SiC to form Cr23C6 and Cr–Si phases. The absence
of expected Ti–Si compounds is attributed to the same
reasons as explained for joint S1. Although the spatial
occurrence of these phases is not clear from the XRD
pattern, Fig. 6, it is possible to suggest that the interface
product at SiC side comprises of Cr23C6, FeSiC, Cr5Si3
and CrSi2 while the stainless steel interface comprises a
complex Cr1.75Ni0.25Ti, together with Fe and Si, though
the latter is not identified in XRD.
In order to understand the effect of the presence of
the active element Ti in the metal member on the interfacial reactions, SiC is joined to Ti stabilised AISI 316SS
(0.4 wt.%Ti) using the same Ag–Cu–Ti filler alloy (S4).
As expected, the chemistry of interfaces is found to be
different from that of joint S3. Fig. 7 shows the XRD
1172
P. Prakash et al. / Scripta Materialia 52 (2005) 1169–1173
Fig. 7. XRD pattern of SiC–AgCuTi–AISI 316SS joint.
pattern of joint S4. In addition to Cr23C6, CrSi2 and
FeSiC as in joint S3, two more expected phases namely
TiC and TiSi2 are also observed, although the amount of
TiC phase is expected to be less from its weak signal
intensity. The EPMA line scans of this joint (S4) shown
in Fig. 8 further substantiates the presence of some of
these phases, particularly to that of TiSi2. Thus an additional availability of Ti from the metal member had
introduced the expected TiSi2 and TiC phases which is
absent in joint S3 (bare stainless steel), justifying the earlier reasoning for the absence of these compounds in
SiC–AgCuTi–AISI 304SS joint (S3), owing to the lower
concentration of Ti (1.25 wt.%) available in S3.
It was observed by Prakash et al. [1] that the presence
of Ni as the major phase in the metal member (Ni based
Fig. 8. BSE and EPMA line scan of SiC–AgCuTi–AISI 316SS joint.
Fig. 9. BSE and X-ray images of SiC–AgCuTi–Inconel 718 joint.
alloys) had a pronounced effect in the joining of Al2O3
using the same filler Ag–Cu–Ti filler. A detailed study
of the above will be published elsewhere. In this work,
the same is attempted with SiC ceramic. Fig. 9 shows
the BSE and EPMA image analyses of SiC–AgCuTi–
Inconel 718 (S5) joint. Here again, as in joint S3, elements such as Cr, Fe and Ni had diffused from Inconel
718 side to SiC interface, whilst Si had diffused towards
Inconel 718 from SiC. The XRD pattern of this joint,
shown in Fig. 10, clearly identifies the presence of
Cr23C6, CrSi2 as in joint S3, together with phases namely
TiC, Ni16Ti6Si7 and CuNi2Ti. XRD pattern also shows
Ti3S4, Cr5Si3 (not identified in XRD) as minor phases.
Evidently the predominant presence of TiC in this joint
is clearly due to the higher Ti concentration available in
this particular joint (1.25 + 0.8 wt.% Ti) compared to
joints S3 (1.25 wt.% Ti) and S4 (1.25 + 0.4 wt.% Ti).
Thus the above sequential experiments reveal that the
chemistry of the interfaces can be well tailored according
to the mechanical property requirements or to the application, by altering the chemical composition of the
metal members, if the same is permissible. For instance,
the active element (Ti) concentration in the brazing alloy
can be kept as low as possible, at the same time sufficient
bonding can be achieved by supplementing the active
element from the metal member, thereby avoiding the
brittleness problem generally encountered in the making
of active brazing alloys with higher Ti concentration.
Moreover, in the higher Ti concentration alloys, the
unreacted Ti which remains in the alloy makes the alloy
P. Prakash et al. / Scripta Materialia 52 (2005) 1169–1173
Fig. 10. XRD pattern of SiC–AgCuTi–Inconel 718 joint.
1173
alloy) too, TiC is observed as the major phase in
addition to Cr23C6. This tendency clearly shows
that in addition to the filler alloy, the active element Ti can also be supplemented through the
metal member to aid bonding.
(ii) Strong presence of Cr23C6 phase in SiC–AgCuTi–
AISI 304SS joints suggests that Cr can act as an
effective active element in joining SiC to stainless
steels, in which case conventional Ag–Cu brazing
alloy can well be used instead of active brazing
alloy, since stainless steel can provide Cr present
in it during brazing. But the same has to be verified. In general the study has revealed that both
Ag–Cu–Ti and Cu–Ag–Ti ABA are suitable for
joining SiC to SiC, and SiC to metal combinations.
(iii) In SiC to metal joints, the presence of Ni in the
metal member does not influence the reactivity of
active element Ti as observed in Al2O3 to metal
joints in our earlier studies.
Acknowledgements
Fig. 11. XRD pattern of SiC–CuAgTi–AISI 304SS joint.
brittle, thereby hampering the stress relaxation functioning of the braze matrix (Ag–Cu). The above view is further rationalized when SiC is joined to AISI 304SS with
Cu–Ag–4.25 wt.%Ti as filler (S6). The XRD pattern of
this joint shown in Fig. 11 clearly shows the presence
of TiC in the interface, attributed to the higher Ti concentration (4.25 wt.%) available in this particular joint
than S3. Other major phases observed are Cr23C6,
Cr5Si3, CuNi2Ti, Ni16Ti16Si7 and Fe2Si.
4. Conclusions
(i) In SiC–AgCuTi–AISI 304SS joint, interestingly
Cr23C6 is observed as the major phase and the
expected TiC phase is notably absent. However,
supplementing 0.4 wt.%Ti (from Ti stabilized AISI
316SS, as in SiC–AgCuTi–AISI 316SS joint) and
0.8 wt.%Ti (from Inconel 718, as in SiC–AgCuTi–
Inconel 718) in addition to the 1.25 wt.% Ti present in the filler alloy (Ag–Cu–Ti) has introduced
the TiC phase as the minor and major phases,
respectively, in addition to the Cr23C6 phase. In
SiC–CuAgTi–AISI 304SS (4.5 wt.%Ti in the filler
The authors are grateful to DRDO for funding this
programme. The authors wish to express their gratitude
to Dr. A.M. Sriramamurthy, Director, DMRL for his
invaluable support and keen interest in this work. One
of the authors (PP) wishes to thank sincerely Mr. V.V.
Ramarao, ScientistÔDÕ, SFAG, DMRL for his help in
imparting training on the operation of EPMA. Authors
are also thankful to Mr. V. Ramakrishna TOÔBÕ and Mr.
M. Yadagiri TOÔAÕ of XRD Section, SFAG, DMRL,
for their support in carrying out XRD analysis.
References
[1] Prakash P, Mohandas T, Ramarao VV. In Proc National symp on
vacuum science and technology and vacuum metallurgy, IVSNS2003, BARC, Mumbai, 2003. p. 451.
[2] Vianco PT, Stephens JJ, Hlava PF, Walker CA. Welding J
2003;9:252-S.
[3] Raymundo A, Eagar TW. Acta Mater 2003;51:4871.
[4] Liu HJ, Feng JC, Qian YY. Scripta Mater 2000;43:49.
[5] Naka M, Feng JC, Schuster JC. Metall Mater Trans A
1997;28A:1385.
[6] Nishino T, Urai S, Okamoto I, Naka M. J Mater Sci Lett
1990;9:1417.
[7] Tamai T, Naka M. J Mater Sci Lett 1996;15:1025.
[8] Jackson MR, Mehan RL, Davis AM, Hall EL. Metall Mater
Trans A 1983;14A:355.
[9] Feng JC, Liu HJ, Naka M, Schuster JC. Mater Sci Tech
2003;19:137.
[10] Prakash P, Mohandas T, Ramarao VV, Narasimha Rao K.
DMRL TR 2003. vol. 341, 2003. p.20.
[11] Barin I. Thermochemical data of pure substances, Part I. 2nd
ed. Germany: VCH; 1993. p. 425.
[12] Barin I. Thermochemical data of pure substances, Part II. 2nd
ed. Germany: VCH; 1993. p. 1528.


© Copyright 2026