
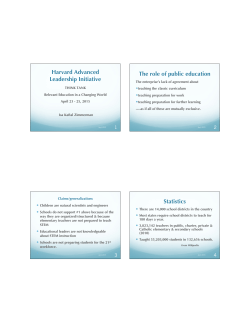
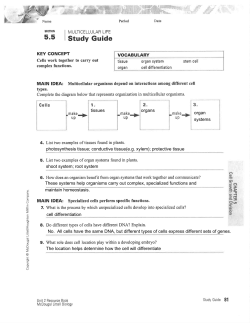
A bioassay to measure energy metabolism in mouse colonic crypts
Articles in PresS. Am J Physiol Gastrointest Liver Physiol (May 14, 2015). doi:10.1152/ajpgi.00052.2015
A bioassay to measure energy metabolism in mouse colonic crypts, organoids
and sorted stem cells
Yang-Yi Fan1,3, Laurie A. Davidson1,2,3, Evelyn S. Callaway1,3, Gus A. Wright4,
Stephen Safe2,5,6 and *Robert S. Chapkin1,2,3,6
1
Program in Integrative Nutrition and Complex Diseases, 2Center for Translational
Environmental Health Research, 3Departments of Nutrition & Food Science, 4Veterinary
Pathobiology, 5Veterinary Physiology and Pharmacology and 6Biochemistry &
Biophysics, Texas A&M University, College Station, TX 77843, USA.
*To whom correspondence should be addressed. Tel: +1 979 845-0448; Fax: +1 979
458-3704; Email: [email protected]
Running Title: Mouse colonocyte bioenergetic profiling
Copyright © 2015 by the American Physiological Society.
1
Abstract
Evidence suggests that targeting cancer cell energy metabolism might be an
effective therapeutic approach for selective ablation of malignancies.
SeahorseTM
Extracellular
Flux
Analyzer,
we
have
demonstrated
Using a
that
select
environmental agents can alter colonic mitochondrial function by increasing respirationinduced proton leak, thereby inducing apoptosis, a marker of colon cancer risk. To
further probe bioenergetics in primary intestinal cells, we developed methodology which
can be modified and adapted to measure the bioenergetic profiles of colonic crypts, the
basic functional unit of the colon, and colonic organoids, an ex vivo 3D culture of colonic
crypts. Furthermore, in combination with the MoFlo® Astrios™ High-Speed Cell Sorter,
we were able to measure the bioenergetic profiles of colonic adult stem and daughter
cells from Lgr5-EGFP-IRES-creERT2 transgenic mice.
We examined the effects of 2,3,7,8-tetrachlorodibenzo-p-dioxin (TCDD), a full
arylhydrocarbon receptor agonist, known to affect gastrointestinal function and cancer
risk, on the bioenergetic profiles of intestinal epithelial cells.
Mouse colonic crypts,
organoids, or sorted single cells were seeded onto Matrigel pre-coated Seahorse XF24
microplates for extracellular flux analysis. Temporal analyses revealed distinct energy
metabolic profiles in crypts and organoids challenged with TCDD. Furthermore, sorted
Lgr5+ stem cells exhibited a Warburg-like metabolic profile. This is noteworthy because
perturbations in stem cell dynamics are generally believed to represent the earliest step
towards colon tumorigenesis. We propose that our innovative methodology will facilitate
future in vivo / ex vivo metabolic studies using environmental agents affecting colonocyte
energy metabolism.
Keywords : colonic crypts, organoids, stem cells, TCDD, metabolism
2
Introduction
The colonic epithelial lining represents one of the most intensively selfreplenishing organs in mammals.
Cell homeostasis is sustained by crypt-resident
multipotent stem cells (1). Using a recently described three-dimensional culture system
(4)(5), we were able to monitor the growth of mouse colonic crypts, stem cell selfrenewal and differentiation in vitro (9). This is significant because adult colonic stem
cells are the cells of origin for colon tumors (4). Cancer cells are typically subject to
profound metabolic alterations, including the Warburg effect wherein most cancer cells
predominantly produce energy by a high rate of aerobic glycolysis (24). Recent studies
suggest that targeting cancer cell energy metabolism might be a new and very effective
therapeutic approach for selective ablation of malignancies (12)(19)(20).
Mitochondrial function has been traditionally assessed using Clark-type electrode
probes for measuring oxygen consumption, luminescent ATP assays for quantification of
total energy metabolism, and MTT or Alamar Blue for determination of metabolic activity.
These techniques, however, are labor intensive, cumbersome, and/or relatively
inaccessible for many laboratories. Recent development of the Seahorse XF
Extracellular Flux analyzer has afforded investigators the ability to measure intact cell
bioenergetic profiles in real time (25). This relatively new streamlined, label-free assay
system measures the two major energy-producing pathways of the cell simultaneously—
mitochondrial respiration (oxygen consumption) and glycolysis (extracellular
acidification)—in a highly sensitive microplate format. Cellular oxygen consumption
(respiration) and proton excretion (glycolysis) induce rapid, easily measurable changes
to the concentrations of dissolved oxygen and free protons which are assessed every
few seconds by solid state sensor probes residing 200 microns above the cell
monolayer. Following the addition of various mitochondrial inhibitors, several
mitochondrial functional parameters can be determined and the entire cell bioenergetics
3
profile can be quantified (Figure 1). However, most of the applications to date have
been carried out using cell lines or isolated mitochondria because of the need to adhere
cells to the bottom of multi-chambered microplates. This step is typically followed by
repeated mixing procedures throughout the course of the analysis (~ 2-3 h). Although
an Islet Capture Microplate with a 125 µm pore size capture screen has been recently
developed, it is not suitable for most floating cells and small size tissue samples. To
date, there is a dearth of studies utilizing primary cultures, especially intestinal
cells/tissues, probably due to the fragility of these cultures, and the unique growth
condition required to sustain specific cell populations. To overcome these obstacles, we
have developed a Matrigel-based methodology for plating freshly isolated colonic crypts,
cultured colonic organoids, and adult colonic stem cells to accommodate the
extracellular flux measurements. Furthermore, by adjusting growth factor levels in the
isolation/incubation medium, we are able to maintain the viability of stem cells ex vivo,
during the measurement of bioenergetic profiles.
The arylhydrocarbon receptor (AhR) is highly expressed in multiple organs and
tissues, and there is increasing evidence that the AhR plays an important role in cellular
homeostasis and disease (21).
The most high-affinity AhR agonist is the notorious
environmental and industrial toxicant 2,3,7,8-tetrachlorodibenzo-p-dioxin (TCDD).
TCDD induces a characteristic semi-acute wasting syndrome in several animal models
and represents a puzzling and dramatic perturbation of the regulatory systems for
energy balance (17). TCDD also modulates the phenotype of various cancer cell types,
including but not limited to, breast, ovarian, liver, and colon cancer cells (13)(15)(21)(26).
In order to further assess the effects of TCDD with respect to energy balance, we
optimized methodologies in order to measure the real time bioenergetics profile of
mouse colonic crypts and colonic organoid cultures exposed to TCDD. In addition, using
4
high-speed cell sorting, we measured for the first time the distinct oxygen consumption
rate (OCR) and extracellular acidification rate (ECAR), representing oxidative
phosphorylation/glycolysis profiles, in adult colonic stem cells and daughter cells freshly
isolated from Lgr5-EGFP-IRES-creERT2 transgenic mice.
5
Materials and Methods
Animals.
C57BL6 mice were used for TCDD studies.
Lgr5-EGFP-IRES-creERT2
transgenic mice, originally generated by H. Clevers at the Hubrecht Institute University
Medical Center, Utrecht, The Netherlands (2), were used for stem cell studies.
All
procedures adhered to the guidelines approved by Public Health Service and the
Institutional Animal Care and Use Committee at Texas A&M University.
TCDD treatment. For in vivo dosing studies, mice were orally gavaged with TCDD (25
µg/kg body weight) or corn oil (vehicle control) daily for 4 consecutive days. Colonic
crypts were subsequently isolated and bioenergetic profiles measured using the
Seahorse bioanalyzer as described in the following detailed protocol section. For ex
vivo analyses, mouse colonic crypts were isolated and cultured to mature organoids in
complete medium containing Advanced DMEM/F12, GlutaMax [2 mM], 100 U/ml
penicillin/100 µg/ml streptomycin, recombinant mouse EGF [50 ng/mL], N2 supplement
[1X], B27 supplement [1X] (all from LifeTechnologies, Grand Island, NY), LDN-193189
[0.2 µM] (Cellagen Technology, San Diego, CA), R-Spondin [500 ng/mL] (Sino
Biological, Beijing, China), N-acetylcysteine [1 µM] and HEPES [10 mM] (Sigma, St.
Louis, MO) and Wnt conditioned medium [1:1 dilution] (9)(22) for 5 days. TCDD [1 nM]
or DMSO (vehicle control) were added to the cultures for 3 additional days. Organoids
were then harvested, and bioenergetic profiles measured.
Stem cell analyses.
Colonocytes were isolated from Lgr5-EGFP-IRES-creERT2
transgenic mouse colons followed by high-speed cell sorting on a Beckman Coulter
MoFlo Astrios to selectively collect GFP-high (stem cell) and GFP-low (daughter cell)
populations as previously described (8).
Gating strategy details for sorting Lgr5-GFP-
high and low cells are described in Figure 2. For gating purposes, colonocytes isolated
6
from litter-mate wild type mice were used to exclude GFP negative cells. Bioenergetic
profiles of stem cells vs daughter cells were subsequently measured.
Statistical analysis. Data were analyzed using t-tests with significance at P < 0.05. All
data are presented as means ± SE, and all analyses were conducted using the Prism 6
program (GraphPad Software, Inc., La Jolla, CA).
Detailed Protocols:
I. Colonic Crypt Isolation: (Processing time ~ 60 min)
1.
Prepare ADF+ medium: Advanced DMEM/F12 medium (LifeTechnologies,
#12634-010) supplemented with 1% Glutamax (LifeTechnologies, #35050061), 1% Penicillin/Streptomycin (LifeTechnologies, #15140-148), and 1%
HEPES (Sigma, #H0887). (Can be stored at 4°C up to 2 weeks).
2.
Make fresh 20 mM EDTA in Ca2+/Mg2+ free HBSS (Mediatech #21-021-CV),
adjust to pH 7.4. Warm to 37°C in a water bath.
3.
Set up an eversion station by positioning a disposable 10 mL syringe upright
on a rack and attach a disposable gavage needle (Soloman Scientific # FTP20-38) onto the syringe.
4.
Fill a 5 mL syringe with cold HBSS and attach a gavage needle (Popper &
Sons, # 7922).
5.
For each tissue, prepare 3 x 50 mL conical tubes containing cold HBSS (~ 30
mL/tube, with 1 tube also containing 0.5% Penicillin/Streptomycin).
6.
Euthanize the mouse with CO2 followed by cervical dislocation.
7.
Remove the colon and place in a cup of cold HBSS.
8.
Rinse the tissue by swishing in cold HBSS and remove excess fat using a
forceps.
7
9.
Use the pre-loaded 5 mL syringe (from step 4) to perfuse the colon in order to
flush out feces.
10.
Gently thread the proximal end of the colon (wider) onto the disposal gavage
needle. Once the entire colon passes through the tip of the needle, tie the
distal end (narrower) onto the needle with a piece of string and cut off the
extra length of string. Evert the tissue by grasping the lower part of the colon
with 2 forceps and gently pulling it upward until it is completely everted.
Place the tissue attached to the gavage needle into the conical tube
containing 30 mL cold HBSS with 0.5% Penicillin/Streptomycin. Keep on ice.
11.
Vortex the colon (in the conical tube with cold HBSS) at maximum speed, 6 x
5 sec each, to remove remaining debris, making sure the tissue is untangled
between/after vortexing cycles.
12.
Use a forceps to transfer the colon to another conical tube containing 30 mL
cold HBSS. Vortex at maximum speed 3 x 5 sec each.
13.
Transfer colons to the pre-warmed 20 mM EDTA/HBSS in a 50 mL conical
tube. Incubate at 37°C in a water bath for 30 min.
14.
Following incubation, transfer the tissue to a conical tube containing ~ 30 mL
cold HBSS and vortex at maximum speed 8 x 5 sec each to release crypts.
(Take 10 µL aliquots and apply to a petri dish; check under an inverted
microscope to see the yield of crypts dislodged from the tissue. Continue the
isolation process using additional vortexing if necessary).
15.
Remove residual colon tissue on needle and discard. Add 3 mL FBS to the
tube containing crypts to yield a final 10% FBS/HBSS solution and spin down
the crypts at 125 x g for 3 min.
16.
Aspirate solution and resuspend crypts with ~ 13 mL cold ADF+ and transfer
to a 15 mL conical tube.
8
17.
Centrifuge at 70 x g for 2 min.
18.
Repeat the ADF+ wash 2-3 x to help remove single cells, pipetting up and
down multiple times.
19.
Take an aliquot and count. (Typical yield ~ 80-120,000 crypts from 1 mouse
colon).
20.
The isolated crypts can be used for organoid culture, single cell isolation, or
directly used for Seahorse Extracellular Flux XF24 bioanalyzer
measurements.
21.
For bioenergetics profile (BEP) analysis, resuspend the crypts at a density of
250 crypts/50 µL Seahorse-ADF medium (Seahorse XF Assay Medium
(Seahorse Bioscience, #100965-000) supplemented with 17.5 mM glucose
(Sigma, #G8769), 2 mM Glutamax (LifeTechnologies, #35050), 1 mM sodium
pyruvate (Sigma, #S8636) and 1% Penicillin/Streptomycin (LifeTechnologies,
#15140-148) adjusted to pH to 7.4.
II. Organoid Culture: (Processing time ~ 20 min)
1.
Prechill 200 and 1000 µL pipet tips at 4°C.
2.
Thaw the growth factor reduced basement membrane matrix Matrigel
(Corning, #356231) on ice, and warm up 24-well culture plates (Costar,
#3524) in a 37°C cell culture incubator at least 30 min prior to finishing the
crypt isolation.
3.
Prepare complete organoid medium by adding the following growth factors to
ADF+ medium: EGF [50 ng/mL] (LifeTechnologies, #PMG8043), LDN-193189
[0.2 µM] (Cellagen Technology, #C5361-2s), R-Spondin [500 ng/mL] (Sino
Biological), N2 supplement [1X] (LifeTechnologies, #17502-048), B27
supplement [1X] (Life Technologies, #12587-010), N-acetylcysteine [1 µM]
9
(Sigma, #A7250) and Wnt conditioned medium [1:1 dilution] as previously
described by Barker et al. (3).
4.
Aliquot the crypts from step 20 in the Colonic Crypt Isolation protocol (~ 5001000 crypts per well) to a 15 mL conical tube, fill the tube with ADF+ to ~10
mL in order to resuspend the crypts well, and spin down at 100 x g for 3 min.
5.
Thoroughly discard the supernatant and keep the crypts cold at all times.
Place the pre-chilled pipet tip boxes on ice and use the chilled pipet tips to
gently resuspend the pellet to a density of 500-1000 crypts/50 µL
Matrigel/well. Avoid bubbles.
6.
Seed 50 µL of Matrigel/crypt mix to the center of each well of pre-warmed 24well plate, and incubate for 5-10 min in 37°C incubator until solidified. (The
droplet of Matrigel should remain in the center of the well and not spread).
7.
During the Matrigel solidification step, prewarm the complete organoid
medium to 37°C.
8.
Once the Matrigel is solidified, add 500 µL warm complete organoid medium
to each well without touching the Matrigel mound. (The medium should
barely cover the Matrigel/crypt mound).
9.
Incubate at 37°C in a CO2 incubator. The plate is now ready for application of
the ex vivo treatments. Change complete medium every 2-3 days as needed.
(In general, the yield of viable crypts is ~ 10%. Live crypts will start budding
after 2-3 days in culture).
III. Organoid Harvest: (Processing time ~ 15 min)
10.
Place organoid culture plates on ice. Carefully aspirate and discard culture
medium, add 0.5 mL ice cold ADF+ and mechanically break up the Matrigel
10
by pipetting up and down multiple times using a 1000 µL pipet. Transfer the
dissociated Matrigel into a 15 mL conical tube.
11.
Wash the well with ice cold ADF+ (0.5 mL) to recover most of the organoids
and add to the 15 mL tube. (Organoids tend to grow more at the edge of
Matrigel. Check the culture wells under microscope to ensure that all
organoids have been harvested).
12.
Fill the 15 mL conical tube with cold ADF+ to at least 10 mL to dissociate and
wash the organoids from the Matrigel.
13.
Centrifuge at 200 x g for 4 min.
14.
Remove supernatant and resuspend in 1 mL Seahorse-ADF medium.
15.
Using a 1 mL syringe, pass the suspension through a 20-gauge needle 5x on
ice to break up the organoids into small pieces.
16.
Take 5 µL and apply to a small petri dish to count the number of organoid
pieces.
17.
Resuspend samples to a density of 250 organoids/50 µL Seahorse-ADF
medium/well. The sample is now ready for BEP analysis.
IV. Single Cell Isolation and Fluorescence Activated Cell Sorting: (Processing time
~ 45 min for single cell isolation, ~ 1 h for cell sorting)
1.
Precoat 5 mL polypropylene tubes (BD, #352063) with 5 mL of 2% FBS/ADF+
the day before cell sorting.
2.
Pre-warm 0.25% Trypsin-EDTA (LifeTechnologies, #25200-056) to room
temperature.
3.
Make fresh 500 mM butyrate working stock by mixing 0.055 g butyrate
(Sigma, #B5887) in 1 mL PBS, filter sterilize through 0.2 µm Acrodisc Syringe
Filter (PALL Life Sciences, #PN4454).
11
4.
Prepare single cell cocktail: ADF+ medium containing 10 µM Y-27632 (Sigma,
#Y0503), 1 µM N-acetylcysteine, 0.5% BSA, 200 U/mL DNase (Sigma
#D5025), 2 mM EDTA and 5 mM butyrate.
5.
Resuspend crypts from step 20 in the Colonic Crypt Isolation protocol in 5 mL
of 0.25% Trypsin-EDTA, incubate at 37°C in a CO2 incubator for 7 min.
6.
Pass suspension through a 20-gauge needle 3x to aid dissociation. Let sit 1
min at room temp. Pass the sample through the needle one last time to
break up cell clusters.
7.
Add 10 mL ice cold 5% FBS/ADF+ to stop the trypsin digestion reaction. Pass
contents through a 20 µm Partec filter (CellTrics, #04-0042-2315). (Multiple
filters may be needed since small clumps of cells or crypts can clog the filter).
8.
Transfer the filtered cell suspension to a 50 mL conical tube. Add an
additional 10 mL ADF+, 5 µl of 10 mM Y-27632, 20 µl of 500 mM butyrate to
the cell suspension. (The butyrate provides an energy source for the
colonocytes).
9.
Take an aliquot to count the number of cells.
10.
Centrifuge the cell suspension at 500 x g for 3 min 4°C. A very small pellet
should be visible. If not, spin again at a 550-600 x g for 1 min.
11.
Carefully aspirate the supernatant and resuspend the cell pellet to a density
of 2-4 x 10⁶ cells/mL, depending on the requirements of the flow cytometer, in
single cell cocktail. Keep samples on ice.
12.
Just before starting cell sorting, filter cell suspensions again using a 20 µm
Partec filter into the pre-coated 5 mL tube. Rinse the filter with a small
volume (~100 µL) of single cell cocktail to recover most of the cells.
12
13.
Add propidium iodine solution (5 µl/500 µl cell suspension) (Miltenyi Biotec,
#130-093-233) to the cell suspension to allow exclusion of dead cells from
cell sorting.
14.
Sort the GFP high, low and negative cell populations using a MoFlo®
Astrios™ High-Speed Cell Sorter (Beckman Coulter, #A66831).
15.
Collect sorted cells into 2X growth factor enriched Seahorse-ADF medium
(GF-Seahorse-ADF): Seahorse-ADF medium containing EGF [100 ng/mL],
LDN-193189 [0.4 µM], R-Spondin [1 µg/mL], N2 supplement [2X], B27
supplement [2X], Y-27632 [20 µM], and fresh butyrate [10 mM]. (Sorted
cells, collected mostly in PBS, will be diluted in the 2X medium to final 1X).
Keep sorted cells on ice.
16.
Transfer sorted cells to a 1.7 mL epi-tube. Count cell number and viability.
Centrifuge at 500 x g for 3 min at 4°C. Resuspend cell pellets to a density of
40,000 cells/50 µL 1X GF-Seahorse-ADF medium/well. (1X GF-SeahorseADF medium: Seahorse-ADF medium containing EGF [50 ng/mL], LDN193189 [0.2 µM], R-Spondin [500 ng/mL], N2 supplement [1X], B27
supplement [1X], Y-27632 [10 µM], and fresh butyrate [5 mM]). Cells are
now ready for BEP analysis.
V. Seahorse XF24 Extracellular Flux BEP Measurement:
(The day before BEP analysis):
Preparation of Matrigel-precoated plates: (Processing time ~ 30 min excluding the
1 h incubation)
1.
Prepare Seahorse-ADF medium.
2.
Dilute Matrigel 1:10 (v/v) in Seahorse-ADF medium. Add 50 µL/well to the
Seahorse XF24 cell culture microplate.
13
3.
Incubate at room temperature for at least 1 h.
4.
Seal with parafilm. Store at 4°C overnight. (Can be stored for up to 1 week).
5.
Prewarm Seahorse XF24 Extracellular Flux Analyzer (Seahorse Bioscience,
Billerica, MA) to 37°C. (At least 3 h before analyzing samples, overnight
stabilization preferred).
6.
Hydrate the XF 24 cartridge plate by adding ~ 1 mL/well of XF Calibrant
(Seahorse Bioscience, #100840-000). Incubate at 37°C in Seahorse XF
Plate Prep Station or a non-CO2 incubator. (Can be prepared 3 days ahead,
make sure the cartridges are well submerged in the XF Calibrant. If the
cartridges dry out, the measurement will not be accurate.)
(The day of analysis) (Processing time ~ 45 min hands-on time, and ~ 130 min
machine run time)
Set up the assay plate template and program according to the Seahorse XF24
Bioanalyzer ‘Assay Wizard’ section. The programs used are shown in the section
below “Program protocol”.
1.
Prepare 10X mitochondrial inhibitor compounds by diluting the stock solutions
in Seahorse-ADF medium (for crypts and organoids) or 1X GF-SeahorseADF medium (for single cells), and pH to 7.4.
The 10X working compounds for crypts, organoids and cells are listed below:
Crypts: oligomycin [20 μM] (Sigma, #O4867), FCCP [carbonylcyanide ptrifluoromethoxyphenylhydrazone; 5 µM] (Sigma, #C2920), and rotenone [50
µM] (Sigma, #R8875).
Organoids: oligomycin [20 μM], FCCP [25 µM], and rotenone [50 µM].
Isolated Cells: oligomycin [20 μM], FCCP [125 µM], and rotenone [100 µM].
2.
Take the hydrated cartridge plate out of the incubator. Add 50 µL oligomycin
to port A, 55 µL FCCP to port B, and 60 µL rotenone to port C of each
14
treatment wells. For basal and unused wells, add medium instead of the
mitochondrial inhibitors
3.
Incubate at 37°C in the Seahorse XF Plate Prep Station or a non-CO2
incubator ~ 30-60 min before the assay.
4.
Warm up the diluted Matrigel pre-coated cell culture microplate and
Seahorse-ADF medium (for crypts and organoids) or 1X GF-Seahorse-ADF
medium (for single cells) to room temp ~ 30-60 min before seeding
crypts/organoids/cells. (Avoid warming up the Matrigel-coated plate too
early, as the coating may dry out).
5.
Adjust samples to an appropriate seeding density: crypts (250 crypts/50 µL)
or organoids (250 organoids/50 µL) in ADF-Seahorse medium; single
colonocytes (minimum 40,000 cells/50 µL) in 1X GF-Seahorse-ADF medium.
6.
Aspirate the diluted Matrigel from the cell culture microplate wells. Wash with
warm Seahorse-ADF medium once (~ 200 µL/well). Add 50 µl of SeahorseADF (or 1X GF-Seahorse-ADF medium) to each well, then gradually add 50
µL of each sample to the well in a circular motion to evenly distribute the
samples in the well. (The pre-addition of 50 µL medium acts as a
coating/diluting buffer to help the samples disperse more evenly. The even
distribution of cells in the well will provide a more accurate measurement).
7.
Immediately incubate the samples at 37°C in the Seahorse XF Plate Prep
Station or a non-CO2 incubator for 30 min.
8.
Start the program by first calibrating the cartridge plate during the 30 min
incubation. Transfer the cartridge plate from the Seahorse XF Plate Prep
Station or non-CO2 incubator, and place inside the Analyzer for calibration.
Calibration takes ~ 30 min.
15
9.
Meanwhile, keep the Seahorse-ADF (or 1X GF-Seahorse-ADF) medium at
37°C in a water bath to maintain the same temperature as the incubated
samples.
10.
After 30 min, take the samples out of incubator. Add an additional 400 µL
37°C medium to each well by gently adding from the top corner of the well, to
avoid agitating the cells which are loosely attached to the wells.
11.
Return the plate to the Seahorse XF Plate Prep Station or 37°C non-CO2
incubator for ~ 10 min to equilibrate the cells/medium. Then transfer the cell
plate into the XF24 Analyzer and continue the program.
At the end of the assay, if you want to save the cell culture microplate for
normalization, perform the following steps:
1.
Remove the sample microplate from the XF24 soon after the assay is
finished.
2.
Gently remove the medium by inverting and tapping the microplate onto a
paper towel.
3.
Apply the cover to the microplate. Tape all 4 sides to ensure the lid is
attached to the plate for cell normalization.
4.
Store at -80°C.
5.
Within 1 month, follow the protocol for CyQuant Cell Proliferation Assay Kit
(LifeTechnologies, #C7026) to measure the cell density for normalization.
Seahorse XF24 Extracellular Flux Analyzer programs for crypts/organoids and single
cells are listed below:
Program protocol for crypts/organoids:
Calibrate
Equilibrate
16
Loop start:
3X
Mix:
3 min
Wait:
2 min
Measure:
3 min
Loop end
Inject:
Loop start:
port A (Oligomycin)
3X
Mix:
3 min
Wait:
2 min
Measure:
3 min
Loop end
Inject:
Loop start:
port B (FCCP)
3X
Mix:
3 min
Wait:
2 min
Measure:
3 min
Loop end
Inject:
Loop start:
port C (Rotenone)
3X
Mix:
3 min
Wait:
2 min
Measure:
3 min
Loop end
End
Program protocol for isolated cells:
Calibrate
Equilibrate
Loop start:
3X
Mix:
2 min
Wait:
2 min
Measure:
5 min
Loop end
Inject:
port A (Oligomycin)
17
Loop start:
3X
Mix:
2 min
Wait:
2 min
Measure:
5 min
Loop end
Inject:
Loop start:
port B (FCCP)
3X
Mix:
2 min
Wait:
2 min
Measure:
5 min
Loop end
Inject:
port C (Rotenone)
Loop start:
3X
Measure:
2 min
Wait:
2 min
Measure:
5 min
Loop end
End
18
Results
Assessment of colonocyte viability and optimization of extracellular flux analysis.
A representative Seahorse XF24 bioenergetic profile is shown in Figure 1.
Representative microscopy images of mouse colonic crypts before and after Seahorse
Extracellular Flux Analyzer measurement are shown in Figure 3. Although single cells
gradually dislodged from the intact crypts as the assay time increased, (Figures 3A, 3B,
3C), the OCR was fairly stable over time (Figure 3D). This indicates that despite the
morphology change, basal energy metabolism was quite stable, indicating acceptable
cell viability. In addition, parallel samples were cultured in a non-CO2 incubator in order
to mimic the analyzer conditions and cell viability was measured using the Live/Dead
Cell Viability Assay (LifeTechnologies, #L3224). Typically, the viability was 90% at the
end of the bioassay (~ 3.5 h from the initial seeding of crypts). Similar results were
observed in the organoid cultures, where comparatively fewer single cells dislodged from
the organoids (Figure 3G). This may be due to the fact that organoids had already been
cultured for several days, and were therefore more resistant to the additional
manipulation associated with the Seahorse analyzer. Despite these modest phenotypic
differences, both crypts and organoids exhibited a stable basal OCR, indicating that the
isolation and culturing protocols did not negatively impact cellular basal energy
metabolism. Similarly, both cell morphology and real time bioenergetic profiles of sorted
single cells indicated a high level of viability (Figure 3K). In subsequent experiments,
bioenergetic profiles were generated following treatment with mitochondrial inhibitors
(oligomycin -
ATP sythetase inhibitor; FCCP – uncoupler; rotenone – Complex I
inhibitor) in the 3 distinct colonic isolates, i.e., crypts, organoids, and sorted stem cells
(Figures 3I-3N). The comparable profiles suggest our method is suitable for measuring
energy metabolism, e.g., OCR and ECAR, in the various colonocyte samples.
19
TCDD treatment alters colonocyte bioenergetic profiles.
To determine the in vivo effects of TCDD on the intestinal tract, C57BL6 mice
were gavaged with TCDD (25 µg/kg body weight) or control (corn oil) for 4 consecutive
days. Colonic crypts were then isolated and the BEP was measured (Table 1). For
comparative purposes, an ex vivo TCDD study was conducted, in which mouse crypts
were plated, grown for 5 days to establish a mature organoid culture in vitro and
subsequently incubated with TCDD (1 nM) or control (DMSO-vehicle) for an 3 additional
days. Subsequently, organoids were harvested and the BEP was measured (Table 2).
Despite the different regimens, i.e., in vivo and in vitro treatment, TCDD had a similar
effect on the various mitochondrial parameters, including basal OCR/ECAR ratio, ATP
turnover, proton leak, and ROS. These findings demonstrate the organoid model can
recapitulate the in vivo effects of TCDD.
Contrasting bioenergetic profiles of colonic adult stem cells as compared to
differentiated daughter cells.
Colonic intestinal stem cells and differentiated daughter cells from Lgr5-EGFPIRES-creERT2 mice were isolated and their respective bioenergetic profiles were
analyzed. As show in Table 3, stem cells and daughter cells had significantly (p < 0.05)
different basal OCR, proton leak, maximal respiration capacity, and OCR/ECAR ratio.
Importantly, the low OCR/ECAR ratio observed in stem cells indicates a decreased
oxidative phosphorylation phenotype, consistent with a Warburg metabolic profile, i.e.,
decreased mitochondrial metabolism and increased glycolytic flux. The comparatively
low basal OCR phenotype in Lgr5+ colonic stem cells vs daughter cells is consistent with
a recent report documenting energy metabolism in human pluripotent stem cells, which
20
exhibited a lower OCR relative to their differentiated cell counterparts (23). In addition,
the lower proton leak in stem cells suggests a reduced apoptotic activity since
mitochondrial proton leak is generally positively correlated with programmed cell death
(10). This phenotype is also consistent with reports that stem cells are resistant to
apoptosis (7).
TCDD treatment suppresses the stem cell metabolic phenotype.
Figure 4 shows the basal OCR/ECAR profile of colonic crypts (Figure 4A) and
organoids (Figure 4B) treated with TCDD. Both in vivo (crypts) and in vitro (organoids)
models show the same TCDD-induced bioenergetic profiles, i.e., a significantly (p <
0.05) enhanced OCR/ECAR, indicating that the dioxin treated cells shifted to an
enhanced oxidative phosphorylation, reduced glycolytic phenotype.
This type of
bioenergetic profile contrasts with the aerobic glycolysis “Warburg effect” exhibited by
cancer stem cells (Warburg 1956), and is therefore consistent with a suppression of
stemness (Figure 4C).
This finding was corroborated by flow cytometry studies
conducted in parallel, where TCDD treated cells exhibited a significant (48%) reduction
(p < 0.05, n=4) in the number of GFP+ stem cells as compared to control (data not
shown). This is consistent with the effect of TCDD on skin stem cell turnover (18).
Collectively, these findings validate the utility of our methodology, which affords
investigators the ability to measure energy metabolism in colonic crypts, organoids and
sorted stem cells.
Discussion
Cells constantly adjust their metabolic state in response to extracellular signals
and nutrient availability in order to meet their demand for energy and metabolic building
blocks. With the recent focus on cancer stem cell research, metabolic reprogramming is
21
now considered a hallmark of tumorigenesis (11). Therefore, it is noteworthy that our
Matrigel-based extracellular flux analysis methodology allows for the real time monitoring
of intestinal bioenergetic profiles using 3 dimensional colonic crypt and organoid
cultures.
This novel application of organoid cultures containing epithelial and
mesenchymal elements for the purpose of metabolic modeling holds great promise
because it combines the accurate multi-lineage differentiation and physiology of in vivo
systems with the facile in vitro manipulation of organoids and sorted stem cells (14).
Recently, Bas and Augenlicht (6) have reported on the utilization of the Seahorse
Extracellular Flux analyzer using small intestine organoids.
However, their crypt
isolation protocol is labor intensive, and all manipulations were carried out only using an
in vitro culture system. In comparison, our crypt isolation protocol is more time efficient,
i.e., less than 1 h to isolate and process multiple samples.
Hence, the modified
methodology allows for a broader range of applications in the field of colon cancer
metabolomics. For example, researchers can perform various in vivo manipulations,
including but not limited to, diet, probiotics, environmental agents, toxins, and/or exercise
regimens. Animals can be terminated and the in vivo effect of such manipulations on
colonic crypt energy metabolism determined. These experiments can be complemented
by in vitro treatments utilizing colonic organoid cultures. At the end of the treatment
period, one simply harvests organoids for bioenergetic profile measurement.
Stem cells in adult tissues produce large numbers of differentiated progeny.
Since transformation of adult colonic stem cells is an extremely important route towards
initiating colon cancer (16), targeting stem cell energy metabolism may be a very
effective therapeutic approach for cancer treatment.
The Lgr5-EGFP-IRES-creERT2
knock-in mouse model allows researchers to distinguish stem cell (GFP-high) vs
daughter cell (GFP-low) populations based on GFP intensity.
Combination of this
22
transgenic mouse model with cell sorting and Matrigel-based Extracellular Flux
methodology allows for the monitoring of adult stem cell energy metabolism in real time.
This is a great advantage in view of the central role of stem cell metabolism in
tumorigenesis. However, several factors complicate the efficiency of this “combined”
methodology. For example, primary colonocytes are extremely fragile, and viability of
cells gradually drops during the cell sorting procedure. Therefore, the addition of growth
factors during cell isolation and cell sorting are critical in maintaining a robust OCR. In
addition, the yield of GFP-high stem cells is quite variable, ranging from approximately
20,000 to 80,000 stem cells per mouse colon, and is affected by diet, age, and other
isolation factors. A minor drawback of this methodology is that only a limited number of
samples can be tested in the XF24 system at one time.
However, with the recent
development of the Seahorse XF96 analyzer, researchers can adjust the seeding
density and test far more samples in one assay.
In summary, we propose that our innovative methodology will facilitate future in
vivo / ex vivo metabolic studies using environmental agents affecting colonic crypt/stem
cell energy metabolism.
23
ACKNOWLEDGMENTS
This work was supported in part by the American Institute for Cancer Research and
NIH grants CA129444, CA168312 and P30ES023512.
DISCLOSURES
No conflicts of interest, financial or otherwise, are declared by the authors.
AUTHOR CONTRIBUTIONS
Y.Y.F., L.A.D., S.S. and R.S.C. for conception and design of research; Y.Y.F., L.A.D.
and E.S.C. performed experiments; Y.Y.F., G.A.S. and L.A.D. analyzed data; Y.Y.F.,
L.A.D., S.S. and R.S.C. interpreted results of experiments; Y.Y.F., L.A.D. and G.A.S.
prepared figures; Y.Y.F. and L.A.D. drafted manuscript; Y.Y.F., L.A.D., S.S. and R.S.C.
edited and revised manuscript; Y.Y.F., L.A.D., E.S.C., G.A.S., S.S. and R.S.C. approved
final version of manuscript.
24
References
1.
Barker N, Bartfeld S, Clevers H. Tissue-resident adult stem cell populations of
rapidly self-renewing organs. Cell Stem Cell 7: 656–70, 2010.
2.
Barker N, van Es JH, Kuipers J, Kujala P, van den Born M, Cozijnsen M,
Haegebarth A, Korving J, Begthel H, Peters PJ, Clevers H. Identification of
stem cells in small intestine and colon by marker gene Lgr5. Nature 449: 1003–7,
2007.
3.
Barker N, Huch M, Kujala P, van de Wetering M, Snippert HJ, van Es JH,
Sato T, Stange DE, Begthel H, van den Born M, Danenberg E, van den Brink
S, Korving J, Abo A, Peters PJ, Wright N, Poulsom R, Clevers H. Lgr5(+ve)
stem cells drive self-renewal in the stomach and build long-lived gastric units in
vitro. Cell Stem Cell 6: 25–36, 2010.
4.
Barker N, Ridgway R A, van Es JH, van de Wetering M, Begthel H, van den
Born M, Danenberg E, Clarke AR, Sansom OJ, Clevers H. Crypt stem cells as
the cells-of-origin of intestinal cancer. Nature 457: 608–11, 2009.
5.
Barker N. Adult intestinal stem cells: critical drivers of epithelial homeostasis and
regeneration. Nat Rev Mol Cell Biol 15: 19–33, 2014.
6.
Bas T, Augenlicht LH. Real time analysis of metabolic profile in ex vivo mouse
intestinal crypt organoid cultures. J Vis Exp : e52026, 2014.
7.
Catalano V, Gaggianesi M, Spina V, Iovino F, Dieli F, Stassi G, Todaro M.
Colorectal cancer stem cells and cell death. Cancers (Basel) 3: 1929–46, 2011.
8.
Davidson L A, Goldsby JS, Callaway ES, Shah MS, Barker N, Chapkin RS.
Alteration of colonic stem cell gene signatures during the regenerative response
to injury. Biochim Biophys Acta 1822: 1600–7, 2012.
9.
Fan Y-Y, Davidson L A, Callaway ES, Goldsby JS, Chapkin RS. Differential
effects of 2- and 3-series E-prostaglandins on in vitro expansion of Lgr5+ colonic
stem cells. Carcinogenesis 35: 606–12, 2014.
10.
Fan Y-Y, Ran Q, Toyokuni S, Okazaki Y, Callaway ES, Lupton JR, Chapkin
RS. Dietary fish oil promotes colonic apoptosis and mitochondrial proton leak in
oxidatively stressed mice. Cancer Prev Res (Phila) 4: 1267–74, 2011.
11.
Galluzzi L, Kepp O, Vander Heiden MG, Kroemer G. Metabolic targets for
cancer therapy. Nat Rev Drug Discov 12: 829–46, 2013.
12.
Gogvadze V, Orrenius S, Zhivotovsky B. Mitochondria as targets for cancer
chemotherapy. Semin Cancer Biol 19: 57–66, 2009.
25
13.
Harrill J a, Parks BB, Wauthier E, Rowlands JC, Reid LM, Thomas RS.
Lineage-Dependent Effects of Aryl Hydrocarbon Receptor Agonists Contribute to
Liver Tumorigenesis. Hepatology 61: 548–560, 2014.
14.
Li X, Nadauld L, Ootani A, Corney DC, Pai RK, Gevaert O, Cantrell M a, Rack
PG, Neal JT, Chan CW-M, Yeung T, Gong X, Yuan J, Wilhelmy J, Robine S,
Attardi LD, Plevritis SK, Hung KE, Chen C-Z, Ji HP, Kuo CJ. Oncogenic
transformation of diverse gastrointestinal tissues in primary organoid culture. Nat
Med 20: 769–77, 2014.
15.
Li Y, Wang K, Jiang Y-Z, Chang X-W, Dai C-F, Zheng J. 2,3,7,8Tetrachlorodibenzo-p-dioxin (TCDD) inhibits human ovarian cancer cell
proliferation. Cell Oncol (Dordr) 37: 429–37, 2014.
16.
Lin SA, Barker N. Gastrointestinal stem cells in self-renewal and cancer. J
Gastroenterol 46: 1039–55, 2011.
17.
Lindén J, Lensu S, Tuomisto J, Pohjanvirta R. Dioxins, the aryl hydrocarbon
receptor and the central regulation of energy balance. Front Neuroendocrinol 31:
452–78, 2010.
18.
Mandavia C. TCDD-induced activation of aryl hydrocarbon receptor regulates the
skin stem cell population. Med. Hypotheses ( January 10, 2015). doi:
10.1016/j.mehy.2014.12.023.
19.
Morin A, Letouzé E, Gimenez-Roqueplo A-P, Favier J. Oncometabolites-driven
tumorigenesis: From genetics to targeted therapy. Int J Cancer 135: 2237–48,
2014.
20.
Rossignol R. Energy metabolism disorders in rare and common diseases.
Toward bioenergetic modulation therapy and the training of a new generation of
European scientists. Int J Biochem Cell Biol 2014: 1–8, 2015.
21.
Safe S, Lee S-O, Jin U-H. Role of the aryl hydrocarbon receptor in
carcinogenesis and potential as a drug target. Toxicol Sci 135: 1–16, 2013.
22.
Sato T, Vries RG, Snippert HJ, van de Wetering M, Barker N, Stange DE, van
Es JH, Abo A, Kujala P, Peters PJ, Clevers H. Single Lgr5 stem cells build
crypt-villus structures in vitro without a mesenchymal niche. Nature 459: 262–5,
2009.
23.
Varum S, Rodrigues AS, Moura MB, Momcilovic O, Easley C a, RamalhoSantos J, Van Houten B, Schatten G. Energy metabolism in human pluripotent
stem cells and their differentiated counterparts. PLoS One 6: e20914, 2011.
24.
Warburg O. Injuring of Respiration the Origin of Cancer Cells. Science 123: 309–
14, 1956.
26
25.
Wu M, Neilson A, Swift AL, Moran R, Tamagnine J, Parslow D, Armistead S,
Lemire K, Orrell J, Teich J, Chomicz S, Ferrick D a. Multiparameter metabolic
analysis reveals a close link between attenuated mitochondrial bioenergetic
function and enhanced glycolysis dependency in human tumor cells. Am J Physiol
Cell Physiol 292: C125–C136, 2007.
26.
Xie G, Peng Z, Raufman J-P. Src-mediated aryl hydrocarbon and epidermal
growth factor receptor cross talk stimulates colon cancer cell proliferation. Am J
Physiol Gastrointest Liver Physiol 302: G1006–15, 2012.
27
Figure Captions
Figure 1. Representative mitochondrial function parameters generated using the
Seahorse XF24 Analyzer. Mouse colonic samples (crypts, organoids, or cells) were
sequentially challenged with an ATP synthetase inhibitor (Oligomycin), respiratory chain
uncoupler (FCCP), and complex I inhibitor (Rotenone). The profile was recorded as
oxygen consumption rate (OCR) throughout the analysis. Based on the different OCR
responses to specific electronic transfer chain inhibitors, basal respiration capacity, ATP
turn over, proton leak, maximum respiratory capacity, and ROS were calculated as
indicated.
Figure 2. Gating parameters for fluorescence activated cell sorting. Gates are set
to (A) exclude cellular debris, (B) exclude propidium iodide positive cells, (C) exclude cell
doublets, (D) exclude non-epithelial cells. (E) Gates are set to collect GFP high (stem
cells) and GFP low expressing cells (daughter cells). (F) Colons from wild type mice
display no GFP expressing cells.
Figure 3.
Cell viability and bioenergetic profiles of colonic crypts, primary
organoid cultures and isolated stem cells. (A), Representative images of freshly
isolated crypts at time 0 (before plating); (B), 30 min after seeding in diluted Matrigel precoated cell culture microplates; and (C) 3.5 h after completion of the assay.
(D),
Representative basal OCR of crypts throughout the entire extracellular flux analysis.
Representative images of 5 d old organoids used for basal energy metabolism
measurements at time 0 (E), 30 min (F) and 3.5 h (G). (H), Representative basal OCR
of organoids throughout the entire extracellular flux analysis.
Representative
bioenergetic profiles (OCR, I-K; ECAR, L-N) of colonic crypts, organoids, and adult stem
28
cells under basal conditions and following treatment with mitochondrial inhibitors
(oligomycin, FCCP, rotenone).
Figure 4. Comparative profiles of basal OCR/ECAR ratios from mouse colonic
crypts, cultured organoids and sorted stem cells. Basal oxidative phosphorylation
and glycolysis phenotypic profiles are shown.
(A) intact colonic crypts assayed
immediately following isolation, (B) cultured colonic crypt organoids following TCDD
treatment and (C) sorted adult stem cells and daughter cells from colonic crypts assayed
immediately following isolation.
Data represent means ± SE from n=4-12 samples.
*Significantly different, p < 0.05.
29
Table 1. Bioenergetic profiles of mouse colonic crypts following TCDD exposure.
C57BL/6 mice were gavaged with TCDD at 25 µg/kg body weight or vehicle control (corn
oil) daily for 4 consecutive days.
Colonic crypts were subsequently isolated and
bioenergetic profiles measured using the Seahorse bioanalyzer as described in the
Methods section.
Control
TCDD
P-value
Basal OCR (pmol/min)
132.0±23.2
198.9±19.8
0.043
Basal ECAR (mpH/min)
8.0±0.8
7.6±1.0
0.779
19.7±2.5
27.8±2.5
0.035
52.5±9.9
97.2±15.0
0.027
Proton Leak
112.0±14.5
73.7±10.0
0.038
Maximal Respiration Capacity
172.8±25.4
204.1±33.3
0.460
Reserved Respiration Capacity
31.7±9.1
78.1±24.2
0.113
ROS
16.8±2.9
29.6±3.2
0.008
OCR/ECAR
--- Respiration (pmol O2/min) utilized for
ATP Turnover
Mean ± SE (n=8-12)
30
Table 2. Effect of TCDD on mouse colonic organoid mitochondrial bioenergetic
profiles. Mouse colonic crypts isolated from chow fed C57BL6 mice were cultured to
mature organoids for 5 days. Colonic organoid cultures were then incubated with TCDD
(1 nM) or control (DMSO-vehicle) for an additional 3 days. Organoids were harvested
and bioenergetic profiles measured.
Control
TCDD
P-value
Basal OCR (pmol/min)
314.8±89.1
201.2±58.0
0.163
Basal ECAR (mpH/min)
14.8±5.9
4.6±1.5
0.088
5.6±3.7
20.1±6.2
0.037
ATP Turnover
43.0±5.9
67.1±5.8
0.012
Proton Leak
57.0±5.9
38.4±7.1
0.039
Maximal Respiration Capacity
172.4±7.5
137.1±27.8
0.107
Reserved Respiration Capacity
72.4±7.5
23.3±16.6
0.008
ROS
42.9±5.5
63.8±13.9
0.086
OCR/ECAR
--- % Basal OCR utilized for
Mean ± SE (n=4-6)
31
Table 3.
Comparison of mitochondrial bioenergetic profiles in adult mouse
colonic stem cells and daughter cells. Colonic epithelial cells were isolated from
Lgr5-EGFP-IRES-creERT2 transgenic mice. GFP-positive cells were sorted to separate
the GFP-high (stem cells) and GFP-low (daughter cells) populations.
Bioenergetic
profiles of these 2 populations are described below.
Stem cells
Daughter cells
P-value
Basal OCR (pmol/min)
164.5±15.7
248.5±20.9
0.004
Basal ECAR (mpH/min)
5.8±1.1
6.2±0.8
0.754
33.9±5.0
59.6±12.2
0.042
23.6±8.9
16.7±3.9
0.418
9.2±1.6
23.2±2.7
0.003
Maximal Respiration Capacity
18.8±3.1
59.3±6.6
0.001
Reserved Respiration Capacity
10.8±6.4
23.8±6.4
0.171
ROS
16.2±5.4
7.9±5.0
0.280
OCR/ECAR
--- Respiration (pmol O2/min) utilized for
ATP Turnover
Proton Leak
Mean ± SE (n=8-9)
32
Figure 1
B
C
OCR (pMoles/min)
A
Time (min)
A. Oligomycin: inhibitor of ATP synthetase - shuts down oxidative phosphorylation
B. FCCP: uncoupler – dissipates the membrane potential, provide unlimited protons for ATP synthesis
C. Rotenone: inhibitor of Complex I – blocks electron transport system
#1: Basal Respiration Capacity
#2: ATP turnover
#3: Proton leak
#4: Maximal Respiratory Capacity
#5: ROS (non-mitochondria related)
#4 - #1: Reserved Respiratory Capacity
Figure 2
Figure 3
Crypts
A
Organoids
B
E
D
G
F
50 µm
50 µm
H
OCR (pMoles/min)
OCR (pMoles/min)
C
Time (min)
Time (min)
Representative bioenergetic profiles
Treated
Time (min)
Basal
Treated
ECAR (mpH/min)
ECAR (mpH/min)
Time (min)
Treated
Basal
Time (min)
ECAR (mpH/min)
N
M
Treated
Basal
Basal
Treated
Time (min)
Time (min)
L
Stem cells
OCR (pMoles/min)
Basal
K
Organoids
OCR (pMoles/min)
J
Crypts
OCR (pMoles/min)
I
Treated
Basal
Time (min)
Figure 4


© Copyright 2026