
The Business Case for Racial Equity in Michigan
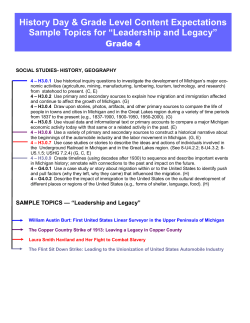
THE BUSINESS CASE FOR
RACIAL
EQUITY
IN MICHIGAN
MAY 2015
Prepared by Altarum Institute and funded by the
W.K. Kellogg Foundation
By Ani Turner, Altarum Institute
—1—
May 2015
Prepared by Altarum Institute and funded by the W.K. Kellogg Foundation
By Ani Turner, Altarum Institute
THE BUSINESS CASE FOR
RACIAL
EQUITY
IN MICHIGAN
“States are equitable when all residents—regardless of their race/ethnicity,
nativity, neighborhood of residence, or other characteristics—are fully
able to participate in the community’s economic vitality, contribute to its
readiness for the future, and connect to its assets and resources.”
PolicyLink
What will drive prosperity in Michigan in the 21st
century? Our population is not growing, but it is
aging. One in seven Michiganders is age 65 or older;
in 10 years, one in five will be 65 or older.1 Almost
half the manufacturing jobs of the 1990s have
disappeared, and the jobs of the future will require a
higher level of skills and education.
Yet Michigan has assets that could position it
well for the “next economy,” including strong
manufacturing, proximity to Canada, and an exportoriented economy.2
Leveraging these strengths will require a highquality workforce. By 2040, Michigan’s working age
population will be smaller by nearly half a million
people and and its composition will shift from about
one-quarter to one-third being residents of color.
Currently, 24% of Michigan’s 9.9 million people are
of color: 76.1% of the population is white, 14.3%
is black, 4.7% is Hispanic, 2.7% is Asian, 0.7% is
American Indian, and 2.2% is of multiple races.3 By
2040, Michigan’s population will be 31% people of
color, and nearly 40% will be children of color.4
Unfortunately, the average child of color in
Michigan is born into a path of poorer health,
lower educational attainment, fewer employment
opportunities, and greater involvement with the
criminal justice system than the average white child.
Given the demographic trends already underway,
reducing racial inequities will not only improve life
outcomes for those most affected, it will increasingly
determine the state’s overall economic performance.
Why is it important to focus strategies on racial
equity and not simply poverty or socioeconomic
status? Race and ethnicity have played a significant
role in the development of today’s inequities.
Minorities face circumstances shaped by a history of
discriminatory laws and practices that denied people
equal opportunities, including limitations on voting
and owning property and discriminatory lending,
hiring, and sentencing practices. While significant
reductions in legal discrimination have occurred
over the past 50 years, the effects of these practices
remain, as do the more subtle forms of structural
racism embedded in our institutions and the effects
of the implicit biases we hold about people of
different races and cultures.
—1—
May 2015
Prepared by Altarum Institute and funded by the W.K. Kellogg Foundation
By Ani Turner, Altarum Institute
WHY IS RACIAL EQUITY IMPORTANT TO MICHIGAN BUSINESSES?
“With greater racial equity, disparities in health, educational achievement,
incarceration rates, and employment opportunities diminish, improving life
outcomes and building a healthier, more productive workforce whose skills
better align with future needs.”
With greater racial equity, disparities in health,
educational achievement, incarceration rates, and
employment opportunities diminish, improving life
outcomes and building a healthier, more productive
workforce whose skills better align with future
needs.
Healthier workers cost less in health care, life and
disability insurance, and workers’ compensation
benefits, allowing businesses to improve profitability
or, in the long run, to better compete for workers by
passing along these savings in higher wages.
A more diverse workforce in itself will contribute to
greater success in an increasingly global economy.
Research has shown that businesses with more
diverse workforces have more customers, higher
revenues and profits, greater market share, less
absenteeism and turnover, and a higher level of
commitment to their organization.5
A more productive workforce will merit higher wages,
increasing the population’s purchasing power for
goods and services. Higher earnings improve the
state’s fiscal outlook by increasing tax revenues and
reducing public spending on welfare and corrections,
enabling investments in other priorities or reductions
in taxes.
Wealth accumulation for households of color will
improve community stability and intergenerational
mobility. It will also provide capital for
entrepreneurship, enriching our communities with
new products and services that create jobs and spur
economic activity.
All these positive outcomes will help Michigan
attract more people and greater private investment,
further improving the state’s growth outlook.
—2—
May 2015
Prepared by Altarum Institute and funded by the W.K. Kellogg Foundation
By Ani Turner, Altarum Institute
20 FACTS ABOUT RACIAL AND ETHNIC INEQUITIES IN MICHIGAN
1. The Race for Results Index assembles 12
measures of success for children and creates
a single composite score between 0 and 1,000
for each racial or ethnic group in each state;
the higher the score, the greater the likelihood
of success.6 The individual measures include
birthweight, preschool participation, proficiency
scores, graduation rates, and poverty levels. The
score for white children in Michigan is 688, for
Latino children it is 411, and for American Indian
children it is 501 (see chart). The most serious
obstacles are faced by African-American children
with a score of 244 out of 1,000. Only two
states, Mississippi and Wisconsin, have lower
African-American scores.
6. In the Detroit metropolitan area, 90% of blacks,
56% of Hispanics, 43% of American Indians,
and 29% of Asians live in opportunity-poor
neighborhoods, compared to 19% of whites.13
The Detroit area ranks as one of the worst in
the nation for intergenerational mobility: Only
about 5% of children born into the lower fifth of
the income distribution can expect to reach the
upper fifth.14
7. Michigan health inequities begin early in life.
African-American babies are twice as likely as
white babies to be born at a low birthweight
and three times more likely than white babies
to die in the first year of life.15 Babies of color
are more likely to be born following pregnancies
with inadequate prenatal care.
2. Based on low family income and level of
education, more than 70% of children of color
(114,000) aged 0–3 years in Michigan are
estimated to be “at risk” of poor outcomes,
compared to 48% of white children. Specificlaly,
two-thirds of Hispanic children (17,000) and
nearly 80% of black children (64,000) are at
risk.7
8. Fifteen percent of whites in Michigan report their
health to be fair or poor, compared to 26% of
blacks, 24% of American Indians, 18% of Arab
Americans, and 28% of Hispanics.16
9. The percentages of Michiganders diagnosed with
diabetes are 8% for whites, 13% for blacks, 15%
for American Indians, and 18% for Hispanics.
For cardiovascular disease, the rates are 8%
for whites, 11% for blacks, 14% for American
Indians, and 10% for Hispanics.17
3. In Michigan, 37% of white children in grade 4
are proficient in reading, compared to 12% of
black and 21% of Hispanic students.8 In grade
4 math, 45% of white children, 10% of black
children, and 22% of Hispanic children are
proficient. Similar disparities exist in grade 8.
In 2011–2012, 4-year high school graduation
rates were 76% overall, 82% for whites, 60% for
blacks, 64% for Hispanics, and 87% for Asians.9
10. In 2014, when the Michigan unemployment rate
was 7.2%, the white rate was 5.8%, the Hispanic
rate was 8.8%, and the black rate was 15.9%—
more than double the total rate and more than
two and a half times the white rate.18
4. By 2020, 70% of jobs in Michigan will require
some type of postsecondary education.10 Only
61% of whites, 54% of African Americans, and
44% of Latinos meet this requirement.11 Similarly,
one-third of jobs in Michigan will require a
bachelor’s degree or above by 2020, but only
26% of whites and 16% of African Americans and
Latinos in Michigan have this level of education.
RACE FOR RESULTS INDEX SCORES FOR MICHIGAN CHILDREN
787
Asian
American
776
668
White
5. Legacy effects of racist laws and practices
have segregated communities of color into
lower-quality residential neighborhoods,
affecting health, wealth accumulation, quality of
education, and employment opportunities. Of
the 100 largest metropolitan areas in the United
States, Detroit is the most segregated between
whites and blacks, and Grand Rapids is in the
top third.12
704
501
American
Indian
387
411
Hispanic/
Latino
404
Michigan
244
Black/African
American
US
345
0
200
400
600
800
1000
—3—
May 2015
Prepared by Altarum Institute and funded by the W.K. Kellogg Foundation
By Ani Turner, Altarum Institute
11. Michigan spends a greater share of the state
general budget on corrections than any other
state in the nation, spening $2.3 billion in
2014, or 4.4% of total state spending (the U.S.
average is 3.2%) and 21% of general revenue
fund dollars.19
17. In Michigan, one-third of African Americans,
one-quarter of American Indians, 30% of ArabAmericans, and 28% of Latinos live below
the federal poverty level, compared to 12%
of whites.24 For families with children, the
discrepancies are even greater, with 45% of
African-American children, a third of Latino and
American Indian children, and 15% of white
children living in poverty.
12. People of color are more likely to be
incarcerated and to be victims of crime. In
Michigan, Hispanics are nearly twice as likely to
be incarcerated as whites, American Indians are
two and a half times as likely, and blacks are
nearly six times as likely.20
18. Differences in earnings summarize the economic
impact of racial and ethnic inequities, because
earnings potential is affected by many areas
where there are disparities, including health,
education, and employment opportunities.
Age- and sex-adjusted earnings per person for
people of color in Michigan are currently 33%
below earnings for whites (see chart), slightly
larger than the national gap of 30%.25 The gap
is particularly large for men of color in Michigan,
whose earnings across all ages are 40% less
than white men. Women of color’s earnings in
Michigan are closer, at 18% lower than white
earnings across all ages. This gap includes the
effects of higher rates of incarceration, higher
unemployment, and lower wages.
13. The toll of violence on youth of color is
extraordinarily high. The top two most violent
cities in the United States in 2010 were Flint and
Detroit. The cost of violent injuries in Michigan
in 2010 was estimated at more than $250
million.21
14. Beyond the economic toll, there is a tragic
human cost from violent crime in Michigan.
Homicide accounts for 2 deaths per 100,000
whites, 5.5 deaths per 100,000 Hispanics, 6.8
deaths per 100,000 American Indians, and 31
deaths per 100,000 African Americans. The death
rate for black teens is more than twice that of
white teens due to a black homicide rate 25
times higher than that of whites.22
15. The combination of high rates of incarceration
and increased mortality due to violence and
disease has created a major gap in the numbers
of black men and women. Black girls begin
to outnumber black boys in adolescence.
Nationally, an estimated 1.5 million black men
ages 25–54 are “missing” relative to the number
of black women.23 The imbalance in numbers of
black men and women contributes to lower rates
of marriage, higher rates of childbirth outside
marriage, and more women-led households.24
Detroit is among the top 10 cities in the nation
for the most “missing” black men, at 21,000.
Two Michigan cities are in the top 10 in the
nation for the lowest share of men in the black
population: Farmington Hills at 39% and Oak
Park at 39.3%.
19. Seventy-eight percent of white families in
Michigan own homes, while only 49% of
households of color own homes.26
20.Homeownership is the primary means of
wealth accumulation for middle-class families.
The difference in the median net worth of
households in Michigan is dramatic: White
households have an average net worth of
$106,000, while households of color have an
average net worth of $6,800.27 This ratio, where
white households in Michigan have nearly 16
times the wealth of households of color, exceeds
the national ratio of 10.
Average Annual Earnings Per Capita By Age
For Males in Michigan
$70,000
$60,000
16. As of 2011, 20% of Hispanics, 17% of African
$50,000
Americans, and 14% of Asians in Michigan
did not have health insurance, compared with
10% of whites. The Patient Protection and
Affordable Care Act (ACA) reduces access barriers
by expanding the state Medicaid program
and offering subsidies for insurance exchange
policies. However, legal, regulatory, and
budgetary challenges remain for continuation of
the ACA coverage expansions in Michigan.
$40,000
$30,000
$20,000
$10,000
$0
18
23
28
33
38
43
48
53
58
63
68
73
78
Age
Non-Hispanic Whites
Persons of Color
—4—
May 2015
Prepared by Altarum Institute and funded by the W.K. Kellogg Foundation
By Ani Turner, Altarum Institute
ESTIMATES OF THE ECONOMIC BENEFITS OF GREATER RACIAL
EQUITY IN MICHIGAN:
“If the 70% of children of color (114,000) aged 0–3 years in Michigan who
are estimated to be “at risk” achieved school readiness, the present value
lifetime savings would be $4.5 billion.”
1. Wilder Research estimates that the lifetime
economic value of an at-risk child in Michigan
achieving school readiness is $39,000,
including savings in special education and
grade repetition; lower criminal justice, public
assistance, and child welfare costs; higher
state tax revenues; savings from reduced crime
and substance abuse; and increases in parent
productivity.28 If the more than 70% of children
of color (114,000) aged 0–3 years in Michigan
who are estimated to be “at risk”29 achieved
school readiness, the present value lifetime
savings would be $4.5 billion.
or $16.2 billion in 2012.33 If the earnings gaps
were eliminated through greater productivity,
the increased earnings would raise the state’s
economic output by a comparable percentage,
for an increase of $31.2 billion in state GDP.
7. Altarum estimates that higher earnings would
have generated an additional $1.9 billion in
state tax revenues and $900 million in local tax
revenues in 2012.
8. Closing the earnings gap and thereby closing
the gap in participation in Medicaid and public
assistance programs would represent a 25%
reduction in spending on these programs, or
$3.1 billion in 2012. The increase in revenues
and decrease in outlays together would improve
state and local finances by nearly $6 billion,
more than 10% of the roughly $50 billion state
budget. For comparison, we currently spend
about $3 billion a year on public safety and
$15 billion on all education funding. Six billion
dollars represents almost one-quarter of what
is collected each year in state taxes (about $24
billion).
2. The Alliance for Excellent Education estimates
that if Michigan’s 2012 high school graduation
rate for children of color had been 90%,
annual earnings would be $151 million higher,
increasing spending by $116 million, federal tax
revenues by $24 million, and state and local
taxes by $11 million per year.30
3. The Alliance also estimates that increasing the
male high school graduation rate in Michigan by
only 5% would produce crime-related savings of
more than $175 million.31
4. LaVeist and Gaskin estimate that health
9. With state population growth coming exclusively
from communities of color, these impacts
will increase over time. By 2040, closing the
earnings gap would increase earnings by 10.1%,
or $65.3 billion, increasing Michigan’s gross
domestic product by $126 billion, and the
increase in Michigan tax revenues and decrease
in outlays would improve state and local
budgets by a net $11 billion.
disparities cost Michigan citizens, employers,
and governments $2.03 billion in excess medical
costs and $1.39 billion in lost productivity in
2009.32
5. LaVeist and Gaskin also estimate that health
disparities translate to premature deaths on
the order of 130,000 lost life years in Michigan,
including 122,000 lost life years for African
Americans alone. Monetizing a human life is
controversial, but using a conservative estimate
of $50,000 per life year, the economic impact
due to premature deaths in Michigan was $6.48
billion in 2009.
10. The projections presented here assume flat
population growth and the current investment
outlook. A more productive workforce, higher
earnings, higher tax revenues, and other
economic benefits will help Michigan attract
more people and investment, further increasing
the positive economic impacts.
6. Altarum estimates that if the average adult
of color achieved the average income of his
or her white counterparts at each age, total
Michigan earnings would increase by 7.5%,
The estimates of economic benefits presented here are approximations and do not include the offsetting
cost of investments required to close gaps, but they illustrate that even modest progress toward eliminating
racial and ethnic inequities in Michigan could produce significant economic benefits.
—5—
May 2015
Prepared by Altarum Institute and funded by the W.K. Kellogg Foundation
By Ani Turner, Altarum Institute
PROMISING POLICIES AND APPROACHES TO
IMPROVING RACIAL EQUITY
The racial and ethnic inequities witnessed today are longstanding and will not disappear without sustained
commitment, but there are effective approaches being implemented in Michigan that are already advancing
this goal.
1. The Perry Preschool Program, implemented in
Ypsilanti, Michigan, is one of the best-known
examples of an investment in early childhood
education that has demonstrated lasting payoffs.
A 2-year program targeting African-American
3- to 4-year-olds in public housing included
sessions at school and home visits by teachers.
Participants at age 27 showed a 44% higher
high school graduation rate and 50% fewer teen
pregnancies. At age 40, participants had 36%
higher median earnings, were 46% less likely
to have served time in jail or prison, were 32%
more likely to own their own home, and were
26% less likely to have received government
assistance.34
and racial and ethnic inequities. Flint has been
a particular success story in reducing infant
mortality in high-poverty areas and has been
held as a model for the statewide effort.
5. Home visiting programs such as nurse-family
partnership (NFP) have been demonstrated to
improve health and other outcomes through
very early intervention. NFP nurses visit the
homes of low-income, first-time mothers during
prenatal and early childhood periods. Both
parents and children have shown improvement
in health and in socioeconomic status. For the
mothers, the program was found to increase
workforce participation, decrease smoking rates
during pregnancies, and decrease the use of
public assistance. Injuries, substance abuse, and
crime were reduced for the children.36 Detroit’s
Authority Health is administering a nurse family
partnership program to support first-time
mothers and babies. A complementary initiative
through a public-private partnership including
major health systems in Detroit, the WomenInspired Neighborhood Network program,
supports second time mothers at risk for poor
pregnancy outcomes with community health
workers conducting the home visits.
2. Michigan has increased its commitment to
making quality preschool accessible to all. The
Great Start Readiness Program (GSRP) is a statefunded preschool program to prepare young
children of qualified families for the transition
to kindergarten. Funding for GSRP has increased
each year for the past several years, with a goal
of covering many more Michigan 4-year-olds. The
Michigan Department of Education shows the
number of low- and moderate-income children in
GSRP classrooms increased from about 23,000
in 2012–2013 to about 30,000 in 2013–2014 to
37,000 in 2014–2015. There was also a 30%
increase in full-time versus half-day slots during
this period. Expansion of the program to 3-yearolds may come next. Participants were less
likely to repeat grades and more likely to test
as proficient in math and language arts in high
school.35 Effects were especially pronounced
for children of color: 60% of who participated
in GSRP graduated from high school on time
versus 37% of a comparable non-GSRP group.
6. Hundreds of local initiatives throughout Michigan
target environmental factors critical to good
health, including urban gardening and local food
initiatives, lead paint testing and remediation,
monitoring and cleanup of air and water quality,
and development and maintenance of green
space and recreational facilities to promote
healthy living and childhood play.
7. Acknowledging our high corrections spending,
Michigan is one of several states that have
begun to focus on reducing incarceration.
The goal is for “tough on crime” to become
“smart on crime.” Michigan initiatives to reduce
incarceration include reducing mandatory
drug sentences, increasing parole grants and
reducing technical revocations, and enhancing
community corrections programming. State
leaders commissioned a study of the state’s
felony sentencing system.37 Michigan’s prison
population has declined from more than 50,000
prisoners a decade ago to about 44,000 today,
although it has recently plateaued.38
3. Many communities in Michigan supplement
federal or state programs such as GSRP, Head
Start, and Early Head Start with additional
targeted programs. The Battle Creek Early
Childhood Connections program provides
Welcome Baby Baskets, home visits, and
playgroups for families with children ages 0–5.
4. The Michigan Department of Community Health
is addressing the state’s higher-than-average
infant mortality rates and inequities in birth
outcomes through the Infant Mortality Reduction
Plan, a multidimensional, regionally focused
approach to reducing the overall mortality rate
—6—
May 2015
Prepared by Altarum Institute and funded by the W.K. Kellogg Foundation
By Ani Turner, Altarum Institute
8. In addition to reducing the numbers entering
prison, much can be done to increase the
likelihood of success for those leaving prison.
The Michigan Prisoner Reentry Initiative has
been an effective program of data-driven, locally
tailored planning of reentry of prisoners, with
the parole boards at the center of the process.
The program has helped to reduce the prison
population and prevent the return of parolees to
prison, although continued funding is uncertain.
10. Focus: HOPE’s Earn and Learn program targets
young men of color and formerly incarcerated
and chronically unemployed adults in the greater
Detroit area, helping them obtain work skills,
set and achieve education goals, and gain work
experience. Employers such as Grand Rapidsbased Cascade Engineering are at the forefront
of businesses confronting barriers to success
after prison by adopting an explicit policy of
considering all qualified job applicants on an
individual basis, regardless of past criminal
record.
9. The Pathways from Prison to Postsecondary
Education Project is a 5-year initiative
to increase educational attainment and
employment opportunities for the incarcerated
and formerly incarcerated. The program is
being piloted in Pontiac and Kalamazoo and
involves assessments, placements in college or
vocational courses, counseling and mentoring,
and partnerships with community-based
organizations such as Michigan Works!
11. The New Economy Initiative, a $130 million,
10-year collaboration of 10 local and national
foundations, is working to create a more
diverse economy in southeast Michigan by
providing technical assistance and capital
for entrepreneurs and small businesses, with
a focus on low-income neighborhoods and
communities of color.
“Racially-based obstacles to the success of today’s younger generation
threaten our economy and security. Tackling these obstacles is not only the
right thing to do; it can be a significant driver of our collective social and
economic well-being.”
MAKING SOUND CHOICES AND INVESTMENTS TODAY
Greater racial equity can be promoted by the choices
that we make each day as individuals and by the
policies that we support through our institutions
and our governments. Progress may also require
strategic investments of time and resources.
Advocates for strategies that promote racial equity
increasingly include business leaders acting in
communities or coming together in groups such
as America’s Edge and ReadyNation to support
policies for economic growth. These leaders join the
W.K. Kellogg Foundation and other organizations
investing in Michigan’s future in recognizing that
today’s younger generation must be well prepared
to become the workers, the consumers, the
taxpayers, and the leaders of tomorrow. Raciallybased obstacles to the success of this generation
threaten our economy and security. Tackling these
obstacles is not only the right thing to do; it can
be a significant driver of our collective social and
economic well-being.
ACKNOWLEDGMENTS
Original technical research in support of this brief
was conducted by Dr. Darrell Gaskin and Dr. Thomas
LaVeist of The Johns Hopkins University and Dr.
Charles Roehrig and Ms. Stacey Pomranky of Altarum
Institute. Consultants to the project were Dr. Dolores
Acevedo-Garcia of Brandeis University; Dr. Marvin H.
McKinney, senior consultant to the Family Research
Initiative at Michigan State University; and Dr. David
R. Williams of Harvard University.
—7—
May 2015
Prepared by Altarum Institute and funded by the W.K. Kellogg Foundation
By Ani Turner, Altarum Institute
ENDNOTES
1. Based on Michigan population projections developed for the
Michigan Department of Transportation by Drs. Donald R.
Grimes and George A. Fulton of the Institute for Research on
Labor, Employment, and the Economy, University of Michigan,
March 2012, and modified by the Michigan Department of
Technology, Management, and Budget.
2. Public Sector Consultants and Brookings Institution.
Michigan’s urban and metropolitan strategy. Lansing, MI,
and Washington, DC: Public Sector Consultants and the
Brookings Institution; 2012. http://www.brookings.edu/
research/reports/2012/02/23-michigan-economy. Accessed May
4, 2015.
3. U.S. Census Bureau. State and county QuickFacts. Last
revised March 31, 2015. http://quickfacts.census.gov/qfd/
index.html. Accessed May 11, 2015.
4. Altarum Institute. The business case for racial equity in
Michigan: technical notes. Ann Arbor, MI: Altarum Institute;
May 2015.
5. Page S. The difference: how the power of diversity creates
better groups, firms, schools, and societies. Princeton, NJ:
Princeton University Press; 2007.
6. Annie E. Casey Foundation. KIDS COUNT data center. http://
datacenter.kidscount.org/. Accessed April 20, 2015.
7. Public Sector Consultants. Policy options to support
children from birth to age three. Lansing, MI: Public Sector
Consultants; November 2014. Factors associated with being
at risk included low-income (defined for this estimate at
185% of the federal poverty level, equivalent to the reducedprice lunch threshold), developmental delays or disabilities,
parents with low educational attainments, adverse
situations, and non-English-speaking homes.
8. National Urban League. Save our cities: education, jobs +
justice. 2015 State of Black America. New York, NY: National
Urban League; 2015.
9. National Center for Education Statistics. State high school
graduation rates by race, ethnicity. http://www.governing.
com/gov-data/education-data/state-high-school-graduationrates-by-race-ethnicity.html. Accessed May 4, 2015.
10. Carnevale A, Smith N, Strohl J. Recovery: job growth and
education requirements through 2020. Washington, DC:
Georgetown University, Georgetown Public Policy Institute,
Center on Education and the Workforce; June 2013.
11. American FactFinder. 2013 American Community Survey data.
http://factfinder.census.gov/faces/nav/jsf/pages/index.xhtml.
Accessed October 17, 2014.
12. Project US 2010. The American Communities Project data
tables. http://www.s4.brown.edu/us2010/SegSorting/Default.
aspx. Accessed May 2015.
13. Ohio State University, Kirwin Institute for the Study of Race
and Ethnicity. Opportunity for all: inequity, linked fate, and
social justice in Detroit and Michigan. Columbus, OH: Ohio
State University; August 2008.
14. Chetty R, Hendren N, Kline P, Saez E. Where is the land of
opportunity? The geography of intergenerational mobility
in the United States. Cambridge, MA: National Bureau of
Economic Research; January 2014.
15. Michigan’s Children. A healthy start for children promises
a healthier future for us all: reducing infant Mortality in
Michigan. Lansing, MI: Michigan’s Children; April 26, 2013.
16. Michigan Department of Community Health. Prevalence
estimates for risk factors and health indicators by raceethnicity, state of Michigan, selected tables. Michigan
Behavioral Risk Factor Survey, 2013. Lansing, MI: Michigan
Department of Community Health; October 2, 2014.
17. Ibid. Age-adjusted rates are cited.
18. Data from the Current Population Survey of the U.S.
Department of Labor, Bureau of Labor Statistics.
19. National Association of State Budget Offices. State
expenditure report: examining fiscal 2012–2014 state
spending. Washington, DC: National Association of State
Budget Offices; 2014.
20.Calculated by the Prison Policy Initiative from U.S. Census
2010 Summary File.
21. Centers for Disease Control and Prevention. WISQARS cost of
injury reports. http://wisqars.cdc.gov:8080/costT/. Accessed
April 20, 2015.
22.Michigan League for Public Policy. 2012 KIDS COUNT data.
23.Wolfers J, Leonhardt D, Quealy K. The methodology:
1.5 million missing black men. New York Times. April
20, 2015. http://www.nytimes.com/2015/04/21/upshot/
the-methodology-1-5-million-missing-black-men.
html?src=twr&abt=0002&abg=0. Accessed April 20, 2015.
24.Michigan Department of Community Health. Michigan Health
Equity Data Project 2013 Update. Based on 2008–2010
American Community Survey data.
25.Altarum Institute, The business case for racial equity in
Michigan: technical notes. Ann Arbor, MI: Altarum Institute;
May 2015.
26.U.S. Census Bureau. Home ownership. http://www.
purelansing.com/Demographics/Home-Ownership. Accessed
May 4, 2015.
27.Corporation for Enterprise Development. 2009–2010 assets
& opportunity scorecard. http://scorecard2009.cfed.org/.
Accessed May 4, 2015.
28.Wilder Research. Cost savings of school readiness per
additional at-risk child in Detroit and Michigan. Lexington,
KY: Wilder Research; December 2011.
29.Public Sector Consultants, Policy options.
30.Alliance for Excellent Education. The economic benefits of
increasing the high school graduation rate for public school
students. Washington, DC: Alliance for Excellent Education;
2013.
31. Alliance for Excellent Education. Saving futures, saving
dollars: the impact of education on crime reduction and
earnings. Washington, DC: Alliance for Excellent Education;
August 2006.
32.Altarum Institute, The business case for racial equity in
Michigan: technical notes. Ann Arbor, MI: Altarum Institute;
May 2015.
33.Ibid.
34.Schweinhart LJ. The HighScope Perry Preschool study
through age 40: summary, conclusions, and frequently asked
questions. Ypsilanti, MI: HighScope Press; 2004.
35.35 Schweinhart LJ, Xiand Z, Daniel-Echols M, Browning KG,
Wakabayashi T. Michigan Great Start Readiness Program
evaluation 2012: high school graduation and grade retention
findings. Lansing, MI: Michigan Department of Education;
March 2012.
36.Lee S, Aos S, Miller M. Evidence-based programs to prevent
children from entering and remaining in the child welfare
system: benefits and costs for Washington. Olympia, WA:
Washington State Institute for Public Policy; 2008.
37.Council of State Governments Justice Center. Applying
a justice reinvestment approach to improve Michigan’s
sentencing system: summary report of analyses and policy
options. Lexington, KY: Council of State Governments; May
2014.
38.Green J, Mauer M. Downscaling prisons: lessons from four
states. Washington, DC: Sentencing Project; 2010.
—8—
May 2015
Prepared by Altarum Institute and funded by the W.K. Kellogg Foundation
By Ani Turner, Altarum Institute


© Copyright 2026