
Meeting Packet
Akron Metropolitan Area Transportation Study March 2015 Committee Meetings TECHNICAL ADVISORY COMMITTEE Thursday, March 19, 2015, 1:30 p.m. Grand Ballroom B - Quaker Square Inn The University of Akron 135 South Broadway, Akron POLICY COMMITTEE Thursday, March 26, 2015, 1:30 p.m. Grand Ballroom B - Quaker Square Inn The University of Akron 135 South Broadway, Akron PLEASE NOTE: THE NEXT MEETING OF THE AMATS CITIZENS INVOLVEMENT COMMITTEE WILL BE APRIL 30 New AMATS Meeting Location Quaker Square Inn - Ballroom B Station Foyer 135 S Broadway Akron, OH 44325 Hall 1 Hall 2 Station A Station B Men FREE PARKING HERE Grand Station Hall Women Men Women Prefunction Station C ENTER HERE Ma in E Glass Walkway to Grille and Mall Boardroom Fe rd i Quaker Square Mall na Trackside Dining Room nd s Registration Trackside Lounge Trackside Grille Plaza Room A AMATS B MEETING A Grand Ballroom Women’s Room Men’s Room Conf C s D Conf D Prefunction or at ev El C B ntr a nce Akron Metropolitan Area Transportation Study Policy Committee Grand Ballroom B - Quaker Square Inn The University of Akron Hotel 135 South Broadway, Akron, Ohio Thursday, March 26, 2015 1:30 p.m. Agenda 1. Call to Order A. Determination of a Quorum B. Audience Participation* Oral 2. Minutes A. January 29, 2015 Meeting - Motion Required Attachment 2A 3. Staff Reports A. Financial Progress Report - Motion Required B. Technical Progress Report C. AMATS Federal Funds Report Attachment 3A Oral Attachment 3C 4. Old Business A. FY 2016-2019 TIP - Second Draft Projects List - Motion Requested Attachment 4A 5. New Business A. Public Participation Plan - Motion Requested Attachment 5A B. AMATS Planning Data Forecast - Motion Requested Attachment 5B C. Draft Road-Diet Analysis - Discussion Only Attachment 5C D. METRO RTA Transit Development Plan Presentation - Discussion Only Oral 6. Resolutions A. Resolution 2015-05 – Supporting an Increase in the Federal Gasoline Tax and Endorsing a New Federal and Statewide Transportation Policy Framework. - Motion Requested Attachment 6A B. Resolution 2015-06 – Approving Amendment #22 to the Transportation Attachment 6B Improvement Program FY 2014-2017 to add two new projects, revise the schedule to two projects and revise the funding to one project. - Motion Requested 7. Other Business 8. Adjournment Next Regular Meeting: Thursday, May 14, 2015 - 1:30 PM Grand Ballroom B - Quaker Square Inn The University of Akron, 135 South Broadway, Akron, Ohio * Any individual or representative of a group may take three (3) minutes to address the Policy Committee on any topic on the agenda. Anyone desiring more time than provided herein shall notify the Director by the Friday preceding the committee meeting so that they may be placed on the agenda for a maximum of five (5) minutes. All mailout material is available on the AMATS Web Site at www.amatsplanning.org Akron Metropolitan Area Transportation Study Technical Advisory Committee Grand Ballroom B - Quaker Square Inn The University of Akron Hotel 135 South Broadway, Akron, Ohio Thursday, March 19, 2015 1:30 p.m. Agenda 1. Call to Order A. Determination of a Quorum Oral 2. Minutes A. January 22, 2015 Meeting - Motion Required Attachment 2A 3. Staff Reports A. Financial Progress Report - Motion Required B. Technical Progress Report C. AMATS Federal Funds Report Attachment 3A Oral Attachment 3C 4. Old Business A. FY 2016-2019 TIP - Second Draft Projects List - Motion Requested Attachment 4A 5. New Business A. Public Participation Plan - Motion Requested Attachment 5A B. AMATS Planning Data Forecast - Motion Requested Attachment 5B C. Draft Road-Diet Analysis - Discussion Only Attachment 5C D. METRO RTA Transit Development Plan Presentation - Discussion Only Oral 6. Resolutions A. Resolution 2015-05 – Supporting an Increase in the Federal Gasoline Tax and Endorsing a New Federal and Statewide Transportation Policy Framework. - Motion Requested Attachment 6A B. Resolution 2015-06 – Approving Amendment #22 to the Transportation Attachment 6B Improvement Program FY 2014-2017 to add two new projects, revise the schedule to two projects and revise the funding to one project. - Motion Requested 7. Other Business 8. Adjournment Next Regular Meeting: Thursday, May 7, 2015 - 1:30 PM Grand Ballroom B - Quaker Square Inn The University of Akron 135 South Broadway, Akron, Ohio All mailout material is available on the AMATS Web Site at www.amatsplanning.org SUMMARY - AGENDA ITEMS March 2015 Attachment 4A – Draft FY 2016-2019 - Second Draft Projects List A revised listing of projects scheduled to receive federal funding in the upcoming Transportation Improvement Program for Fiscal Years 2016 through 2019. The Staff recommends approval. Attachment 5A – Public Participation Plan Plan defines the strategies that the agency will pursue and the policies that it will follow regarding public outreach in the Greater Akron area. The Staff recommends approval. Attachment 5B – AMATS Planning Data Forecast A presentation regarding demographic and population trends in the Greater Akron area and their impacts on the transportation planning process. The Staff recommends approval. Attachment 5C – Draft Road-Diet Analysis A presentation regarding potential road-diet project locations throughout the Greater Akron area and the criteria used for their selection. This item is for discussion only. Attachment 5D – METRO RTA Transit Development Plan Presentation A presentation by METRO RTA regarding the preparation of its future service plans. This item is for discussion only. Attachment 6A – Resolution 2015-05 A resolution from the Policy Committee urging the Greater Akron area's federal representatives to support a 10 cent increase in the federal gas tax to meet the nation's infrastructure needs and urging a new planning framework at the state and federal levels. The Staff recommends approval. Attachment 6B – Resolution 2015-06 – TIP Amendment #22 A TIP amendment to add a new Boston Mills Road project and a replacement study for the State Route 8 Bridge in Akron and to revise the schedule and funding for three projects on Prospect Street, Springdale Road and state Route 91. The Staff recommends approval. Attachment 2A-POLICY Akron Metropolitan Area Transportation Study Policy Committee Thursday, January 29, 2015 – 1:30 p.m. Minutes of Meeting Recordings of AMATS committee meetings are available in the Podcast section of the agency web site at www.amatsplanning.org/category/podcasts/. I. Call to Order A. Chairman Roberts called the meeting to order in Grand Ballroom B of the Quaker Square Inn. The attending members constituted a quorum. B. Audience Participation None. II. Minutes – Motion Required A. Approval of Minutes Members were asked to approve the minutes of the December 18, 2014 meeting. Motion David G. Kline made a motion to approve the minutes and it was seconded by Frank Hairston. The motion was approved by a voice vote. III. Staff Reports A. Financial Progress Report Jason Segedy presented Attachment 3A. Motion Connie Krauss made a motion to approve the Financial Progress Report and it was seconded by Frank Hairston. The motion was approved by a voice vote. B. Technical Progress Report Krista Beniston said that the Staff is working on a Road Diet Analysis and will send a first draft of potential project locations to the TAC members for their review soon. 1 Ms. Beniston described the changes that were recently adopted by the members of the Citizens Involvement Committee (CIC) pertaining to the CIC's meeting format and new quarterly meeting schedule. Ms. Beniston summarized events regarding federal legislation to succeed MAP21, which expires May 30. Joe Paradise asked if the Staff had identified locations and sections for road diets. Ms. Beniston said that the Staff had prepared a preliminary list of locations based on traffic count data and a set of standards for potential projects. Ms. Beniston said that the list could be sent to communities for review. Mr. Paradise said that the Summit County Engineer's office is approaching its paving season and, if there is a resurfacing project on a section identified by AMATS, the engineer's office would like to know about it now so that arrangements could be made to incorporate it into the current paving program. Ms. Beniston said that AMATS would distribute its list as soon as possible. Mr. Segedy announced that Summit County Council established the Summit County Transportation Improvement District (SCTID). Mr. Segedy described the SCTID's organization and purpose. Mr. Segedy said that the district must still be recognized by ODOT. Connie Krauss described the funding and project opportunities presented by the SCTID. Mayor Kline asked if sponsors could seek SCTID funding for currently programmed projects scheduled to receive AMATS and ODOT funding. Ms. Krauss said yes and added that the department is interested in those projects that will create and retain jobs. John Trew said that he would discuss the possibility of Portage County joining the SCTID with the Portage County Commissioners. ODOT District 4 Deputy Director Anthony Urankar said that the state law authorizing TIDs allows for the creation of multicounty districts. Frank Hairston asked if the SCTID would be limited to funding infrastructure projects. Ms. Krauss said that it would fund road projects. Director Urankar suggested that members of the SCTID talk to SCATS about Stark County's TID, which is the only other TID in the ODOT District 4 area. Mayor Bertrand asked if townships and villages were eligible to apply for TID funding. Ms. Krauss said that all Summit County communities were eligible. Mayor Bertrand asked if those areas would be represented on the SCTID Board. Ms. Krauss said that the SCTID Board was organized per OARC Chapter 3540 and is a separate entity from Summit County. Ms. Krauss noted that Director Segedy is the vice chair of the SCTID. Mr. Segedy said that the Staff will provide the Policy Committee with updates 2 regarding the SCTID. Ms. Krauss said that the first meeting of the SCTID Board would be Feb. 2, 2015. C. AMATS Federal Funds Report Victor Botosan presented Attachment 3C and tables concerning Funding Program and Balances dated January 20, 2015. IV. Old Business None. V. New Business A. FY 2016-2019 TIP - First Draft Projects List. Mr. Botosan presented Attachment 5A. Motion Lou Bertrand made a motion to approve the FY 2016-2019 TIP - First Draft Projects List and it was seconded by Joe Paradise. The motion was approved by a voice vote. B. Draft FY 2016 Transportation Planning Work Program and Budget. Jeff Gardner presented Attachment 5B. Motion Frank Hairston made a motion to approve the FY 2016 Transportation Planning Work Program and Budget and it was seconded by David G. Kline. The motion was approved. VI. Resolutions – Approval Requested A. Resolution 2015-01 – Approving Projects to be Funded under the CMAQ Program. Mr. Botosan presented Attachment 6A. Motion David G. Kline made a motion to approve Resolution 2015-01 and it was seconded by Lou Bertrand. The motion was approved by a voice vote. B. Resolution 2015-02 – Approving Amendment #19 to the Transportation Improvement Program FY 2014-2017 to add a new project. Mr. Botosan presented Attachment 6B. 3 Motion David Gasper made a motion to approve Resolution 2015-02 and it was seconded by William A. Currin. The motion was approved by a voice vote. C. Resolution 2015-03 – Approving Amendment #20 to the Transportation Improvement Program FY 2014-2017 to add one new project, revise the funding of two projects and combine two projects. David Pulay presented Attachment 6C. Motion Tom Sheridan made a motion to approve Resolution 2015-03 and it was seconded by Lou Bertrand. The motion was approved by a voice vote. D. Resolution 2015-04 – Approving Amendment #21 to the Transportation Improvement Program FY 2014-2017 - To Add ODOT-Awarded OTPPP Funds in FY 2015 for METRO RTA. Mr. Gardner presented Attachment 6D. Motion Frank Hairston made a motion to approve Resolution 2015-04 and it was seconded by David G. Kline. The motion was approved by a voice vote. VII. Other Business A. Mayor Bertrand suggested that the Policy Committee address the issue of urging the state to restore funding to Ohio's Local Government Fund. The mayor said that the loss of this funding has placed a hardship on villages, townships, cities and counties as they struggle to meet their infrastructure needs. Mayor Bertrand added that a position statement from the committee to the area's state representatives regarding this issue would be timely as the state budget process recently began. The mayor added that if AMATS did not address the issue, then perhaps another body such as the Municipal League should consider doing so. Mr. Segedy said that the Local Government Fund issue might be best suited for discussion amongst local elected officials rather than AMATS. There was discussion regarding federal legislation to succeed MAP-21 and various gas tax proposals currently being considered in Congress. There was discussion regarding state and federal gas taxation rates and funding mechanisms. Mayor Bertrand noted that the restoration of Local Government Funds would not represent a tax increase. 4 Joe Paradise suggested that the Staff draft a letter to the area's state and federal legislators requesting an increase in gas taxes to fund infrastructure needs. Mr. Hairston expressed support for Mr. Paradise' proposal. There was discussion regarding Mr. Paradise' suggestion. Mayor Kline said that the Mayors Association of Portage Summit & Stark Counties (MAPSS) met with Congressional representatives at the John S. Knight Center recently and the federal gas tax was discussed. Motion Joe Paradise made a motion to authorize the AMATS Staff to prepare a draft letter to the Greater Akron area's state and federal legislative representatives urging increases in state and federal gas taxes as a means to pay for infrastructure needs and it was seconded by Frank Hairston. The motion was approved by a voice vote. Chairman Roberts said that the draft letter would be voted on by the Policy Committee for approval during its March 26 meeting. B. Rich Enty asked Mr. Segedy if the Staff and Mr. Kris Liljeblad of METRO have scheduled a presentation by METRO officials regarding the draft update of the transit authority's Transit Development Plan during the March 26 Policy Committee meeting. Mr. Segedy said yes. Mr. Enty described the development of the draft update and its purpose. Mr. Segedy said that AMATS would assist METRO in its public outreach efforts regarding the plan update. C. Mr. Segedy presented a certificate of appreciation on behalf of the Policy Committee to Mayor Kline for his service as committee chairman during 2014. VIII. Adjournment Motion Rich Enty made a motion to adjourn the meeting and it was seconded by Frank Hairston. The motion was approved by a voice vote. The next regularly scheduled Policy Committee meeting will be at 1:30 p.m. on Thursday, March 26, 2015 in Grand Ballroom B of the Quaker Square Inn located at 135 South Broadway in Akron. 5 AMATS POLICY COMMITTEE 2015 ATTENDANCE M Denotes Member Present A Denotes Alternate Present AKRON - Mayor Don Plusquellic (Gasper) (Hewitt) (Weber) AURORA - Mayor Ann Womer Benjamin (Trew) BARBERTON - Mayor William Judge, Jr. (Stefan) BOSTON HEIGHTS - Mayor Bill Goncy (Polyak) BRADY LAKE - Mayor Hal Lehman (Carlson) (McGee) CLINTON - Mayor Al Knack CUYAHOGA FALLS - Mayor Don Walters (Sheridan) DOYLESTOWN - Mayor Terry Lindeman (Marti) FAIRLAWN - Mayor William Roth (Spagnuolo) (Staten) GARRETTSVILLE - Mayor Rick Patrick (Klamer) GREEN - Mayor Dick Norton (Oberdorfer) (Molnar) HIRAM - Mayor Lou Bertrand (Wood) HUDSON - Mayor William Currin (Richardson) (Schroyer) (Sheridan) KENT – City Mgr. David Ruller (Roberts) (Bowling) LAKEMORE – Mayor Rick Justice (Fast) MACEDONIA - Mayor Don Kuchta (Darwish) MANTUA - Mayor Linda Clark (Snopek) METRO – Ms. Saundra M. Foster (Enty) (Harris) MOGADORE - Mayor Michael Rick MUNROE FALLS - Mayor Frank Larson (DiCola) NEW FRANKLIN - Mayor Al Bollas (Gehm) NORTHFIELD – Mayor Jesse Nehez (Greenlee) NORTON - Mayor Mike Zita ODOT - Anthony Urankar (Kinnick) (Rebillot) PARTA – Rick Bissler (Amrhein) (Davis) (Trautman) PENINSULA - Mayor Douglas Mayer PORTAGE COUNTY COMM. - Maureen Frederick (Greener) PORTAGE COUNTY COMM. – Vicki Kline (Long) PORTAGE COUNTY COMM. - Kathleen Chandler (Hairston) PORTAGE COUNTY ENGINEER - Michael Marozzi (Zumbo) RAVENNA - Mayor Joseph Bica (Englehart) (Finney) REMINDERVILLE - Mayor Sam Alonso (Krock) RICHFIELD - Mayor Bobbie Beshara (Frantz) (Wheeler) RITTMAN – Mr. Larry Boggs SILVER LAKE - Mayor Bernie Hovey (Housley) STOW - Mayor Sara Drew (Kurtz) (McCleary) (Rayman) STREETSBORO - Mayor Glenn Broska (Terrell) SUGAR BUSH KNOLLS - Mayor James Beal SUMMIT COUNTY ENGINEER - Alan Brubaker (Fulton) (Paradise) SUMMIT COUNTY EXECUTIVE - Russell Pry (Genet) SUMMIT COUNTY COMM. & ECON. DEV. - Connie Krauss SUMMIT COUNTY COMM. & ECON. DEV. - Dennis Tubbs TALLMADGE - Mayor David Kline (Sauner) TWINSBURG - Mayor Katherine Procop (Mohr) (Finch) WAYNE COUNTY COMM. BOARD - Robert MacGregor (Gleason) WINDHAM - Mayor Robert Donham Jan Mar May July Sept 29 26 14 23 24 Dec 17 A A A M M A M A A A A M M M A 6 AMATS POLICY COMMITTEE 2015 ATTENDANCE OBSERVERS AND STAFF MEMBERS PRESENT NAME REPRESENTING Mr. Terry Fercana Mr. Tom Sheridan EDG City of Hudson Ms. Krista Beniston Mr. Victor Botosan Mr. Jeffrey Gardner Mr. Kerry Prater Mr. Dave Pulay Mr. Jason Segedy AMATS AMATS AMATS AMATS AMATS AMATS 7 Attachment 2A – TAC Akron Metropolitan Area Transportation Study Technical Advisory Committee Thursday, January 22, 2015 – 1:30 p.m. Minutes of Meeting Recordings of AMATS committee meetings are available in the Podcast section of the agency web site at www.amatsplanning.org/category/podcasts/. I. Call to Order A. II. Chairwoman Christine Craycroft called the meeting to order in Grand Ballroom B of the Quaker Square Inn. The attending members constituted a quorum. Minutes – Motion Required A. Approval of Minutes Members were asked to approve the minutes of the December 11, 2014 meeting. Motion David White made a motion to approve the minutes and it was seconded by Frank Hairston. The motion was approved by a voice vote. III. Staff Reports A. Financial Progress Report Jason Segedy presented Attachment 3A. Motion David White made a motion to approve the Financial Progress Report and it was seconded by David Gasper. The motion was approved by a voice vote. B. Technical Progress Report Curtis Baker said that the Staff is working on a Road Diet Analysis and will send a first draft of potential project locations to the TAC members for their review soon. Mr. Baker described the changes that were recently adopted by the members of the Citizens Involvement Committee (CIC) pertaining to the CIC's meeting format and new quarterly meeting schedule. Mr. Baker summarized events regarding federal legislation to succeed MAP-21, which expires May 30. 1 Mr. Segedy announced that Summit County Council established the Summit County Transportation Improvement District (SCTID). There was discussion regarding the SCTID's membership, purpose and funding. C. AMATS Federal Funds Report Victor Botosan presented Attachment 3C and tables concerning Funding Program and Balances dated January 20, 2015. IV. Old Business None. V. New Business A. FY 2016-2019 TIP - First Draft Projects List. Mr. Botosan presented Attachment 5A. Motion Joe Paradise made a motion to approve the FY 2016-2019 TIP - First Draft Projects List and it was seconded by Frank Hairston. The motion was approved by a voice vote. B. Draft FY 2016 Transportation Planning Work Program and Budget. Mr. Baker presented Attachment 5B. Motion David White made a motion to approve the FY 2016 Transportation Planning Work Program and Budget and it was seconded by Frank Hairston. The motion was approved. VI. Resolutions A. Resolution 2015-01 – Approving Projects to be Funded under the CMAQ Program. Mr. Botosan presented Attachment 6A. Motion Tony Demasi made a motion to approve Resolution 2015-01 and it was seconded by David White. The motion was approved by a voice vote. B. Resolution 2015-02 – Approving Amendment #19 to the Transportation Improvement Program FY 2014-2017 to add a new project. Mr. Botosan presented Attachment 6B. 2 Motion David Gasper made a motion to approve Resolution 2015-02 and it was seconded by Wayne Wiethe. The motion was approved by a voice vote. C. Resolution 2015-03 – Approving Amendment #20 to the Transportation Improvement Program FY 2014-2017 to add one new project, revise the funding of two projects and combine two projects. David Pulay presented Attachment 6C. Jim McCleary clarified that the projects to be combined listed as SR 91/SR 303 and SR 91/Norton Road in Attachment 6C should actually read "SR 91/Fishcreek Road and SR 91/Norton Road." Mr. Pulay said that he would make the correction. Motion David White made a motion to approve Resolution 2015-03 and it was seconded by Jim McCleary. The motion was approved by a voice vote. D. Resolution 2015-04 – Approving Amendment #21 to the Transportation Improvement Program FY 2014-2017 - To Add ODOT-Awarded OTPPP Funds in FY 2015 for METRO RTA. Jeff Gardner presented Attachment 6D. Motion Frank Hairston made a motion to approve Resolution 2015-04 and it was seconded by David White. The motion was approved by a voice vote. VII. Other Business Frank Hairston asked if AMATS had heard that FTA District 5 was asking ODOT to delay approval of the STIP. Mr. Segedy said that the agency had not heard about that development. Mr. Hairston said that PARTA officials would contact AMATS to discuss the issue. VIII. Adjournment There being no other business, the meeting was adjourned. The next regularly scheduled TAC meeting will be at 1:30 p.m. on Thursday, March 19, 2015 in Grand Ballroom B of the Quaker Square Inn located at 135 South Broadway in Akron. 3 AMATS TECHNICAL ADVISORY COMMITTEE 2015 ATTENDANCE M Denotes Member Present A Denotes Alternate Present AKRON ENGINEERING BUREAU- Michael J. Teodecki (DiFiore) AKRON PLANNING DEPT. - Mark Moore (Tomic) (Ashley) AKRON TRAFFIC ENGINEERING - Dave Gasper (Davis) AURORA - John E. Trew BARBERTON - Joseph Stefan (Keltyka) CUYAHOGA FALLS - Fred Guerra (Sugar) CUYAHOGA FALLS - Tony V. Demasi (Marko) DOYLESTOWN - Eng. Assoc. - Ronny Portz FAIRLAWN - Nicholas Spagnuolo (Staten) GREEN - Wayne Wiethe (Lingenfelter) GREEN - Paul Pickett (Schemansky) HUDSON - Chris Papp (Sheridan) HUDSON - Greg Hannan (Kosco) KENT - Eugene Roberts KENT - Jim Bowling (Giaquinto) LAKEMORE – Mayor Rick Justice (Fast) MACEDONIA - Michael Hlad (Darwish) METRO - Kris Liljeblad (Bacon) MOGADORE – Vacant MUNROE FALLS – Vacant NEFCO - Joe Hadley (Chinn-Levy) NEW FRANKLIN - Jeff Olson (Kepler) NORTHFIELD - Richard S. Wasosky NORTON - David White ODOT - Steve Rebillot (Bruner) (Kinnick) PARTA – Claudia Amrhein (Smith) (Hairston) PORTAGE COUNTY ENGINEER - Michael Marozzi (Zumbo) PORTAGE CO. REG. PLANNING COMM. - Todd Peetz (James)(McGee) PORTAGE COUNTY SMALL VILLAGES – Vacant PORTAGE COUNTY TOWNSHIP ASSOC – Gibson (Kovacich) RAVENNA - Bob Finney (Jeffers) RICHFIELD - Brian Frantz (Baker) RITTMAN – Larry Boggs SILVER LAKE – John Tutak STOW – James McCleary (Donovan) STOW – Sheila Rayman (Kurtz) STREETSBORO – John H. Cieszkowski, Jr. (Broska) SUMMIT CO. COMM. & ECON. DEV. - Dennis Tubbs SUMMIT COUNTY ENGINEER - Alan Brubaker (Fulton) (Paradise) SUMMIT COUNTY SMALL VILLAGES - Mayor Allen Knack SUMMIT COUNTY TOWNSHIP ASSOC. - Richard Reville (Funk) TALLMADGE - Pat Sauner TWINSBURG - Dan Moczadlo (Mohr) WINDHAM - Mayor Robert Donham Jan Mar May July Sept Dec 22 19 7 16 17 10 M M M M M M M M M M M A A M M M A A A * Richard Enty attended as METRO representative. 4 AMATS TECHNICAL ADVISORY COMMITTEE 2015 ATTENDANCE M Denotes Member Present A Denotes Alternate Present Jan Mar May July Sept Dec 22 13 8 17 18 11 NON-VOTING MEMBERS AKRON CANTON AIRPORT - Rick McQueen AKRON REG. AIR QUALITY MGT. DISTRICT – Sam Rubens AMATS - Jason Segedy CUYAHOGA VALLEY NATIONAL PARK - Rob Bobel ENVIRONMENTAL COMMUNITY REP. - Kurt Princic GREATER AKRON CHAMBER - Gregg Cramer (West) OHIO TURNPIKE COMMISSION – Anthony Yacobucci PORTAGE COUNTY PORT AUTHORITY – Vacant PORTAGE PARK DISTRICT - Christine Craycroft PRIVATE TRANSPORTATION PROVIDER (CYC) – Deb Stolfo RAILROAD INDUSTRY REP. - William A. Callison SUMMIT COUNTY PORT AUTHORITY – Vacant SUMMIT METRO PARKS – Mark Szeremet (Hauber) TRUCKING INDUSTRY – Vacant M M OBSERVERS AND STAFF MEMBERS PRESENT NAME REPRESENTING Mr. Clayton Davis Mr. Steve Jewell Mr. Tom Likavec Mr. Kevin Westbrooks PARTA DLZ LJB, Inc. URS Mr. Curtis Baker Ms. Krista Beniston Mr. Victor Botosan Mr. Jeff Gardner Mr. Kerry Prater Mr. Dave Pulay AMATS AMATS AMATS AMATS AMATS AMATS 5 Attachment 2A - CIC Akron Metropolitan Area Transportation Study Citizens Involvement Committee Thursday, January 22, 2015 – 6:30 p.m. Meeting Summary Recordings of AMATS committee meetings are available in the Podcast section of the agency web site at www.amatsplanning.org/category/podcasts/. Attendees: Dustin J. Baker Audrey Cielinski-Kessler Kyle Julia D.H. Mangold Michael Ondecker Rick Stockburger Fred Wise Staff: Curtis Baker, Planning Administrator Krista Beniston, Planning Coordinator Nate Brugler, Transit Planner I. Seth Bush, GIS Coordinator Heather Davis Reidl, Mobility Planner Dave Pulay, Transportation Engineer Welcome Michael Ondecker commented on the new CIC meeting format. Mr. Ondecker praised the Staff for their work in developing the new format and their ongoing professionalism. Curtis Baker presented a certificate of appreciation from the CIC members to Mr. Ondecker for his service as CIC chairperson during the years 2005 through 2014. II. Review of Last Meeting Summary A. III. Mr. C. Baker presented a Meeting Summary of the December 11, 2014 meeting of the CIC. Discussion Items A. AMATS Agency Update Mr. C. Baker summarized events regarding federal legislation to succeed MAP21, which expires May 30. The Staff is working on a Road Diet Analysis. The Staff will begin updating the Greater Akron area's long-range regional transportation plan, Transportation Outlook 2035, to 2040 later this year. 1 B. Presentation on Road Diets and Upcoming Road Diet Analysis Dave Pulay described the work by AMATS to develop a Road Diet Analysis and why it is pursuing such an analysis. There was discussion regarding potential locations for road diet projects throughout the Greater Akron area. David H. Mangold asked if public opinion would be a consideration in determining project locations. There was discussion regarding public involvement and community support in the selection of potential project locations. Fred Wise asked if data was available regarding the economic impacts of road diets on surrounding small businesses. Mr. Pulay said that he was unaware of any such data, but that he would research the issue. Mr. Wise suggested that AMATS include such impacts in the draft analysis when presenting it for community involvement. Mr. C. Baker concurred with Mr. Wise' suggestion regarding the inclusion of potential economic impacts of road diets in the analysis. There was discussion regarding whether any of the potential road diet projects were located on wide roadways in urban areas that could accommodate protected or dedicated bike lanes. C. Presentation on Demographics and their Impact on Transportation Nate Brugler explained the importance of demographic changes and trends in the transportation planning process. Mr. Brugler said that AMATS prepares a Planning Data Forecast and noted that the next update to this forecast is due in April. Mr. Brugler described the various demographic factors tracked by AMATS for its regional traffic model. AMATS relies upon the U.S. Census Bureau, the Federal Highway Administration (FHWA) and various state departments as data sources. Mr. Brugler explained how the Staff utilizes available data in the traffic modeling process and in the compilation of projections. There was discussion regarding demographic, population and land use trends in the Greater Akron area. IV. Open Discussion Mr. Pulay described recent air quality procedural changes requested by the city of Akron to the White Pond Parkway project, which was approved by the AMATS Policy Committee during its December 2014 meeting in Resolution 2014-16. There was discussion regarding the project. 2 A meeting attendee asked for a description of the $11.5 million local capital expansion project requested by METRO as listed in Table T-2 of Attachment 5AFY 2016-2019 TIP-First Draft Projects List. Mr. Brugler said that the project would construct an outdoor bus canopy. Mr. C. Baker said the funding totals for the project were preliminary. V. Adjournment There being no other business, the meeting was adjourned. The next meeting of the CIC will be 6:30 p.m. on Thursday, April 30 in Meeting Room 1 of the Akron-Summit County Public Library - Main Library located at 60 South High Street in Akron. 3 Attachment 3C AKRON METROPOLITAN AREA TRANSPORTATION STUDY MEMORANDUM TO: Policy Committee Technical Advisory Committee Citizens Involvement Committee FROM: AMATS Staff RE: AMATS Federal Funds Report DATE: March 12, 2015 Funding Issues The TAC TIP Subcommittee will have a meeting in mid-March to begin discussing various issues pertaining to the management of AMATS federal funds. One of the main on-going issues that will be discussed is the over-programming of funds. In the past, there was always an opportunity to trade funds with another MPO. This option has increasingly become more difficult to utilize as Ohio MPOs are more effectively managing their funds and have less un-programmed funds to trade away. Other viable options to consider when dealing with inadequate funding levels is to move projects out to later fiscal years when additional budget becomes available and forgoing the annual 15% project cost increase. The Subcommittee will be discussing these different options and determining how they may potentially impact the overall funding program including the next round of funding slated to start this fall. Results of the Subcommittee’s discussions and any recommendations will be presented to the TAC and Policy Committees for final direction. New TIP for Fiscal Years 2016-2019 The Transportation Improvement Program includes all federally funded projects scheduled for implementation in fiscal years 2016 through 2019. A first draft of the list of projects to be included in the new TIP was presented at the January Committee meetings. Since that time a few updates have been made to some projects and a second draft list has been completed and will be presented at the March meetings. After any changes are made to this second draft project list a two week public involvement period will follow. The final version of the complete TIP document will be presented for approval in May. Attachment 4A AKRON METROPOLITAN AREA TRANSPORTATION STUDY MEMORANDUM TO: Policy Committee Technical Advisory Committee Citizens Involvement Committee FROM: AMATS Staff RE: FY 2016-2019 TIP Projects List - Second Draft DATE: March 12, 2015 In January, the Policy Committee approved a list of highway, transit and bike and pedestrian projects as part of the draft Transportation Improvement Program (TIP) for fiscal years 20162019. In February, copies of the complete 1st draft TIP document were submitted to ODOT for review and comment. Since that time, ODOT provided updates to projects in the first draft list. These changes have been incorporated into the attached second draft project listing. One of the requirements of the TIP is that it must be fiscally constrained meaning that project costs can not exceed expected revenues for any year of the TIP. In order to meet this requirement, several AMATS funded projects were moved into different years and in some cases projects were moved to FY 2020. These project moves are also reflected in this second draft. Copies of the complete 2nd draft TIP document, including the project lists, will be submitted to ODOT in late March for further review and comment. This draft will also be used for a twoweek public involvement period beginning on March 30 and ending April 10. The complete draft TIP document will be made available in late March on AMATS website at www.amatsplanning.org under the What’s New section of the home page. As part of the TIP public involvement, AMATS will host a TIP public meeting on April 8 at 5:00 pm at the Akron Public Library. Any comments received during this public involvement period will be presented at the Policy Committee meeting in May, when approval of the FY 2016-2019 TIP is expected. After Policy Committee approval, the TIP will then be officially submitted to ODOT, the Federal Highway Administration and the Federal Transit Administration for final approval, which is expected by the end of June. The FY 2016-2019 TIP will then be active at the start of the fiscal year in July. CO-RTE-SECTION 98615 POR-ETHAN DR LOCATION & TERMINI STREETSBORO ETHAN DR FROM SR 43 TO THE WEST END TYPE OF WORK UPGRADE EXISTING ETHAN DRIVE TO ACCOMMODATE A FUTURE ROADWAY EXTENSION 92561 POR-FROST RD 1.77 STREETSBORO FROST RD FROM I-480 TO SR 43 RECONSTRUCT TURN LANES SIGNAL INTERCONNECT BRIDGE WIDENING 97706 POR-HEADWATERS TRAIL-Hiram Extension Phase 2 0.49 HIRAM TOWNSHIP SR 305 TO HIRAM COLLEGE FIELD STATION MULTIPURPOSE TRAIL TOTAL PROJECT COST ($000) AIR QUALITY STATUS FUND TYPE PHASE PID # LENGTH Table H-3 AMATS TRANSPORTATION IMPROVEMENT PROGRAM FY 2016-2019 HIGHWAY IMPROVEMENTS STATE LOCAL C C 464.2 261.8 775.8 STREETSBORO EXEMPT CMAQ-A C STATE C LOCAL C 3,969.2 450.0 542.3 6,761.5 STREETSBORO EXEMPT 61.6 15.4 625.0 PORTAGE COUNTY ENGINEER EXEMPT TAP-A LOCAL TAP-A LOCAL P P R R 2016 2017 2018 2019 44.8 11.2 PROJECT SPONSOR 93823 POR-HIRAM HIKE AND BIKE (North) 0.47 HIRAM WINROCK RD TO SR 305 MULTIPURPOSE TRAIL TAP-A LOCAL C C 700.0 147.0 847.0 HIRAM EXEMPT 93825 POR-HIRAM VILLAGE SIDEWALKS 1.10 HIRAM VARIOUS LOCATIONS ALONG SR 82, SR 305 AND SR 700 NEW SIDEWALKS TAP-A LOCAL C C 236.4 59.1 333.2 HIRAM EXEMPT 98366 POR-E. MENNONITE RD 0.90 AURORA E. MENNONITE RD FROM SUNNYLAKE PARK TO WEST CORP LINE RESURFACING STP-A LOCAL C C 185.0 46.3 231.2 AURORA EXEMPT 99823 POR-PARTA BUS PURCHASE N/A PORTAGE COUNTY PURCHASE FOUR NEW BUSES CMAQ LOCAL C C PARTA EXEMPT 99825 POR-PARTA BUS PURCHASE N/A PORTAGE COUNTY PURCHASE FOUR NEW BUSES CMAQ LOCAL C C PARTA EXEMPT 93759 POR-THE PORTAGE HIKE & BIKE TRAIL-SR 59 Segment 0.27 KENT TANNERY PARK SEGMENT TO SR 59/ERIE ST BIKE TRAIL TAP-A LOCAL C C KENT EXEMPT 98977 POR-RIDDLE AVE (Phase 2) 0.38 RAVENNA RIDDLE AVE FROM LIBERTY ST TO NEW MILFORD RD RESURFACING STP-A LOCAL C C RAVENNA EXEMPT 1 700.0 436.2 255.8 64.0 1,136.2 319.8 CO-RTE-SECTION 99879 POR-STREETSBORO SIGNAL UPGRADE LOCATION & TERMINI N/A STREETSBORO VARIOUS LOCATIONS TYPE OF WORK FIBER INTERCONNECTION UPGRADE CENTRAL CONTROL EQUIPMENT EMERGENCY PREEMPTION FUND TYPE PHASE PID # LENGTH Table H-3 AMATS TRANSPORTATION IMPROVEMENT PROGRAM FY 2016-2019 HIGHWAY IMPROVEMENTS CMAQ LOCAL CMAQ LOCAL P P R R HSIP LOCAL HSIP CMAQ-A TAP-A LOCAL R R C C C C 105.0 26.2 3,222.8 5,352.0 500.0 2,268.7 2016 2017 2019 312.0 78.0 PROJECT SPONSOR AIR QUALITY STATUS 5,120.0 STREETSBORO EXEMPT 13,574.3 KENT ANALYZE 1,308.3 327.1 1,635.4 RAVENNA EXEMPT 800.0 88.9 1,513.9 PORTAGE COUNTY ENGINEER ANALYZE 2,950.0 KENT EXEMPT 4,580.7 STREETSBORO EXEMPT 118.0 29.5 84546 POR-E SUMMIT ST 1.54 KENT EAST SUMMIT ST FROM SOUTH LINCOLN ST TO LOOP RD COORDINATED SIGNAL SYSTEM NEW CENTER MEDIAN IMPROVE LINCOLN ST INTERSECTION SIDEWALKS BIKE LANES 93441 POR-WEST SIDE SIGNALS-Ravenna 0.90 RAVENNA HIGHLAND AVE & DIAMOND ST/SYCAMORE ST AND DIAMOND ST & CLEVELAND AVE SIGNAL COORDINATION PREEMPTION PEDESTRIAN SIGNALS CURB RAMPS CMAQ-A C LOCAL C 98585 POR-CR 18-0.51 (Tallmadge Rd) 0.55 BRIMFIELD TOWNSHIP CR 18 (TALLMADGE RD) AT MOGADORE RD AND I-76 CONSTRUCTION OF A DIVERGING DIAMOND INTERCHANGE HSIP LOCAL CMAQ-A LOCAL P P R R 1.30 KENT SR 43 FROM SR 261 TO SUMMIT ST TURN LANES SIGNAL UPGRADE SIGNAL INTERCONNECT SIDEWALK RAMPS CMAQ-A LOCAL CMAQ-A LOCAL R R C C 120.0 30.0 STP-A STP STATE LOCAL C C C C 2,068.2 1,311.7 287.9 557.1 93442 POR-SR 43-10.26 (S Water St) 2018 TOTAL PROJECT COST ($000) 500.0 125.0 2,240.0 560.0 93854 POR-SR 303-0.67 0.86 STREETSBORO SR 303 FROM JUST WEST OF W&LE RAILROAD TRACKS TO JUST EAST OF SR 303 BYPASS RD REPLACE CULVERT ADJUST ROADWAY PROFILE TO IMPROVE DRAINAGE 95258 AMATS AIR QUALITY 95259 ADVOCACY PROGRAM 97832 97833 N/A SUMMIT AND PORTAGE COUNTIES AND CHIPPEWA TOWNSHIP OF WAYNE COUNTY PROMOTION OF ACTIVITIES TO IMPROVE AIR QUALITY SUCH AS BIKING AND WALKING CMAQ-A P LOCAL P 48.0 12.0 48.0 12.0 70.0 17.5 70.0 17.5 295.0 AMATS EXEMPT 95255 RIDESHARE 95256 97829 97830 N/A SUMMIT AND PORTAGE COUNTIES AND CHIPPEWA TOWNSHIP OF WAYNE COUNTY PROMOTION OF CARPOOLING CMAQ-A P 40.0 40.0 50.0 60.0 190.0 AMATS EXEMPT 99722 SUM-AMATS FY 16 REG TRANS PGRM N/A SUMMIT AND PORTAGE COUNTIES AND CHIPPEWA TOWNSHIP OF WAYNE COUNTY REGIONAL TRANSPORTATION PLANNING STP PROGRAM SUPPLEMENTAL FUNDING P 45.0 ODOT EXEMPT 98701 SUM-AKRON CLEVELAND RD 0.41 BOSTON HEIGHTS AKRON CLEVELAND RD FROM SOUTH CORP LINE TO SR 303 RESURFACING C C 325.5 BOSTON HEIGHTS EXEMPT 2 STP-A LOCAL 48.0 260.4 65.1 CO-RTE-SECTION LOCATION & TERMINI TYPE OF WORK FUND TYPE PHASE PID # LENGTH Table H-3 AMATS TRANSPORTATION IMPROVEMENT PROGRAM FY 2016-2019 HIGHWAY IMPROVEMENTS 2016 2017 2018 2019 TOTAL PROJECT COST ($000) PROJECT SPONSOR AIR QUALITY STATUS 88528 SUM-ARLINGTON RD 2.10 COVENTRY AND SPRINGFIELD TOWNSHIPS ARLINGTON RD FROM CHENOWETH RD TO THE AKRON SOUTH CORP LINE NB TURN LANE AT WARNER RD SIGNAL INTERCONNECT RESURFACING SIDEWALK CMAQ-A C STP-A C LOCAL C 880.0 720.0 491.0 2,321.0 SUMMIT COUNTY ENGINEER EXEMPT 93432 SUM-BRITTAIN RD SIGNALS 1.58 AKRON BRITTAIN RD FROM E. MARKET ST TO EASTWOOD AVE SIGNAL COORDINATION FIBEROPTIC CMAQ-A C LOCAL C 920.0 230.0 1,150.0 AKRON EXEMPT 97635 SUM-BUCHHOLZER BLVD-Pedestrian Improvements 0.14 AKRON BUCHHOLZER BLVD FROM INDEPENDENCE AVE TO CHAPEL HILL ENTRY DRIVE SIDEWALK PEDESTRIAN SIGNAL TAP-A LOCAL C C 192.0 48.0 240.0 AKRON EXEMPT 99721 SUM-CANTON RD-Sidewalks 1.03 SPRINGFIELD TOWNSHIP CANTON RD FROM SALMON DR TO SPRINGFIELD LAKE DR SIDEWALK TAP-A LOCAL R R 80.0 20.0 380.0 SUMMIT COUNTY ENGINEER EXEMPT 89113 SUM-CANTON RD/SR 91 0.91 SPRINGFIELD TWP, VILLAGE OF LAKEMORE CANTON RD/SR 91 FROM 500 FT SOUTH OF SPRINGFIELD LAKE DRIVE TO FARMDALE RD STANDARD LANE WIDTH ADD CONCRETE MEDIAN TURN LANES SIDEWALKS HSIP STATE LOCAL STP-A HSIP STATE LOCAL STP-A HSIP STATE LOCAL P P P R R R R C C C C 9,642.4 SUMMITT COUNTY ENGINEER EXEMPT 2,184.1 NORTON ANALYZE 5,096.1 NORTON ANALYZE 10,107.9 AKRON EXEMPT 1,016.0 SUMMIT COUNTY METRO PARKS EXEMPT 85076 SUM-CLEVELAND MASSILLON RD (Phase 1) 0.39 NORTON CLEVELAND MASSILLON RD FROM PLEASANT DR TO GREENRIDGE RD MEDIAN TURN LANE SIGNAL UPGRADE RESURFACING STP-A LOCAL C C 97638 SUM-CLEVELAND MASSILLON RD (Phase 2) 0.65 NORTON CLEVELAND MASSILLON RD FROM WEBER DR TO PLEASANT DR MEDIAN TURN LANE INTERSECTION WIDENING SIGNAL UPGRADE RESURFACING STP-A HSIP LOCAL C C C 88990 SUM-W EXCHANGE ST/CEDAR ST 2.80 AKRON W. EXCHANGE ST FROM S. PORTAGE PATH TO BROADWAY ST AND CEDAR ST FROM RHODES AVE TO BROADWAY ST INTERCONNECT SIGNAL SYSTEM LANE REDUCTION PARKING BIKE LANES HSIP LOCAL CMAQ-A STP-A HSIP LOCAL P P C C C C 2.00 AKRON MILL ST TO EASTWOOD AVE MULTIPURPOSE TRAIL TAP-A LOCAL C C 97855 SUM-FREEDOM TRAIL (Phase 3) 3 607.9 33.8 33.8 915.5 1,130.0 177.2 177.2 2,436.5 2,975.7 455.8 455.8 1,420.0 355.0 3,100.9 216.0 829.2 273.2 30.4 2,400.0 1,424.8 4,136.1 1,415.8 500.0 200.0 CO-RTE-SECTION LOCATION & TERMINI TYPE OF WORK FUND TYPE PHASE PID # LENGTH Table H-3 AMATS TRANSPORTATION IMPROVEMENT PROGRAM FY 2016-2019 HIGHWAY IMPROVEMENTS 2016 2017 2018 2019 TOTAL PROJECT COST ($000) PROJECT SPONSOR 93819 SUM-HOWE AVE 0.69 CUYAHOGA FALLS HOWE AVE FROM MAIN ST TO BUCHHOLZER BLVD PAVEMENT RECONSTRUCTION STP-A LOCAL R R 99826 SUM-METRO BUS PURCHASE N/A SUMMIT COUNTY PURCHASE FIVE NEW BUSES CMAQ LOCAL C C 98702 SUM-OLDE EIGHT RD (Phase 1) 1.56 BOSTON HEIGHTS OLDE EIGHT RD FROM BOSTON MILLS RD TO NORTH CORP LINE RESURFACING STP-A LOCAL C C 730.8 182.7 98703 SUM-OLDE EIGHT RD (Phase 2) 1.72 BOSTON HEIGHTS OLDE EIGHT RD FROM SR 303 TO BOSTON MILLS RD RESURFACING STP-A LOCAL C C 84397 SUM-SEIBERLING WAY (Phase 1) 0.44 AKRON SEIBERLING WAY FROM ENGLEWOOD ST TO EAGLE ST NEW ROAD NEW BRIDGE OVER LITTLE CUYAHOGA RIVER STP-A LOCAL C C 98865 SUM-STATE ST 0.66 NEW FRANKLIN STATE RD FROM TURKEYFOOT LAKE RD (SR 619) TO NORTH CORP LINE RESURFACING STP-A LOCAL C C 240.0 60.0 300.0 97863 SUM-STEELS CORNERS RD 1.05 CUYAHOGA FALLS STEELS CORNERS RD FROM STATE RD TO WYNDHAM RIDGE DR RESURFACING STP-A LOCAL C C 300.0 75.0 375.0 CUYAHOGA FALLS 86053 SUM-STATE ST BRIDGE 0.01 AKRON STATE ST BRIDGE OVER OHIO CANAL BRIDGE REPLACEMENT BR LOCAL C C 98363 SUM-VAN BUREN AVE 1.22 BARBERTON VAN BUREN AVE FROM ROBINSON AVE TO FAIRVIEW AVE AND FAIRVIEW AVE FROM VAN BUREN AVE TO NORTON AVE RESURFACING STP-A LOCAL C C 97856 SUM-VETERANS TRAIL (Phase 1) 1.14 HUDSON BARLOW RD TO VETERANS WAY PARK MULTIPURPOSE TRAIL LOCAL LOCAL P R 4 440.0 110.0 200.0 EXEMPT 913.5 BOSTON HEIGHTS EXEMPT 806.4 201.6 1,008.0 BOSTON HEIGHTS EXEMPT 4,151.8 1,390.7 7,970.0 AKRON ANALYZE NEW FRANKLIN EXEMPT 7,603.6 AKRON EXEMPT EXEMPT 675.0 BARBERTON EXEMPT 1,360.0 80.0 EXEMPT METRO 2,407.5 4,550.2 540.0 135.0 4,194.5 CUYAHOGA FALLS AIR QUALITY STATUS HUDSON EXEMPT PHASE LENGTH Table H-3 AMATS TRANSPORTATION IMPROVEMENT PROGRAM FY 2016-2019 HIGHWAY IMPROVEMENTS 2016 99051 SUM-WHITE POND PARKWAY 0.02 AKRON WEST OF WHITE POND DRIVE AND ACROSS FROM FIRST ENERGY DR NEW ROADWAY DISC LOCAL DISC LOCAL P P C C 58.0 14.5 1,556.6 1,633.4 98365 SUM-WOOSTER RD N. 0.68 BARBERTON WOOSTER RD N FROM HOPOCAN AVE TO NORTON AVE RESURFACING STP-A LOCAL C C 453.4 113.4 76721 SUM-SR 8-7.60 5.25 STOW/HUDSON SR 8 FROM GRAHAM RD TO JUST NORTH OF SR 303 TOTAL PAVEMENT REPLACEMENT NHS STATE C C PID # CO-RTE-SECTION LOCATION & TERMINI TYPE OF WORK FUND TYPE 2017 2018 2019 TOTAL PROJECT COST ($000) 3,480.0 PROJECT SPONSOR AIR QUALITY STATUS AKRON ANALYZE 566.8 BARBERTON EXEMPT 34,720.0 8,680.0 47,809.0 ODOT EXEMPT 9,447.4 ODOT ANALYZE 2,000.0 AKRON EXEMPT 1,120.0 280.0 1,400.0 AKRON EXEMPT 603.1 3,000.0 5,000.0 150.8 1,583.3 11,592.6 AKRON ANALYZE 110,722.2 ODOT ANALYZE 26,987.2 ODOT ANALYZE 132,537.3 ODOT ANALYZE FED BD 83067 SUM-SR 18-1.20 1.23 COPLEY TOWNSHIP SR 18 AT MONTROSE WEST AVE / HERITAGE WOODS DR RELOCATE MONTROSE WEST AVE TO HERTIAGE WOODS DR NEW EB RIGHT TURN LANE TO I-77 SB NHPP HSIP STP STATE LOCAL C C C C 3,298.2 2,839.8 12.4 937.1 1,029.9 93436 SUM-SR 18 SIGNALS (Portage Path) 1.32 AKRON WEST MARKET ST FROM HAWKINS AVE TO PORTAGE PATH SIGNAL COORDINATION FIBEROPTIC ELIMINATE SIGNAL AT KENILWORTH AND ELMDALE CMAQ-A C LOCAL C 93435 SUM-SR 18 SIGNALS (Summit St) 2.09 AKRON MARKET ST FROM PORTAGE PATH TO SUMMIT ST UPGRADE SIGNALS VIDEO DETECTION FIBEROPTIC CMAQ-A C LOCAL C 75436 SUM-SR 59-Rerouting 0.88 AKRON SR 59 FROM EXCHANGE ST TO MAIN/HOWARD STREET RECONSTRUCT RAND AND DART AVE CLOSE NORTH PART OF SR 59 REROUTE TRAFFIC NHPP HSIP STP-A STATE LOCAL C C C C C 93501 SUM-IR 76-0.00 5.62 NORTON/BARBERTON I-76 FROM THE MEDINA COUNTY LINE TO WOOSTER RD COMPLETE PAVEMENT REPLACEMENT STATE WIDENING TO SIX LANES FROM SR 21 FED BD TO SR 619 NHPP STATE P C C C 96670 SUM-IR 76-5.62 5.62 AKRON/BARBERTON I-76 FROM CENTRAL AVE TO 27TH ST RECONSTRUCTION OF I-76/WOOSTER RD/EAST AVE INTERCHANGE EXTENSIVE RAMP RE-ALIGNMENTS STATE STATE NHPP STATE P R C C 1,000.0 4,500.0 RECONSTRUCT MODIFY ACCESS POINTS AND GEOMETRY NHPP IM STATE LOCAL C C C C 93,600.0 45.0 10,405.0 3,398.0 77269 SUM-IR 76/77-10.00 (MAIN/BROADWAY INTERCHANGE) 1.00 AKRON IR 76/77 WEST OF THE MAIN/BROADWAY AND GRANT/WOLF LEDGES INTERCHANGES 5 1,600.0 400.0 4,000.0 85,000.0 3,452.1 15,516.9 16,650.0 1,850.0 CO-RTE-SECTION LOCATION & TERMINI TYPE OF WORK FUND TYPE PHASE PID # LENGTH Table H-3 AMATS TRANSPORTATION IMPROVEMENT PROGRAM FY 2016-2019 HIGHWAY IMPROVEMENTS HSIP LOCAL P P 101.9 11.3 3,800.0 698.2 1,124.6 2016 82594 SUM-CANTON RD (CR 66) 0.98 SPRINGFIELD TOWNSHIP, VILLAGE OF LAKEMORE STANDARD LANE WIDTH CANTON RD FROM SANITARIUM RD TO ADD CONCRETE MEDIAN WATERLOO RD CORRECT VERTICAL CURVE 93444 SUM-SR 91-5.12 (North Ave) 0.65 TALLMADGE NORTH AVE FROM TALLMADGE CIRCLE TO GARWOOD DR RECONSTRUCTION TURN LANES SIDEWALKS CMAQ-A C STP-A C LOCAL C 93433 SUM-SR 91/SR 18 SIGNAL (Canton Rd/E Market St) 0.01 AKRON SR 91 (CANTON RD) AT THE INTERSECTION WITH SR 18 (E. MARKET ST) TURN LANES GEOMETRIC IMPROVEMENTS SIGNAL UPGRADE CMAQ-A LOCAL CMAQ-A LOCAL R R C C 82956 SUM-SR 91-11.83 0.50 HUDSON/STOW/BOSTON HEIGHTS SR 91 FROM FISHCREEK RD TO NORTON RD SR 91 AT NORTON RD INTERSECTION SR 303 BRIDGE OVER HIKE/BIKE TRAIL TURN LANES NEW SIGNAL REPLACE BRIDGE RESURFACING STP-A CMAQ-A STP STATE LOCAL C C C C C 93820 SUM-SR 91-14.67 (N Main St-Downtown) 0.23 HUDSON SR 91 (N. MAIN ST) FROM SR 303 TO OWEN BROWN ST RESURFACING SIGNALIZATION UPGRADE CROSS WALKS SIDEWALKS STP-A LOCAL C C 93822 SUM-SR 91-15.67 (Darrow Rd) 0.70 HUDSON SR 91 (DARROW RD) FROM VALLEYVIEW RD TO HINES HILL RD TURN LANES BIKE LANES SIDEWALKS STP-A LOCAL R R 92032 SUM-SR 91-Phase 2 (Darrow Rd) 0.56 TWINSBURG SR 91 (DARROW RD) FROM NORTH OF GLENWOOD BLVD TO THE TWINSBURG NORTH CORP LINE WIDEN TO FOUR LANES ROUNDABOUT DRAINAGE SIDEWALK STP-A LOCAL STP-A LOCAL R R C C 140.0 35.0 88968 SUM-SR 162 (Copley Rd/Maple St) 3.64 AKRON COPLEY RD FROM COLLIER RD TO GLENDALE AVE UPGRADE SIGNAL SYSTEM INTERCONNECT VIDEO CMAQ-A C LOCAL C 2,100.0 525.0 90415 SUM-SR 241-4.10 (Massillon Rd) 1.00 GREEN RABER RD TO SR 619 WIDEN TO FIVE LANES BIKE LANES SIDEWALKS STP-A LOCAL R R 88556 SUM-SR 261-11.50 (Tallmadge Ave) 0.60 AKRON TALLMADGE AVE (SR 261) FROM N. MAIN ST TO GORGE BLVD INCLUDING INTERSECTION WITH DAYTON ST RECONSTRUCT AND REDUCE TO THREE STANDARD LANES REALIGN DAYTON ST INTERSECTION UPGRADE TRAFFIC SIGNALS UPGRADE SIDEWALK STP-A LOCAL R R 93439 SUM-SR 261 SIGNALS (Tallmadge Ave) 1.19 AKRON TALLMADGE AVE FROM HOME AVE TO BRITTAIN RD SIGNAL COORDINATION FIBEROPTIC 6 CMAQ-A C LOCAL C 2017 2018 2019 TOTAL PROJECT COST ($000) 535.3 PROJECT SPONSOR SUMMITT COUNTY ENGINEER AIR QUALITY STATUS EXEMPT 6,521.0 TALLMADGE EXEMPT 380.0 95.0 1,500.0 AKRON EXEMPT 6,614.9 STOW EXEMPT 1,496.0 374.0 1,921.8 HUDSON EXEMPT 89.1 22.3 2,350.0 HUDSON EXEMPT 800.0 200.0 1,856.0 640.0 1,894.4 478.0 635.0 4,505.0 TWINSBURG ANALYZE 3,440.0 860.0 760.0 190.0 2,625.0 AKRON EXEMPT 1,600.0 400.0 13,310.0 GREEN ANALYZE 296.0 74.0 3,445.0 AKRON EXEMPT 950.0 AKRON EXEMPT Table T - 2 AMATS TRANSPORTATION IMPROVEMENT PROGRAM FY 2016-2019 Project Description PID # Operating 94955 Local Capital Project 94958 Planning 94959 Preventive Maintenance 94947 Large Commuter Buses 94941 Small Buses 94942 Support Equip-Shelters, Benches 94952 Large Buses 95695 Operating 94969 Local Capital Project 94971 Planning 95136 Preventive Maintenance 94966 Large Buses 94960 Small Buses 94962 Support Equip-Shelters, Benches 94967 Large Buses 94960 Operating 99093 Local Capital Project 99078 Planning 99095 Preventive Maintenance 99091 Large Buses 99078 Small Buses 99090 Support Equip-Shelters, Benches 99092 Large Buses 99077 Operating 99100 Local Capital Project 99101 Planning 99102 Preventive Maintenance 99098 Large Buses 99096 Small Buses 99097 Support Equip-Shelters, Benches 99099 Large Bus 99096 Large Buses 99826 TOTALS Qty Expansion or Replacement Expansion 2 Expansion 12 Replacement 2 Replacement 6 Replacement 12 Replacement 2 Replacement 6 Replacement 12 Replacement 2 Replacement 6 Replacement 12 Replacement 1 5 Replacement Replacement State FY Fiscally Constrained TRANSIT IMPROVEMENTS METRO Regional Transit Authority Exempt Operating 2016 Exempt Capital 2016 Exempt Planning 2016 Exempt Capital 2016 Exempt Capital 2016 Exempt Capital 2016 Exempt Capital 2016 Exempt Capital 2016 Yes Yes Yes Yes Yes Yes Yes Yes Exempt Operating 2017 Exempt Capital 2017 Exempt Planning 2017 Exempt Capital 2017 Exempt Capital 2017 Exempt Capital 2017 Exempt Capital 2017 Exempt Capital 2017 Yes Yes Yes Yes Yes Yes Yes Yes Exempt Operating 2018 Exempt Capital 2018 Exempt Planning 2018 Exempt Capital 2018 Exempt Capital 2018 Exempt Capital 2018 Exempt Capital 2018 Exempt Capital 2018 Yes Yes Yes Yes Yes Yes Yes Yes Exempt Operating 2019 Exempt Capital 2019 Exempt Planning 2019 Exempt Capital 2019 Exempt Capital 2019 Exempt Capital 2019 Exempt Capital 2019 Exempt Capital 2019 Exempt Capital 2019 Yes Yes Yes Yes Yes Yes Yes Yes Yes Air Quality Type Federal Funding $ $3,500,000 $1,360,000 $1,008,000 $65,000 $720,000 $3,000,000 $2,160,000 $1,008,000 $65,000 $720,000 $3,000,000 $2,160,000 $1,008,000 $65,000 $800,000 $3,000,000 $2,160,000 $1,008,000 $65,000 $400,000 $2,200,000 $29,472,000 7 Federal Funding Source 5307 5307 5307 5307 5339 5307 5307 5307 5307 5339 5307 5307 5307 5307 5339 5307 5307 5307 5307 5339 CMAQ State Funding $ State Funding Source $675,000 UTP (STP-S) $675,000 UTP (STP-S) $675,000 UTP (STP-S) $675,000 UTP (STP-S) $2,700,000 Local Funding $ Local Funding Source Total Project Cost $ $46,000,000 $11,500,000 $680,000 $1,050,000 $340,000 $252,000 $16,250 $180,000 Dedicated Local Tax Dedicated Local Tax Dedicated Local Tax Dedicated Local Tax Operating Revenue Operating Revenue Dedicated Local Tax Dedicated Local Tax $46,000,000 $11,500,000 $680,000 $5,225,000 $1,700,000 $1,260,000 $81,250 $900,000 $47,500,000 $4,000,000 $715,000 $925,000 $540,000 $252,000 $16,250 $180,000 Dedicated Local Tax Dedicated Local Tax Dedicated Local Tax Dedicated Local Tax Dedicated Local Tax Dedicated Local Tax Dedicated Local Tax Dedicated Local Tax $47,500,000 $4,000,000 $715,000 $4,600,000 $2,700,000 $1,260,000 $81,250 $900,000 $49,000,000 $6,500,000 $740,000 $925,000 $540,000 $252,000 $16,250 $200,000 Dedicated Local Tax Operating Revenue Dedicated Local Tax Dedicated Local Tax Dedicated Local Tax Dedicated Local Tax Dedicated Local Tax Dedicated Local Tax $49,000,000 $6,500,000 $740,000 $4,600,000 $2,700,000 $1,260,000 $81,250 $1,000,000 $51,000,000 $6,500,000 $800,000 $925,000 $540,000 $252,000 $16,250 $100,000 $550,000 Dedicated Local Tax Dedicated Local Tax Operating Revenue Dedicated Local Tax Dedicated Local Tax Dedicated Local Tax Operating Revenue Dedicated Local Tax Dedicated Local Tax $51,000,000 $6,500,000 $800,000 $4,600,000 $2,700,000 $1,260,000 $81,250 $500,000 $2,750,000 $233,003,000 $265,175,000 Table T - 2 AMATS TRANSPORTATION IMPROVEMENT PROGRAM FY 2016-2019 Project Description PID # Operating Planning Preventive Maintenance Small Buses 94643 94645 94648 94649 Operating Planning Preventive Maintenance Transit Enhancements - Pedestrian Small Buses CNG Fueling Station 94644 94646 94650 99294 94651 92923 Operating Planning Preventive Maintenance Large Buses Large Buses 99309 99310 99295 99293 99823 Operating Planning Preventive Maintenance Small Buses Large Buses 99643 99314 99312 99311 99825 State FY Fiscally Constrained TRANSIT IMPROVEMENTS Portage Area Regional Transportation Authority Exempt Operating Exempt Planning Exempt Capital Replacement Exempt Capital 2016 2016 2016 2016 Yes Yes Yes Yes Exempt Operating Exempt Planning Exempt Capital Exempt Capital Replacement Exempt Capital Expansion Exempt Capital 2017 2017 2017 2017 2017 2017 Yes Yes Yes Yes Yes Yes 2 2 Exempt Operating Exempt Planning Exempt Capital Replacement Exempt Capital Replacement Exempt Capital 2018 2018 2018 2018 2018 Yes Yes Yes Yes Yes 6 2 Exempt Operating Exempt Planning Exempt Capital Replacement Exempt Capital Replacement Exempt Capital 2019 2019 2019 2019 2019 Yes Yes Yes Yes Yes Qty 3 6 Expansion or Air Replacement Quality Type TOTALS Federal Funding $ Federal Funding Source State Funding $ State Funding Source $85,000 E & D Fare Assist $650,000 $192,000 5307 5307 5307 5307 5307 CMAQ 5307 5307 CMAQ 5307 5307 CMAQ $7,401,000 $3,300,000 Dedicated Local Tax $75,000 Dedicated Local Tax $250,000 UTP (GRF) $8,250 Dedicated Local Tax $96,000 Dedicated Local Tax $400,000 Operating Revenue $3,300,000 Dedicated Local Tax $75,000 Dedicated Local Tax $250,000 UTP (GRF) $152,000 Dedicated Local Tax $200,000 Dedicated Local Tax $85,000 E & D Fare Assist $650,000 $384,000 $800,000 $3,300,000 Operating Revenue $50,000 Dedicated Local Tax $48,000 Operating Revenue $85,000 E & D Fare Assist $650,000 $608,000 $800,000 Local Funding Source $250,000 UTP (GRF) $85,000 E & D Fare Assist $650,000 $33,000 $384,000 $1,600,000 Local Funding $ $3,300,000 Dedicated Local Tax $75,000 Dedicated Local Tax $250,000 UTP (GRF) $96,000 Operating Revenue $200,000 Dedicated Local Tax $1,340,000 $14,675,250 Total Project Cost $ $3,385,000 $50,000 $900,000 $240,000 $3,385,000 $75,000 $900,000 $41,250 $480,000 $2,000,000 $3,385,000 $75,000 $900,000 $760,000 $1,000,000 $3,385,000 $75,000 $900,000 $480,000 $1,000,000 $23,416,250 Project Description Competitively Selected Projects Competitively Selected Projects Competitively Selected Projects Competitively Selected Projects TOTALS PID # Qty Expansion or Air Replacement Quality Accessible Exempt Exempt Exempt Exempt Yes Yes Yes Yes State FY Fiscally Constrained Specialized Transportation Program - FTA 5310 Enhanced Mobility for the Elderly and Disabled 2016 2017 2018 2019 Yes Yes Yes Yes Federal Funding $ $546,145 $546,145 $546,145 $546,145 $2,184,580 8 Federal Funding Source 5310 5310 5310 5310 State Funding $ State Funding Source Local Funding $ $0 $0 $0 $0 $136,536 $136,536 $136,536 $136,536 $0 $546,145 Local Funding Source Other Other Other Other Total Project Cost $ $682,681 $682,681 $682,681 $682,681 $2,730,725 Attachment 5A AKRON METROPOLITAN AREA TRANSPORTATION STUDY MEMORANDUM TO: Policy Committee Technical Advisory Committee Citizens Involvement Committee FROM: AMATS Staff RE: Public Participation Plan DATE: March 13, 2015 In late January, AMATS undertook a review of its Public Participation Plan, which was last updated in 2012. During the course of this review, the agency decided to update and revise its public outreach strategies. These revisions are largely the result of technological and demographic changes that are unfolding in the Greater Akron area and the agency's continued efforts to expand outreach opportunities. The resulting AMATS Public Participation Plan or "3P" incorporates these changes. The 3P embraces the force of today's social media and recognizes the needs of growing and unique populations within the area, such as the Asian and Latino communities, and those with special needs. The 3P states the agency's willingness to partner with various civic groups to reach these and other populations. Along with these changes, the 3P improves upon the agency's traditional outreach efforts and provides new opportunities for civic involvement through public empowerment strategies. Examples of these efforts are the recent changes to the AMATS Citizens Involvement Committee (CIC), the availability of a new Speakers Bureau, and the agency's Bike-NBrainstorms and Better Block initiatives. The 3P addresses the issue of transparency with passages devoted to public information and how the public may freely access AMATS records, such as meeting minutes, MP3 recordings, reports and studies, through verbal and written requests, the agency website - amatsplanning.org - and AMATS' subscriber services. It should be noted that, due to technical problems stemming from an extensive revamp of the AMATS web site, the Draft 3P was not available for public posting until Feb. 11, 2015. The result of this delayed posting is that the full 45-day public comment period for the Draft 3P will end on Friday, March 27, 2015. The AMATS Staff is requesting approval of the 3P by the Policy Committee to be effective on March 27. Any public comments received by the agency prior to the end of this period will be addressed by the Staff and presented to the Policy Committee for consideration during the next regularly scheduled committee meeting. The 3P is available on the Get Involved page of the agency website. Comments regarding this item and related practices are welcome and should be sent to AMATS Public Information Coordinator Kerry Prater at [email protected] or 330-375-2436. Draft AMATS "3P" Public Participation Plan February 2015 DRAFT AMATS "3P" PUBLIC PARTICIPATION PLAN February 2015 Akron Metropolitan Area Transportation Study 806 CitiCenter / 146 S. High St. / Akron, Ohio 44308-1423 Phone: (330) 375-2436 FAX: (330) 375-2275 This report was prepared by the Akron Metropolitan Area Transportation Study (AMATS) in cooperation with the U.S. Department of Transportation, the Ohio Department of Transportation, and the Village, City and County governments of Portage and Summit Counties and Chippewa and Milton Township in Wayne County. The contents of this report reflect the views of AMATS, which is responsible for the facts and accuracy of the data presented herein. The contents do not necessarily reflect the official view and policies of the Ohio and/or U.S. Department of Transportation. This report does not constitute a standard, specification or regulation. Table of Contents Introduction .................................................................................................................................................. 1 • What is AMATS? ............................................................................................................................... 1 AMATS Committees and Staff ..................................................................................................................... 2 • Policy Committee ............................................................................................................................. 2 • Technical Advisory Committee (TAC) ............................................................................................... 3 • Citizens Involvement Committee (CIC) ............................................................................................ 3 • Staff .................................................................................................................................................. 3 On the Web................................................................................................................................................... 4 • AMATSPLANNING.ORG .................................................................................................................... 4 • SWITCHING‐GEARS.ORG .................................................................................................................. 4 • Social Media ..................................................................................................................................... 5 New Approaches .......................................................................................................................................... 6 • Public Empowerment ....................................................................................................................... 6 • Community Outreach....................................................................................................................... 7 • Speakers' Bureau ............................................................................................................................. 7 • Public Information ........................................................................................................................... 7 Unique Populations ...................................................................................................................................... 9 • Special Needs ................................................................................................................................... 9 • Map ‐ Low‐Income Populations ..................................................................................................... 10 • Map ‐ Minority Populations ........................................................................................................... 11 Conclusion .................................................................................................................................................. 12 Appendix A ‐ Regional Transportation Plan (RTP) ...................................................................................... 13 Appendix B ‐ Transportation Improvement Program (TIP) ........................................................................ 15 Appendix C ‐ Involvement of Interested Parties and Public Comment ...................................................... 17 Appendix D ‐ Audience Participation Form ................................................................................................ 18 Introduction Our world is changing at a rapid pace. A torrent of changes both technological and demographic has been unleashed in recent years. There are opportunities for people to share ideas through new media that weren't possible just a few years ago. There are also new voices to be heard in a rapidly changing society whose composition is evolving almost daily. Change presents new challenges and opportunities to individuals, communities, and even nations. One challenge facing planning agencies such as AMATS is how to harness this change so that the peoples' voices are heard. There is also an opportunity to fashion better transportation systems that not only meet the needs of today, but prepare for tomorrow. The Public Participation Plan ‐ "3P" ‐ reflects the realities of a changing society. AMATS seeks to foster an environment where the public feels that its insights not only matter, but are encouraged and welcomed. Throughout the change occurring around us, there is an old transportation adage that still holds true: The journey of a thousand miles begins with a single step. Our agency actively pursues strategies to encourage the public to take their first steps in getting involved in their region's transportation planning process. AMATS provides many opportunities throughout this process for the public to participate and influence transportation policies. There are several different ways to get involved with AMATS which are presented in 3P, most notably our Citizens Involvement Committee. Please note that the public is by no means limited to the strategies detailed in these pages. The agency actively seeks new opportunities to exchange ideas with the public and welcomes ideas and suggestions on how to do so. What is AMATS? "AMATS" stands for the Akron Metropolitan Area Transportation Study. We are responsible for transportation planning within the Greater Akron area comprised of Portage and Summit counties and a portion of Wayne County. From highways to bikeways, from buses to trails, our agency plays a role in the planning of the major transportation projects within the area and the funding that makes them possible. A Policy Committee, a Technical Advisory Committee (TAC), a Citizens Involvement Committee (CIC) and a staff are the official players that comprise AMATS with each suited to a particular role in the planning process. To learn more about each, read on. 1 AMATS Committees and Staff Each Player Has a Role ‐ Even You! Transportation planning in the Greater Akron area is accomplished through a cast of players. Like any ensemble cast, each player performs a unique role, but their roles are intertwined. The Policy Committee, Technical Advisory Committee (TAC), Citizens Involvement Committee (CIC) and agency staff are featured players in this cast, but ‐ like any cast ‐ they need feedback. The feedback that they need comes from you ‐ the public ‐ through your participation in the planning process. As a member of the public, your are encouraged to participate in the planning process. AMATS strives to make the Greater Akron area's transportation planning process as transparent and accessible as possible. The agency regularly: • Posts timely notices about meeting dates and locations and meeting materials in advance on our website ‐ amatsplanning.org. • Provides podcasts of past meetings on our agency website and through our podcast subscription service. • Schedules committee meetings in locations that are accessible for all citizens, including the disabled and transit dependent. You are welcome to attend any of our committee meetings, all of which are open to the public. Below are descriptions regarding our committees and staff and how you may participate in the regional planning process. Policy Committee Currently, there are 46 voting members of the Policy Committee representing every community in the Greater Akron area. It is this body that decides how the area's federal transportation dollars should be spent. The committee is composed of elected officials, county engineers, transit agencies and representatives from the Ohio Department of Transportation. Its members meet regularly six times a year to make funding decisions, discuss priorities and policies, and collaborate on regional issues. The Policy Committee provides opportunities for the public to address the committee with the following guidelines: • Anyone interested in making comments before the Policy Committee may do so during the public comment period at the beginning of the agenda. • Public comments are limited to three minutes per person, but may be allowed more time by the Policy Committee chairperson. 2 • Organizations wishing to address the Policy Committee should select one representative to speak during the public comment period. • Speakers will be asked to fill out an Audience Participation Form before addressing the Policy Committee (p. 18). • Citizens may contact the AMATS staff at 330‐375‐2436 or by email at [email protected] in advance to request time to speak, or may do so in person before the meeting with any AMATS staff member. Technical Advisory Committee (TAC) The TAC provides technical assistance to the Policy Committee throughout the planning process. The TAC is made up of planners and engineers representing communities, counties and transit providers across the Greater Akron area. The expertise of these members provides the Policy Committee with needed "nuts‐and‐bolts" insights regarding the area's projects. Citizens Involvement Committee (CIC) The CIC is the forum through which the public may weigh in directly on transportation‐related matters. Through its open‐meeting format, CIC members may freely discuss issues with AMATS staff members and other players in the region's planning process. The AMATS staff works closely with the CIC members to identify potential discussion topics and in the preparation of necessary meeting materials and the scheduling of guest speakers. The committee meets quarterly and its membership is open to all who wish to participate. Regular meetings commence at 6:30 p.m. and are usually held in the Akron‐Summit County Public Library located at 60 South High Street in downtown, which is centrally located and transit accessible in the Greater Akron area. Additional committee meetings may be scheduled by the CIC members if they so desire. Staff The AMATS staff assists all three committees and carries out the "day‐to‐day" administrative and technical work of the agency. The staff develops the area's long‐range Regional Transportation Plan (RTP) (p. 13) and the four‐year Transportation Improvement Program (TIP) (p. 15). The staff is a mix of engineers, planners and other professional disciplines. While serving as a liaison between the public and the committees of AMATS, the staff ensures that public comment is considered throughout the region's planning process. The staff welcomes verbal and written comments and strives to respond to concerns in a timely manner. You may contact the staff at 330‐375‐2436 or by email at [email protected]. You may contact individual staff members directly by referencing the Staff Directory on the AMATS web site at amatsplanning.org. Written correspondence should be addressed to: AMATS 806 CitiCenter / 146 S. High Street Akron, Ohio 44308 3 On the Web Technology developed in recent years has given AMATS new ways to reach out to the public. The Internet has created boundless opportunities for you and your friends to engage with our agency without the need to leave the comfort of your home. Along with its two web sites ‐ amatsplanning.org and Switching‐ Gears.org ‐ AMATS uses web posting and social media sites such as Twitter, Facebook and YouTube to provide citizens with up‐to‐the‐ minute information. The agency also has expanded its practice of posting announcements, meeting information and news on community‐ oriented sites such as the Summit County Community Calendar, Zvents and other appropriate venues. Below are some of the ways that AMATS is harnessing the power of the Internet. AMATSPLANNING.ORG AMATS updated its website with a re‐launch in February 2015. The reason for the updated website is to make the site even more user‐friendly than before, with a simplified menu and an emphasis on AMATS news. The website also has an updated and interactive Reports, Maps & Data page. The agency is working to show you how your tax dollars are being spent in a clear, easy‐to‐understand format, including the ability to search through AMATS‐funded projects in an interactive Transportation Improvement Program (TIP). One of the main goals of the new site has been to make it easier to inform the public about events and provide a way for the public to become more engaged and involved in the planning process. From the Home page, a user can check out dates and times for our next Policy Committee, Technical Advisory Committee (TAC), and Citizens Involvement Committee (CIC) meetings as well as take a look at the meeting mailout packets, access several recent news stories under What’s New, check out our Twitter feed, or search the entire site for a specific topic. Also accessible from the Home page is the Get Involved page via the top menu. From the Get Involved page, a user can again check the meeting calendar, review recent press releases or the most recent meeting packets, or listen to an MP3 podcast of one of our meetings. The new website will continue to make it easier for users to fill out and submit the Audience Participation Form (p. 18) to speak to the Policy Committee. SWITCHING‐GEARS.ORG This web site provides information to people on ways to take advantage of the Greater Akron area’s trails and inform them on ways to utilize cycling as a means of transportation. Switching‐Gears.org also has a calendar announcing organized bike rides and events in our region and shares bike and pedestrian count info. The website offers information about our Bike‐N‐Brainstorm program under our Initiatives page as well as tips for on‐road cycling under our Ask the Expert page. 4 Social Media Social media has fast become one of AMATS' most utilized tools for public outreach. The agency can interact with the public regarding transportation‐related topics instantaneously. Below are some of the most popular media that AMATS uses on a regular basis. • Twitter is a great online tool that lets you send messages to your followers in 140 characters or less. Stay up to date with the most relevant news in transportation and land use planning. Follow @amatsplanning on Twitter to receive tweets about the latest transportation news. • Facebook is a popular social media tool that is increasingly being used by agencies to reach new audiences and AMATS is no exception. The agency's Facebook page is updated frequently with our latest tweets and pictures of the region. It is also linked to the AMATS website where the public can get more information. • YouTube is a social media site that allows users to post videos and share them with friends. Through its channel ‐ AMATSPlanning ‐ the agency presents many special video features highlighting transportation topics. Topics range from meeting summaries to informative features. 5 New Approaches AMATS continually seeks new approaches to engage the public throughout the transportation planning process. Below are descriptions of some of the newer strategies that our agency has embraced in recent years. Public Empowerment AMATS pursues innovative public empowerment strategies that present opportunities to challenge the public beyond mere dialogue. These strategies actively urge the public to tackle transportation issues directly through participation in unique events. Generally, these events entail a topic‐specific activity geared to spur dialogue between participants and area policy makers. Following participation in a group endeavor, participants share their ideas and insights gained through firsthand experiences as to what can be done to improve accessibility and livability in a particular locale. Below are several examples used by the agency: • Active Transportation Conferences ‐ AMATS hosts conferences dedicated to transportation‐related topics designed to provoke discussions between policy makers and the public. The intent of the conferences are to help communities address and identify needs that policymakers may have overlooked. These conferences are daylong events with featured speakers and breakout sessions. • Better Block ‐ Better Block encourages the public to take one neighborhood block at a time, start small, and actually do something. It could be setting up new temporary bike lanes; it could be makeshift street art or furniture; it could be a coffee shop, art gallery or beer garden for a brief period of time. These events help the public experience something new in their neighborhoods by letting them see it, live it and ‐ perhaps most importantly – participate in actually creating it. • Bike‐N‐Brainstorms ‐ These events embark on a group bike ride along key corridors as an alternative way to get feedback about on‐road biking. At the end of their ride, group members participate in a brainstorming session with agency personnel and local officials to share their ideas as to what can be done to improve bike travel within the area. • Jane's Walk ‐ Inspired by pioneering author and urban activist, Jane Jacobs, these events provide opportunities for people to engage in city planning by meeting and exploring cities through short walking tours. During these tours, participants discuss what can be done to make areas more pedestrian friendly. The agency also welcomes invitations and suggestions from the public to participate and support community‐oriented events benefitting the area's transportation systems. 6 Community Outreach As part of its efforts to fashion a vibrant, livable Greater Akron area, AMATS frequently partners with various civic groups on a host of projects. Among the agency's past partners have been the Barberton Community Foundation, The Knight Foundation, Leadership Akron, Neighborhood Development Services and Torchbearers. AMATS welcomes opportunities to work with new partners in appropriate community‐oriented endeavors. Those interested in seeking the agency's involvement should contact AMATS at [email protected] or at 330‐375‐2436. Speakers' Bureau AMATS staff members are available by appointment to discuss technical and policy information with citizens and other interested parties during and outside of the agency's normal business hours. Staffers are also available by appointment to present technical and policy information to the public and to participate in a variety of forums such as panel discussions. Individuals and groups can request a speaker by contacting AMATS at [email protected] or at 330‐375‐2436. Requests should be transmitted via the agency's public information coordinator. Public Information As part of our efforts to provide the region with a transparent planning process, AMATS goes beyond merely accommodating requests for public information ‐ which we will gladly do! The agency disseminates all meeting materials one week prior to scheduled committee meeting dates via email and through postings on its web site ‐ amatsplanning.org. The public is welcome to subscribe to these electronic mailings. All that's needed for a subscription to AMATS is a subscriber's name and their email address. Postal delivery of materials may be arranged by special request at no charge to recipients. Many materials, such as our current and past reports, plans and studies are available for review and download on the agency web site. Please note that selected draft and interim materials may be available for viewing and downloading only for specified times, such as public comment periods. Records of committee meetings are available in the form of minutes and MP3 podcasts on the agency web site. AMATS will gladly forward pdf or printed versions of committee minutes to the public via email or postal delivery upon request. The agency also offers a podcast subscriber service in which committee recordings can be automatically downloaded to your computer as soon as they become available. In addition, AMATS regularly distributes press releases and other information to Greater Akron area media regarding transportation‐related events and developments. The agency also provides a free annual report and a semi‐annual newsletter to committee members, the media, and subscribers. Other 7 information and services such as traffic data, project status information, accident data and more are readily available on the agency web site. The staff is available to answer questions regarding information that is not readily available on the site. 8 Unique Populations AMATS strives to involve low‐income and minority groups in the public participation process for the Greater Akron area. The agency recognizes where these groups are located within the region (p. 10 and p. 11) and seeks their involvement throughout the planning process using a mix of outreach strategies involving advertisements, community groups, press releases, social media and other available means. The aforementioned Public Empowerment strategies, such as Better Block and Bike‐N‐Brainstorms, (p. 6) present valuable opportunities for the agency and members of these populations to coordinate, network and organize activities with direct participation and firsthand experiences given the targeted neighborhood scale of many of these events. The region is also witnessing growth in its Asian and Hispanic populations. These populations have unique interests and needs which will contribute to and influence the area's transportation policies and systems. AMATS recognizes this and strives to foster a dialogue with these and other diverse communities within the area. Recently, the agency has increased its outreach efforts to these populations by initiating a dialogue with various organizations including: • the Akron Urban League • Asian Services in Action, Inc. • the International Institute of Akron • the Ohio Latino Affairs Commission • and other community and neighborhood groups. The agency actively pursues opportunities to collaborate on the development of transportation‐related programs and projects with representatives of these populations. Long an adherent to the spirit and wording of both Title VI of the landmark Civil Rights Act of 1964 and Executive Order 12898, the agency will broaden and continue its outreach to the region's many varied communities and populations. Special Needs The agency prides itself on its ongoing efforts to meet and exceed the standards outlined in the Americans with Disabilities Act of 1990. AMATS will make every effort to arrange for translation, sign language and other special assistance at meetings for individuals with special needs who request them at least three business days beforehand. In addition, our agency web site ‐ amatsplanning.org ‐ includes a link to language interpretation software to assist those for whom English is not the first language. The AMATS Title VI Plan outlines other steps to include limited‐English proficient persons in the planning process. 9 ½ K ( n & % Û ? þ ? Ü ? ¸ ? ( i & % ÷ ? ß ? ´ ? ÷ ? ÷ ? ( n & % Ã ? $ f " Ï! !? $ e " Ñ ? ü ? Û ? $ f " ! ² ? ÷ ? $ f " ! ² ? ² ? É ? ( i & % ü ? Ü ? $ e " ! Û ? Ï ? Á ? ê ? ê ? Á ? ? Ü q ? Í ? q ? $ d " ! Ã ? Å ? Ï ? $ d " ! Í ? $ e " ! É ? ÷ ? þ ? ê ? Ö ? Û ? q ? f ? º! K $ d " Ï ? º K º K º K ( k & % Ü ? b ? Ï ? ³ ? { ? ª ? ª ? b ? ` ? è ? { ? 5 $ e " ! a ? 1.6 - 22.8 22.9 - 45.6 February 2015 ÿ ? É ? PERCENT LOW INCOME POPULATION BY CENSUS TRACT ³ ? a ? ÷ ? 0 1 2 3 4 Miles 45.7 - 87.2 ½ K ( n & % Û ? þ ? Ü ? ¸ ? ( i & % ÷ ? ß ? ´ ? ÷ ? ÷ ? ( n & % Ã ? $ f " Ï! !? $ e " Ñ ? ü ? Û ? $ f " ! ² ? ÷ ? $ f " ! ² ? ² ? É ? ( i & % ü ? Ü ? $ e " ! Û ? Ï ? Á ? ê ? ê ? Á ? ? Ü q ? Í ? q ? $ d " ! Ã ? Å ? Ï ? $ d " ! Í ? $ e " ! É ? ÷ ? þ ? ê ? Ö ? Û ? q ? f ? º! K $ d " Ï ? º K º K º K ( k & % Ü ? b ? PERCENT MINORITIES BY CENSUS TRACT ³ ? a ? Ï ? ³ ? { ? ª ? ª ? b ? ` ? è ? { ? 5 $ e " ! a ? 0.0 - 16.4 16.5 - 32.8 February 2015 ÿ ? 0 1 2 ÷ ? 3 4 Miles 32.9 - 98.8 É ? Conclusion Our agency aims to be as open as possible when it come to sharing information and explaining why and how transportation decisions are made in the Greater Akron area. Our Public Participation Plan or "3P" is intended to appeal to as many different interested people through a mix of opportunities and strategies both digital and personal. AMATS will continue to explore new opportunities for public outreach as they become available. Outreach can be challenging and our agency is committed to receiving as much feedback as possible. 12 Appendix A ‐ Regional Transportation Plan (RTP) A primary responsibility of AMATS is to prepare and maintain a long‐term Regional Transportation Plan (RTP) that meets the travel needs of the region. The RTP creates a framework for the region’s transportation system through the identification of needs and project recommendations. It also sets the direction for transportation decisions, policy and planning throughout the region. Public participation is an integral part of preparing the RTP. This is your chance for your voice to be heard! Comments received during the review of the Draft RTP will be presented to the Policy Committee and other stakeholder planning agencies for consideration before final adoption of the RTP by the Policy Committee. Once a Draft RTP has been created, AMATS will: • Make copies of the draft available to the public at: o AMATS website – amatsplanning.org o AMATS office • Tweet on @amatsplanning • Post on facebook.com/amatsplanning • Schedule at least one public meeting for review and comment • Place advertisements in newspapers including the Akron Beacon Journal, the Record‐Courier and The Reporter and other publications deemed as appropriate by the AMATS staff. • Send news releases • Regularly maintain and update its lists of those interested parties and transportation stakeholders that receive information pertaining to the area's transportation planning process. Please note that AMATS will not limit itself to the activities identified above to promote awareness of the Draft RTP and will actively pursue additional opportunities to do so. Amending the Plan Periodically, local or state officials request that the approved RTP be modified, or that a project recommendation be added or dropped. Such requests will be identified as either a major or minor amendment. The individual amendment determines which public involvement procedure is appropriate. • Major Amendments If the amendment involves a project recommendation that includes a new interchange; a new roadway or lane addition greater than one mile in length; a new major public transit project; commuter rail; or has a significant impact on air quality, then it will be considered a major amendment and public involvement for the amendment will follow the same procedures as the Draft RTP. 13 • Minor Amendments If the amendment does not include a project such as one previously mentioned, it will be considered a minor amendment. Such amendments will be available for public consideration and comment through the appropriate Meeting Packet link and the Get Involved page of the agency website ‐ amatsplanning.org ‐ prior to Policy Committee action. If adopted by the Policy Committee, amendments will be included in the RTP and will be posted on the website. 14 Appendix B ‐ Transportation Improvement Program (TIP) The Transportation Improvement Program (TIP) is the Greater Akron area's four‐year program of highway, public transit, and bicycle and pedestrian projects. It must be consistent with the Regional Transportation Plan (RTP). Through the TIP process, projects are scored and selected, providing funding for area transportation projects. Public participation is necessary in the development of a sound TIP for the area. Comments generated during the review of the Draft TIP will be presented to the Policy Committee and other stakeholder planning agencies for consideration before adoption of the Final TIP document by the Policy Committee. Once a Draft TIP has been created, AMATS will: • Make copies of the draft available to the public at: o AMATS website – amatsplanning.org o AMATS office • Tweet on @amatsplanning • Post on facebook.com/amatsplanning • Schedule at least one public meeting for review and comment • Place advertisements in newspapers including the Akron Beacon Journal, the Record‐Courier and The Reporter and other publications deemed as appropriate by the AMATS staff. • Send news releases • Regularly maintain and update its lists of those interested parties and transportation stakeholders that receive information pertaining to the area's transportation planning process. Please note that AMATS will not limit itself to the activities identified above to promote awareness of the Draft TIP and will actively pursue additional opportunities to do so. Amending the TIP Periodically, state or local officials request that a project in the approved TIP be modified or cancelled or that a new project be added. Such requests will be identified as either a major or minor amendment. The individual amendment determines which public involvement procedure is appropriate. • Major Amendments If the amendment involves a project that includes a new interchange; a new roadway or lane addition greater than one mile in length; a new major public transit project; commuter rail; or has a significant impact on air quality, then it will be considered a major amendment and public involvement for the amendment will follow the same procedures as the Draft TIP. 15 • Minor Amendments If the amendment does not include a project such as one previously mentioned, it will be considered a minor amendment. Such amendments will be available for public consideration and comment through the appropriate Meeting Packet link and the Get Involved page of the agency website ‐ amatsplanning.org ‐ prior to Policy Committee action. If adopted by the Policy Committee, amendments will be included in the TIP and will be posted on the website. 16 Appendix C ‐ Involvement of Interested Parties and Public Comment The 2015 Public Participation Plan or "3P" describes AMATS' ongoing efforts to engage and involve the public in the metropolitan transportation planning process for the Greater Akron area. 3P is an update to the 2012 Public Participation Plan and will be an input into the upcoming Regional Transportation Plan (RTP) and Transportation Improvement Program (TIP). In developing 3P, AMATS is actively seeking consultation with interested parties and communities. Our agency seeks to develop a policy document that engages the public and other private and public organizations by providing ample opportunities for input and involvement in the area's planning process. It is our goal to base 3P on the insights of the area's citizens, community groups, affected public agencies and representatives of public transportation, freight shipping and pedestrian and bicycle transportation. The Draft 3P details how the agency will provide opportunities for public comment and involvement throughout the planning process and for its most significant products, the RTP and TIP. These opportunities include posting committee meeting packets and MP3 podcasts on the AMATS website and using social media tools and non‐traditional meetings and strategies to reach out to new audiences and communities. AMATS will continue to give special consideration to making all of its public meetings convenient and accessible. Meetings of the AMATS Citizens Involvement Committee are scheduled in the evenings and in central locations. Also, all materials, plans and information can be accessed 24 hours a day on the AMATS website ‐ amatsplanning.org. Additional review and involvement opportunities are provided during the development of the RTP and the TIP. The Draft 3P was available for public comment beginning on February 11, 2015. No comments were received during the comment period. AMATS is continually seeking new ways to engage and involve the public and other agencies. As new opportunities arise, they will be incorporated into the transportation planning process. The 3P will be updated accordingly. The public is encouraged to forward their opinions and suggestions regarding this document to AMATS Public Information Coordinator Kerry Prater via email at [email protected] or postal mail at the following address: Mr. Kerry Prater AMATS 806 Citicenter / 146 S. High Street Akron, Ohio 44308 17 Audience Participation Form The Policy Committee welcomes your comments. Please keep these guidelines in mind: Please register by completing the application below. Public comments will be limited to three (3) minutes per person at the beginning of the meeting. Groups wishing to address the Policy Committee should select a representative to present the group’s position. Please submit this form to a staff member prior to the meeting. Forms may also be completed online, faxed, or mailed. Akron Metropolitan Area Transportation Study 806 CitiCenter | 146 S High Street | Akron, Ohio 44308 Phone: 330-375-2436 | Fax: 330-375-2275 Web: amatsplanning.org/get-involved/ Name: Date: Representing (optional): Topic: Address: Telephone #: Email: Would you like to receive meeting material by email? Attachment 5B AKRON METROPOLITAN AREA TRANSPORTATION STUDY MEMORANDUM TO: Policy Committee Technical Advisory Committee Citizens Involvement Committee FROM: AMATS Staff RE: Adopting the AMATS Planning Data Forecast DATE: March 12, 2015 Background Periodically, AMATS undertakes a comprehensive data gathering process as part of its longrange planning effort. Data is collected for 35 different variables, each of which has some level of direct impact on local traffic patterns. Among these variables are population, employment, income, number of vehicles and other important transportation-related variables. Once these data items have been collected for the base year of 2010, AMATS uses various methodologies to forecast each variable to the plan year of 2040. Once forecasted, the data is distributed accordingly among each of the 835 traffic analysis zones that comprise the AMATS region. The AMATS Planning Data Forecast is the formal report in which these forecasted variables and underlying methodologies are presented to the public. After an in-depth background on each variable, the 2010 and 2040 data are presented at different geographic levels: • • • • The AMATS region The county level Select larger cities 8 subareas, grouped by geographic proximity and similarity The data resulting from the AMATS Planning Data Forecast process is used in two primary ways: 1) it is directly entered into the regional traffic model, and used to generate long-term traffic volume, congestion and air quality planning information, and 2) to gain planning insight into the potential future of our region, given that recent trends hold true through 2040. A motion for approval is requested. The staff recommends approval. AMATS 2040 Planning Data Forecast March 2015 1 Table of Contents Executive Summary....................................................................................................................................... 3 Introduction .................................................................................................................................................. 3 A Note on the Interpretation of Projections................................................................................................. 5 Part I: Population-Based Variables ............................................................................................................... 6 Population ........................................................................................................................................ 6 Households ...................................................................................................................................... 8 Population Under 18 ........................................................................................................................ 9 Number of Vehicles.......................................................................................................................... 9 Number of Workers ....................................................................................................................... 10 Part II: Employment-Based Variables ......................................................................................................... 11 Employment ................................................................................................................................... 11 Part III: Stand-Alone Variables .................................................................................................................... 13 School Enrollment (K-12) ............................................................................................................... 13 Group Quarters .............................................................................................................................. 14 Hotel Rooms................................................................................................................................... 15 Median Household Income ............................................................................................................ 16 Part IV: Forecast Results ............................................................................................................................. 17 Map: 2040 Planning Data Forecast Subareas ................................................................................ 18 Data Forecast Tables ...................................................................................................................... 19 Conclusion ................................................................................................................................................... 33 2 Executive Summary Overall, the AMATS region is expected to experience a slight decline in population (-3.8%) between now and 2040. Conversely, the region’s employment is expected to see moderate growth (14.1%) over this same planning period. Summit and Portage counties are expected to hold to these same trends, with the exception that Portage County is expected to see significant employment growth (36.7% through 2040). The rate of growth or decline is often more pronounced at the municipality level, as fluctuations in the historic data tend to cause large swings in long-range forecasts. To moderate these large swings in forecasted data, aggregating the forecasted results of communities within the same geographic area leads to results that appear more in line with recent rates of growth or decline. Through 2040, population growth should be the strongest in the northern portion of Summit County (17.5%) and Northwest Portage County (5.4%). Employment growth is expected to be strongest in Southern Summit County (53.5%). Solid employment growth is also expected throughout Portage County. The geographic area of the Wayne County portion of the AMATS region has doubled since previous versions of the Planning Data Forecast, with the inclusion of the City of Rittman and neighboring Milton Township in 2010. On the whole, the Wayne County portion should expect slight population growth (3.1%) and a moderate decline in overall employment (-22.1%) through 2040. The public school enrollment in the Wayne County communities is expected to be the largest in the AMATS region, growing 17.5% over the planning period. Introduction One of the most fundamental steps in the regional transportation planning process is the collection, organization and analysis of existing planning-related data. Using this data, the Akron Metropolitan Area Transportation Study (AMATS) can determine where we have been (from a social-economic standpoint), the greater Akron region’s current conditions, and perhaps most critical to any planning effort, in what direction we are heading. Although the most commonly used data items (ex. population or employment data) are gathered and analyzed on an ongoing basis, a greatly expanded effort is undertaken in preparation for each upcoming long-range regional transportation plan. For this reason, the AMATS 2040 Planning Data Forecast has been completed as a necessary precursor to the upcoming long-range plan, Transportation Outlook 2040. In addition to the long-range plan, this data is used for forecasting traffic volumes, which in turn are used for traffic congestion studies, air quality planning and in roadway design efforts. Two key time periods are examined during the planning data forecast process: the base year of 2010 and the planning period year of 2040. 2010 data generally comes from either the most recent U.S. census or from American Community Survey (ACS) data – both of which are produced by the U.S. Census 3 Bureau. Using a variety of established methodologies, this 2010 data is forecasted out to the plan year of 2040. Projection methodologies vary depending on the nature of each variable, and each will be fully detailed in its respective section of this report. The AMATS 2040 Planning Data Forecast projects 35 variables, each of which has a direct impact on local traffic and is therefore required for input into the regional traffic demand model. These variables include: Population Households Population Under 18 Vehicles Workers Employment (25 categories) Public School Enrollment (K-12) Private School Enrollment (K-12) Group Quarters Hotel Rooms Median Household Income The AMATS region is divided into 835 traffic analysis zones (traffic zones or TAZ). These traffic zones are used by the regional traffic demand model to generate traffic volumes and to determine where trips begin and end. The model requires that each of the 35 variables be provided for each traffic zone – for the base year 2010 and plan year 2040. The two exceptions to the distribution of data by traffic zone are the City of Rittman and Milton Township in the Wayne County portion of the AMATS region. As a result of the 2010 census, these two communities were added to the Akron metropolitan area – the first expansion of the AMATS region’s geographical footprint since 1978. However, the elongated protrusion that these communities add to the AMATS region’s footprint forms a shape that does not work well with the algorithms used by the regional traffic demand model. For this reason, traffic zones have not been assigned to these communities, and TAZ-level data is unavailable. The AMATS 2040 Planning Data Forecast places the 35 planning variables into three categories: population-based, employment-based and stand-alone variables. For each variable, this report will explain the sources of the underlying data and the methodology used to generate 2040 forecasts. In Part IV of this report, the data representing each of the 35 planning variables will be presented by subarea. 4 A Note on the Interpretation of Projections Although AMATS makes its best attempt to project future data based on recent historic trends, there is no “crystal ball” to perfectly ascertain future growth. Every attempt has been taken to incorporate data from the most reliable data sources into the analyses contained within this report. With a long, 25 year time horizon, even minor fluctuations in any given historic year can significantly affect the expected future outcome at the individual community level. Major fluctuations can dramatically alter the projected totals. To smooth out these data fluctuations, as well as to resolve problems of redundancy (i.e. where census tracts or TAZs include portions of more than one municipality), AMATS has aggregated TAZ-level data for every variable - into eight different subareas. These subareas reflect the shared growth characteristics of the political units within the same geographic area. In addition, data has been presented at the regional and county levels, as well as for three specific larger cities: Akron, Barberton and Cuyahoga Falls. The data from these three communities is not included in the subarea data. The following is a breakdown of the levels in which data has been presented for this analysis: Forecasting Levels Breakdown Northern Summit Central Summit Southern Summit REGIONAL AMATS Region COUNTY Summit County, Portage County SELECT CITIES Akron, Barberton, Cuyahoga Falls SUBAREAS Boston Heights, Boston Twp, Hudson, Macedonia, Northfield Village, Northfield Center Twp, Peninsula, Reminderville, Richfield Village, Richfield Twp, Sagamore Hills, Twinsburg, Twinsburg Twp Bath Twp, Copley Twp, Fairlawn, Munroe Falls, Silver Lake, Stow, Tallmadge Clinton, Coventry Twp, Green, Lakemore, Mogadore, New Franklin, Norton, Springfield Twp Aurora, Mantua Village, Mantua Twp, Shalersville Twp, Streetsboro, Northwest Portage Sugar Bush Knolls Northeast Portage Freedom Twp, Garrettsville, Hiram Village, Hiram Twp, Nelson Twp, Windham Village, Windham Twp Brady Lake, Brimfield Twp, Franklin Twp, Kent, Mogadore (Portage), Southwest Portage Randolph Twp, Ravenna, Ravenna Twp, Rootstown Twp, Suffield Twp, Tallmadge (Portage) Atwater Twp, Charlestown Twp, Deerfield Twp, Edinburg Twp, Southeast Portage Palmyra Twp, Paris Twp Wayne Portion Chippewa Twp, Doylestown, Milton Twp, Norton (Wayne), Rittman 5 While performing the various data analyses required for the Planning Data Forecast, AMATS generally allows historic data points to paint the picture of what may be expected in 2040. The direct intervention and alteration of data has been used on a limited basis, and only in the most egregious circumstances (a negative future population, employment losses of greater than 90%, etc.). One final point to those who may be concerned about the under or over-performance of a certain subarea or city in regards to one or more variables: in adherence to the AMATS “Fix-it-First” policy, project selections are not based solely on projected variables and future congestion. A community faces no threat of reduced project consideration or funding based on the results of these analyses. Therefore, the 2040 projections contained within should not be interpreted as inevitable future results. Rather, they should be looked at as a potential future outcome should recent growth trends persist. Part I: Population-Based Variables Population Data Sources To analyze the AMATS region’s population growth over the 25 year planning horizon, three primary data sources were used: • • • County-level 2040 population projections provided by the Ohio Development Services Agency Historic data (2000-2012) gathered from the U.S. Census Bureau and its American Community Survey (ACS) data The American Association of State Highway and Transportation Officials’ (AASHTO) Census Transportation Planning Products (CTPP) data Methodology As an input into the upcoming long-range regional transportation plan, the AMATS Planning Data Forecast has forecasted the AMATS region’s population to the year 2040, using a base year of 2010. 2010 data was selected as the base year because of its being the most recent decennial census, and therefore, not only is a wealth of data available, but that data is considered highly reliable. To begin the process, AMATS acquired county-level 2040 projections independently calculated by the Ohio Development Services Agency (ODSA). These figures served as control totals – meaning that all internal analyses at a more focused level must eventually arrive at these totals. AMATS’ primary task is to allocate these county-level population totals between the subareas that comprise the region, and at an even more detailed level, among the region’s 835 TAZs. 6 2010 population totals come directly from the U.S. Census Bureau data. To project 2040 populations, the annual populations were gathered for every municipality and township in the AMATS area for the years 2000 through 2012 (the most recently available at the time of the analysis). Using these past population totals as data points, a liner regression analysis was performed for each community to project its population through 2040. Based on its proportional total of the projected county population, the initial 2040 projection for each community was adjusted to fit with the ODSA control totals, and then aggregated into the appropriate subarea. Using these 2040 projections, a 2010-2040 growth rate could be calculated for each geographic area, as presented in Part IV of this report. TAZ level data is an important input into the regional traffic model. AASHTO’s CTPP data was used to gather 2010 population data at the TAZ level. After determining the community-level anticipated growth rate, the community growth rate was applied to the 2010 population for each TAZ to derive the 2040 population data by TAZ. Once again, this data was smoothed out based on its relative proportion so that totals were consistent with ODSA county-level control totals. Key Observations • Holding true to similar recent population observations, the AMATS region is expected to experience a slight population decline (-3.8%) over the 25 year period between 2010 and 2040 • Summit and Portage Counties are expected to see similar, slight population declines (-3.4% and -6.0%, respectively) over the planning period, whereas the Wayne County portion could experience a slight growth (3.1%) in its population • The larger cities that comprise the historical population core of our region - Akron, Barberton, Cuyahoga Falls, Kent and Ravenna (in the Southwest Portage subarea) - are all expected to lose population to some extent • The greatest population growth is expected in the extreme northern portion of the region. One impetus for this growth is likely due to the convenient location between two metropolitan regions – Akron and Cleveland – that these municipalities offer their residents 7 Households Data Sources To project the number of households anticipated by 2040 in the AMATS region, two primary data sources were used: • • 2010 American Community Survey (ACS) data The American Association of State Highway and Transportation Officials’ (AASHTO) Census Transportation Planning Products (CTPP) data Methodology According to the U.S. Census Bureau, a household is defined as a group of people who occupy a housing unit as their usual place of residence. The number of households within an area has a direct impact on local traffic volumes, and is therefore an important input into the regional traffic demand model. AASHTO’s CTPP data source provided the 2010 number of households data at the TAZ level. Since TAZs do not always follow political unit boundaries, they may include more than one community. To double check the accuracy of 2010 household data, AMATS gathered the “number of households” data at the community level from the Census Bureau’s ACS website, so that it could be cross-checked with CTPP data and serve as a control total. Any discrepancies were smoothed by reallocating households according to that TAZ’s proportional share within each community. Once the 2010 number of households was calculated for each AMATS community and TAZ, the 2040 projection process could begin. The previously calculated 2010 population by TAZ was divided by the 2010 number of households to determine the average household size for each TAZ. Next, the 2040 projected population by TAZ was divided by its average household size (average household size was assumed to remain constant through 2040) to determine the number of households in 2040. Finally, these households were aggregated into their appropriate geographic subareas. Key Observation • Due to the underlying methodology, the growth or decline of a subarea’s number of households generally follows its population growth. The only example of forecasted households moving inversely with population growth is in the Southern Summit County subarea (-4.4%) 8 Population Under 18 Data Sources To forecast the population under the age of 18 expected by 2040 in the AMATS region, two primary data sources were used: • • The American Association of State Highway and Transportation Officials’ (AASHTO) Census Transportation Planning Products (CTPP) data Previously calculated 2040 population by TAZ figures, which were based on Census and ACS data Methodology CTPP data provided the raw numbers for the 2010 population in each TAZ that was under the age of 18 – a necessary input into the regional traffic model. Using the total 2010 population for each TAZ, the percentage of each TAZ’s under 18 population was calculated. Assuming that the percentage of under 18 population would remain constant through 2040, the 2010 rate was multiplied by the previously calculated 2040 forecasted total population by TAZ to determine the 2040 under 18 population for each TAZ. The TAZ-level data was then aggregated into the appropriate subareas. Key Observation • Because of the underlying methodology, the forecasted populations for those under the age of 18 are positively correlated with the overall population rate of growth/decline over the planning period Number of Vehicles Data Sources To forecast the number of household-based (i.e. non-commercial) vehicles expected by 2040 in the AMATS region, two primary data sources were used: • • The American Association of State Highway and Transportation Officials’ (AASHTO) Census Transportation Planning Products (CTPP) data Previously calculated 2040 number of households by TAZ figures, which were based on Census and ACS data Methodology CTPP data provided the raw numbers for the number of household-based vehicles by TAZ in 2010, which is an important input into the regional traffic model. For each TAZ, this number of vehicles was divided by the 2010 number of households (also using CTPP data) to determine a rate for the number of vehicles per household. It was assumed that the number of vehicles per household rate would remain constant through 2040, so the rate was multiplied by the previously calculated 2040 number of households by 9 TAZ to derive an expected number of 2040 vehicles for each TAZ. Similar to all other variables, TAZ-level data was then aggregated into the appropriate subareas. Key Observation • Because of the underlying methodology, the forecasted number of vehicles in each TAZ is tied very closely with the overall population rate of growth/decline over the planning period. The only exception is the Southern Summit County subarea, where the number of vehicles is projected to decline slightly, despite anticipated population growth Number of Workers Data Sources To project the number of workers expected by 2040 in the AMATS region, two primary data sources were used: • • The American Association of State Highway and Transportation Officials’ (AASHTO) Census Transportation Planning Products (CTPP) data Previously calculated 2010 and 2040 population by TAZ figures Methodology The Census Bureau defines workers as people who reside within a community, are 16 years or older and who did any work for pay. Workers may be employed in a community other than the one in which they live. CTPP data provided the raw numbers of workers by TAZ in 2010. For each TAZ, the 2010 number of workers was divided by the 2010 total population of the TAZ to determine the percentage of the population within that TAZ that could be classified as “workers”. Assuming that this rate would hold steady through 2040, this 2010 rate of workers per TAZ was multiplied by the previously calculated 2040 population by TAZ to determine the number of workers in each TAZ in 2040. This TAZ-level data was then aggregated into the appropriate subareas. Key Observation • As is the case for most of the other population-based variables, the number of 2040 workers is closely related to the overall population growth rate, due to the underlying methodology. Again, the sole exception is the Southern Summit County subarea 10 Part II: Employment-Based Variables Employment Data Sources To analyze the AMATS region’s employment growth over the 25 year planning horizon, the following data sources were used: • • • The U.S. Census Bureau’s interactive “On the Map” tool, which provided 2002 – 2011 (the most recently available at time of analysis) historic employment by industry for every census tract The American Community Survey’s (ACS) “American Fact Finder” tool The American Association of State Highway and Transportation Officials’ (AASHTO) Census Transportation Planning Products (CTPP) data Methodology As an input into the upcoming long-range regional transportation plan, AMATS has forecasted the region’s employment to the year 2040, using a base year of 2010. 2010 data was selected as the base year because of its being the most recent decennial census, and therefore, not only is a wealth of data available, but that data is considered highly reliable. The first step in the process was gathering recent historic employment data, by industry. Various sources have been used for this data in previous versions of the AMATS Planning Data Forecast, but due to previous issues regarding errors and the validity of the data, a new primary source was used for the current analysis. The U.S. Census Bureau’s “On the Map” tool was used to gather employment data for the years 2002 through 2011. This data was collected for every census tract within the AMATS area, and was pulled for each of the 25 available industries. Employment industry data is differentiated by its North American Industry Classification System (NAICS) code, as identified in the following table: 11 NAICS Industry Codes Code # NAICS 11 NAICS 21 NAICS 22 NAICS 23 NAICS 31-33 NAICS 42 NAICS 44-45 NAICS 48-49 NAICS 51 NAICS 52 NAICS 53 NAICS 54 NAICS 55 NAICS 56 NAICS 61 NAICS 62 NAICS 71 NAICS 72 NAICS 81 NAICS 92 NAICS 99 Industry Description Agriculture, Forestry and Hunting Mining Utilities Construction Manufacturing - Aggregated Wholesale Trade Retail Trade - Aggregated Transportation and Warehousing - Aggregated Information Finance and Insurance Real Estate and Rental and Leasing Professional Scientific and Technical Services Management of Companies and Enterprises Administrative Support, Waste Management and Remediation Services Education Services Health Care and Social Assistance Arts, Entertainment and Recreation Accommodation and Food Services Other Services (except Public Administration) Public Administration Other* *Note – the source provided no data for the NAICS 99 “Other” category. The number of jobs within this industry code has typically been negligible in previous analyses. After gathering annual employment totals for each industry, by census tract, a linear regression analysis was performed to forecast data through the year 2040. Typically, one census tract includes multiple traffic zones. To determine employment by industry at the TAZ level, the proportion of employment was calculated for each TAZ (using CTPP data), and the census tract employment numbers were distributed based on this proportion. As mentioned in the introduction, large changes in recent historic data tended to create enormous changes in the projected values – some of which were determined to be unreasonable. An example might include a single large factory closure causing a reduction of 600 manufacturing employees in a census tract in the calendar year 2008. This recent decrease alone could create a “trend line” that would predict a sharp overall reduction in manufacturing jobs – and sometimes even negative employment – by 2040. The most severe of these instances were smoothed using a variety of techniques. Typically this involved looking at employment estimates from another source and substituting “outlier” data with something more in line with recent history. There are cases where future employment is dramatically higher or lower in 2040 (see: Portage County/Kent’s 2040 “Education Services” data). In most of these 12 cases, we opted to not intervene and let recent trends and speak for themselves. AMATS only intervened in the most egregious of cases (i.e. dramatic employment loss or forecasts that resulted in sub-zero 2040 totals). Once employment was calculated and distributed by TAZ, the totals were aggregated by subarea. The final employment projections may be found in Part IV of this report. Key Observations • In the majority of subareas, the employment picture looks significantly rosier than the population growth projections • The AMATS region is expected to see steady job growth. When coupled with anticipated population decline, this indicates that the region could be a significant importer of workers by 2040 • Both Summit and Portage Counties are likely to experience strong employment growth (10.2% and 36.7%, respectively) over the 25 year period, whereas the Wayne County portion could experience a slight decline in employment (-22.1%) over the same period Part III: Stand-Alone Variables School Enrollment (K-12) Data Sources The State of Ohio publishes comprehensive enrollment reports for both public and private schools. To forecast the number of students expected in 2040, the following sources were used: • • • • Ohio Department of Education 2010 public and non-public school enrollment reports U.S. Census Bureau – population under age 18 by community The American Association of State Highway and Transportation Officials’ (AASHTO) Census Transportation Planning Products (CTPP) data Various school and board of education websites for verification purposes Methodology AMATS analyzes K-12 student enrollment as two separate variables: private and public school enrollment. To begin the data forecasting process, 2010 enrollment data was gathered using reports published by the Ohio Department of Education. The street address for each school was determined and overlayed with the AMATS traffic zones in GIS to allocate enrolled students by TAZ. 13 Many school districts in the region are in the midst of closing, consolidating and/or constructing new school facilities. Research was completed to determine which schools were affected, and how best to re-allocate 2010 students to these new facilities. The analysis only included changes that had been completed or were imminent as of 2014, and assumed all other buildings would remain unchanged through 2040. Public school open enrollment is difficult to track and was presumed to be a minor factor, and therefore omitted from this analysis. Public School Forecast Once 2010 data had been established for public schools, each school building’s enrollment was multiplied its corresponding community’s “under age 18” growth rate between 2010 and 2040, using Census and CTPP data. This resulted in a 2040 enrollment figure at the TAZ level. The TAZ level data was then aggregated and presented at the subarea level. Private School Forecast Private schools typically draw students from a wide geographic area and are not subject to school district boundaries, so rather than using the local community’s growth rate, an average national rate provided by the National Center for Education Statistics was used, and presumed to hold steady through 2040. The 2010 enrollment total for each private school in the AMATS area was multiplied by this national rate (-1.23%) to determine a 2040 enrollment estimate. Key Observations • Private school enrollment is expected to remain virtually unchanged, with an expected 1.2% decrease over the 25 year planning period • Public schools at the regional and county levels will likely experience slight decreases over the planning period • At the city and subarea levels, school enrollment varies widely, and appears to function independently of the area’s overall population growth rate Group Quarters Data Sources To project the number of residents living in group quarters by 2040, the following data sources were used: • • The American Community Survey’s (ACS) “American Fact Finder” tool Various institutional websites and reports for resident count and verification purposes 14 Methodology Group quarters include college dormitories, jails and similar detention centers, and nursing homes. 2010 data was not available at the TAZ level, so it had to be manually calculated. As a first step, ACS data was utilized to determine the number of people residing in group quarters as of 2010 by census tract. Most census tracts contain multiple traffic zones, so the total number of residents within each tract needed apportioned to the traffic zones within that tract. To accomplish this, aerial photos and online mapping programs were used to identify all group quarters facilities, which were then overlayed in GIS to determine which TAZ the facility fell in. Using university student housing reports, inmate population reports and nursing home websites, the populations were distributed among the traffic zones. If a tract contained a group quarters population (usually very small ones) and no group quarters facility could be identified, the total census tract population was divided evenly among all traffic zones within the tract. Since group quarters populations are not related to the surrounding local community (i.e. students, inmates and nursing home residents may come from anywhere), the 2010 group quarters population was simply multiplied by the AMATS region’s general 2010-2040 growth rate (-3.8%) to determine each TAZ’s 2040 group quarters population. These populations were then aggregated into the appropriate subareas. Key Observations • As would be expected, traffic zones in university areas (Kent State, University of Akron, Hiram College, etc.) and where prisons are found (Akron, Shalersville Twp) have significant populations living in group quarters • Nursing homes are distributed evenly throughout the AMATS area, many of which house significant group quarters populations Hotel Rooms Data Sources To forecast the number of hotel room available in the AMATS region by 2040, the following data sources were used: • • Various hotel and travel industry websites to identify hotels and their room inventories Press releases regarding planned and/or pending hotel construction Methodology AMATS conducted research to identify every hotel in the region, as well as to determine the total number of rooms at each of these hotels – a required input into the regional traffic demand model. Once hotels and their addresses were identified, they were overlayed in GIS to determine which traffic zone housed each hotel. All hotels and room inventories existing as of 2010 were assumed to exist unchanged through 2040. 15 In addition to existing hotels, hotels that were under construction or in the planning phases were included in the 2040 totals. Examples include the major hotel under construction in downtown Akron’s Northside neighborhood and a proposed convention center hotel near Greystone Hall, also in downtown Akron. Finally, AMATS added rooms (based on the average number of rooms in recently completed hotel projects) to certain high-growth traffic zones in which future hotel development seems likely. These areas include: • • • • Boston Heights – planned development area in the vicinity of the Ohio Turnpike, State Route 8 and East Hines Hill Rd. A major hotel is a key project identified in a recently completed area plan. Brimfield Township – the rapidly growing commercial area at the intersection of I-76 and County Road 18. Planned improvements for this intersection should improve already excellent highway access and visibility from the interstate, and the area seems a likely place for the construction of a hotel. Green – Akron-Canton Airport vicinity. Great highway access, abundant developable land and a rapidly growing airport make the development of hotels along Lauby or Greensburg Roads highly likely in the future. Rootstown – NEOMED campus area. The rapidly growing medical sciences campus and surrounding area benefits from excellent access to I-76, yet no hotels currently exist in the immediate vicinity. The potential for a hotel project seemed highly likely. Key Observations • Despite the areas of anticipated growth listed above, some industry experts feel that the Akron metropolitan region’s hotel market is oversaturated. This would indicate that new hotel growth is expected to be slow through 2040 • Overall, the region could expect a 17.2% growth rate in its hotel room inventory between 2010 and 2040 Median Household Income Data Source To determine the median household income by census tract, the following data source was used: • The American Community Survey’s (ACS) “American Fact Finder” tool Methodology The 2010 median household income was determined for every census tract within the AMATS region, using data provided by the American Community Survey. This median household income was assumed 16 to be consistent among every traffic zone within that census tract. For traffic zones that crossed into multiple census tracts, an average was calculated, and that average of median household incomes was assigned to that particular TAZ. Due to the difficulty in forecasting median household income over long term periods, this version of the AMATS Planning Data Forecast – like previous versions – holds the income level steady through 2040. Key Observation • Although income levels vary widely among subareas, the overall AMATS region’s income level is very similar to those of each county within the area – Summit, Portage and the Wayne County portion Part IV: Forecast Results The following tables present the results of the various analyses conducted as part of the Planning Data Forecast process. All 35 variables have been forecasted for the AMATS region, at the county level, for three significant cities and eight subareas. Employment data has been summarized by NAICS code. Each table includes 2010 base year data, as well as the data forecasted through the plan year of 2040. Although full details regarding data sources and methodology are available for each variable in the previous sections of this report, nearly all 2010 data has been collected from various sources and tools published by the U.S. Census Bureau. The State of Ohio provided important base year data as well. Although data has been cross-checked for as much consistency as possible, certain situations prevent the perfect reconciliation of totals between different variables and/or subareas. Some of these situations include, but are not limited to: • • • • Rounding error Overlap between geographical boundaries (municipal/TAZ/census tract/etc.) Different data sources necessitating from the absence of data Internal efforts to smooth untenable forecasted totals The following pages include a map illustrating the political units, subareas and traffic analysis zones that were considered as part of this analysis, as well as a presentation of the variables for each of these geographic areas. 17 18 TOTAL AMATS AREA 2040 FORECAST CHARACTERISTICS Population Households Population Under 18 Vehicles Workers Employment NAICS 11 NAICS 21 NAICS 22 NAICS 23 NAICS 31-33 NAICS 42 NAICS 44-45 NAICS 48-49 NAICS 51 NAICS 52 NAICS 53 NAICS 54 NAICS 55 NAICS 56 NAICS 61 NAICS 62 NAICS 71 NAICS 72 NAICS 81 NAICS 92 NAICS 99 Total Employment Public School Enrollment Private School Enrollment Group Quarters Hotel Rooms Median Household Income Base Year: 2010 Plan Year: 2040 % Change 722,788 695,114 -3.8% 292,511 275,821 -5.7% 161,854 156,297 -3.4% 339,775 323,569 -4.8% 343,982 327,350 -4.8% 445 223 2,191 10,453 37,240 16,721 37,359 9,776 4,873 8,679 3,115 15,531 14,872 17,378 29,020 49,099 4,221 25,336 9,733 9,599 305,864 629 537 1,810 11,184 28,848 19,819 37,633 14,103 5,879 9,238 2,540 20,251 25,761 23,179 37,898 60,935 4,067 28,474 9,021 7,247 349,053 41.3% 140.8% -17.4% 7.0% -22.5% 18.5% 0.7% 44.3% 20.6% 6.4% -18.5% 30.4% 73.2% 33.4% 30.6% 24.1% -3.6% 12.4% -7.3% -24.5% 14.1% 99,872 12,034 18,026 6,391 49,984 98,483 11,886 18,617 7,489 49,984 -1.4% -1.2% 3.3% 17.2% 0.0% Agriculture, Forestry and Hunting Mining Utilities Construction Manufacturing - Aggregated Wholesale Trade Retail Trade - Aggregated Transportation and Warehousing - Aggregated Information Finance and Insurance Real Estate and Rental and Leasing Professional Scientific and Technical Services Management of Companies and Enterprises Administrative Support, Waste Management and Remediation Services Education Services Health Care and Social Assistance Arts, Entertainment and Recreation Accommodation and Food Services Other Services (except Public Administration) Public Administration Other 19 SUMMIT COUNTY 2040 FORECAST CHARACTERISTICS Population Households Population Under 18 Vehicles Workers Base Year: 2010 Plan Year: 2040 % Change 541,781 523,190 -3.4% 222,781 209,376 -6.0% 123,575 119,714 -3.1% 254,826 242,270 -4.9% 255,962 243,249 -5.0% Employment NAICS 11 NAICS 21 NAICS 22 NAICS 23 NAICS 31-33 NAICS 42 NAICS 44-45 NAICS 48-49 NAICS 51 NAICS 52 NAICS 53 NAICS 54 NAICS 55 NAICS 56 NAICS 61 NAICS 62 NAICS 71 NAICS 72 NAICS 81 NAICS 92 NAICS 99 Total Employment Public School Enrollment Private School Enrollment Group Quarters Hotel Rooms Median Household Income $ 111 54 2,057 8,644 26,947 13,899 31,453 8,680 4,470 8,033 2,614 14,202 13,995 15,939 19,809 42,872 3,587 20,705 8,140 7,728 253,939 74,634 11,051 9,967 5,056 47,926 $ 118 170 1,622 9,593 20,672 15,064 28,829 11,887 5,720 8,619 1,983 18,522 24,336 20,670 19,428 53,727 3,579 22,756 7,175 5,292 279,762 6.3% 214.8% -21.1% 11.0% -23.3% 8.4% -8.3% 36.9% 28.0% 7.3% -24.1% 30.4% 73.9% 29.7% -1.9% 25.3% -0.2% 9.9% -11.9% -31.5% 10.2% 73,741 10,915 9,953 5,914 47,926 -1.2% -1.2% -0.1% 17.0% 0.0% Agriculture, Forestry and Hunting Mining Utilities Construction Manufacturing - Aggregated Wholesale Trade Retail Trade - Aggregated Transportation and Warehousing - Aggregated Information Finance and Insurance Real Estate and Rental and Leasing Professional Scientific and Technical Services Management of Companies and Enterprises Administrative Support, Waste Management and Remediation Services Education Services Health Care and Social Assistance Arts, Entertainment and Recreation Accommodation and Food Services Other Services (except Public Administration) Public Administration Other 20 PORTAGE COUNTY 2040 FORECAST CHARACTERISTICS Population Households Population Under 18 Vehicles Workers Base Year: 2010 Plan Year: 2040 % Change 161,419 151,720 -6.0% 62,222 58,688 -5.7% 33,678 31,823 -5.5% 76,534 72,583 -5.2% 78,569 74,316 -5.4% Employment NAICS 11 NAICS 21 NAICS 22 NAICS 23 NAICS 31-33 NAICS 42 NAICS 44-45 NAICS 48-49 NAICS 51 NAICS 52 NAICS 53 NAICS 54 NAICS 55 NAICS 56 NAICS 61 NAICS 62 NAICS 71 NAICS 72 NAICS 81 NAICS 92 NAICS 99 Total Employment 183 148 95 1,553 9,853 2,681 5,551 1,078 368 604 478 1,279 877 1,394 8,779 5,748 577 4,514 1,492 1,766 49,018 234 343 177 1,353 8,033 4,606 8,615 2,206 146 613 547 1,718 1,424 2,471 18,175 6,682 404 5,659 1,752 1,869 67,027 27.9% 131.8% 86.3% -12.9% -18.5% 71.8% 55.2% 104.6% -60.3% 1.5% 14.4% 34.3% 62.4% 77.3% 107.0% 16.2% -30.0% 25.4% 17.4% 5.8% 36.7% Public School Enrollment Private School Enrollment Group Quarters Hotel Rooms Median Household Income $ 22,702 747 7,914 1,335 50,447 $ 21,761 738 8,525 1,575 50,447 -4.1% -1.2% 7.7% 18.0% 0.0% Agriculture, Forestry and Hunting Mining Utilities Construction Manufacturing - Aggregated Wholesale Trade Retail Trade - Aggregated Transportation and Warehousing - Aggregated Information Finance and Insurance Real Estate and Rental and Leasing Professional Scientific and Technical Services Management of Companies and Enterprises Administrative Support, Waste Management and Remediation Services Education Services Health Care and Social Assistance Arts, Entertainment and Recreation Accommodation and Food Services Other Services (except Public Administration) Public Administration Other 21 AKRON 2040 FORECAST CHARACTERISTICS Population Households Population Under 18 Vehicles Workers Base Year: 2010 Plan Year: 2040 % Change 199,110 157,715 -20.8% 83,712 66,308 -20.8% 45,541 36,073 -20.8% 90,065 71,340 -20.8% 90,985 72,069 -20.8% Employment NAICS 11 NAICS 21 NAICS 22 NAICS 23 NAICS 31-33 NAICS 42 NAICS 44-45 NAICS 48-49 NAICS 51 NAICS 52 NAICS 53 NAICS 54 NAICS 55 NAICS 56 NAICS 61 NAICS 62 NAICS 71 NAICS 72 NAICS 81 NAICS 92 NAICS 99 Total Employment Public School Enrollment Private School Enrollment Group Quarters Hotel Rooms Median Household Income $ 14 3 1,553 2,670 8,307 3,813 7,713 2,804 2,346 1,871 1,252 5,972 8,594 5,836 10,211 24,973 1,115 5,326 2,924 5,005 102,302 22,714 3,540 6,054 441 34,359 $ 17 82 540 2,545 3,960 3,002 4,663 1,869 2,970 1,518 857 6,347 8,941 5,575 11,378 27,921 814 3,975 1,765 2,335 91,074 21.4% 2633.3% -65.2% -4.7% -52.3% -21.3% -39.5% -33.3% 26.6% -18.9% -31.5% 6.3% 4.0% -4.5% 11.4% 11.8% -27.0% -25.4% -39.6% -53.3% -11.0% 18,590 3,496 6,178 747 34,359 -18.2% -1.2% 2.0% 69.4% 0.0% Agriculture, Forestry and Hunting Mining Utilities Construction Manufacturing - Aggregated Wholesale Trade Retail Trade - Aggregated Transportation and Warehousing - Aggregated Information Finance and Insurance Real Estate and Rental and Leasing Professional Scientific and Technical Services Management of Companies and Enterprises Administrative Support, Waste Management and Remediation Services Education Services Health Care and Social Assistance Arts, Entertainment and Recreation Accommodation and Food Services Other Services (except Public Administration) Public Administration Other 22 BARBERTON 2040 FORECAST CHARACTERISTICS Population Households Population Under 18 Vehicles Workers Base Year: 2010 Plan Year: 2040 % Change 26,550 22,616 -14.8% 11,054 9,416 -14.8% 6,226 5,304 -14.8% 11,445 9,749 -14.8% 11,450 9,754 -14.8% Employment NAICS 11 NAICS 21 NAICS 22 NAICS 23 NAICS 31-33 NAICS 42 NAICS 44-45 NAICS 48-49 NAICS 51 NAICS 52 NAICS 53 NAICS 54 NAICS 55 NAICS 56 NAICS 61 NAICS 62 NAICS 71 NAICS 72 NAICS 81 NAICS 92 NAICS 99 Total Employment Public School Enrollment Private School Enrollment Group Quarters Hotel Rooms Median Household Income $ 45 689 2,988 283 780 130 47 176 67 163 64 339 620 1,359 78 730 486 204 9,248 3,786 160 373 35,411 $ 3 1 2 1,530 5,000 445 1,197 331 83 76 55 66 272 453 540 1,644 201 1,173 456 162 13,690 -93.3% 100.0% 100.0% 122.1% 67.3% 57.2% 53.5% 154.6% 76.6% -56.8% -17.9% -59.5% 325.0% 33.6% -12.9% 21.0% 157.7% 60.7% -6.2% -20.6% 48.0% 3,399 158 359 35,411 -10.2% -1.3% -3.8% 0.0% 0.0% Agriculture, Forestry and Hunting Mining Utilities Construction Manufacturing - Aggregated Wholesale Trade Retail Trade - Aggregated Transportation and Warehousing - Aggregated Information Finance and Insurance Real Estate and Rental and Leasing Professional Scientific and Technical Services Management of Companies and Enterprises Administrative Support, Waste Management and Remediation Services Education Services Health Care and Social Assistance Arts, Entertainment and Recreation Accommodation and Food Services Other Services (except Public Administration) Public Administration Other 23 CUYAHOGA FALLS 2040 FORECAST CHARACTERISTICS Population Households Population Under 18 Vehicles Workers Base Year: 2010 Plan Year: 2040 % Change 49,652 49,381 -0.5% 22,129 -0.5% 22,250 -0.5% 10,368 10,311 25,205 25,067 -0.5% 25,067 -0.5% 25,205 Employment NAICS 11 NAICS 21 NAICS 22 NAICS 23 NAICS 31-33 NAICS 42 NAICS 44-45 NAICS 48-49 NAICS 51 NAICS 52 NAICS 53 NAICS 54 NAICS 55 NAICS 56 NAICS 61 NAICS 62 NAICS 71 NAICS 72 NAICS 81 NAICS 92 NAICS 99 Total Employment Public School Enrollment Private School Enrollment Group Quarters Hotel Rooms Median Household Income $ 63 340 2,382 419 3,142 95 243 310 131 888 571 801 1,615 1,760 335 2,151 786 422 16,454 1 3 30 209 1,565 315 2,317 202 329 119 81 956 401 920 1,309 2,366 247 1,172 414 329 13,285 100.0% 100.0% -52.4% -38.5% -34.3% -24.8% -26.3% 112.6% 35.4% -61.6% -38.2% 7.7% -29.8% 14.9% -18.9% 34.4% -26.3% -45.5% -47.3% -22.0% -19.3% 6,194 3,191 527 318 47,071 $ 6,256 3,152 507 318 47,071 1.0% -1.2% -3.8% 0.0% 0.0% - Agriculture, Forestry and Hunting Mining Utilities Construction Manufacturing - Aggregated Wholesale Trade Retail Trade - Aggregated Transportation and Warehousing - Aggregated Information Finance and Insurance Real Estate and Rental and Leasing Professional Scientific and Technical Services Management of Companies and Enterprises Administrative Support, Waste Management and Remediation Services Education Services Health Care and Social Assistance Arts, Entertainment and Recreation Accommodation and Food Services Other Services (except Public Administration) Public Administration Other 24 NORTHERN SUMMIT COUNTY 2040 FORECAST CHARACTERISTICS Population Households Population Under 18 Vehicles Workers Base Year: 2010 Plan Year: 2040 % Change 87,677 103,039 17.5% 33,774 39,121 15.8% 21,937 25,568 16.6% 42,959 49,660 15.6% 43,019 49,726 15.6% Employment NAICS 11 NAICS 21 NAICS 22 NAICS 23 NAICS 31-33 NAICS 42 NAICS 44-45 NAICS 48-49 NAICS 51 NAICS 52 NAICS 53 NAICS 54 NAICS 55 NAICS 56 NAICS 61 NAICS 62 NAICS 71 NAICS 72 NAICS 81 NAICS 92 NAICS 99 Total Employment 15 39 82 1,986 6,494 6,003 6,112 2,577 1,165 3,058 336 2,445 1,389 1,885 2,692 3,700 1,028 3,885 1,292 862 47,045 9 42 132 1,448 4,248 7,103 4,144 3,090 1,465 4,411 282 2,386 3,943 2,187 2,564 5,040 757 4,101 1,318 1,161 49,831 -40.0% 7.7% 61.0% -27.1% -34.6% 18.3% -32.2% 19.9% 25.8% 44.2% -16.1% -2.4% 183.9% 16.0% -4.8% 36.2% -26.4% 5.6% 2.0% 34.7% 5.9% Public School Enrollment Private School Enrollment Group Quarters Hotel Rooms Median Household Income $ 14,160 1,870 939 1,532 84,206 $ 16,027 1,847 914 1,784 84,206 13.2% -1.2% -2.7% 16.4% 0.0% Agriculture, Forestry and Hunting Mining Utilities Construction Manufacturing - Aggregated Wholesale Trade Retail Trade - Aggregated Transportation and Warehousing - Aggregated Information Finance and Insurance Real Estate and Rental and Leasing Professional Scientific and Technical Services Management of Companies and Enterprises Administrative Support, Waste Management and Remediation Services Education Services Health Care and Social Assistance Arts, Entertainment and Recreation Accommodation and Food Services Other Services (except Public Administration) Public Administration Other 25 CENTRAL SUMMIT COUNTY 2040 FORECAST CHARACTERISTICS Population Households Population Under 18 Vehicles Workers Base Year: 2010 Plan Year: 2040 % Change 94,068 102,667 9.1% 37,875 39,774 5.0% 21,217 23,360 10.1% 44,685 47,476 6.2% 44,776 47,589 6.3% Employment NAICS 11 NAICS 21 NAICS 22 NAICS 23 NAICS 31-33 NAICS 42 NAICS 44-45 NAICS 48-49 NAICS 51 NAICS 52 NAICS 53 NAICS 54 NAICS 55 NAICS 56 NAICS 61 NAICS 62 NAICS 71 NAICS 72 NAICS 81 NAICS 92 NAICS 99 Total Employment 22 12 281 1,317 2,470 1,569 9,692 1,123 443 1,826 510 3,001 2,462 4,335 2,495 8,090 739 5,627 1,685 815 48,514 53 26 856 887 1,468 2,227 10,896 736 722 1,549 581 5,219 7,278 6,391 2,420 11,980 1,015 7,792 2,127 1,024 65,247 140.9% 116.7% 204.6% -32.6% -40.6% 41.9% 12.4% -34.5% 63.0% -15.2% 13.9% 73.9% 195.6% 47.4% -3.0% 48.1% 37.3% 38.5% 26.2% 25.6% 34.5% Public School Enrollment Private School Enrollment Group Quarters Hotel Rooms Median Household Income $ 13,789 1,876 1,647 1,725 70,783 $ 15,173 1,853 1,584 1,725 70,783 10.0% -1.2% -3.8% 0.0% 0.0% Agriculture, Forestry and Hunting Mining Utilities Construction Manufacturing - Aggregated Wholesale Trade Retail Trade - Aggregated Transportation and Warehousing - Aggregated Information Finance and Insurance Real Estate and Rental and Leasing Professional Scientific and Technical Services Management of Companies and Enterprises Administrative Support, Waste Management and Remediation Services Education Services Health Care and Social Assistance Arts, Entertainment and Recreation Accommodation and Food Services Other Services (except Public Administration) Public Administration Other 26 SOUTHERN SUMMIT COUNTY 2040 FORECAST CHARACTERISTICS Population Households Population Under 18 Vehicles Workers Base Year: 2010 Plan Year: 2040 % Change 84,724 87,772 3.6% 34,116 32,628 -4.4% 18,286 19,099 4.4% 40,467 38,976 -3.7% 40,527 39,043 -3.7% Employment NAICS 11 NAICS 21 NAICS 22 NAICS 23 NAICS 31-33 NAICS 42 NAICS 44-45 NAICS 48-49 NAICS 51 NAICS 52 NAICS 53 NAICS 54 NAICS 55 NAICS 56 NAICS 61 NAICS 62 NAICS 71 NAICS 72 NAICS 81 NAICS 92 NAICS 99 Total Employment 20 7 94 1,642 4,299 1,812 4,010 1,951 226 792 318 1,733 915 2,743 2,176 2,980 292 2,979 967 420 30,376 35 16 62 2,974 4,877 1,972 6,263 5,659 150 946 128 2,951 3,500 4,114 1,595 4,777 545 4,543 1,096 434 46,637 75.0% 128.6% -34.0% 81.1% 13.4% 8.8% 56.2% 190.1% -33.6% 19.4% -59.7% 70.3% 282.5% 50.0% -26.7% 60.3% 86.6% 52.5% 13.3% 3.3% 53.5% Public School Enrollment Private School Enrollment Group Quarters Hotel Rooms Median Household Income $ 13,991 414 427 1,040 55,905 $ 14,296 409 411 1,340 55,905 2.2% -1.2% -3.7% 28.8% 0.0% Agriculture, Forestry and Hunting Mining Utilities Construction Manufacturing - Aggregated Wholesale Trade Retail Trade - Aggregated Transportation and Warehousing - Aggregated Information Finance and Insurance Real Estate and Rental and Leasing Professional Scientific and Technical Services Management of Companies and Enterprises Administrative Support, Waste Management and Remediation Services Education Services Health Care and Social Assistance Arts, Entertainment and Recreation Accommodation and Food Services Other Services (except Public Administration) Public Administration Other 27 NORTHWEST PORTAGE COUNTY 2040 FORECAST CHARACTERISTICS Population Households Population Under 18 Vehicles Workers Base Year: 2010 Plan Year: 2040 % Change 43,277 45,626 5.4% 16,934 17,965 6.1% 9,975 10,518 5.4% 20,905 22,256 6.5% 20,885 22,236 6.5% Employment NAICS 11 NAICS 21 NAICS 22 NAICS 23 NAICS 31-33 NAICS 42 NAICS 44-45 NAICS 48-49 NAICS 51 NAICS 52 NAICS 53 NAICS 54 NAICS 55 NAICS 56 NAICS 61 NAICS 62 NAICS 71 NAICS 72 NAICS 81 NAICS 92 NAICS 99 Total Employment 26 59 16 542 4,846 1,907 2,786 436 27 134 237 508 46 605 1,454 1,235 257 1,506 527 349 17,503 12 136 32 285 4,761 3,351 5,203 1,010 63 131 240 727 88 1,113 2,006 1,559 178 2,480 408 654 24,437 -53.8% 130.5% 100.0% -47.4% -1.8% 75.7% 86.8% 131.7% 133.3% -2.2% 1.3% 43.1% 91.3% 84.0% 38.0% 26.2% -30.7% 64.7% -22.6% 87.4% 39.6% Public School Enrollment Private School Enrollment Group Quarters Hotel Rooms Median Household Income $ 7,273 278 713 665 65,488 $ 7,442 275 686 665 65,488 2.3% -1.1% -3.8% 0.0% 0.0% Agriculture, Forestry and Hunting Mining Utilities Construction Manufacturing - Aggregated Wholesale Trade Retail Trade - Aggregated Transportation and Warehousing - Aggregated Information Finance and Insurance Real Estate and Rental and Leasing Professional Scientific and Technical Services Management of Companies and Enterprises Administrative Support, Waste Management and Remediation Services Education Services Health Care and Social Assistance Arts, Entertainment and Recreation Accommodation and Food Services Other Services (except Public Administration) Public Administration Other 28 NORTHEAST PORTAGE COUNTY 2040 FORECAST CHARACTERISTICS Population Households Population Under 18 Vehicles Workers Base Year: 2010 Plan Year: 2040 % Change 16,207 13,178 -18.7% 5,841 4,833 -17.3% 3,640 2,912 -20.0% 7,315 6,297 -13.9% 7,685 6,562 -14.6% Employment NAICS 11 NAICS 21 NAICS 22 NAICS 23 NAICS 31-33 NAICS 42 NAICS 44-45 NAICS 48-49 NAICS 51 NAICS 52 NAICS 53 NAICS 54 NAICS 55 NAICS 56 NAICS 61 NAICS 62 NAICS 71 NAICS 72 NAICS 81 NAICS 92 NAICS 99 Total Employment Public School Enrollment Private School Enrollment Group Quarters Hotel Rooms Median Household Income $ 53 52 397 32 282 57 81 37 30 66 16 656 132 43 453 70 131 2,588 2,186 881 12 52,777 $ 120 1 37 520 58 177 85 76 27 38 87 1 63 781 307 15 886 73 148 3,500 126.4% 0.0% 100.0% -28.8% 31.0% 81.3% -37.2% 49.1% -6.2% -27.0% 26.7% 31.8% 100.0% 293.8% 19.1% 132.6% -65.1% 95.6% 4.3% 13.0% 35.2% 1,713 968 12 52,777 -21.6% 0.0% 9.9% 0.0% 0.0% Agriculture, Forestry and Hunting Mining Utilities Construction Manufacturing - Aggregated Wholesale Trade Retail Trade - Aggregated Transportation and Warehousing - Aggregated Information Finance and Insurance Real Estate and Rental and Leasing Professional Scientific and Technical Services Management of Companies and Enterprises Administrative Support, Waste Management and Remediation Services Education Services Health Care and Social Assistance Arts, Entertainment and Recreation Accommodation and Food Services Other Services (except Public Administration) Public Administration Other 29 SOUTHWEST PORTAGE COUNTY 2040 FORECAST CHARACTERISTICS Population Households Population Under 18 Vehicles Workers Base Year: 2010 Plan Year: 2040 % Change 87,325 80,477 -7.8% 33,902 31,193 -8.0% 16,667 15,490 -7.1% 41,600 38,268 -8.0% 43,265 39,740 -8.1% Employment NAICS 11 NAICS 21 NAICS 22 NAICS 23 NAICS 31-33 NAICS 42 NAICS 44-45 NAICS 48-49 NAICS 51 NAICS 52 NAICS 53 NAICS 54 NAICS 55 NAICS 56 NAICS 61 NAICS 62 NAICS 71 NAICS 72 NAICS 81 NAICS 92 NAICS 99 Total Employment 83 37 79 857 4,566 610 2,312 471 260 433 192 680 828 745 5,796 4,346 271 2,464 862 1,238 27,130 79 126 144 993 3,860 1,036 3,009 964 162 455 206 824 1,331 1,234 13,221 4,715 208 2,116 1,236 1,028 36,947 -4.8% 240.5% 82.3% 15.9% -15.5% 69.8% 30.1% 104.7% -37.7% 5.1% 7.3% 21.2% 60.7% 65.6% 128.1% 8.5% -23.2% -14.1% 43.4% -17.0% 36.2% Public School Enrollment Private School Enrollment Group Quarters Hotel Rooms Median Household Income $ 10,068 469 6,314 658 46,104 $ 9,694 463 6,865 898 46,104 -3.7% -1.3% 8.7% 36.5% 0.0% Agriculture, Forestry and Hunting Mining Utilities Construction Manufacturing - Aggregated Wholesale Trade Retail Trade - Aggregated Transportation and Warehousing - Aggregated Information Finance and Insurance Real Estate and Rental and Leasing Professional Scientific and Technical Services Management of Companies and Enterprises Administrative Support, Waste Management and Remediation Services Education Services Health Care and Social Assistance Arts, Entertainment and Recreation Accommodation and Food Services Other Services (except Public Administration) Public Administration Other 30 SOUTHEAST PORTAGE COUNTY 2040 FORECAST CHARACTERISTICS Population Households Population Under 18 Vehicles Workers Base Year: 2010 Plan Year: 2040 % Change 14,610 12,439 -14.9% 5,545 4,697 -15.3% 3,396 2,903 -14.5% 6,714 5,762 -14.2% 6,734 5,779 -14.2% Employment NAICS 11 NAICS 21 NAICS 22 NAICS 23 NAICS 31-33 NAICS 42 NAICS 44-45 NAICS 48-49 NAICS 51 NAICS 52 NAICS 53 NAICS 54 NAICS 55 NAICS 56 NAICS 61 NAICS 62 NAICS 71 NAICS 72 NAICS 81 NAICS 92 NAICS 99 Total Employment Public School Enrollment Private School Enrollment Group Quarters Hotel Rooms Median Household Income $ 21 52 102 44 132 171 114 19 25 3 28 873 35 6 91 33 48 1,797 3,175 6 57,001 $ 23 80 68 21 106 335 148 1 63 80 4 60 798 101 2 177 35 40 2,142 9.5% 53.8% 0.0% -33.3% -52.3% -19.7% 95.9% 29.8% 100.0% 0.0% 231.6% 220.0% 33.3% 114.3% -8.6% 188.6% -66.7% 94.5% 6.1% -16.7% 19.2% 2,913 6 57,001 -8.3% 0.0% 0.0% 0.0% 0.0% - Agriculture, Forestry and Hunting Mining Utilities Construction Manufacturing - Aggregated Wholesale Trade Retail Trade - Aggregated Transportation and Warehousing - Aggregated Information Finance and Insurance Real Estate and Rental and Leasing Professional Scientific and Technical Services Management of Companies and Enterprises Administrative Support, Waste Management and Remediation Services Education Services Health Care and Social Assistance Arts, Entertainment and Recreation Accommodation and Food Services Other Services (except Public Administration) Public Administration Other 31 WAYNE COUNTY PORTION 2040 FORECAST CHARACTERISTICS Population Households Population Under 18 Vehicles Workers Base Year: 2010 Plan Year: 2040 % Change 19,588 20,204 3.1% 7,508 7,757 3.3% 4,601 4,760 3.5% 8,415 8,716 3.6% 9,451 9,784 3.5% Employment NAICS 11 NAICS 21 NAICS 22 NAICS 23 NAICS 31-33 NAICS 42 NAICS 44-45 NAICS 48-49 NAICS 51 NAICS 52 NAICS 53 NAICS 54 NAICS 55 NAICS 56 NAICS 61 NAICS 62 NAICS 71 NAICS 72 NAICS 81 NAICS 92 NAICS 99 Total Employment Public School Enrollment Private School Enrollment Group Quarters Hotel Rooms Median Household Income $ 146 14 23 256 447 141 359 18 35 42 23 50 45 432 489 57 124 101 105 2,907 2,536 236 145 48,375 $ 277 24 10 238 144 150 190 11 13 6 9 11 39 295 525 85 58 94 85 2,264 89.7% 71.4% -56.5% -7.0% -67.8% 6.4% -47.1% -38.9% -62.9% -85.7% -60.9% -78.0% 0.0% -13.3% -31.7% 7.4% 49.1% -53.2% -6.9% -19.0% -22.1% 2,981 233 139 48,375 17.5% -1.3% -4.1% 0.0% 0.0% Agriculture, Forestry and Hunting Mining Utilities Construction Manufacturing - Aggregated Wholesale Trade Retail Trade - Aggregated Transportation and Warehousing - Aggregated Information Finance and Insurance Real Estate and Rental and Leasing Professional Scientific and Technical Services Management of Companies and Enterprises Administrative Support, Waste Management and Remediation Services Education Services Health Care and Social Assistance Arts, Entertainment and Recreation Accommodation and Food Services Other Services (except Public Administration) Public Administration Other 32 Conclusion Understanding where current trends could be taking the AMATS region in the long-term future is an important part of the regional transportation planning process. The analyses contained within this report give us a glimpse into the potential future of the greater Akron region, in regards to many important transportation planning variables. Each of these 35 variables has a varying degree of impact on the local transportation system. In addition to providing important planning insight, the massive amount of TAZ-level data generated during the Planning Data Forecast process will be input directly into the region’s traffic demand model. Using this data, the model will be able to generate future traffic volumes, congestion and air quality data with the greatest possible accuracy. According to the previous analyses, the AMATS region is expected to experience a slight decline in population (-3.8%) between now and 2040. Conversely, the region’s employment is expected to see moderate growth (14.1%) over this same planning period. Summit and Portage counties are expected to hold to these same trends, with the exception that Portage County is expected to see significant employment growth (36.7% through 2040). At the subarea level, future population growth should be the strongest in the northern portion of Summit County (17.5%) and Northwest Portage County (5.4%). Employment growth is expected to be strongest in Southern Summit County (53.5%). Solid employment growth is also expected throughout Portage County. The Wayne County portion of the AMATS region should expect slight population growth (3.1%) and a moderate decline in overall employment (-22.1%) through 2040. The public school enrollment in the Wayne County communities is expected to be the largest in the AMATS region, growing 17.5% over the planning period. 33 Attachment 5C AKRON METROPOLITAN AREA TRANSPORTATION STUDY MEMORANDUM TO: Policy Committee Technical Advisory Committee Citizens Involvement Committee FROM: AMATS Staff RE: Draft Road Diet Analysis DATE: March 11, 2015 A road diet is a useful low-cost tool to improve safety and integrate multiple modes of travel. A road diet reduces the number of travel lanes on a roadway and then adjusts or reassigns the space for other uses and travel modes. The most common road diet reconfiguration is the conversion of a four lane roadway into a three lane roadway made up of two through lanes and a center two-way left-turn lane. Remaining space can be allocated for bicycle lanes, pedestrian refuge islands, transit bus stops or on-street parking. Road diets have been used successfully for a number of years, and the process is endorsed by the Federal Highway Administration (FHWA) for safety, as well as for complete streets development. The attached draft road diet analysis identifies the following highway segments as top candidates for further analysis and consideration by AMATS members, based on average daily traffic (ADT). Methodology and further considerations are discussed in the following technical memorandum. The staff will present the road diet report in May for final approval. Avg ADT Street From To Location Tier 1 Segments - Average ADT less than 10,000 - Top 10 2nd St SW Snyder Ave Wooster Rd West Barberton 3,650 Opportunity Pkwy SR 59 MLK Jr Freeway W. Cedar St Akron 4,090 Maple St Glendale Ave SR 18 W. Market St Akron 4,710 Independence Ave Home Ave Brittain Rd Akron 4,915 Front St Cuyahoga Falls Ave 2nd St Akron, Cuyahoga Falls 5,470 Maple St Edgewood Ave Glendale Ave Akron 5,530 Kenmore Blvd East Ave Lakeshore Blvd Akron 5,575 Chamberlain Rd Highland Ave SR 82 Aurora Rd Twinsburg 5,680 Second St Oakwood Dr Tifft St Cuyahoga Falls 6,400 Kelly Ave Waterloo Rd Goodyear Blvd Akron 7,646 Road Diet Analysis Technical Memorandum A road diet reduces the number of travel lanes on a roadway and then adjusts or reassigns the space for other uses and travel modes. The most common road diet reconfiguration is the conversion of an undivided four lane roadway into a three lane roadway made up of two through lanes and a center two-way left-turn lane. The reduction in the number of lanes allows the roadway cross section to be reallocated for other uses such as bike lanes, pedestrian refuge islands, transit uses or parking. A simplified example is shown in Figure 1. Figure 1 AMATS works with our member communities and transit agencies to improve the safety of all modes of travel in the area. In particular, AMATS remains committed to reducing highway fatalities and serious injuries on our roadways through the use of proven safety countermeasures. This includes the consideration of road diets as an alternative to improve safety. Four lane, undivided highways experience a number of crash types as traffic volumes increase, including: • • • • • Rear-end and sideswipe crashes caused by speed differential between vehicles Sideswipe crashes caused by frequent and sudden lane changing between two through lanes Rear-end crashes caused by left-turning vehicles stopped in the inside travel lane Left-turn crashes caused by mainline left-turning motorists feeling pressure to depart the shared through/left lane by following motorists and making a poor gap judgment Angle crashes caused by side street traffic crossing four lanes to make a through movement across an intersection, or turning left across two lanes • • Bicycle crash B hes due to a lack l of availlable space for f bicyclistss to ride com mfortably, andd Pedestrian craashes due to the high nuumber of lanees for pedesttrians to crosss with no reefuge. mple, on a ru ural road a hiigher speed left l lane is used mutuallyy as a left turrn lane beforre a For exam road diett is applied (ssee Figure 2). 2 The speedd differentiaal between thhrough traffiic and turninng traffic creeates unsafee conditions in i the left lanne. After thhe applicationn of the roadd diet, left tuurn movemennts are madee safely using the center turn lane. All A through traffic t is maiintained in one o lane, elim minating speed differentiials and weaaving betweeen lanes. Reemaining spaace can be allocatedd for bicycle usage. Figure 2 As trafficc volumes an nd turning movements m (aat intersectioons and driveeways) increease, four lanne, undivided roadways exhibit the above a noted safety conceerns. Additioonally, as biccycle and ncreases, com mmunities may m wish to accommodat a te a safe inteegration of trravel pedestriaan activity in modes byy applying a road diet. The beneefits of a road diet may innclude • • • • • r inn crashes, parrticularly reaar-end and leeft-turn crashhes through the An overall reduction use of a ded dicated left-tturn lane Fewer laness for pedestrrians and biccyclists to crooss and provvide an oppoortunity to innstall pedestrian refuge r islandds in the center of the roaadway Side street motorists m crooss only threee lanes of trraffic insteadd of four A reduction n in the numbber of total lanes l offers the t opportunnity to install curbside bicycle lanees when the cross-sectionn width is reeallocated Traffic calm ming and redduced speed differential that t decrease the numbeer of crashes and reduce the severity s of crashes if theey do occur • • The opportunity to allocate the remaining roadway width for other purposes, such as on-street parking or transit stops, and Encourage a more community-focused, mixed-use environment. A road diet can be a low-cost safety solution, particularly in cases where only pavement marking modifications are needed to make the change. In other cases, a road diet may be planned in conjunction with a roadway or intersection reconstruction or overlaid onto currently planned projects. The change in cross section allocation could be incorporated at no additional cost. To date, two notable road diet projects have been performed in the area with positive results: • • Copley Road in the City of Akron, from I-77 to Storer Avenue (1.1 miles) shown in Figure 3 below, after the application of a road diet. South Main Street in Coventry Township, from Elora Street (¼ mile south of Swartz Road) to Portage Lakes Drive (1.2 miles) Figure 3 Figure 4 Figures 3 and 4 show Copley Road in Akron following the application of a road diet. Figure 3 looks west near the intersection of Copley Road and Dorchester Road. Figure 4 is west, and shows the bicycle lane more clearly. The width of the right-of-way was maintained during the resurfacing project, and the new allocation of lane usage (the road diet) was accomplished by restriping. The City of Akron has received positive feedback after the road diet application on Copley Road, and is considering future applications. The purpose of the attached Road Diet Analysis table is to identify additional locations that AMATS members may wish to consider when making improvements in their communities. The following methodology discusses the draft roadway segments identified in Table 1 as possible candidates for a road diet. POSSIBLE ROAD DIET STREETS RANKED BY ADT CATEGORY Street SR 261 SR 162 SR 764 SR 261 2nd St SW Opportunity Pkwy Maple St Independence Ave Front St Maple St Kenmore Blvd Chamberlain Rd Second St Kelly Ave Albrecht Ave S Hawkins Ave Cedar St Wolf Ledges Pkwy E Howe Rd Exchange St Hawkins Ave Romig Rd/State St Triplett Blvd Vernon Odom Blvd Tallmadge Ave SR 764 SR 261 N SR 91 SR 93 SR 18 SR 18 W E N S AMATS Wilbeth St Brittain Rd Waterloo Rd Broadway St Main St Memorial Parkway Exchange St Canton Rd Manchester Rd Second St Market St Market St Main St Home Ave Main St Robinson Ave From To Location Avg ADT Highest ADT SRTS MBC PCR (2012) Tier 1 Segments-Average ADT less than 10,000 Snyder Ave Wooster Rd West Barberton 3,650 SR 59 MLK Jr Freeway W. Cedar St Akron 4,090 SR 162 Glendale Ave SR 18 W. Market St Akron 4,710 Home Ave Brittain Rd Akron 4,915 Cuyahoga Falls Ave 2nd St Akron, Cuyahoga Falls 5,470 Edgewood Ave Glendale Ave Akron 5,530 East Ave Lakeshore Blvd Akron 5,575 Highland Ave SR 82 Aurora Rd Twinsburg 5,680 Oakwood Dr Tifft St Cuyahoga Falls 6,400 Waterloo Rd Goodyear Blvd Akron 7,646 Canton Rd Stull Ave Akron 7,790 Morse St SR 162 Copley Rd Akron 7,894 Rhodes Ave Broadway St Akron 8,188 Voris St Carroll St Akron 8,400 Alandale St SR 261 Roundabout Tallmadge 8,440 SR 8 SR 18 E. Market St Akron 8,610 SR 162 Copley Rd Idlewood Ave Akron 8,640 SR 261 Vernon Odom Blvd Wooster Rd North Akron/Barberton 8,788 Arlington St Hillbish Ave Akron 9,345 SR 261 Wadsworth Rd SR 59 MLK Jr Freeway Akron 9,504 Cuyahoga St SR 261 N. Main St Akron 9,520 Tier 2 Segments-Average ADT between 10,001 and 15,000 4,000 4,090 4,710 6,690 5,470 5,530 9,170 5,680 6,400 9,500 7,790 10,270 9,740 9,450 8,440 10,880 10,530 9,870 11,250 13,790 10,640 Brown St SR 261 Tallmadge Ave SR 93 Manchester Rd Bartges St Olive St Merriman Rd Dodge Ave E. Market St Waterloo Rd Portage Trail Twin Oaks Dr Buchtel Ave SR 261 Tallmadge Ave SR 261 Tallmadge Ave SR 619 Wooster Rd 10,360 13,820 11,740 16,050 10,690 10,840 14,000 11,160 11,370 11,410 11,550 16,990 13,170 12,000 14,830 13,690 Arlington St Howe Rd Glenmount Ave SR 59 MLK Jr Blvd SR 162 Tallmadge Ave Cuyahoga St Broadway St Mogadore Rd SR 764 Wilbeth Rd Oakwood Dr N. Portage Path SR 91 Canton Rd N. Howard St Midway St Portage Lakes Dr SR 619 5th St Akron Akron Akron Akron Akron Akron Akron Akron Akron Cuyahoga Falls Akron Akron Akron Akron Green, Summit Co Barberton 10,060 10,233 10,315 10,685 10,690 10,840 10,881 11,160 11,370 11,410 11,550 11,631 11,725 11,757 11,835 11,980 62 63 90 31 65 96 81,89 59,84,83,89,80,81 L M L M Y H Y H L M M Safety Y Y 68 79,89 62 56,85 83 52,75 56 84,66 83,88 58,52,87,66,56,73 76,85,88,91,87 57,81,90,82 103 67,71 51,80 95,92 74,70 89,84 83,70 79,96,67 80,60,75,69 77 88 68 81 84,85,89,74 70 76,80 90 56,55 11 87 March 2015 POSSIBLE ROAD DIET STREETS RANKED BY ADT CATEGORY SR 59 SR 619 SR 261 SR 162 SR 18 SR 43 SR 59 SR 43 SR 59 SR 18 SR 261 Street W Main St Wooster Rd West Fifth St NE Canton Rd S Main St Wooster Rd North West Ave Arlington Rd Waterloo Rd Copley Rd W Market St Aurora Rd From Brady Lake Rd 31st St Portsmouth Ave Stark Co Line Miller Ave Wooster Rd West Brittain Rd Killian Rd Allendale St Storer Ave Hawkins Ave SR 82 Waterloo Rd Haymaker Pkwy S Water St Portage Trail E Main St Hawkins Ave State Rd W Market St Tallmadge Ave Fishcreek Rd Exchange St Glenmount Ave W Main St SR 261 Schiller Ave Linden St Idlewood Ave Highbridge Rd N. Portage Path SR 261 N. Main St SR 59 Kent Rd Broadway St Brown St Akron E Main St Kent Summit St Kent 6th St Cuyahoga Falls SR 14/44 Ravenna Westgate Circle Akron Schiller Ave Cuyahoga Falls Merriman Rd Akron Oxford Ave Akron Graham Rd Stow SR 8 Tier 4 Segments-Not wanted or practical 15,230 15,347 15,380 15,480 15,485 15,700 15,720 15,840 16,610 17,130 20,172 15,230 16,410 16,000 15,550 17,150 15,700 16,070 16,320 16,610 17,130 21,640 Bartges St Graham Rd SR 59 MLK Jr Blvd Laurel Woods Dr 8,787 12,700 12,150 12,700 High St Fishcreek Rd To Location Avg ADT Highest ADT SRTS MBC PCR (2012) Sycamore St Portage Co., Ravenna 12,130 12,880 Y 68,89 Wooster Rd North Barberton 12,394 14,370 71,87 Paige Ave Barberton 12,687 14,170 89 Sanitarium Rd Summit Co 12,815 12,940 82 Bartges St Akron 12,910 16,980 84 89,97,50,65 I-76 Ramps Barberton 13,097 18,810 Tallmadge Circle Akron/Tallmadge 13,355 14,390 68 70,56,78,73,85,89 SR 18 E. Market St Summit Co, Akron 13,489 18,290 Arlington St Akron 13,590 13,590 66 S. Portage Path Akron 14,040 14,040 L 88 Twin Oaks Dr Akron 14,270 14,980 86 Geauga Co Line Aurora 14,953 15,180 96 Tier 3 Segments-Average ADT between 15,001 and 20,000 Akron Stow Y Y H Y 70 76 80 74,96 78 88,62 72 80 71 82 69 Safety 75 120 44 122 32 124 41,116 76 93 101 70,72,87 46,61 SRTS - This location is also recommended for a road diet by the Akron Public Schools Safe Routes to School Study. H = High Priority, M = Medium Priority, L = Low Priority MBC - This location is identified in the AMATS Mid-Block Crossing Analysis, December 2014 Safety - This location is ranked in the AMATS 2011-2013 High Crash Roadway Segment Analysis PCR - Pavement Condition Rating AMATS March 2015 Methodology – Candidate Selection Process As mentioned above, one of the most common applications of a road diet is the conversion of a four lane undivided roadway into three lanes with one travel lane in each direction and a twoway left-turn lane in the middle. Two-way, undivided roadway segments with four lanes are generally used as the preliminary criterion to select candidate locations. The feasibility of these selected roadways is then determined by examining other factors discussed in further detail below. These factors include: • • • • • • • • • • Traffic volumes and level of service (LOS) Access points, turning volumes and traffic patterns Frequency of traffic stoppages and slow-moving vehicles The degree of weaving and actual vehicle speeds Delay Pedestrian and bicycle activity Crash types and severity Cost Travel patterns on parallel routes Public comment and community outreach Traffic Volumes and LOS Knowledge of existing and future ADT and peak-hour volumes is needed before a four lane to three lane conversion can be recommended as a feasible improvement alternative. The peak-hour volumes typically represent 8-12% of ADT on the roadway. In general, road diets operate most successfully on roadways with less than 10,000 ADT. Roadways with an ADT between 10,000 and 20,000 should be approached more cautiously. The peak hour volume may be the factor that determines if conversion is feasible. A peak hour directional ADT of 900 or less may function at an acceptable level if other factors are examined and are acceptable. Roadways with an ADT between 10,000 and 15,000 should also have the key intersection turning movements analyzed. Roadways with an ADT between 15,000 and 20,000 should have a preliminary corridor analysis performed using travel demand modeling software to determine level of service. Generally ADT volumes higher than 20,000 experience greater congestion and traffic may divert to parallel routes if they are available. Access Points, Turning Volumes and Traffic Patterns The safety and operations of four lane roadways tend to decrease with increased volume and turning movements. Turn volumes and patterns should be assessed when considering a roadway conversion to determine operational impacts. Four lane undivided roadways tend to operate similar to a three-lane road as access points and left-turns increases. As a result, roadways with a greater number of access points will be better candidates for road diet conversions. Frequency of Traffic Stoppages and Slow-moving Vehicles The number and frequency of slow moving vehicles using the roadway or those making frequent stops must be considered when evaluating for a road diet application. These vehicles will have a greater impact on the operation of a three lane roadway than on a four lane roadway. The primary reason for the increased impact along three lane roadways is a result of the inability of other automobiles to legally pass frequently stopping or slower moving vehicles. The feasibility of a road diet conversion may be uncertain if there is a large number of frequently stopping or slower moving vehicles using the roadway especially during peak travel periods. One potential mitigation measure to minimize the impact of frequently stopping vehicles is to provide pull-out areas at specific locations along the corridor. This lends itself to the ease of entering and exiting the travel lanes and allows through traffic to pass easily. Degree of Weaving and Actual Vehicle Speed The weaving and speeds experienced on a four lane roadway vary when compared to those on a three lane roadway. The average vehicle speed and speed variability usually decreases with a road diet conversion from a four lane roadway to a three lane cross-section. The need to “calm” or reduce vehicle speeds is often a reason for road diet conversions. The inability to change lanes or pass along a three lane roadway results in lower vehicle speed variability than along a four lane undivided roadway. Weaving or lane changing should not occur along a three lane roadway. Lane changing along four lane undivided roadways is done for lane positioning purposes and to bypass turning vehicles. On a four lane roadway, the ability to make these maneuvers decreases as volumes increase, however, and it can have safety impacts. The change in weaving and speeds is dependent on the current operation of the four lane roadway. The impacts should be small if the existing roadway is already operating as a de facto three lane roadway. Delay Vehicle delay and queuing must be considered when assessing the feasibility of a roadway for dieting. The road diet conversion includes geometric changes that can impact throughmovement vehicle delay and queues. Whereas, through vehicle delay related to left-turn traffic can be expected to decrease, the reduction in through lanes may result in a larger increase of peak-hour segment and/or intersection through vehicle delay. This difference in delay and queuing can be mitigated by coordinating signals, adding right-turn lanes, consolidating driveways, and redesigning intersection geometrics. Pedestrian and Bicycles Activity The level of existing or potential pedestrian and bicycle activities must be determined when evaluating for a road diet conversion, with safety as the prime consideration. Separate bicycle lanes or sidewalks can be added using the conserved right-of-way. For pedestrians and bicyclists, the somewhat slower and more consistent speeds of the road diet conversion are more desirable. A three lane roadway produces fewer conflict points between vehicles and crossing pedestrians, and the complexity of a pedestrian crossing the roadway is reduced. Crash Types and Severity As mentioned earlier road diet projects have experienced a reduction in the rate and frequency of crashes and their severity. One objective of a road diet conversion is the safety of all road users. The expected reduction in crashes and severity that results from a road diet conversion may primarily be the result of a reduction in speed and speed variability along the roadway, a decrease in the number of conflict points between vehicles, and improved sight distance for left turn vehicles on the converted roadway. Cost Typically, converting from four lanes to three lanes does not require additional right-of-way. The existing right-of-way is reallocated and requires only re-striping. Occasionally, limited right-of-way acquisition maybe needed for right turn lanes or intersection reconstruction needed to enhance the roadway operation. The cost for road diet conversion is significantly lower when compared to a roadway widening. Travel Patterns on Parallel Routes Depending on the traffic volume, a road diet may result in slower speeds and some decrease in level of service. If parallel routes exist which offer an alternative, there may be some diversion. Therefore, the potential impacts to parallel routes should be considered when evaluating the application of a road diet. Public Comment and Community Outreach Education and outreach play a critical role in the success of a road diet. Many projects have demonstrated that public opposition is strong in the early stages of a project. However, with committed stakeholders, and an organized education and outreach program skeptics can be enlightened about the benefits. Maps of Summit and Portage Counties are attached. Each map identifies the road diet candidates by ‘Tier,” as shown in the above tables Tiers are organized by Average Daily Traffic (ADT). Tier 1 candidates have ADT of less than 10,000 vehicles per day, and are most likely to be viable candidates for a road diet after proper review. Before initiating a road diet, please note that several drawbacks have been experienced regarding some road diet designs: • • • • • An overall reduction in the roadway capacity could lead to congestion on higher volume segments With only one through lane, stopped buses may put a temporary halt to traffic Depending on road diet design, bike lanes and on-street parking could be in conflict A reduction in the number of lane miles could result in a reduction in the allocation of federal funds for maintenance on some roadways Heavy use of the center turn lane due to a proliferation of driveways and cross streets, could result in increased crashes or delays Road diets have been used successfully across the United States for a number of years, and the process is endorsed by the Federal Highway Administration (FHWA) for safety as well as for complete streets development. In addressing safety issues and the integration of multiple travel modes, one low-cost solution that AMATS members may wish to consider is the road diet. The draft Road Diet Analysis is made available for comment and is posted on the agency web site. Draft Road Diet Analysis Summit County Tier 1 (ADT 10,000 or Less) Tier 2 (ADT 10,001-15,000) Tier 3 (ADT 15,001-20,000) Trails Bike Lanes 0 1 2 3 Miles 4 ¯ Draft Road Diet Analysis Portage County Tier 1 (ADT 10,000 or Less) Tier 2 (ADT 10,001-15,000) Tier 3 (ADT 15,001-20,000) Bike Lanes Trails 0 1 2 3 Miles 4 ¯ Attachment 6A AKRON METROPOLITAN AREA TRANSPORTATION STUDY MEMORANDUM TO: Policy Committee Technical Advisory Committee Citizens Involvement Committee FROM: Jason Segedy, AMATS Director RE: Resolution 2015-05 – Supporting an Increase in the Federal Gasoline Tax and Endorsing a New Federal and Statewide Transportation Policy Framework DATE: March 11, 2015 Background For the past several years, public officials throughout the Greater Akron area have recognized the pending insolvency of the Highway Trust Fund as a significant threat to the continued ability of our region to maintain its transportation infrastructure. In 2010, the AMATS Policy Committee passed a resolution endorsing a $0.10 per gallon increase in the federal gasoline tax, recognizing that the nation’s fiscal position with regards to transportation funding was rapidly eroding. The Highway Trust Fund is a significant source of revenue for nearly every sizable highway, public transit, bicycle, and pedestrian project in our region. Without this federal funding, progress on our region’s two highest transportation priorities – keeping our existing roads and bridges in a good state of repair; and making it safer and easier for our residents to walk, bike, and ride the bus – would grind to a halt. Highway Trust Fund Insolvency In 1956, when President Eisenhower signed the Federal-Aid Highway Act into law and created the Highway Trust Fund, it was envisioned as a self-supporting source of revenue based upon a “user fee” – the gasoline tax. This is no longer the case. The federal gasoline tax (18.4 cents per gallon) has not been raised since 1993. Because the tax was never indexed to inflation, its actual purchasing power has declined significantly, causing chronic fiscal problems for the Highway Trust Fund. Indeed, without Congressional action, the Highway Trust Fund is projected be insolvent later this year. The Fund, which is supposed to be self-sustaining, has not been so since 2008. Since that time, $55 billion in general revenue funds have been transferred into the Fund. Given that our nation’s general fund itself is only kept solvent by a national debt that now exceeds $17 trillion, we are essentially borrowing money from countries like China to pay for our roads. So, not only do our roads no longer pay for themselves; but increasingly, neither do our own citizens. This is a transportation future that President Eisenhower would never have imagined. It is clear that the current federal transportation system is fiscally unsustainable. Many different ideas have been proposed as a means of dealing with the pending insolvency of the Highway Trust Fund: corporate tax reform; a wholesale gasoline tax; a vehicle miles traveled fee; continued borrowing from the general fund; devolution of the federal transportation program; a diversion of funds from the United States Postal Service; or a fuel tax increase. The only viable and fiscally-responsible solution to this problem in the short-run is a $0.10 per gallon fuel tax increase, coupled with a new federal and statewide transportation policy framework (described below). The new policy framework outlined here recognizes that that we cannot just throw more money at the existing federal and statewide transportation programs, but that we should reform them so that the hard-earned taxpayer dollars that are allocated for transportation are spent more wisely, and in keeping with today’s social and economic realities. A New Federal and Statewide Transportation Policy Framework We think it important to have federal and statewide transportation programs that are stable, fiscally sound, and enable our region to continue to move its key transportation priorities forward – namely a “fix it first” program that prioritizes maintenance of existing roads and bridges over expanding highway capacity; and a diverse transportation program that uses well-targeted investments to improve mobility for those that walk, bike, and ride the bus to get to where they need to go. While our region could always use more federal and state funding, what we need even more is a new federal and statewide vision for transportation – one that prioritizes fixing the roads and bridges that we already have, and creating viable alternatives to driving. In many ways, we are still stuck in 1956 – both the federal and statewide transportation programs remain primarily the road-building programs that they were under President Eisenhower. Although both have made minor adjustments in their policy programs from time-to-time, neither USDOT nor ODOT have really looked beyond the completion of the Interstate Highway System. Both programs continue to encourage the addition of more and more highway capacity in a state that is no longer growing, and in a region of the state that is shrinking. Here in 2015, our current federal and statewide transportation policy framework is woefully inadequate for dealing with today’s realities in our region: no-growth urban sprawl; unstable and uncertain energy prices that are costing taxpayers and consumers more and more; inequality (li2 mited transportation access to jobs and social opportunities for the poor); and the desire of new generations to not be as car dependent. Our federal and state transportation programs need to be reformed from both a fiscal and a policy standpoint. These two issues should be addressed together, for they are inextricably linked. USDOT and ODOT both need to recognize that the continued focus on building more, wider, and more expensive roads (that state and local governments will be responsible for maintaining in perpetuity) is a large part of the reason why the Highway Trust Fund is insolvent, and is a large part of the reason why ODOT has had to resort to non-traditional funding mechanisms such as the creation of the Ohio Turnpike and Infrastructure Commission, which has issued over $1 billion in new debt, primarily to fund roadway capacity expansion projects. Our current fiscal difficulties are not just a matter of federal or statewide gas taxes failing to keep up with inflation, or per-capita vehicle miles traveled declining – they are directly related to how federal and state transportation dollars are being spent. ODOT, for example, should conduct a wholesale reassessment of its TRAC/Major-New Capacity program. While there are undoubtedly individual cases where new highway capacity could be added in Ohio; given that we are the seventh largest state, but have the fourth largest interstate system; and given that we rank 44th out of the 50 states in terms of population growth, and have low overall levels of traffic congestion, we are actually in the enviable position of not having to spend much money on building new or expanding existing roads if we so choose to. If the U.S. and Ohio do not act now to reform their transportation programs, future funding authorizations will become increasingly disconnected from both economic and social realities, and both programs will run the risk of fiscal collapse. It is in our citizens’ best interest to avoid even greater fiscal pain (in the form of future unfunded roadway maintenance liabilities) by reforming these programs sooner, rather than later. While there are exceptions, we have largely reached a point of diminishing returns when it comes to continuing to expand our highway system, which has served to create a self-reinforcing cycle of continued low-density, scattered development; greater fuel usage; greater automobile dependence; and greater difficulty for the poor to access social and economic opportunities. This is especially true in Northeast Ohio, where overall regional population has declined by 7% since 1970, but expenditures on new highway capacity have continued apace, and the region’s developed footprint has continued to increase (by an estimated 25% since 1970) – compelling taxpayers at all levels of government to pay for ever more infrastructure for ever fewer people. At AMATS, we have recognized this trend and have reprioritized the federal transportation funds that are available to our Metropolitan Planning Organization (MPO) accordingly. Our commitment to routine maintenance is reflected in both our Regional Transportation Plan and our Transportation Improvement Program. 3 Currently, 12% of our region’s pavements are in poor condition, and 7% of our bridges are structurally deficient. Our region is performing better in this regard than many of its peers, but roadway maintenance is not a one-time responsibility. Keeping our roads and bridges in a relatively good state of repair will be an ongoing and costly proposition that is likely to require nearly all available federal, state, and local funds over the next 20 years. The average bridge in our region, for example, is 49 years old, and maintenance that is deferred now, due to a lack of available funds, or a misallocation of resources, will end up increasing the cost of future bridge repair projects exponentially. Conclusion In closing, we are recommending that the Policy Committee endorse a $0.10 per gallon increase in the federal gasoline tax. We are also recommending that the State of Ohio continue to pursue innovative and nontraditional sources of revenue, such as the tolling of additional facilities, and further partnerships with local governments, and with the Ohio Turnpike and Infrastructure Commission. The Ohio gasoline tax of $0.28 per gallon, which was last increased in 2005, should also be reexamined, given declining local revenues and ongoing roadway maintenance needs. We make these recommendations with the recognition that we cannot solve our current fiscal difficulties by just increasing revenue, but that we also must reform our current transportation policy framework at both the federal and state level. As such, we recommend that both USDOT and ODOT adopt a new, fiscally-conservative transportation policy framework that does the following: • “Fix-It-First”, and prioritize roadway maintenance over highway expansion. • Invest more in the relatively inexpensive projects that provide residents (especially some of our most vulnerable citizens) with more transportation options, such as bicycle, pedestrian, and public transit operational improvements. We recognize that adopting a new transportation policy framework will entail difficult political decisions, and that there are many points of view to consider. However, we feel that we would be doing our members and citizens a disservice without honestly recognizing the public policy dimensions of the fiscal equation, on both the supply-side and the demand-side. Recommendation Attached to this memo is Resolution Number 2015-05, supporting an increase in the federal gasoline tax and endorsing a new federal and statewide transportation policy framework. The Staff recommends approval. 4 RESOLUTION NUMBER 2015-05 OF THE METROPOLITAN TRANSPORTATION POLICY COMMITTEE OF THE AKRON METROPOLITAN AREA TRANSPORTATION STUDY Supporting an Increase in the Federal Gasoline Tax and Endorsing a New Federal and Statewide Transportation Policy Framework WHEREAS, the Akron Metropolitan Area Transportation Study (AMATS) is designated as the Metropolitan Planning Organization (MPO) by the Governor, acting through the Ohio Department of Transportation and in cooperation with locally elected officials in Summit and Portage Counties and in the Chippewa Township and Milton Township areas of Wayne County; and WHEREAS, the Highway Trust Fund was established by Congress in 1956 as a means of funding transportation improvements; and WHEREAS, the revenues that support the Highway Trust Fund are generated through taxes on fuel; and WHEREAS, the existing federal tax on gasoline of 18.4 cents per gallon has not been increased since 1993; and WHEREAS, the Highway Trust Fund has had to have infusions of over $55 billion in general revenue funds from Congress since 2008, in order to remain solvent; and WHEREAS, the Highway Trust Fund’s precarious fiscal situation will necessitate spending cuts, tax increases, continued general fund transfers, or some combination of the three; and WHEREAS, budget cuts in the federal transportation program will mean that local governments, states, and regional transit authorities will have greater difficulty in maintaining our transportation infrastructure and providing a wider range of transportation alternatives; and WHEREAS, the Highway Trust Fund’s current reliance on general fund transfers is neither fiscally responsible, nor desirable, because it undermines the “user-pay” principle that has been in place since 1956; it threatens the loss of contract authority for planned transportation improvements; and it severely hampers the ability of AMATS and its member governments to reliably plan for the future; and WHEREAS, this Committee recognizes that neither the Federal nor the State government can solve current fiscal difficulties by simply increasing revenue, but that they also must reform their current transportation policy frameworks; and WHEREAS, this Committee believes that ODOT should continue to pursue innovative and nontraditional sources of revenue, such as the tolling of additional facilities, and further partnerships with local governments, and with the Ohio Turnpike and Infrastructure Commission; and 5 WHEREAS, this Committee believes that both USDOT and ODOT should reform their transportation programs by prioritizing roadway maintenance over highway expansion, as this Committee has already done at the regional level; and WHEREAS, this Committee believes that USDOT and ODOT should use some of the additional revenue raised by a federal fuel tax increase and by innovative financing mechanisms at the state level to invest more in the relatively inexpensive projects that provide residents with more transportation options, such as bicycle, pedestrian, and public transit operational improvements; and WHEREAS, this Committee believes that the continued ability of AMATS and its member local governments to plan for and to fund transportation improvements is of critical importance. NOW THEREFORE BE IT RESOLVED: 1. That this Committee recognizes that it is not fiscally responsible, nor is it in the public interest, to resort to deficit funding to pay for critical transportation improvements. 2. That this Committee therefore supports a ten-cent per gallon increase in the federal gasoline tax, in order to generate transportation revenue in a fiscally sound manner. 3. This Committee recognizes that neither the Federal nor the State government can solve current fiscal difficulties by simply increasing revenue, but that they also must reform their current transportation policy frameworks, by prioritizing roadway maintenance over highway expansion and by using some of the additional revenues raised to invest more in the relatively inexpensive projects that provide residents with more transportation options, such as bicycle, pedestrian, and public transportation operational improvements. 4. That this Committee authorizes the Staff to provide copies of this Resolution to the members of Ohio’s Congressional delegation and to other individuals and agencies, as appropriate, as evidence of action by the Metropolitan Planning Organization. ________________________________ Eugene Roberts, 2015 Chairman Metropolitan Transportation Policy Committee ________________________________ Date 6 Attachment 6B AKRON METROPOLITAN AREA TRANSPORTATION STUDY MEMORANDUM TO: Policy Committee Technical Advisory Committee Citizens Involvement Committee FROM: AMATS Staff RE: Resolution 2015-06- Approving Amendment #22 to the Transportation Improvement Program FY 2014-2017 to add two new projects, revise the schedule to two projects and revise the funding to one project. DATE: March 12, 2015 The following requests have been made to amend the TIP FY 2014-2017: New Projects Boston Mills Rd – is a new resurfacing and widening project in Boston Township. Engineering is scheduled in FY years 2015 and 2016 using $123,000 in Federal Lands Funds and construction is scheduled in FY 2017 using $171,000 in Federal Lands Funds. SR 8 Bridge – is a new study in Akron for the replacement and realignment of the SR 8 bridge between Perkins Street and Glenwood Avenue. This study is scheduled in FY 2015 using $1,100,000 in Major Bridge Funds and $275,000 in state funds. Revise Schedule or Funding Prospect St – move resurfacing and sidewalks from FY 2017 to FY 2015. Springdale Rd Bike Lanes – move construction from FY 2016 to FY 2015. SR 91 (Phase 2) – increase the cost of engineering in FY 2015 from $20,000 to $60,000. STAFF COMMENTS As with all TIP amendments, considerations with respect to public participation, financial capability, air quality, environmental justice and Plan consistency are important. Sufficient funding is forecasted from federal and state sources for this amendment. The new as well as the existing projects listed meet all amendment requirements mentioned above. Therefore this amendment does not cause any negative impact. STAFF RECOMMENDATION Attached to this memo is Resolution Number 2015-06. This Resolution approves the amendment to the TIP FY 2014-2017. The Staff recommends approval. RESOLUTION NUMBER 2015-06 OF THE METROPOLITAN TRANSPORTATION POLICY COMMITTEE OF THE AKRON METROPOLITAN AREA TRANSPORTATION STUDY Approving Amendment #22 to the Transportation Improvement Program FY 2014-2017 to add two new projects, revise the schedule to two projects and revise the funding to one project WHEREAS, the Akron Metropolitan Area Transportation Study (AMATS) is designated as the Metropolitan Planning Organization (MPO) by the Governor, acting through the Ohio Department of Transportation and in cooperation with locally elected officials in Summit and Portage Counties and the Chippewa Township and Milton Township areas of Wayne County and, WHEREAS, it is the responsibility of this Committee to develop and maintain the Transportation Improvement Program (TIP) and, WHEREAS, this Committee has been requested to amend the AMATS FY 2014-2017 Transportation Improvement Program for the following projects as discussed in the accompanying memorandum: 1. POR-Prospect St (PID #97705) – move construction phase from FY 2017 to FY 2015. 2. SUM-Boston Mills Rd (PID #99881) - add new resurfacing and widening project in Boston Township. Engineering is scheduled in FY years 2015 and 2016 using $123,000 in Federal Lands Funds and construction is scheduled in FY 2017 using $171,000 in Federal Lands Funds. 3. SUM-Springdale Rd Bike Lanes (PID #97864) – move construction phase from FY 2016 to FY 2015. 4. SUM-SR 8 Major Bridge (PID #91710) - is a new study in Akron for the replacement and realignment of the SR 8 bridge between Perkins Street and Glenwood Avenue. A study to determine the best design is scheduled in FY 2015 using $1,100,000 in Major Bridge Funds and $275,000 in state funds. 5. SUM-SR 91-Phase 2 (PID #92032) - increase the cost of engineering in FY 2015 from $20,000 to $60,000. WHEREAS, the necessary public involvement has been carried out as described in the AMATS 3P Public Participation Plan and, WHEREAS, the amendment has been judged to be air quality neutral and is, therefore, excluded from additional regional air quality conformity analysis and, WHEREAS, the environmental justice impacts of this amendment has been considered consistent with “Executive Order 12898 Federal Actions to Address Environmental Justice in Minority Populations and Low Income Populations” and, WHEREAS, this Committee has analyzed this request and found this amendment to be consistent with Transportation Outlook, the Regional Transportation Plan, and with the availability of federal funds forecasted for the AMATS area. 2 RESOLUTION NUMBER 2015-06 - Continued NOW THEREFORE BE IT RESOLVED: 1. That this Committee amends the Transportation Improvement Program FY 2014-2017 as previously specified. 2. That this Committee considers the necessary public involvement has been carried out as described in the AMATS 3P Public Participation Plan. 3. That this Committee affirms that sufficient federal funding is expected to be available for the Akron Urbanized Area to maintain financial constraint. 4. That this Committee reaffirms the air quality conformity determination of Transportation Outlook, the Regional Transportation Plan. 5. That this Committee affirms conformity with environmental justice requirements. 6. That this Committee affirms consistency with Transportation Outlook, the Regional Transportation Plan. 7. That this Committee authorizes the Staff to provide copies of this Resolution to the appropriate agencies as evidence of action by the Metropolitan Planning Organization. ________________________________ Eugene Roberts, 2015 Chairman Metropolitan Transportation Policy Committee ________________________________ Date 3 PID # CO-RTE -SECTION LENGTH MAP # AMENDMENT # 22 - 3/26/15 AMATS TRANSPORTATION IMPROVEMENT PROGRAM FY 2014-2017 TABLE H-3 HIGHWAY IMPROVEMENTS LOCATION & TERMINI TYPE OF WORK miles 97705 POR-PROSPECT ST (Revise Schedule) 99881 SUM-BOSTON MILLS RD-Phase 1 (New Project) 97864 SUM-SPRINGDALE RD-Bike Lanes (Revise Schedule) 91710 SUM-SR 8 Major Bridge (New Study) 92032 SUM-SR 91-Phase 2 (Darrow Rd) (Revise Funding) FUND TYPE P H A S E FISCAL YEAR 2014 2015 1.92 ROOTSTOWN TWP, RAVENNA TWP PROSPECT ST FROM SR 5/44 TO RAVENNA SOUTH CORP LINE RESURFACING SIDEWALKS CROSSWALKS PEDESTRIAN SIGNAL STP-A TAP LOCAL C C C 360.0 120.0 120.0 0.19 BOSTON TOWNSHIP BOSTON MILLS RD FROM 1,000 FEET WEST OF RIVERVIEW RD TO RIVERVIEW RD RESURFACING WIDEN SHOULDERS BASE REPAIRS UPGRADE GUARDRAIL NPS LOCAL NPS LOCAL P P C C 70.0 25.6 0.38 STOW SPRINGDALE RD FROM HUDSON DR TO BERKSHIRE RD BIKE LANES TAP-A LOCAL C C 266.5 66.6 0.10 AKRON SR 8 BRIDGE BETWEEN PERKINS AND GLENWOOD STUDY OF REPLACEMENT AND REALIGNMENT BR STATE P P 1,100.0 275.0 STP-A LOCAL P P 60.0 20.0 5.0 15.0 STP-A LOCAL STP-A LOCAL R R C C 0.56 TWINSBURG SR 91 (DARROW RD) FROM NORTH OF GLENWOOD BLVD TO THE TWINSBURG NORTH CORP LINE WIDEN TO FOUR LANES ROUNDABOUT DRAINAGE SIDEWALK 2016 2017 360.0 90.0 53.0 19.4 AIR TOTAL PROJECT PROJECT QUALITY COST SPONSOR STATUS ($000) 500.0 PORTAGE COUNTY ENGINEER EXEMPT 401.5 SUMMIT COUNTY ENGINEER EXEMPT 333.1 STOW EXEMPT 1,943.7 ODOT EXEMPT 171.0 62.5 266.5 66.6 3,740.0 TWINSBURG ANALYZE 140.0 35.0 3,440.0 860.0 Resolution 2015-06 Amendment #22

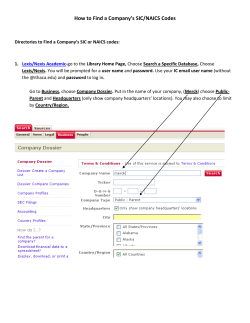
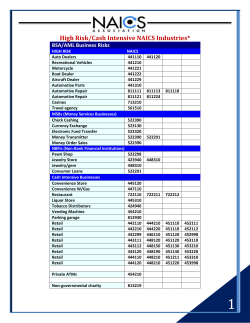
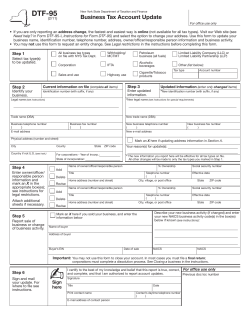


© Copyright 2026