
22/04/2015 SSD Fish Monitoring Report
Solent & South Downs Fish Monitoring
Report 2014
We are the Environment Agency. We protect and improve the environment
and make it a better place for people and wildlife.
We operate at the place where environmental change has its greatest impact
on people’s lives. We reduce the risks to people and properties from flooding;
make sure there is enough water for people and wildlife; protect and improve
air, land and water quality and apply the environmental standards within
which industry can operate.
Acting to reduce climate change and helping people and wildlife adapt to its
consequences are at the heart of all that we do.
We cannot do this alone. We work closely with a wide range of partners
including government, business, local authorities, other agencies, civil society
groups and the communities we serve.
Authors: D. Longley & P. Rudd
Published by:
Environment Agency
Horizon house, Deanery Road,
Bristol BS1 5AH
Email: [email protected]
www.gov.uk/environment-agency
Further copies of this report are available
from our publications catalogue:
www.gov.uk/government/publications
or our National Customer Contact Centre:
T: 03708 506506
Email: [email protected].
© Environment Agency 2014
All rights reserved. This document may be
reproduced with prior permission of the
Environment Agency.
2 of 71
Foreword
This is our eighth consecutive annual Solent and South Downs Area fish monitoring report and we
hope you find it useful. Its purpose is to provide details of all the fish surveys undertaken in 2014,
to present the results and, where appropriate, to set these in the context of previous years' results
as well as environmental data such as for flow and temperature. It is written primarily for the
angling community but also for people and organisations of all kinds with an interest in rivers,
coastal waters and the fish they support.
Our 2014 fish monitoring programme was dominated by Water Framework Directive (WFD)
surveys, the majority of which were in West Sussex and included a high proportion that had never
been visited before. As a result, surveys were less focused on specific fisheries and more on a
wide range of less studied tributaries and reaches. Collectively, this yields a great deal of valuable
fish data, providing us with an evidence base not only to improve ecology as part of our WFD work
but also to underpin more effective fisheries management.
The fish monitoring programme was undertaken as scheduled, between April and October, with
only minor postponements and no cancellations. River surveys involved electric fishing, either from
a boat or wading, while estuary surveys used seine and fyke netting, beam and otter trawling.
Details of various survey types are given in the section titled: "Interpreting results".
Readers of this report in previous years will know that we emphasise the relevance of weather
data on our fish survey results and in recent years there has been no shortage of anomalous
weather that has undoubtedly affected local fish populations. However, 2014 set new benchmarks
on this front, with the Met Office reporting that winter 2013/14 was the stormiest in twenty years,
with a succession of twelve major winter storms between December and February. It was also the
wettest in their England and Wales precipitation series dataset, since 1766. In Romsey in
December 2013, our rain gauge recorded just over 210% of the average rainfall for that month: in
January it was 323%. With local rivers severely flooded from source to sea, it's clear that this
extreme weather influenced fish communities, coarse, game and sea, and this is an important
aspect of the various discussion sections throughout the report.
Acknowledgements
The collection of this essential fish population data would not be possible without the support and
assistance of the landowners, fishing clubs, river keepers, farmers and land agents who kindly
allowed us access to their rivers in 2014 and in many cases provided valuable local knowledge
and advice.
3 of 71
Executive summary
•
We conducted 88 fish population surveys across Solent & South Downs area in 2014: 46 for
Water Framework Directive classification of freshwaters; 26 for WFD estuaries (Southampton
Water & Adur); 6 for juvenile salmon (Test); 2 for juvenile wild brown trout (Meon), 5 for
Principal Coarse Fisheries (Western Rother) and 3 surveys connected to specific habitat
enhancement projects.
•
As expected, Water Framework Directive surveys reflected a broad spectrum in the quality of
fish communities at contrasting survey sites, from quite severely damaged environments to
those that are virtually pristine. Surveys conducted in 2014 provide evidence of pressures on
fish communities resulting from, amongst other factors, barriers to migration, habitat
degradation, poor water quality and the presence of non-native invasive species.
The six Principal Salmon River surveys conducted on the Test in 2014 suggested that parr
abundance in 2014 was amongst the lowest recorded, probably as a result of the impacts of
floods on spawning conditions and juvenile habitat during the previous winter.
•
•
•
Wild brown trout surveys on the Meon revealed high numbers of juveniles at Mislingford but
average numbers at Titchfield (Silver Springs), suggesting that the key trout spawning grounds
in the middle reaches were not adversely impacted by the previous winter's flooding.
Western Rother Principal Coarse Fishery surveys showed a continuation of very low
abundance of coarse fish in general, particularly dace and roach.
•
Estuarine fish monitoring in Southampton Water yielded relatively large catches, with the third
highest total number of fish caught in spring (out of eight survey years) and also the third
highest in autumn. The dominant species in both seasons were sand smelt, common goby,
juvenile bass and juvenile herring.
•
Estuarine fish monitoring on the Adur produced the second lowest spring catch but the highest
autumn catch to date. The dominant species were juvenile bass, common goby and sand goby.
4 of 71
Rivers of Solent & South Downs
East:
West:
5 of 71
Contents
Foreword ....................................................................................................................................... 3
Executive summary ...................................................................................................................... 4
Rivers of Solent & South Downs ................................................................................................. 5
Contents ........................................................................................................................................ 6
Temperature and rainfall .............................................................................................................. 7
Interpreting results ..................................................................................................................... 10
1. East Sussex .......................................................................................................................... 12
1.1. Ouse and Cuckmere.......................................................................................................................................... 12
2. West Sussex ......................................................................................................................... 16
2.1. Adur ................................................................................................................................................................... 16
2.2. Arun ................................................................................................................................................................... 22
2.3. Western Rother & Western Streams ................................................................................................................. 26
3. Isle of Wight........................................................................................................................... 34
4. Hampshire ............................................................................................................................. 38
4.1. East Hampshire ................................................................................................................................................. 38
4.2. Test & Itchen ..................................................................................................................................................... 45
5. Estuarine Fish Monitoring ...................................................................................................... 56
5.1. Southampton Water........................................................................................................................................... 56
5.2. Adur Estuary ...................................................................................................................................................... 65
6. Fish monitoring in 2015 ......................................................................................................... 69
List of abbreviations .................................................................................................................. 70
Glossary .................................................................................................................................... 70
6 of 71
Temperature and rainfall
The quality of river fisheries is very dependent on weather because fish survival and growth are so
strongly influenced by temperature and river flow. Graph TR1 shows the mean (average) Central
England Temperature (CET) for each summer since 2000, as well as the mean temperature for the
preceding winter - both of these values are highly relevant to fish survey results in each year.
Graph TR1: mean summer and winter Central England Temperature
17
14
13
12
11
15
10
14
9
8
13
Deg C WINTER
Deg C SUMMER
16
7
6
12
5
11
4
Mean temp May-Sept
Mean winter temp in preceding Oct-Mar
Similarly, graph TR2 shows total summer and winter rainfall for the Solent and South Downs area,
using the means of rainfall totals from gauges at Romsey and Eastbourne.
Graph TR2: total summer and winter rainfall
160
140
MM
120
100
80
60
40
20
Mean rainfall in preceding Oct-Mar
Mean rainfall Apr-Sept
The first graph shows that mean summer temperature in 2014 was higher than in any of the
preceding seven years and ended the succession of cool summers since 2007. This is very
relevant in assessing the status of river coarse fish communities, as it is unlikely that any strong
7 of 71
coarse fish year classes (unusually large generations) were produced in this period. Although this
is a positive feature, 2014's mean summer temperature was only slightly above average.
Graph TR2 shows that winter 2013/14 was unusually mild, driven by the procession of storms that
hit the UK from the South West. Although a lack of hard frosts may favour over-winter survival of
juvenile coarse fish, severe floods do not and graph TR2 establishes the magnitude of winter
rainfall in the area in winter 2013/14. It also shows that summer rainfall was roughly average in
2014, influenced particularly by a wet August.
Mean, annual or seasonal values are useful for comparing long-term data for any specific year but
they tend to mask briefer periods of weather that may have influenced fish communities. Graph
TR3 shows mean monthly Central England Temperature for winter 2013/4 and summer 2014,
compared with the monthly means, maximums and minimums for the period 2000-2013.
Graph TR3: Mean monthly Central England Temperature, 2014
20
18
16
14
12
Deg C
10
8
6
4
2
0
-2
Oct
Nov
Dec
Jan
Feb
Mar
Apr
May
Jun
Jul
Aug
Sep
Oct
Monthly mean temp. Oct 2013 - Dec 2014
Monthly mean 1999-2013
Max 1999-2013
Min 1999-2013
Nov
Dec
Graph TR4 shows total rainfall measured by the Romsey rainfall gauge in winter 2013/14 and
summer 2014, compared to the 2000-2013 monthly mean, maximum and minimums.
Graph TR4: Romsey total monthly rainfall, 2014
300
250
MM
200
150
100
50
0
Oct
Nov
Dec
Jan
Feb
Mar
Apr
May
Jun
Jul
Aug
Sep
Oct
Nov
Monthly total Oct 2013-Dec 2014
Mean monthly total 2000-2013
Max. total 2000-2013
Min. total 2000-2013
Dec
Graph TR3 reveals that, with the exception of November 2013, mean monthly temperature for
each month up to July lay between the long-term average and the previous maximum, i.e.
8 of 71
November to July was consistently, but not exceptionally, warm. The one anomaly in this graph is
the abrupt dip in mean temperature for August; the lowest mean August temperature recorded
since 2000.
Naturally, graph TR4 is dominated by the peak representing the exceptional rainfall between
December and February, but it's also interesting to see how little rain fell in July and September
and how much in August.
The key questions these weather observations raise are:
– Did the 2013/14 winter flooding reduce juvenile coarse fish survival and disrupt salmonid
spawning by "drowning out" spawning gravels?
– Did the relatively high temperatures in spring and early summer result in early salmonid fry
hatching and subsequent rapid growth?
– Similarly, did these temperatures favour early coarse fish spawning and result in an unusual
abundance of young of the year coarse fish?
– Did the exceptionally low temperatures and high rainfall in August impact fish communities?
In each of the individual catchment chapters, these questions are addressed wherever our data
indicates the most likely answers.
Left: Sadlers Mil causeway in Romsey at the peak of the flooding
Right: Pitton, Wiltshire, near the source of the Dun
9 of 71
Interpreting results
Fish survey methods
The majority of fish population surveys covered in this report were conducted using electric fishing,
either from a boat or wading. Electric fishing involves the placement into the water of a pole with a
large metal ring at the end (the anode), which is energised with electricity from a small generator or
battery. A circuit is formed through the surrounding water between the anode and a length of
copper braid (cathode) placed in the water a few metres away. The current is carefully controlled
via specialised circuitry in a control box and causes fish to swim towards the anode and become
partially anaesthetised so they can easily be collected in a hand net. The type of current used is
known as Pulsed Direct Current. Voltage, pulse frequency and pulse "width" (duration) are all
adjusted for each specific location with the aim of capturing fish, with the minimum electrical power
and therefore the minimum risk of injury.
All electric fishing surveys reported involve the team wading or boating slowly upstream, usually for
100 metres, until they reach a stop net placed across the channel to prevent fish escaping from the
survey reach. Captured fish are placed in a container of cool, aerated water and identified and
counted before being returned to the river. Scales are sometimes taken so that fish ages can be
checked.
Estuarine fish surveys don't use electric fishing, because of the very high conductivity of salt water.
Instead, a combination of beach seine netting, small beam trawling and fyke netting (a type of
static fish trap) is used. Seine netting is sometimes also used to conduct fish surveys in very wide,
slow rivers.
Types of electric fishing survey
All Water Framework Directive and salmonid surveys discussed in this report involve a single
upstream electric fishing run or pass ("single run"), whereas Principal Coarse Fishery and Eel
Index surveys involve three successive runs ("catch depletion") - multiple run surveys require
upstream and downstream stop nets to ensure the isolation of the survey reach.
Fish survey results
Single-run electric fishing surveys don't catch every fish in the reach they cover, so the catch is a
minimum estimate and gives a general idea of the species present and their abundance.
Catch depletion surveys catch the majority, but usually not all, of the fish in the survey reach.
However, the difference in catch in each successive run allows a reliable estimate of the total
population of each species to be calculated. Catch depletion results shouldn't be compared directly
with single run results, although sometimes single run results are compared to the first run of a
catch depletion survey. The results from both types of survey are expressed as the number or
weight of fish per 100m2 of river.
Catch Per Unit Effort surveys (CPUE)
Some electric fishing surveys for juvenile salmon and trout (parr) take place in sections of river that
are too wide, shallow and weedy for stop nets to be used and for two anodes to fish the whole
width effectively. Under these circumstances a reasonable measurement of parr abundance can
be made by fishing with an electric fishing backpack unit and wading in a straight line upstream,
through suitable parr habitat, for a set distance and period of time. If the time fished and the
distance covered is kept consistent, then data can be compared between sites and between years.
We use this method for several of our salmon parr surveys on the Test and Itchen, fishing for
exactly five minutes and covering approximately 75 metres.
10 of 71
Water Framework Directive surveys
Brookside
Cuckmere, Warbleton to Lower Horsbridge 44
Isfield Weir
Uck (Ridgewood Stream to Ishurst)
7
Stroodland Wood
Uck (Ridgewood Stream to Ishurst)
3
Priors Barn
Shortbridge Stream
Avins Bridge
Ouse, Ardingly Reservoir to Lindfield
Brook lamprey
Stone loach
Minnow
Bullhead
Chub
Dace
Gudgeon
3 29
3
4
14
3
Eel
Pike
Perch
Roach
Site name & status Waterbody name & Status
Brown trout
Because Water Framework Directive surveys are so numerous and are not grouped into specific
fisheries, we present their results in concise tables like this one for the Ouse catchment:
3
2
7
3
4
35
103
1
1
1
1
1
These tables indicate the WFD status of each individual survey site and the status of the
waterbody that they represent using a colour-code, as follows:
Blue=High; Green=Good; Yellow=Moderate; Orange=Poor; Red=Bad.
The right hand side of the table shows the numbers of each species caught in the surveys. Cells in
the species columns highlighted red indicate species that have the largest discrepancy between
expected and observed abundance at that site. Cells highlighted yellow are also less abundant
than expected but to a lesser degree. Where the site status is less than good, it is the absence or
low abundance of these species that are causing the failure.
11 of 71
1. East Sussex
1.1. Ouse and Cuckmere
Four single-run Water Framework Directive fish surveys were undertaken in the Ouse catchment in
2014, two on the River Uck and two on the Ouse itself. Only one fish survey was carried out in the
Cuckmere catchment in 2014, a single run WFD survey at Brookside on the Waldron Gill.
Map E. Sussex 1 shows the location of the five WFD fish surveys carried out in 2014
Map E. Sussex 1: 2014 fish survey locations
Results
Table E. Sussex 1 shows the site status, waterbody status and catch at each of the East Sussex
WFD fish surveys. Status is colour coded, as follows:
Blue=High; Green=Good; Yellow=Moderate; Orange=Poor; Red=Bad.
12 of 71
Brookside
Cuckmere, Warbleton to Lower Horsbridge 44
Isfield Weir
Uck (Ridgewood Stream to Ishurst)
7
Stroodland Wood
Uck (Ridgewood Stream to Ishurst)
3
Priors Barn
Shortbridge Stream
Avins Bridge
Ouse, Ardingly Reservoir to Lindfield
Brook lamprey
Stone loach
Minnow
Bullhead
Chub
Dace
Gudgeon
3 29
3
4
14
3
Eel
Pike
Perch
Site name & status Waterbody name & Status
Roach
Brown trout
Table E. Sussex 1: WFD survey results
3
2
7
3
4
35
1
1
103
1
1
1
Graph E. Sussex 1 shows the total density of all fish species caught at each survey site in East
Sussex in 2014.
Graph E. Sussex 1: Species density at all survey sites.
80
Brook lamprey
70
Minnow
60
No/ 100m²
Stoneloach
50
Bullhead
Gudgeon
40
Eel
30
Pike
20
Perch
10
Dace
Chub
0
Isfield Weir
Stroodland
wood
River Uck
Priors Barn
Avins bridge
Brookside
Shortbridge
Stream
River Ouse
Cuckmere
Roach
Brown trout
13 of 71
Graph E. Sussex 2 shows the biomass of fish caught, excluding minor species, at the WFD sites in
East Sussex.
Graph E. Sussex 2: Species biomass
1400
1200
Gudgeon
g/100m²
1000
Eel
800
Pike
600
Perch
400
Dace
200
Chub
0
Isfield Weir
Stroodland
wood
River Uck
Priors barn Avins bridge
Brookside
Roach
Brown trout
Shortbridge
Stream
River Ouse
Cuckmere
Discussion
2014 was a quiet year for fish surveys in East Sussex. The only surveys undertaken were five
Water Framework Directive surveys, four in the Ouse catchment and one on the Cuckmere. 2014
falls between years when we carry out biennial eel index and Principal Coarse fishery surveys,
which usually result in a much larger survey schedule.
The catch at Brookside, on the Cuckmere, was dominated by brown trout, with the majority of the
fish 1+ and older. This high catch of brown trout has resulted in a WFD classification of good for
both the Brookside site and the overall waterbody it is represents.
Brown trout were also caught at Avins Bridge on the Ouse and Priors barn on the Shortbridge
stream (a Tributary of the Ouse) although in lower densities. Brown trout were absent from the two
sites on the River Uck, with Isfield weir containing a mixture of coarse fish at low densities and
Stroodland Wood producing just a small number of roach and minor species. The fish community
at this site is impacted by a large weir a short distance downstream.
Overall, Brookside and Priors Barn had the highest biomass (Graph E. Sussex 2), comprised
entirely of brown trout. These two sites also showed the highest density of fish, although these
densities were predominantly made up of bullhead at Prior's Barn and stone loach and brown trout
at Brookside (Graph E. Sussex 1).
14 of 71
WFD statuses for sites in the Ouse catchment ranged from moderate (Isfield Weir) to bad (Avins
bridge). The species driving each failure are highlighted in table E. Sussex 1, with most of the sites
showing a lack of brown trout and minor species such as bullhead.
Left: View from the survey boat at Stroodland Wood
Right: The Uck at Stroodland Wood
15 of 71
2. West Sussex
2.1. Adur
In 2014, we carried out 11 single-run Water Framework Directive surveys across the Adur
catchment. The five triennial Principal Coarse Fishery surveys are scheduled to be completed in
2015.
Map Adur 1 shows the locations of River Adur fish surveys in 2014.
Map Adur 1: Fish survey site locations
Results
Table Adur 1 shows the site status, waterbody status and catch at each of the Adur WFD fish
surveys. Status is colour coded, as follows:
Blue=High; Green=Good; Yellow=Moderate; Orange=Poor; Red=Bad.
16 of 71
12 18
4
D/s Chess Bridge
Chess Stream
3
74
12
82
4
7 11
Park Farm
Chess Stream
Hookers Farm
R. Adur East
49
8
1 40
53
3
3
15
2
3
U/s Twineham Footbridge R. Adur East
Shermanbury Place GS
River Adur East (Sakeham)
D/s Herrings Bridge
Herrings Stream
Wortleford Bridge
R. Adur East (Goddards Green)
Capps Bridge
R. Adur West
West Grinstead
Adur (Lottbridge)
3 10
1 12
1
2
21
2
28
1
2
3
3
30
41
2
1
9
1
1
5
4
2
15 18
21
4 16 19
3 29 10 13
5
3-sp stickleback
15
6 11
Brook lamprey
4
8
1
Chub
8
2
Dace
101
Cowfold Stream
Stone loach
Gudgeon
Adur (Knepp)
Sheepfield Shaw
Waterbody name & Status
Rudd
Tenchford Bridge
Site name & status
Bullhead
Eel
9
Pike
5
Perch
Roach
Roach x bream hybrid
Common bream
Common Carp
Mirror Carp
Brown trout
Table Adur 1: WFD survey results
1
5
4
7
9
7
60
7
7 17 14 29
6
4
3
1
7
2
1
2
7
1
1
The backpack survey in progress (left) at Sheepfield Shaw and one of two adult wild brown trout
caught there (right)
17 of 71
Graphs Adur 1 - Adur 3 are length frequency histograms showing the numbers of roach, chub and
eels, respectively, in different length categories based on the catches from all eleven Adur surveys
combined. The roach and chub histograms are presented using identical X and Y axes to allow
population structure and abundance to be compared easily.
Graph Adur 1: Roach length frequency for all Adur surveys combined
25
n=361
20
15
10
5
5
20
35
50
65
80
95
110
125
140
155
170
185
200
215
230
245
260
275
290
305
320
335
350
365
380
395
410
425
440
455
470
0
mm
Graph Adur 2: Chub length frequency for all Adur surveys combined
25
n=141
20
15
10
5
5
20
35
50
65
80
95
110
125
140
155
170
185
200
215
230
245
260
275
290
305
320
335
350
365
380
395
410
425
440
455
470
0
mm
Graph Adur 3: Eel length frequency for all Adur surveys combined
25
20
n=129
15
10
5
5
25
45
65
85
105
125
145
165
185
205
225
245
265
285
305
325
345
365
385
405
425
445
465
485
505
525
545
565
585
605
625
0
mm
18 of 71
Graph Adur 4 shows fish species densities caught downstream (d/s Chess Bridge) and upstream
(Park Farm) of a series of impounding structures on the Chess stream, a tributary of the Adur.
Graph Adur 4: Species density downstream and upstream of flow control structures on the
Chess stream
90
Stone loach
80
Bullhead
70
Gudgeon
No/100m²
60
European eel
50
Pike
40
Perch
30
Dace
20
Chub
10
Roach
Brown / sea trout
0
D/s Chess Bridge
Park Farm
Discussion
Table Adur 1 provides details of the catches at the eleven WFD surveys conducted in 2014 and
shows the site and waterbody status calculated by our WFD fish classification tool (Fisheries
Classification Scheme version 2: FCS2). The table clarifies the broad range in fish status amongst
the surveys, with three classed as High, one as Good, three as Moderate and four as Poor.
Amongst the High and Good survey results, the abundance of certain species at some sites is
particularly notable: roach at Tenchford Bridge; eel and roach downstream of Chess Bridge and
roach, chub and gudgeon at Hookers Farm.
Amongst the surveys deemed less than Good, absence of brown trout was the main factor for five
of the seven, with absence or lack of roach, eel, chub, bullhead and stone loach also problematic
at various sites. West Grinstead's Poor status is attributed to a general lack of fish, across several
species.
Therefore, the general picture is of the majority of sites surveyed in 2014 not achieving Good
status (our goal for WFD) but with a few sites supporting exceptional fish communities.
Graphs Adur 1-3 show the abundance of roach, chub and eels according to length categories,
which clarifies each population's age structure - the figures also give the total number of each
species caught across the eleven surveys. As the WFD table shows, these species were not
evenly distributed between the sites.
Adur 1 shows that very few Adur roach exceed 20cm, suggesting slow growth and maturity at a
relatively small size. A clear group of young of the year (0+) roach is apparent between 35-45mm
but almost all of these were from Hookers Farm: roach of this size were absent from most sites.
Adur 2 shows that Adur chub have a much greater size range, as you would expect for this larger
species. However, even slow-growing chub of these larger sizes are likely to be much older than
the largest roach in the 2014 data. As with the roach graph, these is a clear group of young of the
year chub but once again, most these were caught at Hookers Farm and eight of the eleven sites
produced none.
19 of 71
Adur 3 shows that a total of 129 eels were caught across the eleven surveys, ranging in length
from 80-620mm. Approximately 64% of these were caught at d/s Chess Farm, which is the site
closest to the tidal limit. With the exceptions of Park Farm and Sheepfield Shaw, eels were
relatively scarce at most other sites and absent from the catch at Shermanbury Place, suggesting
there may be problems with migratory access and / or a lack of suitable habitat with abundant
food.
Numbers of brown trout and bullhead are generally low in the Adur, with the former only found at
two of the eleven sites surveyed. There are known problems with water quality in some reaches
and areas of suitable spawning gravels and parr habitat are limited. Weirs and other structures that
impound water or obstruct migration are likely to be particular constraints on trout distribution and
abundance.
If we look at the Chess stream in more detail, we can see the difference made by such structures
(Graph Adur 4). At d/s Chess Bridge we recorded a very high abundance of eels and roach and
reasonable abundances of perch, chub and dace - it was also one of only two sites on the Adur
where brown trout were recorded in 2014. Several impounding structures exist between that
survey site and the next one upstream: Park farm. Here, there were far fewer eels, no trout and
fewer coarse fish, including bullhead and stone loach. Total fish density was 69.2 fish per 100m²
downstream and 4.29 fish per 100m² upstream. The WFD site status reflects this (d/s Chess
Bridge: High; Park Farm: Poor).
Our South Downs Fisheries, Biodiversity and Geomorphology Team have improved conditions for
coarse fish, salmonid and eel migration on the Adur with the complete removal of two obsolete
weirs in 2014 and another, at Wineham, is currently being reduced.
Left: Good marginal vegetation cover at Hookers farm on the river Adur
Right: A healthy chub from d/s Chess bridge on the Chess Stream
20 of 71
Left: An example of one of the many elvers captured on the Adur in 2014
Right: One of a number of barriers to fish migration on the Adur. Great work is being done to
reduce the number and impact of these on migratory fish species
21 of 71
2.2. Arun
In 2014 on the River Arun, we surveyed four sites, two on the main river channel and two on the
North River. All four sites were single run Water Framework Directive surveys.
Map Arun 1 shows the locations of fish surveys undertaken on the river Arun in 2014 for the WFD
Map Arun 1: 2014 WFD fish surveys
Results
Table Arun 1 shows the site status, waterbody status and catch at each of the Arun WFD fish
surveys. Status is colour coded, as follows:
Blue=High; Green=Good; Yellow=Moderate; Orange=Poor; Red=Bad.
22 of 71
13
6
1
2
5
14
6
1
1
172 37 51
14
1
25 40
3
2
2
58
23
7
1
3-sp stickleback
9
Bullhead
Bleak
11
Stone loach
R. Arun (U/S Pallingham)
5
Minnow
Bignor Farm
2
Chub
North River
1
Dace
Northlands Farm
23
Gudgeon
North River
Eel
Oakwood Hill
Pike
R. Arun Horsham
Perch
Theale Farm
Roach
Site name & status Waterbody name & Status
Brown trout
Table Arun 1: WFD survey results
1
Graph Arun 1 shows the overall density of each survey carried out in the Arun catchment in 2014.
This density includes minor species such as bullhead, minnow, stone loach and 3-spined
stickleback.
Graph Arun 1: Species density
70
3-spined stickleback
Stone loach
60
No/100m²
Minnow
50
Bullhead
40
Gudgeon
European eel
30
Pike
20
Perch
Bleak
10
Dace
0
Northlands Oakwood
Farm
Hill
North River
Bignor
Farm
Theale
Farm
Chub
Roach
Brown / sea trout
River Arun
23 of 71
Graph Arun 2 shows the species biomass, for each survey, not including minor species.
Graph Arun 2: Species biomass
1200
Gudgeon
g/100m²
1000
European eel
800
Pike
600
Perch
Bleak
400
Dace
200
Chub
0
Northlands Oakwood
Farm
Hill
North River
Bignor
Farm
Theale
Farm
Roach
Brown / sea trout
River Arun
Discussion
On the North River, a tributary of the Arun, which joins the main river near Slinfold, downstream of
Horsham, our two surveys were carried out in very different habitats. The upstream site, at
Oakwood Hill was characterised by a gravel substrate and large riffles, whereas the downstream
site at Northlands Farm was generally slow flowing with a clay bed. As a consequence, the
upstream site was dominated by brown trout (see Graph Arun 2) and bullhead (see Graph Arun 1),
whereas the downstream site had an overall lower density and biomass, with low numbers of
coarse fish including roach, dace and perch. The WFD status of the two waterbodies is Good for
Oakwood hill and Poor for Northlands farm. The lower status at Northlands farm is driven by a lack
of brown trout, eel and minnow.
The trout at Oakwood Hill varied from 0+ (young of the year) fish through to adult fish of 30cm,
indicating successful spawning in this reach. Only one eel was captured in the two surveys on the
North river, most probably due to a number of impounding weirs downstream of the site at
Northlands Farm, which are probably also responsible for the sluggish flows found at the site.
Of the two sites on the main Arun, the upstream site at Theale Farm produced by far the greater
density and biomass of fish (Graphs Arun 1 & 2) and yielded ten species. Further downstream at
Bignor Farm, both fish density and biomass were low, and featured fish species more commonly
found in slow flowing stretches such as bleak, roach and pike. A clay substrate and lack of habitat
diversity are the likely reasons for this limited fish community, with little in the way of refuge areas
for fish in high flow events. The Bignor farm survey resulted in a WFD site classification of Poor,
primarily because of a lack of minnow and low numbers of other fish species in general.
As with the Adur, our South Downs Fisheries, Biodiversity and Geomorphology Team are working
to enhance fish habitat and remove obstructions to fish passage on the Arun, notably through the
Arun and Rother Connections Heritage Lottery Project (ARC). This project saw a key obstruction
removed and a fish pass installed in 2014, with another pass to be constructed in 2015. The
24 of 71
project will also enhance sections of the Arun's middle reaches, particularly with the construction of
backwater refuge areas designed to improve juvenile coarse fish survival.
Left: Shallow riffle areas at Oakwood Hill provided good habitat for brown trout
Right: The impounded stretch at Northlands Farm contained low numbers of coarse fish
25 of 71
2.3. Western Rother & Western Streams
As well as the five annual Principal Coarse Fishery surveys on the Western Rother, we also
carried out five Water Framework Directive surveys in the Western Rother catchment in 2014. Two
of these were on the main channel, two were on the Hammer stream and one was on the
Aldingbourne Rife, a small coastal stream south of Chichester. Four of the five PCF surveys also
serve a WFD purpose.
Map WR1: Western Rother survey locations
26 of 71
Results:
WFD results
Table WR1 shows the site status, waterbody status and catch at each of the Western Rother WFD
fish surveys. Status is colour coded, as follows:
Blue=High; Green=Good; Yellow=Moderate; Orange=Poor; Red=Bad.
D/s Hammer Pond
Hammer Stream (W. Sussex)
U/s Mizzards
Western Rother Durford
2
Durford Bridge
Western Rother Durford
7
Stanbridge
W. Rother U/S Petersfield
3
Felpham Way
Aldingbourne Rife
4
1
2
7
3
5
3
1
1
2
3
6
1
3
1
2
1
4
1
1
8
1
Minnow
1
Bullhead
4
3-sp stickleback
2 111 17 38
1
Chub
1
Flounder
Rudd
1
1
Brook lamprey
Hammer Stream (W. Sussex)
3
Stone loach
Milland
4
Dace
Western Rother
2
Gudgeon
Western Rother
Fittleworth
Eel
Coultershaw
Roach
2
Pike
Western Rother
Perch
Terwick Mill
Common bream
Site name & status Waterbody name & Status
Brown trout
Table WR1: 2015 WFD survey results, Western Rother & Western Streams
2
1
45
41
45
7 14
77
2
1
6
1
11
3
1
1
28
1 26
3
5
1
Adult & juvenile American signal crayfish at Durford Bridge (left),
Excellent riparian habitat downstream of the Hammer pond, Hammer Stream (right)
27 of 71
Graph WR1 shows the density (number per 100m2) of fish species at the five Western Rother WFD
survey sites:
Graph WR1: WFD survey fish density
40
Flounder
Brook lamprey
35
Stone loach
30
Minnow
Bullhead
No/100m²
25
3-sp stickleback
20
Eel
Pike
15
Perch
10
Rudd
5
Roach
Common bream
0
u/s Mizzards
Durford
Bridge
Milland
Western Rother
d/s Hammer Felpham way
Pond
Hammer Stream
Chub
Brown trout
Aldingbourne
Rife
Graph WR2 shows the biomass (grammes per 100m2) of fish species, excluding minor species, at
the five Western Rother WFD survey sites:
Graph WR2: WFD survey fish biomass
g/100m²
900
800
Flounder
700
Eel
600
Pike
500
Perch
400
Rudd
300
Roach
Common bream
200
Chub
100
Brown trout
0
u/s Mizzards Durford Bridge
Western Rother
Milland
d/s Hammer
Pond
Hammer Stream
Felpham way
Aldingbourne
Rife
28 of 71
Graph WR3 shows the density (number per 100m2) of fish species at the five Western Rother
Principal Coarse Fishery survey sites:
Graph WR3: Fish density at the five annual Principal Coarse Fishery sites (minor species
excluded)
6
Flounder
5
Common Carp
Perch
No./100m²
4
Gudgeon
Brown trout
3
Eel
Pike
2
Grayling
Chub
1
Roach
Dace
0
Stanbridge
Terwick
Woolbeding Coultershaw Fittleworth
Graph WR4 shows the biomass (grammes per 100m2) of fish species at the five Western Rother
Principal Coarse Fishery survey sites:
Graph WR4: Fish biomass at the five annual Principal Coarse Fishery sites (minor species
excluded).
2000
Flounder
1800
Common Carp
g/100m²
1600
Perch
1400
Gudgeon
1200
Brown trout
1000
Eel
Pike
800
Grayling
600
Chub
400
Roach
200
Dace
0
Stanbridge
Terwick
Woolbeding Coultershaw Fittleworth
29 of 71
Graph WR5 is a scatter plot showing the relationship between total estimated number of dace and
roach at Principal Coarse Fishery sites each year and an index of summer temperature and flow.
The index represents degree days above 12C divided by summer flow (both 4-year means), where
both datasets have been standardised to the same scale.
Graph WR5: dace & roach abundance and an index of flow & summer temperature: scatter
plot
1.7
Summer temp. & flow index
1.6
1.5
1.4
1.3
1.2
1.1
1.0
0.9
0.8
0.7
0
20
40
60
80
100
120
140
Total est. dace & roach
Graph WR6 is a time series based on the same data as WR5, above.
Graph WR6: dace & roach abundance and an index of flow & summer temperature: time
series
140
120
100
1.5
80
1.3
60
1.1
Total est. catch dace and roach
2014
2013
2012
2011
2010
2009
2008
0.5
2007
0
2006
0.7
2005
20
2004
0.9
2003
40
2002
Total est. dace & roach
1.7
Summer temp & flow index
1.9
Summer temp & flow index
30 of 71
Surveys in progress at Fittleworth (left) and Stanbridge (right)
Discussion
WFD surveys:
Graphs WR1 and WR2 show the density and biomass of fish species caught during the five
surveys in the Western Rother catchment that were for Water Framework Directive only. Graph
WR1 shows that the catch on the Aldingbourne Rife was very poor, with just one rudd, one threespined stickleback, one flounder and eight eels. This was as we expected, as the rife's fish
community is constrained by poor water quality and degraded habitat. It is certain that this
waterbody will continue to fail for WFD.
The two sites on the main river, Durford Bridge & upstream of Mizzards, produced a typical catch
for the upper Western Rother with low numbers of brown trout, a few coarse fish and relatively high
numbers of minor species such as bullhead and stone loach. This low overall abundance may be
partly due to recent climatic conditions, as discussed within the PCF discussion, but also reflects
the geomorphology of the Rother catchment, which sees large inputs of sand and fine sediment to
the river during high flow events.
The Hammer stream survey sites featured some good quality habitat, with a coarser, stony
substrate and as a result, fish densities were higher at both sites. There is an online lake situated
between our two survey points, which was created by putting a large weir across the stream.
Despite this barrier to fish migration, four brown trout were caught at the upstream survey site
(Milland). These fish were probably from an isolated population, with adults remaining in this
section of stream to spawn.
The only site to achieve a Good or better WFD status is Terwick Mill (High). The Less than Good
site classifications on the Hammer stream and Stanbridge are driven by a lack of brown trout,
whereas for sites on the main river and further down the catchment the reason is absence or low
abundance of coarse fish and eels.
Principal Coarse Fishery surveys:
Graphs WR3 and 4 show the density and biomass, respectively, of fish species caught at the five
routine Principal Coarse Fishery survey sites. Both graphs display survey sites in order from
upstream to downstream (left to right on the graph). It's important to interpret these graphs in the
context of the long-term datasets we have for these survey sites and what we understand about
how fish abundance on the Western Rother is affected by prevailing climatic conditions in different
years.
Analysis of potential correlations between Western Rother fish data with weather data suggests
that the two most influential aspects are average temperature and flow in summer, with higher
31 of 71
average temperatures and lower average flows resulting in greater abundance of the two key
angling species, dace and roach. Winter flow is also influential, but apparently less so than
summer.
We analyse summer temperature expressed as the number of degree-days (one day at one
degree) above 12 centigrade, which helps identify prime conditions for coarse fish reproduction,
growth and survival. Summer flow is analysed as the mean flow at the most suitable gauging
station (Hardham for the Western Rother) between April and September. Often, ideal temperatures
for dace and roach reproduction, growth and survival in any given year are counteracted by
unsuitable flows and vice versa, so a single overall value or score that reflects both is useful. In
graphs WR5 and WR6 temperature and flow data have been converted to a single value for each
year by first standardising the data to the same scale and then dividing the temperature value by
the flow value. For example, an ideal year would have a high temperature score and a low summer
flow score, resulting in a high overall value, whereas if both are high or low, the score will be
reduced.
However, the impacts of temperature and flow on fish communities are cumulative across periods
of several years, that is, fish abundance will be higher after three or four ideal years than after just
one, so the analysis described above uses four-year averages (the survey year and the previous
three) for temperature and flow, rather than the values from the survey year alone. This process
reveals the best correlation yet found between Western Rother coarse fish abundance and
environmental conditions, with a value of 0.75 (1 being perfect positive correlation; -1 perfect
negative correlation) - this is illustrated in Graph WR5 which plots, for each year, the combined
temperature / flow score against the total estimated dace and roach catch.
Graph WR6 uses the same data as WR5 but displays the data points along a time series from
2002 to 2014, so that dace and roach abundance in any given survey year can be picked out and
compared with the temperature / flow score. The 2014 score is the third lowest since surveys
began in 2002, reflecting the relatively low average summer temperatures and high summer flows
in the period 2011-2014. Consequently, total estimated dace and roach abundance is also among
the lowest recorded. A stark contrast is provided by the figures for 2006, where the temperature /
flow score is approximately double and the combined dace and roach abundance around six times
higher than 2014.
Although these two species spawn at different times of year and in very different habitats (dace in
early spring on gravel; roach in early summer on submerged vegetation), juveniles of both species
are highly reliant on warm, shallow, slack water for survival and growth, making both vulnerable to
cool, high flow conditions in summer. However, this effect can be mitigated by an abundance of
high quality habitat, especially in the river margins, suggesting that the "bottlenecks" to successful
recruitment on the Western Rother may be a lack of suitable spawning habitat for both species and
/ or lack of habitat providing ideal conditions for juveniles.
Graphs WR3 and WR4 portray the low overall fish abundance on the Western Rother in 2014, with
the very low abundances at Woolbeding, Coultershaw and Fittleworth particularly striking.
Stanbridge is in the river's headwaters on the outskirts of Petersfield, where the dominant fish
species is brown trout, a species with very different environmental requirements to dace and
roach, hence its high density and biomass in comparison to coarse species at the other sites.
Brown trout and a single grayling (207mm) were the only large fish species recorded on this
survey.
Terwick Mill is farther downstream and lies in the zone where both salmonids and coarse fish
thrive, as reflected in the 2014 survey, which yielded ten species, including brown trout, grayling,
chub, pike, perch, roach and eels, as well as several minor species and a common carp. The
disproportionate contribution that the pike, carp and chub make to the site's overall biomass can be
seen in graph WR4.
Despite this diversity, overall density at Terwick was estimated to be less than three fish per
100m2. At Coultershaw density was estimated to be just over one fish per 100m2 and at
Woolbeding and Fittleworth it was less than one. These are very low coarse fish abundances,
reflecting the fish community's sensitivity to adverse environmental conditions and demonstrating a
32 of 71
lack of resilience to normal climatic variability. This is probably symptomatic of the significant
constraints suspected of impacting the river's fish populations, notably, sedimentation,
impoundment, barriers to migration and channel modification. Our South Downs Fisheries,
Biodiversity and Geomorphology Team are working to mitigate these constraints and have
constructed three backwater juvenile fish refuges on the Western Rother in the past eighteen
months.
Of course, some of these stretches and others nearby occasionally produce large specimen
barbel, pike, bream and other species but these cautious, long-lived survivors are scarce and are
only rarely captured in surveys.
Good quality habitat on the Hammer stream resulted in a greater density of fish than sites on the
main Western Rother
A well conditioned chub from Coultershaw (left) , where the catch consisted of a low number of
large fish
A grayling from Terwick Mill (right), a species which was once much more common on the Western
Rother.
33 of 71
3. Isle of Wight
The 2014 survey season was particularly interesting on the Isle of Wight, as we conducted fish
surveys on the Caul Bourne for the first time since the late 1990's and on the upper Eastern Yar for
the first time since 2002. We also conducted surveys for the first time ever on the Brighstone
stream.
Seven surveys were completed in total; all were single run and were required in order to classify
the relevant waterbodies for fish for the Water Framework Directive.
Map IOW1 shows the survey site locations.
Map IOW1: 2014 fish survey sites
Results
Table IOW1 shows the site status, waterbody status and catch at each of the Isle of Wight WFD
fish surveys. Status is colour coded, as follows:
Blue=High; Green=Good; Yellow=Moderate; Orange=Poor; Red=Bad.
51
14
14
36
8
26
28
2
1
6
1
6 27
13 22
23
7
6 133
35 22
1
2
13
6
2
Brook lamprey
Stone loach
Bullhead
Eel
Perch
Roach
Waterbody name & status
E. Yar upper
E.Yar upper
E. Yar lower
Caul Bourne
Caul Bourne
Brighstone streams
Brighstone streams
Dace
Site name & status
Roud
Godshill
Horringford
Shalfleet
Calbourne Mill
Grange Chine
Thorncross
Brown trout
Table IOW1: WFD survey results
2
34 of 71
Graph IOW1 shows which fish species were recorded at each site and how many individuals per
100m2 were caught (density).
Graph IOW1: Species density
60
No/100m2
50
40
Brook lamprey
30
Stone loach
Bullhead
20
Eel
Perch
10
Roach
Caul Bourne
Brighstone Stream
Dace
Horringford
Godshill
Roud
Grange Chine
Thorncross
Shalfleet
Calbourne Mill
0
Brown trout
Eastern Yar
Graph IOW2: Species biomass
3500
3000
g/100m2
2500
2000
Eel
1500
Perch
1000
Roach
500
Dace
Caul Bourne
Grange Chine
Horringford
Godshill
Roud
Grange Chine
Thorncross
Shalfleet
Calbourne Mill
0
Brown trout
Eastern Yar
Discussion
This series of seven surveys provides vital information on the fish communities of three Isle of
Wight streams that have not been surveyed for many years. With the exception of the Thorncross
survey, all the results are positive. Thriving populations of healthy, wild brown trout were recorded
at all other sites, with densities at Roud, Shalfleet and Grange Chine surprisingly high. Trout
density at Godshill, Horringford and Calbourne Mill was lower but this is no cause for concern: at
Horringford the fish community is typical of a river's middle reaches, with a mixture of trout and
coarse fish, while at Calbourne Mill, trout abundance is likely to be constrained to some extent by
35 of 71
the effects of milling on flow. Milling requires the mill pond to be refilled, resulting in regular periods
of low flow in the reach immediately downstream, a process that has been routine here for many
centuries. Godshill is a site that had been heavily modified (dredged and straightened) a long time
ago but has recovered and naturalised to a great extent, with dense, varied woodland lining the
banks and plentiful woody debris in the channel - a great example of a river reach thriving on
neglect and lack of disturbance. However, it would certainly be beneficial to cut back the canopy in
places, in order to let light into the channel and promote herbaceous plant growth both underwater
and on the banks.
Eel abundance was generally high, too, especially at the two sites closest to their streams' tidal
limits: Grange Chine and Shalfleet. Eel abundance at Grange Chine was particularly surprising, as
the stream flows over a concrete weir beneath the road viaduct, which was suspected of being an
obstruction to upstream elver migration. With 35 eels of varying age caught on this survey, elvers
can certainly pass this structure, probably by climbing up the wet vegetation to the sides of the
main flume of water.
A single eel and two bullhead were caught at Thorncross, all three taken from the one pool,
beneath the only tree along the survey reach. The reason for this lack of fish is obvious to anyone
who walks the public footpath along the reach: the stream has, at some point in the past few
decades, been straightened and deepened so that it resembles an agricultural drainage ditch
almost entirely devoid of bankside trees and heavily overgrown with Norfolk reed. This leaves very
little open water and virtually no suitable fish habitat. The good news is that this stream does have
the key ingredient to give it the potential to support a thriving fish community: a constant flow of
clean spring water. In addition, the work required to rectify the damage to the channel is relatively
simple, requiring basic remeandering, tree planting and the installation of large woody debris.
However, there is some concern that fish passage through Brighstone is constrained by an online
millpond and various flow control structures.
Survey in progress at Roud
A perfect Grange Chine brown trout
Viaduct flume at Grange Chine
Heavily modified reach at Thorncross
36 of 71
Fine perch and dace from Horringford
Bootlace eels and a close up of an adult yellow eel, all from Grange Chine
37 of 71
4. Hampshire
4.1. East Hampshire
Two Water Framework surveys were conducted in East Hampshire in 2014: one on the Hampshire
Lavant, at Langstone Technology Park and one on the River Alver at Apple Dumpling Bridge, in
Gosport. The two annual wild brown trout surveys on the Meon were also completed at the usual
sites, Mislingford and Silver springs.
No surveys were carried out in the Wallington or Hamble catchments this year.
Map EH1 shows the locations of all East Hampshire fish surveys in 2014.
Map EH1
Results
Table EH1 shows the site status, waterbody status and catch at each of the East Hampshire WFD
fish surveys. Status is colour coded, as follows:
Blue=High; Green=Good; Yellow=Moderate; Orange=Poor; Red=Bad.
Bullhead
4
85
Common carp
3-sp stickleback
13
Brown trout
Waterbody name
Lavant (Hants)
R. Alver
Roach
Site
Langstone Technology Park
Apple Dumpling Bridge
Eel
Table EH1
1
38 of 71
Meon
Graph Meon 1 shows fish density (number per 100m2), excluding minor species, recorded at
Mislingford and Silver Springs since annual wild brown trout surveying commenced in 2007.
Graph Meon 1: Fish density at Mislingford and Silver springs
40
35
Roach
No./100m2
30
Grayling
25
Dace
20
Salmon
15
Eel
10
Chub
Brown trout
5
Mislingford
2014
2013
2012
2011
2010
2009
2008
2007
2014
2013
2012
2011
2010
2009
2008
2007
0
Silver Springs
Graphs Meon 2 and 3 show the number of brown trout in each 5mm length category recorded in
2014 at Mislingford and Silver Springs respectively.
Graph Meon 2: Brown trout length-frequency histogram; Mislingford
18
16
14
10
8
6
4
2
335
320
305
290
275
260
245
230
215
200
185
170
155
140
125
110
95
80
65
0
50
Frequency
12
mm
39 of 71
Graph Meon 3: Brown trout length-frequency histogram; Silver Springs
18
16
14
Frequency
12
10
8
6
4
2
335
320
305
290
275
260
245
230
215
200
185
170
155
140
125
110
95
80
65
50
0
mm
Graph Meon 4 is a scatter plot showing the relationships between 0+ (young of the year) and 1+
trout (parr in their second year) abundance and mean summer flow at Mislingford.
Graph Meon 4: Mislingford 0+ and 1+ abundance and mean summer flow
140
120
100
Catch
80
60
40
20
0
0.3
0.4
0+ catch
0.5
0.6
1+ catch
0.7
M3/sec
0.8
Linear (0+ catch)
0.9
1
1.1
Linear (1+ catch)
40 of 71
Graph Meon 5 shows the relationship between the mean lengths of 0+ and 1+ trout caught at
Mislingford in each survey year and mean summer flow that year.
Graph Meon 5: Mislingford 0+ and 1+ mean length and mean summer flow
200
190
180
170
160
MM
150
140
130
120
110
100
90
80
70
0.3
0.4
0+ mean length
0.5
0.6
1+ mean length
0.7
M3/sec
0.8
Linear (1+ mean length)
0.9
1
1.1
Linear (1+ mean length)
Discussion
WFD surveys: Alver and Lavant
Despite there being only two Water Framework Directive fish surveys in East Hampshire in 2014,
the results and observations made during the surveys give us plenty of useful ecological evidence
of pressures constraining fish communities in the two watercourses.
The first attempt to conduct an electric fishing survey on the Alver had to be abandoned when it
was found that there was very high salinity even at Apple Dumpling Bridge, two kilometres
upstream of the stream mouth at Browndown - electric fishing with normal gear is not possible in
saline conditions due to the very high conductivity of the water. An investigation was necessary to
work out how far upstream we would have to venture to find salinity low enough to enable electric
fishing. The answer was surprising: salinity dropped quickly only a few metres upstream of Apple
Dumpling Bridge, as the source of very high conductivity water appeared to be a small woodland
pond whose outlet stream joined the main Alver just downstream of the bridge - this is now the
subject of a separate investigation.
An electric fishing survey from a small boat was completed in late September and covered 700
metres of the Alver, from Apple Dumpling Bridge upstream. A single common carp was caught and
no other fish were observed, despite excellent fishing conditions. More surprisingly, large numbers
of eels are often seen by workers clearing beach gravel from the outlet grills at the stream mouth
and shoals of small silver fish (rudd or roach) are often seen where people feed bread to ducks at
Apple Dumpling Bridge (where salinity is too high for electric fishing). Whatever the specific
reasons for the absence of fish upstream of the bridge, the root cause is almost certainly the
combined impact of contaminated water leaching from several historic landfill sites and military
dumps in the area, as well as the canalised nature of the watercourse.
41 of 71
By contrast, the number of bullhead and eels recorded by the fish survey on the Hampshire Lavant
at Langstone indicated good water quality - certainly good enough to sustain the brown trout that
are typically the dominant species in spring fed streams of this type. However, their absence
reflects two pressures: heavily modified habitat and obstructions to migration, particularly to sea
trout trying to ascend the stream from Langstone Harbour. The failure of this waterbody for fish
under the Water Framework Directive will provide evidence and a driver to address these
problems.
Left: East Hampshire's hidden chalkstream; the Hampshire Lavant
Right: The Alver in the Wild Grounds nature reserve
Meon principal brown trout fishery
Graph Meon 1 shows that the density of wild brown trout recorded at Mislingford was the second
highest since 2007: 153 were caught in a single electric fishing run, equating to 22.4 per 100m2 (in
2010 it was 174 & 26.9 respectively). Graph Meon 2 shows that the majority of these (just over
82%) are young of the year (0+; hatched in spring 2014), ranging in length from 68 to 136mm. Just
over 17% of the catch comprised older, longer fish, the majority of which were one year olds,
between 166 and 224mm. Only five fish were >224mm). A single salmon parr was caught at Silver
springs - the lowest catch to date: 48 were caught in the 2013 survey.
The graph demonstrates that the pattern of trout abundance at Silver Springs is not similar to that
at Mislingford and that the number of trout recorded in 2014 was less than half that in the previous
year. This difference between the two sites is one indication of the complexity of our Meon trout
data. The relationships between juvenile trout (growth and abundance) and environmental
conditions (flow and temperature) are unclear, with differences between young of the year parr and
one year olds, as well as differences between the two survey sites. A thorough analysis of annual
abundance and average length of 0+ and 1+ trout shows a surprising lack of any consistent
relationship between these factors and flow or temperature at key periods of the year. For
example, we would expect the varying abundance of 0+ trout at Mislingford to be correlated to
some extent with average flows in summer, but this is not the case. This is illustrated by Graph
Meon 4, which shows annual abundance of 0+ and 1+ parr at Mislingford, set against the annual
average summer flow. On a scale from -1 to +1, the correlation coefficient for 0+ trout abundance
with summer flow is 0.33 and for 1+ parr it's -0.43, suggesting that increasing summer flows tend
to increase young of the year abundance but reduce one year old parr abundance but neither
relationship is strong.
There are probably two main reasons for this difficulty in identifying the drivers of good and poor
recruitment years on the Meon: firstly, this trout population is largely migratory, meaning that there
42 of 71
are likely to be other important environmental factors affecting marine survival and fecundity, such
as sea temperature, predation and food availability, with knock-on effects on patterns in parr
abundance. However, without long term data from a fish counter monitoring returning adult sea
trout, this is impossible to quantify. Secondly, the dataset seems to suggest that the environmental
factors that have exerted the most influence on Mislingford trout abundance and growth have been
different in various years between 2007 and 2014, which is why strong correlations are evident
over briefer periods but not for the whole period. This implies that it's less important to look at
consistent patterns throughout the whole dataset than to appreciate the effects of specific periods
of abnormal flows or temperatures, which have been relatively frequent in recent years.
The most consistent correlation evident throughout the whole period is that between average flow
measured at Mislingford gauging station between April and September and annual average length
of Mislingford 0+ and 1+ parr. Graph Meon 4 shows this relationship and emphasises the general
tendency for chalkstream flow to be linked to carrying capacity for trout. For both 0+ and 1+ trout
(coincidentally) the correlation coefficients between mean length and summer flow are both 0.63.
Our first grayling (left) and an adult chub from Mislingford
Infected wound on a sea trout head
Silver springs backpack survey
43 of 71
Silver Springs salmon parr
Yellow eel close up
44 of 71
4.2. Test & Itchen
Test:
Three types of fish survey were conducted in the Test catchment in 2014: eight Water Framework
Directive (WFD) waterbody classification surveys, six biennial salmon parr surveys and a single
"local investigative" survey. Five of the salmon parr surveys sites are so wide, fast flowing and
shallow that the five-minute, Catch Per Unit Effort (CPUE) survey method is used (see "Interpreting
results" section for details).
Itchen:
Only three fish surveys were required in the Itchen catchment in 2014, all of which were for WFD
waterbody classification purposes.
Map T&I 1 shows the site names and locations of all fish surveys undertaken in the Test and
Itchen catchments in 2014. Purple triangles are WFD surveys, green circles are salmon parr
surveys and the yellow circle is the local investigative survey. WFD waterbody boundaries are
shown in black.
Map T&I 1: survey site locations
45 of 71
Results
Water Framework Directive
Tables Test 1 and Itchen 1 show the site status, waterbody status and catch at each of the Test
and Itchen catchment WFD fish surveys respectively. Status is colour coded, as follows:
Blue=High; Green=Good; Yellow=Moderate; Orange=Poor; Red=Bad.
19
6
32
1
3
6
2
2
1
9 24
1 35 19
3
2
2
2
7
3
1
6
10
3
1
5 84
2 123
3 169
15
46
4
58
2
1 10
2
4
6
25 10
56 11
15
4
67
18
252
Minnow
35 261
Golden orfe
2
8
3
Stone loach
7
1
Bullhead
2
39
15
3-sp stickleback
11
33
1
Eel
Roach
1
7
Gudgeon
10
Chub
Waterbody name & status
Monks Brook
Bow Lake
Bow Lake
Brown trout
Table Itchen 1: Itchen WFD survey results
Site name & status
Stoneham
Bow Lake Fish Farm
Upstream of Leyland's Farm
Rainbow trout
Brook lamprey
Stone loach
Minnow
Bullhead
3-sp stickleback
Flounder
Eel
Pike
Perch
Rudd
Roach
Gudgeon
Grayling
Dac
Chub
Waterbody name & status
Dun
Dun
Dun
F'bourne stream & f'lake meadows
F'bourne stream & f'lake meadows
R. Test
R. Test
R. Test
Tanners Brook
Brown trout
Site name & status
Dunbridge Station
Park Farm
Old Vicarage
Romsey Canal
Fairbourne Stream, Brook Farm
Timsbury Mayfly Carrier
Romsey Memorial Park
Fish Lake
Coxford Road
Salmon
Table Test 1: River WFD survey results
63
2
21
2
Test salmon parr surveys:
Graph Test 1 shows the average number of salmon parr recorded in our five Catch Per Unit Effort
surveys (red dotted line) in each survey year. Also shown is parr abundance (density: number per
100m2) in the first run of Romsey War Memorial Park surveys (solid grey line) and the average flow
in the winter preceding the survey (Oct-Mar) recorded at the Broadlands gauging station.
Note that there were no CPUE surveys before 2007 and that both types of survey switched from
annual to biennial in 2011.
46 of 71
Graph Test 1: Salmon parr abundance and winter flow
14
26
24
12
20
18
8
16
6
M3/sec
No/100m2/mean catch
22
10
14
12
4
10
2
8
Mean catch CPUE sites
1st run density Memorial park
2014
No survey 2013
2012
No survey 2011
2010
2009
2008
2007
2006
2005
2004
6
2003
0
Mean flow Oct-Mar
Graph Test 2 is a scatter plot based on the same data as Test 1 and is aimed at clarifying the
relationship between salmon parr abundance and winter flow.
Graph Test 2: Salmon parr abundance and winter flow scatter plot
22
20
18
Salmon parr
16
14
12
10
8
6
4
2
0
5
7
9
Total catch CPUE sites
11
13
M3/sec
15
17
19
21
1st run density War Memorial Park
47 of 71
Table Test 2: salmon data summary sheet
Table Test 2 sets out key statistics for the Test salmon population.
– Returning Stock is the number of adult salmon recorded at the Nursling salmon counter
– Rod Catch is the total number of salmon caught by rod and line fisheries on the river
– Catch and Release rate is the percentage of those salmon immediately returned alive
– Spawning Escapement is the number of salmon estimated to be available for spawning
– Egg Deposition is the total number of eggs likely to be produced by those fish
River Test
Adult
Return
Year
1990
1991
1992
1993
1994
1995
1996
1997
1998
1999
2000
2001
2002
2003
2004
2005
2006
2007
2008
2009
2010
2011
2012
2013
2014
Returning
Stock
Rod Catch
790
538
614
1155
775
647
623
361
898
867
595
410
1046
367
1129
1150
1058
664
1487
903
833
980
949
1020
1001
Salmon egg conservation limit
Salmon egg management target
Notes
*
***
288
139
151
335
247
167
146
49
204
159
147
215
342
164
449
357
210
258
424
185
225
312
293
323
235
Catch and
Release
Spawning
Egg
Rate
Escapement Deposition
(%)
(millions)
505
1.23
405
0.99
471
1.15
870
2.12
14
560
1.37
0
465
1.13
13
496
1.21
14
319
0.78
44
784
1.91
46
781
1.91
66
545
1.33
99
398
0.97
99
1044
2.55
100
367
0.90
100
1129
2.75
100
1150
2.81
100
1058
2.58
100
664
1.62
100
1487
3.63
100
903
2.20
99
831
2.03
100
979
2.39 *
100
949
2.32 *
100
1020
2.49 ***
100
1001
2.44
3.4 Million
3.88 Million
Returning stock estimate based on historic relationship with rod
catch due to fish counter faults
Provisional count awaiting verification
48 of 71
Table Itchen 2: salmon data summary sheet
Table Itchen 2 sets out key statistics for the Itchen salmon population.
– Returning Stock is the number of adult salmon recorded at the Gaters Mill salmon counter
– Rod Catch is the total number of salmon caught by rod and line fisheries on the river
– Catch and Release rate is the percentage of those salmon immediately returned alive
– Spawning Escapement is the number of salmon estimated to be available for spawning
– Egg Deposition is the total number of eggs likely to be produced by those fish
River Itchen
Adult
Catch and
Return
Returning
Release
Spawning
Egg
Year
Stock
Rod Catch
Rate
Escapement Deposition
(%)
(millions)
1990
367
187
106
0.26
1991
152
69
37
0.09
1992
357
95
230
0.56
1993
852
357
495
1.21
1994
378
183
14
219
0.53
1995
880
241
0
664
1.62
1996
433
261
13
275
0.67
1997
246
95
14
204
0.50
1998
453
161
44
414
1.01
1999
213
92
46
176
0.43
2000
208
168
66
189
0.46
2001
217
190
99
214
0.52
2002
239
188
99
202
0.49
2003
222
78
100
204
0.50
2004
410
149
100
393
0.96
2005
411
87
100
411
1.00
2006
419
121
100
419
1.02
2007
302
224
100
301
0.73
2008
609
282
100
584
1.42
2009
276
205
100
276
0.67
2010
757
361
100
749
1.83
2011
697
295
100
697
1.70 **
2012
622
373
100
622
1.52
2013
478
154
100
478
1.17 ***
2014
779
269
100
779
1.90 **
Salmon egg conservation limit
Salmon egg management target
Notes
**
***
1.63 Million
1.97 Million
Likely to be a slight underestimate due to fault in May and June
Provisional count awaiting verification
49 of 71
Graph Test & Itchen 1: returning adult salmon stock
Graph Test & Itchen 1 shows the numbers of returning adult salmon counted migrating upstream
at Nursling (Test) and Gaters mill (Itchen) each year. The six-year moving average is given for
each river.
1600
1400
1200
1000
800
600
400
200
1990
1991
1992
1993
1994
1995
1996
1997
1998
1999
2000
2001
2002
2003
2004
2005
2006
2007
2008
2009
2010
2011
2012
2013
2014
0
Test returning stock
Itchen returning stock
Test 6 year moving average
Itchen 6 year moving average
50 of 71
Discussion
Water Framework Directive surveys
As we approach the end of the first six year cycle of the Water Framework Directive, the fish
monitoring component has been revised so that we only survey waterbodies that are failing for fish,
at risk from pressures likely to impact fish or are "surveillance" waterbodies, in which every
ecological element is monitored. All of the sites listed in Tables Test 1 and Itchen 1 are in
waterbodies already classed as less than Good for fish before 2014, except for Coxford Road,
which is on the Tanners Brook, a waterbody classed as at risk from pressures linked to fish and
sampled for the first time in 2014. All waterbodies monitored for fish are sampled once every six
years.
Test WFD
The WFD fish surveys conducted on the Test in 2014 are clustered around Romsey and the Dun.
In the second six year cycle of WFD the Dun becomes a single waterbody, when it was previously
two: upper and lower. The failure of both these waterbodies for fish was driven primarily by the low
abundance of eels. As table Test 1 shows, the three surveys conducted on the Dun in 2014 (Park
Farm, Old Vicarage and Dunbridge Station) yielded no eels, which is the primary reason they and
the new waterbody are classed as less than Good in 2015. This doesn't mean eels are entirely
absent from the river, only that they are absent or at very low abundance at these three spaced-out
samples of the fish community and are therefore likely to be relatively scarce throughout the
catchment. The area Fisheries, Biodiversity and Geomorphology (F, B&G) Team have developed a
project to improve eel passage into the Dun from the main Test: one obstructive weir has already
been removed and another crucial one is expected to be taken out in 2015. A lack of trout at Park
Farm and salmon (parr) at Old Vicarage also contributed to the less than Good status.
The Fairbourne Stream and Romsey Canal survey sites lie in the same waterbody but are
physically very different - the former is a natural rain-fed stream that feeds into the latter, a
manmade Test carrier. Only three minor species and a single eel were caught at Fairbourne
Stream when it was last surveyed in 2011. The increased catch and number of species caught in
2014 was probably linked to the high flow conditions earlier in the year, which may have
encouraged coarse species to move into side channels. However, the site still failed as a result of
the lack of eels and brown trout. A fairly wide range of species was caught at Romsey Canal but
the results still led to a WFD failure on the basis of low salmon, trout and grayling abundance.
The survey at Coxford Road, on Southampton's Tanner's Brook was of particular interest as it
revealed that this section of the middle reaches features some good quality physical habitat, which
contrasts with the heavily modified and urbanised character of the majority of the watercourse. On
the basis of this habitat alone, we would expect to find wild brown trout, so their absence indicates
that other factors such as water quality and barriers to migration may be preventing recolonisation
by sea trout. Their absence and the low abundance of eels also led to the site and waterbody
being classed as Bad for fish in 2015.
Also of particular interest at Coxford Road was the abundance of flounder in this wholly freshwater,
urban watercourse at a site approximately 3.5km from the sea. This suggests that, whereas some
factor or factors prevent sea trout from ascending this stream, the same is not true for flounder.
The length of flounder caught ranged from 98 to 160mm meaning they were likely to be juveniles in
their second year (see length frequency histogram SW6 in the Southampton Water section). This
flounder data demonstrates that there is probably a great deal to learn about the role of freshwater
habitats in the life cycle of Southampton Water's flounder population.
The surveys at Timsbury Mayfly Carrier, Romsey Memorial Park and Fish Lake are used to
classify the major River Test waterbody between Romsey and Kimbridge. These sites represent
the relatively modified nature of the river in this waterbody, which has undergone a high degree of
dredging and canalisation (over several centuries) and also features numerous flow control
structures. Table Test 1 shows that the 2014 survey data resulted in the first two of these sites
51 of 71
being classed as Poor and the last Bad, with the waterbody status Poor. The main reason for this
is that, quite remarkably, no brown trout were caught in any of the three surveys in 2014. Lack of
eels and grayling in Fish Lake also contributed to this failure. These results reflect the impact that
extensive channel modification typically has on wild salmonid populations.
Tanners Brook - surprisingly good flounder
habitat
The Dun at Dunbridge Station
A large chub from the Fairbourne Stream
Juvenile brown trout, Dunbridge Station
Perfect perch from Fish Lake
Backpack survey at Park Farm
View from the survey boat at Timsbury
52 of 71
Itchen WFD
Although the total fish density at both Bow Lake WFD survey sites exceed that recorded at
Stoneham on the Monks Brook, the key difference is that wild brown trout were abundant at
Stoneham and absent from Bow Lake. This has resulted in the continued failure of the Bow Lake
waterbody for fish, with the Bow Lake Fish Farm site classed as Poor, Leylands Farm as Bad and
the waterbody as whole as Poor, driven primarily by the absence of brown trout. A great deal of
positive work has been undertaken by the area Fisheries, Biodiversity & Geomorphology team and
the Land and Water team to improve water quality on the Bow Lake, by reviewing the permits and
water management practices of various local businesses. The Monks Brook waterbody is classified
as Good for fish in 2015, on the basis of the 2014 Stoneham survey and also 2013 surveys at
Fleming Park (High) and in Chandlers Ford (Poor).
The absence of trout from the one watercourse and their abundance in the other is a clear
reflection of the contrasting conditions: trout are probably unable to thrive in the Bow Lake as a
result of unsuitable water quality, barriers to migration, sedimentation and low flows. On the Monks
Brook, despite there being some very heavily modified sections in urban reaches, water quality,
flow and migratory passage are clearly sufficiently good for trout to thrive in most reaches. The
Stoneham survey is a particularly good example of this potential, in that it is actually a channelised,
concrete-lined reach, where the habitat has recovered enough to provide complex fish habitat.
Straightened channel in the upper Bow Lake
Concrete bed and banks on the Monks Brook at
Stoneham
Test salmon parr surveys:
Graph Test 1 shows that the average catch at the five Test salmon parr CPUE surveys in 2014
was the lowest recorded since these surveys began in 2007. The number of salmon parr caught in
a single electric fishing run at the survey site in Romsey War Memorial Park was the second
lowest recorded since these surveys began in 2003: the only lower catch was in 2005.
Analysis of our salmon parr survey dataset suggests that possibly the most influential factor in
determining salmon parr abundance in most years is mean flow between October and March in the
winter preceding the surveys, although flow at other periods of the year is certainly also of greater
or lesser importance in different years. Graph Test 2 shows that, despite a high degree of
variability in the data points, there appears to be a weak, positive correlation between salmon parr
abundance and flow in the previous winter, with the highest parr abundances recorded following
winters where the average flow was roughly between 13 and 15m3/sec at Broadlands gauging
station.
However, both graphs suggest that this relationship is probably curved rather than linear and that
winters where the average flow exceeds an optimum (seemingly somewhere between 15 and 19
m3/sec) appear to result in fewer salmon parr in the following summer, indicating that such flow
53 of 71
may be detrimental to salmon parr production. There are several potential explanations for this
observation, including the reduction in the total area of ideal spawning habitat under high flow
conditions and an increase in suspended sediment load, which may promote salmon egg mortality.
Whatever the actual cause, it would appear that the very low salmon parr abundance recorded in
2014 may be linked to the phenomenal and relatively sudden high flows experienced in winter
2013/14 (see the "Temperature and rainfall" section at the start of the report for rainfall data).
Of course, these observations beg the question that if salmon parr abundance is largely dependent
on a factor outside of our immediate influence, is there anything that can be done to increase the
size of the parr population? The answer is actually very clear: in discussing the link between
salmon parr abundance and environmental factors such as flow and temperature, we're only
investigating the causes of variation in abundance between years and not the underlying factors
that determine the overall size of the population. Factors such as habitat quality, water quality,
abstraction, ease of fish passage, disease and predation are what largely determine the river's parr
carrying capacity. Therefore, the removal or major mitigation of these constraints would result in a
larger, more resilient parr population that would still vary in size according to prevailing climatic
conditions from year to year but would do so around a greater average size and would be far less
likely to experience profound reductions, such as that recorded in 2014.
Test & Itchen salmon data summary sheets
Tables Test 2 and Itchen 2 provide comprehensive summaries of data for the returning adult
salmon stock on both rivers. Graph Test & Itchen 1 puts the counted returning stock data into a
time-series format. Analyses of these annual counts with flow, temperature and salmon parr
abundance data indicate a lack of any consistent correlation. This reflects the significance of
mortality in the parr to smolt and smolt to returning adult phases of the lifecycle, the first of these in
the river over winter and the second at sea, from spring through to the following summer for the
majority of fish (i.e. grilse).
Graph Test & Itchen 1 also includes six-year moving averages for each river and these suggest a
gradual increase in the average size of the returning adult stock since the early years of this
millennium. However, the six year average has declined slightly on the Test since a peak in 2009.
The largest number of returning adult salmon counted since records began (in 1990) was 1,487 in
2008 on the Test and 880 in 1995 on the Itchen.
One of the most striking aspects of graph Test & Itchen 1 is the typical magnitude of the difference
in numbers of returning adults in consecutive years: on average, the returning stock in any given
year differs from that in the previous year by just under 47% on the Test and just over 55% on the
Itchen.
54 of 71
Salmon parr survey at Leckford
The view upstream from Sheepbridge
Sheepbridge on the Test
55 of 71
5. Estuarine Fish Monitoring
5.1. Southampton Water
In 2014 the Southampton Water Transitional and Coastal (TrAC) fish monitoring programme
included the routine spring and autumn beach seine and beam trawl surveys at four sites, beach
seine only surveys at three sites (where beam trawling would be hazardous) and fyke net surveys
at a further two sites. Seine net surveys consist of two semi-circular samples in the same location,
with a 45m net set from a boat. The beam trawl is 1.5m wide and is towed for exactly 200m,
parallel to the shore, at the seine net site. Each fyke survey consists of two double ended fykes,
set close to shore in one metre of water at low tide and left for 24 hours.
All the sampling described above is carried out by the local area team. The programme also
includes an autumn otter trawl survey which in 2014 comprised of three 10 minute trawls, carried
out by the coastal survey vessel "Solent Guardian" near to the edge of the maintained shipping
channel, around 600m east of Hythe.
Map SW1 shows the TrAC monitoring sites in Southampton water, coloured according to the types
of survey carried out at each location.
Map SW1: TrAC survey locations
56 of 71
Left: Sparsholt College marine conservation students haul the seine net at Manor Farm
Right: The otter trawl being retrieved aboard the coastal survey vessel Solent Guardian
Table SW1 summarises the 2014 classification results for Southampton Water. For each of the
four sampling methods, a score between 1 and 5 is calculated for the ten metrics that make up the
classification tool. Overall scores (Ecological Quality Ratios: EQR) are given for each method at
the bottom of each column, with the overall estuary score in the bottom right cell. NB the "boot"
column refers to "bootstrapping, a statistical method for taking variance in the whole dataset into
account.
Table SW1: 2015 WFD classification results
Southampton Water
Number of samples
37
Metric description
Beam trawl Fyke
1. Species composition
2
Species diversity & composition 2. Presence of indicator species
5
3. Species relative abundance
5
Species abundance
4. Number of taxa that make up 90% of abundance
5
5. Number of estuarine resident taxa
3
6. Number of estuarine dependent marine taxa
2
Nursery function
7. Functional guild composition
3
8. Number of benthic invertebrate feeding taxa
2
9. Number of piscivorous taxa
3
Trophic inegrity
10. Feeding guild composition
5
EQR
0.63
Method
12
14
161 Total: 224
Otter trawl Beach seine boot
4
3
1
1.94
3
3
3
3.53
2
2
3
3.27
4
4
3
3.78
4
4
4
3.74
5
5
3
3.25
5
5
5
4.47
5
4
4
3.64
3
4
3
3.09
5
5
5
5.00
0.75
0.73
0.60
0.64
57 of 71
Graph SW1 shows the total number of fish of each species caught at all sites for the spring and
autumn survey seasons in 2014. Fish are ordered from highest to lowest catch in spring.
Graph SW1: Fish abundance by species in spring and autumn, 2014
2000
1800
1600
1400
1200
1000
800
600
400
200
0
Spring
Autumn
Graph SW2 shows the total spring and autumn catches for the seine nets & beam trawls combined
for Southampton water for all survey years.
Graph SW2: combined seine & beam trawl catch, spring and autumn
14000
12000
10000
8000
6000
4000
2000
0
2007
2008
2009
2010
Spring
2011
2012
2013
2014
Autumn
58 of 71
Graph SW3 shows the catch in the autumn CSV otter trawl, carried out in deeper water near to
Hythe Pier
Graph SW3: Species caught in the Autumn Otter trawl near Hythe
300
250
200
150
100
50
0
Graph SW4 shows the total number of bass caught in the spring and autumn surveys in each
survey year.
Graph SW4: Bass catch in spring and autumn
2000
1800
1600
1400
1200
1000
800
600
400
200
0
2007
2008
2009
2010
Spring
2011
2012
2013
2014
Autumn
59 of 71
Graph SW5 shows the catches of six flatfish species in the CSV otter trawl near to Hythe Pier in
each survey year. Catch is expressed in the number caught per minute of trawling (NB the line for
brill appears to show zero for all years but, in fact, one specimen was caught in 2009).
Graph SW5: Flatfish caught per minute in the CSV trawl off of Hythe pier
8
Solenette
7
6
Sole
5
Plaice
4
Flounder
3
2
Dab
1
Brill
0
2009
2010
2011
2012
2013
2014
A large plaice (left) and a dab (right)
Brill
Dover sole
60 of 71
Graph SW6 is a length frequency distributions of flounder captured in spring and autumn for all of
our survey years combined in Southampton Water.
Graph SW 6: Flounder frequency histogram
16
14
12
10
8
6
4
2
15
30
45
60
75
90
105
120
135
150
165
180
195
210
225
240
255
270
285
300
315
330
345
360
375
390
405
0
Spring
Autumn
Graph SW7 shows the relationship between the number of flounder caught in our spring surveys
and the average Hayling Island sea surface temperature in spring.
Graph SW7: Flounder catch and spring sea surface temperature
45
12
40
11
30
10
25
9
20
15
Deg C
Total flounder
35
8
10
7
5
0
6
2007
2008
2009
Total spring catch
2010
2011
2012
2013
2014
Mean spring Hayling sea surface temp. C
61 of 71
Graph SW8 shows the same data as a scatter plot, illustrating the negative correlation between
mean spring sea surface temperature and total flounder abundance in the spring survey catch
(correlation coefficient, r = -0.9).
Graph SW8: Flounder catch and spring sea surface temperature
45
40
35
Flounder
30
25
20
15
10
5
0
6
7
8
9
Deg C
10
11
12
Emptying a fyke net end at Bury Marsh
62 of 71
Discussion
Southampton Water WFD status
Table SW1 shows the results of the 2014 classification analysis by the Transitional and Coastal
Fish Index tool (TFCI) for Southampton Water and indicates that the individual scores (EQR's) for
each sampling method, and also the overall score, were in the Good range (i.e. > 0.58 & <0.81).
It's essential to take into account the "confidence in class" statistic that's also calculated and this is
92.4% meaning that the we can be "Quite Certain" That the Southampton Water's fish community
is at "Good" status in 2015 (>95% = "Certain"; <75% = "Uncertain"). This represents a change from
the 2013 status, which was "Moderate", with a confidence in class of "Uncertain". An informal
investigation into what aspects of the fish data have changed will be undertaken in spring 2015.
General observations
2014 was the eighth consecutive year in which we have monitored the fish population in
Southampton Water. This year we caught 33 species in total, with one new addition to our all-time
species list in the shape of a three-spined stickleback (caught at Calshot - although capable of
surviving at sea, this was probably washed out of a river by flood flows). This brings the total
number of fish species we have captured in Southampton Water up to 62.
Overall, catches in the spring were relatively high and comparable with the largest catches that we
have had in spring in the estuary (Graph SW1). It is likely that the mild water temperatures that we
had throughout the winter of 2013/14 helped the survival of small estuarine species and
overwintering juveniles. Impacts of the severe storms that damaged structures along the South
coast and beyond appear not to have impacted the fish population in the estuary. Throughout the
summer, warm, settled weather ensured high inshore water temperatures and the autumn catch
was again relatively high in comparison to previous years (Graph SW2).
We carried out our annual otter trawl in October and caught a variety of deeper water fish species
that we tend not to see in the catches using other methods, including thornback ray, starry smooth
hound and tub gurnard, as shown in Graph SW3.
Graph SW4 shows that numbers of bass caught in spring and autumn were relatively high and we
know from analysis in previous reports that bass abundance is closely linked to prevailing sea
temperature. Bass caught in spring are predominantly overwintered juveniles entering their second
year of life, whose abundance is largely dependent on winter sea temperature: those caught in
autumn are predominantly young of the year whose abundance is closely linked to summer sea
temperature.
This year we have seen an increase in the number of flatfish caught in both our fyke nets and the
otter trawl, with the otter trawl in particular showing a positive trend in flatfish catches (Graph
SW5). Solenette, Dover sole and plaice all show upward trends in abundance over the past five
years but flounder continue to be captured in very low numbers. Flounder spawn in spring, with
juveniles of around 30mm length drifting into estuaries from May to July - these grow to
approximately 80mm by the end of their first year. It is likely that the majority of the juvenile
flounder we catch in our spring surveys are migrating upstream through the estuary to less saline
environments (streams such as the Tanner’s Brook, for example), where a WFD survey captured a
number of juvenile flounder (see page 51). Graph SW6 shows that the 0+ year class flounder are
almost exclusively caught in the spring and are present in much lower numbers in our autumn
surveys. Flounder can penetrate far into freshwater and these habitats are probably essential to
maintain a large, resilient population.
When looking at the Southampton water flounder population over time, there is a strong link
between the numbers of juveniles we catch in the spring and the average temperature spring sea
surface temperature: cooler spring seas result in more juvenile flounder and vice versa.
63 of 71
Juvenile golden, thick and thin lipped grey mullet are not easy to tell apart
Tub gurnard, left, and thornback ray, right, both from the Hythe otter trawl
64 of 71
5.2. Adur Estuary
In 2014 we surveyed the three routine sites on the Adur estuary; Ladywell Stream, Old Toll Bridge
and Kingston Beach. We carried out seine net and beam trawl samples at each site, using the
same techniques as in Southampton Water. Map Adur 1 shows the locations of these sites.
Map Adur TrAC 1 shows the location of surveys carried out in the Adur estuary in 2014
Map Adur TrAC 1: survey locations 2014
A juvenile Dover sole from Kingston Beach
Towing the Kingston beam trawl
65 of 71
Results
Table Adur TrAC 1 summarises the 2014 classification results for the Adur estuary. For each of the
two sampling methods, a score between 1 and 5 is calculated for the ten metrics that make up the
classification tool. Overall scores (environmental quality ratios: EQR) are given for each method at
the bottom of each column, with the overall estuary score in the bottom right cell. NB the "boot"
column refers to "bootstrapping, a statistical method for taking variance in the whole dataset into
account.
Table Adur TrAC 1: 2015 WFD classification results
Adur
Method
Number of samples
29
71 Total: 100
Metric description
Beam trawl Beach seine boot
1. Species composition
3
1
1.33
Species diversity & composition 2. Presence of indicator species
5
1
1.66
3. Species relative abundance
5
4
4.16
Species abundance
4. Number of taxa that make up 90% of abundance
5
5
5.00
5. Number of estuarine resident taxa
2
3
2.84
6. Number of estuarine dependent marine taxa
4
3
3.16
Nursery function
7. Functional guild composition
4
5
4.84
8. Number of benthic invertebrate feeding taxa
3
2
2.16
9. Number of piscivorous taxa
3
2
2.16
Trophic inegrity
10. Feeding guild composition
5
5
5.00
EQR
0.73
0.53
0.56
Graph Adur TrAC 1 shows the number and species of fish caught in all surveys combined in the
2014 spring and autumn survey.
Graph Adur TrAC 1: Number & species of fish caught 2014
500
450
400
350
300
250
200
150
100
50
0
Spring
Autumn
66 of 71
Graph Adur TrAC 2 shows the 2014 spring and autumn catches compared to those in previous
survey years.
Graph Adur TrAC 2: Total catches 2010-2014
1800
1600
1400
Catch
1200
1000
800
600
400
200
0
2010
2011
Spring
2012
2013
2014
Autumn
Graph Adur TrAC 3 shows the relationship between the number of bass caught in autumn on the
Adur estuary and the average summer sea temperature.
Graph Adur TrAC 3: Bass catch and average summer temperature
450
17.75
400
17.50
350
17.25
17.00
250
16.75
200
Deg C.
Autumn bass
300
16.50
150
16.25
100
16.00
50
0
15.75
2010
2011
Autumn bass
2012
2013
2014
Mean summer sea surface temp. Deg C.
67 of 71
Discussion
WFD status
Table Adur 1 shows the results of the 2014 classification analysis by the Transitional and Coastal
Fish Index tool (TFCI) for the Adur Estuary. This indicates that the overall score (EQR) for the
beam trawl data was in the "Good" range (>0.58 & <0.81) but that the beach seine score was in
the "Moderate" range (<0.58 & >0.4). Combined, these resulted in an overall estuary score of 0.56,
so the formal 2014 classification for the estuary is "Moderate". The "confidence in class" statistic is
83.4% meaning that we can be "Quite Certain" that this is the correct status for the Adur estuary's
fish community in 2015 (>95% = "Certain"; <75% = "Uncertain"). This is the same classification as
in 2013.
By checking the ten individual metric scores in the beach seine net column in the table we can see
that metric 1 and 2, "species composition" and "presence of indicator species" both score only 1
out of 5 and are therefore the primary reasons for the overall EQR being below the threshold for
Good status. A formal investigation into the validity of this apparent WFD failure will completed in
spring 2015.
General observations
Graph Adur TrAC 1 shows that spring surveys on the Adur estuary resulted in a very low overall
catch of just 238 fish, only one individual of which was a bass. This is probably due to the very high
rainfall and subsequent river flows experienced in winter of 2013/14: the Adur estuary is far
narrower than Southampton Water and water velocities can be very high as a result of river
discharge and tide. This effect is exacerbated by the massive earth and chalk embankments that
keep water within the channel and prevent flooding of the wider valley. This means that there is
very little "off-channel" habitat for juvenile and small fish to use as refuge from high water velocity,
so there is an increased risk of a proportion of the fish community to be "washed out" during very
wet winters such as 2013/14.
A very settled warm summer, with little in the way of high flow periods, appears to have resulted in
excellent survival and growth conditions in the estuary, producing our highest ever autumn catch
for the Adur (Graph Adur TrAC 2). We saw a 400% increase in the juvenile bass abundance
compared to our highest previous catch and goby numbers, both sand and common, were the
highest recorded. The warm summer sea temperature and the link between sea temperature and
the number of bass caught in our autumn surveys can clearly be seen in graph Adur TrAC 3.
The Beam trawl carried out at Kingston beach turned up some interesting species, with a brill in
the spring and a lesser weever fish in the autumn catch. This highlights the importance of carrying
out surveys across a wide range of habitats and salinities within the estuary as these fish wouldn't
be found in the higher, more riverine locations further inland.
Two interesting specimens from the Kingston Beach surveys: a large thick lipped grey mullet (left)
and the first lesser weever we've captured in the Adur estuary
68 of 71
6. Fish monitoring in 2015
The Solent and South Downs fish monitoring programme for 2015 is relatively large and includes
the following elements:
•
Biennial Eel Index monitoring on the Ouse and Itchen (10 sites each)
•
•
Six-yearly Principal Brown Trout spatial monitoring on the upper Itchen (14 sites)
Six-yearly salmon parr spatial monitoring on the Itchen (14 sites)
•
Principal Coarse Fishery monitoring on the Cuckmere, Ouse, Adur, Western Rother, Wallington
and Hamble (5 sites each except for Wallington & Hamble; 2 sites each)
•
Estuarine fish surveys in spring and autumn on the Adur at Shoreham and throughout
Southampton Water (24 surveys in total)
•
Annual Principal Brown Trout temporal monitoring on the Meon, Lymington and Beaulieu (2
sites each)
•
28 Water Framework Directive surveys, covering various catchments across Hampshire, West
and East Sussex
69 of 71
List of abbreviations
EQR: Ecological Quality Ratio
F, B & G: Fisheries, Biodiversity & Geomorphology Team
TFCI: Transitional and Coastal Fish Index
TrAC: Transitional and Coastal, the term used for our estuarine fish survey programme.
WFD: Water Framework Directive.
Glossary
Biomass: a measure of the weight of fish per unit area. In this report, density means the weight of
fish in grammes per 100m2.
Canalise / channelise: to straighten and widen a natural, varied watercourse
Density: a measure of fish abundance per unit area. In this report, density means the number of
fish per 100m2.
Length-frequency histogram: a graph that shows the number of fish in each incremental length
category (usually 5mm) that helps clarify the size and age structure of a fish population.
Waterbody: a sub-catchment of a river, or a coastal water or lake that is a discrete management
unit for the Water Framework Directive. For rivers, these divisions are usually based on natural
hydrological units, such as tributaries.
Water Framework Directive: a European Union Directive that sets out a common approach to the
monitoring, management and improvement of fresh and coastal waters, with the aim of all
waterbodies achieving at least "Good" status by 2027.
70 of 71
www.gov.uk/environment-agency
Lit code details to be inserted here
71 of 71

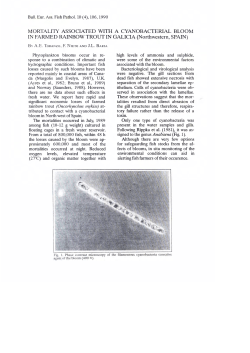


© Copyright 2026