
State Perspective and Strategic Plan (SPSP) PUNJAB
Integrated Watershed Management Programme State Perspective and Strategic Plan (SPSP) PUNJAB Submitted to Department of Land Resources, Ministry of Rural Development, Government of India State Perspective and Strategic Plan for IWMP, DoLRPUNJAB 1. Introduction: An overview of State. 2. Agro-climatic Zones 3. Demography & Land Distribution 4. Land Use Pattern. 5. Trends in Agriculture & Food productivity. 6. Implementation of Watershed Programmes in the state at present. 7. Strategy for implementation of IWMP. 8. Livelihood Concerns. 9. Institutional Arrangement. 10. Capacity Building. 11. Monitoring and Evaluation. 12. Expected Outcomes. Source: Statistical Abstract of Punjab; Department of Soil & Water Conservation, Punjab & line departments. State Perspective and Strategic Plan for IWMP – DoLR- PUNJAB Chapter I 1.0 Introduction Briefly describe physical features along with physical-cum-political map of the State. The state of Punjab forms a part of Indo-Gangetic alluvial plane and is composed of sediments of Siwalik Hills and Himalayas brought down and laid by the rivers of Indus system. The exact depth of the alluvium has not been ascertained though it varies from a few meters to over 2000 meters. The state can be divided in to the following major physiographic units. a) Shiwalik hills b) Piedmont plain c) Alluvial plain d) Sand plain e) Flood plain f) Palaeochannels The Shiwalik Hills in the north-east are steeply sloping. The Shiwalik hills occupy nearly 2.6 percent area of the state and cover sizeable area of Gurdaspur, Hoshiarpur, NawanShehar, Rupnagar and S.A.S Nagar districts. The piedmont area forms a transitional zone between the shiwalik hills and alluvial terraces. It is about 10 to 15 km wide and comprises of Gurdaspur, Hoshiarpur, Nawanshaher, Rupnagar and SAS Nagar districts. The Alluvial Plain/ terraces are the old flood plains of the rivers, the remnants of which lie above the level of present river beds. Three major alluvial plains/terraces are popularly known as upper-Bari Doab covering most parts of Tarn Taran, Amritsar and Gurdaspur districts, Bist Doab covering area between Beas and Satluj rivers and Malwa plain area south of river Satluj. The sand dunes are low ridges along the present and old courses of rivers and choes. At present, only 0.56% area of the state is under Sand dunes. The Flood plains of Ravi, Beas, Satluj and Ghaggar rivers and many seasonal rivulets cover nearly 10% area of the state. The Palaeo channels are believed to be the remnants of the old active channels. These areas occupy a low-lying topographic position on the landscape. 2 IWMP-SPSP-PUNJAB 1.1 Briefly describe drainage systems along with state map indicating major rivers. The drainage system plays an important role in shaping the landscape of an area due to its erosional and depositional nature. The Satluj, Beas and Ravi rivers form the main drainage system in the state of Punjab. The other main drainage channels in Punjab are Ghahhar river, White Bein, Black Bein, Kiran nala, Chakki River and Sakki Nala. In addition to these major drainage channels, these are numerous choes (seasonal rivulets), originating in the Siwalik hills and drain the Kandi area. The natural gradient of the drainage channels is generally from northeast to south-west direction. In areas, where natural drainage is lacking, artificial drains have been dug up for the disposal of storm water and seepage from waterlogged areas in the state. The drainage network map for the state was updated using the satellite data acquired during the period from 2003-2004 and digitized for critical appraisal of waterlogging, flooding and drainage congestion. In Punjab, out of the total irrigated area, 29 percent is irrigated by canals and remaining 71 percent by tubewells. There are six major canals system viz. Upper Bari Doab, Sirhind, Bikaner, Rajasthan, Bist Doab and Bhakra. Only Upper Bari Doab Canal is taking off from river Ravi and the other five canals from river Satluj. The canal network has been digitized for better perception of the command area of each major canal and their distributaries. 3 IWMP-SPSP-PUNJAB 4 IWMP-SPSP-PUNJAB 1.2 Brief description of all river basins The indo-Gangetic plain, of which the Punjab is a part, stretches from the Yamuna river the east to Sulaiman mountains (Pakistan) in the west and separates the peninsular from the extra-peninsular region. The whole expanse of the plains, from one end to the other, is formed with unvarying monotony of Pleistocene and recent alluvial deposits of the rivers of the Indo-Gangetic system. They have completely shrouded the old land surface to a depth of hundreds of meters. This is one vast level plain with wide eroded channels within which the great rivers have occasionally shifted their beds. The alluvial plain covers nearly two-third of the total geographical area of the state. The geological facts reveal that the Indo-Gangetic plain owes its origin to a depression of synclinal nature. The origin of this depression or trough is intimately connected with the origin of the mountains, though its exact nature is not known and is a matter of conjecture. This trough was later on filled up with enormous quantities of sediments brought down from the mountains by the rivers of the Indo-Gangetic system. The exact depth of the alluvium has not been ascertained, though it varies from less than 1,000 to over 2,000 meters. The alluvial sdimentse comprise of massive beds of clay, silt, sand and gravels (Sehgal, 1970; Sehgal et al., 1973; Wadia, 1976) Geologically, the state of Punjab is formed by the alluvial deposits of various rivers flowing through Punjab, namely Ravi, Beas, Satluj, Ghaggar and their tributaries. Based upon the period of deposition these are further sub divided into recent, newer and older alluvial deposits. The Siwalik range in the north-east of Punjab includes middle and lower Siwaliks. Thses hills are formed as a result of the latest phase of Himalayan orogeny. Theses are composed of Pinjore boulders, conglomerates and poorly lithified, soft and friable-sand stone and shales. The age of these deposits vary from Upper Miocene to Lower Pleistocene. The piedmont plain in kandi Belt of Punjab state is characterized by coarse textured, poorly sorted, sediments mixed with gravels and pebbles. It is formed due to coalescence of alluvial fans and is confined to narrow belt along the Siwalik foot hills. 5 IWMP-SPSP-PUNJAB 1.3 Demarcation of micro-watersheds along with code nos. on a map. 6 IWMP-SPSP-PUNJAB 1.4 Overview of the State Table SPSP 1: State Profile* 1 2 3 4 5 6 7 Population (As per the 2001 Census) Sl. No No. of Blocks Total no. of villages Total no. of Gram Panchayats Geographical area in Ha. Amritsar 9 746 708 267700 Gurdaspur 16 1617 1532 Name of District 1. 2. 3. 4. 5. 6. 7. 8. 9. 10. 11. 12. 13. 14. 15. 16. 17. 18. 19. 20. Male SC ST Female Others SC 315411 1152821 356400 230068 S T Total S T Others % of BPL to total population Others SC 274408 1004199 589819 1594018 29.6 701059 204238 622443 434306 1757808 9 Taran Taran 8 487 477 241900 141290 211935 121500 182265 262800 394200 31 Hoshiarpur 10 1417 1386 337000 196242 419250 181148 399566 377390 818816 18.48 Kapurthala 5 690 618 163000 119163 501453 1066245 206785 225787 976541 23.65 Jallandhar 10 950 934 263200 389067 897451 350695 687543 739762 965430 19.57 Nawanshahar 5 471 465 126000 109578 154936 101149 140739 210727 295675 0.05 Ropar 5 616 597 137600 69312 193946 61464 172368 130776 497091 12.2 S.A.S. Nagar 3 415 403 109300 67998 178743 55100 151221 123098 329964 11.6 Patiala 8 942 918 331900 200132 671358 176857 585532 376989 1256890 4.8 Fatehgarh Sahib 5 444 442 114200 88087 202050 76949 70955 165036 373005 3.6 Ludhiana 12 915 897 370600 415679 1247037 342529 1027586 757962 2274869 12.5 Sangrur 9 576 573 360500 293515 494280 257961 427486 551476 921766 26.67 Barnala 3 125 124 141400 50273 231221 41211 204226 91494 435447 19.48 Moga 5 329 321 223200 151647 322492 133292 287423 284939 600915 3.14 Ferozepur 10 1004 968 526300 210329 715895 188080 631803 398409 1347698 2.61 Faridkot 2 171 163 147700 104984 56743 94273 654123 199257 176532 2.86 Mukatsar 4 8 234 284 234 280 263600 337600 147000 189652 248000 443157 146000 164980 237000 385506 293000 344632 485000 828663 13 8 Bathinda Mansa GRAND TOTAL 5 240 238 217100 110296 141 12673 1278 5036200 3714350 0 20198 98593 9064025 3314373 19786 0 8098555 208889 7028723 76098 0 17162580 7 IWMP-SPSP-PUNJAB 3.90 12.18 1.5. Economic Development a. Brief description about the economic growth of the State, Growth of net state domestic product, per capita income and comparison to national GDP and per capita income growth rate, sectoral contribution to state domestic product, changes in occupational structure, data for last five years, strategies for future economic growth of the State, any other important information about the State Punjab has mainly Agriculture based Economy. Its average growth during 10th Plan has been 5.08% and the Average Annual Compound Growth rate of gross State Income during 2006-07 has been 6.32%. The Net State domestic Product at Factor Cost at current Prices has been Rs. 109459.44 Crores in the Year 2006-07 which has grown by 12.4% against previous year figure. The Per capita Income at current prices in Punjab has been Rs. 40566/- as compared to the National figure of Rs. 29642/- in the year 2006-07. The Gross State Domestic product was Rs. 123397.25 Crores in the Year 2006-07 which constitutes a significant share of the National GDP. The per Capita Income Growth Rate in the state has been more than 38% during the 10th Plan period. Agriculture with 30%, Industry 14% and Services (Tertiary) Sector with 44% are the major contributors in the Gross State Domestic product. From the Year 2000 to 2006, the occupation in the Govt. Sector has decreased from 69.73% to 66.78% while that in the Private sector has increased from 30.27% to 33.22%. for better economic growth in the future, the Agriculture Sector needs a major push/ support. 8 IWMP-SPSP-PUNJAB b. Role of watershed management in the State – Importance of watershed programme for the State, historical background of watershed development in the State, current status, expected outcomes, etc. Out of total 50.36 lakh Ha. of geographical area of Punjab, 41.84 Lakh Ha. (83%) is under cultivation. Out of which, 40.78 Lakh Ha. (97.5%) is irrigated. However, only 11.93 Lakh Ha. (28.5%) of cultivated area is irrigated by canals and the remaining 29.91 Lakh Ha. (71.5%) cultivated area depends upon rainfall and groundwater for irrigation. The uneven & erratic rainfall over the years has lead to over-exploitation of the ground water resources of the state to the extent that 103 blocks out of total 141 blocks have been declared 'Over-exploited' and the ground water table is depleting at an average rate of 50cm annually. Poor ground water quality & water-logging is a major challenge in a few areas of South-western districts. Further, rampant Paddy-wheat Cycle in about 34.67 Lakh Ha. (83%) has caused severe damage to the soil health & structure in 39% area of the state. In this context, Watershed Management Programmes have become highly important for not only reversing the trend of deteriorating quantity & quality of ground water but also to prevent further soil degradation. Watershed Development started by the GOI Ministry of Agriculture during the 8 th Plan with the National Watershed Development programme for Rainfed Areas (NWDPRA) and Flood Prone River-Ghaggar-River valley project (FPR-RVP) schemes in the Northern kandi area (5.38 Lakh Ha., nearly 10% of the total geographical area) districts of Mohali, Ropar, Nawanshaher, Gurdaspur & Hoshiarpur districts. The All India Soil & Land Use Survey (AISLUS) has divided this area into 138 watersheds comprising of 5.16 Lakh Ha. of treatable area, out of which 97 watersheds have already been taken up covering an area of 1.30 lakh Ha. The Integrated Wasteland Development Programme (IWDP) of the Ministry of Rural Development was started during the 10th Plan period. Till date, 16 projects have been started in 12 districts covering an area of 0.66 Lakh Ha. These Projects have been formulated based on the local problems of soil & water in the project area. 3 more IWDP projects are being proposed covering 0.35 Lakh Ha. in 3 districts. All the above programmes of Watershed Development shall play a big role not only in improving the state of soil & water resources thereby improving production of food grains but shall also help in socio-economic development & ecological development of the project areas. 9 IWMP-SPSP-PUNJAB Chapter 2 2.0 Agro-climatic zones Briefly describe the agro-climatic zones of the States including the soil types, rainfall, major crops, etc. The climate of Punjab is dominantly sub-tropical and monsoon type. The mean annual rainfall varies from about 1200 mm in Dhar block of Gurdaspur district (wettest) to less than 300mm at Abohar (driest). Soil moisture regimes are udic, ustic and aridic and soil temperature regime is hyperthermic. The extent of variabilities in agroecological regions, soil characteristics (e.g texture, soil fertility, etc), ground water behavior, drainage, flood prone areas, soli salinity/alkalinity, ground water quality, etc. Based on soil and climatic parameters, the Punjab Agricultural University has divided Punjab into the following Agro Climatic regions:1. Sub Mountainous undulating region or Kandi region. 2. Undulating plain region. 3. Central plain region. 4. Western plain region. 5. Southern plain region. 6. Flood Plain/Bet Area. 10 IWMP-SPSP-PUNJAB Sub Mountainous undulating region or Kandi region Kandi region as notified by Govt. of Punjab consists of all areas in Punjab lying to the east of Derabassi-ChandigarhRopar-Balachaur-Hoshiarpur-Mukerian road. Kandi region is spread over 22 blocks in 5 districts. The boundaries of development blocks are not coterminous with the boundaries of Kandi region. Most blocks contain both Kandi and nonkandi area. Entire Kandi area has been declared as backward area. As the unit of development is a block, this artificial demarcation creates some problems in the implementation of the programme. The total area of the Kandi region is not known precisely but the total area of the above blocks is estimated to be 5 lac hectares or about 10% of the total area of the state. Kandi area is one of the most backward area of the state. Most of the population depends on agriculture either as farmers or as agricultural labourers. The few industrial units established to take advantage of subsidies in backward areas are concentrated near Ropar and in few villages of Nawanshaher district. Most of the farmers have small (1-2 ha) or marginal land holdings. Literacy especially amongst the women is very low. Most of the adult males have been traditionally working as laborers in the town, particularly in grain markets. Out migration which was earlier temporary is now more of less permanent. Apart from agriculture and labour, other major sources of income are animal husbandry and sale of trees from cultivated areas and illegally from forest areas. Many poor people particularly ladies from both farming and landless labour families collect fuel wood from hills and store it at household level for sale. Sale of trees from cultivated areas is also at the village level to petty contractor. Most of the villages lack facilities of all whether roads, good schools and hospitals. The total normal rainfall of the Kandi region varies from about 800 to 1500 mm, about three fourths of which is received during rainy season in a few rainy days. The normal winter (November to March) rainfall is bout 170 mm. The minimum temperature in Dec-Jan may be close to freezing and the maximum during May-June to about 45 degrees. 11 IWMP-SPSP-PUNJAB 12 IWMP-SPSP-PUNJAB Undulating plain region In the Kandi region, undulating area just below the hills with 2-6% slope is used for raising crops mainly rainfed. Out of total rainfed area of 3.75 Lac hectare in 1994-95 about 75% or 2.81 lac hectares is in the Kandi area. The average annual rainfall of the area varies from 800mm to 1500mm with wide variations. About 80% of total rainfall is received in 3 months from mid June to mid September. The aberrations include late start of monsoon season and its early withdrawl, long dry spells within monsoon season and heavy showers received in a short period of 2-3 days. Open pan evaporation during the growth period varies from about 2mm/day in December-January to about 5mm in last week of March and first week of April. But in most of the years, maize fails because of lack of moisture at the time of maturity of crops and wheat cannot be sown for the same reason. The entire 1.0 lac hectares rainfed wheat and 0.75 lac hectares maize is grown in this region. Cultivated Plain Area: Irrigated agriculture with shallow tubewells as source of water is practiced. The problems are more or less the same as in Kandi choe related problems and other tubewell irrigated areas. Central plain region Extent: This region of non Kandi area of Gurdaspur, Hoshiarpur, Nawanshahar Roopnagar and Patiala districts, and whole area of Jalandhar, Kapurthala Ludhiana and Fatehgarh Sahib districts and most of Sangrur and Amritsar districts. The region constitute a little more than 50 per cent of the total area of the state. Rainfall and irrigation: The rainfall in the region varies from 500-800 mm and about 80 per cent of which is received in a short period 3 months (mid June to mid September). The region also receives lot of run off water from the Kandi area through a number of channels like White Bein and Black Bein in Jalandhar and Kapurthala districts, Patiala Ki Rao and Ghaggar in Patiala and Sangrur districts and number of Nalas originating in Kandi area of Gurdaspur and Amritsar districts. Even though the area is irrigated by upper Bari Doab canal in Gurdaspur and Amritsar districts, Bist Doab canal in Hoshiarpur Nawanshahar and Jalandhar districts, Sirhind Canal, Bhakra Main Canal in Ludhiana, Patiala and Sangrur 13 IWMP-SPSP-PUNJAB districts , however, except for Sangrur and Patiala districts the area irrigated by canals is very small. Major constraints of the region are declining water table and soil sodicity and salinity. Decline in water table: Directorate of water resources Punjab monitors the water levels at a large number of locations. Data from 228 selected observations well between June 1983 and June 1990 were analyzed by the scientists of the Punjab Agricultural University for 19 Agro Climatic zones, based on soils and canal system. Their conclusion is "The study further brought out that present normative demands are not met. If the normative demands are met the fall in water table will be much more. One may not agree with the methodology or absolute figures but it cannot be over looked that ground water in the sweet water zone is being over exploited and if this trend continues, it may prove disastrous for Punjab agriculture. Every effort should be made to halt this process and if possible reverse it." Sodic Soils kallar. Large area of land in the Semi- Arid central plains of Punjab was Affected sodicity commonly known as Most of these lands had been lying uncultivated for long where nothing grew. The technology for the improvement and reclamation of these soils was developed by the scientists of Central Soil Survey Research Institute Karnal and that for rainfed areas was developed by Scientists of Punjab Agriculture University which essentially consisted of (a) provision of a good quality ground water (b) and leveling (c) addition of gypsum (d) suitable cropping pattern and (e) appropriate agronomic practices. The Punjab Land Development Reclamation & Development Corporation in coordination with the Agriculture department took up the work of reclamation of sodic soil on a large scale in early eighties. As a result of these efforts 2 lac hectare area has been reclaimed. Western plain region & Southern plain region Climate: South western plains region comprises of Mansa, Bhatinda, Faridkot and Ferozepur districts. The total area of the region is 17.14 lac hectares forming 35 per cent of the state. The rainfall varies from 260 mm in Abohar to 450 mm in Ferozepur. About 80 per cent of total rain is received in 3 months July to September but is not enough to meet evaporative demand of the crop. Rainfall is not only low but also highly risky. Average annual mean temperature is about 14 IWMP-SPSP-PUNJAB 25 degree C with the lowest minimum close to freezing point in December- January and highest (above 40 degree C) in June. Ground Water: Most of the ground water in the region have moderate to high salinity and sodicity hazards and thus cannot be used for irrigation for prolonged periods. Irrigation: Successful agriculture in the region is possible without irrigation. Ground water is either not available or not suitable for irrigation because of high salinity or sodicity hazard. The only alternative is to provide canal irrigation. Sirhind canal was the first canal to be constructed for providing irrigation to this area. Water from this canal head works at Ropar on river Satluj was released in 1882. Now the region is being irrigated by following canal system. Sirhind Canal Sirhind Feeder Eastern Canal Out of total net irrigated area of 13.69 lac Hect. in the region in 1994-95, 9.66 lac hectare (71%) is irrigated by canals. About two third of the net irrigated area of canals in the state is in this region. In recent years there has been an increase in the tube well irrigated area, particularly in Ferozepur district where 46 per cent of total net area is irrigated by tube wells. Because of the serious water quality problem this would need careful monitoring. In this south-western plains region 88 per cent of total area is under cultivation. Cropping intensity in the region is 179 and of the total 27.75 lac hectares cropped area, 26.66 lac hectares or 96 per cent is irrigated. Flood Plain/Beet Area An area of 10138 hectares in Punjab is Beet area falling under Hoshiarpur district. Rains are scanty and there are no definite sources of irrigation like canals, ponds etc. The groundwater table is normally very deep with tubewell bores running to a depth of more than 650 feet. Like submountaneous area, the land is undulating and soil is very deep. Main problem of bet area is the lack of water for irrigation and even for drinking purposes. 15 IWMP-SPSP-PUNJAB Table SPSP 2: Details of Agro-climatic zones in the State 1 2 3 4 S. No Name of the Agro-climatic zone Area in Ha. Names of the districts 1. Semi Arid 263570 Amritsar Sub Mountain Undulating Region 88562 Gurdaspur Undulating Plain Region 137450 5 Major soil types b) Area in a)Type Ha. Sandy loam 222000 to loam Sandy to 88562 Sandy Loam Clay Loam to Sandy Loam, Central Plain Region 6 Average rainfall in mm (preceding 5 years average) 522.5 1400 87836 123616 Sandy Loam to Clay Loam Wheat, Paddy,Basm ati, Sugarcane, Berseem, Vegetables Sandy Loam to Clay Loam 123616 Central Plane 241449 T.Tarn Dry Sub humid 339800 Hoshiarpur Central Plain 167000 Kapurthala Central Plain 263000 Jalandhar Sub Mountain Undulating Region 25000 Nawanshaher 4. 5. 6. 7. Undulating Plain Region 15000 Sub Mountain Undulating Region 8. 135728 Ropar b)Area in Ha. 183000 187000 48709 106467 1100 Wheat, Paddy,Basm ati, Sugarcane, 101630 Paddy Wheat Wheat Maize Rice Wheat, Rice Wheat, Rice Wheat Rice Sugarcane Maize Sunflower Rapeseed & Mustard 166290 180000 136771 60065 55272 187653 165321 162000 134000 72000 50000 9000 17000 15000 Wheat Maize 61139 20301 Loamy Sand, Loamy Clay Sandy loam Loamy sand 241449 650 159905 119929 900 Centrail Alluvial Plain Centrail Alluvial Plain sandy to sandy loam 167000 544 263000 703 25000 900 15000 135728 750 935 Clay Loam to Sandy Loam, Sandy Loam to Clay Loam Sandy loam to loamy a)Name Rice Wheat Wheat, Maize, Paddy, Vegetables, Horticulture Fruit Plantation 1100 49614 2. 3. 7 Major crops 1000 16 IWMP-SPSP-PUNJAB sand 36231 16823 Wheat Maize Rice Fodder Rice Wheat Rice Wheat Wheat Paddy Fodder Vegetables Wheat Paddy 51362 6378 30153 21360 234000 240000 84000 85000 247677 240270 49807 8307 283000 262000 Undulating Plain Region 101713 S.A.S. Nagar Sandy loam to loamy sand 101713 815 Central Alluvial Plain 329000 Patiala Clay 329000 571.8 Central Alluvial plain 117000 Clay 117000 403.4 Central Alluvial Plain 368000 Fatehgarh Sahib Ludhiana deep loamy alluvial 368000 680 South western plain region 312000 Sangrur 312000 344 South western plain region 140965 Barnala 140965 342 Wheat Paddy 112000 99000 South Westren Plain region 205895 Moga Sandy loam to loamy sand Sandy loam to loamy sand, saline and Sodic Sandy Loam Loamy Sand 97000 108895 277 Wheat Paddy 194350 167615 Northen-Arid Zone 526300 Ferozepur 237.98 South western plain region 146875 Faridkot Sandy Loam Loamy Sand 84825 62650 395.8 Arid Irrigated Zone 263933 Muktsar Sandy loam 263933 380 Wheat Paddy Cotton Paddy Cotton Wheat Cotton Wheat Paddy Wheat Cotton Paddy 389000 235000 151000 90000 14000 111000 413702 Wheat Cotton Paddy Rice Wheat Pulses groundnut Sunflower Oilseeds Sugarcane Fruits Vegetables 169000 100000 61000 2621000 3467000 29000 4000 15000 70000 99000 57000 110000 9. 10. Rice Fodder 11. 12. 13. 14. 15. 16. 17. 18. Arid 336725 Bathinda 19. Western Area( Plain) 216643 Mansa 257000 375000 2680000 1714000 10138 20 districts 20. Sub Mountainous undulating region or Kandi region. Undulating plain region. Central plain region. Western & Southern plain region. Flood Plain/Bet Area. Loamy sand Sandy Loamy Sandyyto Sandy Loam 168362 168363 216643 333.8 156.35 303052 227289 75763 17 IWMP-SPSP-PUNJAB 2.1 Rainfall a) Brief description about rainfall in the State, months during which rainfall is received in the State, distribution of rainfall over the year with average rainfall per month, type of monsoon etc. The mean annual rainfall is 705mm, which varies from 1200mm at Pathankot to less than 300 mm at Abohar, representing wettest and driest stations, respectively. The major part of rain fall occurs between the months of July and September, and is essential for growing Kharif crops and subsequent sowing of rabi crops. Hence the climate of the state is dominantly, semiarid and monsoonic type. The soils moisture regimes are udic, ustic and aridic and the soil temperature regime is mainly hyperthermic. Table SPSP 3: Details of average rainfall and altitude recorded at the District headquarters 1 2 S.No. Name of the District 1. Amritsar 2. Gurdaspur 3. Taran Taran 4. Hoshiarpur 5. Kapurthala 6. Jallandhar 7. Nawanshahar 8. Ropar 9. S.A.S. Nagar 10. Patiala 11. Fatehgarh Sahib 12. Ludhiana 13. Sangrur 14. Barnala 15. Moga 16. Ferozepur 17. Faridkot 18. Mukatsar 19. Bathinda 20. Mansa STATE AVERAGE 3 Average rainfall in mm (preceding 5 years average) 432.2 917.6 391.7 576.2 428.10 552.5 630.2 671.8 376.7 571.8 403.4 375.7 344.9 287.2 197.4 171.0 462.9 449.7 357.9 155.0 438.0 18 IWMP-SPSP-PUNJAB b) A brief description of droughts and floods in the State in the last ten years. Table SPSP 4: Details of drought and flood affected districts, blocks and villages in the State during last 10 years * (MIS Table-M(SP)6) 1 2 3 4 5 Sl.No Name of the District Particulars Names of the Block Villages Data Available Not Flood Drought Data Available Data Available Not Not 6 Periodicity 7 Not affected No.of villages Data Not Available Any other (pl.specify) Data Not Available Name (s) of villages Data Not Available Data Available Not Data Not Available No.of villages Data Not Available Data Available Not Data Not Available Name(s) of villages Data Not Available Data Available Not Data Not Available Annual Data Not Available 19 IWMP-SPSP-PUNJAB Chapter 3 3.0 Demography and land distribution – an overview Growth in population during the last three census’ , per capita availability of land, sex ratio, population age group in the State, literacy level, migration, workforce available in different sectors of the economy, demography of SC,ST, BPL and landless families in the State in the last ten years, etc. The Population during the last 3 Census' in the Year 1981, 1991 and 2001 was 1.68 Crores, 2.03 Crores and 2.44 Crores respectively marking a Growth of 45% in these 2 decades. The Average Size of Land Holding has been 4.03 Ha. and the Sex Ratio in 2001 was 876. As per 2001 Census, there were 1.30 Crore Males and 1.14 Crore Females in the state, out of which 0.32 Crores were Children in the Age Group (0-6). The Literacy rate has been 69.7% excluding the Children in the Age Group (0-6). The migration of population is small proportions is either to big cities or foreign shores. Out of total workforce of 91.27 Lakh, 20.65 Lakh are Cultivators, 14.90 Lakh are Agricultural Labourers and the remaining are in other Main & marginal industries. There are 12.55 Lakh SC, 0 ST, 0.93 Lakh BPL and 2.09 Lakh Landless families in the state. 3.1 Land reform measures – types of tenancies, distribution of ceiling surplus land, bhoodan land and wastelands among landless, prevention of alienation of tribal land, restoration of alienated land among tribals, women’s land rights, empowerment of PRIs, definition and proper categorization of common property resources etc. There are 20.65 Lakh Cultivators (Land Owners) and 14.90 Lakh Agricultural Labourers (Tenants or Workers) in the state. At present, there is no Govt. policy to distribute ceiling surplus land, bhoodan land and wastelands among landless. There are no tribals in the state. Women have equal land rights to men as per the relevant GOI Act. The PRIs are involved in most of the Govt. schemes of Social, Agricultural & rural development. The ongoing watershed development programmes of NWDPRA & IWDP are being implemented through PRIs only. The Common Property Resource (CPR) may be defined as categorization of area under different land use/ land cover categories in different socio-cultural zones apart from Agriculture, residential of industrial uses. There is 3.00 Lakh Ha. of Built-up land, 43.70 Lakh Ha. Agricultural Land, 1.54 Lakh Ha. of forests, 0.98 Lakh Ha. Wastelands, 0.96 Lakh Ha. under Water bodies and 0.19 lakh Ha. of wetlands in the state. 20 IWMP-SPSP-PUNJAB 3.2 Operational land holdings in the State under different categories and income a) Brief description about land holdings: There are total 9.98 Lakh Operational Land Holdings in the state, out of which 0.72 Lakh (7.25%) are Large (>10 Ha.), 1.23 Lakh (12.31%) are Marginal (<1 Ha.) and the remaining 8.03 Lakh (80.46%) are Small (1-10 ha.) holdings. Table-SPSP 5: Details of District-wise land holding pattern in the State * (MIS Table-M(SP)9) 1 S. No. 1. 2. 3. 4. 2 Names of Districts Amritsar Gurdaspur Taran Taran Hoshiarpur Kapurthala 5. 6. Jallandhar 3 Type of Farmer i) Large ii) Small iii) Marginal iv) Landless Sub-total i) Large ii) Small iii) Marginal iv) Landless Sub-total i) Large ii) Small iii) Marginal iv) Landless Sub-total i) Large ii) Small iii) Marginal iv) Landless Sub-total i) Large ii) Small iii) Marginal iv) Landless Sub-total i) Large 4 No. of households 1901 16835 9184 5 No. of BPL households 27920 2359 69415 41434 174751 287959 1984 43682 9184 0 30551 30551 6 Land holding (ha) Irrigated Rainfed 25943 23317 5893 144051 27719 164198 13438 0 4429 40473 6459 205355 26528 23317 4097 51361 54850 2000 52000 21000 0 75000 2584 23640 4790 0 0 0 3686 14750 18436 53942 17816 83050 4200 0 105066 40826 80121 3112 0 19184 67950 7800 0 94934 31014 21015 0 124059 158415 0 Total 25943 23317 5893 144051 32148 204671 19897 0 256716 26528 23317 4097 0 53942 37000 151000 12000 0 200000 40826 80121 3112 0 124059 158415 21 IWMP-SPSP-PUNJAB 7. 8. 9. Nawanshahar Ropar S.A.S. Nagar Patiala 10. Fatehgarh Sahib 11. Ludhiana 12. Sangrur 13. 14. Barnala ii) Small iii) Marginal iv) Landless Sub-total i) Large ii) Small iii) Marginal iv) Landless Sub-total i) Large ii) Small iii) Marginal iv) Landless Sub-total i) Large ii) Small iii) Marginal iv) Landless Sub-total i) Large ii) Small iii) Marginal iv) Landless Sub-total i) Large ii) Small iii) Marginal iv) Landless Sub-total i) Large ii) Small iii) Marginal iv) Landless Sub-total i) Large ii) Small iii) Marginal iv) Landless Sub-total i) Large 29930 9205 65131 5807 60150 8780 37144 55416 26341 127681 6890 18965 45325 16589 87769 4956 15623 32571 13548 66698 5005 8737 4460 60517 78719 1546 3799 12379 22473 40197 48483 14076 9819 164165 236543 41910 49957 9014 100881 10409 0 4884 4884 2758 2758 229353 15 25 34 0 1 4 5 74 10 10 16 29 3 4 55 9 14 21 7 1582 1582 44 8 0 0 0 0 0 48483 14076 9819 0 0 72378 132800 158400 28800 0 320000 94477 0 34975 34975 2 6 65131 5807 0 229353 16 29 39 0 84 10 19 33 0 62 9 16 27 0 52 0 0 0 0 0 0 0 0 0 0 48483 14076 9819 0 72378 132800 158400 28800 0 320000 94477 22 IWMP-SPSP-PUNJAB Moga 15. Ferozepur 16. Faridkot 17. Mukatsar 18. Bathinda 19. Mansa 20. GRAND TOTAL ii) Small iii) Marginal iv) Landless Sub-total i) Large ii) Small iii) Marginal iv) Landless Sub-total i) Large ii) Small iii) Marginal iv) Landless Sub-total i) Large ii) Small iii) Marginal iv) Landless Sub-total i) Large ii) Small iii) Marginal iv) Landless Sub-total i) Large ii) Small iii) Marginal iv) Landless Sub-total i) Large ii) Small iii) Marginal iv) Landless Sub-total i) Large (2-10 ha) ii) Small (1-2 ha) iii) Marginal (<1 ha) iv) Landless Grand total 10784 1346 28445 1277 22539 39156 7916 6270 69809 123151 63717 8741 2996 0 124199 183576 11314 3976 0 0 198866 437527.3 11918 2112.55 0 75454 21753 4611 3132 0 451558 115285 6490 2003 0 29496 3526 13628 25148 11255 53557 44078 8262 7632 37552 97524 1388 14288 1786 0 123778 8 10 19 0 37 277249 11912 4639 3 32042 2000 1000 293800 54878.89 130305.8 2929.57 35042 188114 1641538.15 812019.77 92137.12 0 3840653 0 55656 110427 15264 0 181347 1896 1896 7800 7800 17462 686515 183064 133791 555608 1558978 0 0 0 3686 92960 96646 2 1 28445 1277 0 124199 183576 11314 3976 0 198866 437527.26 11918 2112.55 0 451557.81 115285 6490 2003 0 123778 8 12 20 0 40 309291 13912 5639 0 328842 54878.89 130305.77 2929.57 0 188114.23 1697194.15 922446.77 107401.12 0 4022000 23 IWMP-SPSP-PUNJAB Table SPSP 6: Share of Agriculture Sector to State Income/National Income at Current Prices and Total Work Force in the State and India 1 Year 1999-2000 2000-01 2006-07 @ 2 3 Percentage share of Agriculture & allied (Primary) sector in NSDP@ figure State All India 37.53 25.52 35.89 24.69 31.24 18.80 Percentage share of Agriculture in Total Workforce State All India 38.95 60.00 NSDP: Net State Domestic Product Table SPSP 7: Sectoral Composition of Net State Domestic Product (NSDP) in State. Sector Agriculture and allied (Primary) Sectors Industrial (secondary) Sector Service (Tertiary) Sector Years 2005-06 30.72 1999-2000 37.53 2000-01 35.89 2006-07 31.24 22.75 22.98 24.33 24.78 39.72 41.13 44.95 43.98 24 IWMP-SPSP-PUNJAB Chapter 4 4.0 Land Use Pattern 4.1 Brief description about land use planning and agriculture land in the state: There is 3.00 Lakh Ha. of Built-up land, 43.70 Lakh Ha. Agricultural Land, 1.54 Lakh Ha. of forests, 0.98 Lakh Ha. Wastelands, 0.96 Lakh Ha. under Water bodies and 0.19 lakh Ha. of wetlands in the state. 4.2 Mechanism in the State for land use conversion, establishment of Land Use Board in the State, conversion of agricultural land to other uses in the last five years, brief description of other uses to which agricultural land has been converted, extent to which area under wastelands has been reclaimed and the uses to which the reclaimed land has been put, etc. At present, the Revenue department gives the permission for land use conversion in the state. A State Land Use Board was established under a GOI Scheme which has become redundant now due to scrapping of GOI scheme. The Net Sown Area has reduced from 42.50 Lakh Ha. in the Year 2000-01 to 41.84 Lakh Ha. in the Year 2006-07. The agricultural land is decreasing as it is being converted to residential & industrial land in the state. An area of 66157 Ha. of wasteland has been reclaimed and put to productive agriculture use. 25 IWMP-SPSP-PUNJAB Table-SPSP 8: Land Use status in the State (average of preceding 5 years)* (Area in 000 Ha.) 1 2 3 Districts Geogra phical Area Forest Area Amritsar Gurdaspur Taran Taran Hoshiarpur Kapurthala Jallandhar Nawanshahar Ropar S.A.S. Nagar Patiala 267 356 241 340 163 266 119 144 111 329 10 37 5 108 2 6 16 37 18 13 4 Land under NonAgril use 31 21 18 28 29 21 11 14 15 36 Fatehgarh Sahib Ludhiana Sangrur Barnala Moga Ferozepur Faridkot Mukatsar Bathinda Mansa 117 2 11 368 361 141 168 585 144 263 334 219 5036 10 5 2 2 12 2 2 8 3 300 52 38 13 22 38 17 14 32 14 475 Grand Total 5 6 Total rainfed area b)cultiv able waste a)cultiva ted 7 Land under miscellaneous tree crops and groves Permanent pastu-res 8 9 10 11 12 13 Curre nt fallow Other fallow Net sown area Net area sown more than once Net irrigated area Gross crop-ped area 222 288 218 201 136 239 95 78 75 273 202 224 186 154 139 179 83 63 44 263 222 237 218 172 135 239 87 67 75 273 424 512 404 355 275 418 178 141 119 536 102 91 102 193 305 315 124 195 476 128 227 297 190 4184 275 309 116 176 397 126 222 258 170 3677 305 315 124 195 474 128 225 295 190 4078 580 624 240 371 873 254 449 555 360 7861 1 1 1 1 2 2 1 2 1 1 4 1 1 2 3 14 3 2 4 7 35 1 26 IWMP-SPSP-PUNJAB 4.3 Irrigated areas a) Brief description about irrigated area in the State – major sources of irrigation – effect of climate change on irrigation – increase or decrease in irrigated area in the last five years – effect on crop yields, productivity and change in cropping pattern. Out of total 50.36 lakh Ha. of geographical area of Punjab, 41.84 Lakh Ha. (83%) is under cultivation. Out of which, 40.78 Lakh Ha. (97.5%) is irrigated. However, only 11.93 Lakh Ha. (28.5%) of cultivated area is irrigated by canals and the remaining 29.91 Lakh Ha. (71.5%) cultivated area depends upon rainfall and groundwater for irrigation. The uneven & erratic rainfall / climate over the years has lead to over-exploitation of the ground water resources of the state to the extent that 103 blocks out of total 141 blocks have been declared 'Over-exploited' and the ground water table is depleting at an average rate of 50cm annually. The Net Irrigated Area has marginally increased from 40.38 Lakh Ha. in the Year 2000-01 to 40.78 Lakh Ha. in the Year 2006-07. However, this change has been affected due to a rise in the no. of Tubewells to 12.32 Lakhs, higher drawl from underground water aquifers and the area irrigated by canals has in fact decreased during this period. From 2000-01 to 2006-07, there has been an increase in yield of Rice from 3506 kg/Ha to 3868 Kg/ha and decrease in the Yield of Wheat from 4563 kg/Ha to 4210 Kg/ha. During this period, the area under Rice has increased from 26.12 Lakh Ha to 26.21 Lakh Ha. and the area under Wheat has increased from 34.08 Lakh Ha to 34.67 Lakh Ha. 27 IWMP-SPSP-PUNJAB Table-SPSP 9: Irrigation Status (Area in 000 Ha.)* 1 2 3 4 Districts Gross# cultivated area Net cultivated area Gross@ irrigated area 424 512 404 355 275 418 178 141 119 536 222 288 218 201 136 239 95 78 75 273 193 102 426.46 410.89 384.54 254.95 277.00 413.28 167.00 106.00 96.00 531.70 192.50 221.94 205.44 217.54 144.33 135.00 235.12 84.00 62.00 52.00 531.70 192.50 99.97 79.94 99.79 72.17 100.00 100.00 89.36 80.52 82.54 99.38 100.00 580 624 240 371 873 254 449 555 360 7861 305 315 124 195 476 128 227 297 190 604.80 616.60 125.00 194.34 891.80 253.00 437.57 328.84 361.00 7657.4 306.00 312.00 125.00 194.34 463.70 126.00 218.79 293.80 190.00 4078.00 100.00 100.00 100.00 94.39 96.99 96.92 90.07 89.34 96.94 97.70 Amritsar Gurdaspur Taran Taran Hoshiarpur Kapurthala Jallandhar Nawanshahar Ropar S.A.S. Nagar Patiala Fatehgarh Sahib Ludhiana Sangrur Barnala Moga Ferozepur Faridkot Mukatsar Bathinda Mansa Grand Total 4184 5 6 Net irrigated Net irrigated area % 7 Rainfed Area 1.00 51.36 94.93 10.00 16.00 11.00 23.00 % of net cultivated area 0.45 19.98 0.00 47.47 0.00 0.00 10.64 20.78 17.46 0.00 0.00 0.00 9.04 0.00 0.00 43.49 35.05 285.58 0.00 0.00 10.66 0.00 7.19 28 IWMP-SPSP-PUNJAB Table-SPSP 10: Source-wise Area Irrigated (Area in 000Ha.)* 1 2 3 4 5 6 Canal (Area) Tanks Open wells Bore wells Lift irrigation Districts Amritsar Gurdaspur Taran Taran Hoshiarpur Kapurthala Jallandhar Nawanshaha r Ropar S.A.S. Nagar Patiala Fatehgarh Sahib Ludhiana Sangrur Barnala Moga Ferozepur Faridkot Mukatsar Bathinda Mansa Grand Total 54 56 115 21 0.5 4 1.0 No Area No Area 45 60.00 137 0.03 0 0.00 524 0.01 4 0 6 11 10 19 27 3 161 107 200 215 95 1109 45 60.00 661 0.04 No Area 67970 51338 87292 20000 20000 40000 20885 168 213 103 141 135 233 83 10000 80000 7000 3000 74 49 265 91 294000 92123 10000 83183 30000 5000 5000 29705 32689 1246000 296 293 97 192 314 17 24 81 95 2964 7 Others (Pl. specify) No Area No Area 15 250.00 10 145.00 8 1438.00 8 Total No Area 67970 222 269 218 165 135 237 84 2000.00 5 0.02 20891 78 50 271 102 294000 92123 83 23 1688.00 15 2145.02 29705 32689 537461 29 IWMP-SPSP-PUNJAB 306 312 124 195 475 124 224 296 190 4077 4.4. Common Property Resources (CPR): Brief description about Common Property Resources in the State, laws regarding common property resources, access of landless to the CPRs, management and maintenance of CPRs, brief description of CPRs which have become inoperable due to non-maintenance, state assistance, if any, for development and maintenance of CPRs etc. The Common Property Resource (CPR) may be defined as categorization of area under different land use/ land cover categories in different socio-cultural zones apart from Agriculture, residential of industrial uses. There is 3.00 Lakh Ha. of Built-up land, 43.70 Lakh Ha. Agricultural Land, 1.54 Lakh Ha. of forests, 0.98 Lakh Ha. Wastelands, 0.96 Lakh Ha. under Water bodies and 0.19 lakh Ha. of wetlands in the state. The CPR is either under control of the Revenue department, Panchayats or Municipal Corporations etc. and the Revenue Department can transfer the same to other uses. The landless can work as labourers under different schemes on the CPR. Most of the CPR, barring Mountainous land, is operable and is put into diverse uses as described in the table below. 30 IWMP-SPSP-PUNJAB Table-SPSP 11: Details of Common Property Resources in the State *(MIS Table-M(SP)10) 1 2 3 S. No. Names of Districts CPR Particulars 1. 2. 3. Amritsar Gurdaspur Taran Taran Wasteland/ degraded land Pastures Orchards Village Woodlot Forest Village Ponds/ Tanks Community Buildings Weekly Markets Permanent markets Temples/ Places of worship Others (Pl. specify) Wasteland/ degraded land Pastures Orchards Village Woodlot Forest Village Ponds/ Tanks Community Buildings Weekly Markets Permanent markets Temples/ Places of worship Others (Pl. specify) Wasteland/ degraded land Pastures Orchards Village Woodlot Forest Village Ponds/ Tanks Community Buildings Weekly Markets 4 Total Area (ha) Area owned/ In possession of Govt. Any other Pvt. (Specify PRI (Pl. persons deptt.) Specify) 191 177 176 5 Area available for treatment (ha) Pvt. persons 191 Govt. (specify deptt.) 177 PRI Any other (Pl. Specify) 20 9632 438 22598 150 205 8400 4000 2600 425 2932 98 302 100 15 33140 150 1446 32 302 2630 98 2630 98 554 5176 504 153 5176 504 31 IWMP-SPSP-PUNJAB Permanent markets 20 Temples/ Places of worship Others (Pl. specify) 4. Hoshiarpur 200 Wasteland/ degraded land 9438 9438 60 25 Pastures Orchards Village Woodlot Forest 54000 22400 Village Ponds/ Tanks 11600 665 21000 16000 9600 355 Community Buildings Weekly Markets Permanent markets Temples/ Places of worship Others (Pl. specify) 5. Kapurthala Wasteland/ degraded land 1650 Pastures Orchards 100 Village Woodlot Forest 200 Village Ponds/ Tanks 400 Community Buildings Weekly Markets Permanent markets Temples/ Places of worship Others (Pl. specify) 32 IWMP-SPSP-PUNJAB 6. Jallandhar Wasteland/ degraded land 3100 Pastures Orchards 100 Village Woodlot Forest 700 Village Ponds/ Tanks 600 Community Buildings Weekly Markets Permanent markets Temples/ Places of worship Others (Pl. specify) 7. Nawanshahar Wasteland/ degraded land 8000 15000 5000 Pastures Orchards 900 100 Village Woodlot Forest 12000 Village Ponds/ Tanks 405 Community Buildings Weekly Markets Permanent markets Temples/ Places of worship Others (Pl. specify) 8. Ropar Wasteland/ degraded land 2000 4000 4000 2000 4000 4000 Pastures Orchards Village Woodlot 33 IWMP-SPSP-PUNJAB Forest 7000 13000 6000 2000 1000 1000 5000 1000 2000 5000 1000 2000 5000 10000 3000 2000 3000 2000 5000 3000 4000 3000 8000 9000 Village Ponds/ Tanks Community Buildings Weekly Markets Permanent markets Temples/ Places of worship Others (Pl. specify) 9. S.A.S. Nagar Wasteland/ degraded land Pastures Orchards Village Woodlot Forest Village Ponds/ Tanks Community Buildings Weekly Markets Permanent markets Temples/ Places of worship Others (Pl. specify) 10. Patiala Wasteland/ degraded land Pastures Orchards Village Woodlot Forest Village Ponds/ Tanks Community Buildings Weekly Markets 34 IWMP-SPSP-PUNJAB Permanent markets Temples/ Places of worship Others (Pl. specify) 11. Fatehgarh Sahib Wasteland/ degraded land 10000 8000 3000 8000 4000 3000 Pastures Orchards Village Woodlot Forest Village Ponds/ Tanks Community Buildings Weekly Markets Permanent markets Temples/ Places of worship Others (Pl. specify) 12. Ludhiana 3164 Wasteland/ degraded land Pastures Orchards 1624 Village Woodlot 3215 Forest 10200 Village Ponds/ Tanks 2940 Community Buildings 791 2898 Weekly Markets 517 Permanent markets 132 Temples/ Places of worship Others (Pl. specify) 1146 1 35 IWMP-SPSP-PUNJAB 13. Sangrur Wasteland/ degraded land Pastures Orchards 2381 28 Village Woodlot 14. Barnala Forest 5000 Village Ponds/ Tanks 1300 Community Buildings 340 Weekly Markets 70 Permanent markets 1700 Temples/ Places of worship Others (Pl. specify) 460 41130 Wasteland/ degraded land 1640 Pastures 4500 Orchards Village Woodlot 950 Forest 1701 Village Ponds/ Tanks 2910 Community Buildings 15. Moga 454 441 1900 Weekly Markets 400 Permanent markets 109 Temples/ Places of worship Others (Pl. specify) 60 5236 Wasteland/ degraded land Pastures Orchards 55 Village Woodlot 36 IWMP-SPSP-PUNJAB Forest 2575 Village Ponds/ Tanks 563 Community Buildings Weekly Markets Permanent markets Temples/ Places of worship Others (Pl. specify) 16. Ferozepur 8200 Wasteland/ degraded land Pastures Orchards 2680 Village Woodlot Forest 233.22 Village Ponds/ Tanks Community Buildings 19279 Weekly Markets Permanent markets Temples/ Places of worship Others (Pl. specify) 17. Faridkot Wasteland/ degraded land Pastures Orchards 500 Village Woodlot Forest 200 Village Ponds/ Tanks 235 Community Buildings 260 Weekly Markets 37 IWMP-SPSP-PUNJAB Permanent markets 10 Temples/ Places of worship Others (Pl. specify) 18. Mukatsar 639 Wasteland/ degraded land Pastures Orchards 6162 Village Woodlot Forest 1722 Village Ponds/ Tanks 1022 Community Buildings 236 Weekly Markets Permanent markets 4 Temples/ Places of worship Others (Pl. specify) 19. Bathinda Wasteland/ degraded land 520 6052 6052 1630 1630 Pastures Orchards Village Woodlot Forest 6283 Village Ponds/ Tanks 6283 540 540 Community Buildings Weekly Markets Permanent markets Temples/ Places of worship Others (Pl. specify) 20. Mansa Wasteland/ degraded land 9 24 3032 3032 38 IWMP-SPSP-PUNJAB Pastures Orchards Village Woodlot Forest Village Ponds/ Tanks 869 869 3125 3125 368 368 Community Buildings Weekly Markets Permanent markets Temples/ Places of worship Others (Pl. specify) GRAND TOTAL Wasteland/ degraded land Pastures Orchards Village Woodlot Forest Village Ponds/ Tanks Community Buildings Weekly Markets Permanent markets Temples/ Places of worship Others (Pl. specify) 52727 41249 32000 10532 28002 29245 18100 0 0 4598 0 98 0 98 0 0 18185 223 0 0 2499 25 0 0 0 4165 0 0 0 0 0 0 81475 121812 20600 0 25000 34584 12600 0 1713 8092 3773 908 0 504 355 908 20511 27889 496 0 0 0 0 0 0 987 0 0 0 0 0 0 0 2157 0 9 0 0 0 0 24 1871 1159 200 0 0 0 0 0 46367 0 0 0 0 0 0 39 IWMP-SPSP-PUNJAB Chapter 5 5.0 Trends in agriculture and food productivity Brief description about agriculture and food productivity, major crops by cropping seasons, total food-grain production in the State, per capita availability of food-grains, comparison with national average, crops exported from the State and crops imported in the State, share of agriculture sector in State income/national income at current prices, total agriculture workforce in the State compared to national, changes in cropping patterns during the last five years, etc. Rice & Maize are the major Kharif crops and Wheat is major Rabi crop in Punjab. Other major crops include Pulses, Oilseeds, cotton, sugarcane, Vegetables & fruits. In the Year 2006-07, the yield of Rice was 3868 Kg/ha and that of Wheat was 4210 Kg/ha. The area under Rice was 26.21 Lakh Ha. and that under Wheat was 34.67 Lakh Ha. The Production of Rice has been 101.38 Lakh Metric tons while that of Wheat has been 145.96 Lakh Metric tons in the Year 2006-07. The Per capita availability of food-grains is 1015.39 Kg as compared to National average figure of 156.64 kg (taking into account Rice & Wheat only). The State contributes 31.2% of rice and 75.3% of Wheat to the Central Pool. Rice worth 754.58 Crores was exported from the State in 2006-07. The share of agriculture & allied (Primary) sector in State income at current prices has been 31.24% as compared to 18.81% of the National figures. The Percentage share of Agriculture in Total Workforce in Punjab was 38.95% as per 2000-01 Census as compared to around 60% of National figure. From 2000-01 to 2006-07, the area under Rice has increased from 26.12 Lakh Ha to 26.21 Lakh Ha. and the area under Wheat has increased from 34.08 Lakh Ha to 34.67 Lakh Ha. 40 IWMP-SPSP-PUNJAB Table-SPSP 12: Crops production and productivity as per Agricultural Statistics, 2008 (MIS Table-M(PO)C1, C2 & C3 pre-project status) 1. 2 3 Sl. No. Names of the Districts Name of crops Area (ha) Irri 1. 2. 3. Amritsar Gurdaspur Rice 123000 4 5 6 Kharif Rabi Zaid Average Yield (Qtl) Total Production (Qtl) per ha. Rf. Irri 33.98 Rf. Irri Rf. Area (ha) Irri 44.04 810000 Wheat 1700 00 37.59 639030 0 Paddy 170000 Maize 2000 171000 28.13 Jallandhar 43 38 Ropar 1.9 11.4 - 1.00 - 1.5 12.0 - 23.00 7822 5 18 140805 0 - - - - - - - - - - - - 55272 28 1547616 37.53 4348 - 4355000 1110 00 - 32.5 16 13 2400 30000 40 41.20 - 4643 - - 1620 00 46.2 748440 0 68 17 5000 0 45 2090000 480000 470000 WHEAT MAIZE 425 - 114000 Wheat 8. 17 - Rice 10 9 250 Rf. - RICE 49 Irri 7000 - 495540 Nawanshahar Rice Maize Sugarcan e Rf. -- 15 Wheat 7. Irri 3.32 8.19,00 0 - 1.85 134000 Rf. 2000 539 33036 Rice Irri Average Yield Total production per ha (qtl) (qtl) 41880 Wheat 5. Rf. Area (ha) 4782100 Maize Wheat Kapurthala Irri 1.84 Oil Seed 5. Rf. Wheat Taran Taran Paddy Wheat Hoshiarpur Irri Total production (qtl) 418000 Pulses 4. Rf. Average Yield per ha (qtl) 300000 0 600000 0 1200000 41 IWMP-SPSP-PUNJAB RICE 9. S.A.S. Nagar MAIZE RICE 10 Patiala 11. 12. 13. 14. 15. Fatehgarh Sahib Ludhiana Sangrur Barnala Moga 16. Ferozepur 17. Faridkot 33000 37 1220000 WHEAT --- ---- --- --- -- --- 17.0 84.0 --- --- ---- --- --- -- --- 35 Paddy 247000 46.33 11440 -- -- -- -- --- -- --- -- Wheat -- -- 2580 00 283 12460 -- -- -- -- -- 132727 00 535000 0 - - - - - - 262 99 158945 Cotton 4794 Wheat - Paddy Cotton wheat Barley Gram 235 151 - 70 47.72 42.30 7.12 - 18340000 4660000 6723373 - - - - - - - 41.43 689444 9 - - - - - 200 7.5 - 1500 - - - 389 5 13 40.79 1587.0 110.15 - - 95000 43.57 21000 6.87 85000 bales 3) Moong 700 10.15 7000 Cotton 2000 Desi Cotton 19. Bathinda - - 2)Cotton Mukatsar - 1664 12 1)Paddy 97000 105000 47.07 - 4140000 paddy 4234 kg per ha 758 kg per ha 648 kg per ha 46.90 112 948.0 14.36 48.28 33813 33.57 10.23 17.0 1.3 4) wheat 18. 180000 0 23.4 -- 80000 1030000 45 40 36 --- WHEAT RICE WHEAT RICE Paddy 2000 29000 4000 0 1180 00 47.32 558000 0 3030 52 40 221.00 4.02 lac meter ton 4.68 lac bales 8000 bales Wheat Cotton 227289 20 45.45 Paddy 75763 60 45.46 42 IWMP-SPSP-PUNJAB 20. Cotton Mansa 100318 61096 438 Bales 7.45 Peddy 252 MT 169 41.29 GRAND TOTAL Wheat Rice 2621000 38.68 101380000 223 Maize 154000 31.23 4810000 Wheat 3467 000 1900 0 Barley Rapeseed & Mustard Sunflowe r Sugarcan e Potato Cotton 43.4 42.10 145960 000 33.94 640000 4100 0 11.1 9 1530 0 9900 0 7560 0 6000 00 16.3 9 60.8 3 170. 30 6020000 7.63 45780 460000 251000 1352500 0 43 IWMP-SPSP-PUNJAB Table-SPSP 13: A. comparative average yield of major crops of the State and India during Triennia 1972-73 to 1974 -75 and 1992-93 to 1994-95 (in Kg/Ha.) 1 Major Crop/crop group Rice Maize Wheat Barley Rapeseed & Mustard Sunflower Sugarcane Potato Cotton 2 Period I: 1970-71 State India 1765 1555 2238 1022 4117 12752 399 3 Period II: 1990-91 State India 3229 1786 3715 2754 1003 1531 5941 19863 481 4 Period III: Post 2000-01 State India 3506 2102 2793 1938 4563 2619 3393 1938 1218 1154 6425 6691 19563 17058 437 362 5.1 Give a brief description of types, area covered, production/productivity, marketing facilities and income per ha. from cash crops grown in the State Apart from foodgrains, Punjab produces a number of Cash crops like Pulses, groundnut, Sunflower, Oilseeds, Sugarcane, Fruits & Vegetables covering area of 0.29 Lakh Ha, 0.04 Lakh Ha, 0.15 Lakh Ha, 0.70 Lakh Ha, 0.99 Lakh Ha, 0.57 Lakh Ha & 1.10 Lakh Ha respectively. The Production of these Cash crops in 2006-07 has been Pulses- 0.24 Lakh Metric tons, groundnut- 0.04 Lakh Metric tons, Sunflower- 0.25 Lakh Metric tons, Oilseeds- 0.78 Lakh Metric tons, Sugarcane- 6.02 Lakh Metric tons and Fruits- 8.31 Lakh Metric tons. Major Fruit crops include Kinnow, Guava, Mangoes, Ber & Pear. Major vegetables include Potato & Onion. There are 145 regulated markets attached with 294 sub-yards in the state for marketing. The Gross Income Per Hectare of Cash crops varies from Rs. 1.25 Lakhs to 2.00 Lakhs. 44 IWMP-SPSP-PUNJAB Chapter 6 6.0 Implementation of watershed programmes in the State at present a) Brief description about administrative structure for implementing watershed programmes in the State. At present, National Watershed Development programme for Rainfed Areas (NWDPRA) & Flood Prone RiverGhaggar-River valley project (FPR-RVP) schemes of the Ministry of Agriculture (MoA) and the Integrated Wasteland Development Programme (IWDP) of the Ministry of Rural Development (MoRD) are being implemented in 12 districts of the state. The present Administrative set-up in NWDPRA & FPR-RVP schemes involves the MoA at the GOI level, State level Steering Committee (SLSC) under the chairmanship of Financial Commissioner Development and the State Level Nodal Agency (SLNA) followed by the Department of Soil & Water Conservation as the Nodal Office at the State level and the district level officers of the department as Project Implementing Agencies (PIA). The present Administrative set-up in IWDP scheme involves the MoRD at the GOI level, State Level Nodal Agency (SLNA) followed by the Joint Development Commissioner at the State Level, District level Additional Deputy Commissioners as Nodal officers and the district level officers of the Department of Soil & Water Conservation as Project Implementing Agencies (PIA). The new Common Watershed Development guidelines of GOI shall be applicable to all new watershed development programmes in the state. b) Area covered under watershed programmes in the State Under NWDPRA & FPR-RVP, 97 Micro-watersheds have already been taken up covering an area of 1.30 lakh Ha. Under IWDP, 76 Micro-watersheds have been started covering an area of 0.66 Lakh Ha. These Projects have been formulated based on the local problems of soil & water in the project area. 3 more IWDP projects are being proposed covering 0.35 Lakh Ha. in 3 districts. 45 IWMP-SPSP-PUNJAB Table-SPSP 14: Status of District-wise area covered under the watershed programme (ha) * (MIS Table-M(SP)2) 1 2 S. No. Names of Districts 3 4 Total microwatersheds in the District 5 Micro-watersheds covered so far Dept. of Land Resources Other Ministries/ Depts. Pre-IWMP projects (DPAP +DDP Any other watershed project +IWDP) No. Area (ha.) No. 16 11 38 75810 38000 175353 3 1 2 Total watersheds covered Net watersheds to be covered Area (ha.) No. Area (ha.) No. Area (ha.) No. Area (ha.) 13678 3000 9285 12 2 15 60343 3463 23929 74021 6463 33214 0 1 8 21 0 1789 31537 142139 0 1. 2. 3. 4. 5. Amritsar Gurdaspur Taran Taran Hoshiarpur Kapurthala 15 3 17 0 6. Jallandhar 0 0 0 0 7. 8. Nawanshahar 9. 10. Ropar 12 29 50000 86510 2 1 8632 5252 3 19 12454 25000 5 20 21086 30252 7 9 28914 56258 S.A.S. Nagar 11 73259 1 4245 4 15000 5 19245 6 54014 3 13000 1 5000 1 5000 2 8000 0 0 0 0 12 Patiala Fatehgarh Sahib Ludhiana 0 0 0 0 13 Sangrur 1 1 3700 0 0 14 Barnala 0 0 0 0 15 Moga 0 0 0 0 16 Ferozepur 10 8200 1 1525 1 1525 9 6675 17 Faridkot 1 3040 1 3040 1 3040 0 0 18 Mukatsar 1 5787 1 5787 1 5787 0 0 19 Bathinda 0 0 0 0 20 Mansa GRAND TOTAL 1 3349 0 0 71 206682 63 329326 11 3700 1 3700 1 3349 1 3349 134 536008 16 66157 55 140189 46 IWMP-SPSP-PUNJAB Table-SPSP 15: Details regarding the watershed projects sanctioned by DoLR in the State: 1 2 3 S.No. Item Total 1 Area sanctioned in ha. (as per column 4 of DoLR area in ha. Table SSP 14) Names of the districts covered 2 3 4 5 6 7 8 9 10 11 No.of Blocks covered No.of watershed projects sanctioned by DoLR No. of projects completed out of those taken at Row (4) No.of projects foreclosed of Row (4) No.of on-going projects of Row (4) Area already treated by completed projects of Row (5) Area for treatment by on-going projects of Row (5) Total area treated and under treatment (8)+ (9) Area yet to be treated and proposed to be treated by DoLR (column 1-column 10) 4 Pre-IWMP scheme details DPAP DDP IWDP 66157 Hoshiarpur, Sangrur,Gurdaspur, Taran Taran, Ferozepur, Faridkot, Mansa, Amritsar, Muktsar 16 none nil 16 none 66157 52487 38000 47 IWMP-SPSP-PUNJAB Table-SPSP 16: Details of the watershed projects implemented in the State with the financial assistance other than DoLR 1 2 3 S.N o Item Total 1 2 3 4 5 6 7 8 9 10 11 Area sanctioned in ha. (as per column 4 of Table 14) Names of the districts covered No.of Blocks covered No.of watershed projects sanctioned other than DoLR No.of projects completed out of those taken at Row (4) No. of projects foreclosed of Row (4) No.of on-going projects of Row (4) Area already treated by completed projects of Row (5) Area for treatment by on-going projects of Row (5) Total area treated and under treatment (8)+ (9) Area yet to be treated and proposed to be treated by other than DoLR resources (column 1-column 10) 4 Watershed schemes of other Ministries Ministry of Agriculture GoI Ministry of E & F, GoI Planning Commission NABA RD State Govt. EA P #Others (Pl. Specify) 140189 Mohali, Ropar, Nawanshaher, Hoshiarpur, Gurdaspur 55 37 18 70019 26881 96900 397811 48 IWMP-SPSP-PUNJAB 6.1 Details of pending utilization certificates and unspent balance. Kindly refer Table- SPSP 17 below. Table- SPSP 17 1 S. No. 1. 2. 2 District Amritsar Gurdaspur 3. Taran Taran 4. Hoshiarpur : Details of pending UCs (MIS Table-M(FM)5) 3 Project Nil IWDP-I IWDPII IWDPIII IWDP 4 5 6 7 Instalment no. Financial year of release of fund Amount released (Rs. in lakh) Amount utilized (Rs.in lakhs) 7 th 3rd 2008-09 2008-09 16.34 82.11 16.34 52.92 3rd 2008-09 81.94 40.76 st 04-05 27.00 23.67 nd 1 TDET 2 07-08 80.32 80.32 Harike Wetlan d (Ministr y of F & E) Mahilp ur - 07-08 54.43 54.43 rd 2008-09 (Oct./08) 101.05 41.65 Hazipu r 2 nd 2008-09 (Oct./08) 54.14 14.25 3 8 9 Submission of UC Date of submission of UC Due date 31-306 31-308 31-308 Amount (Rs. In lakhs) 23.67 80.32 54.43 Date 21-206 31-309 311208s Amount (Rs. In lakhs) 23.67 10 11 Reasons for not submitting/ delayed submission of UC 80.32 Submitted in time --do-- 54.43 --do-- UC to be submitted along with the th case for 4 Installment UC to be submitted along with the case for 3rd Installment Pending UCs Period Amount (Rs. in lakhs) - - - - 200809& 2009-10 101.05 200809& 2009-10 54.14 49 IWMP-SPSP-PUNJAB 5. 6. 7. 8. 9. 10. 11 12 13 Kapurthala Jallandhar Nawanshah ar Ropar S.A.S. Nagar Patiala Fatehgarh Sahib Ludhiana Nil Nil Iwdp 3 2009-10 78.81 - Instalment sanctioned in August 2009 2nd 2006-07 99.90 71.52 Funds could not be utilized because of elections 1 05-06 11.62 - - 2 1st 08-09 2006-07 12.58 (GOI) 1.14 (state share) 24.54 27.36 4.76 15.70 - - Ist 2nd 2001-02 2005-06 total 52.08 49.14 101.22 41.20 44.38 85.58 Nil Nil Nil Nil Nil IWDP Le Sangrur Hragag a 14 15 16 Barnala Moga Nil IWDP Ferozepur 17 Faridkot 18 I.W.D. P. IWDP Mukatsar 19 20 Bathinda Mansa 7-82007 - 7.58 - - - 1 61.05 08-09 6.14 1 No. - 10.88 4.76 15.64 Nil Nil 50 IWMP-SPSP-PUNJAB Table-SPSP 18: Details of Unspent balance (MIS Table-M(FM)8) 1 S. No. 1. 2. 2 3 District Project Amritsar nil IWDP-I IWDP-II IWDP-III IWDP Mahilpur Hazipur nil nil Balachaur Saroya Budhkirao Iwdp Iwdp nil nil Lehragaga nil nil IWDP IWDP IWDP nil IWDP Gurdaspur 3. 4. Taran Taran 5. 6. 7. Kapurthala Jallandhar 8. 9. 10. 11 12 13 14 15 16 17 18 19 20 Ropar S.A.S. Nagar Patiala Fatehgarh Sahib Ludhiana Sangrur Barnala Moga Ferozepur Faridkot Mukatsar Bathinda Mansa Hoshiarpur Nawanshahar 4 5 6 7 8 Last released Installment no. Financial year of release of last fund Total Amount released (Rs. in lakh) Total Amount utilized (Rs.in lakhs) Unutilised funds (Rs. In lakhs) 4th rd 3 rd 3 st 1 rd 3 nd 2 2006-07 2007-08 2007-08 2004-05 2008-09 2008-09 188.52 217.50 217.50 27.00 277.36 85.53 172.71 189.66 176.32 23.67 208.92 47.56 15.81 27.84 41.18 3.33 68.44 37.97 2 2 4 1 1 2006-07 2007-08 2007-08 2006-07 2005-06 141.49 97.78 182.75 38.20 45.00 141.49 97.78 139.60 29.54 45.00 0.00 0.00 43.15 8.66 0.00 2nd 2007-08 99.90 73.33 26.57 1 1 2 2008-09 2008-09 2006-07 38.26 25.08 101.22 15.76 18.72 76.03 22.50 6.36 25.19 1 2003-04 20.63 1803.72 20.63 1476.72 0.00 327.00 51 IWMP-SPSP-PUNJAB Chapter 7 7.0 Strategy for implementation of Integrated Watershed Management Programme (IWMP) Briefly describe the following: a) Prioritization of available area based on the criteria as per the Operational Guidelines of DoLR The area has been prioritized for treatment after following the DoLR Guidelines. Area & treatment has been suggested keeping in view the local problems of the project area. b) List of watershed projects, along with area coverage, selected for treatment for the next 18 years; listing of these watershed projects and area coverage year-wise for next 18 years Details given in Table-SPSP 19 below. 52 IWMP-SPSP-PUNJAB Table-SPSP 19: Plan-wise phasing of physical (area in ha) & financial (Rs. in Crore) targets of IWMP for next 18 years*: District S.No Remaining period of XI Plan (2009-10 to 2011-12) Phy. Fin. XII Plan (2012-13 to 2016-17) Phy. Fin. 1 Gurdaspur 1789 2.15 2 Hoshiarpur 19501 23.40 16500 19.80 3 Ropar 14120 16.94 9000 12.08 4 Amritsar 3000 3.60 5 XIII Plan (2017-18 to 2021-22) Phy. 19600 Fin. 23.40 XIV Plan (2022-23 to 2026-27) Phy. 20500 Fin. 24.60 2000 2.40 Patiala 3000 3.60 2000 2.40 6 Sangrur 4000 4.80 2000 2.40 7 Jalandhar GRAND TOTAL 35410 42.49 2000 2.40 2000 2.40 2000 2.40 30500 37.88 30600 36.6 26500 31.8 Total for 18 years Phy. Fin. 1789 2.15 76101 91.2 23120 29.02 5000 6.00 5000 6.00 6000 7.20 6000 7.20 123010 148.77 53 IWMP-SPSP-PUNJAB Table-SPSP 20: Year-wise phasing of physical (area in ’000 ha) & financial (Rs. in lakh) targets of IWMP for remaining period of XI Plan *: 1 S. No 2 2009-10 Phy. District No. of projects H&D O Ropar 0 2 Gurdasp ur 1 447 3 Hoshiar pur 6 4875 7 8 8 No. of projects O 500 0 1 Grand Total Fin. Area H&D 5322 H&D- Hilly & Difficult area; 3 Remaining period of XI Plan 2010-11 2011-12 Fin. Phy. Phy. H&D 6 5.85 500 0 11.8 5 0 O H&D O 50 00 8 1 895 6 9751 7 1064 6 8 No. of projects Area H&D 6 11.7 50 00 17.7 O H&D 447 6 4875 5322 Fin. Phy. No. of projects O 41 20 1 8 Fin. Area 8 7 Total H&D 41 20 O H&D 8 14120 1694 1 1789 214. 93 6 19501 2340 35410 4248 .93 4.94 5.85 10.79 Area 7 8 O 0 O- Others 54 IWMP-SPSP-PUNJAB 1 Table-SPSP 21: Details of district wise and category-wise area proposed to be taken up under IWMP during next 3 years i.e upto 11th Five Year Plan. (Area in 000 Ha.) 7 2 3 4 5 6 S. No. District Year 1. Ropar 2. Gurdasp ur 2009-10 2010-11 2011-12 Sub-total 2009-10 2010-11 2011-12 Sub-total 2009-10 2010-11 2011-12 Sub-total 2009-10 Total area available for treatment 5000 5000 4120 14120 447 895 447 1789 4875 9751 4875 19501 10322 2010-11 15646 2011-12 Sub-total 3. Hoshiar pur GRAND TOTAL Total area proposed to take up under IWMP in the next 3 years 5000 5000 4120 14120 447 895 447 1789 4875 9751 4875 19501 10322 Terrain of the proposed area Hilly Desert Others (Pl. specify) 5000 5000 4120 14120 447 895 447 1789 Land use type of proposed area cultivated rainfed area Uncultivated Wasteland 2100 2100 1935 6135 600 600 578 1778 634 945 1891 945 3781 1545 4875 9751 4875 19501 9875 0 447 880 1731 3462 1731 6924 3831 15646 14751 0 895 5562 2491 9442 9442 8995 0 447 3666 1523 35410 35410 33621 0 1789 13939 6193 55 IWMP-SPSP-PUNJAB Table-SPSP 21 (Conti.) : Details of district wise and category-wise area proposed to be taken up under IWMP during next 3 years i.e upto 11th Five Year Plan. 7 8 Ownership pattern of the proposed area No. of beneficiaries covered Community Forest 2541 6050 5529 1551 227 11 Private 4524 6983 7994 Others (pl. specify) 0 0 Total area DPAP MF SF LF Landless 14120 12 5 10 8 15 1700 1948 1789 20 8 11 4 25 783 1130 21 15 55 00 22 0 19501 9 Identified DPAP/ DDP Blocks covered Total No. of blocks 0 DDP 0 No. of blocks 0 0 0 0 0 Area Area ………… ………Nil ………… ………. 3624 11459 0 56 IWMP-SPSP-PUNJAB C) Briefly describe the convergence of IWMP with other Schemes in the State No targets have been fixed for convergence. However, need-based convergence with NREGS may be carried out during the course of the project implementation. Table-SPSP 22: Details of Convergence of IWMP with other Schemes* (MIS Table-M(P)3) 1 2 S. No. Name of the District nil 3 Names of Departments with Schemes converging with IWMP 4 Funds to be made available to IWMP due to convergence (Rs.) Nil nil 5 6 7 Was this fund included in Level at Name of Rs.12,000/15,000 which activity/task/structure per ha. decision for to be undertaken convergence with converged funds was taken$ Yes No nil nil nil nil d) Public – Private Partnership Briefly describe scope for Public – Private Partnership in watershed projects No for Public – Private Partnership is carried out in the watershed projects. However, the treatment on private lands of project area inhabitants is done on sharing basis depending upon the type of activity wherein nominal share is taken from beneficiary. 57 IWMP-SPSP-PUNJAB Table-SPSP 23: Summary of Public-Private Partnership in the IWMP projects* (MIS Table-M(P)4) 1 2 3 S. District No. nil Name of Private Sector Partner Agency nil 4 Type of agreement signed (MoU/contract others pl.specify) nil 5 6 7 Financial contribution Partnership Interventions Expected Outcomes nil nil nil 7.1 Planning Process - Details of Scientific criteria/Inputs used in Planning (MIS Table-M(P)6) Briefly describe about various scientific inputs used in planning watershed projects in the State. Whether the desired criteria followed? Scientific criteria/ inputs used (A) Planning Cluster approach Whether technical back-stopping for the project has been arranged? If yes, mention the name of the Institute. Baseline survey Hydro-geological survey Contour mapping Participatory Net Planning (PNP) Remote sensing data-especially soil/ crop/ run-off cover Ridge to Valley treatment Online IT connectivity between (1) Project and DRDA cell/ZP Yes. No. Yes. Yes. Yes. Yes. Yes. Yes. Yes. 58 IWMP-SPSP-PUNJAB (2) DRDA and SLNA (3) SLNA and DoLR Availability of GIS layers 1. Cadastral map 2. Village boundaries 3. Drainage 4. Soil (Soil nutrient status) 5. Land use 6. Ground water status 7. Watershed boundaries 8. Activity Crop simulation models# Integrated coupled analyzer/ near infrared visible spectroscopy/ medium spectroscopy for high speed soil nutrient analysis Normalized difference vegetation index (NDVI)# Weather Stations (B) Inputs 1. Bio-pesticides 2. Organic manures 3. Vermicompost 4. Bio-fertilizer 5. Water saving devices 6. Mechanized tools/ implements 7. Bio-fencing 8. Nutrient budgeting 9. Automatic water level recorders & sediment samplers Any other (please specify) Yes. Yes. Yes. Yes. Yes. Yes. Yes. Yes. Yes. Yes. No. No. No. Yes. No. Yes. Yes. Yes. Yes. Yes. No. No. No. NA 59 IWMP-SPSP-PUNJAB Chapter 8 8.0 Livelihood concerns: (a) Brief description about the livelihoods in the State-traditional livelihoods-reasons for development of traditional livelihoods-other raw materials and potential available in the State – livelihoods that can be developed on the basis of these raw materials and potential-reasons for not developing these livelihoods so far-factors necessary for developing these livelihoods-potential in rural areas and potential in urban areas-backward-forward linkages available and yet to be created-facilities for capacity building available and yet to be created-workforce available in the State by age groupper capita income in the State and comparison with national average – likely per capita income to be generated through enhancement of livelihoods etc. Given in Table- SPSP 24:(A) below. 60 IWMP-SPSP-PUNJAB Table- SPSP 24:(A) Details of livelihoods created for landless people*(MIS Table-M(PO)D2:(i)) 1 S. No. 1 2 District Ropar 3 Name of activity Gurdas 5 6 7 8 No. of beneficiaries Pre-project Expected change in Funds required Sources of funding (Rs.) income income from project for the activity Project Benefi- (Rs.) intervention (Rs.) Nil 100% 10680000 Nil 100% 7565000 SC ST Post Harvesting 35 Techniques 0 Small enterprises 2 4 55 0 Oth Wom Tot ers en 0 0 850 0 0 300 12 00 85 0 Fund ciary 968000 100000 0 institution NGO Others 0 0 0 0 0 0 900000 0 0 0 700000 0 0 0 0 656500 100000 0 0 Washing Powder 12 20 32 Nil 100% 120000 10000 10000 Sauces & Pickles 20 20 Nil 100% 225000 15000 10000 20 20 Nil 100% 150000 40000 10000 Nil 100% 9327000 Nil 100% 6313000 pur Cutting & Tailoring 3 al Financial Hoshiar pur Post Harvesting 67 Techniques 5 Small enterprises like Bee Keeping and Vermi culture 10 90 0 0 1350 0 0 459 20 75 15 49 842700 0 561300 0 61 IWMP-SPSP-PUNJAB Table-SPSP 25: (B) Details of other livelihoods created for farmers*(MIS Table- M(PO)D2:(ii)) 1 2 3 4 5 6 7 Funds No. of beneficiaries Name Pre-project Expected change in required for of income income from project the activity activity SF MF LF Other Total (Rs.) intervention (Rs.) Bee Keepin 10 15 25 17000/ Ha 25000/ Ha 30000 g Gurdas 1 Mushro pur om 15 15 17500/ Ha 30000/ Ha 25000 Cultivat ion Mushro om 40 20 12500/hact 25 625 20000 / hact 4125000 Cultivat 0 0 are ion Bee 20 10 Hoshiar Keepin 25 325 -- do --- do -1863000 2 0 0 pur g Vermin 20 10 50 350 -- do --- do -2214000 Culture 0 0 Dairy / 15 75 25 250 -- do --- do -3760000 Poltary 0 S. District No. 8 Sources of funding (Rs.) Projec Benefi- Financial NGO Others t Fund ciary institution 20000 10000 15000 10000 32750 850000 00 14630 400000 00 16140 600000 00 30100 750000 00 62 IWMP-SPSP-PUNJAB Chapter 9 9.0 Institutional arrangements Briefly describe the Institutional arrangements for implementation of IWMP in the State at various levels At present, National Watershed Development programme for Rainfed Areas (NWDPRA) & Flood Prone RiverGhaggar-River valley project (FPR-RVP) schemes of the Ministry of Agriculture (MoA) and the Integrated Wasteland Development Programme (IWDP) of the Ministry of Rural Development (MoRD) are being implemented in 12 districts of the state. The present Administrative set-up in NWDPRA & FPR-RVP schemes involves the MoA at the GOI level, State level Steering Committee (SLSC) under the chairmanship of Financial Commissioner Development and the State Level Nodal Agency (SLNA) followed by the Department of Soil & Water Conservation as the Nodal Office at the State level and the district level officers of the department as Project Implementing Agencies (PIA). The present Administrative set-up in IWDP scheme involves the MoRD at the GOI level, State Level Nodal Agency (SLNA) followed by the Joint Development Commissioner at the State Level, District level Additional Deputy Commissioners as Nodal officers and the district level officers of the Department of Soil & Water Conservation as Project Implementing Agencies (PIA). The new Common Watershed Development guidelines of GOI shall be applicable to all new watershed development programmes in the state. 9.1 SLNA Briefly describe organizational structure of SLNA (total no. of persons working, no. of permanent employees, no. of persons on contract basis, no. of persons paid from DoLR grants under IWMP, other sources of funds) A dedicated State Level Nodal Agency (SLNA) (Department ) is constituted by the State Government vide notification no.7647 dt. 27-10-2008 as per common guidelines of Watershed Development Programme as per the following: 63 IWMP-SPSP-PUNJAB Financial Commissioner, Rural Dev. & Panchayats Chairman Financial Commissioner Development or Representative Member Rep. of GOI Water Resources Deptt., Rural Dev. Ministry Member Dr. A.K. Sikka, Technical Expert (WD), NRAA Member Rep. of GOI Ministry of Agriculture Member Rep. of NABARD Member Director, Rural Development & Panchayats, Punjab Member Joint Development Commissioner (IRDP), Punjab Member Principal Chief Conservator of Forests, Punjab Member Chief Conservator of Soils, Punjab Member Director, Animal Husbandry Deptt., Punjab Member Director, Water Resources, Punjab Member Head, Deptt. of Soil & Water Engg., PAU, Ludhiana Member Rep. of NGO SPACE Member Chief Executive Officer/ SLNA Member Secretary The main functions of the SLNA will be to: 64 IWMP-SPSP-PUNJAB a. Prepare a perspective and strategic plan of watershed development for the state on the basis of plans prepared at the block and district level and indicate implementation strategy and expected outputs/outcomes, financial outlays and approach the Nodal Agency at the central level in the Department for appraisal and clearance. b. Establish and maintain a state level data cell from the funds sanctioned to the States, and connect it online with the National Level Data Centre. c. Provide technical support to District Watershed Development Units (DWDU) throughout the state. d. Approve a list of independent institutions for capacity building of various stakeholders within the state and work out the overall capacity building strategy in consultation with NRAA/Nodal Ministry. e. Approve Project Implementing Agencies identified/selected by DWDU/ District Level Committee by adopting appropriate objective selection criteria and transparent systems. f. Establish monitoring, evaluation and learning systems at various levels (Internal and external/ independent systems). g. Ensure regular and quality on-line monitoring of watershed projects in the state in association with Nodal Agency at the central level and securing feedback by developing partnerships with independent and capable agencies. h. Constitute a panel of Independent Institutional Evaluators for all watershed projects within the state, get this panel duly approved by the concerned Nodal Agencies at the central level and ensure that quality evaluations take place on a regular basis. i. Prepare State Specific Process Guidelines, Technology Manuals etc in coordination with the Nodal Ministry/ NRAA and operationalise the same. The Funding support for the State Level Nodal Agency and the state level data cell will come primarily from the budget of the Department of Land Resources, Ministry of Rural Development after suitable review of the existing staff and infrastructure already available and actual requirement. It may also receive support from other Institutes and Agencies both national and international, corporate entities, and such other organisations which seek to support programmes on watershed mode. Each State Level Nodal Agency and state level data cell will be provided with an initial capital grant to 65 IWMP-SPSP-PUNJAB meet establishment costs and a recurring grant per annum to meet its annual expenses. The actual amount would depend upon the level of staff and infrastructure already available and the actual requirement. Till such time, SLNA is set up, the existing arrangement regarding sanctioning of project and flow of fund will be continued. However, all out efforts should be made by the States to set up SLNAs within a period of 6 months. Table-SPSP 26: Details of SLNA (MIS Table-M(IS)1) 1 2 3 4 S. No. Date of Notification Type of SLNA# Date of MoU with DoLR 1. 27/10/2008 5 Total no. of members of SLNA 15 Table-SPSP 27: Details of SLNA (MIS Table-M(IS)1) (Contd..) 6 Chairperson 7 CEO Name Designation# Name Designation Date of Appointment Sh. J. S. Sandhu Financial Commission Rural Development & Panchyats Dr. S. Krana Raju Joint Development Commissioner 27-10-08 Nature of appointment Deputation $ Tenure (No. of years) Contact Ph. No./ Fax/ E-mail NA 0172-2700920 66 IWMP-SPSP-PUNJAB Table-SPSP 28: Details of functionaries in the SLNAs* (MIS Table-M(IS)2) 1 2 3 4 Monthly Details of the persons engaged in the SLNA funded by DoLR Total no. emoluments S. of persons of all the Contact Subject Nature Date of Tenure N working in persons Ph. No./ Names & Monthly of of Qualifi Rol Experience o. the SLNA working in Designation remuneration Appoint appoint- (No. of Expertis -cation e Fax/ ment years) $ for IWMP the SLNA ment e E-mail for IWMP N/A N/A N/A N/A N/A N/A N/A N/A N/A N/A N/A N/A Table-SPSP 29 : Details of State Level Data Cell (SLDC) functionaries*# (MIS Table-M(IS)3) 1 S. No. 1 2 3 Monthly Total no. emoluments of persons of all the working in persons Names & the SLDC working in Designation for IWMP the SLDC for IWMP 4 Details of the persons engaged in the SLDC to be funded by DoLR Monthly re muneration Date of Appoint ment Nature of appointment $ Tenur e (No. of years ) 9 Years 2001 Govt. Officer regul ar 7 Years 2002 -do- -do- 2 Er. Gulpreet Soil Singh Conservatio Aulakh n Officer Er. Baljinder doSingh Contact Ph. No./ Fax/ Email Qualification 01722777094; B.Tech( 2725330, Agri. dswcpunj Engg) ab@gmai -dol.com Experience Role 9 Monit oring 8 Plan ning 67 IWMP-SPSP-PUNJAB Briefly describe State level Monitoring/Evaluation Cell Financial Commission Rural Development & Panchyats, Joint Development Commissioner, Punjab and Chief Conservator of Soils, Punjab alongwith their offices shall be responsible for state Level Monitoring/Evaluation 9.2. A) District Level Watershed Units Briefly describe organizational structure of DRDA/ZP cell for watershed programme (total no.of persons working, no.of permanent employees, no. of persons on contract basis, no.of persons paid from DoLR grants under IWMP, other sources of funds) Please find the details in Table-SPSP 30 below. Table-SPSP 30: Details of functionaries in the DWDU/ DRDA Watershed Cell*(MIS Table-M(IS)4) 1 2 Name S. of the No. District 1 Ropar 7 6 Total no. Monthly Name of Date of of emolument the Status of signing of persons s of all executin Chairma MoU with working persons g n@ SLNA for working for Agency# IWMP IWMP DRDA CEO ZP 1 Govt. Employee 3 4 5 8 Details of the two personnel engaged in the Watershed Cell funded by DoLR Name Contact Monthly Date of Nature of Tenure and Ph. No./ Qualifi- Experi Remun Appoint- appoint- (No. of Role Desig Fax/ e- cation ence eration ment ment$ years) nation mail Harin Govt. der Employ Singh ee APO Gradu 20 Moni ate years torin g 68 IWMP-SPSP-PUNJAB 2 3 Gurdas Divisiona pur l Soil Conserv CEO, ation Zilaparis Officer, had Gurdasp ur Hoshia DRDA rpur CEO ZP 2 2 Govt.Empl Sh. Govt.E Monitori oyee Anga mploye ng d e Shar ma NA Gradu 30 ate Moni torin g Govt. Sh. Employee Nirma l Singh Govt. B.K. Employee Shar ma, APO (M) Balvir Singh , Invest igator NA Gradu 20 ate M Govt. Monitori N Employ ng ee Govt. 27-10Employ 2008 ee Gradu 10 Moni ate years torin g Govt. 27-10Employ 2008 ee - do- 8 Moni years torin g Similar structure, as above, is followed in all districts. 69 IWMP-SPSP-PUNJAB B) Eligible districts (more than 25,000 ha area under watershed projects in the district) for strengthening DRDA cell may be given. Hoshiarpur, Gurdaspur and Ropar 9.3 PIA The PIA for the state of Punjab has been identified as Department of Soil and Water Conservation Punjab 9.4 WDT Watershed development team comprises of Team Leader as the Soil Conservation Officer( Soil And Water Conservation Department) and the team members are Horticulture Development Officer(Horticulture Department), Agriculture Development Officer(department of Agriculture Punjab), Veterinary officer, representative of KVK 9.5 Institutional arrangements at village level and people’s participation The Watershed Committee shall constitute SHGs in the watershed area with the help of WDT from amongst poor, small and marginal farmer households, landless/asset less poor agricultural labourers, women, shepherds and SC/STpersons. These Groups shall be homogenous groups having common identity and interest who are dependent on the watershed area for their livelihood. Each Self Help Group will be provided with a revolving fund of an amount to be decided by the Nodal Ministry. 70 IWMP-SPSP-PUNJAB 10 User Groups The Watershed Committee (WC) shall also constitute User Groups in thewatershed area with the help of WDT. These shall be homogenous groups of persons most affected by each work/ activity and shall include those having land holdings within the watershed areas. Each User Group shall consist of those who are likely to derive direct benefits from a particular watershed work or activity. The Watershed Committee (WC) with the help of the WDT shall facilitate resource-use agreements among the User Groups based on the principles of equity and sustainability. These agreements must be worked out before the concerned work is undertaken. It must be regarded as a pre-condition for that activity. The User Groups will be responsible for the operation and maintenance of all the assets created under the project in close collaboration with the Gram Panchayat and the Gram Sabha. 71 IWMP-SPSP-PUNJAB Chapter 10 10.0 Capacity building a) Stake holders and capacity building requirements S.No 1 Project Stakeholder Target community 2 3 GPs Watershed Committees 4 SHGs 5 6 UGs WDTs 7 8 9 PIAs DRDA/ZP cell SLNA Critical capacity gaps Critical capacity gaps Awareness among the members regarding the project, participation and management Awareness among the members regarding the project, participation and management Importance of SHG, working and sustainability Participation, management and maintenance of the assets created. Project awareness Project awareness Project awareness Project awareness b) Strategies for capacity building Briefly describe about strategies for capacity building Kindly refer Table-SPSP 31 below. 72 IWMP-SPSP-PUNJAB Table-SPSP 31: List of Training Institutes@ identified for Capacity Building at State level (MIS Table-M(CB)1) State Level 1 2 3 S. No. Name of the Training Institute Full Address with contact no., website & e-mail 1. 2. 3. 4. 4 Name & Designatio n of the Head of Institute Dr. V.K. Reddy, Directot(HR D) MANAGE, Rajinder HYDERABA Nagar , D Hyderabad ,vkreddy @manage.g ov.in NIRD, Rajinder Hyderabad Nagar, Hyderabad Contact-04024016500 Punjab Firozepur Dr. M.S. Agriculture Road, Kang, Vice University Ludhiana Chancellor CSWCRTI, Dehradhun 218, Kaulagarh Road, Dehradhun, 01352758564 Dr. V.N.Sarda, Director 5 6 7 Type of Institute# Area(s) of specialization$ Accreditation details Capacity Building Central ---Do---Govt. Dept. University Agriculture/ Horticulture/F orestry/Livelih ood Central Participatory Govt. Dept. Watershed Development 73 IWMP-SPSP-PUNJAB District Level 1 S. No. 1. 2. 3. 4. 2 3 Full Address Name of the with contact Training no., Institute website & e-mail MANAGE, Rajinder HYDERABA Nagar , D Hyderabad ,vkreddy @manage. gov.in NIRD, Rajinder Hyderabad Nagar, Hyderabad Contact04024016500 Punjab Firozepur Agriculture Road, University Ludhiana CSWCRTI, Dehradhun 4 5 6 7 Name & Designation of the Head of Institute Type of Institute# Area(s) of specialization$ Accreditation details Dr. V.K. Reddy, Director (HRD) Capacity Building Central Givt. Dept. Dr. M.S. Kang, Vice Chancellor 218, Dr. Kaulagarh V.N.Sarda, Road, Director Dehradhun, 01352758564 ---Do---- University Agriculture/ Horticulture/F orestry/Livelih ood Central Participatory Govt. Dept. Watershed Development 74 IWMP-SPSP-PUNJAB Project Level 1 2 3 S. No. Name of the Training Institute Full Address with contact no., website & e-mail 1. 2. 3 4. 4 Name & Designatio n of the Head of Institute 5 6 7 Type of Institute# Area(s) of specialization$ Accredi tation details Regional Station, Dr. Y.S. Parmar University of Horticulture, Jachh Krishi Vigyan Kendra, Gurdaspur Kangra Road , Jachh( Jasur), H.P. University 01874-221743 Dr. P.K.Ghuma n Soil & Water Conservation Training Institute, Mohali VIMARSH Near Dara Studio, Phase-VI, Mohali, 9872001605 Er. S.K.Goel Govt Departmen t 445, Udyog Vihar, Phase-III, Gurgaon, 0124-4264909/08 Sh. Manmohan Khosla NGO Horticulture/F orestry Skill Enhancement Trainings to SHG/UG/Far mers Soil & Water Conservation Capacity Building c) Information, Education & Communication (IEC) Activities: Describe the IEC activities to be undertaken under IWMP: 75 IWMP-SPSP-PUNJAB Table: SPSP 32: Details of IEC activities* (MIS Table-M(CB)3) 1 S. No. 2 District nil 3 4 Activity Executing agency nil 5 Estimated expenditure for XI Plan period (Rs. in lakh) nil 6 Expected Outcome (may quantify, wherever possible) nil * From Column no. 2, total no. of Districts implementing the programme, from column no.3 no. of activities, from Column no. 4, total no. of agencies, from column no. 5 total estimated expenditure may be given at the end of the table for the entire State. 76 IWMP-SPSP-PUNJAB Chapter 11 11.0 Monitoring and Evaluation (M & E) Briefly describe plan to comply following: Table-SPSP 33: List of Institutes@ identified for M & E at State level 1 2 3 S. No. Name of the Training Institute Full Address with contact no., website & e-mail 1 CSWCRTI, Dehradhun 218, Kaulagarh Road, Dehradhun, 0135-2758564 2 Punjab Agriculture University VIMARSH Firozepur Road, Ludhiana Soil Conservatio n Society of India GG-3, National Societies Block,National Agricultural Science Centre Complex,Dev Prakash Shastri Marg,Pusa Campus, New Delhi-110012. 3 4. 5. 445, Udyog Vihar, Phase-III, Gurgaon, 0124-4264909/08 Agricultural B-1/9, Community Centre, finance Janakpuri, New delhi-110058. Corporation, 4 Name & Designation of the Head of Institute Dr. V.N.Sarda, Director Dr. M.S. Kang, Vice Chancellor Sh. Manmohan Khosla Sh. S.K. Dalal, 5 6 7 Type of Institute# Area(s) of specialization$ Accredi tation details Central Participatory Govt. Dept. Watershed Development University Agriculture/ Horticulture/Forestry /Livelihood NGO Capacity Building Society Capacity Building, Evaluation Corporatio n owned byBanks, NABARD Capacity Building, Evaluation Coordinator M. Manjunatha, Dy. Gen. Manager & Incharge 77 IWMP-SPSP-PUNJAB Chapter 12 12 Expected outcomes a) Briefly describe expected outcomes due to implementation of IWMP in the State, Summarized in the table given below. Table-SPSP 34: Expected/Estimated Outcomes (MIS Table-M(PO)F1) 1 2 3 4 5 S. No. Name of the District Item Unit of measurement Pre-project Status Ropar Status of water table Ground water structures repaired/ rejuvenated Quality of drinking water Availability of drinking water Increase in irrigation potential Change in cropping/ land use pattern Area under agricultural crop i Area under single crop ii Area under double crop iii Area under multiple crop Net increase in crop production area Increase in area under vegetation Increase in area under horticulture Increase in area under fuel & fodder Increase in milk production No. of SHGs Increase in no. of livelihoods Increase in income Mtr. No. Months Ha Ha Ha Ha Ha Ha Ha Ha Kg/cattle/day No. No. Rs. Per capita 6 Expected Postproject Status 160-180 155-175 Good 12 62 Good 12 75 7000 60000 6000 2000 55000 11000 4000 5000 1000 1000 2 7 Remarks 2000 78 IWMP-SPSP-PUNJAB Migration SHG Federations formed Credit linkage with banks Resource use agreements WDF collection & management Summary of lessons learnt Gurdaspur No. / village No. No. No. per - - Shall be furnished at the end of the project. Status of water table Ground water structures repaired/ rejuvenated Quality of drinking water Availability of drinking water Feet 140 135 Months Good 12 Good 12 Increase in irrigation potential Change in cropping/ land use pattern Area under agricultural crop i Area under single crop Ha 1111 1225 Ha 100 - Ha Ha Ha Ha Ha Ha Litres/Day Nos 250 761 200 1050 139 15 35 05 500 25 05 Rs.700/Per Capita 50% reduction 1 12 ii Area under double crop iii Area under multiple crop Net increase in crop production area Increase in area under vegetation Increase in area under horticulture Increase in area under fuel & fodder Increase in milk production No. of SHGs Increase in no. of livelihoods Increase in income Rs/ Capita 5 Per Migration SHG Federations formed Credit linkage with banks Nos Nos Nil 79 IWMP-SPSP-PUNJAB Hoshiarpur Resource use agreements WDF collection & management Summary of lessons learnt Status of water table Ground water structures repaired/ rejuvenated Quality of drinking water Availability of drinking water Increase in irrigation potential Change in cropping/ land use pattern Area under agricultural crop i Area under single crop ii Area under double crop iii Area under multiple crop Net increase in crop production area Increase in area under vegetation Increase in area under horticulture Increase in area under fuel & fodder Increase in milk production No. of SHGs Increase in no. of livelihoods Increase in income Migration SHG Federations formed Credit linkage with banks Resource use agreements WDF collection & management Summary of lessons learnt Nos 5 Lacs Shall be furnished at the end of the project Mtr. 125 110 No. Months Ha Ha Ha Ha Ha Ha Ha Ha Kg/cattle/day No. No. Rs. Per capita No. / per village No. No. No. Good 8 Good 12 200000 99667 25000 200000 88000 8560 0 2-4 0 135000 40000 230000 95000 10000 10000 6-8 20-25 Nil 0 0 0 2 80% SHG As per guidelines 0 As per guidelines Shall be furnished at the end of the project. ************ 80 IWMP-SPSP-PUNJAB


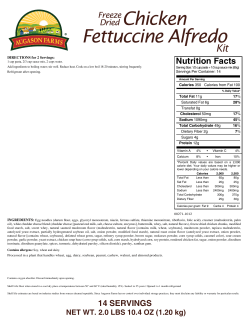


© Copyright 2026