
Linear Patterns 1 –2 –1
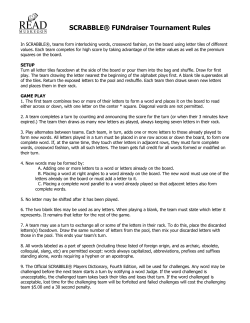
1
–2 –1
–1
Linear Patterns
1
–6
4
5
6
7
8
9
A.1
Foundations for functions. The student understands that a
function represents a dependence of one quantity on
another and can be described in a variety of ways.
(B) The student is expected to gather and record data and
use data sets to determine functional relationships
between quantities
A.3
Foundations for functions. The student understands how
algebra can be used to express generalizations and
recognizes and uses the power of symbols to represent
situations.
–3
–5
3
TEKS
–2
–4
2
(A) The student is expected to use symbols to represent
unknowns and variables.
(B) The student is expected to look for patterns and
represent generalizations algebraically.
–7
–8
–9
TAKS™
Objective 1 The student understands that a function represents a
dependence of one quantity on another and can be
described in a variety of ways.
Objective 2 The student uses the properties and attributes of functions.
©2008 Austin ISD Secondary Mathematics Dept.
Algebra 1
1
Vocabulary Focus
Constant
Expression
Linear function
Model
Pattern
Regression
Rule
Term
Variable
Key Questions
By the end of this lesson, students should be
able to answer these key questions:
•
How can patterns be used to develop an
understanding of linear functions?
•
What are the connections between a pattern
model, a table, a graph, a verbal description,
and a rule for the function represented in a
pattern?
•
What informal solution methods are useful
when analyzing patterns?
•
What informal solution methods developed
to describe and analyze linear patterns can
be connected to solving equations?
Students are not expected to
write and define vocabulary
words. Instead, these terms
should be clarified as necessary
in the Explain phase of the
lesson. Then, they may be
displayed on a word wall or
recorded in a student
interactive notebook.
Materials
Prepare in advance:
Overhead transparent counters (3 red and 12 blue)
Half sheets of grid chart paper for each group
Overhead calculator or SmartView or TI presenter
Group Activity: Tile Pattern Team Challenge
Copy of Team Roles
Color tiles or cardstock squares to model patterns
For each student:
Graphing Calculators
Activity: Comparing Patterns
Activity: Linear Increasing and Decreasing Patterns
Evaluate: Linear Patterns
©2008 Austin ISD Secondary Mathematics Dept.
Algebra 1
2
ENGAGE
The Engage portion of the lesson is designed to create student interest
in the concept of studying patterns to develop generalizations that
describe linear functions.
1. Display the pattern to the right on the overhead, board or
chart paper. Ask students to study the pattern quietly for
two minutes and write down what they see in this pattern.
Encourage students to describe the pattern in words (e.g.
Figure 1 contains an arrangement of 1dark circle with two
light circles, one above and one to the right of the dark
circle).
Fig. 1
Fig. 2
Fig. 3
2. Explain how these types of patterns will be used to make
sense of functions. In the Explore phase of this lesson
students will compare and contrast different patterns to
determine how a rule can be used to describe any figure in
a pattern.
Facilitation Questions
•
How can you describe the arrangement of the circles?
Figure 1 contains an arrangement of 1dark circle with two light
circles, one above and one to the right of the dark circle.
•
How does your description of the number of circles
relate to the number of the figure?
The light circles are arranged above and to the right of the one
dark circle. The number of light circles is two times the figure
number plus one additional dark circle.
•
What is the difference in the total number of circles
from one figure to the next?
Figure 2 has 2 more circles than Figure 1 and Figure 3 has 2
more circles than Figure 2.
•
Do you think that this pattern represents a linear
relationship? Why or why not?
This pattern represents a linear relationship because the change
in the number of circles from one figure to the next is always 2
(or constant, or the same).
©2008 Austin ISD Secondary Mathematics Dept.
Algebra 1
3
EXPLORE
The Explore portion of the lesson provides students with an opportunity to be
actively engaged in finding similarities and differences between linear patterns
and patterns in perimeters of regular polygons. Students should identify the
general characteristics of linear patterns and use these characteristics to
make predictions and generalizations.
1. Distribute the Comparing Patterns activity page to
students.
2. Allow students to work in pairs or small groups to discuss
and compare the patterns. Each student in the group
should be able to describe the similarities and differences
between the sets of patterns.
3. Encourage students to describe the patterns in more than
one way. Students should be able to identify how the
pattern grows and connect it to the model. They should
notice that the numerical sequences for the linear patterns
grow by a constant amount.
4. Students may struggle to create a pattern that fits the
numerical sequence. Provide toothpicks, tiles, or counters
to help students build and draw their pattern. Encourage
groups to create slightly different models.
Facilitation Questions
•
Are there any patterns in Set A that have the same
numerical values for each of the figures?
There 3, 5, and 7 objects in both the toothpick pattern and the
circles pattern.
•
How is the tiles pattern in Set A different from the
other two patterns?
The tile pattern has 5, 9, and 13 tiles in each figure.
•
What number is added to each figure in Set A to make
the next figure?
In the tile pattern each figure increases by 4 tiles. In the toothpick
and circles patterns each figure increases by 2.
•
How do the figures in Set B increase?
The perimeters of the triangles increase by 1 for each figure. The
perimeters of the squares increase by 2 for each figure. The
perimeters of the pentagons increase by 3 for each figure.
•
How are the numerical sequences for the perimeters
for each set of regular polygons similar or different?
Each sequence begins with a different amount and increases by
a different amount (1 more than the previous polygon).
•
How can you use the amount of increase (or decrease)
to write a rule or generalization for a pattern?
The amount of the decrease is related to what must be multiplied by x to find the
rule for a pattern. The amount that you start with or the part added can be found by
subtracting the amount of the increase or decrease from the number of objects in
the first figure.
©2008 Austin ISD Secondary Mathematics Dept.
Algebra 1
4
Name:
Period:
Date:
Comparing Patterns
How are the following patterns alike? How are they different? Write two or three sentences
that describe the similarities and differences between these three patterns.
SET A
Each of the figures in Set B is made of regular polygons. Consider one side of a polygon as
one unit to calculate the perimeter in units. Find the perimeter for each figure in the
patterns. How is the perimeter of the following patterns alike? How are they different? Write
two or three sentences that describe the similarities and differences between these three
patterns.
SET B
©2008 Austin ISD Secondary Mathematics Dept.
Algebra 1
5
Name:
Period:
Date:
Compare the patterns in SET A with the patterns in SET B on the previous page and write
at least three sentences describing how the patterns are similar and different pictorially and
numerically.
What is the same and what is different about these two number sequences?
Sequence A
2
4
6
8
10…
5
7
9
11…
Sequence B
3
Work with a group to create a model of a linear growing pattern that fits this numerical
sequence.
5
9
13
17
21
©2008 Austin ISD Secondary Mathematics Dept.
25…
Algebra 1
6
EXPLAIN
The Explain portion of the lesson provides students with an opportunity to
use algebraic reasoning to connect multiple representations to models of
linear growing patterns.
1. Distribute one page of the Tile Pattern Team
Challenge activity sheet, the Team Roles
sheet and graphing calculators to each group of
four students. Two groups may have to work on
the same pattern if there are more than six
groups.
2. Review the team roles with students and assign
each member of the group a role. Set criteria
for the group posters and presentations.
Consider giving each member of a group a
different colored marker and ask that they use
only that color for their work on the poster.
3. Monitor students as they work in groups so that
each member is included and understands that
they will have a part in the final presentations.
Allow each group 3-5 minutes for their poster
presentations.
4. Once all groups have presented lead a whole
class discussion about using the graphing
calculator, lists, and linear regression to check
the rules and posters.
5. Post the group posters around the room and have
students give peer feedback using the “noticings”
and “wonderings” protocol. Set criteria for the
feedback and ask students to identify similarities
and differences between the different patterns.
Facilitation Questions
•
How can you use different representations to
help discover the rule for the pattern?
Answers will vary.
•
How are the different representations
connected? How does the table connect to the
graph and the rule? How do the graph and the
rule connect to the table?
Answers will vary.
•
Which representation was the most helpful for
finding the rule that would work for any figure
in the pattern?
Answers will vary.
©2008 Austin ISD Secondary Mathematics Dept.
Algebra 1
7
Team Roles
Resource Manager:
• Call the teacher over when your team is stuck. Make sure that all
questions are team questions.
“What team question can we ask the teacher?”
“Are we sure that no one here can answer the question?”
• Don’t let your team stay stuck!
Facilitator:
• Make sure your team understands the entire task before you begin.
“Who wants to read? Does everyone understand what we are asked to
do?”
“What is the connection? How will it show in the graph? How will it
show in the table?”
• Keep your team together. Make sure everyone’s ideas are heard.
“Are we all ready to move onto the next step?”
“Does anyone see it in a different way?”
Recorder/Reporter:
• Help your team organize a transparency or poster with your analysis.
Your poster needs to show everyone’s ideas and be well organized. Use
color, arrows, and other math tools to communicate your mathematics,
reasons and connections.
“How can we show that on the graph?”
“How can we show that connection?”
Task Manager:
•
Be sure that your team is accomplishing the task effectively and
efficiently. Keep track of the time and tell the team when it is time to
move forward to the next part of the task. Make sure that all talking is
within your team and is helping you accomplish the task. Eliminate side
conversations.
“How can we divide the work most efficiently?”
“We need to finish this part in 5 minutes, so we have time for…”
8
Page 1 of 6
Tile Pattern Team Challenge
Your team’s task is to create a poster showing every way you can represent the pattern below
and highlighting all of the connections between the representations that you can find. For this
activity, finding and showing the connections are the most important parts. Clearly
presenting the connections between representations on your poster will help you convince your
classmates that your description of the pattern makes sense.
Figure 1
Figure 2
Figure 3
Pattern Analysis:
•
Extend the pattern: Draw Figures 0, 4, and 5. Then describe Figure 20. Give as much
information as you can. What will it look like? How will the tiles be arranged? How
many tiles will it have?
•
Generalize the pattern by writing a rule that will give the number of tiles in any figure in
the pattern. Show how you got your answer.
•
Find the number of tiles in each figure. Record your data in a table and a graph.
•
Demonstrate how the pattern grows using color, arrows, labels, and other math tools to
help you show and explain. Show growth in each representation.
•
What connections do you see between the different representations (graph, figures, and
table)? How can you show these connections?
Presenting the Connections:
As a team, organize your work into a large poster that clearly shows each representation of
your pattern, as well as a description of Figure 20. When your team presents your poster to
the class, you will need to support each statement with a reason from your observations.
Each team member must explain something mathematical as part of your presentation.
9
Page 2 of 6
Tile Pattern Team Challenge
Your team’s task is to create a poster showing every way you can represent the pattern below
and highlighting all of the connections between the representations that you can find. For this
activity, finding and showing the connections are the most important parts. Clearly
presenting the connections between representations on your poster will help you convince your
classmates that your description of the pattern makes sense.
Figure 1
Figure 2
Figure 3
Pattern Analysis:
•
Extend the pattern: Draw Figures 0, 4, and 5. Then describe Figure 20. Give as much
information as you can. What will it look like? How will the tiles be arranged? How
many tiles will it have?
•
Generalize the pattern by writing a rule that will give the number of tiles in any figure in
the pattern. Show how you got your answer.
•
Find the number of tiles in each figure. Record your data in a table and a graph.
•
Demonstrate how the pattern grows using color, arrows, labels, and other math tools to
help you show and explain. Show growth in each representation.
•
What connections do you see between the different representations (graph, figures, and
table)? How can you show these connections?
Presenting the Connections:
As a team, organize your work into a large poster that clearly shows each representation of
your pattern, as well as a description of Figure 20. When your team presents your poster to
the class, you will need to support each statement with a reason from your observations.
Each team member must explain something mathematical as part of your presentation.
10
Page 3 of 6
Tile Pattern Team Challenge
Your team’s task is to create a poster showing every way you can represent the pattern below
and highlighting all of the connections between the representations that you can find. For this
activity, finding and showing the connections are the most important parts. Clearly
presenting the connections between representations on your poster will help you convince your
classmates that your description of the pattern makes sense.
Figure 1
Figure 2
Figure 3
Pattern Analysis:
•
Extend the pattern: Draw Figures 0, 4, and 5. Then describe Figure 20. Give as much
information as you can. What will it look like? How will the tiles be arranged? How
many tiles will it have?
•
Generalize the pattern by writing a rule that will give the number of tiles in any figure in
the pattern. Show how you got your answer.
•
Find the number of tiles in each figure. Record your data in a table and a graph.
•
Demonstrate how the pattern grows using color, arrows, labels, and other math tools to
help you show and explain. Show growth in each representation.
•
What connections do you see between the different representations (graph, figures, and
table)? How can you show these connections?
Presenting the Connections:
As a team, organize your work into a large poster that clearly shows each representation of
your pattern, as well as a description of Figure 20. When your team presents your poster to
the class, you will need to support each statement with a reason from your observations.
Each team member must explain something mathematical as part of your presentation.
11
Page 4 of 6
Tile Pattern Team Challenge
Your team’s task is to create a poster showing every way you can represent the pattern below
and highlighting all of the connections between the representations that you can find. For this
activity, finding and showing the connections are the most important parts. Clearly
presenting the connections between representations on your poster will help you convince your
classmates that your description of the pattern makes sense.
Figure 1
Figure 2
Figure 3
Pattern Analysis:
•
Extend the pattern: Draw Figures 0, 4, and 5. Then describe Figure 20. Give as much
information as you can. What will it look like? How will the tiles be arranged? How
many tiles will it have?
•
Generalize the pattern by writing a rule that will give the number of tiles in any figure in
the pattern. Show how you got your answer.
•
Find the number of tiles in each figure. Record your data in a table and a graph.
•
Demonstrate how the pattern grows using color, arrows, labels, and other math tools to
help you show and explain. Show growth in each representation.
•
What connections do you see between the different representations (graph, figures, and
table)? How can you show these connections?
Presenting the Connections:
As a team, organize your work into a large poster that clearly shows each representation of
your pattern, as well as a description of Figure 20. When your team presents your poster to
the class, you will need to support each statement with a reason from your observations.
Each team member must explain something mathematical as part of your presentation.
12
Page 5 of 6
Tile Pattern Team Challenge
Your team’s task is to create a poster showing every way you can represent the pattern below
and highlighting all of the connections between the representations that you can find. For this
activity, finding and showing the connections are the most important parts. Clearly
presenting the connections between representations on your poster will help you convince your
classmates that your description of the pattern makes sense.
Figure 1
Figure 2
Figure 3
Pattern Analysis:
•
Extend the pattern: Draw Figures 0, 4, and 5. Then describe Figure 20. Give as much
information as you can. What will it look like? How will the tiles be arranged? How
many tiles will it have?
•
Generalize the pattern by writing a rule that will give the number of tiles in any figure in
the pattern. Show how you got your answer.
•
Find the number of tiles in each figure. Record your data in a table and a graph.
•
Demonstrate how the pattern grows using color, arrows, labels, and other math tools to
help you show and explain. Show growth in each representation.
•
What connections do you see between the different representations (graph, figures, and
table)? How can you show these connections?
Presenting the Connections:
As a team, organize your work into a large poster that clearly shows each representation of
your pattern, as well as a description of Figure 20. When your team presents your poster to
the class, you will need to support each statement with a reason from your observations.
Each team member must explain something mathematical as part of your presentation.
13
Page 6 of 6
Tile Pattern Team Challenge
Your team’s task is to create a poster showing every way you can represent the pattern below
and highlighting all of the connections between the representations that you can find. For this
activity, finding and showing the connections are the most important parts. Clearly
presenting the connections between representations on your poster will help you convince your
classmates that your description of the pattern makes sense.
Figure 1
Figure 2
Figure 3
Pattern Analysis:
•
Extend the pattern: Draw Figures 0, 4, and 5. Then describe Figure 20. Give as much
information as you can. What will it look like? How will the tiles be arranged? How
many tiles will it have?
•
Generalize the pattern by writing a rule that will give the number of tiles in any figure in
the pattern. Show how you got your answer.
•
Find the number of tiles in each figure. Record your data in a table and a graph.
•
Demonstrate how the pattern grows using color, arrows, labels, and other math tools to
help you show and explain. Show growth in each representation.
•
What connections do you see between the different representations (graph, figures, and
table)? How can you show these connections?
Presenting the Connections:
As a team, organize your work into a large poster that clearly shows each representation of
your pattern, as well as a description of Figure 20. When your team presents your poster to
the class, you will need to support each statement with a reason from your observations.
Each team member must explain something mathematical as part of your presentation.
14
ELABORATE
The Elaborate portion of the lesson provides students with an opportunity
to make generalizations about linear patterns. Students are provided an
example of how different algebraic expressions can be used to describe
the same model and should explain how the different expressions are
equivalent. This part of the lesson is designed for individual investigation.
1. Distribute, the Linear Increasing and Decreasing
Patterns activity sheet. Students can cut up the
page and attach it to a page in their interactive
notebook. Give students graph paper if they request
it. Otherwise, encourage them to sketch their
calculator screens.
2. Allow students to use whatever tools they have
used previously such as a graphing calculator (and
including integer pieces or colored tiles) to complete
this activity. Monitor student progress and address
any misconceptions. Use the facilitation questions
to assist struggling students.
3. If students use the graphing calculator to find the
rule for the patterns, encourage them to connect
their rule to the pattern and other representations.
4. For Part 2, students should describe the concept of
equivalence using words, pictures, concrete
models, or algebraic methods. If students enter
each expression in the graphing calculator, they
must be able to justify how this strategy works.
Facilitation Questions
•
How can you describe each figure in the
sequence in relation to the figure number?
Answers will vary, but some variation of an expression
may emerge.
•
How can you use a table and/or graph to find the
rule for the pattern?
Students might describe how to create a table to find the
rate of change and starting point for the pattern.
•
What information about the pattern can be found
by graphing?
Students may be able to recall previous learning about
how to use slope and y-intercept to write the rule for the
pattern.
•
How can you use the graphing calculator to
check your work?
Answers will vary.
•
2 x (n +1)
How can the expressions in Part 2 be connected
to the model?
n
Answers will vary.
+2
2n
+2
n
©2008 Austin ISD Secondary Mathematics Dept.
Algebra 1
15
Name:
Period:
Date:
Linear Increasing and Decreasing Patterns
Part 1
For each of the patterns below draw the 4th and 5th figures of the sequence. Describe
the 20th figure using words, pictures and/or symbols. How would you find any figure in
the sequence? Create a table, graph and rule for each pattern. (You may cut out the
patterns and tape them in your spiral notebook.)
Pattern 1
Figure 1
Pattern 2
Figure 1
Figure 2
Figure 3
Figure 2
Pattern 3 Figure 1
Figure 3
Figure 2
Figure 3
Part 2
Which of these algebraic expressions could be linked to the growing pattern above?
Demonstrate how one or more of the expressions links to the pattern using color,
arrows, labels, and other math tools to help you show and explain.
A 2n + 2
B n+2+n
C 2(n+1)
©2008 Austin ISD Secondary Mathematics Dept.
Algebra 1
16
EVALUATE
During the Evaluate portion of the lesson, teachers will assess student
learning about the concepts and procedures that were investigated and
developed during the lesson.
1. Distribute a copy of Evaluate: Linear Patterns to each student.
2. Ask the students to answer the Evaluate questions.
3. The error analysis provided below guides teachers in diagnosing student misunderstandings
so that the teacher can more efficiently reteach the topic based on conceptual or procedural
student error patterns.
Question
Number
Correct
Answer
TEKS
TAKS™
1
A
A.3B
2
B
C
D
2
B
A.1B
1
A
C
D
3
C
A.3B
2
A
B
4
C
A.3B
2
Conceptual Error
©2008 Austin ISD Secondary Mathematics Dept.
Procedural Error
B
Guess
D
D
A
Algebra 1
17
Name:
Period:
Date:
Evaluate: Linear Patterns
1. The squares below show a pattern.
Which expression can be used to determine the number of squares at stage n?
A 4n – 2
B 5n – 3
C n2 + n
D 2n2
2. Which of the following equations best represents the relationship in the set of data shown
below?
x
–4
–3
–1
2
4
y
24
20
12
0
–8
A y = –5x + 4
B y = –4x + 8
C y = −7x − 4
D y = −8x − 8
©2008 Austin ISD Secondary Mathematics Dept.
Algebra 1
18
3. The blocks below are arranged in sequence to show a pattern.
Which expression can be used to determine the number of blocks at Stage n?
A n+1
B 3n – 1
C (n – 1) + 2
D (n – 1) + 2n
4. For a sports banquet Coach Brown must use rectangular tables in the school cafeteria. The
diagram below shows the seating arrangement that Coach Brown can use at 1 and 2 tables.
Which expression can be used to determine the number of people who can sit as a group if y
tables are joined to form 1 long table?
A 4(y + 1)
B 3(y + 1)
C 2(2y + 1)
D 6y
©2008 Austin ISD Secondary Mathematics Dept.
Algebra 1
19


© Copyright 2026