
Annual Report 2014
Auric Pacific Group Limited Annual Report 2014 1 Annual Report 2014 2 Auric Pacific Group Limited Annual Report 2014 Auric Pacific Group Limited Annual Report 2014 Contents Our Vision, Our Mission, Our Core Values 01 * Our Businesses 04 * Highlights of the Year 06 * Chairman’s Message 10 * Operations Review by Group CEO 12 * Our Financial Highlights 15 * Our Corporate Profile 16 * Our Corporate Information 17 * Our Board of Directors 20 * Our Senior Management Profile 28 * Corporate Governance, Risk Management and Financial Reports 30 Our vision Your Quality Food Provider Our mission Satisfying Your Everyday Food Essentials Our core values Excellence • Ethical • Engaging • Enterprising • Empowering 01 02 Auric Pacific Group Limited Annual Report 2014 S D N A R B Shine THAT With over 80 years of bread-making expertise, we have made our house brand Sunshine a staple on Singapore households’ dining tables. Beyond the commercial success of our products, we pride ourselves on how Sunshine and our other brands have earned, kept and reinforced the trust of our consumers through the years. It is a true testament to how deeply we understand our markets and how effectively we serve their needs. Auric Pacific Group Limited Annual Report 2014 03 04 Auric Pacific Group Limited Annual Report 2014 Auric Pacific Group Limited Annual Report 2014 OUR Business Auric Pacific has forged a brand in its own right as a trusted Food & Beverage group. We are continually working to ensure our products evolve with the dynamic consumer lifestyles. OUR BRANDS Sunshine, SCS, Buttercup, Top-One, Gourmet, Twin Cows Our aim is to enhance the brand equity of our partners’ and our brand products from generation to generation. FOOD RETAIL Food Junction, 1 Market, Délifrance, Toast Junction and Roti Junction. Over the years, Auric Pacific has become a brand in its own right as a Food & Beverage group. We continually strive to ensure our products evolve in tandem with our consumers’ changing tastes and lifestyles. DISTRIBUTION Post, Kellogg’s, Pringles, McCormick, Anlene, Heinz, Twinnings, Lee Kum Kee, Over a hundred other more brands 05 06 Auric Pacific Group Limited Annual Report 2014 Auric Pacific Group Limited Annual Report 2014 07 Highlights OF THE YEAR Extra Fine Breads Launched Sunshine Bakeries, Singapore’s first commercial manufacturer and marketer of bakery products, launched several Extra Fine Wholemeal breads last year. Sunshine’s Hawaiian Pizza Comes Up Tops In the 2015 Domestic Diva Awards, Auric Pacific’s Sunshine Hawaiian pizza was voted the favourite Ready-toEat Western Frozen Meal. Sunshine pizzas, now in both personal and family sizes, come in an array of delicious and exciting flavours that please the palates of everyone at home. Among them was Sunshine Extra Fine Sprouted Wholemeal Bread launched in May 2014. It also became the first Asian manufacturer to work with the US Whole Grains Council to educate consumers on the important benefits of sprouted grains. Sprouting unlocks many of the grain’s nutrients, making them more easily absorbed. Studies show that sprouting increases the amount of folate, Vitamins Bs and C, as well as iron, essential amino acids and soluble fibre, while reducing the gluten load. In October, Sunshine Classic Wholemeal Bread made its debut. Baked with natural wheatberries, it is rich in dietary fibre, nutrients and complex carbohydrates. Being made 100% from whole grain, its nuttier taste and grainier texture attest to its truly wholemeal nature. SCS voted Best Butter SCS Pure Creamery Unsalted Butter was voted the Best Butter in the Women’s Weekly Domestic Diva 2015 Awards in both Malaysia and Singapore. The magazine’s readers love SCS’ rich and creamy taste, smooth texture and irresistible aroma for both baking and cooking. They also the love the fact that it does not contain artificial colourings, additives, preservatives or hormones, but is chock-full of vitamins A, D, E and K. Rainbow Connection Award-Winning HR Practices Auric Pacific emerged as the winner of the Human Resource (“HR”) Leadership Award in Asia’s Best Employer Brand Awards. Conferred by the Employer Branding Institute and the World HRD Congress, the awards recognise organisations, which excel in people-focused strategies in the areas of policies, frameworks as well as human capital management and development practices anchored in a progressive culture engrained throughout the organisation. Sunshine Wins Giant Award In 2014, Sunshine won Giant supermarket’s Best Key Account Manager Award. Auric Pacific received the award in appreciation of our excellent support to the hypermart group. By providing new advertising and promotional activities, we were able to generate sales and growth for both the iconic Sunshine brand and for Giant. Mediterranean restaurant MEDZS Rainbow Cake was named the Best Rainbow Cake by 8 Days magazine in 2014. The scrumptious concoction of cream cheese frosting between multi-coloured soft vanilla sponge won over the reviewers, who described MEDZS Rainbow Cake as “pretty yum”. They also loved its cottony texture, which is reminiscent of a feathery Japanese cheesecake. “Modestly spread with cream cheese frosting so its pillowy vanilla sponge isn’t overwhelmed, it also has a berry garnish that helps cut the richness,” wrote the reviewers. 08 Auric Pacific Group Limited Annual Report 2014 N O I T U EXEC s r e v i l e D THAT To keep our brands top-of-mind, our operations have to be nothing less than excellent. We do not cut corners as we believe in delivering consistently high standards of quality in our products, service and corporate performance. Our sustainable growth is a result of our unswerving dedication and drive to create value for our customers, partners and stakeholders. Auric Pacific Group Limited Annual Report 2014 09 10 Auric Pacific Group Limited Annual Report 2014 Chairman’s MESSAGE The return to profitability was achieved despite a slowing economy and an increasingly more competitive landscape. Albert Saychuan Cheok Chairman Dear Shareholders, On behalf of the Board of Directors, I am pleased to present the annual report of Auric Pacific Group Limited for the financial year ended 31 December 2014 (“FY2014”). Improved Group financial performance Under challenging economic and competitive conditions, the Auric Pacific Group achieved a significant turnaround from a loss before tax of $21.9 million in financial year ended 31 December 2013 (“FY2013”) to a modest pre-tax profit of S$0.6 million in FY2014. Group revenue maintained an upward trend, increasing from $398.5 million to $424.4 million over the same period. The return to profitability was achieved despite a slowing economy and an increasingly more competitive landscape. The Singapore economy grew on a year-on-year by 2.1% basis in the fourth quarter of FY2014 versus 2.8% in the preceding quarter. On a quarter-on-quarter seasonally-adjusted annualised basis, it expanded at a faster pace of 4.9% in the fourth quarter compared to 2.6% in the previous quarter. For the whole of FY2014, the Singapore economy expanded by 2.9%, slower than the 4.4% in FY2013. The $22.5 million turnaround for Auric Pacific was primarily attributable to the $21.6 million in exceptional items recognised in FY2013 as part of the Group’s strategy to streamline its nonperforming businesses and to direct the Group’s focus onto building sustainable and profit generating business, which included provisions for impairment, losses on fixed assets as well as accrual of other costs such as rental penalties and severance payments. If one were to exclude the exceptional items recognised in FY2013 and FY2014, the Group would show an underlying improvement in profit of S$4.3 million. Auric Pacific Group Limited Annual Report 2014 In particular, significant strides have been made by Auric Pacific’s Manufacturing business. Local and regional icon Sunshine bread remained the star performer. This household favourite increased its market share and achieved doubledigit growth in both value and volume. As a result, Sunshine captured a larger bite of the bread market and further reinforced its premier brand status. Its stellar performance was due to the introduction of several “innovative, healthy and delicious” products, a result of dedicated and imaginative research and development and successful marketing. Our buttery stalwarts – SCS and Buttercup also continued to be household favourites, maintaining their brand competitiveness and dominant status in the regional market. Wholesale and Distribution held its ground, and remained a significant profit contributor in the year under review. Because of Auric Pacific’s established expertise and experience, the Group was able to attract new and expand the list of principals that it represents in the market. Food Junction, which underwent a major consolidation in the past two years, has seen some improvement in performance despite the challenging conditions. On the whole however, Food Retail still suffered from the twin effects of an increasingly tight labour market and increasingly more competitive market conditions. Even so, Food Retail managed to reduce its losses – but it was at a disappointing slower-than-expected rate. Efforts bear fruit Over the past two years, in the pursuit of re-achieving profitability and growth, Auric Pacific has pursued the painful but essential strategy of weeding out the non-performers, consolidating and rationalising its operations and enhancing good performers by investing in their further development, especially our brand dynamos Sunshine, SCS and Buttercup. These regional household names continue to grow in competitiveness, strength and market standing. We will continue to invest in our people, facilities and businesses as appropriate to generate or seize growth opportunity. Though slow in coming, our efforts are starting to bear fruit. However, we will not be content until our combination efforts of “weeding, consolidating, rationalising and enhancing” are visibly and sustainably bearing good fruit. We therefore remain unservingly committed in our goal of re-achieving sustainable growth and profitability for our shareholders. Remaining Responsible We are committed to corporate governance and will continually enhance our processes and procedures to ensure that the investment of shareholders are protected. Last year, Auric Pacific made significant strides by climbing 255 rungs to be part of the top 10% of all 644 companies listed under the Singapore Exchange Limited under the Governance and Transparency Index (“GTI”). The Singapore Exchange Securities Trading Limited Jointly launched by The Business Times and the Centre for Governance, Institutions and Organisations, the GTI is the only index in Singapore which assesses and ranks corporate governance practices of listed companies. At the same time, Auric Pacific believes strongly in being a responsible corporate citizen. Sunshine bread is distributed at various events in support of community and national events such as the National Day Parade. Sunshine products are also distributed to the needy, including Apex Lodge, St. John’s Home, Teen Challenge Singapore, Asia Women’s Welfare Association and Women’s and Children’s Health Care foundation. We also strongly support both government and civic initiatives in the development of human resource. Auric Pacific’s efforts in a management trainee programme and participation in the “Earn-as-You-Learn” traineeship programme partner with the Institute of Training and Education (“ITE”), assists to nurture the skills and talent of the young of Singapore. Future Growth Building on what has been achieved in FY 2014, Auric Pacific will continue its pursuit and journey of further growing and strengthening its businesses. This year, our Manufacturing business will continue in its efforts to meet the demands for quality products expected by consumers of bread and buttery and to ensure that the cost of such products remain light on their pockets. Together with the Wholesale and Distribution front, we are looking to extend our geographical reach beyond our traditional markets of Singapore and Malaysia. Auric Pacific will leverage on our expertise and experience to enhance the market penetration of the brands owned by us and our principals. Operating conditions for our Food Retail business remains challenging. However, our on-going consolidation and rationalisation efforts are purposefully aimed at restoring profitability to this area of the Group’s business. Auric Pacific is looking forward to and primed for a better year ahead. Appreciation I would like to take this opportunity to thank my fellow Directors for their invaluable advice and guidance. On behalf of the Board, we would like to thank Auric Pacific’s management team as well as our staff for their hard work and dedication. Our people remain the cornerstone of Auric Pacific’s strength and resilience. Our team of people has worked hard to bring us on the path back to profitability. We give thanks to their tireless and unremitting efforts and excellent teamwork. I would like to thank Ms Saw Phaik Hwa, who will retire on 30 April as the Group Chief Executive Officer of APGL, for her invaluable contributions. We wish her the very best in her future endeavours. I would also like to express my gratitude for the strong support we have been receiving from our shareholders. Let me assure you that we do not take your support for granted. Last but certainly not least, I would like to thank all our other stakeholders, namely our customers, principals, union and business associates, for their support and patronage. 11 12 Auric Pacific Group Limited Annual Report 2014 Auric Pacific Group Limited Annual Report 2014 Operations Review BY GROUP CEO The Sunshine brand shone even brighter in the market. Singapore’s longest standing commercial bread brand outpaced the growth of the bread market here last year increasing its market share with the introduction of new product lines. Group Chief Executive Officer Improved Performance FY2014 saw our brands make further inroads in their respective markets as we developed and launched new products that captured the hearts and minds of our consumers. The Sunshine brand shone even brighter in the market. Singapore’s longest standing commercial bread brand outpaced the growth of the bread market here last year increasing its market share with the introduction of new product lines. Following the FY2014 rollout of its Extra Fine Sprouted Wholemeal, Extra Fine Wholemeal Hamburger Bun, Extra Fine Wholemeal Hot Dog Roll and Classic Wholemeal, Sunshine is now a major player in the wholemeal bread market. Product innovation extended beyond bread products. In July, Sunshine added to its frozen pizza selection with Restaurants and outlets continue to come under the dual pressure of manpower shortage and high rentals. We have closed down the non-performers, and will continue to cast a critical and analytical eye on individual restaurants this year. Through further rationalisation, we are expecting to reduce further losses from these businesses. As part of these efforts, Toast@Work has been rebranded to Toast Junction, and with a new and delectable selection of local favourites, Toast Junction is drawing fresh crowds to its outlets. Delifrance Singapore has undergone a major consolidation, reducing the number of distressed outlets, and strengthening the profitable outlets’ performance following aggressive advertising and marketing efforts. Saw Phaik Hwa Operations Review The financial year ended 31 December 2014 (“FY2014”) was a turning point for Auric Pacific as we managed to turn in a modest profit amidst challenging economic conditions, a more competitive landscape and the continuing labour crunch. Food Junction’s food court business performed well in FY2014. Its new concept offers diners an airy, open and friendly atmosphere, which dish out good value offerings. Its customers have embraced the new concept, and response has been exceptionally good at the new outlets. Food Junction’s food courts have also benefited from strong support from its tenants, who continually strive to offer a wide and tasty range of cuisines and dishes to Singaporeans. four new tasty and tempting treats, including the Classic Aloha and the Meat Lovers pizzas. Another long-time household favourite, SCS, introduced in September its spreadable butter – a healthy option made with extra virgin olive oil and packed with Omega 3 and Vitamins A and D. The product is now available on both sides of the Causeway. Leveraging on our strengths in developing, promoting and marketing our brands, we introduced new products to our portfolio, which includes blended spreads under SCS. The sales of the new products will be closely monitored and reviewed continually taking into consideration their performance in the market. The list of principals placing their trust in us to market their products also grew last year. Pringles, Kellogg’s and Tabasco were among the global household names that we welcomed to our fold in FY2014. Even as we added to our list of house brands and principals, we have increased the market penetration of their products. In FY2014, our sales and marketing team successfully introduced and sold the brands we represent to cafes, restaurants and other dining establishments. Delifrance’s performance in Hong Kong also improved, with more better-located outlets and the launch of its healthy cafe offshoot, Alfafa. Delifrance’s Malaysian market continues to remain a challenge. In January 2015, Delifrance launched the Heritage Croissant in Singapore and Malaysia. Made of ingredients from France, this flaky pastry was an instant hit among diners. The Heritage Croissant will reinforce Delifrance’s status as the King of Croissants. Group Financial Review In FY2014, the Group’s total revenue rose to $424.4 million, an increase of $25.9 million or 6.5% compared to the previous year. Wholesale and distribution reported the strongest growth, increasing by 10% to $238.7 million. Manufacturing too posted strong growth, increasing by 8.7% to $46.8 million in revenue. Under Food Retail, Edmontor Group’s revenue rose by 6.7% to nearly $76.5 million. However, Food Junction Group saw revenue dip 3.7% to about $62.1 million because of the closure of various unprofitable restaurants. In FY2014, Auric Pacific reported a profit before taxation of $0.6 million in FY2014 versus a loss before tax of $21.9 million last year. The $22.5 million profit improvement was due mainly to the recognition of $21.6 million in exceptional items in FY2013 for the streamlining of non-performing businesses. Excluding the exceptional items recognised in FY2013 and FY2014, our profit before taxation improved by $4.3 million. This was because: a) Manufacturing’s operating profit increased from $7.3 million in 2013 to $10.0 million in 2014, b) Food Junction Group’s operating performance improved by $3.7 million over the same period because of enhanced profitability from food courts, restaurant in Hong Kong and the closure of nonperforming restaurants, c) Edmontor Group reduced its operating loss by $0.9 million to $6.9 million in FY2014 on the back of higher sales from Delifrance Singapore and Hong Kong, and d) Operating losses from other investments in FY 2014 was $2.9 million lower than the previous year due to a gain on the disposal of interests in subsidiary companies and an absence of allowance for impairment loss on an unquoted $3 million investment. These improvements were partially offset by a $2.0 million drop in the Wholesale and Distribution segment’s operating profit in FY2014 because of a weaker Malaysian market. In FY2014, the Group’s total revenue rose to $424.4 million, an increase of $25.9 million or 6.5% compared to the previous year. Wholesale and distribution reported the strongest growth, increasing by 10% to $238.7 million. Manufacturing too posted strong growth, increasing by 8.7% to $46.8 million in revenue. 13 14 Auric Pacific Group Limited Annual Report 2014 Auric Pacific Group Limited Annual Report 2014 15 OUR Wholesale and Distribution Wholesale and Distribution’s revenue rose because of higher sales from Food Service contributed by new agencies, new house brands and additional market penetration into restaurants. It was further boosted by higher retail sales from both general trade and key accounts. Food Court Lower revenue from Food Junction Group segment was due mainly to the discontinuation of management and operator services of ME@OUE, the closure of restaurants and lower contributions from others. This was partially offset by higher sales from food courts and performing restaurants. Wholesale and Distribution’s operating profit for FY2014 was S$2.0 million lower than that in FY2013. The dip was mainly due to a $1.7 million drop in operating profit from the Malaysian operations, which was hit by higher selling and marketing expenses, administrative expenses and higher staff cost. Food Junction Group’s operating performance improved in 2014 by $3.7 million because of higher profits from food courts and its Hong Kong restaurant, and the closure of non-performing restaurants. Due to the intense competition in the overseas food and beverage industry, the Group also recognised a one-off loss of $3.3 million in 2014 arising from the discontinuation of a loss-making restaurant in China. Manufacturing The Manufacturing segment recorded higher revenue in FY2014 because of an increase in sales of Sunshine’s bread products and the successful launch of several new products. Operating profit from Manufacturing also increased from $7.3 million in FY2013 to $10.0 million in FY2014. Manufacturing in Singapore, which enjoyed higher sales from both existing and new products, was the main reason behind the $2.7 million increase. The reversal of accrual for a regulatory claim after the finalisation of tax reviewed by Malaysian Customs also contributed to the profit rise. However, higher sales and marketing expenses incurred by the Singapore business in line with the increase in sales coupled with higher raw materials’ costs from Malaysia business had a negative impact on operating profit. Food Retail Higher revenue from Edmontor Group was due mainly to an increase in retail sales from Delifrance Hong Kong outlets. Effective marketing campaigns generated increased awareness in and additional traffic to these cafes. Edmontor Group reported an operating loss of $6.9 million in FY2014, an improvement of $0.9 million, excluding $10.7 million in exceptional items recognised in FY2013 for the impairment of intangible assets and other closure costs. The improved performance was largely contributed by Delifrance Singapore and Hong Kong, which saw sales rise on the back of intensive promotional activities. The increase was partially offset by higher labour, rental, marketing and semi-variable costs. Looking Ahead The year ahead will continue to be a challenging one for Auric Pacific, which is well positioned for growth. We have invested and will continue to invest in our people – the cornerstone of our organisation. Our efforts have gained recognition. Auric Pacific was conferred various HR awards including the NTUC Mayday Model Partnership Awards 2014 – Progressive wage model (production operators). The Group was also a finalist in three categories at the Human Resources Excellence Awards 2014. Auric Pacific continually strives to improve controls and processes to boost productivity and align IT to our strategic business objectives. In FY2014, the Marketing and Distribution businesses implemented the supply chain management systems which will further improve the productivity and effectiveness of its supply chain operations. It is also progressively rolling out inventory planning and forecasting systems, which will enhance inventory management, improve customer fulfilment service levels and reduce stock write-offs. At Sunshine Bakeries, systems that had been implemented and have enhanced the efficiency of our operations and made a positive impact on our performance. Appreciation Finally, I would like to express my appreciation and thanks for all the support I have received from the Board, management and staff during my time here. I have had such a richly rewarding and fulfilling experience, and I want to thank each and everyone for all their contributions and efforts. I wish Auric Pacific and everyone in it all the best in their future endeavours. Financial HIGHLIGHTS YEAR ENDED 31 DECEMBER ($‘000) 2014 2013 2012 2011 (restated) Income Statement Revenue 424,424 398,482 389,997 386,753 Profit/(Loss) before taxation 639 (21,912) (1,017) 11,096 Income tax (expense)/credit (464) (1,332) 12,579 (2,592) Profit/(Loss) for the financial year 175 (23,244) 11,562 8,504 Profit/(Loss) attributable to equity holders of the Company 231 (21,943) 14,613 8,566 Balance Sheet Fixed assets 40,861 34,865 Other Intangible Assets 58,531 61,794 Investment in a joint venture company 2,002 2,067 Investments in associated companies 273 277 Goodwill on consolidation 18,059 18,107 Long-term investments 10,428 10,160 Deferred tax assets 1,092 1,158 Fixed deposits (restricted) 4,004 3,856 Deposits and other debtors, prepayments and other recoverables (non-current) 11,428 6,545 Short-term investments - - Fixed deposits 4,798 4,636 Working capital 67,007 77,967 Loans and borrowings (non-current) (415) (333) Deferred tax liabilities (3,640) (4,202) Other creditors (non-current) (1,047) (433) Provisions (non-current) (4,631) (4,262) Net assets 208,750 212,202 Financed by : Share capital 64,461 64,461 Reserves 143,521 146,776 207,982 211,237 Non-controlling interests 768 965 Total equity 208,750 212,202 Ratios : Earnings/(Loss) per share (cents) 0.18 (17.46) Dividends net per share (cents) 2.00 2.00 Net assets value per ordinary share ($) 1.66 1.68 Net tangible assets per ordinary share ($) 1.05 1.05 After tax return on equity attributable to equity holders of the Company (%) 0.11% -10.39% Number of ordinary shares 125,667,324 125,667,324 2010 381,814 9,601 (2,032) 7,569 6,302 40,312 64,594 1,874 282 28,219 12,907 930 5,304 34,421 70,924 1,662 282 29,794 16,448 730 5,848 33,627 73,796 1,416 1,607 29,957 17,728 831 720 6,420 - 11,825 105,815 (17,666) (4,775) (209) (3,657) 252,175 6,157 2,330 10,692 90,465 (16,315) (5,154) (326) (1,742) 246,216 7,553 6,630 8,018 85,999 (14,809) (5,800) (997) (1,529) 244,747 64,461 170,231 234,692 17,483 252,175 64,461 160,732 225,193 21,023 246,216 64,461 157,499 221,960 22,787 244,747 11.63 3.00 1.87 1.13 6.82 3.00 1.79 0.99 5.01 3.00 1.77 0.94 6.23% 3.80% 125,667,324 125,667,324 2.84% 125,667,324 16 Auric Pacific Group Limited Annual Report 2014 Auric Pacific Group Limited Annual Report 2014 OUR OUR Corporate Corporate PROFILE Auric Pacific Group Limited (Auric Pacific) is a Singapore incorporated investment holding company involved in a diverse range of businesses which includes the distribution of fast moving consumer food, food manufacturing and retailing, and restaurant and food court management. Listed on the mainboard of the Singapore Stock Exchange Security Trading Limited of, Auric Pacific’s businesses and operations are present in Singapore, Malaysia, Indonesia, Hong Kong and China. Distribution Auric Pacific’s distribution business, under its subsidiary Auric Pacific Marketing Pte Ltd (Auric Pacific Marketing) which marketing and distribution services are carried out in Singapore, whereas its related Malaysian counterpart, Auric Chun Yip Sdn. Bhd. (Auric Chun Yip) provides similar services in Malaysia. Both business subsidiaries have successfully assisted many leading global consumer brands to establish their market positions and build significant market shares in Singapore and Malaysia. Collectively, Auric Pacific Marketing and Auric Chun Yip have over a hundred brands in its distribution portfolio which comprises well established global and household names such as Post, Kelloggs, Pringles, McCormick, Heinz, Twinings, Abbott Laboratories and Lee Kum Kee, among other well-known brands. Auric Pacific Marketing is also in the business of marketing and distribution of many of the world leading Wines, Beer, Cider, Artesian Water, Sake & Yuzu, such as Alto Los Romeros, Dominio del Plata, Castello Banfi, Chateau Tanunda, Durbanville Hill, Edulis, Hardys, Robert Mondavi, Kim Crawford, Nederburg, Pacific Rim, Tatachilla, Amsterdam beer, Savanna Cider, Voss and Shiragiku Sake & Yuzu. Auric Pacific Marketing further carries more than 200 labels of premium wines as well as cult brands from renowned wineries and also deals in en primeur Bordeaux wines. Brands Owned by Auric Pacific Auric Pacific also has a portfolio of well-established household brands markets such as Sunshine, Top One, SCS and Gourmet which can be commonly found in every household in Singapore. Buttercup and Twin Cows have also gained its reputation as household essentials in Malaysia. Auric Pacific has newly launched Amor Margarine in Malaysia in 2014. Manufacturing Sunshine and Top-One breads are made at Auric Pacific’s own baking and manufacturing facility based in Singapore. The bakery, which has been placing bread and other bread products on tables within Singapore homes since the 1930s, is one of the nation’s largest and established bread manufacturers in Singapore. Sunshine has launched nine new breads and bakery products such as Sprouted Wholemeal bread, Classic Wholemeal bread in 2014 and continues to expand their range to cater to the diverse needs of the public. Currently, Sunshine SoftWhite Bread has gained its place as one of the leading products in the market. Sunshine further presents an array of convenience foods and baking ingredients such as Sunshine Frozen Pizza to satisfy our consumers’ need for convenience and quality products. Auric Pacific Food Processing Sdn. Bhd., a Malaysian subsidiary of Auric Pacific, manufactures Buttercup, butter blend and margarine products. Auric Chun Yip markets and distributes the Buttercup branded range of products through its distribution network in Malaysia. Food Retail Auric Pacific’s food retail businesses are carried out through its subsidiaries Food Junction Holdings Limited, and Délifrance Asia Limited. Food Junction Holdings Limited manages and operates a chain of food courts in Singapore and Malaysia, branded under Food Junction. It further manages and operates casual dining restaurants and outlets, which includes Toast Junction in Singapore and Lippo Chiuchow Restaurant in Hong Kong. Délifrance is a brand recognisable in Singapore, Malaysia and Hong Kong with retail food outlets serving French bakery products in the respective territories. Délifrance began its operations in Singapore in 1983, initially focusing on manufacturing bakery products for wholesale customers, following which, it expanded into café operations in 1985 when it opened the first Délifrance café in Singapore at Clifford Centre. Since then, it has grown across Asia and today, Auric Pacific’s subsidiary Délifrance Asia Ltd, through its subsidiaries, operate and manage more than 75 Délifrance outlets in Singapore, Malaysia and Hong Kong. For more information on Auric Pacific Group Limited, please refer to our website at www.auricgroup.com. INFORMATION BOARD OF DIRECTORS Mr Albert Saychuan Cheok Independent Non-Executive Chairman Dr Stephen Riady Executive Director Dr Andy Adhiwana Executive Director (Appointed with effect from 1 November 2014) Ms Saw Phaik Hwa Executive Director (Resigned with effect from 1 March 2015) Mr Bryan Chang Yew Chan Independent Non-Executive Director CORPORATE HEAD OFFICE AND REGISTERED OFFICE 50 Collyer Quay #06-03 OUE Bayfront Singapore 049321 Tel: (65) 6336 2262 Fax: (65) 6336 2272 Website: www.auricgroup.com DATE OF INCORPORATION 20 August 1988 COMPANY REGISTRATION NUMBER Dr Lim Boh Soon 198802981D Dr Ronnie Tan Keh Poo SHARE REGISTRAR Independent Non-Executive Director AUDIT AND RISK COMMITTEE M & C Services Private Limited 112 Robinson Road #05-01 Singapore 068902 Tel: (65) 6227 6660 Fax: (65) 6225 1452 Chairman AUDITORS Non-Executive Director Mr Edwin Neo Independent Non-Executive Director Mr Bryan Chang Yew Chan Dr Lim Boh Soon Ernst & Young LLP Member Mr Shekaran Krishnan Dr Ronnie Tan Keh Poo Member Partner (Appointed in financial year 2013) NOMINATION COMMITTEE PRINCIPAL BANKER Dr Lim Boh Soon Oversea-Chinese Banking Corporation Limited Dr Stephen Riady STOCK EXCHANGE LISTING Chairman Member Mr Bryan Chang Yew Chan Member REMUNERATION COMMITTEE Mr Albert Saychuan Cheok Chairman Mr Bryan Chang Yew Chan Member Dr Lim Boh Soon Member COMPANY SECRETARY Mr Tan T’eng Ta’ Benedict The Singapore Exchange Securities Trading Limited 17 18 Auric Pacific Group Limited Annual Report 2014 M S I M A DYN s e v i r D THAT We are always on the lookout for fresh and innovative products to channel to our growing markets. With our diverse business interests, from distribution, manufacturing and retail to restaurant and food court management, we have a healthy, balanced and dynamic mix of growth drivers that moves us forward, in Singapore and beyond. Auric Pacific Group Limited Annual Report 2014 19 20 Auric Pacific Group Limited Annual Report 2014 Auric Pacific Group Limited Annual Report 2014 21 OUR BOARD OF Directors Albert Saychuan Cheok (Age: 64) Independent Non-Executive Chairman Appointment Date of first appointment as a director: 22 July 2002 Date of last re-election as a director: 25 April 2013 Length of service as a director: 12 years and 5 months (as at 31 December 2014) Board committee(s) served on Remuneration Committee (Chairman) Mr Albert Cheok was appointed a director of Auric Pacific Group Limited (“APGL”) on 22 July 2002 and has served as independent non-executive Chairman of APGL since 23 February 2006. He also serves as Chairman of the Remuneration Committee. The Board and Nomination Committee regard him as independent for the financial year ending 2015. Mr Cheok is a vice governor of the Board of Governors of the Malaysian Institute of Corporate Governance. In Singapore, Mr Cheok is the independent non-executive Chairman of Bowsprit Capital Corporation Limited (Manager of First Real Estate Investment Trust). He is also the independent non-executive Chairman of LMIRT Management Ltd (Manager of Lippo Malls Indonesia Retail Trust) and of Amplefield Limited. Elsewhere, Mr Cheok holds independent non-executive directorships in Hongkong Chinese Limited, AcrossAsia Limited, International Standard Resources Holdings Limited, Macau Chinese Bank Limited, Metal Reclamation Berhad and Adavale Resources Limited. Mr Cheok is a banker with over 30 years’ experience in banking in the Asia-Pacific region. Between May 1979 and February 1982, he was an adviser to the Australian Government Inquiry into the Australian Financial System which introduced comprehensive reforms to the Australian banking system. He was also the Chief Manager at the Reserve Bank of Australia from October 1988 to September 1989 before becoming the Deputy Commissioner of Banking of Hong Kong for about three and a half years, and he was subsequently appointed as the Executive Director in charge of Banking Supervision at the Hong Kong Monetary Authority from April 1993 to May 1995. Mr Cheok held the position of Chairman of Bangkok Bank Berhad from September 1995 to November 2005 and Vice Chairman of the Export and Industry Bank of the Philippines from February 2006 to April 2012. Mr Cheok graduated from the University of Adelaide, Australia with First Class Honours in Economics. He is a Fellow of the Australian Institute of Certified Public Accountants. Further details of Mr Cheok may be found at page 47 of the Annual Report. Dr Stephen Riady was appointed a director of Auric Pacific Group Limited (“APGL”) on 12 May 1997, whereupon from 10 May 1999 to 22 February 2006, he assumed the role of Group Managing Director. Thereafter, from 23 February 2006 till today, he served as an executive director of APGL and was last re-elected as director on 27 April 2012. As a member of the APGL Board, Dr Riady serves as a member of its Nomination Committee. Dr Riady is also an executive director of Lippo Limited and has been its Chairman since 1991. He was appointed a Director of Lippo China Resources Limited in 1992 and on 25 March 2011, he was appointed as its Chairman. He has been an executive director of Hongkong Chinese Limited since 1992 and on 25 March 2011, he was appointed its Chairman. Dr Riady has served as executive director of OUE Limited (“OUE”) since 30 November 2006 whereupon on 9 March 2010, he was appointed OUE’s Executive Chairman and continues to hold those positions until today. Dr Stephen Riady (Age: 54) Executive Director Appointment Date of first appointment as a director: 12 May 1997 Date of last re-election as a director: 27 April 2012 In public service, Dr Riady was Hong Kong Affairs Advisor from April 1995 to June 1997 and was appointed by the Hong Kong and Macao Affairs Office of the State Council and Xinhua News Agency, Hong Kong Branch of the People’s Republic of China (“PRC”). He is also a member of the Committee to Promote Economic Co-operation between Fujian and Hong Kong established by the Provincial Government of Fujian, PRC. Accolades he has received include the Chevalier de L’Ordre des Arts et des Lettres awarded by the French government, and the Strategic Investment Entrepreneur of the Year in Ernst & Young’s annual Entrepreneur of the Year Awards Singapore 2007. He is an Honorary Citizen of Shenzhen, PRC. Length of service as a director: 17 years and 8 months (as at 31 December 2014) Dr Riady is a graduate of the University of Southern California, United States and holds a Master Degree of Business Administration from Golden Gate University, United States. He was conferred an Honorary Degree of Doctor of Business Administration from Edinburgh Napier University, United Kingdom, and is one of the first Honorary University Fellows installed by the Hong Kong Baptist University. Board committee(s) served on Nomination Committee (Member) Further details of Dr Riady may be found at page 47 of the Annual Report and his deemed shareholdings interest may be found at pages 52 to 55 of the Annual Report. 22 Auric Pacific Group Limited Annual Report 2014 Auric Pacific Group Limited Annual Report 2014 23 Dr Andy Adhiwana (Age: 30) Executive Director Appointment Date of first appointment as a director: 1 November 2014 Dr Andy Adhiwana was appointed executive director of Auric Pacific Group Limited (“APGL”) on 1 November 2014 and is presently a substantial shareholder of APGL. As executive director, Dr Adhiwana continues to drive the business development affairs of APGL and its subsidiaries, among other critical responsibilities, a role that he was involved in when he joined APGL as its business development manager in December 2013. Date of last re-election as a director: N.A. Dr Adhiwana graduated from the renowned Heidelberg University and earned a Bachelor of Medicine, Bachelor of Surgery and a Doctorate in Medicine, where he distinguished himself and was granted the prestigious “Dr.med.” title with cum laude. Length of service as a director: 2 months (as at 31 December 2014) Notwithstanding his distinction in medicine, Dr Adhiwana pursued his interest in business and enrolled, in the Masters of Business Administration programme with the National University of Singapore, and was subsequently awarded a Masters of Business Administration degree. Board committee(s) served on Nil Further details of Dr Adhiwana may be found at page 47 of the Annual Report and his deemed shareholdings interest may be found at pages 52 and 53 of the Annual Report. Ms Saw Phaik Hwa joined Auric Pacific Group Limited (“APGL”) as Group Chief Executive Officer on 1 May 2012 and was appointed Executive Director on 25 July 2012. Ms Saw has resigned as Executive Director of APGL with effect from 1 March 2015 and shall be retiring as Group Chief Executive Officer with effect from 30 April 2015. Saw Phaik Hwa (Age: 60) Executive Director & Group Chief Executive Officer Appointment Date of first appointment as a director: 25 July 2012 She was appointed non-executive director of Food Junction Holdings Limited, a subsidiary of APGL on 13 July 2012 and was redesignated as an executive director on 14 September 2012. She is also a non- executive director of The Hour Glass Ltd, a Director of the Esplanade Co. Ltd and sits on the Board of Trustees of the Singapore Management University and Tan Tock Seng Hospital Community Charity Fund. As an avid practitioner of Taiji, Ms Saw serves as President of the Singapore Jian Chuan Tai Chi Chuan Physical Culture Association and as First Vice Chairman of Singapore Wushu Dragon and Lion Dance Federation. She is also the Vice President of the International Wu Style Tai Chi Chuan Federation and the Governor for Singapore and Malaysia for the international body of Wu’s Tai Chi Chuan Academy. Date of last re-election as a director: N.A. Ms Saw was formerly the President and Chief Executive Officer of SMRT Corporation Ltd (“SMRT”) having transformed SMRT into a transport corporation with new business segments in retail and advertising. She was also the Regional President of DFS Venture Singapore (Pte) Ltd after holding various senior positions within the duty-free retail chain. Length of service as a director: 2 years and 5 months (as at 31 December 2014) Ms Saw graduated with Honours degree in Biochemistry from the University of Singapore and had also completed an Advanced Management Programme at the University of Hawaii. Board committee(s) served on Nil Further details of Ms Saw Phaik Hwa may be found at page 48 of the Annual Report and her shareholding interest may be found at page 52 of the Annual Report. 24 Auric Pacific Group Limited Annual Report 2014 Auric Pacific Group Limited Annual Report 2014 Bryan Chang Yew Chan (Age: 56) Independent Non-Executive Director Appointment Date of first appointment as a director: 23 February 2006 Date of last re-election as a director: 27 April 2012 Length of service as a director: 8 years and 10 months (as at 31 December 2014) Board committee(s) served on • Audit and Risk Committee (Chairman) • Nomination Committee (Member) • Remuneration Committee (Member) 25 Mr Bryan Chang Yew Chan was appointed as director of Auric Pacific Group Limited (“APGL”) on 23 February 2006 and currently serves as an Independent non-executive director of APGL. The Board and the Nomination Committee regard Mr Chang as independent for the financial year ending 2015. He also serves as Chairman of the Audit and Risk Committee and member of the Nomination and Remuneration Committees of APGL. Mr Chang presently holds directorships in Shin Yang Services Pte Ltd, Atlantic Capital Group Ltd, Juno Shipping Ltd and a number of private limited companies. Mr Chang is also currently the General Manager of Shin Yang Services Pte Ltd which is principally engaged in the design and execution of business models, identifying future revenue sources and formulating business plans of which he assumes the role of Internal Consultant (internal audit, management information and resources allocation system) to its Head Office in Malaysia and personal adviser to the Chairman of the Shin Yang Group of companies. Mr Chang holds a Bachelor degree in Accountancy from the National University of Singapore and is a Fellow Member of both the Certified Public Accountants Australia and the Institute of Singapore Chartered Accountants. Further details of Mr Bryan Chang may be found at page 48 of the Annual Report. Dr Lim Boh Soon was appointed as director of Auric Pacific Group Limited (“APGL”) on 23 February 2006 and currently serves as an independent non-executive director of APGL. The Board and the Nomination Committee regard Dr Lim as independent for the financial year ending 2015. He also serves as Chairman of the Nomination Committee and a member of the Remuneration and Audit and Risk Committees of APGL. Dr Lim Boh Soon (Age: 58) Independent Non-Executive Director Appointment Date of first appointment as a director: 23 February 2006 Date of last re-election as a director: 30 April 2014 Length of service as a director: 8 years and 10 months (as at 31 December 2014) Board committee(s) served on • Nomination Committee (Chairman) • Remuneration Committee (Member) • Audit and Risk Committee (Member) Dr Lim is currently a director of, and shareholder in, Arise Asset Management Pte Ltd. He holds directorships in CSE Global Ltd (independent non-executive director) listed on the Singapore Exchange Securities Trading Limited and AcrossAsia Limited (independent non-executive director) listed on the Stock Exchange of Hong Kong. Dr Lim is also an Independent Non-Executive Director on the Board of SMTrack Bhd. which is listed in Bursa Malaysia. Dr Lim was the former First Non-Muslim Chief Executive Officer of a leading Kuwait Finance House (Islamic) Bank in Singapore and former director of Ferrell International Limited. Prior to that, he was the first foreign expatriate CEO of Vietcombank Fund Management Company (“Vietcombank”). Vietcombank is a subsidiary of the largest state-owned Bank of Foreign Trade in Vietnam, in which he was instrumental for setting up various offices and private equity funds. Previously, he was a Partner at UBS Capital Asia Pacific (S) Ltd from July 1996 to December 1999 in which he co-headed the private equity arm of UBS AG in Asia and UBS Investment Management Pte Ltd. Dr Lim graduated from the University of Strathclyde (formerly The Royal College of Science & Technology) in United Kingdom with a Bachelor of Science (First Class Honours) in Mechanical Engineering and subsequently a PhD in 1985 in Mechanical Engineering. He also obtained a Graduate Diploma in Marketing Management from the Singapore Institute of Management and a Diploma in Marketing from the Chartered Institute of Management in United Kingdom. Further details of Dr Lim Boh Soon may be found at page 48 of the Annual Report and his shareholding interest may be found at page 52 of the Annual Report. 26 Auric Pacific Group Limited Annual Report 2014 Auric Pacific Group Limited Annual Report 2014 Dr Ronnie Tan Keh Poo (Age: 60) 27 Dr Ronnie Tan Keh Poo was appointed executive director of Auric Pacific Group Limited (“APGL”) on 1 October 2004. Subsequently on 31 July 2009, he relinquished his role as executive director and he currently serves as non-executive director and member of the Audit and Risk Committee of APGL. Non-Executive Director Dr Tan is currently a director and chief executive officer of Bowsprit Capital Corporation Limited. Appointment Date of first appointment as a director: 1 October 2004 Dr Tan worked in various government and private healthcare facilities in Australia and Singapore as a medical practitioner until 1987. He joined Parkway Holdings Limited as its international business development manager and also served as chief executive officer and director of Gleneagles Hospital. In 1995, he worked in Indonesia as executive director of Lippo Group and chief executive officer of Siloam Group of Hospitals. From 1998 to 2004, he took up various postings as chief executive officer and director of AsiaMedic Limited and senior executive in Parkway Holdings Limited. For the period from 2006 to 2012, Dr Tan was a director of Food Junction Holdings Limited. Date of last re-election as a director: 25 April 2013 Length of service as a director: 10 years and 3 months (as at 31 December 2014) Board committee(s) served on Audit and Risk Committee (Member) Edwin Neo (Age: 64) Independent Non-Executive Director Appointment Date of first appointment as a director: 15 March 2011 Date of last re-election as a director: 30 April 2014 Length of service as a director: 3 years and 9 months (as at 31 December 2014) Board committee(s) served on Nil Dr Tan qualified as a medical doctor from the University of Melbourne in 1977. He has also received his Master of Health Administration from Loma Linda University. Further details of Dr Tan may be found at page 49 of the Annual Report. Mr Edwin Neo was appointed as director of Auric Pacific Group Limited (“APGL”) on 15 March 2011 and currently serves as an independent non-executive director of APGL. The Board and the Nomination Committee regard Mr Neo as independent for the financial year ending 2015. Mr Neo is currently an independent non-executive director of Lippo Limited and Lippo China Resources Limited. He is also a member of the Nomination Committee, Remuneration Committee and Audit Committee of Lippo Limited and Lippo China Resources Limited. He is presently the senior partner of Hoosenally & Neo. Mr Neo was admitted as a solicitor of the Supreme Court of Hong Kong in 1976, as an advocate and solicitor of the Supreme Court of Singapore in 1991 and as a solicitor of the Supreme Court of England and Wales in 1993. He is a practicing lawyer and a notary public in Hong Kong. He holds a Bachelor of Laws degree with Honours and Post-graduate Certificate in Laws from the University of Hong Kong. Further details of Mr Neo may be found at pages 48 and 49 of the Annual Report. 28 Auric Pacific Group Limited Annual Report 2014 OUR Senior Management Profile Mr Tan Kai Teck Group Chief Financial Officer Mr Tan was appointed the Group Chief Financial Officer in November 2013. He is responsible for the Group’s financial systems and controls, group accounting, corporate finance, treasury and taxation matters. Prior to joining Auric Pacific, Mr Tan was the Chief Financial Officer of Midas Holdings Limited since March 2003. Mr Tan has over 20 years of experience in finance and accounting. He is a fellow member of The Institute of Singapore Chartered Accountants. He holds a Bachelor of Accountancy degree (Second Upper Class Honours) from the Nanyang Technological University. Ms Dora Chong Lee Buay Chief Executive Officer - Food Group Ms Chong was appointed Chief Executive Officer of the Food Group in February 2013. She is responsible for the marketing, manufacturing and distribution businesses of Auric Pacific, which includes Auric Pacific Marketing, Auric Chun Yip and Sunshine Bakeries. Her professional career of 33 years saw her involved in retail, marketing and distribution activities across Asia, which included countries such as People’s Republic of China, Hong Kong, India, Japan, Republic of Korea and countries within SouthEast Asia. Before joining Auric Pacific, Ms Chong was general manager of Coty Prestige South East Asia Limited (“Coty Prestige”), which is part of New York based global leading brand owner and manufacturer with a presence in over 130 countries and territories. Besides being responsible for increasing revenue and profits by driving market share in the countries under her portfolio, her responsibilities with Coty Prestige included business development, opening of new markets and brand building. Ms Chong holds a Bachelor of Business Administration Degree from the University of Singapore. Mr Ho Shau Foong Chief Manufacturing Officer Mr Ho Shau Foong was appointed Chief Manufacturing Officer in March 2014. He is responsible for the production functions in the Group, which include overseeing all factory operations and expansion, engineering functions, facilities maintenance, quality assurance programmes and new production development. Mr Ho has more than 25 years of experience in food industries in Singapore and China. Prior to joining Auric Pacific, Mr Ho has held several vice-president and SVP positions in food conglomerates including SGX-listed SFI/SATS Ltd and Hanwell Holdings. His experience includes managing one of the largest food catering operations and food distribution operations in Singapore, and has setup/managed more than ten food production factories. He has also worked with Singbridge in the development of the Jilin Food Zone in China. Mr Ho holds a Master of Science degree (with Distinction) in Food Biotechnology from the University of Strathclyde (UK), and has attained excellent academic achievements and several awards in his education in food science and technology leading to the Master degree. Ms Michelle Lim Chief Creative Officer Ms Lim was appointed Chief Creative Officer of Auric Pacific in February 2013. She is responsible for the marketing function of the Group. Her responsibilities include brand building, strategic planning, product creation, consumer insight and marketing communications. Prior to joining Auric Pacific, Ms Lim held the position of Director of Media at Marina Bay Sands and was in the leadership & pioneer team that spearheaded the launch of Marina Bay Sands. Her experience in marketing spans across the hotel, retail mall, food and beverage, and entertainment industries to the FMCG industry. Ms Lim’s marketing career in MNCs include McCain Foods, Coca Cola, F&N Foods and Canon. She also has regional experience in the Asia Pacific markets. Ms Lim holds a Bachelor of Science, major in Economics from the National University of Singapore and a Graduate Diploma in Marketing from the Marketing Institute of Singapore. Mr Tan T’eng Ta’ Benedict Group Legal Counsel and Company Secretary Head of Risk Management Mr Tan was appointed Group Legal Counsel and Company Secretary in May 2013 and is responsible for overseeing the Group’s legal, risk management and corporate secretarial functions. He is also the secretary of the Audit and Risk Committee, the Nomination Committee and the Remuneration Committee of Auric Pacific’s Board. His experience spans across the FMCG, food and beverage, real estate, fund management, information technology and hospitality industries across the region. He has more than 15 years of experience in his legal career both in private practice and with multi-national companies based in Singapore and overseas. Before Mr Tan joined Auric Pacific, he was a senior legal counsel with Fraser and Neave, Limited. Mr Tan holds a Master’s of Science degree in risk management, operations and regulations from the University of Reading, United Kingdom. He has a Honour Degree in Law and is a member of Middle Temple (Inns of Court) United Kingdom. He has been called to the Singapore Bar and the Bar of England and Wales, and is a member of the Singapore Academy of Law. Contents Corporate Governance 30 * Risk Management Report 50 * Directors’ Report 52 * Statement by Directors 58 * Independent Auditor’s Report 59 * Consolidated Statement of Comprehensive Income 60 * Balance Sheets 61 * Statements of Changes in Equity 63 * Consolidated Cash Flow Statement 66 * Notes to the Financial Statements 68 30 Auric Pacific Group Limited Annual Report 2014 Auric Pacific Group Limited Annual Report 2014 CORPORATE GOVERNANCE REPORT CORPORATE GOVERNANCE REPORT For the financial year ended 31 December 2014 Board members are experienced and qualified and they collectively set the standard for APGL’s corporate governance policies and practices. The Board oversees the business performance of APGL and its subsidiaries (collectively, the “Group”), provides the entrepreneurial leadership, and sets the strategic direction and performance objectives of the Group. The Board of Directors (the “Board”) of Auric Pacific Group Limited (“APGL”) believes that good corporate governance is essential to maintain sustainable growth and success, and crucial for the protection and the enhancement of the value of investments by shareholders. APGL is committed to high standards of corporate governance in its business and operations, and continually strives to strengthen its corporate transparency through sound corporate policies, business practices and internal controls. APGL’s commitment to high standards of corporate governance is led by the Board, and supported by an experienced, qualified and committed management. APGL is listed on the mainboard of the Singapore Exchange Securities Trading Limited (“SGX-ST”), and adheres to the principles and guidelines under the Code of Corporate Governance and other applicable laws, rules and regulations, including the SGX-ST Listing Manual. APGL has through the course of financial year ended 2013 enhanced its policies, practices and framework to strengthen its corporate governance in line with the implementation of the 2012 Code of Corporate Governance (“2012 Code”) which came into effect on 2 May 2012. In the financial year 2014, these policies have been reviewed to ensure that they continue to be relevant. The Board confirms that it has adhered closely to the principles and guidelines under the 2012 Code, applicable laws, relevant rules and regulations, including but not limited to the SGX-ST listing rules. The Board members include business, operations, financial, accounting and legal professionals, whose experience includes those relevant to the industries and environment in which APGL operates. A profile of each of the Directors, their current directorships in both listed and non-listed companies, chairmanships, past directorships over the preceding 3 years, their principal commitments, backgrounds and qualifications may be found under pages 20 to 27 and 47 to 49. Board Approvals and Delegation of Authority Written guidelines have been adopted by the Board that sets out directions to management on matters that are reserved for the Board’s approval, and these matters principally include: 1) 2) 3) 4) approval of the Group’s policies, strategies and financial objectives; approval of the Group’s internal control and risk management framework; annual budget and major funding requirements of the Group; and any acquisitions and divestments of assets and investments by the Group. This report provides an insight on APGL’s corporate governance framework and practices, in reference to the 2012 Code. The performance and the management of the Group (financial and otherwise), and the Group’s compliance with relevant laws and regulations are monitored by the Board. Board members actively participate, discuss, deliberate and appraise matters requiring its attention and decision, both within scheduled board meetings and through other forms of communication, such discussions, deliberations, appraisement of which at the Board’s discretion, may include members of management. BOARD MATTERS Principle 1: Board’s Conduct of its Affairs Every company should be headed by an effective Board to lead and control the company. The Board is collectively responsible for the long-term success of the company. The Board works with Management to achieve this objective and Management remains accountable to the Board. As at 31 December 2014, the Board composed of eight directors (the “Directors”) of which includes three executive directors and four independent directors. This number has since been reduced to seven as at the date of this report with the resignation of Ms Saw Phaik Hwa with effect from 1 March 2015. The names of the Directors and their executive and independence status are set out below: Name of Director Position and Executive Status Independence Mr Albert Saychuan Cheok Chairman of the Board (“Chairman”) and Non-Executive Director Independent Ms Saw Phaik Hwa(1) Executive Director and Group Chief Executive Officer Non-Independent Dr Stephen Riady Executive Director Non-Independent Dr Lim Boh Soon Lead Independent Director and Non-Executive Director Independent Mr Bryan Chang Yew Chan Non-Executive Director Independent Mr Edwin Neo Non-Executive Director Independent Dr Ronnie Tan Keh Poo Non-Executive Director Non-Independent Dr Andy Adhiwana Executive Director Non-Independent (2) Note: (1) Ms Saw Phaik Hwa has resigned as Executive Director with effect from 1 March 2015 and retires as Group Chief Executive Officer on 30 April 2015. (2) Dr Andy Adhiwana was appointed Executive Director with effect from 1 November 2014. In order for the Board to oversee the various matters of APGL, it delegates specific areas of its responsibility to its three Board committees, which include the Audit and Risk Committee (“ARC”), the Nomination Committee (“NC”) and the Remuneration Committee (“RC” and collectively together with the ARC and the NC, the “Board Committees”). Each Board Committee is governed by clear terms of references approved by the Board and its role is to assist the Board in the matters that the Board delegates to it. The Board is periodically kept informed of the matters under discussion and the proceedings of its Board Committees through reports and periodical updates by the chairman and the secretary of each Board Committee, and as appropriate the Board Committees will make recommendations to the Board. APGL adopts a framework of delegated authorisation (“Delegation of Authority”). The Delegation of Authority document defines the procedures and levels of authorisation required for specified transactions, and sets out the approval limits for operating and capital expenditure, including those that require the approval of the Board. The Delegation of Authority is approved by the Board and facilitates efficiency in operations of the Group. Notwithstanding the Board’s delegation to its Board Committees and the adopted Delegation of Authority, the Board maintains its responsibility on the matters overseen by the Board Committees and management. Meetings of the Board and Board Committees The Board and the ARC meet at least once every financial quarter and as and when required by members of the Board. The NC and RC meet as and when required to assist the Board in its respective roles and to perform the responsibilities that have been delegated to them. For the financial year ended 2014, the Board convened six times, with the ARC convening ten times, and both the NC and RC convening three and two times respectively. As an alternative to physical meetings, teleconference facilities are made available to members of the Board to facilitate directors (“Directors”) participation at Board meetings, a means of communication which is provided for under APGL’s Articles of Association (the “Articles of Association”). 31 32 Auric Pacific Group Limited Annual Report 2014 Auric Pacific Group Limited Annual Report 2014 CORPORATE GOVERNANCE REPORT CORPORATE GOVERNANCE REPORT Directors’ Attendance at Board and Board Committee Meetings Principle 2: Board Composition and Balance (cont’d) The number of Board meetings and Board Committee meetings held during the financial year ended 31 December 2014 and the attendance of Directors at these meetings are as follows: As at the date of the publication of this report, the APGL Board consists of two executive Directors as compared to five nonexecutive directors, and four independent Directors as compared to three non-independent directors, with a total of seven Directors in all which forms the Board. Director’s profile and key information on the Directors may be found at pages 20 to 27, and 47 to 49 of the Annual Report, respectively. Board Meetings held during the financial year ended 31 December 2014 Mr Albert Saychuan Cheok Mr Saw Phaik Hwa(4) Dr Stephen Riady Dr Lim Boh Soon Mr Bryan Chang Yew Chan Mr Edwin Neo Dr Ronnie Tan Keh Poo Dr Andy Adhiwana(1) 6 6/6 6/6 6/6 6/6 6/6 6/6 6/6 1/1 Audit and Risk Committee* Nomination Committee Remuneration Committee 10 3 2 - 2(3) 2/2 - - - 3/3 10/10 3/3 2/2 10/10 3/3 2/2 1(2) - 8/10 - Note: (1) Dr Andy Adhiwana was appointed Executive Director with effect from 1 November 2014. (2) Mr Edwin Neo attended as an invited guest of the Audit and Risk Committee. (3) Mr Albert Saychuan Cheok attended as an invited guest of the Nomination Committee. (4) Ms Saw Phaik Hwa has resigned as Executive Director with effect from 1 March 2015. Development of the Board Upon appointment, new directors to the Group are briefed their duties and obligations, and undergo a comprehensive orientation programme to familiarise such directors with the business activities and structure, strategic direction, policies and corporate governance practices of the Group. The orientation serves to allow new directors to get acquainted with fellow directors, senior management and the Group. As part of the orientation programme, arrangements are made for new directors to attend relevant seminars organized by established institutions, such as the Singapore Institute of Directors, to update new directors on the latest changes in the regulatory environment of which the Group operates. Dr Andy Adhiwana attended the orientation programme arranged by the Group when he was appointed as its executive director on 1 November 2014. Directors are continually and regularly updated on the Group’s businesses, the business environment that the Group operates in, and any relevant legislative and regulatory changes applicable to the Group and its businesses at each meeting of the Board. The NC reviews and recommends the training and development requirements of the Board. During the year, the Board was briefed by external consultants on the Group’s responsibilities in connection with its compliance matters in Hong Kong, taking into consideration that APGL is a subsidiary of various Hong Kong listed companies, such external consultants were appointed by the Board upon the recommendation of the NC. Directors are also encouraged to be members of the Singapore Institute of Directors which provides updates and training relevant to the development of directors. Directors have through the financial year ended 2014 attended various seminars and conferences as part of their individual development, of which are either funded by themselves or with those programmes approved by the NC, through APGL. The Board with the assistance of the NC conducts an annual review of the size and composition of the Board to ensure that both aspects continue to meet the needs of the Group and the Board. When reviewing the size and composition of the Board, the NC takes into consideration various factors, among others, such as, (i) the independence and executive status of the chairman of the Board, (ii) the balance of diversity of skills, experience, gender and knowledge, (iii) balance between executive and non-executive members, (iv) balance between independent and non-independent members, and (v) the presence of a lead independent director, (vi) market benchmarks of listed companies in Singapore. Whilst the Articles of Association allow for the appointment of a maximum of 12 directors, the NC is of the view that its current size and composition is appropriate for the scope and nature of the Group’s businesses and operations, and for facilitating effective discussion and decision-making within the Board. The current size of the Board is in the NC’s view not so large as to be unwieldy, or as would interfere with efficient decision-making. There is a strong and independent element on the Board which is in the NC’s view fundamental to good corporate governance, and no individual or group dominates the Board’s decision-making process. Independent directors make up more than half of the Board’s composition, and nonexecutive directors continue to form the majority of the Board. There are no alternative directors appointed to the Board. The Board with the assistance of the NC is proactive in seeking to maintain an appropriate balance of expertise, skills and attributes among the Directors, and this is reflected in the diversity of backgrounds and the competency of each of the Directors. Such competency includes banking, finance, accounting, legal, relevant industry knowledge, entrepreneurial and management experience, familiarity with relevant regulatory requirements and risk management. This diversity and competency allows management to tap on the broad range of views and perspective and the breadth of experience of its directors. Principle 3: Chairman and Chief Executive Officer There should be a clear division of responsibilities between the leadership of the Board and the executives responsible for managing the company’s business. No one individual should represent a considerable concentration of power. Taking into consideration the retirement of Ms Saw Phaik Hwa, as Group Chief Executive Officer of APGL, the Board, with the assistance of the NC, shall be reviewing potential candidates for the position. Until such time a candidate is found, the executive directors of APGL shall see to the day-to-day matters of APGL in accordance with APGL’s succession plan. The Chairman and the executive directors of APGL are separate persons thereby ensuring that there is an appropriate balance and separation of power and authority, and clear division of responsibilities and accountability. The Chairman who is an independent non-executive director is not related to the executive directors. There is no business relationship between the Chairman and the executive directors, and the Chairman does not hold any shareholding interests in APGL. The role of the Chairman includes: 1) leading the Board and ensuring its effectiveness by steering effective, productive and comprehensive discussions amongst Board members and management on strategic, business and other key issues pertinent to the business and operations of the Group; Principle 2: Board Composition and Balance 2) There should be a strong and independent element on the Board, which is able to exercise objective judgement on corporate affairs independently, in particular, from Management and 10% shareholders. No individual or small group of individuals should be allowed to dominate the Board’s decision making. encouraging active and effective engagement, participation by and contribution from all Directors, and facilitates constructive relations between the Board and management and between members of the Board; 3) with the full support of the Board, the Company Secretary and management, the Chairman heads APGL’s drive to promote, attain and maintain high standards of corporate governance and transparency; 33 34 Auric Pacific Group Limited Annual Report 2014 Auric Pacific Group Limited Annual Report 2014 CORPORATE GOVERNANCE REPORT CORPORATE GOVERNANCE REPORT Principle 3: Chairman and Chief Executive Officer (cont’d) 4) the review of directors’ independence in accordance with the Independence Guidelines (see below); 4) promoting effective communication with shareholders on the performance of the Group; and 5) the implementation of an annual evaluation and assessment of the performance of the Board as a whole and the contribution of each director to the effectiveness and performance of the Board; 5) ensuring that Directors are provided with clear, complete and timely information in order to make sound informed decisions. 6) the determination on whether directors who hold multiple listed Board directorships and principlal commitments are able to and have devoted sufficient time to discharge their responsibilities adequately as required under the 2012 Code. The Board with the assistance of the NC has as part of its annual review, takes into account, among others (i) the contributions by directors to and during meetings of the Board and relevant Board Committees, (ii) the results of the Board evaluation of its performance, and (iii) the directorships and principal commitments of individual directors, and is of the view that requiring a cap on the number of listed company board representations on each of its directors is not required as despite the current directorships and principal commitments of individual directors, the commitment of directors, and their deliberations and decisions, are not hindered by such directorships and commitments; 7) the review and endorsement of all proposed senior management appointments; 8) the review and endorsement of any training and development programs of the Board and its directors; and 9) the review and endorsement of succession plans for Board members, the Group Chief Executive Officer and senior management. In addition to the Chairman, a lead independent director is appointed by the Board to serve in a lead capacity to coordinate the activities of the independent directors. The lead independent director’s role would include assisting the Chairman to ensure effective corporate governance in the management of the affairs of the Board and the Group. The lead independent director is available to shareholders if there are concerns relating to matters which contact through the normal channels to the Chairman is deemed inappropriate by shareholders. Dr Lim Boh Soon, through the appointment of the Board has been appointed the lead independent director of APGL, to hold office for financial years ending 2015 and 2016. The Group CEO bears executive responsibility for implementing the Board’s decision and policies, and oversees APGL’s businesses, and its day-to-day operations through the executive directors of APGL’s business units and the senior management team. The executive directors are accountable to the Board for the conduct and performance of APGL’s businesses and operations. Principle 4: Board Membership There should be a formal and transparent process for the appointment and re-appointment of directors to the Board. The establishment of the NC is mandated by Article 106 of the Articles of Association and consists of the following members: Name of Director Position in the Committee Dr Lim Boh Soon Dr Stephen Riady Mr Bryan Chang Yew Chan Chairman Member Member The NC composes of three directors, the majority of whom are independent. The Chairman of the NC, Dr. Lim Boh Soon, is an independent non-executive director. Dr Lim is also the lead independent director. Article 91 of the Articles of Association requires one third of the Board to retire by rotation at every Annual General Meeting and such retired directors pursuant to Article 91 are eligible for re-election. At the Annual General Meeting of APGL held on 30 April 2014 (the “2014 AGM”), Dr Lim Boh Soon and Mr Edwin Neo were re-elected as directors of APGL. The nomination of both Dr Lim Boh Soon and Mr Edwin Neo were both recommended by the NC and endorsed by the Board for re-election by shareholders at the 2014 AGM. Nomination of Directors The Board, with the assistance of the NC, has since 15 May 2009 endorsed a framework by which it would apply to the review of all new and existing directors, prior to their nomination for election or re-election. The framework (the “Nomination Framework”) includes, but not limited to, a review of: 1) the candidate’s qualifications, experience and reputation; The NC is guided by written terms of reference endorsed by the Board and which sets out its duties and responsibilities. The principal function of the NC is to assist the Board in the following areas: 2) the size and composition of the Board; 1) the review and recommendation to the Board on all Board appointments, including any recommendations on the structure, size and composition of the Board taking into consideration the balance between executive and nonexecutive directors and between independent and non-independent directors and other relevant considerations; 3) the performance and effectiveness of the Board (taking into consideration the annual performance evaluation of the Board, among other relevant assessments) with a view to determine how the nominated candidate would assist to contribute towards increasing the performance and effectiveness of the Board; and 2) leads the process for the search, identification, evaluation and selection of suitable candidates for new directorships (both executive and non-executive) taking into consideration the skills, knowledge and experience required by the Board to discharge its responsibilities effectively and the needs and requirements of the Group. In this respect, the NC would appoint executive search professionals and consider recommendations and referrals from the industry, to identify potential nominees. A rigorous interview process involving the NC and the Board shall take place prior to any appointment; 4) the skills, expertise and experience of the nominated candidate with a view to determine whether the candidate’s appointment would benefit APGL and the deliberations and decisions of the Board. 3) the review and recommendation to the Board on the proposed objective performance criteria to be adopted by the Board; A combination of public searches, background checks and interviews will be conducted to assist the Board and the NC in their deliberation, before coming to a decision in recommending any nomination of candidates for election or re-election. Dr Stephen Riady, Mr Bryan Chang and Dr Andy Adhiwana, who have been proposed for re-election as directors at the forthcoming 2015 AGM have been reviewed by the NC in accordance with the Nomination Framework, and following such review approved by the Board and endorsed by the NC for re-election. 35 36 Auric Pacific Group Limited Annual Report 2014 Auric Pacific Group Limited Annual Report 2014 CORPORATE GOVERNANCE REPORT CORPORATE GOVERNANCE REPORT Principle 4: Board Membership (cont’d) Principle 5: Board Performance Independence of Directors There should be a formal annual assessment of the effectiveness of the Board as a whole and its board committees and the contribution by each director to the effectiveness of the Board. The independence of each director is reviewed annually by the NC based on guidelines of independence which incorporates the guidelines under the 2012 Code. The review of each director’s independence by the NC takes into consideration the following: 1) the independence guidelines under the 2012 Code; 2) the written declarations of independence by each director, which is made annually; 3) the relationship (if any) between the director and APGL or its subsidiaries, through his interests in shareholdings, contractual relations or otherwise; 4) the relationship (if any) between the director and shareholders of APGL, through his interests in shareholdings, contractual relations or otherwise; 5) the director’s conduct and objectivity in the discussion of matters before the Board and relevant Board committees; and 6) the interests of the director as disclosed throughout the relevant financial year, (collectively, the “Independence Framework”). The NC has in relation to the financial year ended 31 December 2014 and that ending 31 December 2015 carried out the review of independence of the directors in accordance with the Independence Framework, and following such review has determined the independence status of the directors to be as follows: The Board with the assistance of the NC has established and implemented a formal process for evaluating and assessing the effectiveness of the Board as a whole and the contributions by each director to the effectiveness and performance of the Board. This evaluation and assessment exercise is carried out annually. If required, independent external consultants are engaged to facilitate the evaluation. The Board’s evaluation and assessment covers areas such as Board Composition, Board Information, Board Process, Internal Controls and Risk Management, Board Accountability, the Board’s relationship with the Group CEO and Standards of Conduct. Each director evaluates and assesses the Board and their individual performance, the results of which are consolidated, analysed and discussed within the NC, which includes a comparison with the results of the preceding financial year. As part of the evaluation carried out by the Board, members of the Board considered whether fellow members are able to and have adequately carried out their duties as directors of APGL especially when directors have multiple board representations and principal commitments. The results are reported to the Board and areas to be strengthened are identified and led by the Chairman of the Board, acted upon by the directors. The NC reviewed the evaluation and assessment criteria and process in financial year 2014, whereupon the criteria and process were updated to ensure that the same are up to date and meet the requirements of the Board and the 2012 Code. The revised criteria and process allows the Board to make comparisons with industry peers. The updated criterion following the latest review has been adopted by the Board. Based on the evaluation and assessment carried out by the NC on the Board and each director for the financial year ended 31 December 2014, it is the Board’s collective view that the Board and the Board Committees have operated effectively and each director is contributing to the overall effectiveness of the Board. Name of Director Independence Principle 6: Access to Information Mr Albert Saychuan Cheok Ms Saw Phaik Hwa(1) Dr Stephen Riady Dr Lim Boh Soon Mr Bryan Chang Yew Chan Mr Edwin Neo Dr Ronnie Tan Keh Poo Dr Andy Adhiwana(2) Independent Non-Independent Non-Independent Independent Independent Independent Non-Independent Non-Independent In order to fulfil their responsibilities, directors should be provided with complete, adequate and timely information prior to board meetings and on an on-going basis so as to enable them to make informed decisions to discharge their duties and responsibilities. Note: (1) Ms Saw Phaik Hwa has resigned as Executive Director with effect from 1 March 2015. (2) Dr Andy Adhiwana was appointed Executive Director with effect from 1 November 2014. Taking into consideration that Mr. Albert Saychuan Cheok has served on the APGL Board for more than nine years, the NC has further reviewed Mr Cheok’s independence and has determined that Mr Cheok has maintained his independence in accordance with the Independence Guidelines and has contributed significantly to the discussion on matters before the Board, which includes matters relating to the strategic direction and corporate governance of APGL. Mr Cheok’s independence and objective leadership of the Board, his depth of experience and skill, makes him an invaluable member of the Board. Management prepares and provides the Board with detailed Board papers specifying relevant information and commercial rationale for each proposal for which Board approval is sought. Such information includes relevant financial forecasts, risk analysis, mitigation strategies, feasibility studies and key commercial issues for the Board’s attention and consideration. Reports on major operational matters, business development and activities, financial performance, potential investment opportunities and budgets are also circulated to the Board for approval. Directors are provided with accurate, complete and timely information by management, facilitated by the Company Secretary. Board papers on matters to be discussed by the Board and Board Committees are circulated to directors not less than one week before the relevant meeting to allow for the Board time to review and consider the papers and documents. As and when required by directors, documents and information are provided by management to the Board. Board activities are scheduled prior to the commencement of each year. The Company Secretary attends all Board meetings, ensures that Board procedures are complied with, and provides advice and guidance on corporate governance, legal and regulatory compliance matters. The Company Secretary is further appointed the secretary of the Board Committees in accordance with their respective terms of reference. Under the direction of the Chairman (and where relevant the chairpersons of each Board Committee), the Company Secretary facilitates and acts as a channel of communication between management and members of the Board thereby ensuring a smooth flow of information. The Company Secretary is the primary channel of communication with the Stock Exchange of Singapore and relevant regulatory authorities. 37 38 Auric Pacific Group Limited Annual Report 2014 Auric Pacific Group Limited Annual Report 2014 CORPORATE GOVERNANCE REPORT CORPORATE GOVERNANCE REPORT Principle 6: Access to Information (cont’d) Principle 9: Disclosure on remuneration (cont’d) Members of the Board have direct and unrestricted access to management and the Company Secretary. Members of management are invited to attend both Board and Board Committee meetings as and when required to facilitate discussions on the issues deliberated on and to respond and clarify any queries the Board may have. Presentations are made by management periodically to update the Board and the Board Committees on the business and projects undertaken by the Group. 3) reviews and recommends for endorsement of the Board the annual fees payable to directors; and 4) reviews and recommends for endorsement of the Board the annual discretionary bonus and increments of the Group taking into consideration the performance of the Group. The Board may at APGL’s expense seek and obtain independent professional advice where necessary to discharge its duties effectively. REMUNERATION MATTERS Principle 7: Procedures for Developing Remuneration Policies There should be a formal and transparent procedure for developing policy on executive remuneration and for fixing the remuneration packages of individual directors. No director should be involved in deciding his own remuneration. Principle 8: Level and Mix of Remuneration The level and structure of remuneration should be aligned with the long-term interest and risk policies of the company, and should be appropriate to attract, retain and motivate (a) the directors to provide good stewardship of the company, and (b) key management personnel to successfully manage the company. However, companies should avoid paying more than is necessary for this purpose. Principle 9: Disclosure on remuneration Every company should provide clear disclosure of its remuneration policies, level and mix of remuneration, and the procedure for setting remuneration, in the company’s Annual Report. It should provide disclosure in relation to its remuneration policies to enable investors to understand the link between remuneration paid to directors and key management personnel, and performance. The RC consists of the following non-executive independent directors: Name of Director Position in the Committee Mr Albert Saychuan Cheok Dr Lim Boh Soon Mr Bryan Chang Yew Chan Chairman Member Member The RC composes of three directors, all of whom are independent. The Chairman of the RC is Mr Albert Saychuan Cheok, Chairman of the Board and an independent non-executive director. The RC is guided by written terms of reference endorsed by the Board and which sets out its duties and responsibilities. The principal function of the RC is to assist the Board in the following areas: 1) the establishment of a formal and transparent process for developing the remuneration framework and policies applicable to the directors, senior management and executives of the Group, such process, framework and relevant policies, as endorsed by the RC, and recommended to the Board for approval; 2) determines the remuneration package and service terms of individual directors, the Group CEO, the Chief Financial Officer, the Chief Executive Officer of each of the Group’s business units and the Group’s Legal Counsel and Company Secretary. The RC reviews the remuneration packages and service terms of other senior managers of the Group; The RC reviews and approves the performance targets of the Group CEO and the senior managers of the Group, and evaluates their performances periodically. For financial year ended 2014, the remuneration package of the Group CEO and relevant senior managers of the Group includes performance related long-term incentive schemes have been reviewed. As at the date of this report, there are no long-term and short term schemes applicable to the Group CEO and relevant senior manager of the Group. In recommending to the Board the remuneration policy to be adopted, together with the level and mix of remuneration of directors and senior managers, the RC’s objective is to draw, build, motivate and retain high performing directors and senior managers, to ensure that the Group’s businesses grow sustainably, efficiently and profitably. In its deliberation, the RC takes into consideration relevant industry practices and benchmarks. The RC may from time to time, and where necessary, seek advice from external consultants in framing the remuneration framework and policy of directors and senior management, and determining the level and mix of remuneration. Mercer (Singapore) Pte. Ltd. (“Remuneration Consultants”), remuneration consultants, were appointed during the financial year ended 31 December 2013, to advise the RC on the adequacy of the remuneration policies of senior management and employees of the Group, and the level and mix of remuneration that the Group should adopt taking into consideration the objectives of the Group and the nature of the Group’s businesses. The Remuneration Consultants updated the RC on the current industry practices and provided a comparison between the Group’s remuneration policies against relevant industry benchmarks to ensure that the Group’s remuneration policies remain competitive. The Remuneration Consultants do not have any relationship with the Group that would affect its independence and objectivity. Taking into consideration that the review by the Remuneration Consultants took place in financial year ended 31 December 2013, no review was carried out for financial year ended 31 December 2014. The Group’s compensation framework for employees of the Group other than senior managers composes of fixed remuneration, performance bonuses, allowances and benefits. The performance bonus component and long term incentives are both linked to the Group and individual’s performance. An appraisal of such employees within the Group is conducted annually, their performance assessed, and bonuses and increments are decided based on such assessment. Remuneration of Non-Executive Directors Remuneration of Non-Executive Directors for Financial Year ended 31 December 2014 Directors Fees(1) Mr Albert Saychuan Cheok $166,000 Dr Lim Boh Soon $122,000 Mr Bryan Chang Yew Chan $122,000 Dr Ronnie Tan Keh Poo $85,000 Mr Edwin Neo $68,000 Notes: Directors fees of non-executive directors are paid by APGL annually. All directors’ fees paid by APGL is subject to the approval by shareholders at the Annual General Meeting. (1) 39 40 Auric Pacific Group Limited Annual Report 2014 Auric Pacific Group Limited Annual Report 2014 CORPORATE GOVERNANCE REPORT CORPORATE GOVERNANCE REPORT Principle 9: Disclosure on remuneration (cont’d) Principle 9: Disclosure on remuneration (cont’d) The RC takes into account the contribution and responsibilities, including the attendance and time spent at Board meetings and Board Committee meetings, when it determines the remuneration of all directors. Directors are paid a basic fee and attendance fees for attending Board meetings and Board Committee meetings. The Chairman and the lead independent director are paid additional fees for their role and responsibility. Directors do not decide on their own fees and the directors’ fee structure is reviewed periodically by the RC. Following a review undertaken in the financial year ended 31 December 2013, a review shall be carried out by the RC during the financial year ending 2015, which is every two (2) years in accordance with the review policy adopted by the Board. Remuneration of Senior Management For the financial year ended 31 December 2014, the fees for non-executive directors composed of a basic retainer fee, additional fees for specific appointments on Board and Board Committees, and attendance fees for Board and Board Committee meetings. Both short-term performance bonuses and long-term incentives serve to encourage the delivery of sustainable growth and shareholder value. Allowances and benefits are commensurate with local market practice. Long-term incentives include lump sum bonuses paid upon the Group meeting short-term and long-term targets over a fixed period of time. The Group does not implement any share option schemes as part of its long-term incentive strategy. Directors’ fees are subject to the approval of shareholders at an Annual General Meeting and are paid annually upon such approval. Non-executive directors have no service contracts as the Articles of Association govern the terms of directors appointment. There are no employees who are immediate family members of the Directors and the Group CEO whose aggregate remuneration is more than S$50,000 for the financial year ended 2014. There are no termination, retirement and post-employment benefits granted to non-executive directors and the Group does not adopt any retirement benefit and share based compensation schemes. For the financial year ended 2014, no such termination, retirement and post-employment benefits were paid to non-executive directors. Remuneration of Executive Directors The remuneration and terms of appointment of Ms Saw Phaik Hwa, Dr Stephen Riady and Dr Andy Adhiwana, executive directors of the Board, have been individually negotiated and endorsed by the Board pursuant to the recommendation of the RC. The aggregate remuneration received by executive directors amounts to S$1,435,880 for the financial year ended 2014, which includes a fixed salary, bonuses, allowances and other benefits. Any renewals of their respective employment are subject to the review of the NC and the approval of the Board. Executive directors do not receive director’s fees in connection with their appointment as directors to the Board. The aggregate remuneration of each executive director and a breakdown in percentage of such remuneration is set out below: Remuneration of Executive Directors for Financial Year ended 31 December 2014 Aggregate Remuneration Ms Saw Phaik Hwa Dr Stephen Riady Dr Andy Adhiwana (2) S$1,148,710 S$184,535 S$102,635 Salary(1) Bonus Allowances and Benefits Total 62.42% 79.47% 87.69% 31.21% - 7.31% 6.37% 20.53% 5.00% 100% 100% 100% Notes: (1) Excludes fixed allowances but includes CPF contributions. (2) Ms Saw Phaik Hwa has resigned as executive director with effect from 1 March 2015. There was no termination, retirement and post-employment benefits granted and paid to Ms Saw upon her resignation as Executive Director. For the financial year ended 2014, no termination, retirement and post-employment benefits were paid to the executive directors. The appointment of each executive director is contractual and each term of appointment does not exceed three years. Upon the completion of each term, the NC reviews the appointment in accordance with the Nomination Framework. The Group’s compensation framework for senior management composes of fixed remuneration, performance bonuses, allowances and benefits, and long term incentives. The performance bonus component and long-term incentives are both linked to the Group and individual’s performance. An annual appraisal of senior managers is carried out annually and their performance is assessed based on individual key performance indicators and targets of the Group. Performance bonuses and long-term incentives are decided based on such assessment. There are no termination, retirement and post-employment benefits granted to executive directors and senior management of the Group. For the financial year ended 2014, no such termination, retirement and post-employment benefits were paid. The Group does not adopt any retirement benefit and share based compensation schemes for executive directors and senior management, which includes the top five key executives listed below. The top key executives, excluding the Group CEO, Dr Stephen Riady and Dr Andy Adhiwana, are (i) Mr Tan Kai Teck, Group Chief Financial Officer, (ii) Ms Dora Chong, Chief Executive Officer - Food Group, (iii) Ms Michelle Lim, Chief Creative Officer, (iv) Mr Ho Shau Foong, Chief Manufacturing Officer, and (v) Mr Tan T’eng Ta’ Benedict, Group Legal Counsel and Company Secretary. Their aggregate total remuneration for the financial year ended 2014 is S$1,526,385, and a breakdown in percentage of each executive’s remuneration is set out below: Salary(1) Bonus Between $250,000 to S$500,000 Ms Dora Chong Lee Buay Mr Tan Kai Teck Ms Michelle Lim Mr Tan T’eng Ta’ Benedict 66.77% 77.52% 64.78% 66.10% 20.79% 6.60% 20.17% 17.54% Allowances and Benefits Total 12.44% 15.87% 15.04% 16.36% 100% 100% 100% 100% Below S$250,000 Mr Ho Shau Foong(2) 75.46% 6.09% 18.45% 100% Notes: (1) Excludes fixed allowances but includes CPF contributions. (2) Mr Ho Shau Foong was appointed as Chief Manufacturing Officer on 24 March 2014. ACCOUNTABILITY AND AUDIT Principle 10: Accountability The Board should present a balanced and understandable assessment of the company’s performance, position and prospects. APGL prepares its financial statements in accordance with the Singapore Financial Reporting Standards (“SFRS”) prescribed by the Accounting Standards Council of Singapore. The Board provides shareholders with quarterly and annual financial reports released through announcements with SGX-ST and where appropriate. In any communication of financial results, the Group aims to present a balanced and clear assessment of the Group’s performance, position and prospects. 41 42 Auric Pacific Group Limited Annual Report 2014 Auric Pacific Group Limited Annual Report 2014 CORPORATE GOVERNANCE REPORT CORPORATE GOVERNANCE REPORT ACCOUNTABILITY AND AUDIT (CONT’D) Principle 12: Audit Committee (cont’d) Principle 11: Risk Management and Internal Controls 8) The Board is responsible for the governance of risk. The Board should ensure that Management maintains a sound system of risk management and internal controls to safeguard shareholders’ interests and the company’s assets, and should determine the nature and extent of the significant risks which the Board is willing to take in achieving its strategic objectives. reviews and evaluates external and internal audit reports, including any recommendations by auditors and responses to those recommendations; 9) review whistle-blowing investigations within the Group and ensuring appropriate follow-up in accordance with the Group’s whistle-blowing policy; Principle 12: Audit Committee 10) reports any material matters, findings and recommendations to the Board. The Board should establish an Audit Committee (“AC”) with written terms of reference which clearly set out its authority and duties. The Group maintains a sound internal control and risk management system with a view to safeguard its assets and shareholder investment led by the Board with the assistance of the ARC. The ARC consists of the following non-executive directors: Name of Director Position in the Committee Mr Bryan Chang Yew Chan Dr Lim Boh Soon Dr Ronnie Tan Keh Poo Chairman Member Member The ARC composes of three directors, of whom Mr Bryan Chang Yew Chan and Dr Lim Boh Soon are independent. The Chairman of the ARC is Mr Bryan Chang Yew Chan, an independent non-executive director, who has a Degree in Accountancy, and is a fellow member of the Institute of Singapore Chartered Accountants and the Certified Public Accountants of Australia. The collective wealth of expertise and experience on accounting and financial management of members of the ARC allows the ARC to discharge its function effectively. The NC is of the view that members of the ARC are appropriately qualified and have such relevant financial management expertise and experience. The ARC is guided by written terms of reference endorsed by the Board and which sets out its duties and responsibilities. The principal function of the ARC is to assist the Board in the following areas: 1) reviews and recommends for approval of the Board the quarterly and full-year financial results and related announcement(s) to be released on SGX-ST; 2) assist the Board to oversee the internal controls and risk management framework, policies and processes of the Group, including carrying out periodical evaluations of the framework, policies and processes; 3) reviews the Group’s strategy, policies, ERM framework, processes and procedures for identifying, measuring, reporting and mitigating key risks in the Group’s businesses and operations; 4) provides guidance to management and renders assistance to the Board to determine the nature and extent of significant risks, which the Board would be willing to take in achieving the Group’s strategic objectives; 5) recommends to the Board for approval the appointment, reappointment or removal of internal and external auditors, including their remuneration and terms of engagement; 6) reviews the adequacy and effectiveness of appointed internal auditors, including the adequacy of internal audit resources; 7) reviews and evaluates the audit plans proposed by the external and internal auditors, including the scope of such plans; The ARC through the assistance of internal and external auditors, reviews and reports to the Board on the adequacy of the Group’s system of controls established by management, including financial, operational and compliance controls. In assessing the effectiveness of internal controls, the ARC ensures primarily that key objectives are met, material assets are properly safeguarded, fraud or errors in the accounting records are prevented or detected, accounting records are accurate and complete, and reliable financial information is prepared in compliance with applicable internal policies, laws and regulations. Following the nomination of the ARC to assist the Board in its risk management role, the ARC reviews the adequacy of the Group’s risk management framework to ensure that a robust risk management framework is in place. The ARC, assisted by external consultants, has commenced putting in place an enterprise risk management (“ERM”) framework to enhance its risk management capabilities. Key risks, mitigating measure and management actions have been identified, reviewed and monitored as part of the ERM implementation process. A detailed report on the risk management framework is set out within the risk management report found at page 50. External Auditors The ARC conducted an annual review of the scope and results of audit by Ernst & Young LLP (“EY”), the incumbent external auditors, its cost effectiveness, as well as the independence and objectivity of EY, as external auditors for the financial year ended 2014. It also reviewed all non-audit services provided by EY, and the aggregate amount of audit fees paid to them in connection with such non-audit services, as tax consultants. Following such review, the total non-audit fees paid to EY and its related entities for financial year ended 2014 is on the average less than 26% of the total fees paid to EY and its related entities, in their capacity as external auditors. In reviewing EY’s independence, the ARC took into consideration, among others (i) EY’s written confirmation of independence, (ii) that EY has not performed any services in connection with APGL and its subsidiaries that would result in EY function in the role of management, auditing its own work or serving in advocacy roles for APGL and its subsidiaries (other than advocacy roles relating to tax representations), (iii) the non-audit services rendered by EY and its related entities for financial year ended 2014, and (iv) the non-audit fees paid to EY for financial year ended 2014 as compared to the audit fees. Following such review, the ARC is satisfied that neither the independence nor the objectivity of external auditors is put at risk, and that external auditors are still able to meet the audit requirements and statutory obligations of the Group. In recommending the re-appointment of the external auditors, the ARC has further taken into consideration the adequacy of resources, the experience of the supervising partner and his team that has been assigned to the audit of the Group, and the size of complexity of the Group, its businesses and operations. Following its review, the ARC is confident that EY will be able to carry out its function as external auditors of the Group for financial year ending 2015. Meeting with Internal and External Auditors The ARC meets with both internal and external auditors without the presence of management at least once a year to discuss and review the competency and adequacy of the finance function, to ascertain any material weaknesses or control deficiencies in the Group’s financial reporting and operational systems. 43 44 Auric Pacific Group Limited Annual Report 2014 Auric Pacific Group Limited Annual Report 2014 CORPORATE GOVERNANCE REPORT CORPORATE GOVERNANCE REPORT Principle 12: Audit Committee (cont’d) Principle 13: Internal Audit (cont’d) Whistle-blowing Policy The ARC has in its endorsement to appoint RSM Ethos taken into consideration the resources, the qualifications and experience of the persons undertaking the service to the Group under RSM Ethos, the fees and standing of RSM Ethos in its appointment as internal auditors of the Group. The ARC shall continue to review and monitor the adequacy and effectiveness of RSM Ethos throughout its term of appointment. The ARC is of the view that RSM Ethos has adequate resource and appropriate standing within the Group to perform its function effectively. RSM Ethos reports directly to the Chairman of the ARC. The Group has within the financial year ended 31 December 2013 reviewed and updated its whistle-blowing policy. The policy provides an independent feedback channel through which matters of concern about possible improprieties in matters of financial reporting or other matters may be raised by employees and external parties in confidence and in good faith. The salient terms of the policy and the contract details under the policy may be found on APGL’s website. The policy does not disregard anonymous complaints and all complaints are investigated in accordance with the terms of the policy. Adequacy of Internal Controls and Risk Management Systems The Board has adopted an assurance framework to determine the adequacy and effectiveness of internal controls which includes, (i) the appointment of the ARC to assist the Board in overseeing the internal controls and risk management of the Group, (ii) the appointment of internal and external auditors, (iii) periodical reports and assurances from relevant senior managers, (iv) the adoption of a risk management policy, (v) the adoption of an establishment of an enterprise risk management framework and (vi) the adoption of industry wide certified risk monitoring methodology. The Group CEO, Group CFO and the Group Legal Counsel have in connection with the assurance framework each given their written assurance: (a) that the financial records have been properly maintained and the financial statements give a true and fair view of APGL’s operations and finances; and (b) the system of risk management and internal controls in place within APGL is adequate and effective in addressing the material risks in APGL in its current business environment, including material, financial, operational, compliance and information technology risks. Based on the internal controls established and maintained by the APGL Group, work performed by internal and external auditors in accordance with agreed audit plans, and reviews performed by management and various Board Committees with the assistance of external consultants, the implementation of relevant procedures and policies with the assistance of relevant technology, the Board, with the concurrence of the ARC, is of the opinion that the APGL Group’s internal controls are adequate to address financial, operational, compliance risks and information technology, which the Group considers relevant and material to its operations. The Board notes that (i) the system of internal controls and risk management provides reasonable, but not absolute, assurance that the Group will not be adversely affected by an event that could be reasonably foreseen as it strives to achieve its business objectives, and (ii) no system of internal controls and risk management can provide absolute assurance in this regard, or absolute assurance against the occurrence of material errors, poor judgment in decisionmaking, human error, losses, fraud or other irregularities. Principle 13: Internal Audit The company should establish an effective internal audit function that is adequately resourced and independent of the activities it audits. To ensure that internal audit function meets the requirement of the Group, the ARC has endorsed the outsource of the internal audit function to RSM Ethos Pte Ltd (“RSM Ethos”) for the financial year ended 31 December 2014. The internal auditors report directly to the ARC on audit matters and in carrying out its internal audit functions, has adopted the Standards for Professional Practice of Internal Auditing set by The Institute of Internal Auditors. During the financial year ended 31 December 2014, RSM Ethos conducted its audit reviews based on ARC approved internal audit plans. All audit reports detailing audit findings and recommendations are provided to management who would respond on the actions to be taken. In accordance with the approved audit plan, audit reports are submitted to RSM Ethos and discussed at relevant ARC meetings, such reports of which include a status of the audit plan, audit findings, recommendations of RSM Ethos, the risk ratings of each finding and actions taken by management. The ARC monitors the timely and proper implementation of required corrective, preventive or improvement measures. SHAREHOLDER RIGHTS AND RESPONSIBILITIES Principle 14: Shareholders Rights Companies should treat all shareholders fairly and equitably, and should recognise, protect and facilitate the exercise of shareholders’ rights, and continually review and update such governance arrangements Principle 15: Communication with Shareholders Companies should actively engage their shareholders and put in place an investor relations policy to promote regular, effective and fair communication with shareholders. Principle 16: Conduct of Shareholder Meetings Companies should encourage greater shareholder participation at general meetings of shareholders, and allow shareholders the opportunity to communicate their views on various matters affecting the company. The Group believes in treating shareholders fairly and equitably and it continues to make efforts to keep shareholders and other stakeholders informed timely and consistently of the Group’s corporate activities, including any changes in the Group or its businesses that is likely to materially affect the price or value of its shares. APGL has an officer who is available to communicate with its investors and attends to their queries. Shareholders are encouraged to participate effectively and vote at general meetings of APGL. The Board believes that general meetings serve as an opportunity for shareholders to meet members of the Board and senior management, to foster a better understanding of the Group’s businesses. Board members, senior management and external auditors are present at such meetings to respond to any questions from shareholders. External auditors are also present to address queries about the conduct of audit and the preparation and content of the audtor’s report. The Articles of Association allows all shareholders the right to appoint up to two proxies to attend and vote on their behalf at shareholders meetings. A copy of the annual report and notice of AGM are sent to all shareholders. Separate resolutions are proposed on each substantial separate issue at the meeting. Relevant rules and procedures governing such meetings are clearly communicated. 45 46 Auric Pacific Group Limited Annual Report 2014 Auric Pacific Group Limited Annual Report 2014 CORPORATE GOVERNANCE REPORT CORPORATE GOVERNANCE REPORT Principle 16: Conduct of Shareholder Meetings (cont’d) Board of Directors Dealings in Securities Mr Albert Saychuan Cheok The Group observes and complies with the SGX-ST Listing Rules on dealing in securities. Following the recommendation of the ARC, the Board has within the financial year ended 31 December 2014 adopted a dealings policy that applies to APGL. Pursuant to the terms of the Policy, clear guidelines that applies to directors, officers and relevant employees of the Group have been documented, guidelines that follow the provisions under the SGX-ST Listing Rules. As part of its guidelines, directors and employees of the Group are not to deal in the Group’s listed securities during the period commencing two weeks before the announcement of the Group’s quarterly results, and one month before the announcement of its full year financial results, and ending on the date of such announcements. Directors, officers and employees are not to trade in listed securities of the Group at any time while in possession of unpublished price sensitive information and to retain from dealing with the Group’s listed securities on short-term consideration. In accordance with listing rule 1207(19) of the SGX-ST Listing Rules, the Group issues quarterly reminders to its directors, officers and employees on such restrictions in dealings in listed securities of the Group. Compliance to the policy is monitored by the Company Secretary and any dealings by directors, officers and employees in breach of the policy is reported to the ARC quarterly. Interested Person Transactions Policy The Group has adopted an internal policy in relation to transactions with interested persons which sets out the framework (“IPT Framework”) for the notification to and the approval by the ARC of interested person transactions (“IPT”). The aggregate value of IPTs entered into during the financial year under review under Chapter 9 of the SGX-ST Listing Rules were as follows: Name of Interested Person OUE Limited Lippo Realty (Shanghai) Limited Serene Yield Limited Aggregate value of all IPTs during the financial year under review (excluding transactions less than $100,000 and transactions conducted under shareholders’ mandate pursuant to Rule 920) $230,173 $368,655 $3,344,675 Aggregate value of all IPTs conducted during the financial year under review under shareholders’ mandate pursuant to Rule 920 (excluding transactions less than $100,000) Not Applicable Not Applicable Not Applicable The Group has established the IPT Framework to ensure that IPT transactions with related parties are undertaken on an arm’s length basis, on normal commercial terms consistent with the Group’s usual business practices and policies and on terms which are generally no more favourable to than those extended to unrelated third parties. APGL shall be seeking the approval of its shareholders for a general mandate under Chapter 9 of the listing rules of SGX-ST from its shareholders on 29 April 2015 to enable APGL, its subsidiaries and its associated companies to enter into various transactions subject to the conditions of the mandate. APGL maintains a register of all transactions carried out by the Group with interested persons. On a quarterly basis, the ARC reviews all recorded IPTs entered into by the Group, and the basis of such transactions. The ARC shall review the IPT as part of its standard procedures while examining the adequacy of the Group’s internal controls. Material Contracts Save for what has been disclosed in this report, there are no material contracts of the Group involving the interests of each director, the Group CEO or controlling shareholder, either for the financial year ended 31 December 2014 or entered into since the end of the previous financial year. Academic & Professional Qualification(s): • First Class Honours In Economics, University of Adelaide • Fellow of Australian Institute of Certified Public Accountants • Vice Governor of the Board of Governors of the Malaysian Institute of Corporate Governance Present Directorships (as at 31 December 2014) Listed Companies • Amplefield Limited • Adavale Resources Limited • Metal Reclamation Berhad • HongKong Chinese Limited • Macau Chinese Bank Limited • AcrossAsia Ltd • International Standard Resources Holdings Limited Others • Bowsprit Capital Corporation Limited • LMIRT Management Ltd. Principal Commitments: Nil Past directorships held over the preceding three years (From 1 January 2012 to 31 December 2014) • Export and Industry Bank of the Philippines (Vice Chairman) Others (including experience) • Previously Advisor of Australian Government Inquiry • Previously Chief Manager of Reserve Bank of Australia • Previously Deputy Commissioner of Banking of Hong Kong • Previously Executive Director (in charge of banking supervision) of Hong Kong Monetary Authority • Previously Chairman of Bangkok Bank Berhad Dr Stephen Riady Academic & Professional Qualification(s): • Bachelor Degree of Business Administration, University of Southern California • Master Degree of Business Administration, Golden Gate University • Honorary Degree of Doctor of Business Administration, Edinburgh Napier University • Honorary University Fellow, Hong Kong Baptist University Present Directorships (as at 31 December 2014) Listed Companies • Hongkong Chinese Limited (Executive Chairman) • Lippo China Resources Limited (Executive Chairman) • Lippo Limited (Executive Chairman) • OUE Limited (Executive Chairman) Others Nil Principal Commitments: • University of Hong Kong Foundation for Education Development and Research (Founding Honorary Advisor) • The Better Hong Kong Foundation (Member of the Board of Trustees) • Advisory Council of One Country Two Systems Research Institute (Member) • Advisory Board of Sloan School of Management of Massachusetts Institute of Technology (Member) • Duke of Edinburgh’s Award World Fellowship (Fellow) • The Incorporated Trustees of Volunteer Service Trust (Patron and Trustee) Past directorships held over the preceding three years (From 1 January 2012 to 31 December 2014) • Dhillon Investment Limited (NonExecutive Chairman) • Ranktop International Limited (Non-Executive Chairman) • Tecwell Limited (Non-Executive Chairman) Others (including experience): Nil Dr Andy Adhiwana Academic & Professional Qualification(s): • Bachelor of Medicine and Bachelor of Surgery, Heidelberg University • Doctorate in Medicine, Heidelberg University • “Dr. med.” title with cum laude, Heidelberg University • Masters of Business Administration, National University of Singapore Present Directorships (as at 31 December 2014) Listed Companies Nil Others Nil Principal Commitments: Nil Past directorships held over the preceding three years (From 1 January 2012 to 31 December 2014): Nil Others (including experience): Nil 47 48 Auric Pacific Group Limited Annual Report 2014 Auric Pacific Group Limited Annual Report 2014 CORPORATE GOVERNANCE REPORT CORPORATE GOVERNANCE REPORT Board of Directors (cont’d) Board of Directors (cont’d) Ms Saw Phaik Hwa Academic & Professional Qualification(s): • Second Upper Class Honours In Biochemistry, University of Singapore • Advanced Management Programme, University of Hawaii Present Directorships (as at 31 December 2014) Listed Companies The Hour Glass Limited Others • The Esplanade Co Ltd Principal Commitments: • TTSH Community Fund Ltd. • Singapore Management University (Member of Board of Trustees) • International Wu Style Tai Chi Chuan Federation • (Vice President of Executive Committee) • Wu’s Tai Chi Chuan Academy (Governor) • Singapore Jian Chuan Tai Chi Chuan Physical Culture Association (President) • Singapore Wushu Dragon & Lion Dance Federation (First Vice Chairman) Past directorships held over the preceding three years (From 1 January 2012 to 31 December 2014) • SMRT Corporation Ltd Others (including experience): • Youth Business Singapore (Board of Trustees) • Vision 2030 Steering Committee (Member) • National Environment Agency (Member of BOD) • Health Promotion Board (Board Member) • Tan Tock Seng Hospital Community Charity Fund (Member of Board of Trustees) Mr Bryan Chang Yew Chan Academic & Professional Qualification(s): • Bachelor Degree In Accountancy, National University of Singapore • Fellow Member of the Institute of Singapore Chartered Accountants • Fellow Member of The Certified Public Accountants Australia Present Directorships (as at 31 December 2014) Listed Companies Nil Others: • Shin Yang Services Pte. Ltd. • Tasmania Pte Ltd • Espial Enterprises Ltd • Vision Classic Holdings Ltd • Rebecca Enterprises Ltd • Sumisho & Mitsuibussan Kenzai Ltd • Shin Yang Group Limited • Atlantic Capital Group Ltd • Juno Shipping Ltd • Toucan Land Ltd • Toucan Buddy Ltd Principal Commitments: Nil Past directorships held over the preceding three years (From 1 January 2012 to 31 December 2014) Nil Others (including experience): Nil Dr Lim Boh Soon Academic & Professional Qualification(s): • Bachelor of Science In Mechanical Engineering, University of Strathclyde • PhD In Mechanical Engineering, University of Strathclyde • Diploma In Marketing Management, Singapore Institute of Management • Diploma In Marketing Management, Chartered Institute of Management, United Kingdom Present Directorships (as at 31 December 2014) Listed Companies • CSE Global Limited • SMTrack Bhd. • AcrossAsia Ltd Others • Peak Power Asia Pte Ltd • Nationwide Petroleum Pte Ltd • Hup Soon Leong Holdings Pte Ltd • Arise Asset Management Pte Ltd Principal Commitments: Nil Past directorships held over the preceding three years (From 1 January 2012 to 31 December 2014) Nil Others (including experience): • Previously CEO of Kuwait Finance House (Islamic) Bank • Previously CEO of Vietcombank Fund Management Company • Previously Partner of UBS Capital Asia Pacific (S) Ltd • Previously Director of Ferrell International Limited Mr Edwin Neo Academic & Professional Qualification(s): • Bachelor of Law Degree, University of Hong Kong • Post-graduate Certificate In Laws, University of Hong Kong • Solicitor of the Supreme Court of Hong Kong • Advocate and Solicitor of Supreme Court of Singapore • Solicitor of Supreme Court of England and Wales • Notary Public in Hong Kong Present Directorships (as at 31 December 2014) Listed Companies • Lippo Ltd. • Lippo China Resources Limited Others • Wise Jade Limited Hong Kong • Boomerang Limited • Universal Prospects Limited • Cyclix Limited • Loftiview Limited • Richpro Limited • Protop Investment Limited • Vestpro Limited • Clifton Way Limited • Prime Elite Limited • Trimart Limited • Eden Investments Limited Principal Commitments: Hoosenally & Neo (Partner) Past directorships held over the preceding three years (From 1 January 2012 to 31 December 2014): Nil Others (including experience): Nil Dr Ronnie Tan Keh Poo Academic & Professional Qualification(s): • Medical Doctor, University of Melbourne • Master of Health Administration, Loma Linda University Present Directorships (as at 31 December 2014) Listed Companies Nil Others • Greenix Limited • Bowsprit Capital Corporation Limited Principal Commitments: Nil Past directorships held over the preceding three years (From 1 January 2012 to 31 December 2014) Food Junction Holdings Limited Others (including experience): • Previously CEO and Director of Gleneagles Hospital Limited • Previously Executive Director of Lippo Group • Previously CEO of Siloam Group of Hospitals • Previously CEO and Director of AsiaMedic Limited • Previously Senior Executive of Parkway Holdings Limited 49 50 Auric Pacific Group Limited Annual Report 2014 Auric Pacific Group Limited Annual Report 2014 RISK MANAGEMENT REPORT RISK MANAGEMENT REPORT The board of directors (the “Board”) of Auric Pacific Group Limited (“APGL”) recognises the importance of APGL and the Board taking on an integrated enterprise-wide perspective of risk management practices and the need to enhance management’s accountability of APGL’s risk management. The principal objective of the enterprise risk management (“ERM”) framework is to support the objectives and commitments of APGL and its subsidiaries (collectively, the “Group”) to safeguard the interests and assets of the Group’s stakeholders as the Group pursues its strategic objectives and business goals. Principle 11 of the 2012 Code of Corporate Governance issued by the Monetary Authority of Singapore on 2 May 2012 reinforces the Board’s recognition. Key Risk for Financial Year 2015 On 12 August 2013, the Audit and Risk Committee (“ARC”) was delegated the role of assisting the Board in its risk management function. A consolidated risk management review, which includes the implementation of a risk management framework, the systemic documentation of business continuity plans and the introduction of a group wide insurance programme was carried out for financial year ended 2014. Risk Management Process The ARC with the assistance of management and internal and external auditors, reviews and reports to the Board at least annually on the adequacy and effectiveness of the Group’s internal controls, including financial operational, compliance and information technology controls, established by Management. In addition, the Board with the assistance of the ARC reviews and determines the Group’s level of risk tolerance and risk policies, and oversees the design, implementation and monitoring of the risk management and internal control systems. The Board, with the endorsement of the ARC, has in financial year ended 2014 adopted an ERM policy that documents the Group’s ERM strategy, objectives and governance structure. Pursuant to the terms of the policy, the head of each business division is the risk owner and responsible for determining and managing the overall risk exposure of his/her business division. Risk coordinators located at each business division is, and shall be, coordinating the implementation of the ERM policy, the updating and reporting of risk status, and to upkeep the risk register of their respective business divisions. Notwithstanding, every staff has a role to play in risk management. ERM and business continuity plan awareness workshops have been conducted and have been planned for financial year 2015. To facilitate the reporting and monitoring of risk, the ARC has endorsed the use of a web-based corporate risk scorecard system, a common platform which enables business divisions within the Group to report risks and risk status consistently and cohesively. In this respect, with the assistance of the risk management coordination team (“Risk Management Coordination Team”) which resides at APGL, the ARC shall be provided relevant reports disclosing the risk status of the Group. The web-based corporate risk scorecard system captures risks, mitigating measures, timelines for implementation and risk ratings. Key risk indicators are established as safeguards and to monitor risk, where applicable. Scorecards are consolidated with the assistance of the Risk Management coordination Team and reviewed at the senior management level before they are escalated for review by the ARC. Following the assessment of key risks (“Key Risk”) by senior management in financial year ended 2013 and approved by the Board with the endorsement of the ARC, risks identified under each operational level shall be, where relevant, grouped under each Key Risk, when reported to the ARC. The Key Risk faced by the Group for financial year 2015, in summary, includes the following: • Strategic Direction Risk – Taking into consideration the territories and markets that the Group operates in, and the pressures that competition has on the Group and its revenue and margins, the Group faces risk in its (i) application of its assets and capital towards suitable investments, markets and product launches, and (ii) seizure of business and investment opportunities when such opportunities arise. • Capital Availability and Capital Management Risk – Taking into consideration the available terms in the equity and debt markets, the Group faces the risk of the Group failing to obtain suitable financing to support and sustain its development and growth. • Execution Risk – Due to the complexities of the food business, the uncertainties of supply and the reliability of the supply chain, the Group faces the risk that its strategic plans are not effectively executed or meets the objectives of the Group and its strategy. • Key Personnel and Talent Attraction and Retention Risk - The competition for talent in Singapore and the countries which the Group operates has led to the risk that the Group is not being able to attract and retain key personnel and talents with the appropriate and required skill-set/experience/competence which would meet the business objectives of the Group. • Manpower Availability Risk – The manpower regulations in the respective jurisdictions which the Group operates increases the risk of the Group obtaining and retaining manpower to meet its operational needs. • Food Contamination Risk – Taking into consideration the nature of the Group’s businesses, the risk of third party supplier and customer failing to comply with the Group’s food safety/hygiene policies and procedures resulting in the contamination of the food products. • Food Quality Risk - Taking into consideration the nature of the Group’s businesses, the risk of third party suppliers failing to supply products of adequate quality standards required and expected by the Group. • Disruption in Food Production Risk - Taking into consideration the nature and age of its equipment, and the availability of good external manufacturing capabilities, the risk of disruption in food production due to adverse external events and the breakdown of such equipment. As at the date of this report, the Key Risk of the Group have been largely mitigated. The completion of the review of business continuity plans and the implementation of the Group Insurance Programme serve as important steps in the mitigation of Key Risk. Among various measures and procedures implemented within the Group, with the implementation of the ERM framework, the ARC with the assistance of the Risk Coordination Management Team will be able to monitor the effectiveness of implemented risk mitigation measures, and if there are any unusual exposure to a particular risk. 51 52 Auric Pacific Group Limited Annual Report 2014 Auric Pacific Group Limited Annual Report 2014 DIRECTORS’ REPORT DIRECTORS’ REPORT The directors are pleased to present their report to the members together with the audited consolidated financial statements of Auric Pacific Group Limited (“the Company”) and its subsidiary companies (collectively, “the Group”) and the balance sheet and the statement of changes in equity of the Company for the financial year ended 31 December 2014. DIRECTORS’ INTERESTS IN SHARES AND DEBENTURES (CONT’D) DIRECTORS Dr. Andy Adhiwana is deemed to have an interest in the shares of Bravado International Ltd. and Goldstream Capital Limited. The directors of the Company in office at the date of this report are:Mr. Albert Saychuan Cheok Dr. Stephen Riady Dr. Andy Adhiwana Mr. Bryan Chang Yew Chan Dr. Lim Boh Soon Dr. Ronnie Tan Keh Poo Mr. Edwin Neo (Independent Non-Executive Chairman) (Executive Director) (Executive Director) (Appointed with effect from 1 November 2014) (Independent Non-Executive Director) (Independent Non-Executive Director) (Non-Executive Director) (Independent Non-Executive Director) ARRANGEMENTS TO ENABLE DIRECTORS TO ACQUIRE SHARES AND DEBENTURES Neither at the end of nor at any time during the financial year was the Company a party to any arrangement whose objects are, or one of whose objects is, to enable the directors of the Company to acquire benefits by means of the acquisition of shares or debentures of the Company or any other body corporate. DIRECTORS’ INTERESTS IN SHARES AND DEBENTURES According to the register of directors’ shareholdings required to be kept under Section 164 of the Singapore Companies Act, Cap. 50 (“the Act”), the following directors, who held office at the end of the financial year, had interests in the shares of the Company and its related companies as stated below: Shareholdings registered in Shareholdings in which directors are the name of directors as at deemed to have an interest as at 1.1.2014 31.12.201421.1.2015 1.1.2014 31.12.201421.1.2015 (or date of (or date of appointment) appointment) Auric Pacific Group Limited (Ordinary shares) Dr. Stephen Riady – – – 89,420,646 61,927,335 Dr. Lim Boh Soon – – – 4,000 4,000 Ms. Saw Phaik Hwa 450,000 550,000 550,000 – – Dr. Andy Adhiwana – – – – 27,493,311 61,927,335 4,000 – 27,493,311 By virtue of Section 7 of the Act, Dr. Stephen Riady is deemed to have interests in shares of the subsidiary companies of the Company. Except as disclosed above, the following directors who held office at the end of the financial year had interests in the shares of the following entities, which are related corporations to a corporate shareholder of the Company : Shareholdings registered in Shareholdings in which directors are the name of directors as at deemed to have an interest as at 1.1.2014 31.12.2014 21.1.2015 1.1.2014 31.12.2014 21.1.2015 (or date of (or date of appointment) appointment) Goldstream Capital Limited (Ordinary shares) Dr. Stephen Riady – – – 10 – Bravado International Ltd (Ordinary shares) Dr. Stephen Riady – – – 1 – Goldstream Capital Limited (Ordinary shares) Dr. Andy Adhiwana – – – – 10 Bravado International Ltd (Ordinary shares) Dr. Andy Adhiwana – – – – 1 Nine Heritage Pte Ltd (Ordinary shares) Dr. Stephen Riady – – – 800,000 800,000 Pantogon Holdings Pte Ltd (Ordinary shares) Dr. Stephen Riady – – – 1,000,000 1,000,000 Win Joyce Limited (Ordinary shares) Dr. Stephen Riady – – – 2 2 Goldmax Pacific Limited (Ordinary shares) Dr. Stephen Riady – – – 1 1 Jeremiah Holdings Limited (Ordinary shares of S$1.00 each) Dr. Stephen Riady – – – 779,187 779,187 Dragon Board Holdings Limited (Ordinary shares of S$1.00 each) Dr. Stephen Riady – – – 1 1 – – 10 1 800,000 1,000,000 2 1 779,187 1 53 54 Auric Pacific Group Limited Annual Report 2014 Auric Pacific Group Limited Annual Report 2014 DIRECTORS’ REPORT DIRECTORS’ REPORT DIRECTORS’ INTERESTS IN SHARES AND DEBENTURES (CONT’D) DIRECTORS’ INTERESTS IN SHARES AND DEBENTURES (CONT’D) Shareholdings registered in Shareholdings in which directors are the name of directors as at deemed to have an interest as at 1.1.2014 31.12.2014 21.1.2015 1.1.2014 31.12.2014 21.1.2015 (or date of (or date of appointment)appointment) Tamsett Holdings Limited (Ordinary shares of US$1.00 each) Dr. Stephen Riady – – – 1 1 1 Max Turbo Limited (Ordinary shares of US$1.00 each) Dr. Stephen Riady – – – 100 100 100 Rickon Holdings Limited (Ordinary shares of US$1.00 each) Dr. Stephen Riady – – – – 1 1 Lippo China Resources Limited (Ordinary shares) Dr. Stephen Riady – – – 6,544,696,389 6,544,696,389 6,544,696,389 First Tower Corporation (Ordinary shares of US$1.00 each) Dr. Stephen Riady – – – 1 1 Skyscraper Realty Limited (Ordinary shares of US$1.00 each) Dr. Stephen Riady – – – 10 10 1 10 Shareholdings registered in Shareholdings in which directors are the name of directors as at deemed to have an interest as at 1.1.2014 31.12.201421.1.2015 1.1.2014 31.12.201421.1.2015 (or date of (or date of appointment) appointment) Lanius Limited * (Ordinary shares) – – – 30 30 Lippo Finance Limited (Ordinary shares) – – – 6,176,470 6,176,470 6,176,470 TechnoSolve Limited (Ordinary shares) – – – 18,053,500 18,053,500 18,053,500 Kingtek Limited (Ordinary shares of US$1.00 each) – – – 60 60 60 Beijing Lippo Century Realty Co., Ltd. (Total paid-up registered capital: US$36,000,000) – – – US$36,000,000 US$36,000,000 US$36,000,000 Multi-World Builders & Development Corporation (Ordinary shares) – – – 4,080 4,080 4,080 Chung Po Investment Holding Co., Ltd. – – – 1,200,000 1,200,000 1,200,000 (Ordinary shares of HK$1.00 each) Apart from the above, Dr. Stephen Riady is also deemed to be interested in the wholly-owned subsidiaries and fellow subsidiaries of the entities listed in this section. Lippo Limited (Ordinary shares) Dr. Stephen Riady – – – 319,322,219 319,322,219 319,322,219 Apart from the above, Dr. Stephen Riady is also deemed to have interests in the holding companies of the controlling shareholders and companies related to the controlling shareholders as stated below: Shareholdings registered in Shareholdings in which directors are the name of directors as at deemed to have an interest as at 1.1.2014 31.12.2014 21.1.2015 1.1.2014 31.12.2014 21.1.2015 (or date of (or date of appointment)appointment) 30 Lippo Capital Limited (Ordinary shares of HK$1.00 each) – – – 705,690,001 705,690,001 705,690,001 Hongkong Chinese Limited (Ordinary shares of HK$1.00 each) – – – 1,121,517,842 1,315,707,842 1,315,707,842 * The trustee of a discretionary trust which was founded by Dr. Mochtar Riady, who does not have any interest in the share capital of Lanius Limited. The beneficiaries of the trust included, inter alia, Dr. Stephen Riady and other members of the family. Except as disclosed in this report, no other director who held office at the end of the financial year had interests in shares, share options, warrants or debentures of the Company and its related companies, either at the beginning of the financial year, or date of appointment if later, or at the end of the financial year. 55 56 Auric Pacific Group Limited Annual Report 2014 Auric Pacific Group Limited Annual Report 2014 DIRECTORS’ REPORT DIRECTORS’ REPORT DIRECTORS’ CONTRACTUAL BENEFITS AUDIT AND RISK COMMITTEE (CONT’D) Since the end of the previous financial year, no director of the Company has received or become entitled to receive a benefit (other than as disclosed in the financial statements) by reason of a contract made by the Company or by a related corporation with the director, or with a firm of which the director is a member, or with a company in which the director has a substantial financial interest, apart from remuneration from the Company and/or related corporations in their capacities as directors/executives of those corporations. • Reviewed legal and regulatory matters that may have a material impact on the financial statements, related compliance policies and programmes, and any reports received from regulators • Reviewed the cost effectiveness and the independence and objectivity of the external auditor • Reviewed the nature and extent of non-audit services provided by the external auditors OPTIONS • Recommended to the board of directors the external auditors to be nominated, approved the compensation of the external auditor, and reviewed the scope and results of the audit There is presently no option scheme on unissued shares of the Company. REVIEW OF INTERNAL CONTROLS AND RISKS Based on the internal controls established and maintained by the Group, work performed by the internal and external auditors, and reviews performed by management, various Board Committees and the Board, the Audit Committee and the Board are of the opinion that the Group’s internal controls, addressing financial, operational and compliance risks, were adequate as at 31 December 2014. AUDIT AND RISK COMMITTEE The Audit and Risk Committee (“ARC”) carried out its functions in accordance with Section 201B(5) of the Singapore Companies Act, Cap.50, including the following:• Reviewed the audit plans of the internal and external auditors of the Group and the Company, and reviewed the internal auditors’ evaluation of the adequacy of the Company’s system of internal accounting controls and the assistance given by the Group and the Company’s management to the external and internal auditors • Reviewed the quarterly and annual financial statements and the auditor’s report on the annual financial statements of the Group and the Company before their submission to the board of directors • Reported actions and minutes of the ARC to the board of directors with such recommendations as the ARC considered appropriate • Reviewed interested person transactions in accordance with the requirements of the Singapore Exchange Securities Trading Limited’s Listing Manual The ARC, having reviewed all non-audit services provided by the external auditor to the Group, is satisfied that the nature and extent of such services would not affect the independence of the external auditor. The ARC has also conducted a review of interested person transactions. The ARC convened 10 meetings during the financial year. As at the date of this report, the ARC has also met with the external and internal auditors, without the presence of management, at least once a year and had visited some of its subsidiaries. Further details regarding the ARC are disclosed in the Report on Corporate Governance as set out in the Annual Report of the Company. AUDITOR Ernst & Young LLP have expressed their willingness to accept reappointment as auditor. • Reviewed effectiveness of the Group and the Company’s material internal controls, including financial, operational and compliance and information technology controls and risk management via reviews carried out by the internal auditors On behalf of the board of directors, • Met with the external auditors, other committees, and management in separate executive sessions to discuss any matters that these groups believe should be discussed privately with the ARC Stephen Riady Executive Director Andy Adhiwana Executive Director Singapore 30 March 2015 57 58 Auric Pacific Group Limited Annual Report 2014 Auric Pacific Group Limited Annual Report 2014 STATEMENT BY DIRECTORS INDEPENDENT AUDITOR’S REPORT We, Stephen Riady and Andy Adhiwana, being two of the directors of Auric Pacific Group Limited (the “Company”), do hereby state that, in the opinion of the directors:- REPORT ON THE FINANCIAL STATEMENTS (i) the accompanying consolidated statement of comprehensive income, balance sheets, statements of changes in equity and consolidated cash flow statement, together with the notes thereto, are drawn up so as to give a true and fair view of the state of affairs of the Group and of the Company as at 31 December 2014, and the results of the business, changes in equity, and cash flows of the Group, and the changes in equity of the Company for the financial year then ended on that date; and (ii) at the date of this statement, there are reasonable grounds to believe that the Company will be able to pay its debts as and when they fall due. On behalf of the board of directors, For the financial year ended 31 December 2014 Independent Auditor’s Report to the Members of Auric Pacific Group Limited We have audited the accompanying financial statements of Auric Pacific Group Limited (“the Company”) and its subsidiary companies (collectively, “the Group”) set out on pages 60 to 141, which comprise the balance sheets of the Group and the Company as at 31 December 2014, the statements of changes in equity of the Group and the Company, consolidated statement of comprehensive income and consolidated cash flow statement of the Group for the year then ended, and a summary of significant accounting policies and other explanatory information. Management’s Responsibility for the Financial Statements Management is responsible for the preparation of financial statements that give a true and fair view in accordance with the provisions of the Singapore Companies Act, Chapter 50 (the “Act”) and Singapore Financial Reporting Standards, and for devising and maintaining a system of internal accounting controls sufficient to provide a reasonable assurance that assets are safeguarded against loss from unauthorised use or disposition; and transactions are properly authorised and that they are recorded as necessary to permit the preparation of true and fair profit and loss accounts and balance sheets and to maintain accountability of assets. Auditor’s Responsibility Our responsibility is to express an opinion on these financial statements based on our audit. We conducted our audit in accordance with Singapore Standards on Auditing. Those standards require that we comply with ethical requirements and plan and perform the audit to obtain reasonable assurance about whether the financial statements are free from material misstatement. Stephen Riady Executive Director Andy Adhiwana Executive Director An audit involves performing procedures to obtain audit evidence about the amounts and disclosures in the financial statements. The procedures selected depend on the auditor’s judgement, including the assessment of the risks of material misstatement of the financial statements, whether due to fraud or error. In making those risk assessments, the auditor considers internal control relevant to the entity’s preparation of financial statements that give a true and fair view in order to design audit procedures that are appropriate in the circumstances, but not for the purpose of expressing an opinion on the effectiveness of the entity’s internal control. An audit also includes evaluating the appropriateness of accounting policies used and the reasonableness of accounting estimates made by management, as well as evaluating the overall presentation of the financial statements. We believe that the audit evidence we have obtained is sufficient and appropriate to provide a basis for our audit opinion. Opinion Singapore 30 March 2015 In our opinion, the consolidated financial statements of the Group and the balance sheet and statement of changes in equity of the Company are properly drawn up in accordance with the provisions of the Act and Singapore Financial Reporting Standards, so as to give a true and fair view of the state of affairs of the Group and of the Company as at 31 December 2014 and the results, changes in equity and cash flows of the Group and the changes in equity of the Company for the financial year ended on that date. REPORT ON OTHER LEGAL AND REGULATORY REQUIREMENTS In our opinion, the accounting and other records required by the Act to be kept by the Company and by those subsidiary companies incorporated in Singapore of which we are the auditors have been properly kept in accordance with the provisions of the Act. Ernst & Young LLP Public Accountants and Chartered Accountants Singapore 30 March 2015 59 60 Auric Pacific Group Limited Annual Report 2014 Auric Pacific Group Limited Annual Report 2014 CONSOLIDATED STATEMENT OF COMPREHENSIVE INCOME BALANCE SHEETS Note Note For the financial year ended 31 December 2014 (In Singapore Dollars) Group 2014 $’000 2013 $’000 Revenue 3 424,424 398,482 Cost of revenue 4 (244,180) (227,201) Gross profit 180,244 171,281 Other item of income/(expenses) Other revenue 5 3,265 2,301 Selling and marketing expenses (79,295) (71,961) General and administration expenses (30,349) (32,390) Investment related activities 1,457 (727) Finance costs 7 (371) (399) Other operating expenses 5 (71,793) (69,283) Exceptional items 6 (3,285) (21,561) Share of results of an associated company 14 (4) (5) Share of results of a joint venture company 15 770 832 Profit/(loss) before taxation 8 639 (21,912) Income tax expense 9 (464) (1,332) Profit/(loss) for the financial year, net of taxation 175 (23,244) Other comprehensive expenses: Items that may be reclassified subsequently to profit or loss Reclassification adjustment for gain on disposal of a foreign operation 13 (375) – Foreign currency translation 29 (a) (618) (1,617) Other comprehensive expenses for the financial year, net of taxation (993) (1,617) Total comprehensive loss for the financial year (818) (24,861) Profit/(loss) attributable to: Owners of the Company 231 (21,943) Non-controlling interests (56) (1,301) 175 (23,244) Total comprehensive loss attributable to: Owners of the Company (779) (23,759) Non-controlling interests (39) (1,102) (818) (24,861) Earnings per share attributable to owners of the Company (cents per share): Basic 10 0.18 (17.46) Diluted 10 The accompanying accounting policies and explanatory notes form an integral part of the financial statements. 0.18 (17.46) 61 As at 31 December 2014 (In Singapore Dollars) 2014 $’000 Group 2013 $’000 Company 2014 2013 $’000 $’000 ASSETS Non-current assets Property, plant and equipment 11 40,861 34,865 234 Intangible assets 12 76,590 79,901 – Interest in subsidiary companies 13 – – 96,199 Investment in an associated company 14 273 277 – Investment in a joint venture company 15 2,002 2,067 – Long-term investments 16 10,428 10,160 – Other debtors 19 6,751 5,810 – Prepayments and other recoverables 19 4,677 735 – Deferred tax assets 27 1,092 1,158 – 142,674 134,973 96,433 364 – 95,197 – – – – – – 95,561 Current assets Stocks 17 48,875 42,318 – – Trade debtors 18 64,137 60,010 – – Other debtors 19 9,249 9,353 292 249 Prepayments and other recoverables 19 4,428 3,118 18 15 Amounts due from subsidiary companies 20 – – 170,116 179,599 Fixed deposits (restricted) 21 4,004 3,856 – – Cash and cash equivalents 21 46,326 55,867 14,857 24,757 177,019 174,522 185,283 204,620 Total assets 319,693 309,495 281,716 300,181 EQUITY AND LIABILITIES Current liabilities Trade creditors 22 39,888 38,023 – – Other creditors and accruals 23 46,225 40,509 2,262 2,290 Deferred income 23 1,943 502 – – Provisions 24 887 1,046 – – Amounts due to subsidiary companies 25 – – 183,258 175,764 Loans and borrowings 26 9,391 6,534 4,000 – Tax payable 2,876 1,449 – 218 101,210 88,063 189,520 178,272 Net current assets/(liabilities) 75,809 86,459 (4,237) The accompanying accounting policies and explanatory notes form an integral part of the financial statements. 26,348 62 Auric Pacific Group Limited Annual Report 2014 Auric Pacific Group Limited Annual Report 2014 BALANCE SHEETS (CONT’D) STATEMENTS OF CHANGES IN EQUITY As at 31 December 2014 (In Singapore Dollars) Note For the financial year ended 31 December 2014 (In Singapore Dollars) 2014 $’000 Group 2013 $’000 Company 2014 2013 $’000 $’000 EQUITY AND LIABILITIES (CONT’D) Non-current liabilities Deferred income 23 1,047 433 Provisions 24 4,631 4,262 Loans and borrowings 26 415 333 Deferred tax liabilities 27 3,640 4,202 9,733 9,230 Total liabilities 110,943 97,293 Net assets 208,750 212,202 – 100 – 192 – 100 – 192 292 292 189,812 178,564 91,904 121,617 Equity attributable to owners of the Company Share capital 28 64,461 64,461 64,461 64,461 Retained earnings 145,255 147,537 18,968 48,681 Other reserves 29 (1,734) (761) – – Merger reserve 30 – – 8,475 8,475 207,982 211,237 91,904 121,617 Non-controlling interests 13 768 965 – – Total equity 208,750 212,202 91,904 121,617 Total equity and liabilities 319,693 309,495 281,716 300,181 The accompanying accounting policies and explanatory notes form an integral part of the financial statements. Attributable to owners of the Company Discount Gain on on purchase Total equity Foreignacquisitionof treasury attributable Other currency of non-shares by a to owners Non Share Retained reserves, translationcontrolling subsidiary of thecontrolling Capital earnings total reserve interests company Company interests (Note (Note (Note (Note (Note 28) 29) 29 (a)) 29 (b)) 29 (c)) $’000 $’000 $’000 $’000 $’000 $’000 $’000 $’000 Total equity $’000 Group 2014 Balance at 1 January 2014 Profit for the financial year 64,461 147,537 – 231 (761) – (7,357) – 6,078 – Other comprehensive expense Foreign currency translation – – (1,010) (1,010) – Other comprehensive (expense)/ income for the financial year, net of taxation – – (1,010) (1,010) – Total comprehensive (expense)/ income for the financial year – 231 (1,010) (1,010) – Contributions by and distributions to owners Dividend on ordinary shares (Note 31) – (2,513) – – – Total contributions by and distributions to owners – (2,513) – – – Changes in ownership interest in subsidiaries Acquisition of non-controlling interest – – 37 – 37 Total changes in ownership interest in subsidiaries – – 37 – 37 Total transactions with owners in their capacity as owners – (2,513) 37 – 37 Balance at 31 December 2014 64,461 145,255 (1,734) (8,367) 6,115 518 211,237 – 231 965 212,202 (56) 175 – (1,010) 17 (993) – (1,010) 17 (993) – (779) (39) (818) – (2,513)– (2,513) – (2,513)– (2,513) – 37 (158) (121) – 37 (158) (121) – (2,476) (158) (2,634) 518 207,982 The accompanying accounting policies and explanatory notes form an integral part of the financial statements. 768 208,750 63 64 Auric Pacific Group Limited Annual Report 2014 Auric Pacific Group Limited Annual Report 2014 STATEMENTS OF CHANGES IN EQUITY (CONT’D) STATEMENTS OF CHANGES IN EQUITY (CONT’D) For the financial year ended 31 December 2014 (In Singapore Dollars) For the financial year ended 31 December 2014 (In Singapore Dollars) Attributable to owners of the Company Discount Gain on on purchase Total equity Foreignacquisitionof treasury attributable Other currency of non-shares by a to owners Non Share Retained reserves, translationcontrolling subsidiary of thecontrolling Capital earnings total reserve interests company Company interests (Note (Note (Note (Note (Note 28) 29) 29 (a)) 29 (b)) 29 (c)) $’000 $’000 $’000 $’000 $’000 $’000 $’000 $’000 Total equity $’000 Group 2013 Balance at 1 January 2013 Loss for the financial year 64,461 173,250 (3,019) – (21,943) – (5,541) – 2,004 – Other comprehensive expense Foreign currency translation – – (1,816) (1,816) – Other comprehensive (expense)/income for the financial year, net of taxation – – (1,816) (1,816) – Total comprehensive (expense)/income for the financial year – (21,943) (1,816) (1,816) – Contributions by and distributions to owners Dividend on ordinary shares (Note 31) – (3,770) – – – Total contributions by and distributions to owners – (3,770) – – – Changes in ownership interest in subsidiaries Acquisition of non-controlling interest (Note 13) – – 4,074 – 4,074 Total changes in ownership interest in subsidiaries – – 4,074 – 4,074 Total transactions with owners in their capacity as owners – (3,770) 4,074 – 4,074 Balance at 31 December 2013 64,461 147,537 (761) (7,357) 6,078 518 234,692 17,483 252,175 – (21,943) (1,301) (23,244) – – (1,816) (1,816) 199 199 (1,617) (23,759) (1,102) (24,861) – (3,770)– (3,770) – (3,770)– (3,770) – 4,074 (15,416) (11,342) – 4,074 (15,416) (11,342) – 304 (15,416) (15,112) The accompanying accounting policies and explanatory notes form an integral part of the financial statements. Share capital (Note 28) $’000 Retained earnings * $’000 Merger reserve (Note 30) $’000 Total equity Company 2014 Balance at 1 January 2014 64,461 Loss for the financial year – Total comprehensive expenses for the financial year – 48,681 (27,200) (27,200) 8,475 – – 121,617 (27,200) (27,200) Contributions by and distributions to owners Dividend on ordinary shares (Note 31) – (2,513) – Total contributions by and distributions to owners – (2,513) – 8,475 Balance at 31 December 2014 64,461 18,968# (2,513) (2,513) $’000 91,904 (1,617) – 518 211,237 2013 Balance at 1 January 2013 64,461 51,286 Profit for the financial year – 1,165 Total comprehensive income for the financial year – 1,165 Contributions by and distributions to owners Dividend on ordinary shares (Note 31) – (3,770) Total contributions by and distributions to owners – (3,770) Balance at 31 December 2013 64,461 48,681 8,475 – – – – 8,475 124,222 1,165 1,165 (3,770) (3,770) 121,617 * It includes an amount of $32,617,000 (2013: $32,617,000), which relates to the gain resulting from an internal restructuring of certain subsidiary companies in 1999. This amount is non-distributable in accordance with the Company’s Memorandum and Articles of Association. # In March 2015, a subsidiary company declared and paid a dividend of $25,000,000 to the Company as disclosed in Note 39(b). 965 212,202 The accompanying accounting policies and explanatory notes form an integral part of the financial statements. 65 66 Auric Pacific Group Limited Annual Report 2014 Auric Pacific Group Limited Annual Report 2014 CONSOLIDATED CASH FLOW STATEMENT CONSOLIDATED CASH FLOW STATEMENT (CONT’D) Group 2014 2013 $’000 $’000 Group 2014 2013 $’000 $’000 Cash flows from operating activities Profit/(loss) before taxation 639 (21,912) Adjustments for: Dividend income (300) (485) Interest income (12) (1,417) Interest expense 371 399 Share of results of an associated company 4 5 Share of results of a joint venture company (770) (832) Depreciation of property, plant and equipment 12,937 14,661 Fair value changes of financial instruments: - Loss/(gain) on investment funds at fair value through profit or loss 329 (75) - Loss on redeemable preference shares issued by a subsidiary company – 814 Gain on disposal of interest in subsidiary companies (1,734) – Allowance for impairment on trade debtors 759 742 Allowance for impairment on unquoted investment funds – 3,047 Bad debts recovered – (1) Amortisation of intangible assets 2,800 2,800 Net (gain)/loss on disposal of property, plant and equipment (29) 51 Stocks written down 2,217 2,180 Property, plant and equipment written off 62 314 Allowance for impairment on property, plant and equipment – 4,511 Write-off of non-trade debtor 101 – Write-back of provision for reinstatement cost (233) – Impairment loss on intangible assets 463 10,000 Translation differences (1,156) (1,975) Operating cash flows before working capital changes 16,448 12,827 Increase in assets: Stocks (8,774) (7,643) Trade and other debtors (9,682) (4,696) Increase in liabilities: Trade and other creditors 9,692 5,314 Net cash generated from operations 7,684 5,802 Tax paid (1,010) (3,451) Interest paid (371) (399) Interest received 10 3,957 Net cash flows generated from operating activities 6,313 5,909 Cash flows from investing activities Disposal of interests of subsidiary companies 1,255 Dividend income received 300 Dividend received from a joint venture company 835 Proceeds on disposal of property, plant and equipment 78 Proceeds from return of capital from investment funds 257 – Proceeds from disposal of redeemable preference shares(1) Purchase of property, plant and equipment (18,115) Purchase of investment funds (800) Net cash flows (used in)/generated from investing activities (16,190) Cash flows from financing activities Repayment of obligations under finance leases (120) Dividend on ordinary shares (2,513) Proceeds from bank borrowings 26,305 Repayment of bank borrowings (23,369) Acquisition of non-controlling interests (Note 13) (121) Repayment of financing for redeemable preference shares – (Increase)/decrease in fixed deposits pledged with banks (148) Net cash flows generated from/(used in) financing activities 34 Net decrease in cash and cash equivalents (9,843) Cash and cash equivalents at beginning of financial year 55,867 Effect of exchange rate changes on cash and cash equivalents 302 Cash and cash equivalents at end of financial year (Note A) 46,326 The accompanying accounting policies and explanatory notes form an integral part of the financial statements. The accompanying accounting policies and explanatory notes form an integral part of the financial statements. For the financial year ended 31 December 2014 (In Singapore Dollars) For the financial year ended 31 December 2013 (In Singapore Dollars) – 485 639 68 433 21,073 (12,952) (600) 9,146 (72) (3,770) 24,659 (24,265) (11,342) (4,436) 1,448 (17,778) (2,723) 58,533 57 55,867 (A) Analysis of the balances of cash and cash equivalents Fixed deposits (restricted) Fixed deposits (current) Cash and bank balances Fixed deposits pledged with banks (Note 21) Group 2014 2013 $’000 $’000 4,004 4,798 41,528 50,330 (4,004) 46,326 3,856 4,636 51,231 59,723 (3,856) 55,867 In 2013, the Group entered into a share purchase agreement dated 1 March 2013 (the “Share Purchase Agreement”) with Asian Hotel & Report Group Limited (the “Purchaser”) for the sale of all the Group’s redeemable prefrence shares (“RPS”) and ordinary shares in the share capital of Auric Pacific Real Estate Fund (“APREF”) which holds the Group’s investment in a mezzanine loan. The sale of the Group’s RPS and ordinary shares in APREF was completed in May 2013 for a consideration of $21.1 million, and the mezzanine loan (other receivables) and RPS liability were derecognised upon deconsolidation of APREF. No gain or loss was recognised on disposal. (1) 67 68 Auric Pacific Group Limited Annual Report 2014 Auric Pacific Group Limited Annual Report 2014 NOTES TO THE FINANCIAL STATEMENTS NOTES TO THE FINANCIAL STATEMENTS 1. CORPORATE INFORMATION 2. Auric Pacific Group Limited (the “Company”) is a limited liability company incorporated and domiciled in Singapore and is listed on the Singapore Exchange Securities Trading Limited. 2.3 Standards issued but not yet effective (cont’d) The Company’s holding company is Lippo China Resources Limited (“LCR”), a limited liability company incorporated in the Hong Kong Special Administrative Region of the People’s Republic of China and listed on the Hong Kong Stock Exchange. The registered office and principal place of business of the Company is located at 50 Collyer Quay, #06-03, OUE Bayfront, Singapore 049321. The principal activities of the Company are those of investment holding and the provision of services to its subsidiary companies. There have been no significant changes in the nature of these activities during the financial year. The principal activities of its subsidiary companies are disclosed in Note 13 to the financial statements. 2. Summary of significant accounting policies For the financial year ended 31 December 2014 For the financial year ended 31 December 2014 2.1 Basis of preparation The consolidated financial statements of the Group, and the balance sheet and the statement of changes in equity of the Company have been prepared in accordance with Singapore Financial Reporting Standards (“FRS”). The financial statements have been prepared on a historical cost basis, except as disclosed in the accounting policies below. As of year ended 31 December 2014, the Company is in a net current liability position of $4,237,000. The financial statements of the Company has been prepared on a going concern basis as there is sufficient cash flows at the subsidiary companies to be declared as dividends, as and when required. In March 2015, a subsidiary company declared and paid $25,000,000 as dividends to the Company. Description Improvements to FRSs (February 2014) (a) Amendments to FRS 103 Business Combinations (b) Amendments to FRS 113 Fair Value Measurement Amendments to FRS 1: Disclosure Initiative Amendments to FRS 16 and FRS 38: Clarification of Acceptable Methods of Depreciation and Amortisation Amendments to FRS 27: Equity Method in Separate Financial Statements Amendments to FRS 110 and FRS 28: Sale or Contribution of Assets between an Investor and its Associate or Joint Venture Amendments to FRS 110, FRS 112 and FRS 28: Investment Entities: Applying the Consolidation Exception Amendments to FRS 111: Accounting for Acquisition of Interests in Joint Operations FRS 114: Regulatory Deferral Accounts FRS 115: Revenue From Contracts With Customers FRS 109: Financial Instruments 2.3 Standards issued but not yet effective Improvements to FRSs (January 2014) (a) Amendments to FRS 102 Share Based Payment (b) Amendments to FRS 103 Business Combinations (c) Amendments to FRS 108 Operating Segments (d) Amendments to FRS 113 Fair Value Measurement (e) Amendments to FRS 16 Property, Plant and Equipment and FRS 38 Intangible Assets (f) Amendments to FRS 24 Related Party Disclosures Effective for annual periods beginning on or after 1 July 2014 1 July 2014 1 July 2014 1 July 2014 1 July 2014 1 July 2014 1 July 2014 1 January 2016 1 January 2016 1 January 2016 1 January 2016 1 January 2016 1 January 2016 1 January 2016 1 January 2017 1 January 2018 FRS 115 was issued in November 2014 and establishes a new five-step model that will apply to revenue arising from contracts with customers. Under FRS 115, revenue is recognised at an amount that reflects the consideration to which an entity expects to be entitled in exchange for transferring goods or services to a customer. The principles in FRS 115 provide a more structured approach to measuring and recognising revenue. The new revenue standard is applicable to all entities and will supersede all current revenue recognition requirements under FRS. Either a full or modified retrospective application is required for annual periods beginning on or after 1 January 2017 with early adoption permitted. The Group is currently assessing the impact of FRS 115 and plans to adopt the new standard on the required effective date. 2.4 Significant accounting estimates and judgements The preparation of the Group’s consolidated financial statements requires management to make judgements, estimates and assumptions that affect the reported amounts of revenues, expenses, assets and liabilities, and the disclosure of contingent liabilities at the end of each reporting period. Uncertainty about these assumptions and estimates could result in outcomes that could require a material adjustment to the carrying amount of the asset or liability affected in the future periods. (a) Key sources of estimation uncertainty The Group has not adopted the following standards that have been issued but not yet effective: Description Amendments to FRS 19 Defined Benefit Plans: Employee Contributions 1 July 2014 1 July 2014 Except for the impact of FRS 115 as described below, the directors expect that the adoption of the standards above will have no material impact on the financial statements in the period of initial application. The financial statements are presented in Singapore dollars (SGD or $), and all values are rounded to the nearest thousand ($’000), except when otherwise indicated. The accounting policies adopted are consistent with those of the previous financial year except in the current financial year, the Group has adopted all the new and revised standards which are effective for annual financial periods beginning on or after 1 January 2014. The adoption of these standards did not have any effect on the financial performance or position of the Group and the Company. Effective for annual periods beginning on or after 2.2 Changes in accounting policies SUMMARY OF SIGNIFICANT ACCOUNTING POLICIES (CONT’D) The key assumptions concerning the future and other key sources of estimation uncertainty at the end of each reporting period are discussed below. The Group based its assumptions and estimates on parameters available when the financial statements were prepared. Existing circumstances and assumptions about future developments, however, may change due to market changes or circumstances arising beyond the control of the Group. Such changes are reflected in the assumptions when they occur. Useful lives of plant and equipment The cost of plant and equipment is depreciated on a straight-line basis over the plant and equipment’s estimated economic useful lives. Management estimates the useful lives of these plant and equipment to be within 1 to 10 (2013: 1 to 10) years. Changes in the expected level of usage could impact the economic useful lives of these assets; therefore, future depreciation charges could be revised. The carrying amount of the Group’s plant and equipment at the end of each reporting period is disclosed in Note 11 to the financial statements. 69 70 Auric Pacific Group Limited Annual Report 2014 Auric Pacific Group Limited Annual Report 2014 NOTES TO THE FINANCIAL STATEMENTS NOTES TO THE FINANCIAL STATEMENTS 2. 2. For the financial year ended 31 December 2014 SUMMARY OF SIGNIFICANT ACCOUNTING POLICIES (CONT’D) 2.4 Significant accounting estimates and judgements (cont’d) (a) Key sources of estimation uncertainty (cont’d) Impairment of non-financial assets As disclosed in Note 12 to the financial statements, the recoverable amounts of the cash generating units which goodwill and trademarks have been allocated to are determined based on value in use calculations. The value in use calculations are based on a discounted cash flow model. The recoverable amount is most sensitive to the discount rate used for the discounted cash flow model as well as the expected future cash inflows and the growth rate used for extrapolation purposes. The key assumptions applied in the determination of the value in use including a sensitivity analysis, are disclosed and further explained in Note 12 to the financial statements. For the financial year ended 31 December 2014 SUMMARY OF SIGNIFICANT ACCOUNTING POLICIES (CONT’D) 2.4 Significant accounting estimates and judgements (cont’d) (b) Judgements made in applying accounting policies In the process of applying the Group’s accounting policies, management has made the following judgements, which have the most significant effect on the amounts recognised in the consolidated financial statements: Useful life of trademark license agreement Trademark license agreement arose from the Group’s acquisition of Edmontor Investments Pte Ltd in 2008, and was related to the right to use the “Delifrance” trademark granted under a license agreement. Since its acquisition in 2008, management had estimated the useful life of trademark license agreement to be indefinite, as management believed that there was no foreseeable limit to the period over which the agreement was expected to generate net cash inflows to the Group. Moreover, the agreement allowed for automatic renewal without significant cost. In September 2011, Grand Moulins De Paris (“GMP”) renewed the trademark license agreement for a period of 7 years (Initial Period). The revised agreement shall be further extended for a period of 7 years (First Renewal Period) and beyond, subject to the satisfactory compliance with the terms and conditions of the revised agreement. Management believes it would be able to meet the new terms and conditions in the revised agreement and the agreement would be renewed beyond the period of 21 years. There is no foreseeable limit to the period over which the revised agreement is expected to generate net cash inflows to the Group. Operating lease commitments – as lessor The Group has entered into operating leases with the landlords on its food court premises. The Group licences the use of the food and beverage stalls within the food courts to individual stallholders. The Group has determined that these are operating lease arrangements where significant risks and rewards of these food court premises have not been transferred. The carrying amount of the intangible assets as at 31 December 2014 is $76,590,000 (2013: $79,901,000). Impairment of loans and receivables The Group assesses at the end of each reporting period whether there is any objective evidence that a financial asset is impaired. Factors such as the probability of insolvency or significant financial difficulties of the debtor and default or significant delay in payments are objective evidence of impairment. In determining whether there is objective evidence of impairment, the Group considers whether there is observable data indicating that there have been significant changes in the debtor’s payment ability or whether there have been significant changes with adverse effect in the technological, market, economic or legal environment in which the debtor operates in. Where there is objective evidence of impairment, the amount and timing of future cash flows are estimated based on historical loss experience for assets with similar credit risk characteristics. The carrying amount of the Group’s loans and receivables at the end of each reporting period are disclosed in Note 21 to the financial statements. Deferred tax assets Deferred tax assets are recognised for all unused tax losses to the extent that it is probable that taxable profit will be available against which the losses can be utilised. Significant management judgement is required to determine the amount of deferred tax assets that can be recognised, based upon the likely timing and level of future taxable profits together with future tax planning strategies. Where taxable profits are expected in the foreseeable future, deferred tax assets are recognised on the unused tax losses. The carrying amount of the Group’s deferred tax assets, and recognised and unrecognised tax losses at the balance sheet date are disclosed in Note 27 to the financial statements. 2.5 Basis of consolidation and business combinations (a) Basis of consolidation The consolidated financial statements comprise the financial statements of the Company and its subsidiary companies as at the end of the reporting period. The financial statements of the subsidiary companies used in the preparation of the consolidated financial statements are prepared for the same reporting date as the Company. Consistent accounting policies are applied to like transactions and events in similar circumstances. All intra-group balances, income and expenses and unrealised gains and losses resulting from intra-group transactions and dividends are eliminated in full. 71 72 Auric Pacific Group Limited Annual Report 2014 Auric Pacific Group Limited Annual Report 2014 NOTES TO THE FINANCIAL STATEMENTS NOTES TO THE FINANCIAL STATEMENTS 2. 2. For the financial year ended 31 December 2014 SUMMARY OF SIGNIFICANT ACCOUNTING POLICIES (CONT’D) 2.5 Basis of consolidation and business combinations (cont’d) (a) Basis of consolidation (cont’d) Subsidiary companies are consolidated from the date of acquisition, being the date on which the Group obtains control, and continue to be consolidated until the date that such control ceases. Losses within a subsidiary company are attributed to the non-controlling interest even if that results in a deficit balance. A change in the ownership interest of a subsidiary company, without a loss of control, is accounted for as an equity transaction. If the Group loses control over a subsidiary, it: - - - - - - - de-recognises the assets (including goodwill) and liabilities of the subsidiary at their carrying amounts at the date when control is lost; de-recognises the carrying amount of any non-controlling interest; de-recognises the cumulative translation differences recorded in equity; recognises the fair value of the consideration received; recognises the fair value of any investment retained; recognises any surplus or deficit in profit or loss; re-classifies the Group’s share of components previously recognised in other comprehensive income to profit or loss or retained earnings, as appropriate. For the financial year ended 31 December 2014 2.5 Basis of consolidation and business combinations (cont’d) Business combinations are accounted for by applying the acquisition method. Identifiable assets acquired and liabilities assumed in a business combination are measured initially at their fair values at the acquisition date. Acquisition-related costs are recognised as expenses in the periods in which the costs are incurred and the services are received. Any contingent consideration to be transferred by the acquirer will be recognised at fair value at the acquisition date. Subsequent changes to the fair value of the contingent consideration which is deemed to be an asset or liability will be recognised in profit or loss. The Group elects for each individual business combination, whether non-controlling interest in the acquiree (if any), that are present ownership interests and entitle their holders to a proportionate share of net assets in the event of liquidation, is recognised on the acquisition date at fair value, or at the non-controlling interest’s proportionate share of the acquiree’s identifiable net assets. Other components of non-controlling interests are measured at their acquisition date fair value, unless another measurement basis is required by another FRS. Any excess of the sum of the fair value of the consideration transferred in the business combination, the amount of non-controlling interest in the acquiree (if any), and the fair value of the Group’s previously held equity interest in the acquiree (if any), over the net fair value of the acquiree’s identifiable assets and liabilities is recorded as goodwill. The accounting policy for goodwill is set out in Note 2.14. In instances where the latter amount exceeds the former, the excess is recognised as gain on bargain purchase in profit or loss on the acquisition date. Goodwill is initially measured at cost. Following initial recognition, goodwill is measured at cost less any accumulated impairment losses. (b) Business combinations and goodwill (cont’d) For the purpose of impairment testing, goodwill acquired in a business combination is, from the acquisition date, allocated to the Group’s cash-generating units that are expected to benefit from the synergies of the combination, irrespective of whether other assets or liabilities of the acquiree are assigned to those units. The cash-generating units to which goodwill have been allocated is tested for impairment annually and whenever there is an indication that the cash-generating unit may be impaired. Impairment is determined for goodwill by assessing the recoverable amount of each cash-generating unit (or group of cash-generating units) to which the goodwill relates. When the recoverable amount of the cash-generating unit is less than carrying amount, an impairment loss is recognised in profit or loss. Impairment losses recognised for goodwill are not reversed in subsequent periods. 2.6 Transactions with non-controlling interests Non-controlling interest represents the equity in subsidiary companies not attributable, directly or indirectly, to owners of the Company. Changes in the Company’s ownership interest in a subsidiary company that do not result in a loss of control are accounted for as equity transactions. In such circumstances, the carrying amounts of the controlling and noncontrolling interests are adjusted to reflect the changes in their relative interests in the subsidiary company. Any difference between the amount by which the non-controlling interest is adjusted and the fair value of the consideration paid or received is recognised directly in equity and attributed to owners of the Company. (b) Business combinations and goodwill SUMMARY OF SIGNIFICANT ACCOUNTING POLICIES (CONT’D) 2.7 Foreign currency The Group’s consolidated financial statements are presented in Singapore Dollars, which is also the Company’s functional currency. Each entity in the Group determines its own functional currency and items included in the financial statements of each entity are measured using that functional currency. (a) Transactions and balances Transactions in foreign currencies are measured in the respective functional currencies of the Company and its subsidiary companies and are recorded on initial recognition in the functional currencies at exchange rates approximating those ruling at the transaction dates. Monetary assets and liabilities denominated in foreign currencies are translated at the rate of exchange ruling at the end of the reporting period. Non-monetary items that are measured in terms of historical cost in a foreign currency are translated using the exchange rates as at the dates of the initial transactions. Non-monetary items measured at fair value in a foreign currency are translated using the exchange rates at the date when the fair value was measured. Exchange differences arising on the settlement of monetary items or on translating monetary items at the end of the reporting period are recognised in profit or loss. 73 74 Auric Pacific Group Limited Annual Report 2014 Auric Pacific Group Limited Annual Report 2014 NOTES TO THE FINANCIAL STATEMENTS NOTES TO THE FINANCIAL STATEMENTS 2. 2. For the financial year ended 31 December 2014 SUMMARY OF SIGNIFICANT ACCOUNTING POLICIES (CONT’D) 2.7 Foreign currency (cont’d) (b) Consolidated financial statements For consolidation purposes, the assets and liabilities of foreign operations are translated into SGD at the rate of exchange ruling at the end of the reporting period and their profit or loss are translated at the exchange rates prevailing at the date of the transactions. The exchange differences arising on the translation are recognised in other comprehensive income. On disposal of a foreign operation, the component of other comprehensive income relating to that particular foreign operation is recognised in profit or loss. In the case of a partial disposal without loss of control of a subsidiary company that includes a foreign operation, the proportionate share of the cumulative amount of the exchange differences are re-attributed to non-controlling interests and are not recognised in profit or loss. For partial disposals of associates or jointly controlled entities that are foreign operations, the proportionate share of the accumulated exchange differences is reclassified to profit or loss. For the financial year ended 31 December 2014 2.9 Employee benefits Interest income is recognised using the effective interest method. (e) Dividend income Fixed rental income from the sub-lease of food courts is recognised as income in profit or loss on a straight line basis over the lease term. The variable portion of the rental income which is computed based on a percentage of the food court tenants’ gross sales is recognised when such sales are earned. (d) Interest income Revenue from sale of food and beverage is recognised upon the delivery to and acceptance by customers, net of sales discounts. (c) Fees charged to food court tenants Dividend income is recognised when the Group’s right to receive payment is established. (f) Royalty and franchise income Royalty income is recognised based on percentage of sales to the franchisees. Franchise income under the ‘Delifrance’ trademark is recognised in accordance with the underlying agreements. Borrowing costs are capitalised as part of the cost of a qualifying asset if they are directly attributable to the acquisition, construction or production of that asset. Capitalisation of borrowing costs commences when the activities to prepare the asset for its intended use or sale are in progress and the expenditures and borrowing costs are incurred. Borrowing costs are capitalised until the assets are substantially completed for their intended use or sale. All other borrowing costs are expensed in the period they occur. Borrowing costs consist of interest and other costs that an entity incurs in connection with the borrowing of funds. 2.11 Government grants Government grants are recognised when there is reasonable assurance that the grant will be received and all attaching conditions will be complied with. Government grant shall be recognised in profit or loss on a systematic basis over the periods in which the entity recognises as expenses the related costs for which the grants are intended to compensate. Grants related to income may be presented as a credit in profit or loss, either separately or under a general heading such as “Other income”. Alternatively, they are deducted in reporting the related expenses. (b) Sale of food and beverage Revenue from sale of goods is recognised upon the transfer of significant risks and rewards of ownership of the goods to the customer, usually on delivery of goods. Revenue is not recognised to the extent where there are significant uncertainties regarding recovery of the consideration due, associated costs or the possible return of goods. Employee entitlements to annual leave are recognised as a liability when they are accrued to employees. The undiscounted liability for leave expected to be settled wholly before twelve months after the end of the reporting period is recognised for services rendered by employees up to the end of the reporting period. The liability for leave expected to be settled beyond twelve months from the end of the reporting period is determined using the projected unit credit method. The net total of service costs, net interest on the liability and remeasurement of the liability are recognised in profit or loss. 2.10 Borrowing costs (a) Sale of goods The Group participates in the national pension schemes as defined by the laws of the countries in which it has operations. In particular, the Singapore companies in the Group make contributions to the Central Provident Fund (“CPF”) scheme in Singapore, a defined contribution pension scheme. Contributions to defined contribution pension schemes are recognised as an expense in the period in which the related service is performed. (b) Employee leave entitlement 2.8Revenue Revenue is recognised to the extent that it is probable that the economic benefits will flow to the Group and the revenue can be reliably measured, regardless of when the payment is made. Revenue is measured at the fair value of consideration received or receivable, taking into account contractually defined terms of payment and excluding taxes or duty. (a) Defined contribution plans SUMMARY OF SIGNIFICANT ACCOUNTING POLICIES (CONT’D) 75 76 Auric Pacific Group Limited Annual Report 2014 Auric Pacific Group Limited Annual Report 2014 NOTES TO THE FINANCIAL STATEMENTS NOTES TO THE FINANCIAL STATEMENTS 2. 2. For the financial year ended 31 December 2014 SUMMARY OF SIGNIFICANT ACCOUNTING POLICIES (CONT’D) 2.12 Property, plant and equipment All items of property, plant and equipment are initially recorded at cost. Subsequent to recognition, property, plant and equipment are measured at cost less accumulated depreciation and any accumulated impairment losses. The carrying values of property, plant and equipment are reviewed for impairment when events or changes in circumstances indicate that the carrying value may not be recoverable. An item of property, plant and equipment is derecognised upon disposal or when no future economic benefits are expected from its use or disposal. Any gain or loss arising on derecognition of the asset is included in profit or loss in the financial year the asset is derecognised. 2.13Depreciation Leasehold land and improvements, and factory and office buildings - Plant and other equipment - Food court equipment - Motor vehicles - Over period of lease ranging from 5 to 50 years or useful life, whichever is shorter 1 to 10 years 6 years 3 to 6 years Fully depreciated assets are retained in the financial statements until they are no longer in use and no further charge for depreciation is made in respect of these assets. Construction-in-progress is not depreciated as the asset is not available for use. The residual value, useful life and depreciation method are reviewed at each financial year-end, and adjusted prospectively, if appropriate. 2.14 Intangible assets Intangible assets acquired separately are measured initially at cost. Following initial acquisition, intangible assets are measured at cost less any accumulated amortisation and any accumulated impairment losses. The useful lives of intangible assets are assessed as either finite or indefinite. Intangible assets with finite useful lives are amortised over the estimated useful lives and assessed for impairment whenever there is an indication that the intangible asset may be impaired. The amortisation period and method are reviewed at least at each financial year-end. Changes in the expected useful life or the expected pattern of consumption of future economic benefits embodied in the asset is accounted for by changing the amortisation period or method, as appropriate, and are treated as changes in accounting estimates. Intangible assets relating to unpatented technology, customer relationships, management service agreement, and order backlog acquired in a business combination have finite useful lives and are measured at cost less accumulated amortisation and impairment losses. These intangible assets are amortised in profit or loss on a straight-line basis over their estimated useful lives as follows: Unpatented technology Customer relationships Management service agreement Order backlog Intangible assets with indefinite useful lives or not yet available for use are tested for impairment annually, or more frequently if the events and circumstances indicate that the carrying value may be impaired either individually or at the cash-generating unit level. Such intangible assets are not amortised. The useful life of an intangible asset with an indefinite useful life is reviewed annually to determine whether the useful life assessment continues to be supportable. If not, the change in useful life from indefinite to finite is made on a prospective basis. Gains or losses arising from derecognition of an intangible asset are measured as the difference between the net disposal proceeds and the carrying amount of the asset and are recognised in profit or loss when the asset is derecognised. (i)Trademarks Depreciation of a property, plant and equipment begins when it is available for use and is calculated on the straightline method to write off the costs of property, plant and equipment over their estimated useful lives as follows :- SUMMARY OF SIGNIFICANT ACCOUNTING POLICIES (CONT’D) 2.14 Intangible assets (cont’d) For the financial year ended 31 December 2014 10 years 10 years 3 years 1 year Trademarks were acquired in business combinations. The useful life of the “Food Junction” trademark is estimated to be indefinite given that no legal, regulatory, contractual, competitive, economic or any other factors limit the life of the trademarks. The useful life of the “Malone’s” trademark was estimated to be indefinite because it was expected to contribute to net cash inflows indefinitely. As a result, trademarks would not be amortised until the useful life is determined to be finite. Trademarks would be tested for impairment in accordance with FRS 36 annually and whenever there is an indication that it may be impaired. (ii) Trademark licence agreement Trademark licence agreement (“the Agreement”) was acquired in a business combination. The Agreement relates to the right to use a trademark, and allows for automatic renewal without significant cost. As a result, management believes there is no foreseeable limit to the period over which the Agreement is expected to generate net cash inflows to the Group, and the useful life of the Agreement is estimated to be indefinite (Note 2.4(b)). 2.15 Investments in subsidiary companies A subsidiary is an investee that is controlled by the Group. The Group controls an investee when it is exposed, or has rights, to variable returns from its involvement with the investee and has the ability to affect those returns through its power over the investee. In the Company’s separate financial statements, investments in subsidiary companies are accounted for at cost less any accumulated impairment losses. 77 78 Auric Pacific Group Limited Annual Report 2014 Auric Pacific Group Limited Annual Report 2014 NOTES TO THE FINANCIAL STATEMENTS NOTES TO THE FINANCIAL STATEMENTS 2. 2. For the financial year ended 31 December 2014 SUMMARY OF SIGNIFICANT ACCOUNTING POLICIES (CONT’D) For the financial year ended 31 December 2014 SUMMARY OF SIGNIFICANT ACCOUNTING POLICIES (CONT’D) 2.16 Joint arrangements 2.17 Investment in a joint venture company and an associated company (cont’d) A joint arrangement is a contractual arrangement whereby two or more parties have joint control. Joint control is the contractually agreed sharing of control of an arrangement, which exists only when decisions about the relevant activities require the unanimous consent of the parties sharing control. When the Group’s share of losses in an associate or joint venture equals or exceeds its interest in the associate or joint venture, the Group does not recognise further losses, unless it has incurred obligations or made payments on behalf of the associate or joint venture. A joint arrangement is classified either as joint operation or joint venture, based on the rights and obligations of the parties to the arrangement. To the extent the joint arrangement provides the Group with rights to the assets and obligations for the liabilities relating to the arrangement, the arrangement is a joint operation. To the extent the joint arrangement provides the Group with rights to the net assets of the arrangement, the arrangement is a joint venture. After application of the equity method, the Group determines whether it is necessary to recognise an additional impairment loss on the Group’s investment in associate or joint ventures. The Group determines at the end of each reporting period whether there is any objective evidence that the investment in the associate or joint venture is impaired. If this is the case, the Group calculates the amount of impairment as the difference between the recoverable amount of the associate or joint venture and its carrying value and recognises the amount in profit or loss. (a) Joint operations The financial statements of the associates and joint ventures are prepared as the same reporting date as the Company. Where necessary, adjustments are made to bring the accounting policies in line with those of the Group. The Group recognises in relation to its interest in a joint operation, 2.18 Financial assets (a) (b) (c) (d) (e) Initial recognition and measurement Financial assets are recognised when, and only when, the Group becomes a party to the contractual provisions of the financial instrument. The Group determines the classification of its financial assets at initial recognition. The Group does not have any financial assets designated as held-to-maturity investments. The Group accounts for the assets, liabilities, revenues and expenses relating to its interest in a joint operation in accordance with the accounting policies applicable to the particular assets, liabilities, revenues and expenses. When financial assets are recognised initially, they are measured at fair value, plus, in the case of financial assets not at fair value through profit or loss, directly attributable transaction costs. Subsequent measurement The subsequent measurement of financial assets depends on their classification as follows: Financial assets at fair value through profit or loss Financial assets at fair value through profit or loss include financial assets held-for-trading and financial assets designated upon initial recognition at fair value through profit and loss. Financial assets are classified as heldfor-trading if they are acquired for the purpose of selling or repurchasing in the near term. This category includes derivative financial instruments entered into by the Group. Derivatives, including separated embedded derivatives are also classified as held for trading. Subsequent to initial recognition, financial assets at fair value through profit or loss are measured at fair value. Any gains or losses arising from changes in fair value of the financial assets are recognised in profit or loss. Net gains or net losses on financial assets at fair value through profit or loss include exchange differences, interest and dividend income. Available-for-sale financial assets Available-for-sale financial assets include equity securities. Equity investments classified as available-for-sale are those, which are neither classified as held-for-trading nor designated at fair value through profit or loss. After initial recognition, available-for-sale financial assets are subsequently measured at fair value. Any gains or losses from changes in fair value of the financial asset are recognised in other comprehensive income, except that impairment losses, foreign exchange gains and losses on monetary instruments and interest calculated using the effective interest method are recognised in profit or loss. The cumulative gain or loss previously recognised in other comprehensive income is reclassified from equity to profit or loss as a reclassification adjustment when the financial asset is derecognised. its assets, including its share of any assets held jointly; its liabilities, including its share of any liabilities incurred jointly; its revenue from the sale of its share of the output arising from the joint operation; its share of the revenue from the sale of the output by the joint operation; and its expenses, including its share of any expenses incurred jointly. (b) Joint ventures The Group recognises its interest in a joint venture as an investment and accounts for the investment using the equity method. The accounting policy for investment in joint venture is set out in Note 2.17. 2.17 Investment in a joint venture company and an associated company An associate is an entity over which the Group has the power to participate in the financial and operating policy decisions of the investee but does not have control or joint control of those policies. The Group account for its investments in associates and joint ventures using the equity method from the date on which it becomes an associate or joint venture. On acquisition of the investment, any excess of the cost of the investment over the Group’s share of the net fair value of the investee’s identifiable assets and liabilities is accounted as goodwill and is included in the carrying amount of the investment. Any excess of the Group’s share of the net fair value of the investee’s identifiable assets and liabilities over the cost of the investment is included as income in the determination of the entity’s share of the associate or joint venture’s profit or loss in the period in which the investment is acquired. Under the equity method, the investment in associates or joint ventures are carried in the balance sheet at cost plus post-acquisition changes in the Group’s share of net assets of the associates or joint ventures. The profit or loss reflects the share of results of the operations of the associates or joint ventures. Distributions received from joint ventures or associates reduce the carrying amount of the investment. Where there has been a change recognised in other comprehensive income by the associates or joint venture, the Group recognises its share of such changes in other comprehensive income. Unrealised gains and losses resulting from transactions between the Group and associate or joint venture are eliminated to the extent of the interest in the associates or joint ventures. 79 80 Auric Pacific Group Limited Annual Report 2014 Auric Pacific Group Limited Annual Report 2014 NOTES TO THE FINANCIAL STATEMENTS NOTES TO THE FINANCIAL STATEMENTS 2. 2. For the financial year ended 31 December 2014 SUMMARY OF SIGNIFICANT ACCOUNTING POLICIES (CONT’D) 2.18 Financial assets (cont’d) For the financial year ended 31 December 2014 SUMMARY OF SIGNIFICANT ACCOUNTING POLICIES (CONT’D) 2.21 Impairment of assets Subsequent measurement (cont’d) Available-for-sale financial assets (cont’d) The Group assesses at the end of each reporting period whether there is any objective evidence that a financial asset is impaired. Investments in equity securities whose fair value cannot be reliably measured are measured at cost less any accumulated impairment losses. Financial assets carried at amortised cost Loans and receivables Non-derivative financial assets with fixed or determinable payments that are not quoted in an active market are classified as loans and receivables. Subsequent to initial recognition, loans and receivables are measured at amortised cost using the effective interest method, less impairment. Gains and losses are recognised in profit or loss when the loans and receivables are derecognised or impaired, and through the amortisation process. For financial assets carried at amortised cost, the Group first assesses whether objective evidence of impairment exists individually for financial assets that are individually significant, or collectively for financial assets that are not individually significant. If the Group determines that no objective evidence of impairment exists for an individually assessed financial asset, whether significant or not, it includes the asset in a group of financial assets with similar credit risk characteristics and collectively assesses them for impairment. Assets that are individually assessed for impairment and for which an impairment loss is, or continues to be recognised are not included in a collective assessment of impairment. If there is objective evidence that an impairment loss on financial assets carried at amortised cost has incurred, the amount of the loss is measured as the difference between the asset’s carrying amount and the present value of estimated future cash flows discounted at the financial asset’s original effective interest rate. The carrying amount of the asset is reduced through the use of an allowance account. The impairment loss is recognised in profit or loss. When the asset becomes uncollectible, the carrying amount of impaired financial assets is reduced directly or if an amount was charged to the allowance account, the amounts charged to the allowance account are written off against the carrying value of the financial asset. To determine whether there is objective evidence that an impairment loss on financial assets has been incurred, the Group considers factors such as the probability of insolvency or significant financial difficulties of the debtor and default or significant delay in payments. If in a subsequent period, the amount of the impairment loss decreases and the decrease can be related objectively to an event occurring after the impairment was recognised, the previously recognised impairment loss is reversed to the extent that the carrying amount of the asset does not exceed its amortised cost at the reversal date. The amount of reversal is recognised in profit or loss. Financial assets carried at cost If there is objective evidence (such as significant adverse changes in the business environment where the issuer operates, probability of insolvency or significant financial difficulties of the issuer) that an impairment loss on financial assets carried at cost has been incurred, the amount of the loss is measured as the difference between the asset’s carrying amount and the present value of estimated future cash flows discounted at the current market rate of return for a similar financial asset. Such impairment losses are not reversed in subsequent periods. De-recognition A financial asset is derecognised where the contractual right to receive cash flows from the asset has expired. On de-recognition of a financial asset in its entirety, the difference between the carrying amount and the sum of the consideration received and any cumulative gain or loss that had been recognised directly in other comprehensive income is recognised in profit or loss. 2.19 Cash and cash equivalents (a) Impairment of financial assets Cash and cash equivalents comprise cash at bank and on hand, demand deposits, and short-term, highly liquid investments that are readily convertible to known amount of cash and which are subject to an insignificant risk of changes in value. These also include bank overdrafts that form an integral part of the Group’s cash management. 2.20Stocks Stocks are stated at the lower of cost and net realisable value. Costs incurred in bringing the stocks to their present location and condition are accounted for as follows: • Raw materials and stores: Purchase costs on a weighted-average basis; and • Finished goods and goods for sale: Costs of direct materials, labour and production overheads based on the level of normal activity, assigned on a weighted-average basis. Where necessary, allowance is provided for damaged, obsolete and slow-moving items to adjust the carrying value of inventories to the lower of cost and net realisable value. Net realisable value is the estimated selling price in the ordinary course of business, less estimated costs of completion and the estimated costs necessary to make the sale. Available-for-sale financial assets In the case of equity investments classified as available-for-sale, objective evidence of impairment include (i) significant financial difficulty of the issuer or obligor, (ii) information about significant changes with an adverse effect that have taken place in the technological, market, economic or legal environment in which the issuer operates, and indicates that the cost of the investment in equity instrument may not be recovered; and (iii) a significant or prolonged decline in the fair value of the investment below its costs. 81 82 Auric Pacific Group Limited Annual Report 2014 Auric Pacific Group Limited Annual Report 2014 NOTES TO THE FINANCIAL STATEMENTS NOTES TO THE FINANCIAL STATEMENTS 2. 2. For the financial year ended 31 December 2014 SUMMARY OF SIGNIFICANT ACCOUNTING POLICIES (CONT’D) For the financial year ended 31 December 2014 SUMMARY OF SIGNIFICANT ACCOUNTING POLICIES (CONT’D) 2.21 Impairment of assets (cont’d) 2.22 Financial liabilities (cont’d) Financial liabilities at fair value through profit or loss (cont’d) Subsequent to initial recognition, financial liabilities at fair value through profit or loss are measured at fair value. Any gains or losses arising from changes in fair value of the financial liabilities are recognised in profit or loss. The Group has designated the redeemable preference shares issued by a subsidiary company upon initial recognition at fair value through profit or loss. Derecognition A financial liability is derecognised when the obligation under the liability is discharged or cancelled or expires. When an existing financial liability is replaced by another from the same lender on substantially different terms, or the terms of an existing liability are substantially modified, such an exchange or modification is treated as a derecognition of the original liability and the recognition of a new liability, and the difference in the respective carrying amounts is recognised in profit or loss. (a) Impairment of financial assets (cont’d) Available-for-sale financial assets (cont’d) If an available-for-sale financial asset is impaired, an amount comprising the difference between its acquisition cost (net of any principal repayment and amortisation) and its current fair value, less any impairment loss previously recognised in profit or loss is transferred from other comprehensive income and recognised in profit or loss. Reversals of impairment losses in respect of equity instruments are not recognised in profit or loss; increase in their fair value after impairment are recognised directly in other comprehensive income. (b) Impairment of non-financial assets The Group assesses at each reporting date whether there is an indication that an asset may be impaired. If any indication exists, or when an annual impairment testing for an asset is required, the Group makes an estimate of the asset’s recoverable amount. An asset’s recoverable amount is the higher of an asset’s or cash-generating unit’s fair value less costs of disposal and its value in use and is determined for an individual asset, unless the asset does not generate cash inflows that are largely independent of those from other assets or group of assets. Where the carrying amount of an asset or cash-generating unit exceeds its recoverable amount, the asset is considered impaired and is written down to its recoverable amount. A previously recognised impairment loss is reversed only if there has been a change in the estimates used to determine the asset’s recoverable amount since the last impairment loss was recognised. If that is the case, the carrying amount of the asset is increased to its recoverable amount. That increase cannot exceed the carrying amount that would have been determined, net of depreciation, had no impairment loss been recognised previously. Such reversal is recognised in profit or loss unless the asset is measured at revalued amount, in which case the reversal is treated as a revaluation increase. 2.22 Financial liabilities 2.23 Redeemable preference shares Redeemable preference shares issued by a subsidiary company relate to the Group’s real estate fund investment activities and were classified as financial liabilities at fair value through profit or loss. The liabilities arising from the redeemable shares were carried at the redemption amount being the net asset value calculated in accordance with FRS. For the purpose of calculating the net assets attributable to shareholders in accordance with the redemption requirements, the assets and liabilities relating to the real estate fund investment activities were measured at fair value. 2.24Provisions Initial recognition and measurement Financial liabilities are recognised when, and only when, the Group becomes a party to the contractual provisions of the financial instrument. The Group determines the classification of its financial liabilities at initial recognition. All financial liabilities are recognised initially at fair value plus, in the case of financial liabilities not at fair value through profit or loss, directly attributable transaction costs. Subsequent measurement Financial liabilities at amortised cost After initial recognition, financial liabilities that are not carried at fair value through profit or loss are subsequently measured at amortised cost using the effective interest method. Gains and losses are recognised in profit or loss when the liabilities are derecognised, and through the amortisation process. 2.25Taxes Financial liabilities at fair value through profit or loss Financial liabilities at fair value through profit or loss include financial liabilities held for trading. Financial liabilities are classified as held for trading if they are acquired for the purpose of selling in the near term. This category includes derivative financial instruments entered into by the Group that are not designated as hedging instruments in hedge relationships. Separated embedded derivatives are also classified as held for trading unless they are designated as effective hedging instruments. Provisions are recognised when the Group has a present obligation (legal or constructive) as a result of a past event, it is probable that an outflow of resources embodying economic benefits will be required to settle the obligation, and the amount of the obligation can be estimated reliably. Provisions are reviewed at the end of each reporting period and adjusted to reflect the current best estimate. If it is no longer probable that an outflow of economic resources will be required to settle the obligation, the provision is reversed. If the effect of the time value of money is material, provisions are discounted using a current pre tax rate that reflects, where appropriate, the risks specific to the liability. When discounting is used, the increase in the provision due to the passage of time is recognised as a finance cost. (a) Current income tax Current income tax assets and liabilities for the current and prior periods are measured at the amount expected to be recovered from or paid to the taxation authorities. The tax rates and tax laws used to compute the amount are those that are enacted or substantively enacted at the end of the reporting period, in the countries where the Group operates and generates taxable income. 83 84 Auric Pacific Group Limited Annual Report 2014 Auric Pacific Group Limited Annual Report 2014 NOTES TO THE FINANCIAL STATEMENTS NOTES TO THE FINANCIAL STATEMENTS 2. 2. For the financial year ended 31 December 2014 SUMMARY OF SIGNIFICANT ACCOUNTING POLICIES (CONT’D) For the financial year ended 31 December 2014 SUMMARY OF SIGNIFICANT ACCOUNTING POLICIES (CONT’D) 2.25 Taxes (cont’d) 2.25 Taxes (cont’d) (a) Current income tax (cont’d) Current income taxes are recognised in profit or loss except to the extent that the tax relating to items recognised outside profit or loss, either in other comprehensive income or directly in equity. Management periodically evaluates positions taken in the tax returns with respect to situations in which applicable tax regulations are subject to interpretation and establishes provisions where appropriate. (c) Goods and services tax (b) Deferred tax Revenues, expenses and assets are recognised net of the amount of goods and services tax, except: • Where the goods and services tax incurred on a purchase of assets or services is not recoverable from the taxation authority, in which case the goods and services tax is recognised as part of the cost of acquisition of the asset or as part of the expense item as applicable; and • Receivables and payables that are stated with the amount of goods and services tax included. Deferred tax is provided, using the liability method on temporary differences at the end of the reporting period between the tax bases of assets and liabilities and their carrying amounts for financial reporting purposes. 2.26Leases Deferred tax liabilities are recognised for all temporary differences, except: • Where the deferred tax liability arises from the initial recognition of goodwill or of an asset or liability in a transaction that is not a business combination and, at the time of the transaction, affects neither the accounting profit nor taxable profit or loss; and • In respect of taxable temporary differences associated with investments in subsidiary companies, associated company and joint venture company, where the timing of the reversal of the temporary differences can be controlled and it is probable that the temporary differences will not reverse in the foreseeable future. Deferred tax assets are recognised for all deductible temporary differences, carry-forward of unused tax credits and unused tax losses, to the extent that it is probable that taxable profit will be available against which the deductible temporary differences, and the carry-forward of unused tax credits and unused tax losses can be utilised, except: • • Where the deferred tax asset relating to the deductible temporary difference arises from the initial recognition of an asset or liability in a transaction that is not a business combination and, at the time of the transaction, affects neither the accounting profit nor taxable profit or loss; and In respect of deductible temporary differences associated with investments in subsidiary companies, associated company and joint venture company, deferred tax assets are recognised only to the extent that it is probable that the temporary differences will reverse in the foreseeable future and taxable profit will be available against which the temporary differences can be utilised. The carrying amount of deferred tax assets is reviewed at the end of each reporting period and reduced to the extent that it is no longer probable that sufficient taxable profit will be available to allow all or part of the deferred tax asset to be utilised. Unrecognised deferred tax assets are reassessed at the end of each reporting period and are recognised to the extent that it has become probable that future taxable profit will allow the deferred tax asset to be recovered. Deferred tax assets and liabilities are measured at the tax rates that are expected to apply in the year when the asset is realised or the liability is settled, based on tax rates (and tax laws) that have been enacted or substantively enacted at the end of each reporting period. Deferred tax relating to items recognised outside profit or loss is recognised outside profit or loss. Deferred tax items are recognised in correlation to the underlying transaction either in other comprehensive income or directly in equity and deferred tax arising from a business combination is adjusted against goodwill on acquisition. (a) As lessee Finance leases, which transfer to the Group substantially all the risks and rewards incidental to ownership of the leased item are capitalised at the inception of the lease at the fair value of the leased asset or, if lower, at the present value of the minimum lease payments. Any initial direct costs are also added to the amount capitalised. Lease payments are apportioned between the finance charges and reduction of the lease liability so as to achieve a constant rate of interest on the remaining balance of the liability. Finance charges are charged to profit or loss. Contingent rents, if any, are charged as expenses in the periods in which they are incurred. Capitalised leased assets are depreciated over the shorter of the estimated useful life of the asset and the lease term, if there is no reasonable certainty that the Group will obtain ownership by the end of the lease term. Operating lease payments are recognised as an expense in profit or loss on a straight-line basis over the lease term. The aggregate benefit of incentives provided by the lessor is recognised as a reduction of rental expense over the lease term on a straight-line basis. (b) As lessor Leases where the Group retains substantially all the risks and rewards of ownership of the asset are classified as operating leases. Initial direct costs incurred in negotiating an operating lease are added to the carrying amount of the leased asset and recognised over the lease term on the same bases as rental income. The accounting policy for rental income is set out in Note 2.8(c). Contingent rents are recognised as revenue in the period in which they are earned. 2.27 Segment reporting For management purposes, the Group is organised into operating segments based on their products and services which are independently managed by the respective segment managers responsible for the performance of the respective segments under their charge. The segment managers report directly to the management of the Company who regularly reviews the segment results in order to allocate resources to the segments and to assess the segment performance. Additional disclosures on each of these segments are shown in Note 37 to the financial statements, including the factors used to identify the reportable segments and the measurement basis of segment information. 85 86 Auric Pacific Group Limited Annual Report 2014 Auric Pacific Group Limited Annual Report 2014 NOTES TO THE FINANCIAL STATEMENTS NOTES TO THE FINANCIAL STATEMENTS 2. 3.REVENUE For the financial year ended 31 December 2014 SUMMARY OF SIGNIFICANT ACCOUNTING POLICIES (CONT’D) 2.28Contingencies A contingent liability is: (a) a possible obligation that arises from past events and whose existence will be confirmed only by the occurrence or non-occurrence of one or more uncertain future events not wholly within the control of the Group; or (b) a present obligation that arises from past events but is not recognised because: (i) It is not probable that an outflow of resources embodying economic benefits will be required to settle the obligation; or (ii) The amount of the obligation cannot be measured with sufficient reliability. A contingent asset is a possible asset that arises from past events and whose existence will be confirmed only by the occurrence or non-occurrence of one or more uncertain future events not wholly within the control of the Group. Contingent liabilities and assets are not recognised on the balance sheet of the Group, except for contingent liabilities assumed in a business combination that are present obligations and which the fair values can be reliably determined. 2.29 Related parties A related party is defined as follows: (a) A person or a close member of that person’s family is related to the Group and Company if that person: (i) Has control or joint control over the Company; For the financial year ended 31 December 2014 Revenue is made up of the following: Sales of goods Sales of food and beverage Fees charged to food court tenants (including variable fee) Interest income * Dividend income from quoted investment securities Royalty and franchise income * Interest income: - Mezzanine loan - Fixed deposits, and cash and bank balances 4. Group 2014 2013 $’000 $’000 286,100 115,897 22,065 12 300 50 424,424 – 12 12 260,626 114,597 21,253 1,417 485 104 398,482 1,374 43 1,417 COST OF REVENUE Cost of goods sold Cost of food and beverage Cost of goods manufactured Group 2014 2013 $’000 $’000 (178,045) (39,692) (26,443) (244,180) (163,116) (39,423) (24,662) (227,201) (ii) Has significant influence over the Company; or (iii) Is a member of the key management personnel of the Group or Company or of a parent of the Company. (b) An entity is related to the Group and the Company if any of the following conditions applies: (i) The entity and the Company are members of the same group (which means that each parent, subsidiary and fellow subsidiary is related to the others). (ii) One entity is an associate or joint venture of the other entity (or an associate or joint venture of a member of a group of which the other entity is a member). (iii) Both entities are joint ventures of the same third party. (iv) One entity is a joint venture of a third entity and the other entity is an associate of the third entity. (v) The entity is a post-employment benefit plan for the benefit of employees of either the Company or an entity related to the Company. If the Company is itself such a plan, the sponsoring employers are also related to the Company; (vi) The entity is controlled or jointly controlled by a person identified in (a); (vii) A person identified in (a) (i) has significant influence over the entity or is a member of the key management personnel of the entity (or of a parent of the entity). 5. OTHER REVENUE AND OTHER OPERATING EXPENSES (a) Other revenue Other revenue included the following for the financial years ended 31 December: Group 2014 2013 $’000 $’000 991 134 8 40 26 1,006 Recovery of costs from tenants Income from expired coupons Finance income on rental deposits Income from forfeiture of deposits Marketing and sponsorship income received from suppliers Government assistance schemes 460 58 199 349 102 398 87 88 Auric Pacific Group Limited Annual Report 2014 Auric Pacific Group Limited Annual Report 2014 NOTES TO THE FINANCIAL STATEMENTS NOTES TO THE FINANCIAL STATEMENTS 5. 8. PROFIT/(LOSS) BEFORE TAXATION Profit/(loss) before taxation included the following for the financial years ended 31 December: For the financial year ended 31 December 2014 For the financial year ended 31 December 2014 OTHER REVENUE AND OTHER OPERATING EXPENSES (CONT’D) (b) Other operating expenses Other operating expenses included the following for the financial years ended 31 December: 6. Operating lease expenses (including variable rental expenses) Repairs and maintenance Utilities expenses Exceptional items are made up of the following: - Allowance for impairment of intangible assets - Allowance for impairment on unquoted investment funds - Allowance for impairment of property, plant and equipment - Accelerated depreciation of property, plant and equipment - Accrual for closure costs - Accrual for a regulatory claim 7. (41,771) (3,726) (10,054) (40,220) (3,122) (9,853) EXCEPTIONAL ITEMS Group 2014 2013 $’000 $’000 Group 2014 2013 $’000 $’000 (463) – – – (2,822) – (3,285) (10,000) (3,000) (4,430) (1,095) (2,230) (806) (21,561) These exceptional items relate to non-performing restaurants, food courts and retail outlets under certain entities. These included allowance for impairment of property, plant and equipment, impairment of goodwill and trademark, and accrual of closure costs such as rental penalties and severance payments. In 2013, there was also an allowance made for the impairment of unquoted investment funds as the recoverable values were assessed to be lower than the carrying values. FINANCE COSTS Finance costs are made up of the following: - Bank borrowings - Obligations under finance leases - Others Group 2014 2013 $’000 $’000 (240) (16) (115) (371) (258) (10) (131) (399) Advertising and promotional expenses Allowance for impairment on property, plant and equipment - classified under general and administration expenses - classified under exceptional items Allowance for impairment on trade debtors Allowance for impairment on unquoted investment funds - classified under investment related activities - classified under exceptional items Amortisation of intangible assets Bad debts recovered Depreciation of property, plant and equipment Write-off of non-trade debtor Employee benefits expense: - Salaries, bonuses and related expenses - Contributions to defined contribution plans Fair value changes of financial instruments: - Loss on redeemable preference shares issued by a subsidiary company - (Loss)/gain on investment funds at fair value through profit or loss Fees paid to: - Auditors of the Company • Audit services • Non-audit services - Other auditors • Audit services • Non-audit services Impairment loss on intangible assets Net foreign exchange gain Net gain/(loss) on disposal of property, plant and equipment Operating lease expenses (including contingent rent): - classified under other operating expenses - classified under general and administration expenses Property, plant and equipment written off Gain on disposal of interest in subsidiary companies Remuneration paid to:- - Directors of the Company: Fees paid to directors Salaries, bonuses and related expenses Contributions to defined contribution plans - Directors of the subsidiary companies and other key management personnel: Fees paid to directors of the subsidiary companies Salaries, bonuses and related expenses Contributions to defined contribution plans Stocks recognised as an expense in cost of sales Group 2013 2012 $’000 $’000 (13,910) (10,584) – – (759) (81) (4,430) (742) – – (2,800) – (12,937) (101) (47) (3,000) (2,800) 1 (14,661) – (66,477) (6,911) (64,044) (6,462) – (329) (814) 75 (626) (187) (639) (211) (176) (63) (463) 900 29 (165) (38) (10,000) 1,934 (51) (41,771) (630) (62) 1,734 (40,220) (1,040) (314) – (574) (1,465) (13) (492) (1,266) (11) – (2,282) (87) (178) (1,445) (55) (221,517) (207,774) 89 90 Auric Pacific Group Limited Annual Report 2014 Auric Pacific Group Limited Annual Report 2014 NOTES TO THE FINANCIAL STATEMENTS NOTES TO THE FINANCIAL STATEMENTS 9. INCOME TAX EXPENSE 9. INCOME TAX EXPENSE (CONT’D) Major components of income tax expense The nature of expenses that are not deductible for income tax purpose included the following: The major components of income tax expense for the financial years ended 31 December 2014 and 2013 are: Group 2014 2013 $’000 $’000 Depreciation for non-qualifying assets Fair value loss on redeemable preference shares issued by a subsidiary company Entertainment and private car expenses Impairment for intangible assets Impairment for property, plant and equipment Accrual for closure costs 1,228 – 172 79 – 480 Income not subject to taxation purpose included the following: For the financial year ended 31 December 2014 Consolidated income statement: Current income tax: Current income taxation Overprovision in respect of previous years Deferred income tax: Origination and reversal of temporary differences Overprovision in respect of previous years Income tax expense recognised in profit or loss For the financial year ended 31 December 2014 Group 2014 2013 $’000 $’000 (3,332) 2,372 (960) (3,093) 964 (2,129) 328 168 496 (464) 286 511 797 (1,332) Relationship between tax expense and accounting profit/(loss) Profit/(loss) before taxation Tax calculated at the domestic tax rate of 17% (2013: 17%) Adjustments: Temporary differences not recognised Different tax rates of subsidiary companies operating in other jurisdictions Non-deductible expenses Income not subject to taxation Effect of partial tax exemption and tax relief Share of results of an associated company and a joint venture company Deferred tax on royalty and interest incomes Overprovision in respect of previous years for current and deferred income taxes Income tax expense recognised in profit or loss Group 2014 2013 $’000 $’000 639 (21,912) 109 (3,725) 1,019 1,903 688 2,935 (675) (847) (130) (95) (2,540) 464 486 5,698 (875) (731) (141) 192 (1,475) 1,332 Group 2014 2013 $’000 $’000 Income from foreign subsidiary companies not subject to taxation Gain from disposal of foreign subsidiary companies (a) In 2014, in relation to the Singapore Group Relief System, the Group had utilised tax losses and capital allowances of approximately $2,907,000 (2013: $2,630,000) and $2,176,000 (2013: $3,000) respectively to set off the assessable income for year of assessment 2014 of certain companies within the Group. The utilisation of tax losses and capital allowances under the Singapore Group Relief System is subject to compliance with the relevant rules and procedures and agreement of the Inland Revenue Authority of Singapore. (b) As at 31 December 2014, the Group has unutilised tax losses of approximately $19,235,000 (2013: $14,220,000) and unabsorbed capital allowances of $5,451,000(2013: $5,276,000) that are available for offset against future taxable income, subject to compliance with the relevant rules and procedures and agreement of the respective tax authorities. No deferred tax assets are recognised due to uncertainty of recoverability. The Group has unutillised tax losses that will expire within the next 5 years as follows: The reconciliation between tax expense and the product of accounting profit/(loss) multiplied by the applicable corporate tax rate for the financial years ended 31 December 2014 and 2013 are as follows: 1,446 138 95 1,700 753 379 2015 2016 2017 2018 2019 – (230) (421) – 2014 $’000 2013 $’000 591 3,149 2,517 1,566 1,369 9,192 452 693 3,149 2,517 1,566 8,377 91 92 Auric Pacific Group Limited Annual Report 2014 Auric Pacific Group Limited Annual Report 2014 NOTES TO THE FINANCIAL STATEMENTS NOTES TO THE FINANCIAL STATEMENTS 10. EARNINGS PER SHARE (CONT’D) 11. PROPERTY, PLANT AND EQUIPMENT (CONT’D) Basic earnings per share are calculated by dividing the “profit for the financial year, net of taxation, attributable to owners of the Company” by the weighted average number of ordinary shares outstanding during the financial year of 125,667,324 (2013: 125,667,324). Diluted earnings per share are calculated by dividing the “profit for the financial year, net of taxation, attributable to owners of the Company” by the weighted average number of ordinary shares outstanding during the financial year for diluted earnings per share computation of 125,667,324 (2013: 125,667,324). As there was no unexpired share option scheme and no warrants granted, the basic and diluted earnings per share are the same. The following tables reflect the profit and share data used in the computation of basic and diluted earnings per share for the financial years ended 31 December: For the financial year ended 31 December 2014 For the financial year ended 31 December 2014 Profit/(loss) for the year attributable to owners of the Company Weighted average number of ordinary shares for basic earnings per share computation (‘000) Group 2014 2013 $’000 $’000 231 125,667 Leasehold land and improvements, Conand factory Plant Food structionand office and other court Motor inbuildings equipment equipment vehicles progress $’000 $’000 $’000 $’000 $’000 Group Cost Balance at 1 January 2013 31,503 43,983 3,673 Additions * 8,219 4,938 478 Disposals (664) (728) (33) Write-offs (1,816) (1,764) (165) Reclassification – 35 – Translation differences 597 (345) (15) Balance at 31 December 2013 and 1 January 2014 37,839 46,119 3,938 Additions * 11,046 5,948 1,032 Disposals (1,401) (74) (77) Write-offs (3,625) (3,424) (649) Translation differences 386 (14) (178) Balance at 31 December 2014 44,245 48,555 4,066 (21,943) 125,667 Total $’000 1,791 411 – – – (8) 408 81,358 67 14,113 – (1,425) – (3,745) (35) – (67) 162 2,194 796 (304) (107) (19) 373 90,463 87 18,909 – (1,856) (310) (8,115) – 175 2,560 150 99,576 Leasehold land and improvements, Conand factory Plant Food structionand office and other court Motor inbuildings equipment equipment vehicles progress $’000 $’000 $’000 $’000 $’000 Group Accumulated depreciation and impairment loss Balance at 1 January 2013 (17,604) (20,233) (1,142) Charge for the financial year (Note 8) (8,442) (4,953) (1,202) Impairment loss (2,776) (1,045) (690) Disposals 607 668 31 Write-offs 1,686 1,593 152 Translation differences (420) 273 24 Balance at 31 December 2013 and 1 January 2014 (26,949) (23,697) (2,827) Charge for the financial year (Note 8) (7,630) (4,491) (641) Disposals 1,353 74 76 Write-offs 3,618 3,375 643 Translation differences (392) 133 184 Balance at 31 December 2014 (30,000) (24,606) (2,565) Net carrying amount As at 31 December 2013 10,890 22,422 1,111 As at 31 December 2014 14,245 23,949 1,501 Total $’000 (1,706) (361) (41,046) (64) – – – 6 – (14,661) – (4,511) – 1,306 – 3,431 – (117) (1,764) (361) (55,598) (175) 304 107 35 – (12,937) – 1,807 310 8,053 – (40) (1,493) (51) (58,715) 430 12 34,865 1,067 99 40,861 * Included in additions for the financial year were $215,000 (2013: $349,000) of obligations under finance leases and $579,000 (2013: $812,000) of reinstatement costs for dismantling, removal and restoration of property, plant and equipment which was provided for (Note 24). Cash payments of $18,115,000 (2013: $12,952,000) were made to purchase property, plant and equipment during the financial year. 93 94 Auric Pacific Group Limited Annual Report 2014 Auric Pacific Group Limited Annual Report 2014 NOTES TO THE FINANCIAL STATEMENTS NOTES TO THE FINANCIAL STATEMENTS 11. PROPERTY, PLANT AND EQUIPMENT (CONT’D) 12. INTANGIBLE ASSETS For the financial year ended 31 December 2014 Company Cost Balance at 1 January 2013 Additions Balance at 31 December 2013 and 1 January 2014 Additions Disposals Balance at 31 December 2014 Accumulated depreciation Balance at 1 January 2013 Charge for the financial year Balance at 31 December 2013 and 1 January 2014 Charge for the financial year Disposals Balance at 31 December 2014 Net carrying amount As at 31 December 2013 As at 31 December 2014 For the financial year ended 31 December 2014 Office Equipment $’000 Order backlog $’000 Total $’000 Group 1,798 131 1,929 46 (4) 1,971 (1,310) (255) (1,565) (174) 2 (1,737) 364 234 Assets held under finance leases The carrying amount of plant and equipment of the Group held under finance lease obligations as at 31 December 2014 is $223,000 (2013: $374,000). Leased assets are pledged as security for the related finance lease obligations (Note 26). Impairment of assets Manage Goodwill Trademark Customer ment on con- Trade- licence Unpatented relation- service solidation marks agreement technology ships agreement $’000 $’000 $’000 $’000 $’000 $’000 In 2013, an impairment loss of $4,430,000 was recognised in “exceptional items” in the statement of comprehensive income as the Group intended to cease the operations of several loss-making retail outlets of certain entities. In addition, an impairment loss of $81,000 was recognised in “general and administration expenses” line item of the statement of comprehensive income for the financial year ended 31 December 2013. Cost Balance at 1 January 2013 37,412 20,638 32,495 14,245 Translation differences (112) – – – Balance at 31 December 2013 and 1 January 2014 37,300 20,638 32,495 14,245 Translation differences (48) – – – Balance at 31 December 2014 37,252 20,638 32,495 14,245 Accumulated amortisation and impairment loss Balance at 1 January 2013 (9,193) (3,514) – (7,124) Charge for the financial year (Note 8) – – – (1,424) Allowance for impairment (Note 8) (10,000) – – – Balance at 31 December 2013 and 1 January 2014 (19,193) (3,514) – (8,548) Charge for the financial year (Note 8) – – – (1,424) Allowance for impairment (Note 8) – (463) – – Balance at 31 December 2014 (19,193) (3,977) – (9,972) Net carrying amount Balance at 31 December 2013 18,107 17,124 32,495 5,697 Balance at 31 December 2014 18,059 16,661 32,495 4,273 14,802 216 92 119,900 – – 14,802 216 – – 14,802 216 92 119,740 (6,948) (216) (92) (27,087) (1,376) – – – – – (10,000) (8,324) (216) (92) (39,887) (1,376) – – (2,800) – – – (463) (9,700) (216) 6,478 – – 79,901 5,102 – – 76,590 – (112) 92 119,788 – (48) (2,800) (92) (43,150) 95 96 Auric Pacific Group Limited Annual Report 2014 Auric Pacific Group Limited Annual Report 2014 NOTES TO THE FINANCIAL STATEMENTS NOTES TO THE FINANCIAL STATEMENTS 12. INTANGIBLE ASSETS (CONT’D) 12. INTANGIBLE ASSETS (CONT’D) For the financial year ended 31 December 2014 (a) Amortisation expense Trademarks relate to “Food Junction” trademarks and the useful lives of these trademarks are estimated to be indefinite. Trademark licence agreement relates to the right to use the “Delifrance” trademark granted under a licence agreement. The useful life of this trademark licence agreement is estimated to be indefinite. Unpatented technology relates to Delifrance’s Modified Sons Vide Process for the Group’s food retail business, which allows for the preparation of food to reduce wastage significantly, increases the shelf life of the food items, and reduces the time required to reheat food significantly. The remaining amortisation period of unpatented technology is 3 (2013: 4) years. Customer relationships relate to tenancy agreements between the stallholders and the food court operators in the food court business. The remaining amortisation period is 3 (2013: 4) years. Management service agreement relates to the trademark license agreement between a subsidiary company of the Group and its licensee for the provision of management services to the licensee. The amortisation of unpatented technology, customer relationships, and management service agreement are included in the “Selling and marketing, and Other operating expenses” line items in profit or loss. (b) Impairment testing of goodwill on consolidation, trademarks and trademark license agreement Goodwill, trademarks and trademark license agreement acquired through business combinations have been allocated to the Group’s cash-generating units (“CGU”), which are also the reportable operating segments, for impairment testing, as per the following: - Wholesale and Distribution - Manufacturing - Food Retail - Food Courts The carrying amount of goodwill and intangible assets with indefinite life allocated to each CGU is as follows: Trademarks andPre-tax Trademark Compoundeddiscount licence revenueLong-term rate Allocated CGU Goodwill agreement growth growth per 2014 2014 rate ratesannum $’000 $’000 % % % Wholesale and Distribution Auric Chun Yip Sdn Bhd (i) 2,846 – 10.9 3.0 14.4 Manufacturing Auric Pacific Food Processing Sdn Bhd (i) 176 – 12.9 3.0 17.7 Food Retail Edmontor Investments Pte Ltd (ii) 1,449 32,495 16.3 3.3 18.5 Food Courts Food Junction Holdings Limited (iii) 10,101 16,661 15.7 3.1 18.5 Food Courts Malones Holdings Pte Ltd (iv) – – – Nil Nil Food Courts All Around Limited (v) 3,487 – 0.9 2.5 12.6 18,059 49,156 For the financial year ended 31 December 2014 (b) Impairment testing of goodwill on consolidation, trademarks and trademark license agreement (cont’d) Trademarks andPre-tax Trademark Compoundeddiscount licence revenueLong-term rate Allocated CGU Goodwill agreement growth growth per 2014 2014 rate ratesannum $’000 $’000 % % % Wholesale and Distribution Auric Chun Yip Sdn Bhd (i) 2,891 – 12.5 3.0 16.0 Manufacturing Auric Pacific Food Processing Sdn Bhd (i) 179 – 13.2 3.0 17.7 Food Retail Edmontor Investments Pte Ltd (ii) 1,449 32,495 15.8 2.8 16.9 Food Courts Food Junction Holdings Limited (iii) 10,101 16,661 9.3 2.6 20.2 Food Courts Malones Holdings Pte Ltd (iv) – 463 9.4 2.5 12.2 Food Courts All Around Limited (v) 3,487 – 9.9 2.5 12.6 18,107 49,619 The intangible assets’ recoverable amounts have been determined based on value in use calculations using cash flow projections from financial budgets approved by management covering a period of 5 (2013: 5) years. Management has considered and determined the factors applied in these financial budgets which include budgeted gross margins and the target growth rates. Key assumptions used in the value in use calculations Pre-tax discount rates – Discount rates represent the current market assessment of the risks specific to each CGU, regarding the time value of money and individual risks of the underlying assets which have not been incorporated in the cash flow estimates. The discount rate calculation is based on the specific circumstances of the Group and its operating segments and derived from its weighted average cost of capital (“WACC”). Growth rates – Management determines the growth rates based on past performance and its expectations for market development. The forecasted long-term growth rates are based on published industry research and do not exceed the long-term average growth rate for the industries relevant to the CGUs. Budgeted gross margins – Gross margins are based on average values achieved in the three years preceding the start of the budget period. These are increased over the budget period for anticipated efficiency improvements. Sensitivity to changes in assumptions Except for Edmontor Investments Pte Ltd, management believes that no reasonably possible change in any of the above key assumptions would cause the carrying value of the business units to materially exceed their recoverable amounts. 97 98 Auric Pacific Group Limited Annual Report 2014 Auric Pacific Group Limited Annual Report 2014 NOTES TO THE FINANCIAL STATEMENTS NOTES TO THE FINANCIAL STATEMENTS 12. INTANGIBLE ASSETS (CONT’D) 13. INTEREST IN SUBSIDIARY COMPANIES For the financial year ended 31 December 2014 For the financial year ended 31 December 2014 (b) Impairment testing of goodwill on consolidation, trademarks and trademark license agreement (cont’d) Sensitivity to changes in assumptions (cont’d) For Edmontor Investments Pte Ltd, its recoverable amount exceeds its carrying amount by $12,977,000. The implication of the key assumptions for recoverable amount is discussed below: Decrease of Assumptions Change recoverable amount $’000 Discount rate 1% increase 5,540 Long-term growth rate 1% decrease 3,805 Compounded annual growth rate 0.4% decrease 12,977 In 2013, the carrying amount of Edmontor Investments Pte Ltd after recognising the impairment loss approximates its recoverable amount. Consequently, any adverse change in the following key assumptions would result in a further impairment loss: Assumptions Change Discount rate 1% increase Long-term growth rate 1% decrease Revenue growth rate 1% decrease (i) Additional impairment loss $’000 5,200 3,600 5,700 In 2014 and 2013, it was assessed that there was no impairment of the goodwill acquired for Auric Chun Yip Sdn Bhd and Auric Pacific Food Processing Sdn Bhd as their recoverable amounts were in excess of their carrying values. (ii) In 2014, an impairment assessment had been performed for the goodwill and trademark license agreement acquired for Edmontor Investments Pte Ltd and it was assessed that there was no impairment as the recoverable amount was in excess of the carrying value. In 2013, an impairment loss of $10,000,000 was recognised as the recoverable amount was below the carrying value. (iii) In 2014 and 2013, impairment assessment had been performed for the goodwill acquired for Food Junction Holdings (“FJH”) and it was assessed that there was no impairment as the recoverable amount was in excess of the carrying value. (iv) In 2014, impairment assessment had been performed for the trademark of Malones Holdings Pte Ltd and an impairment loss of $463,000 (2013: $nil) was recognised as the Group intends to discontinue the restaurant in China. (v) In 2014 and 2013, impairment assessment review had been performed for the goodwill acquired by FJH in All Around Ltd and it was assessed that there was no impairment as the recoverable amount was in excess of the carrying value. Unquoted ordinary shares, at cost Long term intercompany receivables Allowance for impairment Company 2014 2013 $’000 $’000 101,534 29,320 130,854 (34,655) 96,199 101,534 28,318 129,852 (34,655) 95,197 Impairment assessment of interest in subsidiary companies In 2014, no allowance for impairment loss was recognised for the interest in subsidiary company. An allowance for impairment loss of $144,000 was recognised in 2013. The long term intercompany receivables are disbursed for investment activities, which are expected to generate returns in the long run. The receivables have no fixed repayment term. 99 100 Auric Pacific Group Limited Annual Report 2014 Auric Pacific Group Limited Annual Report 2014 NOTES TO THE FINANCIAL STATEMENTS NOTES TO THE FINANCIAL STATEMENTS 13. INTEREST IN SUBSIDIARY COMPANIES (CONT’D) 13. INTEREST IN SUBSIDIARY COMPANIES (CONT’D) For the financial year ended 31 December 2014 For the financial year ended 31 December 2014 Details of subsidiary companies as at 31 December are: Name of company Principal activities Cost of Percentage of equity (Country of incorporation) (Place of business) investments held by the Group 2014 2013 2014 2013 $’000 $’000 % % Held by the Company APG Foods Pte Ltd ++ Investment holding 50,000 50,000 100 100 (Singapore) (Singapore) Auric Property Pte Ltd ++++ Holding company 10,000 10,000 100 100 (Singapore) (Singapore) Auric Pacific Investment Investment holding in # # 100 100 Holdings Pte. Ltd. ++ technology related (Singapore) companies (Singapore) Milford Sound Pte. Ltd. ++ Investment holding # # 100 100 (Singapore) (Singapore) Top-One Foods Pte Ltd ++++ Dormant 9,815 9,815 100 100 (Singapore) Auric Pacific (M) Sdn. Bhd. +++ Marketing and 634 634 100 100 (Malaysia) distribution of food products (Malaysia) Classic Aspire Sdn. Bhd. +++ Dormant (Malaysia) (Malaysia) - Ordinary shares 25 25 100 100 - Preference shares 8,991 8,991 100 100 Sunshine Services (HK) Investment holding # # 100 100 Limited +++ (Hong Kong) (Hong Kong) Cold Storage Holdings Limited + Dormant 21,948 21,948 100 (England) Auric Pacific China Limited + Dormant # # 100 (British Virgin Islands) Charm Fit Pte. Ltd. ++ Investment holding and1 1 100 (Singapore) wholesale trading (Singapore) 100 AP Fund Management Fund management Pte. Ltd. ++ activities (Singapore) (Singapore) 100 120 101,534 120 101,534 100 100 100 Details of subsidiary companies as at 31 December are: Name of company Principal activities (Country of incorporation) (Place of business) Percentage o f equity held by the Group 2014 2013 % % Held by the subsidiary companies Auric Pacific Marketing Pte Ltd ++ General wholesale, trade and distribution100 100 (Singapore) (Singapore) Auric Pacific Food Industries Pte Ltd ++ General wholesale, trade in food products100 100 (Singapore) (Singapore) Centurion Marketing Pte Ltd ++ Wholesale of other specific commodities100 100 (Singapore) (Singapore) Sunshine Manufacturing Pte Ltd ++++ Dormant100 100 (Singapore) Gourmet Foods Pte Ltd ++++ Dormant100 100 (Singapore) Auric Pacific (International) Pte Ltd ++++ Dormant100 100 (Singapore) Auric Pacific Investment Pte. Ltd. ++ Investment holding100 100 (Singapore) (Singapore) Auric Pacific Dairy (Foshan) Limited + (1) Investment holding– 100 (British Virgin Islands) (British Virgin Islands) Auric Pacific Fine Wines Pte. Ltd. ++ Wholesale and retail of wine100 100 (Singapore) (Singapore) Auric Asset Management Pte Ltd ++++ Asset/portfolio management and100 100 (Singapore) advisory services (Singapore) Auric Chun Yip Sdn. Bhd. +++ Supply of bakery, confectionery materials100 100 (Malaysia) and other general products (Malaysia) Confidence Driven Sdn. Bhd. +++ Dormant100 100 (Malaysia) Auric Pacific Food Processing Manufacturer of and dealing in butter,100 100 Sdn. Bhd. +++ margarine and related confectionery products (Malaysia) (Malaysia) Chunex Pte. Ltd. ++ Wholesale trade and wholesale on a fee or100 100 (Singapore) contract basic (Singapore) Auric Pacific Bakeries Sdn. Bhd. +++ Marketing and distribution of products in Malaysia100 100 (Malaysia) (Malaysia) 101 102 Auric Pacific Group Limited Annual Report 2014 Auric Pacific Group Limited Annual Report 2014 NOTES TO THE FINANCIAL STATEMENTS NOTES TO THE FINANCIAL STATEMENTS 13. INTEREST IN SUBSIDIARY COMPANIES (CONT’D) 13. INTEREST IN SUBSIDIARY COMPANIES (CONT’D) For the financial year ended 31 December 2014 Name of company Principal activities Percentage o f equity (Country of incorporation) (Place of business) held by the Group 2014 2013 % % Held by subsidiary companies (cont’d) Maxreal Property Investment Pte. Ltd. ++++ Dormant 100 100 (Singapore) Auric Pacific Realty Pte. Ltd. ++ Property developers and investment 100 100 (Singapore) (Singapore) APG Strategic Investment Pte. Ltd. ++ Investment holding 100 100 (Singapore) (Singapore) Mequestic Investments Limited + Dormant 60 60 (British Virgin Islands) Red Oasis Pte. Ltd. ++++ Dormant 60 60 (Singapore) Sublet of farm for rental income – 100 Foshan Ausoon Dairy Co Ltd*(1) (People’s Republic of China) (People’s Republic of China) Guangzhou Ausoon Food & Beverage Food and beverage management – 100 (People’s Republic of China) Enterprise Management Co Ltd* (1) (People’s Republic of China) Gainfield Holdings Limited + Investment holding 100 100 (British Virgin Islands) (British Virgin Islands) Auric Pacific Food Retail Pte. Ltd. ++ Investment holding 100 100 (Singapore) (Singapore) Edmontor Investments Pte Ltd ++ Investment holding and wholesale trade 100 100 (Singapore) (Singapore) Delifrance Asia Ltd ++ Management and holding company, 100 100 (Singapore) development and sale of the Group’s franchising activities (Singapore) Cuisine Creations Pte. Ltd. ++ Manufacture of other food products 100 100 (Singapore) (Singapore) Cuisine Continental Pte. Ltd. ++ Food & beverage retail, catering and 100 100 (Singapore) central kitchen production (Singapore) Delifrance Singapore Pte Ltd ++ Manufacture and sale of French bakery and 100 100 (Singapore) pastry products, operation of café-bakeries, bakery corners, and restaurants (Singapore) Nouvelle Carte Asia Pte Ltd ++++ Dormant 100 100 (Singapore) For the financial year ended 31 December 2014 Name of company Principal activities Percentage o f equity (Country of incorporation) (Place of business) held by the Group 2014 2013 % % Held by subsidiary companies (cont’d) Delifrance (HK) Limited +++ Manufacture and sale of French bakery 100 100 (Hong Kong) and pastry products and the operation of café-bakeries and kiosks (Hong Kong) Delifrance Food (M) Sdn. Bhd. ** Dormant 100 100 (Malaysia) Delifrance (Malaysia) Sdn. Bhd. +++ Manufacture and sale of French bakery and 100 100 (Malaysia) pastry products and the operation of café-bakeries (Malaysia) Shanghai Delifrance Foodstuff Co., Ltd. **** Sale of bakery and pastry products and 100 100 (People’s Republic of China) the operation of café-bakeries (People’s Republic of China) DLF (Thailand) Ltd. ## *** Dormant 49 49 (Thailand) DLF (NSW) Pty Ltd + (3) Dormant – 100 (Australia) Cuisine Continental (HK) Limited Retailing of food and beverage products 100 100 (Hong Kong)@@ and services (Hong Kong) Food Junction Holdings Limited ++ (2) Investment holding and provision of 98.02 97.63 (Singapore) management services to its subsidiary companies, fast food restaurants and general wholesale trade (Singapore) Food Junction Management Pte Ltd ++ (2) Operation and management of food 98.02 97.63 (Singapore) court and fast foodrestaurants; general wholesale trade (Singapore) Food Junction International Pte Ltd ++ (2) Fast food restaurants & general 98.02 97.63 (Singapore) wholesale trade (Singapore) Food Culture Pte Ltd ++ (2) Hawker & stall-holders selling food (Singapore) and beverage, and general 98.02 97.63 wholesale trade (Singapore) FNC International Pte. Ltd. ++ (2) Restaurants, hawkers & stall-holders 98.02 97.63 (Singapore) selling food and beverage (Singapore) 103 104 Auric Pacific Group Limited Annual Report 2014 Auric Pacific Group Limited Annual Report 2014 NOTES TO THE FINANCIAL STATEMENTS NOTES TO THE FINANCIAL STATEMENTS 13. INTEREST IN SUBSIDIARY COMPANIES (CONT’D) 13. INTEREST IN SUBSIDIARY COMPANIES (CONT’D) Name of company Principal activities Percentage o f equity (Country of incorporation) (Place of business) held by the Group 2014 2013 % % Held by subsidiary companies (cont’d) Malones Holdings Pte. Ltd. ++ (2) Investment holding company 98.02 97.63 (Singapore) (Singapore) Food Junction Singapore Pte Ltd ++ (2) Fast food restaurants and general 98.02 97.63 (Singapore) wholesale trade (Singapore) T & W Food Junction Sdn Bhd +++ (2) Management of food courts and 98.02 97.63 (Malaysia) operation of food outlets (Malaysia) Food Culture Sdn. Bhd. +++ (2) Dormant 98.02 97.63 (Malaysia) PT. FJ Square Indonesia +++ (2) Management of food courts and operation 98.02 97.63 (Indonesia) of food outlets (Indonesia) Food Junction Beijing Co., Ltd. @ (2) Management of food courts and operation 98.02 97.63 (People’s Republic of China) of food outlets (People’s Republic of China) Malone’s Limited @@@ (2) Owns and manages trademarks 98.02 97.63 (Hong Kong) in Hong Kong (Hong Kong) Maibo Restaurant Management Management and operation of restaurants 98.02 97.63 (Shanghai) Co., Ltd. **** (2) in Shanghai (People’s Republic of China) (People’s Republic of China) All Around Limited + (2) Investment holding 98.02 97.63 (British Virgin Islands) (British Virgin Islands) LCR Catering Services Limited@@@ (2) Owns and operates a restaurant 88.22 87.87 (Hong Kong) in Hong Kong (Hong Kong) Eggs & Berries (Singapore) Pte. Ltd. ++ (2) Sale of food and beverages 98.02 97.63 (Singapore) (Singapore) Star Party Pte. Ltd. ++ (2) Sale of food and beverages 98.02 97.63 (Singapore) (Singapore) Lifestyle Dining Pte. Ltd. ++ (2) Sale of food and beverages 98.02 97.63 (Singapore) (Singapore) LP+Tetsu Pte. Ltd. ++ (2) Sale of food and beverages, and 98.02 97.63 (Singapore) management of restaurants, cafes and bars (Singapore) Name of company Principal activities Percentage o f equity (Country of incorporation) (Place of business) held by the Group 2014 2013 % % Held by subsidiary companies (cont’d) Zutis Pte. Ltd. ++ (2) Sale of food and beverages, and 98.02 97.63 (Singapore) management of restaurants, cafes and bars (Singapore) Investment holding 98.02 97.63 Medzs Pte. Ltd. ++ (2) (Singapore) (Singapore) Investment holding 98.02 97.63 Eggs & Berries Pte. Ltd. ++ (2) (Singapore) (Singapore) Sale of food and beverages 98.02 97.63 Medzs (Singapore) Pte. Ltd. ++ (2) (Singapore) (Singapore) Sale of food and beverages 98.02 97.63 The Boxing Crab Pte. Ltd.++ (2) (Singapore) (Singapore) Investment holding 98.02 97.63 Wan Style Pte. Ltd.++ (2) (Singapore) (Singapore) Sale of food and beverages 98.02 97.63 Wan Style (Singapore) Pte. Ltd.++ (2) (Singapore) (Singapore) Investment holding 98.02 97.63 Food Junction (China) Pte. Ltd.++ (2) (Singapore) (Singapore) For the financial year ended 31 December 2014 For the financial year ended 31 December 2014 # Investment cost is less than $1,000. ## Deemed subsidiary company as the Group has more than half of the voting rights of the shareholders. * Audited by Foshan Da Cheng Certified Public Accountants, People’s Republic of China. ** Audited by OK Yau & How Yong, Malaysia. *** Audited by Dharmniti Auditing Co. Ltd, Thailand. **** Audited by Shanghai Saint C.P.A. Partnership, People’s Republic of China. + Not required to be audited by the law of the country of incorporation. ++ Audited by Ernst & Young LLP, Singapore. +++ Audited by member firms of Ernst & Young Global in the respective countries. ++++ Qualified for exemption from audit for the financial year ended 31 December 2014 in accordance with Section 205(b) of the Singapore Companies Act. @ Audited by LegendHouse CPAs, People’s Republic of China. @@ Audited by Anthony Kam & Associates Ltd, Hong Kong. @@@ Audited by Joseph Kwan and Company CPAs, Hong Kong. 105 106 Auric Pacific Group Limited Annual Report 2014 Auric Pacific Group Limited Annual Report 2014 NOTES TO THE FINANCIAL STATEMENTS NOTES TO THE FINANCIAL STATEMENTS 13. INTEREST IN SUBSIDIARY COMPANIES (CONT’D) 14. INVESTMENT IN AN ASSOCIATED COMPANY For the financial year ended 31 December 2014 (1) For the financial year ended 31 December 2014 On 30 June 2014, the Group disposed its entire shareholding in of Auric Pacific Dairy (Foshan) Limited and its subsidiary companies, namely Foshan Ausoon Dairy Co Ltd and Guangzhou Ausoon Food & Beverage Enterprise Management Co Ltd. The net cash in flow on disposal of subsidiary companies amounted to $1,255,000. A gain of $1,734,000 was recognised on the disposal, inclusive of realised cumulative translation gain of $375,000. The value of assets and liabilities of Auric Pacific Dairy (Foshan) Limited and its subsidiary companies recorded in the consolidated financial statement as at 30 June 2014, and the cash flow effect of the disposal was: Property, plant and equipment Trade and other receivables Cash and cash equivalents Trade and other payables Carrying value of net assets Total consideration Cash and cash equivalents of the subsidiary companies Net cash inflow on disposal of subsidiary companies $’000 44 3 47 94 (27) 67 1,302 (47) 1,255 As at 31 December 2014, the Group acquired additional 473,850 shares (2013: 44,187,213 shares) and its interest in FJH increased from 97.63% to 98.02%. The excess of the carrying amount of non-controlling interest over the consideration paid was taken to other reserve – discount on acquisition of non-controlling interest in equity. (2) (3) On 28 May 2014, DLF (NSW) Pty Ltd has been deregistered. Acquisition of non-controlling interests The following summarises the effect of the change in the Group’s ownership interest in equity attributable to owners of the Company: Food Junction Holdings Limited Auric Pacific Dairy (Foshan) Limited Consideration paid for acquisition of non-controlling interests Food Junction Holdings Limited Auric Pacific Dairy (Foshan) Limited Decrease in equity attributable to non-controlling interests Increase in equity attributable to owners of the Company Group 2014 2013 $’000 $’000 121 – 121 11,268 74 11,342 (158) – (158) (15,431) 15 (15,416) 37 4,074 Group 2014 2013 $’000 $’000 Unquoted equity shares, at cost Costs directly attributable to acquisition of an associated company Share of post-acquisition reserves: Share of post-acquisition losses (net of tax) Accumulated impairment loss Net carrying amount 3,422 22 3,444 3,422 22 3,444 (1,575) (1,596) (3,171) (1,571) (1,596) (3,167) There is no contingent liability relating to the Group’s interest in its associated company. Details of the associated company as at 31 December are as follows: 273 277 Name of company Principal activities Cost of Percentage of equity (Country of incorporation) (Place of business) investments held by the Group 2014 2013 2014 2013 $’000 $’000 % % Held by a subsidiary company JVC Capital Pte Ltd * Property agency (Singapore) and brokerage (Singapore) 3,444 3,444 44.45 44.45 * Audited by Lee SF & Co, Singapore. The summarised financial information in respect of the associated company based on its financial statements and a reconciliation with the carrying amount of the investment in the consolidated financial statements are as follows: Summarised balance sheet 2014 $’000 2013 $’000 Assets and liabilities: Non-current assets 516 516 Current assets 101 115 Total assets 617 631 Current liabilities (12) (18) Total liabilities (12) (18) Net assets 605 613 Proportion of the Group’s ownership 44.45% 44.45% Group’s share of net assets 269 273 Other adjustments 4 4 Group’s share of net assets 273 277 107 108 Auric Pacific Group Limited Annual Report 2014 Auric Pacific Group Limited Annual Report 2014 NOTES TO THE FINANCIAL STATEMENTS NOTES TO THE FINANCIAL STATEMENTS 14. INVESTMENT IN AN ASSOCIATED COMPANY (CONT’D) 15. INVESTMENT IN A JOINT VENTURE COMPANY (CONT’D) For the financial year ended 31 December 2014 For the financial year ended 31 December 2014 Summarised statement of comprehensive income 2014 $’000 Revenue Loss for the financial year Other comprehensive income Total comprehensive income The associated company is not subjected to any restriction on its cash dividend payout. – (9) – (9) 2013 $’000 – (12) – (12) 15. INVESTMENT IN A JOINT VENTURE COMPANY Group 2014 2013 $’000 $’000 Unquoted equity shares, at cost Share of post-acquisition profits Post-acquisition dividend received Net carrying amount There are no contingent liabilities relating to the Group’s interest in the joint venture company. 453 4,307 (2,758) 2,002 453 3,537 (1,923) 2,067 The Group has 49% (2013: 49%) interest in ownership and voting rights in a joint venture, Delifrance Singapore Wholesale Pte Ltd that is held through a subsidiary. This joint venture is incorporated in Singapore and is a strategic venture in the business. The Group jointly controls the venture with the other partner under the contractual agreement and requires unanimous consent for all major decisions over the relevant activities. 109 Details of the joint venture company as at 31 December are as follows: Name of company Principal activities Cost of Percentage of equity (Country of incorporation) (Place of business) investments held by the Group 2014 2013 2014 2013 $’000 $’000 % % Delifrance Singapore Wholesale of French 453 453 49 49 Wholesale Pte Ltd * bakery and pastry (Singapore) products (Singapore) * Formally known as Delifrance Asia Wholesale Pte Ltd * Audited by Ernst & Young LLP, Singapore. The summarised financial information of the joint venture company, based on its FRS financial statements, and reconciliation with the carrying amount of the investment in the consolidated financial statement is as follows: Summarised balance sheet 2014 $’000 2013 $’000 Cash and cash equivalents Trade and other receivables Inventory Current assets Non-current assets excluding goodwill Goodwill Total assets Current liabilities Total liabilities Net assets Net assets excluding goodwill Proportion of the Group’s ownership Group’s share of net assets Carrying amount of the investment Summarised statement of comprehensive income Revenue Other revenue Cost of sales and other expenses Profit before tax Income tax expense Profit after tax Other comprehensive income Total comprehensive income 2,274 1,624 897 4,795 52 763 2,345 1,921 779 5,045 38 763 5,610 5,846 (761) (865) (761) (865) 4,849 4,086 4,981 4,218 49% 2,002 49% 2,067 2,002 2,067 12,415 26 (10,607) 12,529 14 (10,498) 1,834 (262) 2,045 (348) 1,572 – 1,697 – 1,572 1,697 Dividends of S$835,000 (2013: S$639,000) were received from the joint venture company. The joint venture company is not subjected to any restriction on its cash dividend payout. 110 Auric Pacific Group Limited Annual Report 2014 Auric Pacific Group Limited Annual Report 2014 NOTES TO THE FINANCIAL STATEMENTS NOTES TO THE FINANCIAL STATEMENTS 16. LONG-TERM INVESTMENTS 17.STOCKS For the financial year ended 31 December 2014 Long-term investments Financial assets at fair value through profit or loss: Investment funds (unquoted) (1) Available-for-sale financial assets at cost: Investment funds (unquoted) (1) (2) (1) United States dollars Singapore dollars (2) Group 2014 2013 $’000 $’000 1,166 1,442 9,262 10,428 8,718 10,160 Unquoted investment funds are held in the following currencies: For the financial year ended 31 December 2014 Group 2014 2013 $’000 $’000 8,455 1,973 10,428 8,987 1,173 10,160 The breakdown of unquoted investment funds held as available for sale is as follows: Group 2014 $’000 Unquoted investment funds, at cost Allowance for impairment 14,384 (5,122) 9,262 Balance sheet: Raw materials and stores 3,589 2,079 Finished goods and goods for sale (at cost or net realisable value) 45,286 40,239 Total 48,875 42,318 Income statement: Stocks recognised as an expense in cost of sales 221,517 207,774 Inclusive of the following charge: - stocks written down 2,217 2,180 18. TRADE DEBTORS Trade debtors are stated net of allowance for impairment of 2013 $’000 13,840 (5,122) 8,718 Unquoted investment funds were measured at cost less accumulated impairment loss. The fair value cannot be reliably measured as these unquoted investment funds do not have quoted market prices in an active market and it is not practicable to determine the fair value using valuation models as the assumptions in these models cannot be reasonably determined. In 2013, the Group recognised an impairment loss of $3,047,000 in unquoted investment funds, reflecting a writedown in the carrying values of the funds, of which $3,000,000 was recognised in “exceptional items” in the statement of comprehensive income and $47,000 was classified as an “investment related activity”. There was no allowance for impairment being recognised for the current financial year. Group 2014 2013 $’000 $’000 Group 2014 2013 $’000 $’000 (3,621) (4,153) 43,621 19,972 544 64,137 42,644 15,925 1,441 60,010 Trade debtors of the Group are held in the following currencies: Singapore dollars Malaysian ringgit Other currencies Trade debtors of the Group are non-interest bearing and are generally on 30 to 120 (2013: 30 to 120) days’ credit terms. They are recognised at their original invoiced amounts which represent their fair values on initial recognition. Included in trade debtors is an amount of $545,000 (2013: $885,000) due from a joint venture company of the Group. The amount due from the joint venture company arose from sales made to that company, and is unsecured, interestfree, and repayable within normal trade credit terms and is to be settled in cash. The amount is denominated in Singapore dollars. Trade debtors that are past due but not impaired The Group has trade debtors amounting to $20,971,000 (2013: $19,872,000) that are past due at the balance sheet date but not impaired. These debtors are unsecured and the analysis of their aging at the balance sheet date is as follows: Less than 30 days 30 to 60 days 61 to 90 days 91 to 120 days More than 120 days Group 2014 2013 $’000 $’000 15,105 2,268 770 1,773 1,055 20,971 14,405 2,611 809 1,438 609 19,872 111 112 Auric Pacific Group Limited Annual Report 2014 Auric Pacific Group Limited Annual Report 2014 NOTES TO THE FINANCIAL STATEMENTS NOTES TO THE FINANCIAL STATEMENTS 18. TRADE DEBTORS (CONT’D) 19. OTHER DEBTORS, AND PREPAYMENTS AND OTHER RECOVERABLES (CONT’D) Trade debtors that are impaired The Group’s trade debtors that are impaired as at balance sheet date and the movements of the allowance account used to record the impairment are as follows: Group Company 2014 2013 2014 2013 $’000 $’000 $’000 $’000 Total other debtors 16,000 15,163 292 249 Other debtors are stated net of allowance for impairment of (91) (515) – – (1) Staff loans are unsecured, non-interest bearing, and have repayment terms of 5 (2013: 7) months. For the financial year ended 31 December 2014 Trade debtors Allowance for impairment Movements in allowance account:- Balance at 1 January Charge for the financial year Write-off against allowance Exchange differences Balance at 31 December For the financial year ended 31 December 2014 Group 2014 2013 $’000 $’000 3,621 (3,621) – 4,153 (4,153) – Other debtors of the Group and the Company are held in the following currencies: 4,153 759 (1,256) (35) 3,621 3,689 742 (192) (86) 4,153 Trade debtors that are individually determined to be impaired at the balance sheet date relate to debtors that are in significant financial difficulties and have defaulted on payments. These debtors are not secured by any collateral or credit enhancements. For the financial year ended 31 December 2014, an allowance for impairment of $759,000 (2013: $742,000) was recognised in profit or loss. 19. OTHER DEBTORS, AND PREPAYMENTS AND OTHER RECOVERABLES (a) Other debtors Group Company 2014 2013 2014 2013 $’000 $’000 $’000 $’000 Non-current Refundable deposits 6,751 5,810 – – Total other debtors, non-current 6,751 5,810 – – Current Staff loans (1) 4 30 – – Refundable deposits placed with landlords 4,844 4,690 156 156 Sundry debtors 2,037 3,786 13 93 Interest receivable 9 7 – – Tax recoverable 2,355 840 123 – Total other debtors, current 9,249 9,353 292 249 (a) Other debtors (cond’t) 2014 $’000 Singapore dollars Malaysian ringgit Renminbi Hong Kong dollars Other currencies Group 2013 $’000 Company 2014 2013 $’000 $’000 8,374 1,564 371 5,455 236 8,563 2,488 270 3,818 24 292 – – – – 249 – – – – 16,000 15,163 292 249 Other debtors that are past due but not impaired The Group has other debtors amounting to $483,000 (2013: $251,000) that are past due at the balance sheet date but not impaired. These debtors are unsecured and the analysis of their aging at the balance sheet date is as follows: Less than 30 days 30 to 60 days 61 to 90 days 91 to 120 days More than 120 days Group 2014 2013 $’000 $’000 96 57 55 100 175 483 31 51 5 3 161 251 113 114 Auric Pacific Group Limited Annual Report 2014 Auric Pacific Group Limited Annual Report 2014 NOTES TO THE FINANCIAL STATEMENTS NOTES TO THE FINANCIAL STATEMENTS 19. OTHER DEBTORS, AND PREPAYMENTS AND OTHER RECOVERABLES (CONT’D) 19. OTHER DEBTORS, AND PREPAYMENTS AND OTHER RECOVERABLES (CONT’D) For the financial year ended 31 December 2014 For the financial year ended 31 December 2014 (a) Other debtors (cond’t) Other debtors that are impaired The Group’s other debtors that are impaired at the balance sheet date and the movements of the allowance account used to record the impairment are as follows: Other debtors Allowance for impairment Group Individually impaired 2014 2013 $’000 $’000 91 (91) – 515 (515) – Movements in allowance account: Balance at 1 January Charge for the financial year Write-off against allowance Translation differences Balance at 31 December Group Individually impaired 2014 2013 $’000 $’000 515 101 (535) 10 91 612 – (117) 20 515 During the year, the Group has made an allowance for impairment of $101,000 (2013: $nil). As at balance sheet date, the non-trade debtor was written off and the expenses were recognised in the profit or loss. Other debtors that are individually determined to be impaired at the balance sheet date relate to debtors that have defaulted on payments. There are no balances that are collectively determined to be impaired. (b) Prepayments and other recoverables GroupCompany 2014 2013 2014 2013 $’000 $’000 $’000 $’000 Non-current Deferred lease expenses 143 160 – – Renovation fees to be billed to tenants # 2,721 567 – – Prepayments (2) 1,813 8 – – 4,677 735 – – (b) Prepayments and other recoverables (cont’d) Group 2014 2013 $’000 $’000 Current Deferred lease expenses 168 164 Renovation fees to be billed to tenants # 415 583 Other recoverables 230 104 Prepayments (2) 3,561 2,102 Advance payment for purchases 54 165 4,428 3,118 Total prepayments and other recoverables 9,105 3,853 # Loans and receivables at amortised cost (Note 21) 3,136 1,150 (2) Company 2014 2013 $’000 $’000 – – – 18 – 18 – – – 15 – 15 18 15 – – Prepayments are advanced payments made to contractors for renovation of food courts.. 20. AMOUNTS DUE FROM SUBSIDIARY COMPANIES Loans to subsidiary companies Allowance for impairment Net amounts due from subsidiary companies (current portion) Allowance for impairment Total Company 2014 2013 $’000 $’000 54,475 (2,245) 52,230 61,754 (8,484) 53,270 146,198 (28,312) 117,886 129,641 (3,312) 126,329 170,116 179,599 As at 31 December 2014, loans to subsidiary companies are non-trade in nature, unsecured, interest-free and are repayable on demand. The amounts due from subsidiary companies are non-trade in nature, unsecured, interest-free and repayable on demand and to be settled by offsetting against the amount due to subsidiary companies in due course. As at 31 December 2013, a balance of $6,701,000 under the amount due from subsidiary company bears interest at rates ranging from 0.30% to 0.35%. 115 116 Auric Pacific Group Limited Annual Report 2014 Auric Pacific Group Limited Annual Report 2014 NOTES TO THE FINANCIAL STATEMENTS NOTES TO THE FINANCIAL STATEMENTS 20. AMOUNTS DUE FROM SUBSIDIARY COMPANIES (CONT’D) 20. AMOUNTS DUE FROM SUBSIDIARY COMPANIES (CONT’D) For the financial year ended 31 December 2014 For the financial year ended 31 December 2014 Amounts due from subsidiary companies that are past due but not impaired: The Company does not have any loans to and amounts due from subsidiary companies that are past due but not impaired at the balance sheet date. Loans to and amounts due from subsidiary companies are held in the following currencies:- Singapore dollars Renminbi Amounts due from subsidiary companies that are impaired: Company 2014 2013 $’000 $’000 169,899 217 170,116 179,387 212 179,599 The Company’s loans to and amounts due from subsidiary companies that are impaired at the balance sheet date and the movements in allowance account used to record the impairment are as follows: Company 2014 2013 $’000 $’000 Loans to subsidiary companies: Loans to subsidiary companies 2,245 Allowance for impairment (2,245) – Amounts due from subsidiary companies: Amounts due from subsidiary companies Allowance for impairment 8,484 (8,484) – Company 2014 2013 $’000 $’000 28,312 (28,312) – 3,312 (3,312) – Amounts due from subsidiary companies that are impaired: (cont’d) Company Individually impaired 2014 2013 $’000 $’000 Movements in allowance account: Balance at 1 January Change for the financial year Write off during the financial year Balance at 31 December 11,796 25,000 (6,239) 30,577 11,796 – – 11,796 During the financial year, the Company has written off allowance for impairment of $6,239,000 (2013: $nil) as the subsidiary was disposed during the year. Loans to and amounts due from subsidiary companies that are individually determined to be impaired at the balance sheet date relate to subsidiary companies that are in financial difficulties and have defaulted on payments. The Company has made an allowance for amount due from subsidiary of $25,000,000 (2013: $nil) for the financial year ended 31 December 2014. 21. FIXED DEPOSITS (RESTRICTED) AND CASH AND CASH EQUIVALENTS (a) Fixed deposits (restricted) The Group’s fixed deposits (restricted) relates to pledges of $2,520,000 (2013: $2,085,000) and $1,105,000 (2013: $1,386,000) to banks as security for banker’s guarantees issued in lieu of rental deposits and bank borrowings, and for issuance of security, utility and rental deposits respectively. Another $379,000 (2013: $385,000) has been pledged to a bank as security for an overdraft facility. (b) Cash and cash equivalents Fixed deposits (c) Cash and bank balances (d) 2014 $’000 4,798 41,528 46,326 Group 2013 $’000 4,636 51,231 55,867 Company 2014 2013 $’000 $’000 4,784 10,073 14,857 4,570 20,187 24,757 117 118 Auric Pacific Group Limited Annual Report 2014 Auric Pacific Group Limited Annual Report 2014 NOTES TO THE FINANCIAL STATEMENTS NOTES TO THE FINANCIAL STATEMENTS 21. FIXED DEPOSITS (RESTRICTED) AND CASH AND CASH EQUIVALENTS (CONT’D) 22. TRADE CREDITORS Trade creditors are non-interest bearing and are normally settled on their normal trade terms of 7 to 90 (2013: 7 to 90) days. Trade creditors of the Group are held in the following currencies: For the financial year ended 31 December 2014 For the financial year ended 31 December 2014 (c) Fixed deposits Fixed deposits are held in the following currencies: Group Company 2014 2013 2014 2013 $’000 $’000 $’000 $’000 Singapore dollars – 21 – – Malaysian ringgit 14 13 – – United States dollars 4,784 4,570 4,784 4,570 Other currencies – 32 – – 4,798 4,636 4,784 4,570 Fixed deposits have effective interest rates ranging from 0.05% to 3.25% (2013: 0.05% to 3.25%) per annum and are made for varying periods of primarily less than 3 (2013: 3) months depending on the immediate cash requirements of the Group, and earn interest at the respective short-term deposit rates. Cash and bank balances are held in the following currencies: 2014 $’000 Group 21,910 1,582 8,638 241 143 9,009 5 41,528 2013 $’000 20,621 1,378 13,511 564 406 14,746 5 51,231 Company 2014 2013 $’000 $’000 6,944 690 – 5 – 2,434 – 10,073 10,654 441 – 5 – 9,087 – 20,187 Cash and bank balances earn interest at floating rates based on daily bank deposit rates ranging up to 1.08% (2013: 1%) per annum. The carrying amounts of loans and receivables comprise: Trade debtors (Note 18) Other debtors, excluding tax recoverable (Note 19 (a)) Other recoverables (Note 19 (b)) Amounts due from subsidiary companies (Note 20) Cash and cash equivalents Fixed deposits (restricted) Singapore dollars United States dollars Malaysian ringgit Australian dollars Hong Kong dollars Other currencies Group 2014 2013 $’000 $’000 23,708 3,777 5,837 1,548 3,454 1,564 39,888 23,311 4,966 4,433 985 3,074 1,254 38,023 23. OTHER CREDITORS AND ACCRUALS, AND DEFERRED INCOME (d) Cash and bank balances Singapore dollars United States dollars Malaysian ringgit Renminbi Indonesian rupiah Hong Kong dollars Other currencies 2014 $’000 Group 2013 $’000 Company 2014 2013 $’000 $’000 64,137 60,010 – – 13,645 3,136 14,323 1,150 169 – 249 – – 46,326 4,004 131,248 – 55,867 3,856 135,206 170,116 14,857 – 185,142 179,599 24,757 – 204,605 (a) Other creditors and accruals Sundry creditors Accrual for unutilised leave Accrued operating expenses Deposits from tenants Accrual for closure costs Total other creditors and accruals 2014 $’000 8,900 1,246 29,434 3,823 2,822 46,225 Group 2013 $’000 8,681 1,151 25,491 2,956 2,230 40,509 Company 2014 2013 $’000 $’000 261 177 1,824 – – 2,262 562 148 1,580 – – 2,290 (b) Deferred Income Group Company 2014 2013 2014 2013 $’000 $’000 $’000 $’000 Non-current Deferred income (1) 1,047 433 – – Current Deferred income (1) 1,943 502 – – (1) Deferred income pertains to the fees to be recovered from tenants for the renovation works for new and existing food courts. 119 120 Auric Pacific Group Limited Annual Report 2014 Auric Pacific Group Limited Annual Report 2014 NOTES TO THE FINANCIAL STATEMENTS NOTES TO THE FINANCIAL STATEMENTS 23. OTHER CREDITORS AND ACCRUALS, AND DEFERRED INCOME (CONT’D) 24. PROVISIONS (CONT’D) Provisions for reinstatement costs are recognised for expected costs for dismantling, removal and restoration of property, plant and equipment based on the best estimate of the expenditure with reference to past experience. It is expected that most of these costs will be incurred within 5 (2013: 5) years from the balance sheet date. The provision is discounted using a current rate of 5% (2013: 5%) per annum that reflects the risks specific to the liability. For the financial year ended 31 December 2014 For the financial year ended 31 December 2014 Other creditors and accruals of the Group and of the Company are held in the following currencies: GroupCompany 2014 2013 2014 2013 $’000 $’000 $’000 $’000 Singapore dollars 27,156 27,579 2,255 2,284 Malaysian ringgit 9,629 8,031 – – Renminbi 4,523 1,926 7 6 Hong Kong dollars 4,658 2,512 – – Other currencies 259 461 – – 46,225 40,509 2,262 2,290 The carrying amounts of financial liabilities at amortised cost comprise: GroupCompany 2014 2013 2014 2013 $’000 $’000 $’000 $’000 Trade creditors (Note 22) 39,888 38,023 – – Other creditors and accruals 46,225 40,509 2,262 2,290 Amounts due to subsidiary companies (Note 25) – – 183,258 175,764 Loans and borrowings (Note 26) 9,806 6,867 4,000 – 95,919 85,399 189,520 178,054 Less: - Obligations under finance leases (Note 26) (538) (434) – – Total financial liabilities at amortised cost 95,381 84,965 189,520 178,054 24.PROVISIONS Loans from subsidiary companies Amounts due to subsidiary companies (non-trade) Company 2014 2013 $’000 $’000 70,795 112,463 183,258 70,795 104,969 175,764 Loans from subsidiary companies are non-trade in nature, unsecured, interest-free, except for a loan of $2,350,000 (2013: $2,350,000) from a subsidiary company, which bears interest at 3.5% (2013: 3.5%) per annum, is repayable on demand and to be settled in cash. The amounts due to subsidiary companies are non-trade in nature, unsecured and repayable on demand. These represent amounts received from the Company’s subsidiary companies for working capital purposes. For the financial year ended 31 December 2014, the amounts due to the subsidiary companies are interest-free. In prior year, $40,960,000 of the amounts due to subsidiary companies bear interest at rates ranging from 0.30% to 0.35%. Loans from and amounts due to subsidiary companies are denominated in Singapore dollars. 26. LOANS AND BORROWINGS Provisions for reinstatement costs: Balance at 1 January Provision during the financial year Utilised during the financial year Write-back during the financial year Finance costs during the year Translation differences Balance at 31 December Comprises: Current Non-current 25. AMOUNTS DUE TO SUBSIDIARY COMPANIES 2014 $’000 5,308 579 (320) (233) 96 88 5,518 GroupCompany 2013 2014 2013 $’000 $’000 $’000 4,696 812 (329) (38) 130 37 5,308 100 – – – – – 100 100 – – – – – 100 887 1,046 4,631 4,262 5,518 5,308 – 100 100 – 100 100 GroupCompany 2014 2013 2014 2013 $’000 $’000 $’000 $’000 Current : Bank borrowings - unsecured (1) 9,268 6,433 4,000 – Obligations under finance leases (2) 123 101 – – 9,391 6,534 4,000 – Non-current : Obligations under finance leases (2) 415 333 – – Total loans and borrowings 9,806 6,867 4,000 – 121 122 Auric Pacific Group Limited Annual Report 2014 Auric Pacific Group Limited Annual Report 2014 NOTES TO THE FINANCIAL STATEMENTS NOTES TO THE FINANCIAL STATEMENTS 26. LOANS AND BORROWINGS (CONT’D) 27. DEFERRED TAX ASSETS/(LIABILITIES) For the financial year ended 31 December 2014 For the financial year ended 31 December 2014 Loans and borrowings of the Group and of the Company are held in the following currencies:- Singapore dollars Malaysian ringgit 2014 $’000 4,499 5,307 9,806 GroupCompany 2013 2014 2013 $’000 $’000 $’000 342 6,525 6,867 4,000 – 4,000 – – – (1) In 2014, the bank loan of $4,000,000 undertaken by the Company was unsecured and bears a weighted average effective interest rate of 1.9% per annum. The loan is fully repayable on 16 December 2015. (a) Deferred tax assets GroupCompany 2014 2013 2014 2013 $’000 $’000 $’000 $’000 Balance at 1 January 1,158 930 – – (Credit)/expenses during the financial year (66) 224 – – Translation differences – 4 – – Balance at 31 December 1,092 1,158 – – Net deferred tax assets recognised as at 31 December relate to the following: Bankers’ acceptances issued by the subsidiary companies of $5,268,000 (2013: $6,433,000) bear a weighted average effective interest rate of 3.95% (2013: 3.7%) per annum and are repayable within 3 to 6 (2013: 3 to 6) months. Accruals The Group has obligations under finance leases for certain plant and equipment. These leases are classified as finance leases and expire over 1 to 3 (2013: 2 to 3) years. The implicit average interest rate in the leases ranges from 2.5% to 3.8% (2013: 3.8% to 3.9%) per annum. These obligations are secured by the rights to the leased plant and equipment (Note 11). 2014 $’000 1,092 GroupCompany 2013 2014 2013 $’000 $’000 $’000 1,158 – – (2) Future minimum lease payments under finance leases together with the present value of the net minimum lease payments are as follows: Group 2014 $’000 2013 $’000 Within 1 year Within 2 to 5 years Total minimum lease payments Less: Amounts representing finance charges Present value of minimum lease payments Present value of minimum lease payments : Within 1 year Within 2 to 5 years Total 140 478 618 (80) 538 113 379 492 (58) 434 123 415 538 101 333 434 (b) Deferred tax liabilities GroupCompany 2014 2013 2014 2013 $’000 $’000 $’000 $’000 Balance at 1 January (4,202) (4,775) (192) (534) Write-back during the financial year 562 573 – 342 Balance at 31 December (3,640) (4,202) (192) (192) Deferred tax liabilities as at 31 December, after appropriately offsetting against deferred tax assets, relate to the following: GroupCompany 2014 2013 2014 2013 $’000 $’000 $’000 $’000 Deferred tax liabilities: Excess of net book values over tax written down values of property, plant and equipment (1,996) (2,071) – – Fair value adjustments on acquisition of subsidiary companies (1,642) (2,118) – – Unremitted income (192) (192) (192) (192) Gross deferred tax liabilities (3,830) (4,381) (192) (192) Deferred tax assets: Accruals 190 179 – – Gross deferred tax assets 190 179 – – Net deferred tax liabilities (3,640) (4,202) (192) (192) 123 124 Auric Pacific Group Limited Annual Report 2014 Auric Pacific Group Limited Annual Report 2014 NOTES TO THE FINANCIAL STATEMENTS NOTES TO THE FINANCIAL STATEMENTS 27. DEFERRED TAX ASSETS/(LIABILITIES) (CONT’D) 29. OTHER RESERVES (CONT’D) For the financial year ended 31 December 2014 For the financial year ended 31 December 2014 (b) Deferred tax liabilities (cont’d) Unrecognised deferred tax assets (b) Discount on acquisition of non-controlling interests Discount on acquisition of non-controlling interests represents the differences between acquired equity and acquisition costs, which have arisen from the acquisition of non-controlling interests. Net deferred tax assets not recognised at 31 December relate to the following: GroupCompany 2014 2013 2014 2013 $’000 $’000 $’000 $’000 Deferred tax assets: Unutilised tax losses 4,005 3,087 – – Unabsorbed capital allowances 927 897 – – Accruals – 4 – – Deferred tax assets 4,932 3,988 – – The Group and the Company did not recognise deferred tax assets amounting to $4,932,000 (2013: $3,988,000) as it is not probable that taxable profits will be available against which the deferred tax assets can be utilised. Tax consequences of proposed dividends There are no income tax consequences attached to the dividends to the shareholders proposed by the Company but not recognised as a liability in the financial statements (Note 31). Group and Company 2014 2013 $’000 $’000 Issued and fully paid ($’000) 64,461 64,461 Number of ordinary shares 125,667,324 125,667,324 The holders of ordinary shares are entitled to receive dividends as and when declared by the Company. All ordinary shares carry one vote per share without restriction. The ordinary shares do not carry any par value. 29. OTHER RESERVES The reserve is used to account for transactions with non-controlling shareholders in terms of the economic entity model, whereby the excess of the cost of the transactions over the acquirer’s interest in previously recognised assets and liabilities is allocated to this reserve. This reserve is also used in common control transactions (where all of the combining entities in a business combination are ultimately controlled by the same entity) where the excess of the cost over the acquirer’s proportionate share of the net assets is allocated to this reserve. (c) Gain on purchase of treasury shares by subsidiary company The reserve relates to the subsidiary company’s difference between the carrying amount of non-controlling interests and the cost of treasury shares acquired. 30. MERGER RESERVE The reserve arose from a Scheme of Arrangement undertaken by a subsidiary company in prior financial year and is not distributable. 31. DIVIDEND ON ORDINARY SHARES 28. SHARE CAPITAL (a) Foreign currency translation reserve Foreign currency translation reserve represents exchange differences arising from the translation of the financial statements of foreign operations whose functional currencies are different from that of the Group’s reporting currency. Group and Company 2014 2013 $’000 $’000 Declared and paid during the financial year Dividend on ordinary shares: Final tax exempt (one-tier) dividend for 2013: $0.02 (2012: $0.03) per share 2,513 Proposed but not recognised as a liability as at 3 1 December Dividend on ordinary shares, subject to shareholders approval at AGM: Final tax exempt (one-tier) dividend for 2014 : $0.02 (2013: $0.02) per share 2,513 3,770 2,513 At the Annual General Meeting on 29 April 2015, a final exempt dividend of 2 cents per share amounting to a total of $2,513,000 will be recommended. These financial statements do not reflect this dividend and will be accounted for in shareholders’ equity as an appropriation of retained earnings in the financial year ending 31 December 2015. 125 126 Auric Pacific Group Limited Annual Report 2014 Auric Pacific Group Limited Annual Report 2014 NOTES TO THE FINANCIAL STATEMENTS NOTES TO THE FINANCIAL STATEMENTS 32. CONTINGENT LIABILITIES AND COMMITMENTS 32. CONTINGENT LIABILITIES AND COMMITMENTS (CONT’D) For the financial year ended 31 December 2014 For the financial year ended 31 December 2014 (a) Operating lease commitments – As lessee The Group leases certain properties and vehicles under lease agreements that are non-cancellable. These leases expire on various dates till 15 December 2032 (2013: 15 December 2032) and leases for properties contain provisions for rental adjustments. A few of the lease agreements provide for renewable options, escalation clauses and variable rentals based on percentage of sales in excess of base rent. There are no restrictions placed upon the Group’s activities concerning dividends, additional debt or further leasing by entering into these leases. Rental expense for the financial year ended 31 December 2014 is composed of minimum lease payments of $39,122,000 (2013: $37,704,000) and variable rent of $2,649,000 (2013: $2,516,000). Future minimum lease payments for the leases are as follows: Within 1 year Within 2 to 5 years More than 5 years 2014 $’000 GroupCompany 2013 2014 2013 $’000 $’000 $’000 42,783 64,853 7,349 114,985 33,664 42,659 12,984 89,307 569 329 – 898 569 874 – 1,443 (b) Operating lease commitments – As lessor The Group licenses the use of F&B stalls within food courts to individual third party tenants and a subsidiary company. Such licences are typically for a period of one to two years and are not cancellable. In the course of a financial year, there may be terminations and renewals of such licences and the Group has accounted for licence fee in respect of non-cancellable leases as at annual balance sheet date. Licences that expired and not renewed during the financial year were not accounted for. All the leases provide for variable rent. During the year, the variable rent amounted to $4,404,000 (2013: $4,367,000). Future minimum lease rental receivable (after group elimination): Group 2014 $’000 2013 $’000 Within 1 year Within 2 to 5 years 15,762 7,923 23,685 13,003 1,941 14,944 (c) Capital commitments Capital expenditure contracted for as at the balance sheet date but not recognised in the financial statements is as follows: Group 2014 $’000 2013 $’000 Capital commitments in respect of plant and equipment 579 897 (d) Bankers’ guarantees Group 2014 $’000 2013 $’000 6,024 5,718 Secured (1) 1,175 1,153 Unsecured (2) 7,199 6,871 (1) At the end of the financial year ended 31 December 2014, the Group had approximately $6,024,000 (2013: $5,718,000) bankers’ guarantees issued in lieu of rental deposits to landlords and utility deposits for retail outlets and this is secured against fixed deposits. (2)Bankers’ guarantees amounting to $113,000 (2013: $202,000) were issued by the Group to suppliers in the ordinary course of business. The bankers’ guarantees are denominated in Malaysian Ringgit. In prior year, $115,000 and $87,000 of the issued guarantees were denominated in Malaysia Ringgit and Euro Dollars respectively. As at 31 December 2014, the Group had approximately $1,062,000 (2013: $951,000) bankers’ guarantees which is in lieu of rental and utility deposits. (e) Financial support As at 31 December 2014 and 2013, the Company has provided financial support to certain subsidiary companies to enable them to continue as a going concern. The net deficit position of these subsidiary companies as at 31 December 2014 amounted to $81,372,000 (2013: $50,579,000). 33. SIGNIFICANT RELATED PARTY TRANSACTIONS In addition to the related party information disclosed elsewhere in the financial statements, the Group had the following significant transactions with its related parties during the financial years at terms agreed between the companies: Group 2014 $’000 2013 $’000 Rental expenses paid to related parties (2,110) (2,322) Sale of goods to a joint venture company 2,818 3,272 Sale of food and beverage to a related company 251 278 Project management fee income from related party – 55 Management service fee income from related party – 90 Restaurant operator income from related party – 1,586 Compensation of key management personnel: Remuneration paid to: Directors of the Company Fees paid to directors of the Company (574) (492) Salaries, bonuses and related expenses (1,465) (1,266) Contributions to defined contribution plans (13) (11) Directors of subsidiary companies and other key management personnel Fees paid to directors of the subsidiary companies – (178) Salaries, bonuses and related expenses (2,282) (1,445) Contributions to defined contribution plans (87) (55) 127 128 Auric Pacific Group Limited Annual Report 2014 Auric Pacific Group Limited Annual Report 2014 NOTES TO THE FINANCIAL STATEMENTS NOTES TO THE FINANCIAL STATEMENTS 34. FAIR VALUE OF ASSETS AND LIABILITIES 34. FAIR VALUE OF ASSETS AND LIABILITIES (CONT’D) For the financial year ended 31 December 2014 For the financial year ended 31 December 2014 (a) Fair value hierarchy The Group classifies fair value measurements using a fair value hierarchy that is dependent on the valuation inputs used as follows: (c) Level 2 fair value measurements The following is a description of the valuation techniques and inputs used in the fair value measurement for assets and liabilities that are categorised within Level 2 of the fair value hierarchy: Level 1 – Quoted prices (unadjusted) in active markets for identical assets or liabilities that the Group can access at the measurement date; Unquoted investment fund (Note 16): Level 2 – Inputs other than quoted prices included within Level 1 that are observable for the asset or liability, either directly or indirectly; and Level 3 – Unobservable inputs for the asset or liability. Fair value measurements that use inputs of different hierarchy levels are categorised in its entirety in the same level of the fair value hierarchy as the lowest level input that is significant to the entire measurement. (d) Fair value of financial instruments by classes that are not carried at fair value and whose carrying amounts are reasonable approximation of fair value (b) Assets and liabilities measured at fair value The following table shows an analysis of financial instruments carried at fair value by level of fair value hierarchy:. Group 2014 Quoted prices in active Significant market for unobservable identical inputs other than instruments quoted prices (Level 1) (Level 2) $’000 $’000 Significant unobservable inputs (Level 3) $’000 Assets measured at fair value Financial assets: Financial assets at fair value through profit or loss: Investment funds (unquoted) (Note 16) – 1,166 – Financial assets as at 31 December 2014 – 1,166 – Quoted prices in active Significant market for unobservable identical inputs other than instruments quoted prices (Level 1) (Level 2) $’000 $’000 Trade debtors, other debtors (current portion), trade creditors, other creditors and accruals, amounts due from/ (to) subsidiary companies, loans and borrowings, cash and cash equivalents, and fixed deposits (restricted) The carrying amounts of these financial assets and liabilities are reasonable approximation of fair values, either due to their short-term nature or that they are floating rate instruments that are re-priced to market interest rates on or near the balance sheet date. (e) Fair values of financial instruments by classes that are not carried at fair value and whose carrying amounts are not reasonable approximation of fair value Total $’000 1,166 1,166 The fair values of financial assets by classes that are not carried at fair value and whose carrying amounts are not reasonable approximation of fair value are as follows: Group 2014 2013 Carrying Fair Carrying Fair value value value value $’000 $’000 $’000 $’000 Financial assets Available-for-sale financial assets: - Unquoted investment funds, at cost (Note 16) 9,262 * 8,718 * * Investments in unquoted investment funds carried at cost Group 2013 The fair value of the unquoted investment fund was assessed to approximate the net asset value indicated on the net asset value statement issued by the investment fund manager. Significant unobservable inputs (Level 3) $’000 Assets measured at fair value Financial assets: Financial assets at fair value through profit or loss: Investment funds (unquoted) (Note 16) – 1,442 – Financial assets as at 31 December 2013 – 1,442 – Total $’000 1,442 1,442 Fair value information has not been disclosed for the Group’s investments in unquoted investment funds that are carried at cost less accumulated impairment loss because fair value cannot be measured reliably. The unquoted investment funds represent investments in mining, technology-related and education investment fund companies which are not quoted on any market. The fair value cannot be reliably measured as these unquoted investment funds do not have quoted market prices in an active market, and it is not practicable to determine the fair value using valuation models as the assumptions in these models cannot be reasonably determined. The Group does not intend to dispose of these investments in the foreseeable future. The Group intends to eventually dispose of their investments through sales to institutional or private investors. 129 130 Auric Pacific Group Limited Annual Report 2014 Auric Pacific Group Limited Annual Report 2014 NOTES TO THE FINANCIAL STATEMENTS NOTES TO THE FINANCIAL STATEMENTS 35. FINANCIAL RISK MANAGEMENT POLICIES AND OBJECTIVES 35. FINANCIAL RISK MANAGEMENT POLICIES AND OBJECTIVES (CONT’D) For the financial year ended 31 December 2014 For the financial year ended 31 December 2014 The Group and the Company are exposed to financial risks arising from its operations and the use of financial instruments. The Group’s principal financial instruments comprise loans and borrowings, investments, and cash and short-term deposits. The Group has various other financial assets and liabilities, such as trade debtors and creditors, and other debtors and creditors. The key financial risks are credit risk, foreign currency risk, and liquidity risk. The Board of directors reviews and agrees policies and procedures for the management of these risks. There has been no change to the Group’s exposure to these financial risks or the manner in which it manages and measures the risks. (a) Credit risk Credit risk is the risk of loss that may arise on outstanding financial instruments should a counterparty default on its obligations. The Group’s and the Company’s exposure to credit risk arises primarily from trade and other debtors. Guidelines on credit terms provided to trade customers are established and continually monitored. For other financial assets (including cash and short-term deposits, fixed deposits, investment securities, and investment funds), the Group minimises credit risk by dealing exclusively with reputable and well-established local and foreign banks, and companies with high credit ratings and no history of defaults. The Group’s objective is to seek continual revenue growth while minimising losses incurred due to increased credit risk exposures. Credit policies with guidelines on credit terms and limits set the basis for risk control. New customers are subject to credit evaluation while the Group continues to monitor existing customers, especially those with repayment issues. In addition, appropriate allowances are made for probable losses when necessary for identified debtors. (a) Credit risk (cont’d) Credit risk concentration profile (cont’d) Group 2014 Total $’000 % By geographical segment: Singapore 43,621 68 Hong Kong 533 1 Malaysia 19,973 31 People’s Republic of China 10 * 64,137 100 * Less than 1% Total $’000 2013 43,535 532 15,926 17 60,010 % 73 1 26 * 100 Financial assets that are neither past due nor impaired Trade and other debtors that are neither past due nor impaired mainly comprise debtors with good payment records. Cash and cash equivalents, investment securities, and investment funds are placed with or entered into with reputable financial institutions, well-established local and foreign banks and companies with high credit ratings and no history of defaults. In addition, the Group’s exposure to credit risk for its food court operations arises primarily from other debtors. The Group does not have credit risk exposure from the tenants. It is the Group’s policy that all tenants need to place deposits before the Group licenses the stalls to the tenants. In addition, the Group collects sales proceeds on behalf of the tenants and returns the net proceeds to the tenants upon settlement. Financial assets that are either past due or impaired Information regarding financial assets that are either past due or impaired is disclosed in Notes 18, 19, and 20 to the financial statements. Exposure to credit risk (b) Foreign currency risk At the balance sheet date, the Group’s and the Company’s maximum exposure to credit risk is represented by the carrying amounts of each class of financial assets recognised in the balance sheets. Credit risk concentration profile As at 31 December 2014, 66% (2013: 84%) of trade debtors related to 27 (2013: 25) major customers of subsidiary companies. The credit risk concentration profile of the Group’s trade debtors at the balance sheet date are as follows: The Group has transactional currency exposures arising from sales or purchases that are denominated in a currency other than the respective functional currencies of Group entities. The Group’s foreign exchange exposures are primarily from United States dollars (USD) and Hong Kong dollars (HKD). The Group does not consider foreign exchange risk arising from other currencies, such as Indonesian Rupiah (Rupiah), Australian Dollars (AUD) and Renminbi (RMB) to be significant. The Group’s policy is to enter into forward currency contracts to reduce its foreign exchange risk, where appropriate, but does not hedge the foreign currency exposures of its investments in subsidiary companies. The Group does not have any forward currency contracts outstanding as at 31 December 2014. Group 2014 Total $’000 % By business segment: Wholesale and distribution 52,158 81 Manufacturing 9,539 15 Food retail 2,398 4 Food courts 42 * 64,137 100 Total $’000 48,915 8,514 2,501 80 60,010 2013 % 82 14 4 * 100 131 132 Auric Pacific Group Limited Annual Report 2014 Auric Pacific Group Limited Annual Report 2014 NOTES TO THE FINANCIAL STATEMENTS NOTES TO THE FINANCIAL STATEMENTS 35. FINANCIAL RISK MANAGEMENT POLICIES AND OBJECTIVES (CONT’D) 35. FINANCIAL RISK MANAGEMENT POLICIES AND OBJECTIVES (CONT’D) For the financial year ended 31 December 2014 For the financial year ended 31 December 2014 (b) Foreign currency risk (cont’d) (c) Liquidity risk Sensitivity analysis for foreign currency risk The following table demonstrates the sensitivity to a reasonably possible change in the exchange rates of USD and HKD (against SGD), with all other variables held constant, of the Group’s profit net of taxation. Liquidity risk is the risk that the Group or the Company will encounter difficulty in meeting financial obligations due to shortage of funds. The Group’s and the Company’s exposure to liquidity risk arises primarily from mismatches of the maturities of financial assets and liabilities. The Group’s and the Company’s objective is to maintain a level of cash to meet the obligations and commitments due and to ensure cash efficiency whereby maximisation of cash flow position can be achieved. The Group’s liquidity risk management policy is to monitor its working capital projections, taking into account the available banking and other borrowing facilities of the Group, and ensuring that the Group has adequate working capital to meet obligations and commitments due. Analysis of financial instruments by remaining contractual maturities The table below summarises the maturity profile of the Group’s and the Company’s financial assets and liabilities at the balance sheet date, based on contractual undiscounted repayment obligations. USD/SGD – strengthened 3% (2013: 2%) – weakened 3% (2013: 2%) HKD/SGD – strengthened 3% (2013: 2%) – weakened 3% (2013: 2%) Group 2014 2013 $’000 $’000 Increase/ Increase/ (decrease) (decrease) in profit in profit 359 (359) 254 (254) 74 (74) 169 (169) Interest rate risk is the risk that the fair value or future cash flows of the Group’s and the Company’s financial instruments will fluctuate because of changes in market interest rates. The Group’s and the Company’s exposure to interest rate risk arises primarily from their loans and borrowings, interest-bearing loans from/to subsidiary companies, cash and cash equivalents. The Group’s policy is to minimise its interest exposure through the restructure of loans and borrowings, and to enter into interest rate swaps, where appropriate. In the past 2 years, the Group has not entered into any interest rate swaps. Sensitivity analysis for interest rate risk Movements in interest rates will have an impact on the Group’s loans and borrowings. A change of 50 basis points (bp) in interest rates at the reporting date would change profit net of taxation by the amounts shown below. This analysis assumes that all other variables remain constant. Group 50bp 50bp Increase Increase $’000 $’000 Increase/(decrease) in profit 2014 Loans and borrowings (31) 31 Increase/(decrease) in profit 2013 Loans and borrowings (31) 31 Information relating to the Group’s interest exposure is also disclosed in various notes to the financial statements. 2014 Group Within 1 year $’000 Within 2 to 5 years Total $’000 $’000 2013 Within 1 year $’000 Within 2 to 5 years $’000 Financial assets Trade and other debtors 73,386 6,751 80,137 69,363 5,810 Other recoverables 415 2,721 3,136 583 567 Cash and cash equivalents 46,326 – 46,326 55,867 – Fixed deposits (restricted) 4,004 – 4,004 3,856 – 124,131 9,472 133,603 129,669 6,377 Financial liabilities Trade and other creditors 86,113 – 86,113 78,532 – Loans and borrowings 9,408 478 9,886 6,546 379 95,521 478 95,999 85,078 379 Total net undiscounted financial assets 28,610 8,994 37,604 44,591 5,998 Company Financial assets Trade and other debtors 170,408 – 170,408 179,848 – Cash and cash equivalents 14,857 – 14,857 24,757 – 185,265 – 185,265 204,605 – Financial liabilities Trade and other creditors 185,520 – 185,520 178,054 – Loans and borrowings 4,000 – 4,000 – – 189,520 – 189,520 178,054 – Total net undiscounted financial (liabilities)/ assets* (4,255) – (4,255) 26,551 – * Total $’000 75,173 1,150 55,867 3,856 136,046 78,532 6,925 85,457 50,589 179,848 24,757 204,605 178,054 – 178,054 26,551 In 2015, the Company received a dividend from its subsidiary as disclosed in Note 39(b), which addresses the net undiscounted financial liabilities position as shown above. 133 134 Auric Pacific Group Limited Annual Report 2014 Auric Pacific Group Limited Annual Report 2014 NOTES TO THE FINANCIAL STATEMENTS NOTES TO THE FINANCIAL STATEMENTS 35. FINANCIAL RISK MANAGEMENT POLICIES AND OBJECTIVES (CONT’D) 37. SEGMENT INFORMATION For the financial year ended 31 December 2014 For the financial year ended 31 December 2014 (c) Liquidity risk (cont’d) Analysis of financial instruments by remaining contractual maturities (cont’d) The table below summarises the contractual expiry by maturity of the Group’s contingent liabilities and commitments. The maximum amount of the financial guarantee contracts are allocated to the earliest period in which the guarantee could be called. Bankers’ guarantees Within 1 year $’000 2,116 Group 2014 Within 2 Within to 5 years Total 1 year $’000 $’000 $’000 5,083 7,199 2,906 2013 Within 2 to 5 years $’000 Total $’000 3,965 6,871 36. CAPITAL MANAGEMENT The main objective of the Group in capital management is to ensure that it maintains a healthy capital structure from various sources of funds to finance its overall operations, support business growth and maximise shareholder value. While debt financing provides more flexibility in arrangement, the Group monitors the volatility of interest rates on the variability of earnings before taxation. Hence, the Group ensures that a sufficient income stream is maintained to service all contractual obligations arising from debt financing and dividend payments to shareholders. Interest coverage is calculated by dividing adjusted profit by finance costs. Adjusted profit relates to the profit before taxation after adjusting for finance costs, depreciation and amortisation, and provision for closure costs. The interest coverage was 54.0 in 2014 as compared to 41.1 in 2013. No changes were made in the objectives, policies or processes during the financial years ended 31 December 2014 and 2013. The Group’s policy is to maintain the interest coverage not less than 1.2 (2013: 1.2). The Group monitors capital using a debt-equity ratio, which is calculated by dividing its total loans and borrowings by total shareholders’ equity. The Group’s policy is to keep the ratio below 1 (2013: 1). Total liabilities include loans and borrowings, and trade and other creditors. Total shareholders’ equity includes equity attributable to the equity holders of the parent. Group 2014 2013 $’000 $’000 Loans and borrowings (Note 26) Equity attributable to the owners of the Company Gearing ratio Adjusted profit Finance costs Interest coverage 9,806 6,867 207,982 211,237 0.05 0.03 20,032 16,414 371 399 54.0 41.1 For management purposes, the Group is organised into business units based on their products and services, and has eight reportable operating segments as follows: (i) The Wholesale and Distribution segment is in the business of supplying fast-moving consumer goods and fine wines. (ii) The Manufacturing segment is in the business of manufacturing bread and other house brand products. (iii) The Food Retail segment operates chains of bakeries, cafes and bistros. (iv) The Food Courts segment is in the business of managing food courts, restaurants and sale of food and beverages. (v) The Property Investment segment is in the business of leasing residential and commercial properties. (vi) The Securities Investment segment is mainly in the business of investing in funds and quoted investment securities. (vii) The Investment Holding segment is involved in Group-level corporate services, treasury functions, and investing in unquoted investments. (viii) The Fund Investment segment is in the business of real estate fund investment. Management monitors the operating results of its business units separately for the purpose of making decisions about resource allocation and performance assessment. Segment profit is used to measure performance as management believes that such information is the most relevant in evaluating the results of certain segments relative to other entities that operate within these industries. Segment accounting policies are the same as the policies described in Note 2 to the financial statements. Information regarding the results of each reportable operating segment is included below. 135 136 Auric Pacific Group Limited Annual Report 2014 Auric Pacific Group Limited Annual Report 2014 NOTES TO THE FINANCIAL STATEMENTS NOTES TO THE FINANCIAL STATEMENTS For the financial year ended 31 December 2014 For the financial year ended 31 December 2014 37. SEGMENT INFORMATION (CONT’D) For the financial year ended 31 December 2014: Wholesale and Distribution Manufacturing $’000 $’000 Revenue: - External customers 238,723 46,831 - Inter-segment 28,136 14,234 Total revenue 266,859 61,065 Results: Interest income – – Dividend income – – Fair value loss on investment funds at fair value through profit or loss – – Stocks written down (2,078) (139) (Allowance)/write-back for impairment on trade debtors (827) 41 Depreciation and amortisation (730) (1,729) Property, plant and equipment written off – (41) Write-back of provision for reinstatement cost – – Net gain/(loss) on disposal of property, plant and equipment 14 (27) Impairment loss on intangible assets – – Share of results of associated and joint venture companies 770 – Gain on disposal of interest in subsidiary companies – – Segment profit/(loss) 9,534 9,996 Assets: Investments in associated and joint venture companies 2,002 – Additions to non-current assets 901 1,517 Segment assets 116,140 19,891 Segment liabilities (36,594) (7,913) Food Retail $’000 Food Courts $’000 76,471 2,322 78,793 62,088 35 62,123 – – – – – – – – 29 (7,130) (25) – 20 – – (2) (5,975) 4 233 22 (463) – – (6,866) – (5,280) – 6,158 – 10,287 71,666 69,642 (16,378) (31,273) Adjustments Property Securities Investment Fund and Investment Investment Holding Investment Emliminations Note $’000 $’000 $’000 $’000 $’000 Per Consolidated Financial Statements $’000 – 300 11 – – – – 300 11 – 1 11 – 300 – – (329) – – – – – – – – – – – – (329) (2,217) – – – – – – – – – – – (173) – – – – – – – – – – – – – (759) (15,737) (62) 233 29 – – – – – (463) – (4) – – – 766 – (1) – – 1,734 (7,138) – (1) – 395 (ii) 1,734 639 – 273 – – – 46 2,500 7,509 7,676 (4) (41) (2,410) – – 888 – – 23,781 (iii) 2,275 18,909 319,693 – – – (8) – (44,727) (i) (44,727) (16,322) (iv) 424,424 – 424,424 12 300 (110,943) 137 138 Auric Pacific Group Limited Annual Report 2014 Auric Pacific Group Limited Annual Report 2014 NOTES TO THE FINANCIAL STATEMENTS NOTES TO THE FINANCIAL STATEMENTS For the financial year ended 31 December 2014 For the financial year ended 31 December 2014 37. SEGMENT INFORMATION (CONT’D) For the financial year ended 31 December 2013: Revenue: - External customers - Inter-segment Total revenue Wholesale and Distribution Manufacturing $’000 $’000 Food Retail $’000 216,964 43,082 26,810 11,845 243,774 54,927 71,678 1,698 73,376 Results: Interest income – – Dividend income – – Fair value gain on investment funds at fair value through profit or loss – – Fair value loss on redeemable preference shares issued by a subsidiary company – – Allowance for impairment on unquoted investment funds – – Stocks written down (2,081) (99) Allowance for impairment on trade debtors (583) (41) Depreciation and amortisation (667) (1,564) Property, plant and equipment written off (1) (46) Net (loss)/gain on disposal of property, plant and equipment – (5) Impairment loss on intangible assets – – Allowance for impairment on property, plant and equipment – (81) Share of results of associated and joint venture companies 832 – Segment profit/(loss) 11,514 7,276 Assets: Investments in associated and joint venture companies 2,067 – Additions to non-current assets 475 1,416 Segment assets 110,246 19,281 Segment liabilities (35,845) (6,719) Food Courts $’000 Adjustments Property Securities Investment Fund and Investment Investment Holding Investment Emliminations Note $’000 $’000 $’000 $’000 $’000 – – 19 – – – – 485 24 – – – – 485 24 – – 24 – 485 – – 75 – – – – – 64,503 – 64,503 1,746 – 1,746 – (40,353) (i) (40,353) Per Consolidated Financial Statements $’000 398,482 – 398,482 1,374 – – – 1,417 485 – – 75 – (814) – (814) – – (118) (6,343) – – – (8,630) – – – – (47) – – – (3,000) – – (256) – – – (1) – – – – (3,047) (2,180) (742) (17,461) (49) (218) – – – – – (314) – – – – – – – (5) (66) 503 – – – – – – (51) (10,000) – – – (4,511) – (12,111) – 1,678 – 428 (ii) – 277 – – – 131 2,500 6,910 17,682 (9) (42) (2,478) – – 898 – 43 22,449 (iii) (50) (10,000) 4 – (532) (3,898) – (18,488) – (12,646) 827 (21,912) – 7,516 75,674 – 4,557 53,855 (17,778) (21,885) (19) (12,518) (iv) 2,344 14,138 309,495 (97,293) 139 140 Auric Pacific Group Limited Annual Report 2014 Auric Pacific Group Limited Annual Report 2014 NOTES TO THE FINANCIAL STATEMENTS NOTES TO THE FINANCIAL STATEMENTS 37. SEGMENT INFORMATION (CONT’D) 37. SEGMENT INFORMATION (CONT’D) Notes Information from major customers Revenue from a major customer amounts to $51,030,000 (2013: $48,012,000), arising from sales from Wholesale and Distribution segment. 38. DIRECTORS’ REMUNERATION The number of directors of the Company whose total remuneration from the Group falls into the following bands is as follows: For the financial year ended 31 December 2014 For the financial year ended 31 December 2014 Nature of adjustments and eliminations to arrive at amounts reported in the consolidated financial statements (i) Inter-segment revenues are eliminated on consolidation. (ii) The following items are added to/(deducted from) segment profit to arrive at “Profit before taxation” presented in the statement of comprehensive income: 2014 $’000 Finance costs Share of results of associated and joint venture companies (371) 766 395 2013 $’000 (399) 827 428 (iii) The following items are added to segment assets to arrive at total assets reported in the consolidated balance sheet: 2014 2013 $’000 $’000 Investments in associated and joint venture companies Goodwill on consolidation Deferred tax assets Tax recoverable (iv) 2,275 18,059 1,092 2,355 23,781 $500,000 and above Below $250,000 Total 39. EVENTS OCCURRING AFTER THE REPORTING PERIOD 2,344 18,107 1,158 840 22,449 2014 $’000 2013 $’000 Deferred tax liabilities Tax payable Loans and borrowings Obligations under finance leases 3,640 2,876 9,268 538 16,322 4,202 1,449 6,433 434 12,518 Revenue and non-current assets information based on geographical location of customers and assets respectively are as follows: Revenue Non-current assets 2014 2013 2014 2013 $’000 $’000 $’000 $’000 Singapore 270,136 259,418 113,903 108,445 Malaysia 101,812 89,201 7,059 3,980 Hong Kong 48,616 42,618 7,738 8,608 People’s Republic of China 3,822 5,195 59 278 Indonesia 38 304 120 – Others – 1,746 – – 424,424 398,482 128,879 121,311 Non-current assets information presented above consist of property, plant and equipment, intangible assets, other debtors, and prepayments and other recoverables. 1 7 8 1 6 7 (a) Investment in PT. Auric Pacific Marketing Indonesia The following items are added to segment liabilities to arrive at total liabilities reported in the consolidated balance sheet: Group 2014 2013 On 6 January 2015, APG Foods Pte Ltd (“APGF”), a wholly-owned subsidiary of the Company has invested in a newly incorporated company in Indonesia, PT. Auric Pacific Marketing Indonesia (“PT. APMI”). The issued and paid up share capital of PT. APMI is US$220,000 and the principal activities are distribution and sale of food and beverage products. APGF has subscribed for 660 units of shares (US$100 each) and paid US$66,000 in total. This represented 30% of the issued and paid up share capital of PT. APMI. (b) Dividend of $25,000,000 declared by a subsidiary, Auric Property Pte Ltd In March 2015, Auric Property Pte Ltd declared and paid a final tax exempt (one-tier) dividend of $25,000,000 for the financial year ended 31 December 2014 to Auric Pacific Group Limited. 40. AUTHORISATION OF FINANCIAL STATEMENTS FOR ISSUE The financial statements for the financial year ended 31 December 2014 were authorised for issue in accordance with a resolution of the directors on 30 March 2015. 141 142 Auric Pacific Group Limited Annual Report 2014 Auric Pacific Group Limited Annual Report 2014 SHAREHOLDING STATISTICS SHAREHOLDING STATISTICS Issued and Fully Paid-up Capital No. of Shares Issued Class of Shares Voting Rights (7) (8) Win Joyce Limited (“Win Joyce”) is deemed to be interested in the shares of APGL through Goldmax. Win Joyce is a wholly-owned subsidiary of Rickon Holdings Limited (“Rickon”). Rickon, a wholly-owned subsidiary of Lippo China Resources Limited (“LCR”), is deemed to be interested in the shares held by Tamsett, Win Joyce, Hong Kong China Treasury Limited and their related corporations in APGL. (9) LCR is deemed to be interested in the shares held by Rickon and its related corporations in APGL. As at 16 March 2015 : : : : As at 16 March 2015 $64,460,182 125,667,324 Ordinary share One vote per share (10) Skyscraper Realty Limited (“Skyscraper”) is deemed to be interested in the shares held by LCR and its related corporations in APGL. ANALYSIS OF SHAREHOLDINGS (11) First Tower Corporation (“First Tower”) is deemed to be interested in the shares held by Skyscraper and its related corporations in APGL. RANGE OF SHAREHOLDINGS NO. OF % NO. OF % SHAREHOLDERS SHARES 1 – 99 154 5.73 4,105 0.00 100 – 1,000 752 27.98 496,460 0.39 1,001 – 10,000 1,342 49.92 5,425,538 4.32 10,001 – 1,000,000 435 16.18 19,211,067 15.29 1,000,001 AND ABOVE 5 0.19 100,530,154 80.00 2,688 100.00 125,667,324 100.00 (12) Lippo Limited (“Lippo”) is deemed to be interested in the shares held by First Tower and its related corporations in APGL. SUBSTANTIAL SHAREHOLDERS (13) Lippo Capital Limited (“Lippo Capital”) is deemed to be interested in the shares held by Lippo and its related corporations in APGL. (14) Lanius Limited (“Lanius”) is deemed to be interested in the shares held by Lippo Capital and its related corporations in APGL. (15) Mr James T. Riady is deemed to be interested in the shares held by Lanius and its related corporations in APGL. (16) Dr Stephen Riady (“Dr Riady”) is deemed to be interested in the shares held by Lanius and its related corporations in APGL. Lanius is the trustee of a discretionary trust of which, inter alia, Dr Riady and other members of the family are the beneficiaries. (17) Bravado International Ltd. (“Bravado”) is deemed to be interested in the shares of APGL held by Goldstream Capital Limited (“Goldstream”) which in turn is a wholly-owned subsidiary of Bravado. (18) Dr Andy Adhiwana is deemed to be interested in the shares of APGL through Bravado. Dr Andy Adhiwana is the beneficial owner of the entire issued shares capital of Bravado. (as shown in the Register of Substantial Shareholders) Name 1 Jeremiah Holdings Limited 2 Goldstream Capital Limited 3 Nine Heritage Pte Ltd 4 Pantogon Holdings Pte Ltd 5 Dragon Board Holdings Limited 6 Ir Endang Utari Mokodompit 7 Max Turbo Limited 8 Tamsett Holdings Limited 9 Goldmax Pacific Limited 10 Win Joyce Limited 11 Rickon Holdings Limited 12 Lippo China Resources Limited 13 Skyscraper Realty Limited 14 First Tower Corporation 15 Lippo Limited 16 Lippo Capital Limited 17 Lanius Limited 18 James T. Riady 19 Stephen Riady 20 Bravado International Ltd. 21 Andy Adhiwana Beneficial Interest % Deemed Interest % 4,999,283 27,493,311 20,004,000 36,165,052 – – – – – – – – – – – – – – – – – 3.98 21.88 15.92 28.78 – – – – – – – – – – – – – – – – – 20,004,000(1) – – – 25,003,283(2) 25,003,283(3) 25,653,283(4) 25,653,283(5) 36,165,052(6) 36,165,052(7) 61,927,335(8) 61,927,335(9) 61,927,335(10) 61,927,335(11) 61,927,335(12) 61,927,335(13) 61,927,335(14) 61,927,335(15) 61,927,335(16) 27,493,311(17) 27,493,311(18) 15.92 – – – 19.90 19.90 20.41 20.41 28.78 28.78 49.28 49.28 49.28 49.28 49.28 49.28 49.28 49.28 49.28 21.88 21.88 Notes: (1) Jeremiah Holdings Limited (“Jeremiah”) is deemed to be interested in the shares held by Nine Heritage Pte Ltd (“Nine Heritage”) in Auric Pacific Group Limited (“APGL”). (2) Dragon Board Holdings Limited (“Dragon Board”) is deemed to be interested in the shares held by Jeremiah and Nine Heritage in APGL. (3) Ir Endang Utari Mokodompit is deemed to be interested in the shares held by Jeremiah and Nine Heritage in APGL. (4) (5) Max Turbo Limited (“Max Turbo”) is deemed to be interested in the shares held by Dragon Board and its related corporations in APGL. Tamsett Holdings Limited (“Tamsett”) is deemed to be interested in the shares held by Max Turbo and its related corporations in APGL. (6) Goldmax Pacific Limited (“Goldmax”) is deemed to be interested in the shares of APGL through Pantogon Holdings Pte Ltd. TWENTY LARGEST SHAREHOLDERS (as shown in the Register of Members and Depository Register) No. Name CITIBANK NOMINEES SINGAPORE PTE LTD RHB SECURITIES SINGAPORE PTE LTD RAFFLES NOMINEES (PTE) LTD DBS NOMINEES PTE LTD HSBC (SINGAPORE) NOMINEES PTE LTD KOR BENG SHIEN UNITED OVERSEAS BANK NOMINEES PTE LTD PHILLIP SECURITIES PTE LTD SAW PHAIK HWA CHEE SWEE CHENG & CO PTE LTD OCBC NOMINEES SINGAPORE PRIVATE LIMITED TAN CHEE JIN GOH GEOK LOO ATLAS ICE (SINGAPORE) PRIVATE LIMITED NG SOO GIAP OR CHEW SOOI GUAT TEH GUEK NGOR ENGELIN SEET CHRISTINA TAYERS HOLDINGS PTE LTD VIJEYACONE ARIYACONE @ VIJEYARETNAM LAM HOLDINGS (PTE) LTD No. Of Shares Held % 65,053,335 27,557,311 3,621,338 2,566,186 1,731,984 788,000 735,429 700,250 550,000 518,469 505,000 460,000 350,000 305,735 295,000 231,000 228,000 205,000 197,995 197,013 106,797,045 51.77 21.93 2.88 2.04 1.38 0.63 0.58 0.56 0.44 0.41 0.40 0.37 0.28 0.24 0.23 0.18 0.18 0.16 0.16 0.16 84.98 FREE FLOAT Based on the information available to the Company as at 16 March 2015, approximately 28.4% of the issued ordinary shares of the Company is held by the public and the Company is in compliance with Rule 723 of the Listing Manual. 143 144 Auric Pacific Group Limited Annual Report 2014 Auric Pacific Group Limited Annual Report 2014 NOTICE OF ANNUAL GENERAL MEETING NOTICE OF ANNUAL GENERAL MEETING Notice is hereby given that the Twenty-Eighth Annual General Meeting of Auric Pacific Group Limited (the “Company”) will be held at Capricorn Leo Function Room (Level 1), Marina Mandarin Singapore, 6 Raffles Boulevard, Marina Square, Singapore 039594 on Wednesday, 29 April 2015 at 10.00 a.m. for the following purposes: (b) (notwithstanding that the authority conferred by this Resolution may have ceased to be in force) issue Shares in pursuance of any Instrument made or granted by the directors of the Company while this Resolution was in force, AS ORDINARY BUSINESS 1. To receive and adopt the directors’ report and audited financial statements for the financial year ended 31 December 2014, together with the auditors’ report thereon. (Resolution 1) 2. To approve a one-tier tax exempt final dividend of 2 cents per share for the financial year ended 31 December 2014. (Resolution 2) 3. To approve directors’ fees of S$563,000 payable by the Company for the financial year ended 31 December 2014 (Approved directors’ fees for financial year ended 31 December 2013: S$574,000). (Resolution 3) 4. To re-elect the following directors who are retiring and who, being eligible, offer themselves for re-election: (a) Dr Stephen Riady, who retires by rotation pursuant to Article 91 of the Articles of Association of the Company. (See Explanatory Note 1) (Resolution 4) (b) Mr Bryan Chang Yew Chan, who retires by rotation pursuant to Article 91 of the Articles of Association of the Company. (Resolution 5) (See Explanatory Note 2) (c) Dr Andy Adhiwana, who retires pursuant to Article 97 of the Articles of Association of the Company. (See Explanatory Note 3) (Resolution 6) 5. To re-appoint Ernst & Young LLP as auditors of the Company for the ensuing year and to authorise the directors to fix their remuneration. (Resolution 7) AS SPECIAL BUSINESS To consider and, if thought fit, to pass, with or without modifications, the following resolution as an ordinary resolution:6. Authority to allot and issue shares That authority be given to the directors of the Company to:(a) (i) issue shares in the Company (“Shares”) whether by way of rights, bonus or otherwise; and/or (ii) make or grant offers, agreements or options (collectively, “Instruments”) that might or would require Shares to be issued, including but not limited to the creation and issue of (as well as adjustments to) options, warrants, debentures or other instruments convertible or exchangeable into Shares, at any time and upon such terms and conditions and for such purposes and to such persons as the directors of the Company may in their absolute discretion deem fit; and 145 provided that: (1) the aggregate number of Shares to be issued pursuant to this Resolution (including Shares to be issued in pursuance of the Instruments made or granted pursuant to this Resolution) shall not exceed 50 per cent of the total number of issued Shares in the capital of the Company (as calculated in accordance with sub-paragraph (2) below), of which the aggregate number of Shares to be issued other than on a pro rata basis to shareholders of the Company (including Shares to be issued under the Instruments made or granted under this Resolution) shall not exceed 20 per cent of the total number of issued Shares in the capital of the Company (as calculated in accordance with sub-paragraph (2) below); (2) (subject to such manner of calculation as may be prescribed by the Listing Manual of the Singapore Exchange Securities Trading Limited (“SGX-ST”)) for the purpose of determining the aggregate number of Shares that may be issued under sub-paragraph (1) above, the total number of issued Shares shall be based on the total number of issued Shares in the capital of the Company at the time of the passing of this Resolution, after adjusting for: (a) new Shares arising from the conversion or exercise of any convertible securities; (b) new Shares arising from exercising share options or vesting of share awards which are outstanding or subsisting at the time of the passing of this Resolution; and (c) any subsequent bonus issue, consolidation or subdivision of Shares; (3) in exercising the authority conferred by this Resolution, the Company shall comply with the provisions of the Listing Manual of the SGX-ST for the time being in force (unless such compliance has been waived by the SGX-ST) and the Articles of Association for the time being of the Company; and (4) unless revoked or varied by the Company in a general meeting, the authority conferred by this Resolution shall continue in force until the conclusion of the next annual general meeting of the Company or the date by which the next annual general meeting of the Company is required by law to be held, whichever is the earlier. (Resolution 8) (See Explanatory Note 4) AS OTHER BUSINESS 7. To transact any other business that may be transacted at an annual general meeting. By Order of the Board Tan T’eng Ta’ Benedict Company Secretary Singapore, 14 April 2015 Notes: (1) A member of the Company entitled to attend and vote at the above meeting may appoint not more than two proxies to attend and vote in his stead. (2) A proxy need not be a member of the Company and where there is more than one proxy, the proportion (expressed as a percentage of the whole) of his shareholding to be represented by each proxy must be stated. (3) The instrument appointing a proxy must be deposited at the registered office of the Company at 50 Collyer Quay #06-03 OUE Bayfront, Singapore 049321 not less than 48 hours before the time appointed for holding the meeting. 146 Auric Pacific Group Limited Annual Report 2014 Auric Pacific Group Limited Annual Report 2014 NOTICE OF ANNUAL GENERAL MEETING NOTICE OF BOOKS CLOSURE Personal Data Privacy NOTICE IS HEREBY GIVEN that the Transfer Books and Register of Members of Auric Pacific Group Limited (the “Company”) will be closed on 8 May 2015 for the purposes of determining shareholders’ entitlements to the proposed onetier tax exempt final dividend of 2 cents per share for the financial year ended 31 December 2014. By submitting an instrument appointing a proxy(ies) and/or representative(s) to attend, speak and vote at the Annual General Meeting and/or any adjournment thereof, a Shareholder (i) consents to the collection, use and disclosure of the Shareholder’s personal data by the Company (or its agents) for the purpose of the processing and administration by the Company (or its agents) of proxies and representatives appointed for the Annual General Meeting (including any adjournment thereof) and the preparation and compilation of the attendance lists, minutes and other documents relating to the Annual General Meeting (including any adjournment thereof), and in order for the Company (or its agents) to comply with any applicable laws, listing rules, regulations and/or guidelines (collectively, the “Purposes”), (ii) warrants that where the Shareholder discloses the personal data of the Shareholder’s proxy(ies) and/or representative(s) to the Company (or its agents), the Shareholder has obtained the prior consent of such proxy(ies) and/or representative(s) for the collection, use and disclosure by the Company (or its agents) of the personal data of such proxy(ies) and/or representative(s) for the Purposes, and (iii) agrees that the Shareholder will indemnify the Company (or its agents) in respect of any penalties, liabilities, claims, demands, losses and damages as a result of the Shareholder’s breach of warranty. AND PAYMENT DATE FOR FINAL DIVIDEND Duly completed and stamped transfers in respect of shares not registered in the name of The Central Depository (Pte) Limited, together with all relevant documents of title thereto, received by the Company’s Share Registrar, M & C Services Private Limited, 112 Robinson Road #05-01, Singapore 068902, up to 5.00 p.m. on 7 May 2015 will be registered before shareholders’ entitlements to the proposed dividend are determined. Shareholders (being depositors) whose securities accounts with The Central Depository (Pte) Limited are credited with shares as at 5.00 p.m. on 7 May 2015 will rank for the proposed dividend. The proposed dividend, if approved by shareholders at the forthcoming Annual General Meeting to be held on 29 April 2015, will be paid on 22 May 2015. Explanatory Notes 1. Resolution 4 If re-elected, Dr Stephen Riady will remain as an executive director and member of the Nomination Committee and will be considered non-independent. 2. Resolution 5 If re-elected, Mr Bryan Chang Yew Chan, an independent non-executive director of the Company, shall remain as Chairman of the Audit and Risk Committee, and member of the Remuneration Committee and Nomination Committee. Mr. Bryan Chang does not have any relationships including immediate family relationships with any director, the Company and any shareholder holding 10 per cent or more Shares. 3. Resolution 6 If re-elected, Dr Andy Adhiwana will remain as an executive director and will be considered non-independent. 4. Resolution 8 The proposed Resolution 8, if passed, is to authorise the directors of the Company from the date of the Annual General Meeting until the next Annual General Meeting to issue Shares and/or make or grant Instruments that might require Shares to be issued, and to issue Shares in pursuance of such Instruments, up to a limit of 50 per cent of the total number of issued Shares in the capital of the Company, with a sub-limit of 20 per cent for issues other than on a pro rata basis, calculated in accordance with and subject to the terms under Resolution 8. By Order of the Board Tan T’eng Ta’ Benedict Company Secretary Singapore, 14 April 2015 147 AURIC PACIFIC GROUP LIMITED (COMPANY REGISTRATION NO. 198802981D) (INCORPORATED IN THE REPUBLIC OF SINGAPORE) PROXY FORM - ANNUAL GENERAL MEETING IMPORTANT NOTES: 1. For investors who have used their CPF monies to buy Auric Pacific Group Limited shares, the 2014 Annual Report is forwarded to them at the request of their CPF Approved Nominees and is sent FOR INFORMATION ONLY. 2. This Proxy Form is not valid for use by CPF investors and shall be ineffective for all intents and purposes if used, or purported to be used, by them. 3. CPF investors who wish to attend the Annual General Meeting as OBSERVERS have to submit their requests through their respective CPF Approved Nominees so that their CPF Approved Nominees may register in the required format, with the Company’s Registrar. Please see Note No. 8 on required format. Personal Data Privacy: By submitting an instrument appointing a proxy(ies) and/or representative(s), the investor accepts and agrees to the personal data privacy terms set out in the Notice of Annual General Meeting dated 14 April 2015. I/We ___________________________________________________ (Name) _________________________ (NRIC/Passport Number) of _________________________________________________________________________________________________ (Address) being a member/members of Auric Pacific Group Limited (the “Company”), hereby appoint: NRIC/ Name Address Passport No. Proportion of Shareholdings (Note 2) No. of Shares (%) and/or (delete as appropriate) NRIC/ Name Address Passport No. Proportion of Shareholdings (Note 2) No. of Shares (%) or failing him/them, the Chairman of the Annual General Meeting (the “AGM”), as my/our proxy/proxies to attend and to vote for me/us on my/our behalf and, if necessary, to demand a poll, at the AGM of the Company to be held at 10.00 a.m. on Wednesday, 29 April 2015 at Capricorn Leo Function Room (Level 1), Marina Mandarin Singapore, 6 Raffles Boulevard, Marina Square, Singapore 039594 and at any adjournment thereof. I/ We direct my/our proxy/proxies to vote for or against the resolutions to be proposed at the AGM as indicated hereunder. If no specific direction as to voting is given, the proxy/proxies may vote or abstain from voting at his/their discretion, as he/they may on any other matter arising at the AGM. NOTE: The Chairman of the AGM will be exercising his right under Article 61(a) of the Articles of Association of the Company to demand a poll in respect of the resolutions to be put to the vote at the AGM and at any adjournment thereof. Accordingly, such resolutions at the AGM will be voted on by way of a poll. No. Resolutions Relating To: No. of Votes For* No. of Votes Against* As Ordinary Business 1 To adopt the directors’ report and audited financial statements for the financial year ended 31 December 2014 and the auditors’ report thereon 2 To declare a one-tier tax exempt final dividend of 2 cents per share for the financial year ended 31 December 2014 3 To approve directors’ fees for the financial year ended 31 December 2014 4 To re-elect Dr Stephen Riady as a director 5 To re-elect Mr Bryan Chang Yew Chan as a director 6 To re-elect Dr Andy Adhiwana as a director 7 To re-appoint Ernst & Young LLP as auditors of the Company and to authorise directors to fix their remuneration As Special Business 8 To authorise directors to issue Shares and/or Instruments under Section 161 of the Singapore Companies Act, Chapter 50 * If you wish to exercise all your votes “For” or “Against” the relevant resolution, please tick (√) within the relevant box provided. Alternatively, if you wish to exercise your votes for both “For” and “Against” the relevant resolution, please indicate the number of Shares in the boxes provided. Total Number of Shares held (Note 4) Dated this ________ day of ________________ 2015. This page is intentionally left blank. Signature/Common Seal of Member(s) IMPORTANT: PLEASE READ NOTES OVERLEAF Please fold here NOTES TO PROXY FORM: 1. A member of the Company entitled to attend and vote at the meeting is entitled to appoint not more than two proxies to attend and vote in his stead and the proxy need not be a member of the Company. The instrument appointing a proxy or proxies must be deposited with the Company Secretary at the registered office not less than 48 hours before the time appointed for holding the meeting. 2. Where a member appoints more than one proxy, the appointments shall be invalid unless he specifies the proportion of his shareholding (expressed as a percentage of the whole) to be represented by each proxy. 3. Completion and return of this instrument appointing a proxy or proxies shall not preclude a member from attending and voting at the meeting. Any appointment of a proxy or proxies shall be deemed to be revoked if a member attends the meeting in person, and in such event, the Company reserves the right to refuse to admit any person or persons appointed under this instrument of proxy, to the meeting. 4. If the member has shares entered against his name in the Depository Register (as defined in Section 130A of the Companies Act, Cap. 50 of Singapore), he should insert that number of shares. If the member has shares registered in his name in the Register of Members of the Company, he should insert that number of shares. If the member has shares entered against his name in the Depository Register and registered in his name in the Register of Members, he should insert the number of shares entered against his name in the Depository Register and registered in his name in the Register of Members. If no number is inserted, this form of proxy will be deemed to relate to all shares held by the member. Please fold here Affix Stamp Here The Company Secretary AURIC PACIFIC GROUP LIMITED 50 Collyer Quay #06-03 OUE Bayfront Singapore 049321 Please fold here 5. The instrument appointing a proxy or proxies must be under the hand of the appointor or of his attorney duly authorised in writing. Where the instrument appointing a proxy or proxies is executed by a corporation, it must be executed either under its common seal or under the hand of its attorney or a duly authorised officer. 6. Where an instrument appointing a proxy or proxies is signed on behalf of the appointor by an attorney, the letter or power of attorney or a duly certified copy thereof must (failing previous registration with the Company) be lodged with the instrument of proxy, failing which the instrument may be treated as invalid. 7. The Company shall be entitled to reject a Proxy Form which is incomplete, improperly completed, illegible or where the true intentions of the appointor are not ascertainable from the instructions of the appointor specified on and/or attached to the Proxy Form. In addition, in the case of a member whose shares are entered in the Depository Register, the Company may reject a Proxy Form if the member, being the appointor, is not shown to have shares entered against his name in the Depository Register as at 48 hours before the time appointed for holding the meeting, as certified by The Central Depository (Pte) Limited to the Company. 8. CPF Approved Nominees acting on the request of CPF investors who wish to attend the meeting as observers are required to submit in writing, a list with details of the investors’ names, NRIC/Passport numbers, addresses and numbers of shares held. The list, signed by an authorised signatory of the relevant CPF Approved Nominees, should reach the Company’s Registrar, M & C Services Private Limited at 112 Robinson Road #05-01, Singapore 068902, at least 48 hours before the time appointed for holding the meeting. (Company Registration No. 198802981D) 50 Collyer Quay #06-03 OUE Bayfront Singapore 049321 Tel: (65) 6336 2262 Fax: (65) 6336 2272 www.auricgroup.com

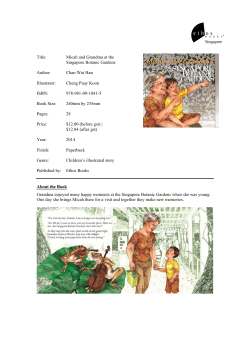


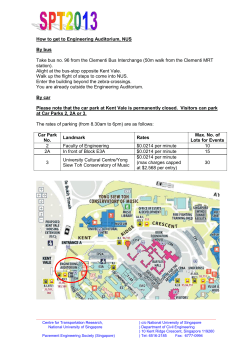
© Copyright 2026