
NADA Used Car Guide Industry Update NADA Used Car Guide
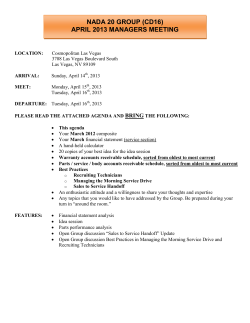
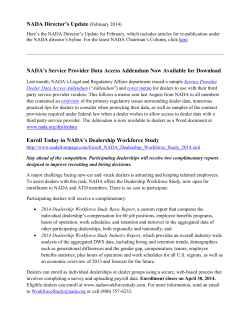
NADA Used Car Guide Industry Update April 2015 Wholesale Prices Grow by 2.3% in March Highest increase recorded since March 2014 NADA’s Used Vehicle Price Index Rises Index reaches 124.3, up from February’s level of 123.4 New Vehicle Sales Creep Up 0.4%; SAAR Reaches 17.05M SAAR exceeds 17M for the third time since 2006 Incentive Spending Flat Year-Over-Year Average spending per unit reaches $2,726, up a slight 0.4% from last year Guidelines | April 2015 TABLE OF CONTENTS Economic Update by Forecasting & Industry Analysis Group ..................................................................... 2 New & Used Market Trends ........................................................................................................ 5 NADA Official Used Car Guide Value Trends ............................................................................... 12 At NADA Used Car Guide ............................................................................................................. 13 ECONOMIC UPDATE by Steven Szakaly, Chief Economist, Forecasting & Industry Analysis Group What can I say, we took a month off with our economic update section and it seems everything went south. The biggest surprise involves employment numbers―which broke a 12-month streak of growth above 200,000 in March―with a miserly increase of 126,000. Growth in the two previous months was also revised down, which illustrates a slowing trend that was supposed to have been built up from January to March. Our constant worry about the low rate of labor participation was also unimproved. Wages were the one brighter spot growing 2.1% in comparison to last year. There is little doubt that Q1 2015 was a disappointment. We’ve seen the slowdown in numerous sectors―such as manufacturing, health care and retail―with automotive being the only sector to “beat the market,” or at least post overall growth that has been more consistent. Clearly Q1 is going to be weak. We are revising our growth forecast downward significantly for Q1 2015 to 1.9% and our overall forecast for all of 2015 to 2.9%. Some of our confidence in the strong tailwinds has ebbed, but given the low rates, the low levels of personal debt and the continued demand for motor vehicles, we’re still biased toward growth picking up in the second half of 2015. Employment (Monthly Non-Farm Employment Change, in Thousands, SA) 380 360 Historical 340 Forecast 320 300 280 260 240 220 200 180 160 140 120 100 80 60 40 20 0 2013 2014 2015 F Part of our downward revision is caused by the fall in oil prices, which has been a boon to consumers, but has dampened investment in the shale fields of the West. Our oil outlook keeps being revised downward, and we are going to do the same again. The deal with Iran (which at this writing is pending, but increasingly likely) will bring a net 1.1 NADA Used Car Guide | 8400 Westpark Drive | McLean, VA 22102 | 800.544.6232 | nada.com/b2b © 2015 NADA Used Car Guide 2 Guidelines | April 2015 [ ECONOMIC UPDATE continued ] million barrels per day (BPD) onto the market in 2016. Without any signs of slowing exports from Saudi Arabia, oil prices will stay below $60 for at least the rest of H1 2015. We now expect WTI to average just $69 a barrel in 2015. Our outlook on the Federal Reserve has also changed. We believe the rate move is definitively set off until September. We had originally forecast mid-Summer, but Q1 weakness is the perfect excuse to hold off on raising interest rates. Our preference remains the Fed not contemplate raising rates until at least Q1 2016 given the strong dollar and nonVehicle Forecast existent inflation (thanks in part to those falling (Number of Motor Vehicles Sold, in Millions) commodity prices). Unfortunately, we think the Fed doesn’t read our Guidelines report. 0.437 Historical Heavy Duty Historical Light Vehicle Just to leave you thinking positively, we’ll take a quick look at the international markets in China and Europe. Forecast Heavy Duty 17 Forecast Light Vehicle 0.422 0.387 0.382 0.385 16.65 16.41 16.3 16.5 2016 2017 2018 2019 2.8 2.9 2017 2018 16 15 14 13 12 11 10 9 16.94 8 7 6 5 4 3 2 1 0 2005 2006 2007 2009 2008 2010 2011 2012 2013 2014 2015 U.S. GDP Outlook (through 2018) 4 2.9 Gross Domestic Product, Annual % Change Focusing on motor vehicle sales, which were up in March to a 17.05 SAAR, the industry is positioned to beat overall economic growth for the sixth year in a row. The nagging question that comes from this growth: Are automotive sales a leading or lagging indicator? Leaving the traditional metrics aside, we’re currently on the side of car sales being a leading indicator, or at least a coincident indicator of the same strong fundamentals we described above. There appears no slacking in demand for cars. Also, while pent-up demand is a big part of the sales records we’ve seen, we feel there is still room to grow. The best summary is that we will leave our forecast unchanged at 16.94 million light vehicles and 0.42 commercial trucks. 18 3 3.1 2.3 2 1 0 2005 2006 2007 2008 2009 2010 2011 2012 2013 2014 2015 2016 2019 -1 -2 -3 Historical -4 Forecast -5 China is approaching a deflationary trap with low growth and massive overcapacity. How well China is able to maneuver through the looming economic slowdown is open to debate. Our estimates for 2015 GDP growth is 6.7%, below the official 7.0% target, and we expect growth to fall to a lesser 6.0% in 2016. Growth in Chinese new vehicle sales will peak in late 2015 to mid-2016, leaving NADA Used Car Guide | 8400 Westpark Drive | McLean, VA 22102 | 800.544.6232 | nada.com/b2b © 2015 NADA Used Car Guide 3 Guidelines | April 2015 [ ECONOMIC UPDATE continued ] many dealers and OEMs looking for export or exit strategies. Japan remains mired in the kind of deflationary trap China is approaching. Growth will continue to be a disappointment and auto sales will fall yet again in 2015. Across the pond, Europe is back to debating who should or should not be in the European Union. The odds of a Greek exit are going back up. We think the exit is about 50/50 right now. Criteria to consider regarding the exit involves how strong the Eurozone institutions are and if they will stand by Portugal or the next crisis-stricken member. Sometimes it’s not how fast you run, but whether you’re running faster than anyone else. NADA Used Car Guide | 8400 Westpark Drive | McLean, VA 22102 | 800.544.6232 | nada.com/b2b © 2015 NADA Used Car Guide 4 Guidelines | April 2015 [ NEW & USED MARKET TRENDS] USED MARKET UPDATE The used vehicle market made up for lost ground in March, as thawing temperatures allowed dealers and consumers to re-engage one another after harsh winter weather crimped market activity over the first two months of the year. Prices of used vehicles up to eight years in age improved by 2.3% on a monthly basis in March, which was 1.5 percentage points more than February’s tepid 0.8% rise. It was also the highest increase recorded since March 2014 NADA Used Vehicle Price Index Vehicles up to eight years in age. Seasonally adjusted. when prices ballooned by over 4%. March 2015: Index rises 0.6 point to 124.3 130 Returning to 2015, March’s solid gain lifted NADA’s seasonally adjusted used vehicle price index to 124.3, up from February’s level of 123.5, but down from last March’s lofty figure of 125.7. Mainstream segments were a model of consistency last month, as price growth for the majority checked in between a tight range of 2.3% to 2.7%. With prices improving by 1.9% and 1.6%, respectively, large pickups and subcompact cars were the only two nonluxury segments to fall short of this range. January 2010 = 100 120 110 100 90 80 Jan-15 Jan-14 Jan-13 Jan-12 Jan-11 Jan-10 Jan-09 Jan-08 Jan-07 Jan-06 Jan-05 Jan-04 Jan-03 Jan-02 Jan-01 Jan-00 Jan-99 Jan-98 Jan-97 Jan-96 Jan-95 70 Month Source: NADA Used Ca r Guide Monthly Change in Wholesale Used Vehicle Prices - February vs. March, 2015 Vehicles up to eight years in age. 3.0% 2.5% Prior Month Change From a historical standpoint, used vehicle prices have now risen by an average of nearly 1.5% in March over the past 20 years. The figure, however, conceals the fact that prices grew by an average of just 0.7% leading up to the recession, but by a more substantial 2.7% in the years since. The postrecession increase is not only a function of circumstance (weather disruptions for example), but is also likely due in part to better and more precise dealer inventory management practices. 2.7% 2.5% 2.5% 2.5% 2.0% 2.5% 2.3% 2.3% 1.9% 1.6% 1.5% 1.0% 0.5% 0.9% 0.7% 0.8% 0.9% 0.3% 0.0% Source: NADA Used Car Guide Although more modest, prices for luxury segments were also up across the board. Luxury car and mid-size utility prices rose by just under 1%, while luxury compact utility prices ticked up by 0.3%. On an annual basis, wholesale prices ended the month 2.3% higher than they were in March 2014. Large pickups have continued to perform very well. As a result, prices for NADA Used Car Guide | 8400 Westpark Drive | McLean, VA 22102 | 800.544.6232 | nada.com/b2b © 2015 NADA Used Car Guide 5 Guidelines | April 2015 [ NEW & USED MARKET TRENDS continued] the segment were 7.2% higher in March than they were last year―which is still the most of any other segment by a wide margin. Another strong performer was the midsize utility segment, whose prices were 4.0% higher than the same period last year. Midsize van and large SUV prices were slightly less than 2% higher than last year, followed by compact and luxury compact utility vehicles, as well as luxury mid-size utility vehicles at around 1%, apiece. Subcompact, luxury large and luxury mid-size car prices continue to be subpar this year. Prices for the trio have dropped between 2.3% to 4.6%. Annual Change in Wholesale Used Vehicle Prices - 2014 vs. 2015, YTD Through March. Vehicles up to eight years in age 7.2% 8.0% 6.0% 4.0% Prior Year Change Auction volume for models up to 8 years old was roughly 341,000 units in March, up 3% from February's level and more than 5% higher than March 2014. Growth was spearheaded by the 2014 model year, which continues to dominate supply through the lanes. Volume for the group reached 70,000 units in March, which was 7% higher than in February and 33% more than what was recorded for the 2013 model year last March. 4.0% 2.0% 1.0% 1.8% 2.3% 1.9% 1.2% 1.0% 0.0% -2.0% -0.4% 0.0% -0.4% -3.1% -4.0% -2.3% -4.6% -6.0% An increasing number of 2015 models also continue to make their way to auction. Volume rose by 36% Source: NADA Used Car Guide compared to February to a total of nearly 9,000 units. Excluding 2011's 7% drop, supply for remaining model years grew by an average of 2% last month. Overall, auction volume finished the first quarter 6% higher than it was over the same period last year. APRIL USED VEHICLE PRICE FORECAST NADA Used Car Guide believes March’s peaking wave of seasonal demand will contain enough energy to limit depreciation to a modest 1% in April. If the forecast rings true, the month’s loss would be an improvement over the 1.5% decline averaged for the month over the past ten years (excluding 2011’s rise in prices caused by the Japanese tsunami). Similar to March, depreciation within mainstream and luxury groupings is expected to be tightly clustered, with losses continuing to be more substantial for premium segments. Following the seasonal norm, depreciation is expected to accelerate as the market transitions from spring to summer, with declines reaching approximately 3% in May and June, then moderating somewhat in July. NADA Used Car Guide | 8400 Westpark Drive | McLean, VA 22102 | 800.544.6232 | nada.com/b2b © 2015 NADA Used Car Guide 6 Guidelines | April 2015 [ NEW & USED MARKET TRENDS continued] APRIL OFFICAL USED CAR GUIDE VALUE MOVEMENT DOMESTIC DELIVERIES FALL BACKWARD With sales sliding by 1.9% last month, domestics went in the wrong direction, but American automakers are still up by 4.4% year-to-date. Sales Volume (millions) 0.6 16% 14% 12% 10% 8% 6% 4% 0.4 0.2 2% 0.0 0% Month Source: WardsAuto New Vehicle SAAR SAAR YoY Change 18 12% 17 10% 16 8% 15 6% 14 4% 13 12 2% 11 0% Month Fiat Chrysler Automobiles (FCA) stayed afloat with Source: WardsAuto deliveries rising by 1.3% as its 6% growth year-todate remains above the industry’s pace. Jeep came to the company’s rescue in March by NADA Used Car Guide | 8400 Westpark Drive | McLean, VA 22102 | 800.544.6232 | nada.com/b2b © 2015 NADA Used Car Guide 7 Percent Change New automobile deliveries flattened out in March with sales up only 0.4%, however, the mild increase was due more to last March’s strength rather than weakness this year. In fact, the seasonally-adjusted annual rate climbed 890,000 units to hit 17.05 million units in March, making the month just the third time to pass this threshold since mid-2006. All told, sales for the first quarter were up a solid 5.6%. New Vehicle SAAR (millions) NEW VEHICLE SALES CREEP UP BY 0.4%, SAAR REACHES 17.05M UNITS YoY Change Percent Change Trade-in values in April’s edition of the NADA Official Used Car Guide decreased by 1.1% relative to March. Car values were reduced by a combined average of 0.6%, which was better than the truck segment’s combined average of 1.8%. Overall for the month of April, luxury vehicle values were, on average, decreased by 2.8%. Mainstream vehicle values, however, were pulled down by a much lower 0.8%, making this the third month in a row that mainstream vehicles performed better than New Vehicle Sales luxury vehicles. Luxury mid-size utilities performed New Vehicles Sales 1.8 the worst in April. Values for the segment were 1.6 lowered by an average of 3.2%. On the opposite end 1.4 of the spectrum, entry subcompact cars performed 1.2 1.0 the best and values were increased by an average of 0.8 2.3%. Guidelines | April 2015 [ NEW & USED MARKET TRENDS continued ] improving sales for each one of its models, which resulted in a 24% sales increase for the brand. Uncharacteristically, Ram struggled and saw deliveries fall by 0.6%. Coming in second place to FCA was General Motors (GM), albeit the automaker exhibited a 2.4% decline in deliveries for the month. Fortunately, year-to-date sales growth is still quite respectable, up 5.3% year-over-year. Mainstream Brand Performance (Units Sold) Chevrolet deliveries decreased by 3.2% as the majority of Mar-15 Feb-15 its cars performed poorly, but GMC and Buick helped Buick 20,526 17,418 Chevrolet 173,886 159,788 lessen the fall with slight sales increases of 1.3% and Chrysler 30,038 28,502 Dodge 46,049 42,115 0.5%, respectively. Ford Motor Company’s sales sunk by 3.7% in March while its year-to-date sales pace is just 2% above last year’s. Two-thirds of the automaker’s product lineup realized sales losses as both the Ford and Lincoln brands’ deliveries fell by more than 3%. IMPORTS STAY IN FRONT OF DOMESTICS, EUROPE SHINES For the second consecutive month, import sales grew the fastest and were up 2.4% overall thanks in particular to European makes, which were up a collective 4.6%. After the first quarter of 2015, import deliveries are up 6.7% year-over-year and lead domestic growth by 2.3percentage points. Excluding Volkswagen, which realized an 18% sales decline, European automakers saw deliveries jump by more than 13% altogether. Audi stood out with its 20% sales improvement, resulting primarily from the new releases of the A3 and Q3, while BMW was up 12% as many of its volume models sold well. Fiat Ford GMC Honda Hyundai Jeep Kia Mazda Mini Mitsubishi Nissan Ram Scion Smart Subaru Toyota Volkswagen 4,494 221,436 41,707 111,623 75,019 71,584 58,771 32,123 5,829 9,764 132,560 43,280 4,424 583 49,111 190,481 30,025 3,289 169,711 42,433 92,474 52,505 55,642 44,030 25,650 3,720 7,533 106,777 33,338 3,864 458 41,358 153,608 25,710 Mar-14 20,428 179,681 26,140 60,575 4,738 229,905 41,173 117,738 67,005 57,983 54,777 34,903 3,655 8,996 136,642 43,535 5,917 775 44,479 180,838 36,717 Change From Month Ago Year Ago 18% 0.5% 9% -3.2% 5% 15% 9% -24% 36.6% -5.1% 30.5% -3.7% -2% 1% 20.7% -5.2% 43% 12.0% 28.7% 23% 33% 7.3% 25% -8.0% 57% 59% 30% 9% 24% -3.0% 29.8% -1% 14.5% -25% 27.3% -25% 18.7% 10% 24.0% 5% 16.8% -18.2% Mar-14 0 15,580 14,246 32,107 14,765 12,494 1,816 4,399 28,593 8,969 29,316 3,808 5,915 Change From Month Ago Year Ago 55% 12.9% -6% 49.3% 20.0% 36% 7% 17.2% -7% 7% 0% 18% -8.6% 37.8% 54% 35.0% 9% 41.1% -3.1% 27.7% 10.2% 34% 12.7% 47.5% 0.0% Source: Wa rds Auto Luxury Brand Performance (Units Sold) Alfa Romeo Acura Audi BMW Cadillac Infiniti Jaguar Land Rover Lexus Lincoln Mercedes-Benz Porsche Volvo Mar-15 73 14,670 17,102 34,310 13,756 12,525 1,660 6,778 31,054 8,695 32,300 4,291 5,916 Feb-15 47 12,992 11,455 25,201 11,739 11,659 1,410 4,917 22,995 6,164 25,291 3,202 4,012 Source: Wa rds Auto South Korean deliveries increased by nearly 10% as the Hyundai and Kia brands exhibited sales growth of 12% and 7.2%, respectively. The Hyundai Elantra was a stellar performer in March, while Kia’s Sedona, Sorento and Sportage models all saw deliveries jump by 25% or more. Year-to-date, Hyundai and Kia sales are up a combined 6.9%. NADA Used Car Guide | 8400 Westpark Drive | McLean, VA 22102 | 800.544.6232 | nada.com/b2b © 2015 NADA Used Car Guide 8 Guidelines | April 2015 [ NEW & USED MARKET TRENDS continued ] Japanese automakers trailed the industry with sales creeping up by only 0.3% as a result of the Japanese Big Three realizing a 0.1% sales loss. However, Subaru was able to maintain its double-digit growth pace as Legacy deliveries shot up by 90%. For the year, Japanese makes still enjoy a 6.9% gain thanks to double-digit growth from Toyota, Subaru and Mitsubishi. Toyota Motor Sales improved its deliveries year-over-year by 4.9%, bringing its year-todate sales pace to 11% above last year’s. Deliveries of many Lexus models have slipped from a year ago, but the addition of the new RC and NX models pushed brand sales up by 8.6%. Meanwhile, the success of the Corolla and RAV4 helped the Toyota brand increase sales by 5.3%. Nissan North America deliveries fell by 2.7% in March, but its year-to-date sales are up 3.6%. Infiniti posted a 0.2% improvement while Nissan sales were down 3% as only the Rogue and Sentra realized any significant sales increases. American Honda Motor Co. exhibited a 5.3% decrease in sales for the month, but its total deliveries in 2015 are up 2.6% as the automaker continues to focus on doing business almost exclusively with retail consumers. Acura sales declined by 5.8% while the Honda brand was down 5.2%. That stated, the future looks promising as the company announced at the New York Auto Show that an all-new Civic will arrive this fall, generating substantial buzz for the automaker. INCENTIVE SPENDING FLAT YEAR-OVER-YEAR Average of Total YoY Change $3,100 25% $3,000 Average Incentive Spending Total spending by Fiat Chrysler increased by 6.8%, with much of that going toward car models. Major brands, Jeep and Ram, raised incentives by a respective 35% and 16% per unit, which is particularly disconcerting for the latter brand considering how the Ram pickup lost sales. Incentives 20% $2,900 15% $2,800 $2,700 10% $2,600 5% $2,500 0% $2,400 $2,300 -5% Month Source: Autodata Just like in February, Buick was the only General Motors brand to see average incentives per unit increase year-over-year as the NADA Used Car Guide | 8400 Westpark Drive | McLean, VA 22102 | 800.544.6232 | nada.com/b2b © 2015 NADA Used Car Guide 9 Percent Change While spending consistently increased over the past two years, 2015 has seen incentives flatten out. Per Autodata, average spending of $2,726 per unit in March was just 0.4% higher than a year ago while incentives year-to-date are up a mere 0.06%. Guidelines | April 2015 [ NEW & USED MARKET TRENDS continued ] automaker cut its total spending by 12%. Meanwhile, Ford Motor Company reduced overall incentive spending by 18%, with both of its brands choosing to be more frugal in March. Intent on protecting profit margins, American Honda Motor Co. decreased its spending by over 19% overall, unlike its Japanese Big Three counterparts. On a per unit basis, the Honda brand spent almost 19% less on average year-over-year while Acura’s incentives rose by 7%. Nissan North America outsold Honda in March, but it spent twice as much in order to do so with the Nissan and Infiniti brands’ incentives per unit up a respective 17% and 19%. With regards to Toyota Motor Sales, the average spending per unit for the Toyota brand increased by 4.8% while Lexus spending fell by 3.2%. BMW and Mercedes-Benz exhibited strong sales growth, but some of that was due in part to incentives per unit increasing by over 23% and 16%, respectively. On the other hand, Audi sales trumped both its rivals despite spending dropping by over 4% per unit. Incredibly, the Land Rover brand grew sales by 54% while cutting incentives per unit by 4%. The result was an industry-low $573 for each vehicle sold. Subaru also continued its torrid sales pace with incentives of only $727 per unit, which is an 8.4% decrease from a year ago. INVENTORY FALLS BY 11 DAYS Days’ supply declined by 11 days month-over-month in March, which was 4 days fewer than last year. Days of Supply Subaru’s continued sales success reduced its inventory to an industry-low 17 days, which is an eight day reduction from the previous month. Meanwhile, South Korean brands saw their days of supply drop by 25, with Hyundai and Kia both finishing March with 50 days of supply. YoY Change 18 13 8 3 40 30 -2 20 -7 10 0 -12 Month Source: WardsAuto With regards to European makes, Jaguar Land Rover exhibited the second-lowest NADA Used Car Guide | 8400 Westpark Drive | McLean, VA 22102 | 800.544.6232 | nada.com/b2b © 2015 NADA Used Car Guide 10 Day Change General Motors’ 76 days of supply exceeded that of Fiat Chrysler and Ford Motor Company by two and 11 days, respectively. Toyota New Vehicle Days' Supply Motor Sales’ inventory level fell to 42 days while Days' Supply American Honda Motor Company’s 60 days of supply 90 80 was just above the industry average of 58 days. 70 Nissan North America settled between its Japanese 60 rivals and ended the month with 56 days of supply. 50 Guidelines | April 2015 [ NEW & USED MARKET TRENDS continued ] inventory level in the industry at 22 days, while BMW followed closely behind with a mere 28 days of supply. Audi and Daimler also find themselves with shrinking inventory as they had 41 and 45 days of supply, respectively, at month-end. NADA Used Car Guide | 8400 Westpark Drive | McLean, VA 22102 | 800.544.6232 | nada.com/b2b © 2015 NADA Used Car Guide 11 Guidelines | April 2015 [ NADA OFFICIAL USED CAR GUIDE® TRENDS ] Monthly Change in NADA Used Car Guide Value March 2015 v. April 2015 NADA Segment Compact Car Compact Utility Large Pickup Large SUV Luxury Compact Car Luxury Compact Utility Luxury Mid-Size Car Luxury Mid-Size Utility Mid-Size Car Mid-Size Utility Mid-Size Van Premium Luxury Large Car Subcompact Car 2008MY 0.3% -1.4% -2.0% -2.8% -1.5% -0.7% -3.2% -3.5% -0.1% -1.3% -1.1% -4.2% 2.1% 2009MY 0.8% -1.8% -1.6% -3.1% -1.3% -2.6% -2.8% -2.9% -0.7% -1.4% -1.0% -2.9% 0.3% 2010MY -0.3% -1.0% -3.1% -3.1% -1.9% -1.6% -2.4% -3.0% 0.5% -2.3% -3.7% -2.7% -0.7% 2011MY -0.7% -1.3% -2.9% -2.8% -4.2% -2.8% -2.8% -2.9% -0.6% -1.9% -2.6% -2.7% 0.9% 2012MY -0.3% -0.6% -2.8% -1.6% -2.2% -2.4% -1.0% -4.0% 1.0% -1.0% -0.9% -3.6% 0.7% 2013MY 0.5% -0.8% -1.2% -1.3% -4.2% -1.6% -2.0% -2.7% 0.2% -1.1% -2.9% -2.2% 1.4% 2014MY* -0.5% -0.9% -3.4% -0.7% -1.4% -1.1% -1.2% -2.3% -0.7% -1.4% -2.0% -1.2% 1.0% 2YR -2.3% 4.5% -1.3% 1.1% 3.1% -3.5% 6.5% 1.9% 2.8% 6.0% 1.4% -2.8% -2.7% 1YR -8.9% -3.4% 6.5% 3.0% -0.5% 3.1% 11.7% 4.6% -2.1% 4.0% 0.4% 11.2% -9.0% *Value movement can be influenced by newly valued vehicles. Annual Change in NADA Used Car Guide Value April, 2014 v. 2015 NADA Segment * Compact Car Compact Utility Large Pickup Large SUV Luxury Compact Car Luxury Compact Utility Luxury Mid-Size Car Luxury Mid-Size Utility Mid-Size Car Mid-Size Utility Mid-Size Van Premium Luxury Large Car Subcompact Car 7YR -1.4% -2.0% 14.7% 5.1% 8.1% -3.0% 3.4% -0.4% -5.1% 9.8% 18.6% -4.5% 5.0% 6YR -4.8% 1.9% 6.9% 1.8% 2.1% 9.8% -1.3% 4.4% -3.2% -3.8% 3.4% 8.1% -10.8% 5YR -1.0% 8.4% 5.0% -2.0% 0.0% 9.9% 5.2% 1.9% -6.7% 5.7% 1.8% 0.3% -6.6% 4YR -8.4% 4.4% 7.8% 4.8% -2.8% 6.6% 0.5% 2.4% -5.0% 8.8% 16.3% -7.5% -11.4% 3YR -6.2% 4.6% 6.4% -3.2% -5.9% 4.0% 0.3% 2.5% -6.5% -0.2% -10.0% -5.6% -12.9% *Value differences can be the result of changes in segment mix (i.e. models entering/leaving), model redesigns, and overall market performance. YTD Change in NADA Used Car Guide Value January — April 2015 NADA Segment Compact Car Compact Utility Large Pickup Large SUV Luxury Compact Car Luxury Compact Utility Luxury Mid-Size Car Luxury Mid-Size Utility Mid-Size Car Mid-Size Utility Mid-Size Van Premium Luxury Large Car Subcompact Car 2008MY 2.1% 1.2% 2.9% 1.9% -1.0% 2.2% -2.7% -1.8% 2.9% 1.4% 1.2% -3.2% 4.7% 2009MY 2.4% 1.7% 2.8% -1.9% -1.7% 1.3% -0.3% 0.2% 1.8% 2.0% 4.5% 0.6% 2.3% 2010MY 0.1% 2.8% 1.0% 1.1% 0.6% 1.3% -0.4% 0.7% 2.3% 2.0% -1.0% 3.0% -0.8% 2011MY 3.5% 2.2% 1.4% 0.8% -3.6% 1.4% -1.4% 0.4% 2.3% 3.2% 0.9% 2.4% 1.4% 2012MY 3.4% 5.7% 1.7% 5.3% 0.5% 2.2% 5.0% -0.2% 6.8% 5.7% 9.0% -0.9% 3.1% 2013MY 3.7% 6.5% 5.1% 6.1% -4.7% 2.6% 0.0% -0.4% 4.4% 5.1% 4.7% -1.2% 4.1% 2014MY* 3.5% 6.4% 0.0% 6.1% -3.4% 0.0% -1.9% -0.1% 3.6% 3.3% 2.9% -1.4% 4.0% *Value movement can be influenced by newly valued vehicles. NADA Used Car Guide | 8400 Westpark Drive | McLean, VA 22102 | 800.544.6232 | nada.com/b2b © 2015 NADA Used Car Guide 12 Guidelines | April 2015 AT NADA USED CAR GUIDE What’s New The NADA Appraisal Suite is launched! Tired of the back and forth? Turn your entire appraisal process into something your customers can truly understand. Select NADA Appraisal, starting at $99/month with an annual subscription, or upgrade to NADA AppraisalPRO to include additional market data from trusted industry sources. Both provide you with an official appraisal document, backed by NADA, which gives customers the confidence to sign. Learn more at nada.com/appraisal or call 866.974.6232. NADA Used Car Guide is launching a newly designed website! Coming soon in April, we have updated and reorganized our website to make your experience even better! Look forward to easier access to reports, whitepapers and blogs, as well as: Dedicated Insight & Analysis section with market overview videos, data and reporting Products and related information grouped by relevant business segments Data tables for additional insight On the Road Jonathan Banks, John Beckman and Steve Stafford will be attending the Auto Finance and Compliance Summit in San Diego, May 18 — 19. Jonathan Banks will speak May 20th on Key Trends in Risk Management at the CU Direct Lending and Marketing Conference, May 20 — 21. Be sure to say hello to Dog Ott as well. May 27 — 29, Steve Stafford, Larry Dixon and John Beckman will attend the 19th Annual Non-Prime Auto Financing Conference held in Plano, Texas. About NADA Used Car Guide Since 1933, NADA Used Car Guide has earned its reputation as the leading provider of vehicle valuation products, services and information to businesses throughout the United States and worldwide. NADA’s team collects and analyzes over one million combined automotive and truck wholesale and retail transactions per month. Its guidebooks, auction data, analysis and data solutions offer automotive/ truck, finance, insurance and government professionals, the timely information and reliable solutions they need to make better business decisions. Visit nada.com/b2b to learn more about solutions for your business and nada.com/usedcar to stay abreast of the latest used and new vehicle market trends. Financial Industry, Accounting, Legal, OEM Captive Steve Stafford 800.248.6232 x7275 [email protected] Credit Unions, Fleet, Lease, Rental Industry, Government Doug Ott 800.248.6232 x4710 [email protected] Automotive Dealers, Auctions, Insurance Jim Dodd 800.248.6232 x7115 [email protected] Director, Sales and Customer Service Dan Ruddy 800.248.6232 x4707 [email protected] Automotive OEMs Stu Zalud 800.248.6232 x4636 [email protected] Business Development Manager James Gibson 800.248.6232 x7136 [email protected] NADA Used Car Guide | 8400 Westpark Drive | McLean, VA 22102 | 800.544.6232 | nada.com/b2b © 2015 NADA Used Car Guide 13 Guidelines | April 2015 NADA CONSULTING SERVICES NADA’s market intelligence team leverages a database of nearly 200 million automotive transactions and more than 100 economic and automotive market-related series to describe the factors driving current trends to help industry stakeholders make more informed decisions. Analyzing data at both wholesale and retail levels, the team continuously provides content that is both useful and usable to the automotive industry, financial institutions, businesses and consumers. Complemented by NADA’s analytics team, which maintains and advances NADA’s internal forecasting models and develops customized forecasting solutions for automotive clients, the market intelligence team is responsible for publishing white papers, special reports and the Used Car & Truck Blog. Throughout every piece of content, the team strives to go beyond what is happening in the automotive industry to confidently answer why it is happening and how it will impact the market in the future. Senior Director, Vehicle Analysis & Analytics Jonathan Banks 800.248.6232 x4709 [email protected] Senior Manager, Market Intelligence Larry Dixon 800.248.6232 x4713 [email protected] Automotive Analyst David Paris 800.248.6232 x7044 [email protected] Automotive Analyst Joseph Choi 800.248.6232 x4706 [email protected] ADDITIONAL RESOURCES Guidelines White Papers Updated monthly with a robust data set from various industry sources and NADA’s own proprietary analytical tool, Guidelines provides the insight needed to make decisions in today’s market. NADA’s white papers and special reports aim to inform industry stakeholders on current and expected used vehicle price movement to better maximize today’s opportunities and manage tomorrow’s risk. NADA Perspective Used Car & Truck Blog Leveraging data from various industry sources and NADA’s analysts, NADA Perspective takes a deep dive into a range of industry trends to determine why they are happening and what to expect in the future. Written and managed by the Market Intelligence team, the Used Car & Truck Blog analyzes market data, lends insight into industry trends and highlights relevant events. Connect with NADA Read our Blog Follow Us on Twitter Find Us on Facebook Watch Us on YouTube nada.com/usedcar @NADAUsedCarGde Facebook.com/NADAUsedCarGuide Youtube.com/NADAUsedCarGuide Disclaimer: NADA Used Car Guide makes no representations about future performance or results based on the data and the contents available in this report (“Guidelines”). Guidelines is provided for informational purposes only and is provided AS IS without warranty or guarantee of any kind. By accessing Guidelines via email or the NADA website, you agree not to reprint, reproduce, or distribute Guidelines without the express written permission of NADA Used Car Guide. NADA Used Car Guide | 8400 Westpark Drive | McLean, VA 22102 | 800.544.6232 | nada.com/b2b © 2015 NADA Used Car Guide 14


© Copyright 2026