
Texture Synthesis of Contrasting Natural Patterns
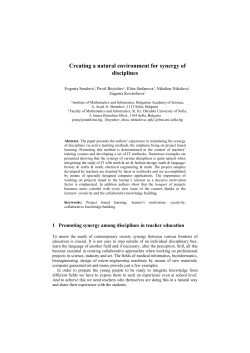
Texture Synthesis of Contrasting Natural Patterns
Fabiane Queiroz
Instituto de Computação - UFAL
[email protected]
Marcelo Walter
Instituto de Informática - UFRGS
[email protected]
Fig. 1. Sample of regular patterns generated with our approach: (a) Belted cow pattern, (b) zebra pattern, (c) goat patterns and (d) Panamanian golden frog
pattern. The black and white images on the top row illustrate textures used to control positioning of effects, explained in the paper.
Abstract—The seamless integration of the shape and visual
attributes of virtual objects is still one of the greatest challenges in
Computer Graphics. For some natural objects, such as patterned
animals, shape and appearance are mutually connected and
therefore the individual treatment of these two aspects difficult
the whole process and limits the visual results. One approach to
solve this problem is to create shape and appearance together,
thus generating so-called intelligent textures, since they can adapt
to the surface of the object according to geometric information.
The Clonal Mosaic model presented an approach for intelligent
texturing of fur patterns seen in some mammals, particularly the
big cats and giraffe. This paper extends this model to account
for biologically plausible contrasting fur patterns, mostly seen
in black and white, either regular – as seen in zebras, or
irregular – as seen in cows and horses, among other animals.
The main contributions of this work are the addition of a
neural crest model, local control for parameters, and also vector
field definition on the object’s surface for simulation control.
The results synthesized for various mammals with contrasting
patterns such as cows, horses, and zebras, and other contrasting
patterns found in frogs, for example, confirm the advantages of
an integrated approach such as the one provided by the extended
Clonal Mosaic procedural model.
Keywords-Texture Synthesis; Procedural Models; Natural Patterns; Animal Coat Color
I. I NTRODUCTION
The natural world surrounds us. It is both very complex
and familiar. Computer graphics research has always drawn
inspiration and looked for challenges from the natural world.
A pioneer panel in Siggraph 1983 [2] already established the
specific demanding needs of this field, such as the intrinsic
complexity of the phenomena and the need to build solutions
for time variant phenomena. In spite of all advances we are still
struggling with independent solutions that address a particular
issue and do not consider the object as a whole. Blinn [3]
already recognized in 1998 systems integration as one of the
top 10 problems in computer graphics. On the one hand,
texture mapping is the ubiquitous solution to add visual variety
for synthetic objects. It is a divide-and-conquer solution since
we address shape and visual separately, and later on have to
integrate the two.
On the other hand, nature does not create pattern and shape
separately. It is therefore reasonable to consider solutions that
are inspired by nature itself. Procedural models for textures
simulated directly on the mesh, an idea pioneered by Turk
in 1991 [16], conceptually address the problem from an integrated point-of-view. Visual appearance is simulated directly
on the mesh, guided by geometric information. The Clonal
Mosaic model [20] extended Turk’s ideas since the patterns
can follow dynamic changes on the object, such as an animal
growing.
Contributions - In this paper we extend the Clonal Mosaic
model introducing a new biological element: the neural crest.
The cells responsible for coloring the fur travel over the
animal’s body from the neural crest. This dynamic process is
responsible for the many variations seen in many fur patterns.
Our paper brings a procedural model closer to the real biology
and therefore is able to synthesize a wide range of realisticallylooking patterns. In Fig. 1 we illustrate the power of expression
of the model, with a few results for regular patterns.
II. R ELATED W ORK
Research addressing specifically the problem of integration
between shape and the visual attributes of virtual objects
is not common. Not that this is an issue ignored by the
research community. However, most studies deal with this
issue in an indirect way, tackling problems mainly related to
texture mapping. We review related work according to four
categories: direct painting, texture mapping techniques, direct
texture synthesis from samples and texturing of 3D objects
using procedural models.
Direct Painting - As early as 1990, Hanrahan and Haeberli
[10] introduced a nice interaction metaphor of direct painting
on the object’s surface. Later on [11] and [6], followed a
similar approach of paintings made directly on the surface.
The main difficulty with these techniques is the need of artistic
ability from the user in order to obtain good results.
Texture Mapping - More recent research tries to ease
the task of computing a good mapping. Zhou et al. [25]
presented an alternative way to integrate the shape of the object
with the textures. Texture Montage uses a small collection
of photographs of the real object which are then combined
and mapped on the object’s surface. The correct mapping is
achieved with the user specifying points of correspondence
between the texture atlas and the object. Tzur et al. [18] also
followed the same idea from a collection of photographs. In
more recent work, Ran Gal et al [8] presents a new way
to generate a seamless texture over a surface model from
photographs taken with an ordinary handheld camera. The
success of these techniques lies more in the way many previous
studies were combined in an innovative way, however, the user
has a difficult task of specifying matches matches over the 3D
surface. Also, if the application demands many individuals
of the same type, finding a good set of images might be a
challenge.
Texture Synthesis - The research on texture synthesis from
samples advanced from pure 2D results to 3D direct synthesis
on the object’s surface. There is a range of studies that discuss
different ways to accomplish the synthesis of textures in an
integrated manner from a single sample. Among the main work
in this area are [15], [17], [22] and [24]. Sylvain et al. [13]
presents a texture synthesis scheme based on neighborhood
matching, with contributions in two areas: parallelism and
user control. Solid textures are an efficient instrument to
compactly represent both the external and internal appearance
of 3D objects. Pietroni and colleagues [14] present different
algorithms for synthesis and representation of solid textures.
Although solid texturing techniques show visually acceptable
results, few addressed natural, organic patterns and besides,
the variation on the final results still depends upon the initial
sample.
Procedural Models for Texture Synthesis - In 1991,
Turk [16] and Witkin and Kass [23] introduced the idea of
generating textures directly onto the surface of the object being
textured. They proposed a way to generate procedural textures
on arbitrary surfaces with techniques of Reaction-Diffusion
(RD) for animals coat patterns. This idea was seminal in the
area of direct synthesis of textures. The visual results reached a
satisfactory level of realism, but without displaying the natural
variation characteristic of these animals. Turk, in his work,
recognized the need for mechanisms of pattern formation
driven by geometric information, but did not implement the
idea fully. In a more recent work, Kider et al. [12] also used
Reaction-Diffusion, but applied with success in an integrated
way to model complex biological processes, such as growth
of fungus and bacteria, colony formation, and soft rot in fruits
and vegetables.
Fowler et al. [7] approached the modeling of seashells by
discretizing the growing edge of a parametric model of a shell
into polylines. Each segment of the polyline is treated as a cell
for the one-dimensional Reaction-Diffusion simulation. The
geometric and visual attributes of shells lend themselves to
integration since both shape and texture can be unequivocally
expressed as a function of time. Their exceptional visual
results suggest that the use of an integrated approach is in
some cases not only useful but necessary.
Walter et al. [20] developed a biologically plausible procedural model [21] to extend to the Animal Kingdom the main
ideas present in Fowler’s work. The model proposes that the
typical spotted an striped patterns occurring in several species
of mammals reflect a spatial arrangement - a mosaic - of
epithelial cell that are derived from a single progenitor - they
are clones. Hence the name Clonal Mosaic model (CM model).
Attractive animal patterns, such as seen in the big cats and the
giraffe are formed by simulating cell interactions. The final
pattern could be driven by changes of the surface shape based
on actual growth data of the animal [19]. The model presented
satisfactory visual results without the usual problems of texture
mapping. However, it was not able to simulate a large range
of contrasting patterns and anisotropic patterns. Our work take
this model as starting point.
III. B IOLOGICAL BACKGROUND
A. The Neural Crest
Since the pattern formation occurs at the embryonic stage,
for a better understanding of the processes required for the
formation of contrasting patterns, we briefly discuss the concept of neural crest and its influence on the definition of
animal coat color. Neural crest is the name given to a group
of embryonic cells, derived from the lining of the neural tube,
which originates other types of adult cells such as neurons
and glial cells, osteocytes, melanocytes and smooth muscle
cells [9]. This crest is a component of the ectoderm and is
located between the neural tube and epidermis of the embryo.
These cells have the property to migrate from their origin to a
specific location of the embryo after the recognition of signs
for migration. These signals guide the cells on specific routes
until they reach their final destination. The route of the cells
that differentiate into melanocytes is located just below the
epidermis of the embryo, as illustrated in Fig. 2.
Melanocytes are cells responsible for producing melanin.
Melanins are polymers synthesized from thyrosine. For mam-
mals there are two types of melanin: eumelanin, with colour
ranging from brown to black; and phaeomelanin with colour
ranging from pale yellow to red. Basically, the colour of the
hair is determined by the amount and nature of the produced
melanin. The migration process begins in the dorsal region of
the animal, where is located the neural crest, and terminates in
the ventral region. These specified directions are called lateral
dorsoventral axis.
Fig. 3. (a) Irregular pattern caused by white spotting mutations. (b) Regular
pattern caused by switching color mutations.
Fig. 2.
Neural crest model
Caro [5] investigated and compared contrasting color for
approximately 5000 species of land mammals. This impressive
number of animals is itself a challenge for computer graphics
current patterning techniques. According to him, contrasting
black and white colors are a peculiar sort of animal coloration
since they have a very strong contrast when compared with
other animal colorations.
According to Barsh [1], for some mammals, during the
migration process in the embryonic stage, the death of some
of the melanocytes causes the absence of pigment producing
irregular white patches on the fur of the adult animal. In more
extreme cases some animals may have a completely white
coat. This mutation, known as white spotting, is easily found
in several animals, such as cows and horses as illustrated in
Fig. 3(a). The developmental history of pigment cells also
helps to explain why white spots are specially common on
the ventral body surface, and why individual spots never cross
the ventral midline. Also according to Barsh, in some cases, as
for example in raccoons and zebras, regular patterns of white
areas are not caused by bad formed melanocytes, but by genes
that affect the pigment by a type of switching. Fig. 3(b) shows
some examples of this type of regular pattern. In this work we
present how we extended the CM model to account for this
behavior of pigment cells.
background (B) and middleground (M) cells, where each type
is responsible for the synthesis of a single color appearance
of the entire pattern.
The synthesis of a given pattern is executed in two steps:
initialization and simulation. In the initialization step, a given
number of cells is randomly placed on the domain. The type
of a cell can be specified both by the user or randomly by the
system. In this step, the probability of F, B and M cells are
used to define the amounts of each one. Once the initialization
is done, the simulation through time starts. In the simulation
step, any pattern is defined as a result of two main cell actions:
cell division and cell repulsion. Division rates control the
frequency of cell division into two new cells. The progenies
inherit all attributes of their parents. Adhesion values between
pair of cell types control the amount of repulsion between any
two types of cell.
A relaxation process allows the cells to achieve a somewhat regular stable spatial configuration. In order to achieve
this configuration, each cell moves as far away from all its
neighbors as possible. The total repulsive force received by
a single cell Pc is computed by summing all repulsive forces
from its neighboring cells Pi . For a total area A and m number
of cells, the neighboring cells p
are those which reside within a
given repulsive radius r = wr A/m from Pc . The repulsive
weight wr acts as the scaling factor of the repulsive radius.
For each cell Pc , the individual displacements forces fi due
Dic
(r −
to the neighboring cells Pi are calculated as fi = |D
ic |
|Dic |)(1 − αPic ) where Dic = Pc − Pi and αPic are userdefined adhesion values, specific for the kind of cells involved.
One step of the relaxation process will move cell Pc to its new
position Pc0 defined by
IV. T ECHNICAL BACKGROUND
A. Clonal Mosaic Model
Since our starting point is the CM model, we will briefly
review it here. More detailed information can be found in
the original papers, particularly [20]. The model defined a
procedure to generate mammalian coat patterns on 2D and
arbitrary 3D surfaces. Cell division, cell mutation and cell
repulsion are the key elements to obtain these patterns. A
CM cell is represented as a point. There are three types of
cells that can be represented in the system: foreground (F),
Pc0 = Pc +
n
X
wa O(1 − wa )wd fi
(1)
i=1
where n is the number of neighbors which fall inside the area
defined by the repulsive radius r, wa controls the strength
of anisotropy, O is the displacement vector projected in the
anisotropic direction and wd is a weighting factor for the
displacements.
In summary, the simulation step is defined by a finite
sequence of actions involving basically a set of cell divisions
followed by a process of global relaxation performed in all
cells of the object’s surface. Different patterns are computed
with appropriate parameter values. In the current CM model
these parameters have a global reach influencing the behavior
of all cells over the surface. The main parameters are rates
of cell division (Mitosis [type1]), adhesion between two cell
types (α[type1][type2]), repulsive radius (wr ), and number
of relaxation events between two cells division process (ρ).
The notations used in the symbolic representation of these
parameters will be used throughout this work.
After achieving a desirable spatial configuration, the Polyhedral Voronoi Diagram of these points turn them into a
tessellation of the surface and finally, shading of the surface
is done by filling each of the Voronoi polygons with the
cell color. The CM model also implements a technique for
transferring data growth for polygonal models of animals. For
each section of the body that will grow and, generally, be
transformed independently, a cylindrical coordinate system is
attached to it (see Fig. 4). The visual attributes are defined
directly on the surface of the object and, the CM model takes
into account the dynamic change of shape undergone by the
object because of growth or other reasons.
Fig. 4. Cylindrical system covering an object. Blue regions represent areas
of intersection between more than one cylinder (from [19]).
V. S YNTHESIS OF C ONTRASTING C OAT PATTERNS
In this section we present the main extensions applied to
the CM model previously described. These extensions allowed
improved results in the contrasting coat pattern simulation.
A. The Neural Crest Model
In the particular case of creation of the neural crest model
over an arbitrary surface, we used a combination of the
cylindrical structure and arbitrary images. We will use these
Fig. 5. Neural crest model simulation. The cylinder surface represents the
dorsoventral region.
images to indirect control simulation parameters. Images provide enough flexibility to control this feature. Since the neural
crest has a specific location on the animal’s body, we will
restrict the distribution of the initial set of cells according to
the desired location. A binary image (Fig. 5(b)) is mapped over
the cylinder that surrounds the surface region that represents
the dorsoventral region. The idea is that we will only have
foreground cells in the white areas and everywhere else we
want background cells. We create the cells according to their
original probabilities (Fig. 5(a)) but cells that are located in
the white region of the image remain as originally defined,
whereas the F cells that are located in the black region of the
image have their type changed from F to B type to obtain the
neural crest model (see Fig. 5(c)).
B. Anisotropy in 3D Surfaces
After the cells are distributed according to the neural crest
model, we have to define the overall pattern orientation on
the surface. Cells move not only according to the dorsoventral
direction due to the neural crest, but also in arbitrary directions
due to embryo development, as illustrated in Fig. 6 (a).
Fig. 6. (a) Blue vectors indicate the many directions in the striped zebra
pattern. (b) Vector field on a 3D surface. The red vectors are the result of
interpolation with a RBF function given the control vectors in green. For the
control vectors, the blue point is fixed in the centroid of the triangular face,
and the red point indicates the direction defined by the user.
The original CM model provides anisotropy in only one
direction determined by a user-defined displacement vector
projected in the anisotropic direction. In our work, the desired
orientation of the pattern is specified over the mesh as a vector
field in which the cells can be oriented in different directions
in different parts of the surface. Specifically, for each mesh
face is assigned a vector ~v . The direction of ~v defines pattern
direction and its magnitude, controlled by the weight wa ,
defines how fast the cells move over the surface. In order to
generate the vector field, the user specifies control vectors at a
few faces. The vector field is generated by RBF interpolation
using an inverse
√ multiquadratic radial basis functions defined
by θ(r) = 1/ r2 + c2 in which the radius c is defined as 0.5.
The distances are measured on planar projections of the faces.
Fig. 6 (b) shows a generated vector field in a 3D surface. The
green vectors are the user control vectors, and the red vectors
were generated as described above.
Since anisotropic information of the pattern is defined using
a vector field instead of a single global vector, the extended
CM model replaces the vector which defined globally the
anisotropy direction by the local vectors computed from the
interpolation scheme presented. Therefore, the new position of
a cell in the system previously defined by the Equation 1 is
now defined as:
Pc0 = Pc +
n
X
~j (1 − wa )wd fi
wa V
(2)
i=1
~j is the 2D projection of the vector ~v within the face
where V
j where the cell resides at the time of the relaxation process.
If the cell moves to another face in the relaxation process,
it will be displaced according to the vector Vj , present in
this face, and thus successively. Therefore, the vector field
defined over the surface could move a given cell into multiple
specific directions and not only in a single global direction.
This approach allow us great flexibility in defining cell’s
movements over the surface, obtaining results visually more
similar to the real patterns found in nature. Fig. 7 shows the
effect of the vector field in the simulation of the dorsoventral
cell migration of the neural crest model.
Fig. 8.
System Pipeline.
defined the initial probability of types as a local parameter,
using images attached to the cylinders as illustrated in Fig. 9.
For the dorsal region, the surface area that is under the cylinder
that surrounds this region has their F cells initially distributed
with 60% probability. The F cells distributed in the facial
region are distributed with 100% of probability in order to
synthesize a pattern with a more defined black spot.
Fig. 7. Cells displaced by the vector field in the cell migration simulation.
Left: zoom with details of vector field. Right: time 0 of simulation - initial
distribution of cells with F cells located in the neural crest region; times 5,
10 and 15 of the simulation.
Fig. 8 shows a schematic representation of the whole
process and the changes made in both steps initialization and
simulation in order to obtain results for the contrasting coat
color animal patterns. Basically, the main extensions made
in the original model are the definition of the neural crest
model in the initialization step, the cell migration process in
the simulation step, and a new concept of local parameters
definition in both steps.
C. Synthesis of Irregular Patterns - The Holstein Cow Pattern
For the synthesis of irregular patterns, we will use as a
case study the particular race of bovines known as Holstein
and illustrated in Fig. 3(a) left. Since the Holstein pattern is
created by the white spotting mutation, it presents a random
and irregular appearance. However, despite being a random
pattern, it is also subjected to the neural crest model, since,
for instance, there are no black areas in the ventral region.
Another peculiar characteristic of this race is a small white
triangular area in the center of the head. In order to model
this feature we used local control of the parameters.
The neural crest model is defined in the initialization step.
In order to create the small white area in the central head, we
Fig. 9. Random distribution of the cells over the surface forming the neural
crest model and distribution of cells in the head. In the top we show the
images used to control the initial distribution of cells.
In the simulation step, we used a vector field with 7196
vectors from 11 user-defined control vectors. Table II presents
the parameters used to obtain the pattern shown in the Fig. 10.
In this table, the parameter mitosis F , for example, indicates
that there is a process of cell division at each 15 days of the
total 40 days of simulation. The initial number of cells was
20000 cells, in which 11798 were B cells and 7202 cells were
F cells.
D. Synthesis of Regular Patterns - The Zebra Pattern
We will consider as a case study for the simulation of
regular patterns the zebra stripes. Two real examples of this
pattern are illustrated in Fig. 3(b) and Fig. 6.
Details found in the zebra striped pattern include different
spacing, thickness, and orientations of the stripes over the
body. These features justify the use of local parameters using
the cylindrical system attached to the surface as a guide
that defines different values of parameters for different body
regions. In the real zebra, the stripes on the legs are thinner
Fig. 10. Holstein pattern timeline generated from the neural crest model
in a 3D surface. From left to right and top to bottom: simulation time is
respectively 0, 5, 20, and 30 days (one day of simulation is equal the total
time between two cells division process).
than stripes on the rest of the body. In order to model this
feature, for the legs we initially defined a larger number of
cells than the number on the regions relative to the rest of
the body. Fig. 11 (a) shows one example of local initial
distribution of cells in which we can see a larger number of
cells distributed in the region of the legs. Similarly, in the
regions where the stripes are thinner, we can observe that these
stripes have also a smaller spacing from each other. Therefore
we defined for these regions a lower value for the repulsive
radius (wr ). Fig. 11 (b) shows the use of local repulsive radius
values in the surface.
Since the surface area of the legs is smaller than the surface
area in the dorsoventral region, and the total time of the
simulation is the same, we also defined the anisotropic weight
wa as a local parameter. Therefore, both the dorsoventral the
legs stripes reach their destinations over the surface almost
simultaneously. For the specific case of the zebra stripes, the
displacement weight value wa used in the legs was set five
times less than the weight used in the dorsoventral region.
Fig. 12 illustrates the final result for the zebra striped pattern
using the parameters defined in Table II. For this simulation,
the initial number of cells was 95480 cells, with 6361 F cells
and 89119 B cells.
Since the pattern of the facial region of the zebra is very
complex, due to the different changes in direction of the stripes
in a relatively small area, RBF functions do not have enough
representation power to generate a plausible vector field on this
particular surface area. Therefore, our results do not consider
this part of the animal.
VI. R ESULTS
In all results, the synthesized texture is generated procedurally with the extended CM model, using concepts of
neural crest and local parameters. Fig. 13 presents results of
some irregular natural patterns and Fig. 1 for regular patterns.
In Table I we make an analysis of the computational costs
required in the process of simulation of each displayed result.
These results were produced on an Apple MacBook with an
Fig. 11. (a) From left to right: the models have 50000 and 95480 cells
initially distributed. On the far left the binary images for the neural crest
region and the legs regions. The surface area relative to the legs contains
initially three times more cells than the rest of the surface. (b) First day of
simulation of zebra striped pattern: wr = 6.0 for the surface area relative to
the dorsal region and wr = 1.0 for the areas relative to the region of the
legs.
Fig. 12. Zebra pattern timeline generated with the neural crest model. From
left to right and top to bottom simulation times are respectively 5,10,15, 25,
30 and 35 days of CM simulation.
Intel Core 2 Duo 2.13 GHz processor and 2 GB of RAM.
Table II show the parameters used to obtain these patterns.
For all results we present a real example of the pattern, the
binary image used to define the neural crest model, and the
final result.
In Fig. 14, all results for the Holstein cows were obtained
from the same parameters defined in Table II. The difference
between the patterns is the value used as initial seed of the
random distribution of the cells, that is, in each case the cells
were initially distributed in different positions, which gives
us the power to obtain various representations of the same
pattern, one of the advantages of using a procedural system
as the CM system extended with the neural crest model.
As already mentioned, pattern generation made directly on
the surface can adapt to the changes that it undergoes. In the
case of the synthesis of coat pattern in mammals, changes
in the geometry are caused by growth of the animal. Fig. 15
Fig. 13. Sample of possible patterns with our approach: (a) Hostein cow pattern, (b) Randall cow pattern, (c) and (d) Overo horses. The areas of neural
crest highlighted in red were created from the binary image highlighted in red whereas the blue ones were created from the binary image highlighted in blue.
Pattern
Overo Horses 1
and 2
Randall cow
Holstein cow
Frog
Goat
Belted cow
Zebra
Number
of
Faces
5090
Total ρ
7196
7196
13332
4686
7196
13566
Cost (min)
200 (10 days)
Initial
number
of cells
20000
600
800
600
800
900
720
20000
20000
20000
20000
20000
95480
3
4
7
16
20
38
(30
(40
(30
(40
(50
(40
days)
days)
days)
days)
days)
days)
3
TABLE I
C OMPUTATIONAL COSTS .
Fig. 14.
cattle.
Example of possible variations of individual patterns for Holstein
shows a cow growing example. The growth information is
transferred to the mesh with the help of the cylindrical
structure. This way, the pattern follows in accordance with
the changes suffered by the surface.
Walter [21] estimated the average time in which the pattern
begins for giraffes. For a gestation of 457 days, it was
estimated that the pattern begins around the 36th day of
gestation, or 7.8% of the 457 days of gestation. This pattern
became visible at approximately the 100th day of gestation. If
we use the same idea for cattle, considering that pregnancy in
cattle lasts about 285 days, the pattern will begin to develop
at the 22th day of gestation and will be established in the
62th day of gestation - equivalent to the 100th day of the
pattern of giraffes. Therefore, we would have a window of
40 days defined in the interval [22, 62] for developing the
pattern, ie, the cells will undergo the process of successive
division, relaxation and the migration process from the dorsal
to the ventral area. Once past this gestation window, the
pattern will only grow following the surface without any cell
activity. Unfortunately, the deformation suffered by the model
is not biologically based, due to lack of measurements of fetal
bovines in the literature. To calculate this growth we did a
linear reduction of the average measures of an adult animal.
The measures of cattle in adulthood (36 months after birth)
was taken from Brody [4].
Fig. 15. Holstein cow growing. Top row: pattern being defined within the
specified window (from 22th to 62th day of gestation). Bottow row: cow at
birth (285 days of gestation) and the same adult cow (36 months after birth).
A. Discussion
Although the results can still be improved, for instance,
in case of zebras, there are two key points that justify the
use of results introduced here. First, pattern generation is not
only visually plausible but also biologically grounded. Second,
we can potentially generate an infinite number of different
individuals of a given pattern without need to synthesize
one by one, changing only the seed for the random initial
distribution of cells. Moreover, any pattern synthesized with
the CM model always takes into consideration the shape
changes caused by a dynamic surface such as an animal
growing.
VII. C ONCLUSIONS
In this work we have introduced an extension to the CM
model for the synthesis of procedural textures that represent
contrasting animal coat color patterns expressed regularly
or irregularly. Since contrasting patterns result mostly from
Pattern
Holstein cow
Belted cow
ρ
20
18
Randall cow
Overo horse 1
Overo horse 2
Goat
Frog
Zebra
20
20
20
20
20
18
wr
10.0
2.0 (Head) 6.0
(Others)
6.0
10.0
6.0
2.0
2.0
1.0 (Legs) 3.0
(Others)
time
40
50
wd
0.067
0.067
mitosis F
15
10
mitosis B
60
60
α FF
0.8
0.9
α BB
0.5
0.9
30
10
10
40
30
40
0.067
0.067
0.067
0.067
0.067
0.067
15
10
10
10
10
10
60
50
50
60
60
60
0.9
0.5
0.9
0.9
0.9
0.9
0.5
0.9
0.5
0.9
0.9
0.5
Type probability
100% (F) 0% (B) (Head) 60% (F) 0% (B) (Others)
100% (F) 0% (B)
70% (F) 30%
100% (F) 0%
100% (F) 0%
100% (F) 0%
100% (F) 0%
100% (F) 0%
(B)
(B)
(B)
(B)
(B)
(B)
TABLE II
PARAMETERS FOR IRREGULAR AND REGULAR PATTERNS .
genetic mutations that cause the death of pigment cells during
their lateral dorsoventral migration in the embryonic stage, we
developed a neural crest model and cell migration to simulate
results more biologically plausible.
Since coat patterns have local variations over the animal’s
body, it also became necessary to control the pattern development using a local approach. This new local approach defines
the parameters using the cylindrical structure overlapped on
the various surface areas of the animal’s body with the help
of images. In order to perform cell migration in the simulation
process, we used RBF functions in order to generate, via
interpolation, a vector field from few control vectors defined
by the user. The use of local vector fields, rather than global,
was advantageous because we can specify many routes of cell
migration over the 3D surface in several directions.
The extensions made in this work showed visual plausible
results in the generation of irregular patterns (caused by the
white spotting mutation) found in some breeds of cattle and
horses, and also regular patterns found in some breeds of
cattle, zebras, and goats. In general we can conclude that these
extensions allowed the CM model a significant increase in
patterns that can be procedurally synthesized, including the
synthesis of contrasting patterns in the original model.
There is a lot of future work if computer graphics wants to
model and render even a small fraction of the 5000 species
of black&white land animals as reported by Caro [5]. We
believe that the extended CM model is a direction towards
this ambitious goal. We are planning to transfer the relaxation
process to a GPU module to reduce the computational cost
of the entire process, and also want to study ways even more
efficient than the use of RBF functions to perform anisotropy
of the cells. Thus, patterns that require a high amount of
anisotropic directions may be better expressed.
ACKNOWLEDGMENTS
Work partially supported by CNPq through grants
552856/2009 and 478050/2010.
R EFERENCES
[1] G. S. Barsh. Coat color mutations, animals. AcademicPress,, 2001.
[2] James Blinn, Julian Gomez, Nelson Max, and William Reeves. The
simulation of natural phenomena (panel session). SIGGRAPH Comput.
Graph., 17:137–139, July 1983.
[3] Jim Blinn. Jim blinn’s corner: Ten more unsolved problems in computer
graphics. IEEE Computer Graphics & Applications, 18(5):86–89,
September/October 1998.
[4] S. Brody. Bioenergetics and growth. Hafner, New York, 1945.
[5] Tim Caro. Contrasting coloration in terrestrial mammals. Phil. Trans.
R. Soc. B., 364:537548, 2009.
[6] N. A. Carr and J. C. Hart. Painting detail. In SIGGRAPH, pages 842–
849, 2004.
[7] Deborah R. Fowler, Hans Meinhardt, and Przemyslaw Prusinkiewicz.
Modeling seashells. In Proceedings of the 19th annual conference on
Computer graphics and interactive techniques, SIGGRAPH ’92, pages
379–387, 1992.
[8] Ran Gal, Yonatan Wexler, Eyal Ofek, Hugues Hoppe, and Daniel CohenOr. Seamless montage for texturing models. Comput. Graph. Forum,
pages 479–486, 2010.
[9] S.F. Gilbert. Developmental Biology. Sinauer Associates, Inc., 1994.
[10] Pat Hanrahan and Paul Haeberli. Direct wysiwyg painting and texturing
on 3d shapes. In Proceedings of the 17th annual conference on Computer
graphics and interactive techniques, SIGGRAPH ’90, pages 215–223,
1990.
[11] Takeo Igarashi and Dennis Cosgrove. Adaptive unwrapping for interactive texture painting. In Proceedings of the 2001 symposium on
Interactive 3D graphics, I3D ’01, pages 209–216, 2001.
[12] Joseph T. Kider Jr., Samantha Raja, and Norman I. Badler. Fruit
senescence and decay simulation. Comput. Graph. Forum, 30(2):257–
266, 2011.
[13] Sylvain Lefebvre and Hugues Hoppe. Parallel controllable texture
synthesis. ACM Trans. Graph., 24(3):777–786, 2005.
[14] Nico Pietroni, Paolo Cignoni, Miguel Otaduy, and Roberto Scopigno.
Solid-texture synthesis: A survey. IEEE Computer Graphics and
Applications, 30:74–89, 2010.
[15] Emil Praun, Adam Finkelstein, and Hugues Hoppe. Lapped textures. In
Proceedings of the 27th annual conference on Computer graphics and
interactive techniques, pages 465–470, 2000.
[16] Greg Turk. Generating textures on arbitrary surfaces using reactiondiffusion. In Proceedings of the 18th annual conference on Computer
graphics and interactive techniques, SIGGRAPH ’91, pages 289–298,
1991.
[17] Greg Turk. Texture synthesis on surfaces. In Proceedings of the 28th
annual conference on Computer graphics and interactive techniques,
SIGGRAPH ’01, pages 347–354, 2001.
[18] Yochay Tzur and Ayellet Tal. Flexistickers: photogrammetric texture
mapping using casual images. In ACM SIGGRAPH 2009 papers, pages
45:1–45:10, New York, NY, USA, 2009.
[19] Marcelo Walter and Alain Fournier. Growing and animating polygonal
models of animals. Computer Graphics Forum, 16(3):151–158, August
1997.
[20] Marcelo Walter, Alain Fournier, and Daniel Menevaux. Integrating
shape and pattern in mammalian models. In Proceedings of the 28th
annual conference on Computer graphics and interactive techniques,
SIGGRAPH ’01, pages 317–326, 2001.
[21] Marcelo Walter, Alain Fournier, and Mark Reimers. Clonal mosaic
model for the synthesis of mammalian coat patterns. In Proceedings of
Graphics Interface, pages 82–91, Vancouver, BC, Canada, 18–20 1998.
[22] Li-Yi Wei and Marc Levoy. Texture synthesis over arbitrary manifold
surfaces. In Proceedings of the 28th annual conference on Computer
graphics and interactive techniques, pages 355–360, 2001.
[23] Andrew Witkin and Michael Kass. Reaction-diffusion textures. In
Computer Graphics, pages 299–308, 1991.
[24] Jingdan Zhang, Kun Zhou, Luiz Velho, Baining Guo, and Heung-Yeung
Shum. Synthesis of progressively variant textures on arbitrary surfaces.
ACM Transactions on Graphics, 22(3):295–302, July 2003.
[25] Kun Zhou, Xi Wang, Yiying Tong, Mathieu Desbrun, Baining Guo,
and Heung-Yeung Shum. Texturemontage. In ACM SIGGRAPH 2005
Papers, SIGGRAPH ’05, pages 1148–1155, 2005.


© Copyright 2026