
TLR2 and TLR4 expression on CD14++ and CD14+ monocyte
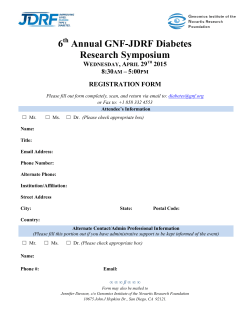
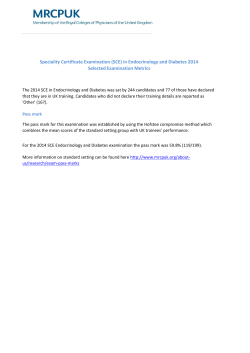
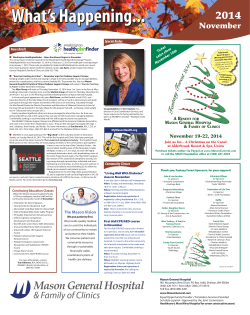
Biomed Pap Med Fac Univ Palacky Olomouc Czech Repub. 2015; 159:XX.
TLR2 and TLR4 expression on CD14++ and CD14+ monocyte subtypes
in adult-onset autoimmune diabetes
Pavlina Cejkovaa,b, Iva Nemeckovaa, Jan Brozc, Marie Cernab
Background. Peripheral blood monocytes are key effectors of innate immunity. Dysfunction, changes in their counts
or altered expression of cytokines and pattern-recognition receptors on monocytes may contribute to the development of the autoimmune type of diabetes mellitus (AD).
Aims. We aimed to analyze the counts and proportions of the two main subtypes of monocyte cells, CD14++ and CD14+,
and to look for potential changes in the expression of toll-like receptors 2 (TLR2) and 4 (TLR4) as well as cytokine prolactin (PRL) in adult-onset AD, including diabetes mellitus type 1 (T1DM) and latent autoimmune diabetes in adults (LADA).
Methods. We examined 21 T1DM patients, 9 patients with LADA, 16 control patients with type 2 diabetes mellitus
(T2DM) and 24 healthy individuals. All diabetic patients were diagnosed after the age of 18 years. Expression at the
mRNA level was determined by quantitative PCR. Flow cytometry was used to ascertain membrane expression and
cell counts.
Results. T1DM patients had fewer CD14++ (P < 0.01) and CD14+ (P < 0.0001) monocytes whereas T2DM subjects showed
decreased counts of CD14+ monocytes compared to healthy controls (P < 0.001). TLR2 protein expression was significantly increased in T1DM CD14+ monocytes compared to healthy controls (P < 0.05), while TLR4 expression in T1DM
CD14++ cells was significantly lower (P < 0.0001). There was no significant difference between the groups in terms of
PRL mRNA expression in monocytes.
Conclusions. The observed changes in the proportions of both immune cell types and in the expression of functional
pattern-recognition receptors on monocytes in the subjects examined may arise as a consequence of chronic inflammation that accompanies long-term diabetes.
Keywords: adult-onset autoimmune diabetes, CD14 monocyte, inflammation, prolactin, toll-like receptor
Received: December 22, 2014; Accepted with revision: April 1, 2015; Available online: May 4, 2015
http://dx.doi.org/10.5507/bp.2015.016
Department of Anthropology and Human Genetics, Faculty of Science, Charles University in Prague, Czech Republic
Department of General Biology and Genetics, Third Faculty of Medicine, Charles University in Prague
c nd
2 Department of Internal Medicine, Diabetes Center, Third Faculty of Medicine, Charles University in Prague
Corresponding author: Pavlina Dankova (Cejkova), e-mail: [email protected]
a
b
INTRODUCTION
tory conditions (e.g. systemic juvenile idiopathic arthritis)
(ref.7), have not confirm any differences in the absolute
numbers or proportions of monocyte subpopulations.
Still, a wealth of gene and protein expression data points
to increased monocytic activity in type 1 diabetic patients
compared to healthy controls5,8-10.
Monocytes exert their crucial role in immune defence
through toll-like receptors (TLRs), a type of pattern recognition receptors. Activation of TLRs results in the secretion of anti-bacterial peptides and cytokines. These
initiate an inflammatory response that further leads to
the recruitment of cells responsible for adaptive immunity. Activation of TLRs has been noticed in a number
of inflammatory diseases11-13 (also reviewed in ref.14). It
has been suggested, and supported by studies on animal
models, that TLRs can cause autoimmune imbalances,
including T1DM (ref.14-16). TLRs also seem to participate
in the pathogenesis of type 2 diabetes mellitus (T2DM)
and the metabolic syndrome17,18. The TLR up-regulation
observed in T1DM patients is hypothesized to be induced
by hyperglycaemia19.
Upon stimuli, monocytes are capable of producing
It has long been recognized that innate immunity and
monocytes play a crucial role in the pathogenesis of autoimmune disorders including type 1 diabetes mellitus
(T1DM). Monocytes are multifunctional cells with roles
in homeostasis, immune defence and tissue repair; they
are also known to express a very diverse transcriptome1.
At least two types of monocytes can be distinguished
based on the level of CD14 expression2,3: (1) classical
monocytes, which are strongly positive for the CD14 cell
surface molecule (CD14++ CD16− monocytes), and (2)
more mature, non-classical monocytes, which co-express
the CD16 molecule (CD14+ CD16+ monocytes). The latter share certain phenotypic characteristics with classical
monocytes but resemble tissue macrophages by expressing
many macrophage-like surface antigens.
Variation in the proportions of individual monocyte
subsets has been observed in several pathological states
such as rheumatoid arthritis4 or type 1 diabetes with juvenile-onset5, although some studies focused on long-term
juvenile-onset autoimmune diabetes6 or chronic inflamma1
Biomed Pap Med Fac Univ Palacky Olomouc Czech Repub. 2015; 159:XX.
many cytokines and chemokines, including prolactin
(PRL), a stress and immunostimulatory molecule20.
Impaired PRL production leads to insufficient activation
of the immune response to infection in sepsis, which can
eventually cause death21,22. On the other hand, serum
hyperprolactinaemia has been detected in several autoimmune diseases and is believed to contribute to the
pathogenesis of these illnesses23,24.
The aim of this study was to identify differences concerning the innate component of immunity that may
reflect immune and/or inflammatory processes taking
place in adult-onset autoimmune diabetes (AD), including T1DM and latent autoimmune diabetes in adults
(LADA). All diabetic patients included in the study were
diagnosed after the age of 18 years. T2DM patients and
healthy individuals served as controls. We analyzed the
proportions and absolute numbers of monocytes, measured monocytic TLRs, and verified the potential relationship between the molecular markers studied and clinical
markers of inflammation. Our ultimate objective was to
describe the role of monocytic PRL in the immune process leading to adult-onset autoimmune diabetes.
Life Technologies Corporation, Carlsbad, CA, USA) following the recommended protocol. Separated monocytes
were subjected to RNA isolation with the RNeasy Mini
Kit (QIAGEN GmbH, Hilden, Germany), with minor
modification. The total amount and purity of RNA were
determined spectrophotometrically.
MATERIAL AND METHODS
Subjects
Seventy subjects were enrolled in total. Forty-six
were diabetic patients of the 2nd Department of Internal
Medicine at the Faculty Hospital Kralovske Vinohrady
in Prague diagnosed after the age of 18 years: 21 T1DM
(mean age 43, SD 18.78; 7 female), 9 LADA (mean age
61, SD 13.68; 2 female), and 16 T2DM (mean age 65.25,
SD 14.52; 7 female) as diabetic controls. The diagnosis
of T1DM was made in accordance with the American
Diabetes Association Criteria25. The diagnosis of LADA
required that the condition did not necessitate insulin administration for 6 months after the initial diagnosis. The
healthy control group, CO (mean age 24.5, SD 3.659),
comprised 24 healthy volunteers (21 female). EDTAblood samples were collected, and the medical history of
each subject was noted upon his or her informed consent.
In case that no difference between T1DM and LADA
patients could be seen during data evaluation, the two
groups were merged into a single autoimmune diabetes
group (AD). Due to limited cell counts, all samples were
tested for expression at the mRNA level; some of the samples, however, could not be tested for other parameters
such as monocyte subtypes and TLR protein expression
(applies especially to LADA group), which represents certain limitation of the study. The study was approved by
the ethical committee of the Faculty of Science, Charles
University in Prague (Institutional Review Board, Faculty
of Science, Charles University in Prague, Vinicna 7,
Prague 2, Czech Republic).
Flow cytometry (FCM)
Expression of CD14, TLR2 and TLR4 receptors on
the cell surface was detected by flow cytometry. Peripheral
blood mononuclear cells (PBMC) were isolated from the
whole blood by Histopaque-1077 (Sigma-Aldrich, Prague,
Czech Republic) gradient separation, washed with PBS
(Gibco, Life Technologies Corporation, Carlsbad, CA,
USA), fixed with 3.8% formaldehyde and incubated in
the dark at 4°C for 30 min with the following monoclonal
antibodies: mouse monoclonal to CD14 stained with the
fluorescein isothiocyanate (FITC) (Exbio, Prague, Czech
Republic), mouse monoclonal to TLR2 stained with allophycocyanin (APC) and mouse monoclonal to TLR4 also
stained with APC (both eBioscience, USA). Typically,
30000 events per sample were acquired from the whole
PBMC population. Target markers were detected on a
FACSCalibur flow cytometer (BD Biosciences, USA).
The results were analysed using CellQuestPro software
(BD Biosciences, USA). The region containing monocytes was delimited based on their characteristic size
and internal complexity in light scatters (forward scatter
(FSc)/side scatter (SSc) parameters, “monocyte gate”),
followed by gating on double positivity for CD14 and
TLR2/4. Monocytes strongly positive for CD14 (CD14++)
and monocytes weakly positive for CD14 (CD14+) were
distinguished. Absolute monocyte counts were obtained
from the whole PBMC population. Expression of the
markers under study was evaluated as both the number
of positive cells (presence or absence of selected marker)
and mean fluorescence intensity (MFI, level of expression
of the given marker on the surface of each detected cell).
Monocyte isolation and RNA extraction
Peripheral blood monocytes were separated using
CD14 positive immunomagnetic beads (Dynal, Invitrogen,
Statistical analysis
Data were statistically evaluated using Epi Info
(Version 3.3, October 2004, Atlanta, Georgia) and
Quantitative real-time PCR
To test the expression of PRL, TLR2 and TLR4
genes in monocytes, an ABI 7000 SDS real-time PCR
instrument (Applied Biosystems, Foster City, California,
USA) was used with the following TaqMan-based Assayon-Demand gene expression probes (Life Technologies
Corporation, Carlsbad, CA, USA): Hs00168730_m1
(PRL), Hs00152932_m1 (TLR2), Hs00152939_m1
(TLR4). The human PGK1 (phosphoglycerate kinase-1)
gene served as an internal control. The 2^-dCt method
was applied for relative quantification, and detected
mRNA values were expressed in arbitrary units (AU). To
present the acquired data in an uncluttered manner and
with better resolution, values from the PRL assay were
multiplied by 10^6, and values from the TLR2 and TLR4
assays were multiplied by 10^3.
2
Biomed Pap Med Fac Univ Palacky Olomouc Czech Repub. 2015; 159:XX.
GraphPad Prism software. The D’Agostino-Pearson
normality test was used to check normality. Data are
presented as medians with 25% and 75% percentiles,
respectively. Data involving two groups were compared
using the Mann-Whitney rank-sum test for unpaired values or the Wilcoxon test for paired observations. Data
involving three or more groups were compared using the
Kruskal-Wallis test or the Friedman test for repeated measures. Significance was accepted at P < 0.05.
RESULTS
the effect of age and gender. There were no significant
differences in age at disease manifestation, BMI, TSH,
lipid profile (HDL, serum triglycerides and cholesterol)
or markers of microalbuminuria (serum albumin, albumin in urea, serum creatinine, creatinine in urea, ALT
and AST). C-peptide levels in the T1DM group were
decreased compared to LADA (statistically significant)
and T2DM patients (statistically insignificant). Markers
of glucose metabolism (serum glucose and glycosylated
haemoglobin) did not differ among the groups tested.
Similarly, there were no detectable differences in CRP
levels among the three diabetic groups.
Baseline characteristics of subjects under study
Clinical and biochemical characteristics of diabetic
patients included in the study are detailed in Table 1. The
age of patients differed at the time of testing. T1DM individuals were significantly younger than LADA (P < 0.05)
and T2DM subjects (P = 0.0001). Moreover, healthy individuals had significantly lower age at time of testing when
compared to all diseased groups (P < 0.0001). Gender
distributions differed in healthy controls in comparison
to diabetic patients (P < 0.01) but not among diabetic
patients themselves. Therefore, significant findings observed in this study had to be adjusted in order to exclude
Numbers of monocytes differ significantly
between diabetic patients and healthy subjects
The levels of CD14 surface expression detected by
fluorescence-based FCM allowed the distinction between
monocytes characterized by a high presence of the CD14
marker on the cell surface (CD14++) and cells with decreased amounts of membrane-bound CD14 (designated CD14+). Although counts of monocytes defined by
physical parameters, such as size and cellular complexity
(monocyte gate), did not significantly differ among the
groups under study (data not shown), fluorescence-based
FCM revealed changes in the spectrum of monocytes clas-
Table 1. Clinical and biochemical characteristics of diseased subjects.
T1DM
LADA
T2DM
n (F; %)
Age at testing (years)
Age at onset (years)
Duration of diabetes < 1 year
Duration of diabetes < 5 years
Duration of diabetes > 5 years
BMI
CP (pmol/l)
S-Glucose (mmol/L)
HbA1C (mmol/mol)
S-Albumin (g/L)
U-Albumin (mg/L)
S-Creatinine (umol/L)
U-Creatinine (mmol/L)
ALT (ukat/L)
AST (ukat/L)
HDL (mmol/L)
S-triglycerides (mmol/L)
S-cholesterol (mmol/L)
TSH (mIU/L)
CRP (mg/L)
21 (7; 33%)
43 (18.78) *,#
45.25 (19.74)
4
0
15
25.48 (21.38 - 27.03)
37 (18.5 - 111) §
10.7 (7.29 - 13.4)
9.1 (7.65 - 11.2)
37.5 (34.4 - 39.33)
7 (3 - 59)
70.5 (59 - 83.75)
6.6 (5.4 - 9.8)
0.48 (0.39 - 0.69)
0.43 (0.37 - 0.6)
1.205 (1.015 - 1.565)
1.54 (1.035 - 2.66)
4.93 (4.233 - 5.423)
1.45 (0.6925 - 2.69)
2.7 (1.425 - 4.725)
9 (2; 22%)
61 (13.67)
51.5 (6.9)
5
1
2
26.21 (24.09 - 30.06)
229 (124 - 460)
9.06 (7.32 - 12.1)
7.6 (5.3 - 12.1)
39.25 (38 - 40.5)
10.3 (1.5 - 1833)
80.5 (67.5 - 100.8)
5.25 (4.525 - 11.68)
0.345 (0.2825 - 0.5875)
0.315 (0.24 - 0.45)
1.17 (0.795 - 1.478)
1.525 (0.7325 - 2.618)
5.245 (3.983 - 6.238)
1.52 (0.69 - 5.82)
3.505 (1.588 - 50.48)
16a (7; 44%)
65.25 (14.52)
61
NA
NA
NA
28.57 (24.86 - 32.75)
260 (24 - 507)
10.2 (7.38 - 17.7)
10.5 (8.4 - 12.1)
36.05 (31.5 - 40.48)
37.2 (12 - 141)
73 (58 - 85)
9.65 (5.825 - 13.33)
0.51 (0.335 - 1)
0.44 (0.315 - 0.865)
1.02 (0.77 - 1.545)
1.38 (0.99 - 2.24)
3.97 (2.735 - 5.26)
1.605 (0.4375 - 12.65)
6.5 (3.4 - 31.05)
a
a
Values are means (SD) or medians (interquartile range), unless indicated otherwise. Values without standard deviation indicate only one subject
with a known value within the group. T1DM, type 1 diabetes mellitus; LADA, latent autoimmune diabetes in adults; T2DM, type 2 diabetes
mellitus; F, female; NA, not available; BMI, body mass index; CP, C-peptide; HbA1C, glycosylated hemoglobin; ALT, alanine amino transferase;
AST, aspartate amino transferase; HDL, high density lipoprotein; TSH, thyroid stimulating hormone; CRP, C-reactive protein; S-, serum levels;
U-, urea levels.
a
Due to limited cell numbers, not all samples were tested for all molecular parameters.
* P < 0.05 (compared to LADA; one-way ANOVA)
# P = 0.0001 (compared to T2DM; one-way ANOVA)
§ P < 0.05 (compared to LADA; Mann Whitney Test)
3
Biomed Pap Med Fac Univ Palacky Olomouc Czech Repub. 2015; 159:XX.
sified according to the level of CD14 expression. T1DM
patients had 1.7 times less and AD subjects 1.5 times
less CD14++ monocytes than healthy controls (T1DM:
median count 1828, 1124–2595, P < 0.01; AD: median
2084, 1267–2718, P < 0.01; CO: median 3131, 2343–
4047). Similarly, the T2DM group of patients showed
a trend towards decreased counts of CD14++ monocytes
when compared to the healthy control group (T2DM:
median 1965, 588–2839; P = NS; Fig. 1a). Interestingly, a
similar but even more profound pattern could be observed
in CD14+ monocytes. There was a significant threefold
decrease in CD14+ counts in T1DM patients compared
to healthy controls (T1DM: median 300, 232.5–505.3;
CO: median 893, 570–1259; P < 0.0001). There were also
3.2 times less CD14+ monocytes in AD patients (median 281, 234–446, P < 0.0001) and 3.4 times less CD14+
monocytes in T2DM patients (median 259, 175–349, P <
0.001) compared to healthy subjects, and a trend towards
a drop-off in CD14+ cells in LADA subjects (median 257,
242–332; P = NS; Fig. 1b). Between the AD group and the
T2DM control group, there were no differences in absolute numbers or percentages of either monocyte subtype.
TLR2 protein expression on CD14++ monocytes among
all the groups.
TLR4 protein expression on CD14++ monocytes but
not CD14+ monocytes is down-regulated in patients
with autoimmune diabetes
The FCM analyses revealed a significant decrease
of the TLR4 protein level in the groups with AD when
compared to healthy controls, but not when compared
to T2DM controls. Membrane expression of TLR4 proteins on monocytes defined by physical parameters was
twice lower in T1DM patients than in healthy individuals (T1DM: MFI 39.71, 29.42–42.97; CO: MFI 80.80,
62.51–91.44; P < 0.0001). Likewise, TLR4 surface expression was decreased by half in the merged AD group (MFI
39.81, 31.18–45.12) when compared to healthy controls (P
< 0.0001). Similarly, CD14++ monocytes from T1DM patients had half the TLR4 cell surface expression compared
to CD14++ cells from healthy subjects (T1DM: MFI 52.86,
46.09–75.60; CO: MFI 107, 83.29–131.1; P < 0.0001).
TLR4 expression on membranes of CD14++ monocytes
of all AD patients (MFI 55.3, 46.37–70.38) was almost
twice lower (1.93×) than that of healthy controls (P <
0.0001; Fig. 2b). In contrast to TLR2, there were no apparent changes in TLR4 levels on the cell membrane of
CD14+ monocytes.
TLR2 protein expression on CD14++ monocytes
and CD14+ monocytes
Membrane expression of TLR2 proteins on monocytes defined by physical parameters was the same among
T1DM, LADA, T2DM control and healthy control subjects. However, when the cells were classified based on
their CD14 antigen expression, CD14+ cells exhibited
a significant increase in the level of the TLR2 protein
within the AD group (AD: MFI 117.6, 83.98–142.3; CO:
MFI 83.08, 59.63–98.23; P < 0.05, increase 1.4 times)
and a trend towards higher TLR2 cell surface expression
in the LADA group when compared to healthy controls
(MFI 119.8, 117.6–140.7; P = NS), but not in T1DM or
T2DM patients (Fig. 2a). There was no difference in
Comparison of TLR2 and TLR4 protein expression between
CD14++ and CD14+ monocytes
In healthy subjects, CD14++ monocytes expressed 1.7
times more TLR2 proteins on their surface (P < 0.0001)
and even have 2.3 times up-regulated amounts of TLR4
(P < 0.0001) than CD14+ cells. By contrast, no differences
in TLR2 and TLR4 membrane antigen levels on CD14++
compared with CD14+ cells were evident in diabetic patients (Fig. 3a, 3b).
1a.
1b.
Fig. 1. CD14++ (a) and CD14+ (b) monocyte counts in diabetic patients and healthy controls.
Absolute counts of CD14++ (a) and CD14+ cells (b) were obtained from 30000 events representing the whole PBMC population.
The horizontal bars correspond to group medians. T1DM, type 1 diabetes mellitus (N = 18); LADA, latent autoimmune diabetes
in adults (N = 3); AD, pooled autoimmune diabetes (N = 21); T2DM, type 2 diabetes mellitus (N = 8); CO, healthy control group
(N = 24); PBMC, peripheral blood mononuclear cells.
4
Biomed Pap Med Fac Univ Palacky Olomouc Czech Repub. 2015; 159:XX.
2a.
2b.
Fig. 2. Expression of TLR2 on CD14+ (a) and TLR4 on CD14++ (b) monocyte surface.
TLR2 protein expression (a) is significantly increased on CD14+ monocytes from AD patients when compared to healthy controls;
TLR4 antigen expression (b) is significantly lower on the CD14++ monocyte surface from T1DM and AD patients in comparison
to healthy individuals. Horizontal bars represent group medians. T1DM, type 1 diabetes mellitus (N = 18); LADA, latent autoimmune diabetes in adults (N = 3); AD, pooled autoimmune diabetes (N = 21); T2DM, type 2 diabetes mellitus (N = 8); CO, healthy
control group (N = 24); MFI, mean fluorescent intensity.
3a.
3b.
Fig. 3. Comparison of TLR2 (a) and TLR4 (b) antigen expression between CD14++ and CD14+ monocytes.
CD14++ monocytes from healthy subjects, but not from the diseased groups, show significantly higher TLR2 (a) and TLR4 (b)
expression than CD14+ monocytes. Horizontal bars represent group medians. T1DM, type 1 diabetes mellitus (N = 18); LADA,
latent autoimmune diabetes in adults (N = 3); AD, pooled autoimmune diabetes (N = 21); T2DM, type 2 diabetes mellitus (N = 8);
CO, healthy control group (N = 24); MFI, mean fluorescent intensity
TLR2 and TLR4 mRNA expression in peripheral blood
monocytes
To determine whether the changes in monocyte TLR2
and TLR4 surface expression in the groups under study
resulted from altered mRNA expression, we investigated
TLR2 and TLR4 mRNA levels in cells isolated from
peripheral blood by CD14-positive immunomagnetic
separation. Consistently with trends observed at the protein level in CD14+ cells from the AD group, we found
a tendency towards a twofold increase in TLR2 mRNA
levels in all diabetic groups compared to the control group
(T1DM: median 460.1 AU, 178.1–648.7; LADA: median
395.1 AU, 81.3–768.2; T2DM: median 504.7 AU, 176.9–
657.9; CO: median 193.9 AU, 177.2–246; P = NS; raw data
multiplied by 10^3).
In the case of TLR4, significant reduction in protein
expression observed on the cell surface of all monocytes
and CD14++ cells from the T1DM and AD groups in comparison to the healthy control group was not detected at
the mRNA level (T1DM: median 130.3 AU, 70.93–212;
LADA: median 160.4 AU, 70.54–216.6; T2DM: median
141.2 AU, 61.74–188.3; CO: median 163.8 AU, 135.9–
202.5; P = NS).
PRL mRNA expression in peripheral blood monocytes
Though physiological expression of extrapituitary
prolactin is generally very low (CO median 181.9 AU,
118.2–256.6; raw data were multiplied by 10^6), we could
observe a trend towards decreased PRL mRNA levels in
both T1DM and T2DM subjects (T1DM: median 117.3
5
Biomed Pap Med Fac Univ Palacky Olomouc Czech Repub. 2015; 159:XX.
AU, 50.86–208.3; T2DM: median 133.1 AU, 82.23–188;
P = NS). On the contrary, patients diagnosed with LADA
showed no changes in PRL mRNA expression compared
to healthy individuals (LADA: median 192.3 AU, 45.36–
267.4; P = NS).
ability to respond to stimulation or both29. In T1DM, autoimmune destruction of pancreatic β cells, which manifests as an inflammatory process, may persist for months
or even years before being diagnosed. Though T2DM is
considered a metabolic disorder, chronic low-grade inflammation (so-called metaflammation, an inflammatory
response to metabolic stress, excessive nutrient intake
and obesity), has been clearly demonstrated (reviewed in
ref.30). Median BMI in all three patient groups indicates
excess weight and the 75th percentile indicates obesity in
the LADA and T2DM groups. It thus seems that inflammatory processes in diabetes may influence peripheral
blood leukocyte counts negatively.
Changes and defects in the expression and function of
toll-like receptors might contribute to altered recruitment
of antigen-presenting cells, resulting either in suboptimal
adaptive immune responses leading to increased frequency of illness related to infection or in excessive adaptive
immune reactions causing autoimmune disorders or allergies. Higher levels of TLR2 and lower levels of TLR4 in
ex vivo conditions encountered in this study indicate that
monocyte phenotypes in diabetes are not equivalent to
monocytes in healthy individuals. Though we did not observe any significant decline in TLR4 mRNA expression
in any of the diseased groups compared to the healthy
control group, diabetic patients had significantly lower
levels of TLR4 membrane antigen on their monocytes,
especially CD14++ monocytes. The effect of aging on the
immune system functioning is widely accepted; study on
mice has reported higher age as a cause of depletion of
murine TLRs on macrophages31. We therefore aimed to
determine whether the down-regulation of TLR4 expression on CD14++ monocytes from T1DM patients is attributable to their higher age compared to the age of healthy
individuals included in the study. After the age adjustment, we observed the same drop (twice in monocytes
characterized both by light scatter parameters and CD14
expression) as before the adjustment. We thus confirm
that the reduction of TLR4 expression on monocytes observed in our study, especially on CD14++ monocytes, is
age-independent and can therefore be ascribed to type 1
diabetes with late onset. Alternatively, it may be part of
some metabolic regulatory mechanism, as recently suggested by Pierre et al.32. In that study, TLR4−/− mice turned
out to be protected from gaining body weight and developing glucose intolerance induced by a high-fat diet (HFD),
and the reduced fat storage in TLR4−/− mice was explained
by the absence of ER stress after HFD feeding32.
Intriguingly, a situation different from TLR4 can
be seen in TLR2 expression. Our study shows mild but
significant up-regulation of TLR2 production by CD14+
monocytes from patients with AD. A trend towards increased amounts of TLR2 in monocytes from T2DM
patients is also observable. These findings are also supported by mRNA data, which revealed an increased, albeit
non-significantly, TLR2 mRNA level in total monocytes
from diabetic patients. In contrast to CD14+ monocytes,
CD14++ cells did not exhibit any changes regarding expression of the TLR2 molecule on the cell surface. It has
been suggested that substantially higher TLR2 and TLR4
Relationship between TLR expression and biochemical
parameters
Several relationships between biochemical parameters
and molecular data have been observed. In all diabetic patients, there was a significant negative correlation between
TLR2 surface expression on total monocytes (defined by
FSc and SSc) and serum glucose (r = −0.4803, P < 0.01),
and similarly, a significant negative correlation between
TLR4 protein expression on total monocytes and serum
glucose (r = −0.5617, P < 0.01). Nevertheless, neither of
these relationships was apparent within each single monocyte subtype. Further, absolute numbers of CD14+ monocytes expressing TLR2 correlated significantly with HDL
levels (r = 0.529, P < 0.05) and negatively with serum
triglycerides (r = −0.533, P < 0.05).
DISCUSSION
Much of the present understanding about the biology
of monocytes in T1DM stems from studies performed
on diabetes with childhood onset. It is therefore difficult
to compare and correctly evaluate all available data together and thus paint a complete picture of the immune
processes taking place in the background of this disease.
Various regulatory mechanisms are known to be involved,
and diverse genetic risk factors affect children and adult
patients26,27.
The distinct roles of particular monocyte subtypes in
the pathogenesis of T1DM are indisputable. Our study
revealed a slight but significant decrease in absolute numbers of CD14++ monocytes and a more profound, threefold
reduction in CD14+ monocytes in both T1DM and T2DM
patients diagnosed in adulthood. The drop in both subsets
of monocytes may suggest deficient activation of the immune system in diabetic patients. This effect is independent of age and gender and may be related to changes of
the immune milieu in long-term diabetes, as 63% of our
patients had suffered from autoimmune diabetes for more
than 5 years. Immune processes that accompany initial
stages of the disease at the time of its first manifestation are known to differ from those observed after several
months or years of progression16. Consistently with this
observation and our data, monitoring of percentages and
absolute numbers of monocytes in new-onset T1DM in
comparison to long-term diabetic patients diagnosed in
childhood revealed increased monocyte counts in newly
diagnosed patients, but unchanged percentages and even
lower monocyte counts in long-term patients28.
As regards diminished counts of monocytes in longterm diabetic patients diagnosed in adulthood, there is
substantial evidence that chronic inflammation can induce activation of the immune system and eventually
cause exhaustion of some of its cell components, the
6
Biomed Pap Med Fac Univ Palacky Olomouc Czech Repub. 2015; 159:XX.
expression in monocytes from diabetic subjects reflects
poor glycaemic control17,19,33,34. Although all participating diabetic groups showed markers of hyperglycaemia,
we were unable to confirm any relationship between the
expression of TLR and HbA1c. Instead, the surface expression of both TLR2 and TLR4 on total monocytes
was negatively correlated with serum glucose levels. This
finding corroborates results obtained by Stechova et al.
(ref.35) regarding the influence of maternal hyperglycaemia on cord blood mononuclear cells, which showed that
glucose may have a decreasing effect on the inflammatory
reaction of the organism.
Because there is a known connection between lipopolysaccharides and serum lipoproteins such as HDL
(ref.36), and since the ability of serum lipids to attenuate proinflammatory activity of bacterial lipoproteins
through binding to toll-like receptors has already been
confirmed37, we evaluated the potential effect of HDL,
triglycerides and cholesterol on the spectrum and numbers of monocytes, and their TLR expression in diabetic
subjects. We nevertheless could not see any relationship
and found no correlation with levels of TLR2 or TLR4
expression on either monocyte subtype. Moreover, absolute numbers of CD14+ monocytes expressing TLR2
correlated significantly with HDL levels and negatively
with serum triglycerides. One might speculate that, in
diabetic patients, elevated serum levels of HDL accompanied by increased numbers of CD14+/TLR2+ cells might
protect against bacterial infections and lipoprotein toxicity, as previously demonstrated in mice and rabbits38,39.
Elevated HDL levels and increased CD14+/TLR2+ cell
counts might play a part in compensatory mechanisms activated in response to decreased CD14++ monocyte counts
and TLR4 expression.
In other words, CD14++ monocytes of healthy subjects
examined in our study express 1.7 times more TLR2 receptors on their surface and even have 2.3 times up-regulated TLR4 antigen levels than CD14+ cells, which is
apparently a physiological reflection of different levels of
maturity associated with different functions. By contrast,
no significant differences in the expression of TLR2 and
TLR4 proteins on CD14++ compared to CD14+ cells could
be seen in diabetic subjects. The minimization of differences in TLR4 membrane expression seems to be mainly
caused by decreased TLR4 expression on CD14++ cells
in both T1DM and, to a lesser extent, T2DM patients,
perhaps pointing to dysregulation of innate immunity in
both types of diabetes, which might be caused by hyperglycaemia, fat storage or other metabolic factors32.
Our findings show that adult-onset autoimmune diabetes is accompanied by changes in absolute numbers and
proportions of immune cells as well as altered expression of functional innate receptors on monocytes and that
these changes differ from those reported in juvenile AD.
On the other hand, overstimulation of the immune system
by chronic low-grade inflammation in long-term diabetic
patients does not seem to have a significant impact on
PRL gene transcription activity. We nevertheless cannot
rule out the possibility that extrapituitary prolactin regu-
lated at the protein level plays a role in the pathogenesis
or progression of AD.
ABBREVIATIONS
AD, Autoimmune diabetes; ALT, Alanine amino
transferase; APC, Allophycocyanine; AST, Aspartate
amino transferase; AU, Arbitrary unit; BMI, Body mass
index; CD, Ccluster of differentiation; CO, Healthy controls; CP, C-peptide; CRP, C-reactive protein; EDTA,
Ethylenediaminetetraacetic acid; ER, Endoplasmic reticulum; F, Female; FITC, Fluorescein isothiocyanate;
FSc, Forward scatter; HbA1C, Glycosylated hemoglobin; HDL, High density lipoprotein; HFD, High fat diet;
LADA, Latent autoimmune diabetes in adults; MFI, Mean
fluorescence intensity; mRNA, Messenger ribonucleic
acid; NA, Not available; PBMC, Peripheral blood mononuclear cell; PGK1, Phosphoglycerate kinase-1; PRL,
Prolactin; S-, Serum levels; SD, Standard deviation; SSc,
Side scatter; T1DM, Type 1 diabetes mellitus; T2DM;
Type 2 diabetes mellitus; TLR2(4), Toll-like receptor 2
(4); TSH, Thyroid stimulating hormone; U-, Urea levels.
ACKNOWLEDGEMENT
This study was funded by the Grant Agency of the
Czech Republic (grant P302-11-P582).
We would like to thank Jana Kratka and Andrea
Valentova for their help with collecting patients’ blood,
and Michaela Rihova and Tana Svitalkova for drawing
blood from healthy subjects. Finally, we thank Fred Rooks
for his advice on English usage.
Authorship contributions: PC, MC: conception and
study design; JB, PC: selection of patient; PC, IN:
data collection and analysis; PC: manuscript writing;
IN, JB, MC: manuscript revision.
Conflict of interest statement: None declared.
REFERENCES
1. Wells CA, Chalk AM, Forrest A, Taylor D, Waddell N, Schroder K, Himes
SR, Faulkner G, Lo S, Kasukawa T, Kawaji H, Kai C, Kawai J, Katayama
S, Carninci P, Hayashizaki Y, Hume DA, Grimmond SM. Alternate transcription of the Toll-like receptor signaling cascade. Genome Biology
2006;7(2).
2. Ziegler-Heitbrock L. The CD14+CD16+blood monocytes: their
role in infection and inflammation. Journal of Leukocyte Biology
2007;81:584-92.
3. Ziegler-Heitbrock L, Ancuta P, Crowe S, Dalod M, Grau V, Hart DN,
Leenen PJM, Liu YJ, MacPherson G, Randolph GJ, Scherberich J,
Schmitz J, Shortman K, Sozzani S, Strobl H, Zembala M, Austyn JM,
Lutz MB. Nomenclature of monocytes and dendritic cells in blood.
Blood 2010;116:E74-E80.
4. Rossol M, Kraus S, Pierer M, Baerwald C, Wagner U. The
CD14brightCD16+monocyte subset is expanded in rheumatoid arthritis and promotes expansion of the Th17 cell population. Arthritis
and Rheumatism 2012;64:671-7.
5. Mysliwska J, Smardzewski M, Marek-Trzonkowska N, Mysliwiec M,
Raczynska K. Expansion of CD14(+)CD16(+) monocytes producing
TNF-alpha in complication-free diabetes type 1 juvenile onset patients. Cytokine 2012;60:309-17.
7
Biomed Pap Med Fac Univ Palacky Olomouc Czech Repub. 2015; 159:XX.
6. Krankel N, Armstrong SP, McArdle CA, Dayan C, Madeddu P. Distinct
Kinin-Induced Functions Are Altered in Circulating Cells of Young
Type 1 Diabetic Patients. Plos One 2010;5(6).
7. Macaubas C, Nguyen KD, Peck A, Buckingham J, Deshpande C, Wong
E, Alexander HC, Chang SY, Begovich A, Sun Y, Park JL, Pan KH, Lin
R, Lih CJ, Augustine EM, Phillips C, Hadjinicolaou AV, Lee T, Mellins
ED. Alternative activation in systemic juvenile idiopathic arthritis
monocytes. Clinical Immunology 2012;142:362-72.
8. Devaraj S, Dasu MR, Rockwood J, Winter W, Griffen SC, Jialal I.
Increased toll-like receptor (TLR) 2 and TLR4 expression in monocytes from patients with type 1 diabetes: further evidence of a proinflammatory state. J Clin Endocrinol Metab 2008;93:578-83.
9. Devaraj S, Glaser N, Griffen S, Wang-Polagruto J, Miguelino E, Jialal
I. Increased monocytic activity and biomarkers of inflammation in
patients with type 1 diabetes. Diabetes 2006;55:774-9.
10. Devaraj S, Cheung AT, Jialal I, Griffen SC, Nguyen D, Glaser N, Aoki
T. Evidence of increased inflammation and microcirculatory abnormalities in patients with type 1 diabetes and their role in microvascular complications. Diabetes 2007;56:2790-6.
11. Hausmann M, Kiessling S, Mestermann S, Webb G, Spottl T, Andus
T, Scholmerich J, Herfarth H, Ray K, Falk W, Rogler G. Toll-like receptors 2 and 4 are up-regulated during intestinal inflammation.
Gastroenterology 2002;122:1987-2000.
12. Shao L, Zhang P, Zhang Y, Lu Q, Ma A. TLR3 and TLR4 as potential
clinically biomarkers of cardiovascular risk in coronary artery disease
(CAD) patients. Heart Vessels 2014;29(5):690-8.
13. Mudaliar H, Pollock C, Komala MG, Chadban S, Wu H, Panchapakesan
U. The role of Toll-like receptor proteins (TLR) 2 and 4 in mediating inflammation in proximal tubules. Am J Physiol Renal Physiol
2013;305:F143-F154.
14. Kaizer EC, Glaser CL, Chaussabel D, Banchereau J, Pascual V, White PC.
Gene expression in peripheral blood mononuclear cells from children with diabetes. Journal of Clinical Endocrinology & Metabolism
2007;92:3705-11.
15. Zipris D. Innate immunity and its role in type 1 diabetes. Curr Opin
Endocrinol Diabetes Obes 2008;15:326-31.
16. Wang XJ, Jia S, Geoffrey R, Alemzadeh R, Ghosh S, Hessner MJ.
Identification of a molecular signature in human type 1 diabetes mellitus using serum and functional genomics. Journal of
Immunology 2008;180:1929-37.
17. Dasu MR, Devaraj S, Park S, Jialal I. Increased Toll-Like Receptor (TLR)
Activation and TLR Ligands in Recently Diagnosed Type 2 Diabetic
Subjects. Diabetes Care 2010;33:861-8.
18. Sherry CL, O'Connor JC, Kramer JM, Freund GG. Augmented lipopolysaccharide-induced TNF-alpha production by peritoneal macrophages in type 2 diabetic mice is dependent on elevated glucose
and requires p38 MAPK. Journal of Immunology 2007;178:663-70.
19. Dasu MR, Devaraj S, Zhao L, Hwang DH, Jialal I. High Glucose Induces
Toll-Like Receptor Expression in Human Monocytes Mechanism of
Activation. Diabetes 2008;57:3090-8.
20. Ben Jonathan N, Mershon JL, Allen DL, Steinmetz RW. Extrapituitary
prolactin: distribution, regulation, functions, and clinical aspects.
Endocr Rev 1996;17:639-69.
21. Felmet KA, Hall MW, Clark RS, Jaffe R, Carcillo JA. Prolonged lymphopenia, lymphoid depletion, and hypoprolactinemia in children
with nosocomial sepsis and multiple organ failure. J Immunol
2005;174:3765-72.
22. Cejkova P, Chroma V, Cerna M, Markova M, Marek J, Lacinova Z,
Haluzik M. Monitoring of the Course of Sepsis in Hematooncological
Patients by Extrapituitary Prolactin Expression in Peripheral Blood
Monocytes. Physiological Research 2012;61:481-8.
23. Leanos-Miranda A, Cardenas-Mondragon G. Serum free prolactin
concentrations in patients with systemic lupus erythematosus are
associated with lupus activity. Rheumatology (Oxford) 2006;45:97101.
24. Neidhart M, Gay RE, Gay S. Prolactin and prolactin-like polypeptides
in rheumatoid arthritis. Biomed Pharmacother 1999;53:218-22.
25. American Diabetes Association. Diagnosis and classification of diabetes mellitus. Diabetes Care 2008;31:S55-S60.
26. Cerna M, Kolostova K, Novota P, Romzova M, Cejkova P, Pinterova D,
Pruhova S, Treslova L, Andel M. Autoimmune diabetes mellitus with
adult onset and type 1 diabetes mellitus in children have different
genetic predispositions. Ann N Y Acad Sci 2007;1110:140-50.
27. Sabbah E, Savola K, Ebeling T, Kulmala P, Vahasalo P, Ilonen J, Salmela
PI, Knip M. Genetic, autoimmune, and clinical characteristics of childhood- and adult-onset type 1 diabetes. Diabetes Care 2000;23:132632.
28. Vuckovic S, Withers G, Harris M, Khalil D, Gardiner D, Flesch I, Tepes
S, Greer R, Cowley D, Cotterill A, Hart DNJ. Decreased blood dendritic cell counts in type 1 diabetic children. Clinical Immunology
2007;123:281-8.
29. Sousa CRE, Yap G, Schulz O, Rogers N, Schito M, Aliberti J, Hieny
S, Sher A. Paralysis of dendritic cell IL-12 production by microbial
products prevents infection-induced immunopathology. Immunity
1999;11:637-47.
30. Gregor MF, Hotamisligil GS. Inflammatory Mechanisms in Obesity.
Annual Review of Immunology, Vol 29 2011;29:415-45.
31. Renshaw M, Rockwell J, Engleman C, Gewirtz A, Katz J, Sambhara S.
Cutting edge: Impaired toll-like receptor expression and function in
aging. Journal of Immunology 2002;169:4697-701.
32. Pierre N, Deldicque L, Barbe C, Naslain D, Cani PD, Francaux M. TollLike Receptor 4 Knockout Mice Are Protected against Endoplasmic
Reticulum Stress Induced by a High-Fat Diet. Plos One 2013;8(5).
33. Mohammad MK, Morran M, Slotterbeck B, Leaman DW, Sun YP, von
Grafenstein H, Hong SC, McInerney MF. Dysregulated Toll-like receptor expression and signaling in bone marrow-derived macrophages at the onset of diabetes in the non-obese diabetic mouse.
International Immunology 2006;18:1101-13.
34. Ururahy MAG, Loureiro MB, Freire-Neto FP, de Souza KSC, Zuhl I,
Brandao-Neto J, Hirata RDC, Doi SD, Arrais RF, Hirata MH, Almeida
MD, de Rezende AA. Increased TLR2 expression in patients with type
1 diabetes: evidenced risk of microalbuminuria. Pediatric Diabetes
2012;13:147-54.
35. Stechova K, Spalova I, Durilova M, Bartaskova D, Cerny M, Cerna M,
Pithova P, Chudoba D, Stavikova V, Ulmannova T, Faresjo M. Influence
of Maternal Hyperglycaemia on Cord Blood Mononuclear Cells in
Response to Diabetes-associated Autoantigens. Scandinavian
Journal of Immunology 2009;70:149-58.
36. Wurfel MM, Kunitake ST, Lichenstein H, Kane JP, Wright SD.
Lipopolysaccharide (Lps)-Binding Protein Is Carried on Lipoproteins
and Acts As A Cofactor in the Neutralization of Lps. Journal of
Experimental Medicine 1994;180:1025-35.
37. Bas S, James RW, Gabay C. Serum lipoproteins attenuate macrophage activation and Toll-Like Receptor stimulation by bacterial
lipoproteins. Bmc Immunology 2010;11(46).
38. Levine DM, Parker TS, Donnelly TM, Walsh A, Rubin AL. In-Vivo
Protection Against Endotoxin by Plasma High-Density-Lipoprotein.
Proceedings of the National Academy of Sciences of the United
States of America 1993;90:12040-4.
39. Cue JI, Dipiro JT, Brunner LJ, Doran JE, Blankenship ME, Mansberger
AR, Hawkins ML, Peck M. Reconstituted High-Density-Lipoprotein
Inhibits Physiological and Tumor-Necrosis-Factor-Alpha Responses to
Lipopolysaccharide in Rabbits. Archives of Surgery 1994;129:193-7.
8


© Copyright 2026