
Palaeontologia Electronica A FOURIER METHOD TO DESCRIBE AND COMPARE SUTURE PATTERNS
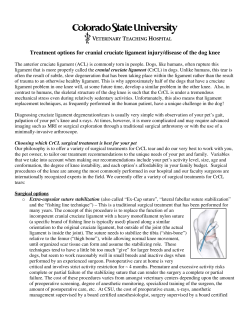
Palaeontologia Electronica http://palaeo-electronica.org A FOURIER METHOD TO DESCRIBE AND COMPARE SUTURE PATTERNS Raymond F. Gildner Paleontological Research Institution. Ithaca, NY 14853 Department of Geosciences, Indiana University, Purdue University, Fort Wayne, Fort Wayne, IN 46805 [email protected] ABSTRACT Suture patterns in shelled cephalopods are periodic structures and can be described using Fourier methods when points along the pattern are described by two parametric equations. One equation describes the angular position along the circumference of the phragmacone, and another describes the height along the length of the shell. The angular position is amenable to Fourier description transformed to the difference between the observed angle and the angle expected if the suture line were straight. An accurate reconstruction of ammonitic suture patterns is accomplished with few amplitudes. Applying the method to the digitized suture patterns provides a more accurate means of interpolation than linear interpolation, necessary for comparison between suture patterns. Simple “nautilitic” and complex “ammonitic” suture patterns from the literature are used to demonstrate application of the method. Ontogenetic series of suture patterns may develop first by increasing variability in their height, and only later by increasing variability in the angular positions. The method invites new approaches of analysis, including different approaches to nearest neighbor analysis to determine patterns of similarity between suture patterns. Copyright: Paleontological Society - September 2003 Submission: 29 April 2002 - Acceptance: 6 August 2003 KEY WORDS: cephalopods, ammonites, septa, suture patterns, Fourier analysis, modeling INTRODUCTION Among the externally shelled cephalopods, wall-like septa separate the shell into camerae and form sutures where each septum joins the external shell. The shape of the suture has been used to distinguish cephalopod species and determine taxonomic relationships, and often serves as a proxy for examining the function of the septa, which has been the focus of much attention in recent years. Although diagnostic and important, the numerical description of sutures has been elusive. This paper presents a numerical method for describing suture patterns and briefly investigates its application. The terms “suture,” “suture line” and “suture pattern” have been used synonymously by various Gildner, Raymond F., 2003. A Fourier Method to Describe and Compare Suture Patterns. Palaeontologia Electronica 6(1):12pp, 4.1MB; http://palaeo-electronica.org/paleo/2003_1/suture/issue1_03.htm GILDNER: FOURIER ANALYSIS OF AMMONOID SUTURES authors. In this paper, “suture” refers to the juncture of the septum and the shell wall, and is a structural part of the cephalopod shell. This paper does not consider the suture. “Suture line” refers to the graphical representation of that juncture on the shell, and is typically drawn in twodimensions. This paper presents a method to reconstruct the suture line using a mathematical description based on Fourier series. A simulation would create suture lines from the physical processes which govern them; this paper does not present a method of simulation. “Suture pattern” refers to the shape or form of the suture line. This paper presents some suggestions for analyzing and comparing suture patterns. Suture patterns range from simple, straight lines (nautilitic patterns) to visually complex and intricate curves (ammonitic patterns). No explanation of sutural complexity is universally accepted. Proposed explanations focus upon a link between sutural complexity and the shell’s resistance to breaking due to hydrostatic or unidirectional stresses (Hewitt and Westermann 1986, 1997, Westermann and Tsujita 1999), the participation of the septa in processes regulating buoyancy (Reyment 1958, Saunders 1995, Seilacher and LaBarbera 1995), or other factors (e.g., viscous fingering, García-Ruíz et al. 1990; body-conch attachment, Lewy 2002). Quantitative modeling experiments of the effect of sutural complexity on shell strength have used artificially simple sinusoidal suture patterns with one or more frequencies (Daniel et al. 1997, Hassan et al. 2002). The inability to mathematically describe more complex and realistic suture patterns limits such analyses. (For more detailed and complete reviews of this debate, see Jacobs 1996, Seilacher and LaBarbera 1995, Westermann 1996, Daniel et al. 1997, Olóriz et al. 2002, Lewy 2002.) To date, quantitative measures of suture patterns fall into two general categories: statistics and descriptions. Statistics are single values that describe some aspect of the pattern that is usually construed as a measure of sutural complexity: a number that increases with the suture’s visual complexity. Exactly what is meant by “complexity” is vague (McShea 1991); one reason such a statistic is pursued is to clarify its meaning. Descriptions, on the other hand, attempt to provide a mathematical method by which the patterns can be recreated numerically and do not address complexity. These methods describe the shape of the suture pattern, and therefore must contain more values than a single statistic. Unlike a statistic, a mathematical description of any suture pattern is unique to that pattern. Westermann proposed the length of a suture normalized to the circumference of the phragmacone as a measure of sutural complexity (sutural complexity index, Westermann 1971) Other workers adopted this statistic (e.g., the Index of Sutural Complexity, Ward 1980; suture-sinuosity index, Saunders 1995) or a variation of it (Suture Complexity Index, Saunders 1995). These statistics have been used to study a variety of paleobiological problems (Ward 1980, Saunders 1995, Saunders and Work 1996, 1997). This statistic has the same value for suture patterns of very different shapes. Fractal dimension is an alternative statistic to the sutural complexity index. Fractal dimension (F.D., Boyajian and Lutz 1992; Df, Olóriz et al. 1999) more directly measures recurving of a suture pattern. The first application of fractal dimension to suture patterns used a space-filling method (Boyajian and Lutz 1992, Lutz and Boyajian 1995), and more recent applications use the more conventional step-line method (Olóriz et al. 1999). The values of fractal dimension are different between the two methods. Fractal analysis has been applied to a variety of paleobiological problems (Olóriz and Palmqvist 1995, Olóriz et al. 1997), including the function of the septum (Olóriz et al. 2002). Like the sutural complexity index, different suture patterns share the same value for fractal dimension. Several attempts have been made to devise a numerical description of suture patterns. The general form of suture lines, a closed orbit wrapping around the circumference of the phragmacone (Figure 1), has been recognized as periodic and therefore potentially amenable to Fourier analysis. There is motivation for applying Fourier methods to sutures, as they have proven useful for morpho- Figure 1. The suture line of Strenoceras in three dimensions. The venter, indicated by label and adorally oriented arrow, and dorsum, indicated by label and arrow, are indicated. 2 GILDNER: FOURIER ANALYSIS OF AMMONOID SUTURES FIGURE 2. The suture line of Strenoceras showing the non-uniqueness of points. There are multiple values for height h, along the blue lines, for several angular positions around the suture line. This non-uniqueness makes a transformation of the angle necessary before Fourier methods can be used. metric analyses of ostracodes (Kaesler and Waters 1972), bivalves (Gevirtz 1976), bryozoans (Anstey and Delmet 1972, 1973, Anstey et al. 1976, Anstey and Pachut 1980), trilobites (Foote 1990), humans (Palmqvist et al. 1996) and other taxa. The complexity of suture patterns, particularly of ammonitic patterns, precludes the direct application of Fourier methods due to non-unique points (Figure 2). It is not uncommon for a suture pattern to recurve along its length, so that there is more than one height for a single angular position around the circumference of the phragmacone. Less-detailed nautilitic suture patterns can be studied using Fourier analysis because they lack nonunique points, but more elaborate ammonitic patterns cannot (Canfield and Anstey 1981). A previous study attempted to circumvent the problem via a transformation (Gildner and Ackerly 1985), but fails due to a dependence upon the scale of measurement. The method described in this paper consists of three parts: a parametric formulation for points along the suture line, a transformation of the data, and a normalization of the series by trigonometric interpolation. The parametric formulation removes the problem of non-unique points. The transformation solves the recognized problem confronted when using Fourier methods on angular data: the removal of the trend of increasing angle around the circumference of the feature. This is analogous to the perimeter method (Foote 1989), originally applied to describe trilobite cranidia as non-parametric, planar curves in polar coordinates. This study extends Foote’s method into three dimensions. The trigonometric interpolation is not necessary for the description of a suture pattern but is needed to standardize such descriptions for comparisons between suture patterns. The index of the point along the suture line is used as the independent variable to calculate an initial pair of Fourier series from digitized suture patterns, which are then used to interpolate points for the calculation of final, normalized Fourier series. The final series allows the numerical analysis of single suture pat- terns, and the comparison of different suture patterns. This paper will briefly examine how ontogenetic development and similarity between suture patterns may be approached using this method. Suture patterns from the literature were transformed into digital images using a flat-bed scanner. The images were manually digitized directly on the computer, and the series were calculated from the digitized data using a discrete Fourier transform. The suture patterns were reconstructed using the series, and points equally spaced along the suture line were trigonometrically interpolated using the series. The final, normalized Fourier series were calculated from the interpolated data. Digitization of the images was done with a program written by the author in Java (Frames); other processing was done with programs written by the author in REALbasic, compiled for Mac OS X. The code and programs are available for the three programs: Draw4096, Frames, and BothFourier., at the PE site [http://palaeo-electronica.org/2003_1/suture/ issue3_01.htm]. PARAMETRIC FORMULATION FOR POINTS ALONG THE SUTURE LINE Sutures are three-dimensional structures (Figure 3), but suture lines are usually illustrated as two-dimensional, open curves in a plane. When viewed in three dimensions, a suture appears as a closed orbital path around the circumference of the phragmacone. Therefore, the suture line is a threedimensional, closed curve. It can be described using cylindrical coordinates. The position of points along the suture line can be measured in terms of an angle around the circumference of the phragmacone (theta), the position along the shell's FIGURE 3. The suture pattern of Strenoceras in cylindrical coordinates illustrating the coordinates used in this study; the angle around the circumference of the whorl, theta, and the height h. The venter is indicated by a white arrow. 3 GILDNER: FOURIER ANALYSIS OF AMMONOID SUTURES length (h) and the distance from the center of the shell whorl (r). Points along the suture line are described by parametric equations, with n (the index of the point) as the variable. If there are N points along the suture line, then the position S of the nth point (the point with index n of N) can be described as S(n) = ( r(n), theta(n), h(n) ) 1 By using parametric equations, the problem of non-uniqueness is eliminated, since each h(n) is unique with respect to n. This is in contrast to the more typical formulation where points are defined in linear terms (e.g., Canfield and Anstey 1981 using Fourier series to describe nautilitic suture patterns, and Daniel et al. 1997, Hassan et al. 2002 using finite-element analyses). A complete mathematical description of suture patterns would use the shape of the shell that bounds the septum, rather than cylindrical coordinates. Most cephalopod shells are logarithmically spiraled cones (although the heteromorph ammonites deviate radically from the logarithmic model). Unfortunately, the shape of the shell is seldom reported in detail in the literature, and this study will use a cylindrical coordinate system. The suture patterns used in this study were from published suture patterns (principally Wiedmann 1969), illustrated as two-dimensional curves. Information on h is incomplete in these sources, and information of the coiling parameters (e.g., W and D, Raup 1967), as well r, are missing. It is possible, however, to compensate for the lack of complete information on h by defining an origin on the suture line (h(0) is defined as 0 where the suture crosses the venter). Published suture lines commonly do not include information on r or the cross-section of the whorl at the position of the suture was drawn, and thus it is not possible to compensate for its absence so r is omitted from this analysis. (It should be noted that this is not always the case; see, for example, Olóriz et al. 1997.) The suture line is scaled such that the length of the half-suture is pi; this characterization has the effect of treating the cross-section of the whorl as a circle with a radius of 1. h is scaled such that proportionality between h and the suture length is maintained. This method requires the complete suture, around the entire circumference of the phragmacone (from 0 to 2 pi). Suture patterns are often not published in their entirety, but omit the internal portion of the pattern that is covered by the succeeding volution. Such published patterns are not amenable to the method as described here, although it may be possible to extend the method. Some shelled cephalopods, most notably the het- eromorph ammonites, are not coiled to the degree that the shell formed by the more mature animal overlaps the earlier formed shell; several of the suture patterns used in this analysis are of heteromorph taxa. TRANSFORMATION OF ANGULAR POSITION AND FOURIER ANALYSIS The h parameter of the curve is directly amenable to Fourier methods without transformation, but the non-uniqueness problem requires that theta be transformed. Transforming the angular position to the difference between the observed and expected positions solves the problem of nonunique points along the suture (Foote 1989). The transformation applied to theta is φ(n) = π n/N - θ(n) θ(n) = π n/N - φ(n) φ( n) = πn − θ( n ) N 2A. and the inverse transformation is θ( n ) = πn − φ( n ) N 2B. where n is the index of the point, N is the total number of points along the suture line, from the ventral (or external, n = 0) to the dorsal (or internal, n = N) points of symmetry. Mirror-plane symmetry of suture lines provides us with opportunities to simplify the analysis. This study uses the point where the suture line crosses the venter as the origin (n = 0, h = 0, theta = 0). Because suture patterns are symmetric about this origin, they can be fully described by cosine and sine series. Note that h is an even function (h(n) = h(-n)) and can be described using cosine series, and that theta and phi are odd functions (theta(n) = -theta(-n)) and can be described using sine series. Because points measured in one half of the suture have counterparts in the other half, any number of points measured in the half suture describes an even number of points in the full suture. The Fourier description of the coordinates of point S(n) along the suture is h( n ) = N −1 π n ∑ A (i) cos 2 i N h 3A. i =0 θ( n ) = πn − N N −1 ∑ A (i) sin 2πi N φ n 3B. i =0 4 GILDNER: FOURIER ANALYSIS OF AMMONOID SUTURES FIGURE 4. Reconstructed suture lines of Agoniatites (below) and Scaphites (above). The reconstruction of Scaphites uses 1024 amplitudes; that of Agoniatites uses only 64 amplitudes. Black curve in background is the suture line as digitized from published image. The white lines in the foreground are the reconstructions, calculated from Fourier amplitudes. Figures modified from Wiedmann (1969). where Ah(i), and A phi (i) are the Fourier amplitudes for the frequency i. Suture patterns of the same individual show a great deal of variation throughout ontogeny. Sutures in an ontogenetic series are treated as different patterns, as if they belonged to different species. Variation can also be found between the left and right sides of the suture of the same individual. This variation? is typically not considered to be important, as shown by the convention of illustrating only half-sutures. There is also variation between individuals of the same species, a common situation in any morphometric study. A discrete Fourier transform is used to calculate the Fourier series. There are two common algorithms for calculating Fourier series: the fast Fourier transform (FFT) and the discrete Fourier transform (DFT). For sine and cosine series, with no imaginary component to the amplitudes (phase angles), FFT and DFT produce the same results. The FFT is a significantly faster computational method for very large data sets, but is constrained to data consisting of 2n points (where n is any integer). The DFT is slower, but only requires an even number of points (2n). Since the use of half-sutures guarantees that there are an even number of points in the full-suture, this requirement is automatically met. The FFT's requirement of 2n points is not automatically met and would require interpolating points along the suture before the Fourier series could be calculated. Since the data for suture lines is limited to a few thousand points, the constraint on the number of points (2n versus 2n) becomes more significant than any advantage in speed the FFT would provide, and the DFT is preferred. The algorithms for the sine and cosine DFT used in this study are modified from Pachner (1984). The DFT returns a description of the suture pattern as two series of amplitudes, each with many elements. The suture pattern can be considered as comprised of two different signals, h and phi. The number of frequencies needed for the reconstruction of suture patterns depends upon the complexity of the suture and the detail needed (Figure 4). Simple patterns, such as that of Agoniatites, require as few as 64 amplitudes (32 frequencies for both phi and h). More complex suture patterns, such as that of Scaphites, require many more data. The reconstruction of the suture pattern of Scaphites requires 512 frequencies. More complex suture patterns require even more data. Much of the visual complexity of a suture pattern appears to be the result of the phi-frequencies, at least subjectively (Figure 5). Uniformly reducing all h-frequencies by the same factor while leaving the phi frequencies unchanged produces suture patterns that are vertically shortened, yet still retain their saddles and lobes in recognizable shapes. Uniformly reducing all the phi-frequencies while leaving the h-frequencies unchanged produces a different result. The number and magnitude of nonunique points along the suture are reduced. The new pattern is no longer recognizable as being the same as the unaltered suture pattern. An ammo- 5 GILDNER: FOURIER ANALYSIS OF AMMONOID SUTURES FIGURE 5. The suture pattern of Scaphites drawn with the amplitudes of h and phi scaled. phi amplitudes have been scaled by the same amount in each column: from left to right, by 0.25, 0.5, 0.75, and 1.0 (no scaling). h amplitudes have been scaled by the same amount in each row: from left to right, by 0.25, 0.5, 0.75, and 1.0 (no scaling). The shape of the suture pattern is recognizable when both h and phi are scaled equally, even to 0.5 times their original values. nitic suture pattern plotted with reduced values for phi appears to be a less complex structure. APPLICATION OF FOURIER DESCRIPTION OF SUTURE PATTERNS It is useful for analysis to reduce these many terms in a meaningful way. In time-series analysis and signal processing, the sum of the squares of the amplitudes of a signal is the signal’s power. That is P( h) = N −1 ∑ A (i ) 2 4A. h i =0 N −1 () P( φ ) = ∑ A φ i i =0 2 4B. The combined power of a suture pattern is: P(all) = Power(h) + Power(theta) N −1 ( i) h P ( all ) = ∑ A i= 0 2 N −1 () + ∑ Aφ i i=0 2 4C 4D. Each of these definitions of Power describes different properties of the suture pattern. Power(h) describes variability in the height of the suture, the vertical distance between the top and bottom of the suture. A high Power(h) indicates that the suture is tall, along the longitudinal direction of the whorl. In the same way, the Power(phi) is a description of variability along the radial direction of the suture pattern. A suture pattern with non-singular points can be expected to have a high Power(phi). Power(all), Power(h) and Power(phi) of a straight suture line are all 0. For this study, ontogenetic series of Strenoceras and of Scaphites were analyzed using this method, and Power(h) and Power(phi) were plotted for each (Figure 6). The ontogenetic series show that h and phi do not develop synchronously. The amplitudes of the h-frequencies increase more quickly than those of the phi-frequencies in the early stage of development, but in the middle stage of development this relationship changes. In the last stage of development of Scaphites, both h and phi increase at an intermediate rate. Only two ontogenetic series are shown, and other ontogenetic series may display significant deviation from the simple pattern illustrated. More data are needed to 6 GILDNER: FOURIER ANALYSIS OF AMMONOID SUTURES FIGURE 6. Plot of Power(phi) and Power(h) for suture patterns in the ontogenetic series of Strenoceras (6a) and Scaphites (6b). The trend of power through the ontogeny is indicated by the thick, bent arrow, with the arrow head at the mature suture pattern. Colored arrows connect the point plotted to the suture pattern. Early in ontogeny, h-amplitudes increase relatively faster than phi, then enter a stage in which the relationship is reversed. determine the general applicability of the trend of suture development through ontogeny. The Fourier description of suture patterns also provides a basis by which suture patterns may be compared. Previous quantitative comparisons of suture patterns have not been based on methods that are capable of reconstructing suture patterns, but have been based on suture statistics. The sutural complexity index (Westermann 1971) has been used in several studies with limited success. Its usefulness is limited because many different suture patterns have the same value. However, the sutural complexity index can be measured can be calculated directly from the Fourier series. The length of the suture line is the line integral of the parametric Fourier series, and the normalization can be accomplished by dividing the length by pi. 1 dh x ( ) + dθ( x ) dx SCI = 1 π 0 dx dx ∫ 5. As a practical matter, it is more efficient to calculate the index of sutural complexity by reconstructing the suture pattern and calculating and summing the distance between calculated points. The two Fourier series describe the shape of the suture pattern in detail, as can be demonstrated by recreating the suture pattern (Figure 4). The series also record the shape in a more general fashion. Suture patterns reconstructed using only the first few frequencies display the same general shape. For Strenoceras and Scaphites, reconstructions of stages in an ontogenetic series using the first 32 frequencies generate patterns that are similar (Figure 7) to other members of the same series. The basic pattern of major and minor lobes can be seen in each reconstruction, from the earliest to the mature suture pattern. The frequencies of both h and phi can be treated as orthogonal axes defining a multidimensional space (the number of dimensions equal twice the number of frequencies). The amplitude of each frequency of a suture pattern describes a point in this space. Another way of thinking of this concept is to consider the suture pattern a vector in the multidimensional space, starting at the origin and ending at the point defined by the amplitudes of each frequency. The magnitude of the vector is the square root of Power(all); the direction is determined by the relative amplitudes of each frequency. Each suture pattern defines a unique point. Visualizing the pattern in this way is a useful way to think about the analysis and comparison of suture patterns. Suture patterns can be compared by analyzing the relationships of points and vectors. Suture patterns whose points are coincident are the same pattern; they have the same shape. Those whose points are near each other in space have similar shapes. Because the Euclidean distance between the points representing suture patterns is a reflection of their similarity, comparison of these distances is a comparison of suture patterns. This difference can be demonstrated by varying the amplitudes of fossil suture patterns (Scaphites, Figure 4) to generate suture patterns that can then 7 GILDNER: FOURIER ANALYSIS OF AMMONOID SUTURES FIGURE 7. Suture patterns for stages in an ontogenetic series of Strenoceras (7a) and Scaphites (7b) reconstructed with the first 16 frequencies (left), and with all frequencies (right). The similarity between each of the stages shows that the fundamental shape of the suture pattern is conserved and can be extracted using Fourier series. be compared to the original: the greater the difference in power, the greater the difference in shape. The Euclidean distance between points is C= N −1 ∑( A ( i ) − B (i ) ) +( A ( i ) − B (i ) ) 2 h h φ φ 2 6. i =0 where C is the distance between the points, and A(i) and B(i) are the amplitudes of the ith frequencies for the two suture patterns. A dendrogram of nearest neighbors can be created from the distances (Figure 8). The taxa used in this study are not meant to be exhaustive, but were chosen to capture a range of suture shapes. Five relatively simple nautilitic suture patterns were chosen: Agoniatites, Anetoceras, Bactrites, Cyrtobactrites, and Mimagoniatites. Seven (or eight if Scaphites and Strenoceras are counted separately?) more complex suture patterns were chosen: Chelinoceras, Diabologoceras, Douvilleiceras, Hamites, Leptoceras, Paraspiticeras, Scaphites, and Strenoceras. The ontogenetic series of Scaphites and Strenoceras used in the analysis above were included, with each stage of the series treated as a separate suture pattern. Among these taxa, Agoniatites, Anetoceras, and Mimagoniatites are agoniatitid genera, Bactrites and Cyrtobactrites are bactritid genera, and Douvilleiceras, Cheloniceras, and Paraspiticeras are douvilleiceratid genera; other families are represented by single taxa. All genera are currently assigned to the ammonoids (Order Ammonoidea Zittel, 1884). Euclidean distance between the points representing suture patterns will not necessarily be a very sensitive indicator of similarity between suture shape. As seen earlier, the shape of a suture pattern is conserved if all amplitudes are scaled equally. A greater distance than one might expect from a visual examination separates the points for these similar suture patterns. The general shape of the suture pattern is preserved in the relative amplitudes between frequencies, not in their absolute magnitude. That is, the general shape of the suture pattern is recorded in the orientation of the vector, not its magnitude. The distance-based dendrogram reflects this insensitivity. Although there is an apparent visual pattern in the tree, the bactritids, douvilleiceratids and ontogentic series are split between different branches, separated by the suture patterns of more distantly related taxa. Only the suture patterns of the agoniatitids are grouped into the same branch of the dendrogram. This moderate success is lessened by the placement of the agoniatitids among the other taxa. The orientations of the vectors can be more sensitive indicators of the similarity between suture patterns. The orientations can be compared by examining the angle between the vectors representing them. The Cosine Law resolves the angle between two suture patterns (A and B) and origin as: 2 2 2 A B C + − ∆ = cos AB −1 7. where delta is the angle between the two suture patterns, A and B are the magnitudes of the vectors (equal to the square root of Power(All) for each), and C is the distance between the endpoints 8 GILDNER: FOURIER ANALYSIS OF AMMONOID SUTURES FIGURE 8. Dendrogram of similarity between suture patterns, based on Euclidean distance between points representing the sutures in multidimensional space. Related taxa are coded by colored boxes: douvilleiceratids - white with black border, bactritids - yellow, agoniatitids - green, Scaphites - red, and Strenoceras - blue. Suture patterns included are Agoniatites (Agon), Anetoceras (Anet), Bactrites (Bact), Cyrtobactrites (Cyrt) and Mimagoniatites (Mima), Chelinoceras (Chel), Douvilleiceras (Douv), Hamites (Hami), Leptoceras (Lept), Paraspiticeras (Para), Scaphites (Scap) and Strenoceras (Stren). The numbers after Scaphites and Strenoceras refer to the position in the ontogenetic series with 1 being earliest. of the vectors, and is the same distance that is used to compare suture patterns by Euclidean distance. As with Euclidean distances, a dendrogram of nearest angular neighbors can be created (Figure 9). The dendrogram based on angles is similar in FIGURE 9. Dendrogram of similarity between suture patterns, based on angular distance between points representing the sutures in multidimensional space. Related taxa are coded by colored boxes: douvilleiceratids - white with black border, bactritids - yellow, agoniatitids - green, Scaphites - red, and Strenoceras - blue. Suture patterns included are Agoniatites (Agon), Anetoceras (Anet), Bactrites (Bact), Cyrtobactrites (Cyrt) and Mimagoniatites (Mima), Chelinoceras (Chel), Douvilleiceras (Douv), Hamites (Hami), Leptoceras (Lept), Paraspiticeras (Para), Scaphites (Scap) and Strenoceras (Stren). The numbers after Scaphites and Strenoceras refer to the position in the ontogenetic series with 1 being earliest. some ways to the distance-based dendrogram, but in other ways is significantly different. The agoniatitids remain collected into the same branch, and the bactritids, douvilleiceratids and ontogenetic series of Scaphites remain separated. However, 9 GILDNER: FOURIER ANALYSIS OF AMMONOID SUTURES the ontogenetic series of Strenoceras is now grouped together in the same branch. In addition, the agoniatitids are now separated from the other taxa at a much higher level, indicating that the difference in their shape compared to the shape of the other taxa is more significant. The ontogenetic series of Strenoceras was easily grouped into one cluster using the angular measure, but not using Euclidean distance. Even though the first, youngest suture in the series is very “simple,” clustering by angle tightly groups it with the rest of the taxon. The ontogenetic series of Scaphites is not grouped using either Euclidean distance nor angular measures of similarity, although clustering is more complete using the angular measure. In both instances, the douvilleiceratids Douvilleiceras and Chelinoceras are grouped closely, but separated from the other douvilliceratid Paraspiticeras. In neither case does the nearest-neighbor dendrogram accurately reflect taxonomy. This lack of correlation is not surprising, because it has been shown that determining taxonomic relationships requires examination of both the patterns and their ontogenetic development (House 1980, Wiedmann and Kullman 1980). The effort reinforces common knowledge: that similarity of suture shape alone, without regard to the shapes ontogeny, is not sufficient for unraveling the phylogeny of the ammonoids. more accurate data and data from more taxa. Data for this study were manually digitized, scanned images of photocopies of published suture patterns. These images have gone through a number of reproductions before being digitized for the raw data used for the Fourier analysis, and an unknown amount of error has been introduced at each step. The accuracy and precision of published images of suture patterns is variable. Use of original suture tracings, rather than mass-produced images, would improve the reliability of the results of analyses such as this study. More accurate yet would be data collected directly from the specimen, using precision systems such as three-dimensional point-digitizing arms (Lyons et al. 2000; Wilhite 2002). Along with applications in the study of suture patterns, a quantitative description of suture patterns has benefit for digital records. The amplitudes of a Fourier series can be stored in a surprisingly small amount of data. For moderately complex suture patterns such as that of Strenoceras, the amount is only 1 or 2 kilobytes (depending on whether single or double precision numbers are used). This size issue is an important consideration for the electronic communication of suture patterns and in the memory demands for computerized databases, such as Ammon (Liang and Smith 1997). The low data requirements could also prove useful for applications where the rate of data transfer is limited, such as the Internet. SUMMARY The analyses presented in this paper are preliminary efforts. The suture patterns used for analysis were chosen to test the reconstruction method, and not to resolve taxonomic or evolutionary questions. More complex analytical techniques would undoubtedly prove useful and informative. Combined with a model of the septum (Hammer 1999, Daniel et al. 1997, Hassan et al. 2002) and the outer shell (Raup 1967, Ackerly 1989, Okamoto 1988), the model of suture patterns presented here can be used to improve the accuracy of computational mechanical models. The model presented here does not include the expansion and curvature of the phragmacone, but treats the shell as a cylinder, as do many of the current mechanical models. However, it is possible to integrate it into a more realistic model of the ammonite shell and septa. This extension would allow study of the shell-suture-septa complex in a systemsapproach. A thorough test of the usefulness of Fourier analysis to the study of suture patterns must use ACKNOWLEDGMENTS I especially want to thank two anonymous reviewers of the submitted manuscript for their comments, some of which prevented me from making some simple and embarrassing errors. R. Kaesler, M. Foote, W. B. Saunders and Ø. Hammer provided information and feedback that helped develop the concept. E. G. Allen generously shared her knowledge and insight, above and beyond the pale. S. C. Ackerly originally directed my attention to the problem of quantifying suture patterns. Finally, R. Linsley’s simple question (“But what is it good for?”) greatly changed the direction of this research. REFERENCES Ackerly, S.C. 1989. Kinematics of accretionary shell growth, with examples from brachiopods and molluscs. Paleobiology, 15:147-164. Anstey, R.L., and Delmet, D.A. 1972. Genetic meaning of zooecial chamber shapes in fossil bryozoans: Fourier analysis. Science, 177:1000-1002. 10 GILDNER: FOURIER ANALYSIS OF AMMONOID SUTURES Anstey, R. L., and Delmet, D.A. 1973. Fourier analysis of zooecial shapes in fossil tubular bryozoans. Geological Society of America Bulletin, 84:1753-1764. Anstey, R.L., and Pachut, J.F. 1980. Fourier packing ordinate: A univariate size-independent measurement of polygonal packing variation in Paleozoic bryozoans. Mathematical Geology, 12:139-156. Anstey, R.L., Pachut, J.F., and Prezbindowski, D.R. 1976. Morphogenetic gradients in Paleozoic bryozoan colonies. Paleobiology, 2:131-146. Boyajian, G.E., and Lutz, T.M. 1992. Evolution of biological complexity and its relation to taxonomic longevity in the Ammonoidea. Geology, 20:983-986. Canfield, D.J., and Anstey, R.L. 1981. Harmonic analysis of cephalopod suture patterns. Mathematical Geology, 13:23-35. Daniel, T.L., Helmuth, B.S., Saunders, W.B., and Ward, P.D. 1997. Septal complexity in ammonoid cephalopods increased mechanical risk and limited depth. Paleobiology, 23:470-481. Foote, M. 1989. Perimeter-based Fourier analysis: A new morphometric method applied to the trilobite cranidium. Journal of Paleontology, 63:880-885. Foote, M. 1990. Nearest-neighbor analysis of trilobite morphospace. Systematic Zoology, 39:371-382. García-Ruíz, J.M., Checa, A., and Rivas, P. 1990. On the origin of ammonite sutures. Paleobiology, 16:349354. Gevirtz, J.L. 1976. Fourier analysis of bivalve outlines: Implications on evolution and autecology. Mathematical Geology, 8:151-163. Gildner, R.F., and Ackerly, S. 1985. A Fourier technique for studying ammonoid sutures. Geological Society of America Abstracts with Programs, 17:592. Hammer, Ø. 1999. The development of ammonoid septa: An epithelial invagination process controlled by morphogens? Historical Biology, 13:153-171. Hassan, M.A., Westermann, G.E.G., Hewitt, R.A., and Dokanish, M.A. 2002. Finite-element analysis of simulated ammonoid septa (extinct Cephalopoda): Septal and sutural complexities do not reduce strength. Paleobiology, 28:113-126. Hewitt, R.A., and Westermann, G.E.G. 1997. The mechanical significance of ammonoid septa with complex sutures. Lethaia, 30:205-212. Hewitt, R.A., and Westermann, G.E.G. 1986. Function of complexly fluted septa in ammonoid shells. I. Mechanical principles and functional models. Neues Jahrbuch fur Geologie und Palantologie Abhandlungen, 172:47-69. House, M.R. 1980. On the origin, classification and evolution of the early Ammonoidea, p. 3-36. In House, M. R. and Senior, J. R. (eds.), The Ammonoidea. Academic Press, London and New York. Jacobs, D.K. 1996. Chambered cephalopod shells, buoyancy, structure and decoupling: History and red herrings. Palaios, 11:610-614. Kaesler, R.L., and Waters, J.A. 1972. Fourier analysis of the ostracode margin. Geological Society of America Bulletin, 83:1169-1178. Lewy, Z. 2002. The function of ammonite fluted septal margins. Journal of Paleontology, 76:63-69. Liang, B., and Smith, P.L. 1997. The Jurassic image database 'Ammon.' Palaeontology, 40:99-112. Lutz, T. M., and Boyajian, G. E. 1995. Fractal geometry of ammonoid sutures. Paleobiology, 21:329-342. Lyons, Patrick D., Rioux, Marc, and Patterson, R. Timothy . 2000. Application of a Three-Dimensional Color Laser Scanner to Paleontology: an Interactive Model of a Juvenile Tylosaurus sp. Basisphenoid-Basioccipital. Palaeontologia Electronica, 3: 16, 2.04MB. http:// palaeo-electronica.org/2000_2/mosasaur/ issue2_00.htm McShea, D.W. 1991. Complexity and evolution: What everybody knows. Biology and Philosophy, 6:303324. Okamoto, T. 1988. Analysis of heteromorph ammonoids by differential geometry. Palaeontology, 31:35-52. Olóriz, F., and Palmqvist, P. 1995. Sutural complexity and bathymetry in ammonites: fact or artifact? Lethaia, 28:167-170. Olóriz, F., Palmqvist, P., and PérezClaros, J.A. 1997. Shell features, main colonized environments, and fractal analysis of sutures in Late Jurassic ammonites. Lethaia, 30:191-204. Olóriz, F., Palmqvist, P., and PérezClaros, J.A. 2002. Morphostructural constraints and phylogenetic overprint on sutural frilling in Late Jurassic ammonites. Lethaia, 35:158-168. Olóriz, F., Palmqvist, P., and Pérez-Claros, J.A. 1999. Recent advances in morphometric approaches to covariation of shell features and the complexity of suture lines in late Jurassic ammonites, with reference to the major environments colonized, p. 273294. In F. Olóriz and F.J. Rodríguez-Tovar, (eds.), Advancing Research on Living and Fossil Cephalopods. Plenum Press, New York. Pachner, J. 1984. Handbook of Numerical Analysis Applications. McGraw-Hill, New York, New York. Palmqvist, P., PérezClaros, J.A., Gibert, J., and Santamaría, J.L. 1996. Comparative morphometric study of a human phalanx from the lower Pleistocene site at Cueva Victoria (Murcia, Spain), by means of Fourier analysis, shape coordinates of landmarks, principal and relative warps. Journal of Archaeological Science, 23:95-107. Raup, D.M. 1967. Geometric analysis of shell coiling: Coiling in ammonoids. Journal of Paleontology, 41:43-65. Reyment, R.A. 1958. Some factors in the distribution of fossil cephalopods. Stockholm Contributions to Geology, 1:97-184. Saunders, W.B. 1995. The ammonoid suture problem: Relationships between shell and septal thickness and sutural complexity in Paleozoic ammonoids. Paleobiology, 21:343-355. Saunders, W.B., and Work, D.M. 1996. Shell morphology and suture complexity in Upper Carboniferous ammonoids. Paleobiology, 22:189-218. 11 GILDNER: FOURIER ANALYSIS OF AMMONOID SUTURES Saunders, W.B. and Work, D.M. 1997. Evolution of shell morphology and suture complexity in Paleozoic prolecanitids, the rootstock of Mesozoic ammonoids. Paleobiology, 23:301-325. Seilacher, A. and LaBarbera, M. 1995. Ammonites as Cartesian Divers. Palaios, 10:493-506. Ward, P. 1980. Comparative shell shape distributions in Jurassic-Cretaceous ammonites and Jurassic-Tertiary nautilids. Paleobiology, 6:32-43. Weidmann, J. and Kullmann, J. 1980. Ammonoid sutures in ontogeny and phylogeny, p. 215-255. In House, M.R. and Senior, J.R. (eds.), The Ammonoidea. Academic Press, London and New York. Weidmann, J. 1969. The heteromorphs and ammonoid extinction. Biological Review, 44:563-602. Westermann, G.E.G. 1971. Form, structure and function of shell and siphuncle in coiled Mesozoic ammonoids. Life Science Contributions of the Royal Ontario Museum, 78:1-39. Westermann, G.E.G. 1996. Ammonoid life and habitat, p. 608-710. In Landman, N. H., Tanabe, K. and Davis, R. A., (eds.), Ammonoid Paleobiology. Plenum Press, New York, New York. Westermann, G.E.G. and Tsujita, C.J. 1999. Life habits of ammonoids, p. 299-325. In Savazzi, E. (ed.), Functional Morphology of the Invertebrate Skeleton. John Wiley and Sons, Chichester. Wilhite, Ray. 2003. Digitizing Large Fossil Skeletal Elements for Three-Dimensional Applications. Palaeontologia Electronica, 5: 10, 619KB. http://wwwodp.tamu.edu/paleo/2002_2/scan/issue2_02.htm 12


© Copyright 2026