
Aurea Consulting Company_WMP_Draft_2 - UBC Blogs
2015 Woodlot 1699 Management Plan Noah Steinberg, Jordan Yano, Paul Shives, Luke Weyman and Adam Wu Aurea Consulting Company: A Student Initiative 3/26/2015 Preface: The Aurea Consulting Company would like to extend gratitude to Chartwell Consultants Ltd., for providing their time, resources, data and personnel for this project. All information and management strategies produced in this plan are available for use. It must be acknowledged that the members of the Aurea Consulting team were under considerable time and resource constraints during plan creation. Aurea would like to acknowledge the following people for donating their time and support over the past three months: Gary Bull, Verena Griess, Kyle Lockhead, Yuhau Lu, Steve Mitchell, Cheryl Powers, Paul Wood, Bruce Larson and Harry Nelson of the University of British Columbia. We would also like to acknowledge Cosman Man, and Ken Fairhurst for their dedication and help in producing visualization data and carbon budgeting. Finally, we would like to thank and acknowledge Rob Deines of Chatwell Consultants Ltd. for his dedication to this management plan. Executive Summary: This management plan was created to provide the client, Chartwell Consultants Ltd., with several alternative forest management scenarios for Woodlot 1699. This woodlot is a product of the BC Liberal’s 2003 Forestry Revitalization Plan. This plan, among other things, identified a strategy to reallocate 20% of the replaceable tenures in the province to more small- and medium-scale tenures, including woodlots. It was in 2006 when the pre-existing Timber Sale Licence in the area was converted to Woodlot 1699, with the initial licensee being Scott Paper Ltd. (now Kruger Products). Although Scott Paper never harvested in the woodlot during their term as licensee, the majority of the woodlot area is second growth, a result from intensive logging in the 1950’s and earlier. Now owned by our client, Woodlot 1699 is located near the small resort town of Harrison Hot Springs in BC’s Fraser Valley. A baseline scenario and four alternative forest management scenarios were modelled for, with three of the scenarios attempting to justify an increase to the woodlot’s AAC and another scenario exploring the possibility of managing the entire woodlot for carbon sequestration. These scenarios were evaluated based on the tenets of sustainable forest management, which involves managing a forested estate for social, environmental and economic objectives. To reflect our client’s objectives, the scenarios’ evaluation scheme placed a higher weight on economic returns. Aurea Consulting recommends that the scenario involving increasing the AAC through a fertilization application and a 20m no harvest buffer around all streams would be the best forest management scenario to satisfy the unique objectives of our client as well as the ideals of sustainable forest management. i|P age Table of Contents Preface: .................................................................................................................................................... i Executive Summary: ................................................................................................................................. i List of Tables .......................................................................................................................................... vi List of Figures ........................................................................................................................................ vii 1.0 Introduction: ..................................................................................................................................... 1 1.1 Purpose: ........................................................................................................................................ 1 1.2 Project Area: .................................................................................................................................. 2 1.2.1 Location: ................................................................................................................................. 2 1.2.2 Timber Supply: ........................................................................................................................ 3 1.2.3 Topography: ............................................................................................................................ 5 1.2.4 Geology and Soils: ................................................................................................................... 5 1.2.5 Ecosystem: .............................................................................................................................. 5 1.3 Management Philosophy: .............................................................................................................. 6 1.4 Sustainable Forest Management: ................................................................................................... 6 1.5 Management Constraints:.............................................................................................................. 7 1.5.1 Visual Quality Objectives (VQO): ............................................................................................. 7 1.5.2 Pacific Water Shrew (Sorex bendirii) ........................................................................................ 8 1.6 Management Plan Operations: ...................................................................................................... 8 2.0 Goals & Indicators for Sustainable Forest Management ..................................................................... 9 2.1 G&I Framework: ............................................................................................................................ 9 2.2 Goals & Indicators for Woodlot 1699 Management: .................................................................... 11 2.2.1 Biodiversity: .......................................................................................................................... 11 2.2.2 Water:................................................................................................................................... 12 2.2.3 Soils: ..................................................................................................................................... 13 2.2.4 Fish/Riparian: ........................................................................................................................ 14 2.2.5 Wildlife: ................................................................................................................................ 16 2.2.6 Carbon: ................................................................................................................................. 17 2.2.7 Timber: ................................................................................................................................. 17 2.2.8 Recreation: ........................................................................................................................... 18 ii | P a g e 2.2.9 Cultural Heritage: .................................................................................................................. 19 2.2.10 Visual Quality: ..................................................................................................................... 21 2.2.11 Legal Obligation: ................................................................................................................. 22 2.2 Management Strategies: ........................................................................................................ 22 3.0 Scenario Modelling .......................................................................................................................... 23 3.1 Modelling Software...................................................................................................................... 23 3.1.1 FPS-ATLAS ............................................................................................................................. 23 3.1.2 CBM-CFS3 ............................................................................................................................. 23 3.2 General Modelling Assumptions .................................................................................................. 24 3.3 Forest Management Scenarios ..................................................................................................... 25 3.3.1 Base Case Scenario................................................................................................................ 27 3.3.2 Maximum Harvest Scenario................................................................................................... 27 3.3.3 Maximum Harvest with Fertilization Scenario........................................................................ 27 3.3.4 Maximum Harvest with fertilization and genetic gain scenario .............................................. 29 3.3.5 No Harvest for Carbon Scenario ............................................................................................ 29 3.4 Modelling Results ........................................................................................................................ 29 3.4.1 Harvested volume ................................................................................................................. 30 3.4.2 Species harvested ................................................................................................................. 31 3.4.3 Growing Stock ....................................................................................................................... 33 4.0 Comparative Analysis of Scenarios: .................................................................................................. 35 4.1 Value Satisfaction Ranking: .......................................................................................................... 35 4.1.1 Biodiversity: .......................................................................................................................... 36 4.1.2 Water:................................................................................................................................... 36 4.1.3 Soils: ..................................................................................................................................... 37 4.1.4 Fish/Riparian: ........................................................................................................................ 37 4.1.5 Wildlife: ................................................................................................................................ 37 4.1.6 Carbon: ................................................................................................................................. 37 4.1.7 Timber: ................................................................................................................................. 37 4.1.8 Recreation: ........................................................................................................................... 38 4.1.9 Cultural Heritage: .................................................................................................................. 38 iii | P a g e 4.1.10 Visual Quality: ..................................................................................................................... 38 4.1.11 Legal Obligation: ................................................................................................................. 38 4.2 Economic Satisfaction Ranking: .................................................................................................... 39 5.0 Recommendations: .......................................................................................................................... 40 5.1 Rationale: .................................................................................................................................... 41 Bibliography .......................................................................................................................................... 42 Appendix A – Glossary of Terms and Abbreviations ............................................................................... 45 Abbreviations .................................................................................................................................... 45 Glossary of Terms .............................................................................................................................. 46 Appendix B – Pacific Water Shrew Best Management Practices ............................................................. 47 Habitat: ............................................................................................................................................. 47 Habitat Protection: ............................................................................................................................ 48 Watercourse and Wetland Crossings: ................................................................................................ 48 Results Based Management:.............................................................................................................. 49 Appendix C – Visual Quality Assessments .............................................................................................. 50 Appendix D – FSC Principles Means to Address Table............................................................................. 53 Appendix E – Management Strategies ................................................................................................... 64 E1 – Economic Viability Strategy ........................................................................................................ 64 E2 – First Nations Consultation and Accommodation Strategy ........................................................... 65 E3 – Fish and Wildlife Strategy ........................................................................................................... 66 E4 – High Conservation Value Forest (HCVF) Strategy ........................................................................ 67 E5 – Legal Compliance Strategy ......................................................................................................... 68 E6 – Regeneration Strategy................................................................................................................ 69 E7 – Riparian Zone Strategy ............................................................................................................... 70 E8 – Stakeholder Engagement Strategy.............................................................................................. 71 E9 – Visual Quality Strategy ............................................................................................................... 72 E10 – Water Resource Management Strategy .................................................................................... 73 Appendix F – Carbon Modelling and the F2C Tool .................................................................................. 74 Appendix G – Minimum Harvestable Age by Stand Group ...................................................................... 76 Appendix H – Age Class Distribution Through Time ................................................................................ 77 iv | P a g e H1 Base case Scenario ....................................................................................................................... 77 H2 Max Harvest with Fertilization Scenario ........................................................................................ 79 H3 No Harvest - Carbon Scenario ....................................................................................................... 81 Appendix I – Financial Evaluations ......................................................................................................... 83 I1 Base Case Scenario: ....................................................................................................................... 83 I2 Maximum Harvest Scenario: .......................................................................................................... 85 I3 Maximum Harvest Fertilization Scenario: ....................................................................................... 87 I4 Cost of Fertilizer:............................................................................................................................ 88 I5 Genetic Gain Seed Scenario: .......................................................................................................... 89 I6 No Harvest Carbon Scenario: ......................................................................................................... 90 Appendix J – Average Stumpage Rates................................................................................................... 91 v|P ag e List of Tables Table 1: THLB (Operable and Inoperable) by Primary Species within Stands and % Area Coverage ........... 4 Table 2: Definitions for Goals and Indicators Framework. ........................................................................ 9 Table 3: Comparison between the Aurea Consulting goals and FSC principles. ....................................... 10 Table 4: Biodiversity goals, indicators, targets and associated strategies ............................................... 12 Table 5: Water resource management goals, indicators, targets and associated strategies .................... 13 Table 6: Soil management goals, indicators, targets and associated strategies ....................................... 14 Table 7: Fish and Riparian zone management goals, indicators, targets and associated strategies ......... 15 Table 8: Wildlife management goals, indicators, targets and associated strategies ................................ 16 Table 9: Carbon management goals, indicators, targets and associated strategies ................................. 17 Table 10: Timber management goals, indicators, targets and associated strategies ............................... 18 Table 11: Recreation management goals, indicators, targets and associated strategies ......................... 19 Table 12: Cultural Heritage management goals, indicators, targets and associated strategies ................ 20 Table 13: Visual Quality management goals, indicators, targets and associated strategies ..................... 21 Table 14: Legal Obligation management goals, indicators, targets and associated strategies ................. 22 Table 15: General modelling assumptions.............................................................................................. 24 Table 16: Management plan scenario descriptions ................................................................................ 25 Table 17: Constraint table for all management plan scenario modelling ................................................ 26 Table 18: Long Run Sustained Yield (LRSY) of each modelled scenario and the variation from the Base Case ...................................................................................................................................................... 30 Table 19: Ranking System ...................................................................................................................... 35 Table 20: Management Plan Scenario Ranking ....................................................................................... 36 Table 21: Economic output of each scenario modelled .......................................................................... 40 Table 22: Final scenario comparison and ranking ................................................................................... 40 Table 23: FSC principles and the associated criteria and how the management plan addresses them. ... 53 Table 24: Minimum harvestable age separated by stand group code, defined in table E 2 ..................... 76 Table 25: Description of stand group 3 digit code .................................................................................. 76 Table 26: Cost for fertilizer .................................................................................................................... 88 Table 27: Carbon Credit Revenue and Cost Calculations......................................................................... 90 Table 28: Average stumpage rates for the Chilliwack Forest District (adapted from the Coast Appraisal Manual, 2014) ....................................................................................................................................... 91 vi | P a g e List of Figures Figure 1: Location map of Woodlot 1699 ................................................................................................. 2 Figure 2: Age class distribution for Woodlot 1699 .................................................................................... 3 Figure 3: Image displaying the various topography of teh woodlot. Darker colours indicate more slope, and lighter indicate closer to horizontal slope.......................................................................................... 5 Figure 4: Alteration of 4.23% in the Partial Retention VQO polygon viewed from the marina site on Harrison Lake .......................................................................................................................................... 7 Figure 5: Sts’ailes Traditional Territory and the location of Woodlot 1699 (Sts'ailes Band, 2010a). ......... 19 Figure 6: Modelling methods for applying fertilization to natural stands using VDYP.............................. 28 Figure 7: Long Run Sustained Yield (LRSY) of each modelled scenario .................................................... 31 Figure 8: Harvested volumes by species in the Base Case Scenario ........................................................ 32 Figure 9: Harvested volumes by species in the Maximum Harvest Scenario ........................................... 33 Figure 10: Non-reserve growing stock of all scenarios ............................................................................ 34 Figure 11: Total growing stock of all scenarios ....................................................................................... 34 Figure 12: Placing a tree in Arc-Scene. Note that the 3D Graphics toolbar is selected in the top right corner and the last tree placed has a white 3-D box around it. .............................................................. 50 Figure 13: Areas shown as total visual landscape area (in red) and effect from harvest operations (in yellow) .................................................................................................................................................. 51 Figure 14 Map showing the two different visual classifications on in the woodlot. R is retention and PR is partial retention visual constraints. ....................................................................................................... 52 Figure 15: Age class distribution throughout management activities in the Base Case Scenario ............. 77 Figure 16: Age class distribution throughout management activities in the Maximum Harvest Fertilization Scenario ................................................................................................................................................ 79 Figure 17: Age class distribution where no harvest occurs ..................................................................... 81 Figure 18: Base Case Revenue Calculations ............................................................................................ 83 Figure 19: Base Case Cost Calculations................................................................................................... 84 Figure 20: Maximum Harvest Revenue Calculations ............................................................................... 85 Figure 21: Maximum Harvest Cost Calculations ..................................................................................... 86 Figure 22: Maximum Harvest Fertilization Revenue Calculations ........................................................... 87 Figure 23: Maximum Harvest Fertilization Cost Calculations .................................................................. 88 Figure 24: Genetic Gain Scenario Revenue Calculation........................................................................... 89 Figure 25: Genetic Gain Scenario Cost Calculation ................................................................................. 90 vii | P a g e 1.0 Introduction: In 2014, Chartwell Consultants Ltd. purchased Woodlot 1699, a 670 ha Woodlot located in the West Harrison Landscape Unit of the Chilliwack Forest District. A Woodlot License is “a legal agreement that grants the license holder exclusive rights to manage and harvest crown timber within the Woodlot license area” (Ministry of Forests, Lands and Natural Resource Operations, 2014). The Woodlot is held under a 20 year license, with the ability to renew every ten years. Chartwell Consultants Ltd. is currently harvesting a five year cut control within the Woodlot boundary. Established in 2000, Chartwell Consultants Ltd. is a multifaceted natural resources consulting company based out of North Vancouver, BC. Chartwell’s focus includes professional forestry, visual impact analysis, project management, road management and mapping. As a SAFE Certified Company, Chartwell Consultants exemplifies safety and professionalism in the resource sectors of BC. Their vision is to deliver the best possible customer service and the highest quality products to all clients. Recent expansions into LiDAR projects, inclusion of new clients, and the purchase of two Woodlots in the Chilliwack Forest District have increased Chartwell’s commitment to outstanding quality and growth for the future. 1.1 Purpose: Woodlot 1699 provides a diverse array of values to its many stakeholders. The purpose of this management plan is to compare and contrast several alternative management scenarios for the Woodlot. They will be compared to the baseline, a “business-as-usual” model based on the current Woodlot Management Plan (WMP). With the aid of the Forest Planning Studio (FPS) modelling software FPS-ATLAS, the effects of these scenarios on harvesting levels will be modelled. It will be imperative to balance the demands of societal and ecological needs with the economic benefits to the client due to adjacent First Nations lands and provincial recreation sites. Prior to 2006, the Woodlot area was initially Timber Sale Licence A20475; however strategies within the Forestry Revitalization Plan contributed to converting the timber sale licence to a Woodlot licence. Initially owned by Kruger Forest Products, Woodlot #1699 was sold to Chartwell in late 2014. No harvesting occurred during Kruger’s tenure. 1|P a ge Aurea Consulting, a student initiative believes that working towards meeting the Forest Stewardship Council (FSC) management certification scheme will contribute to sustainably managing the land base. The FSC standards closely parallel the objectives of Ecosystem Based Management (EBM), and therefore utilizing these standards would be beneficial to both the client, and the values considered in the Forest and Range Practices Act (FRPA). The main objective for the Client is to produce maximum revenue from management activities, while ensuring FRPA values are maintained. 1.2 Project Area: 1.2.1 Location: Woodlot # 1699 is located ~4.5km up the Harrison mainline, off of Highway 7 in Harrison Mills, BC. The woodlot license area includes a non-timber harvesting land base (NTHLB) of 85 ha, and a timber harvesting land base (THLB) of 585 ha. The total area is 670 ha (Kruger Products, 2006). The area is heavily used by recreationalists visiting one of the many campsites and resorts in the area. The Harrison mainline accesses Lillooet Lake, and many other drainages utilized by other forest managers. BCTS and BC Hydro both operate adjacent to the Woodlot location. Figure 1: Location map of Woodlot 1699 2|P a ge The Sts’ailes First Nations traditional territory is located along Harrison Lake. Currently, the Aboriginal group operates tenure adjacent to the southern portion of the Woodlot. Access agreements with the Sts’ailes and the client already exist. 1.2.2 Timber Supply: The Timber Harvesting Land Base (THLB) represents 87% of the total Woodlot Licence Area. As calculated in 2006, 57% of the available timber is the in age class of 41-60, 7% is in age class 61-80, 14% is in the 81-120 age class and the remaining 21% is in age class 121+ (Figure 1). The AAC of the Woodlot is currently scheduled as 1,777 m3/year, as calculated in the 2006 Timber Supply Review (O'Connor, 2007). After purchase, Chartwell recalculated a potential AAC, estimating an appropriate level of harvest to be ~3400 m3/year. The assessment completed in this plan identified alternative AAC estimations for each scenario. Figure 2: Age class distribution for Woodlot 1699 The dominant species is Douglas fir (Pseudotsuga menzeizii), with an abundant component of Western hemlock (Tsuga occidentalis) and Western redcedar (Thuja plicata). Distribution of species is determined by considering the leading species area allocations. Some hardwood species exist in the Woodlot, cumulatively representing 4.62% of the timber resources. Utilizing spatial data, the area of each species and their associated percentage of the total area is calculated (Table 1). 3|P a ge Table 1: THLB (Operable and Inoperable) by Primary Species within Stands and % Area Coverage Species (Common Name) Western Red Cedar Red Alder Douglas Fir Coastal Douglas Fir Western Hemlock Bigleaf Maple Lodgepole Pine Willow Grand Total Area (ha) Percentage (%) 55.41 8.27% 1.16 0.17% 465.27 69.43% 0.20 0.03% 103.16 15.40% 22.67 3.38% 15.02 2.24% 7.19 1.07% 670.08 100.00% The forests in Woodlot 1699 consist almost completely of second growth stands. The Woodlot timber supply was harvested approximately 60 years ago, creating stands of naturally regenerating stock. The main disturbance regimes in the management unit are wind and landslides. Large fires are very rare in the region. In past timber supply reviews, the level of disturbance identified was “greater than actually experienced” (Pedersen, 2004), encouraging growth of young stands. 4|P a ge 1.2.3 Topography: The topography within the West Harrison landscape unit has a mixture of ground-based and cable operating areas. Within Woodlot 1699, the topography is mixed, with sections of class 4 and class 5 terrains (>60%), and a mixture of ground-based harvest areas (<30%). The Woodlot is located directly above Harrison Lake, with gentle slopes in the higher elevation portions of the license area. Figure 3: Image displaying the various topography of teh woodlot. Darker colours indicate more slope, and lighter indicate closer to horizontal slope. 1.2.4 Geology and Soils: The soils in Woodlot #1699 are generally composed of rich and dry soil nutrient and soil moisture regimes respectively. Many areas were identified to have limestone bedrock, resulting in basic soils appropriate for Western redcedar growth. The substrate is excellent for road construction, with large conglomerates of substrate present in the soils. Identified concern for road building on sites with class 4 and class 5 terrain exist, and therefore require a geotechnical assessment prior to approving any construction. 1.2.5 Ecosystem: The Biogeoclimatic ecosystem (BEC) zone located within Woodlot 1699 is the Coastal Western Hemlock (CWH). The subzone of the CWH is the dry maritime (dm), which varies from very dry, rich sites, to very rich, wet sites. The dm subzone “supports the most productive tree growth of Douglas-fir and redcedar” (Klinka, Chourmouzis, & Varga, 2005). Common tree species within the Woodlot include Douglas-fir 5|P a ge (Pseudotsuga menziesii), Western hemlock (Tsuga heterophylla), Western redcedar (Thuja plicata), and Red alder (Alnus rubra). 1.3 Management Philosophy: Aurea Consulting Company’s management plan is designed to strategically develop the Woodlot area. Through consultation with Chartwell, three scenarios to improve economic output from the Woodlot and one scenario to assess the areas potential for carbon sequestration have been produced. The baseline will be used to compare each of the four scenarios to the current management regime. The four scenarios in this plan include a maximum harvest scenario, fertilization scenario, +Seed scenario and a no harvest scenario. Chartwell Consultants currently use a Woodlot License Management Plan, developed in 2007 by Phil O’Connor, RPF. This management plan includes the licensee’s goals and commitments, as well as resource inventories and calculation of the Allowable Annual Cut (AAC). Balancing old growth management areas (OGMA), recreation resources and water resources with economic optimization is a requirement of the current management plan. The client’s current goals are (O'Connor, 2007): To develop and manage this Woodlot utilizing strategies and techniques reflecting the principles of sustainable development To develop the forest resources of this Woodlot in a manner that provides the greatest financial return to the company To ensure development of the Woodlot is done so in full compliance with all current Provincial and Federal legislation 1.4 Sustainable Forest Management: The Aurea Consulting team is determined to manage the Woodlot resources in a sustainable manner. Sustainable Forest Management (SFM) is “a system that works to meet society’s needs for maintaining a vibrant forest economy while protecting the health of forested lands and maximizing the many environmental and social benefits we value those lands for” (Natural Resources Canada, 2014). This forest management philosophy utilizes evaluation and adjustments of forest practices to ensure balance in management activities. 6|P a ge The use of adaptive management ensures that criteria for sustainable forest management “reflect[s] the national context and the specific ecological and environmental conditions, as well as social, economic, political, cultural and spiritual dimensions” (PEFC, 2015). Aurea plans to meet this requirement for sustainably managing the land base by assessing, monitoring and improving goals, indicators, targets and strategies as required during management activities. 1.5 Management Constraints: 1.5.1 Visual Quality Objectives (VQO): Due to the adjacency of the Harrison lake area, visual quality must be considered in woodlot #1699. Currently, there are seven different visual quality polygons within the boundaries of the woodlot, most of which are listed as partial retention with one retention. The current ministry legislation surrounding a partial retention states that the maximum percent of visual alteration to the landscape is 7% where retention is set at 1.5%. An exact definition taken from the Ministry of Forests, Lands and Natural Resource Operations (MFLNRO) “Guide to Visual Quality Objectives” on partial retention objectives states the following, “Alteration is easy to see, small to medium in scale, and natural and not rectilinear or geometric in shape” (Ministry of Forests, Lands and Natural Resource Operations, 2013a). Within the retention visual polygon, there is a set of power lines that affect 3.04% of the landscape. With the maximum allowable landscape alteration set at 1.5% by ministry, Chartwell will have to apply for exemption status on any harvesting activities within the retention polygon, as the power lines are a preexisting disturbance that is out of Chartwell’s control. Figure 4: Alteration of 4.23% in the Partial Retention VQO polygon viewed from the marina site on Harrison Lake 7|P a ge 1.5.2 Pacific Water Shrew (Sorex bendirii) The Pacific Water Shrew is a semi-aquatic mammal that lives in riparian habitats around watercourses and wetlands of BC’s lower mainland. This species is designated as endangered by the Committee on the Status of Endangered Wildlife in Canada (COSEWIC) and is listed on Schedule 1 of the Species at Risk Act (SARA). With 11.8% of the management area encompassed within a potential WHA for Pacific Water Shrew, best management practices (BMP) will be applied to all potential habitat. Best Management Practices indicates that a 100m protective area should be established on all streams and wetlands (Appendix B). Conducting best management practices on the woodlot will also satisfy the habitat need for the Oregon Spotted Frog (Rana pretiosa), which has been noticed in the area. 1.6 Management Plan Operations: Woodlot # 1699 has the potential to provide high economic returns to the client, as well as ensuring sustainable management within the West Harrison landscape unit. The purpose of this forest management plan is to present management scenarios to optimize economic return and benefits to the client. In order to improve upon the current management plan, scenarios were designed to ensure the following forest management issues were addressed. 11.8% of the Woodlot 1699 area is proposed to be Wildlife Habitat Area (WHA) for Pacific Water Shrew, a red-listed species. 2 different visual quality objective (VQO) polygons classifications exist within Woodlot 1699 (Appendix C). Many areas with shallow soils and limestone bedrock limit rooting depth within Woodlot 1699. The current AAC is underrepresented for Woodlot 1699. Three scenarios will be modelled in attempt to alleviate the aforementioned forest management issues. A baseline scenario will be used to compare each alternative against the current management regime for the Woodlot. The main objective for Woodlot 1699 is to maximize revenue to the client by increasing the AAC. In order to increase the AAC, an intensive silviculture treatment for the Woodlot will be proposed. This will include fertilization and +Seed modelling. Based on reserve allocation, a valuation of potential revenue from carbon sequestration will be modelled. A comparative analysis will be used to determine the most profitable scenario, or combination of scenarios to be presented to the client for potential future use. 8|P a ge 2.0 Goals & Indicators for Sustainable Forest Management 2.1 G&I Framework: Developing Goals and indicators for the sustainable forest management of Woodlot 1699 considered the principles and criteria outlined by the Forest Stewardship Council (FSC). Indicators and targets relate to FSC principles in order to ensure sustainable management objectives are met. The goals and indicators outlined in the management plan aim to protect ecological, economic and social values, while ensuring maximum economic benefits to the Woodlot managers. Woodlot 1699 will not be certified due to the inability to meet some FSC requirements, and the size of the company. Considering this, the sustainable management plan will focus on meeting as many criteria from the FSC as possible (Table 3) ensuring the area is managed sustainably. Table 2 defines goals, indicators, targets and strategies of the management framework (Lisaak Forest Resources Ltd., 2011) Table 2: Definitions for Goals and Indicators Framework. Goal Indicator A category of conditions or A quantitative or processes by which Qualitative measure sustainable forest (measurement) of an management may be aspect of a goal which assessed and is can be measured or characterized by a set of described and which, related indicators that are when observed monitored periodically to periodically, will assess change. demonstrate trends. ** = Legislative Indicators; + = Modelled Indicators Target Strategy A clearly defined, quantitative statement describing the desired future state of an indicator within a defined period. Operational procedure that outlines methods for successful implementation of sustainable forest management. A strategy may be used in place of a target when targets are not feasible. To ensure sustainable management of the Woodlot, indicators for the various resources and values are identified. An indicator relates a goal to an attainable target, and states the measuring units for that target. The indicators will be assessed throughout the management activities, and will measure the success or failure of each goal. Targets describe the desired future condition of each value by quantifiably measuring the success of management activities by a defined date. Many of the targets were identified by considering the Forest and Range Practices Act (FRPA) Woodlot License Planning and Practices Regulations (WLPPR). In the event that specific targets are not identified, a strategy will be used to provide guidance towards 9|P a ge meeting each goal. A strategy is a document that provides a justification for certain management decisions, including a purpose to express how each strategy relates to an associated value, a rationale for management decisions and the steps towards sustainable management. The “means to address” the FSC principles and criteria are defined in appendix D. Each “means to address” value described relates directly to an indicator, target and/or strategy described below. The goals developed for managing Woodlot 1699 sustainably correspond with the FSC principles, as outlined in Table 3. Table 3: Comparison between the Aurea Consulting goals and FSC principles. Aurea Consultants Ltd. Goals FSC Principles Goal 1: Sustain biological richness, diversity and associated values. Principle 5: Benefits from the Forest Principle 6: Environmental Values and Impacts Principle 9: High Conservation Values Goal 2: Manage the associated attributes of Principle 3: Indigenous Peoples’ (IP) Rights unique and significant cultural, ecological and Principle 5: Benefits from the Forest spiritual values found in the forest. Principle 6: Environmental Values and Impacts Goal 3: Protect water quality and quantity in and Principle 6: Environmental Values and Impacts adjacent to the management unit Principle 9: High Conservation Values Goal 4: Protect and maintain soil quality and Principle 5: Benefits from the Forest productivity in the management unit. Principle 6: Environmental Values and Impacts Principle 9: High Conservation Values Goal 5: Maintain riparian ecosystems, including Principle 6: Environmental Values and Impacts their health and viability. Principle 7: Management Planning Goal 6: Maintain the viability of fish and associated Principle 5: Benefits from the Forest habitat. Principle 9: High Conservation Values Goal 7: Respect and protect wildlife and their Principle 5: Benefits from the Forest habitats throughout management activities. Principle 9: High Conservation Values Goal 8: Manage and work to protect rare and Principle 1: Compliance with Laws threatened species in and adjacent to the Principle 6: Environmental Values and Impacts management unit. Principle 9: High Conservation Values Goal 9: Ensure sustainable management of carbon Principle 5: Benefits from the Forest on the land base Goal 10: Improve and maintain the stand health Principle 6: Environmental Values and Impacts and vigour through forest management activities. Principle 8: Monitoring and Assessment Goal 11: Generate economic benefits through Principle 5: Benefits from the Forest management activities. Goal 12: Utilize public interest in forest Principle 2: Workers’ Rights and Employment management planning. Conditions Principle 4: Community Relations Goal 13: Establish mutually beneficial relationships Principle 3: Indigenous Peoples’ (IP) Rights 10 | P a g e Aurea Consultants Ltd. Goals with local First Nation Communities. Goal 14: Recognize and respect First Nations legal and customary rights Goal 15: Protect and identify culturally significant features. Goal 16: Respect and comply with all visual quality constraints on the land base. Goal 17: Respect all national, provincial and local laws throughout all management activities and operations. FSC Principles Principle 1: Compliance with Laws Principle 3: Indigenous Peoples’ (IP) Rights Principle 3: Indigenous Peoples’ (IP) Rights Principle 9: High Conservation Values Principle 1: Compliance with Laws Principle 10: Implementation of Management Activities Principle 1: Compliance with Laws Principle 7: Management Planning 2.2 Goals & Indicators for Woodlot 1699 Management: In producing a sustainable forest management plan (SFMP) for Woodlot 1699, ten FRPA values were identified. The following section discusses each value in relation to FSC principles and criteria, and outlines the goals, indicators, targets and strategies required to sustainably manage Woodlot 1699. 2.2.1 Biodiversity: As represented in FRPA, biodiversity is an essential component of managing forests sustainably. Biodiversity contributes to the ecological health of British Columbia’s forests, encompassing genetic diversity, species diversity and ecosystem diversity. The term is defined by the Ministry of Forests, Lands and Natural Resources Operations in the Biodiversity Guidebook as “the diversity of plants, animals and other living organisms in all their forms and levels of organization, and includes the diversity of genes, species and ecosystems, as well as the evolutionary and functional processes that link them” (Ministry of Forests and Range, 1995). With a variety of vegetation and a mix of both deciduous and coniferous tree species, Woodlot 1699 has a wide range of forest cover types falling within the CWH dry maritime BEC Subzone. Riparian and aquatic ecosystems exist in the area enabling a mixture of wildlife species to thrive. Recognizing the importance of maintaining biodiversity in all forested areas in British Columbia, the strategies outlined in this report utilize a coarse filter approach, unless management concerns warrant a fine filter approach (ie. The Pacific Water Shrew). The objective of ensuring biodiversity is to maintain suitable habitat conditions for all native animal and plant species in the region. 11 | P a g e Although only one BEC Subzone exists within Woodlot 1699, biodiversity will be maintained through managing for FRPA values (Table 4). These include the goals of maintaining wildlife tree retention areas, ensuring the maintenance of coarse woody debris, and establishing High Conservation Value Forest (HCVF) assessments. Table 4: Biodiversity goals, indicators, targets and associated strategies Goal Goal 1: Sustain biological richness, diversity and associated values. ** Indicator 1.1 Retention of wildlife trees (ha) 1.2 Coarse woody debris (m3/ha) Goal 2: Manage the associated attributes of unique and significant cultural, ecological and spiritual values found in the forest. ** 2.1 High Conservation Value Forests (HCVF) (% Change) Target Strategy 1.1.1 Maintain 8% of Woodlot license area as wildlife tree retention areas (ha) by September 30, 2020 1.2.1 Maintain a minimum of 4 logs/ha, each being at least 5m in length and 30cm in diameter (logs/ha) by September 30, 2020 2.1.1 Ensure 0% net loss of HCVF by September 30, 2020 HCVF Strategy 2.1.2 Identify HCVF prior to each 5 year cut control period 2.2.2 Water: Woodlot 1699 is located directly upslope from Harrison Lake, a highly used aquatic area adjacent to Harrison Mills, BC. Many tributaries run through the Woodlot, however no aquatic habitat exists for fish species. The aforementioned red listed species (Pacific Water Shrew and Oregon Spotted Frog) cohabitate in the aquatic ecosystems in the Woodlot. Management for these species requires a 100m buffer on all potential habitats. The Woodlot license plan (WLP) dictates the Woodlot to not be within community watersheds or fisheries sensitive watersheds, however, three water licensees are identified to be associated in the region. These include Brantsy Creek (domestic), Weaver Creek (conservation – use of water) and Drift Bolt Creek (power – residential). Management for water is focused on a coarse-filter approach, ensuring management activities adhere to the Water Act, and ensure the maintenance of water flowing through the management unit. Although road construction has occurred across some riparian areas in the management unit, an emphasis is placed on minimizing road building activities in areas adjacent to streams. Fertilization will also be restricted in aquatic zones to minimize impacts on water quality. The objective for water 12 | P a g e resource management within the Woodlot area is to maintain water quality and quantity throughout all management activities (Table 5). To ensure sustainable management throughout management activities, water quality assessment reports should be conducted prior to all harvest activities. These assessments should be updated prior to each 5 year cut control period, in order to monitor strategies and ensure compliance with associated regulations. Table 5: Water resource management goals, indicators, targets and associated strategies Goal Goal 3: Protect water quality and quantity in and adjacent to the management unit. ** Indicator Target 3.1 Road building activities in watershed areas (m) 3.1.1 Ensure no roads are within 100m upslope of a tributary of community watersheds by September 30, 2020 3.2.1 Ensure fertilizer is not used within 10m of a perennial stream by September 30, 2020 3.2 Use of fertilizer in watershed areas (m) 3.3 Protection of water quality (% Change) 3.4 Protection of water quantity (% Change) Strategy Water Resource Management Strategy Water Resource Management Strategy 2.2.3 Soils: Soils are a function of climatic, topographic and landform factors. Soils “support the growth of fibre and food; acts as a filter for air and water; affects global climate through gas exchange and storage; contains a diverse array of organisms (e.g., fungi, bacteria, insects, worms); and supports natural ecosystems and wildlife habitat” (Ministry of Environment, 2015a). Protection of soil resources is represented as a FRPA value, with practice regulations existing specifically for Woodlot management. Woodlot 1699 has no national soil data directly associated with it, but within the Canadian Soil Information System (CanSIS), there has been a pit dug just 900 m to the South East, with comparable soils. This site has been classified as a poignant modifier within CanSIS. This soil is described as an Orthic 13 | P a g e Humo-Ferric Podzol, with no water table present, and no root restricting layer until the bedrock (Agriculture and Agri-Food Canada, 2013). It is also noted that this soil has a high percent of colluvium and eolian deposited parent materials, causing the soil to drain quite rapidly. There are areas within the Woodlot with slopes >60%. These areas require the services of a geotechnical engineer, or other competent professional, prior to any management activities occurring. Restrictions on road construction or harvesting may be present due to the steep slope areas proximity to aquatic or riparian ecosystems. Based on the FRPA values, goals for soil management include minimizing disturbance area, limiting the amount of permanent structures and human induced landslide management, and revegetating of deactivated road areas (Table 6). The Woodlot License Planning and Practices Regulations state management targets for these goals. Table 6: Soil management goals, indicators, targets and associated strategies Goal Goal 4: Protect and maintain soil quality and productivity in the management unit. ** Indicator Target 4.1 Disturbance of soil in the Net Area to be Reforested (NAR) (ha) 4.2 Occupation of land by permanent structure (% net area harvested) 4.1.1 Maintain < 8% disturbance of the NAR. (ha) by January 2020 4.3 Harvest activities effect on landslide (% net area harvested) 4.4 Revegetation on deactivated and deconstructed roads (ha) Strategy 4.2.1 Ensure < 7% effective clear cut area (ECA) occupied by permanent structures by January 2020 4.3.1 Maintain 0% ECA affected by human induced landslides by January 2020 Regeneration Strategy 2.2.4 Fish/Riparian: No fish exist within the boundary of Woodlot 1699 due to the higher elevation of the site. Habitat Wizard identified Rainbow Trout (Oncorhynchus mykiss) as a species observed in one of the central lakes 14 | P a g e within the Woodlot in 2000 (Ministry of Environment, 2015b). No fish have been identified since, and it is believed that this previous sighting was not verified. The adjacent campgrounds (Wolfe Lake and Grace Lake) are both stocked with Rainbow Trout (Freshwater Fisheries Society of BC, 2014). Harrison Lake has a diverse group of migrating fish each year. Species include Lake Whitefish (Coregonus clupeaformis), Coho Salmon (Oncorchynchus kisutch), Dolly Varden (Salvelinus malma), Cutthroat Trout (Oncorhynchus clarkii), Chinook salmon (Oncorhynchus tshawytscha), Steelhead (Oncorhynchus mykiss), Chum Salmon (Oncorhynchus keta), Sockeye Salmon (Oncorhynchus nerka), Rainbow Trout (Oncorhynchus mykiss), Pink Salmon (Oncorhynchus gorbuscha), and Threespine Stickleback (Gasterosteus aculeatus) (Government of British Columbia, 2015). These species migrate from the Fraser River, through Harrison Lake, and up through the Lillooet River. The Conservation Data Center (CDC) recognized White Sturgeon (Acipenser transmontanus) belonging to the Lower Fraser River population to exist in the Harrison River. Management considerations should exist in future harvest activity planning for this species. Management for fish and riparian zones focuses on maintaining water quality and quantity (Table 7). The management strategies for these values are developed to help ensure the viability of fish passage and minimize the amount of harvesting in riparian zones. Two lakes exist in the centre of the block with lake-head streams flowing north from these zones. The lower elevation streams located in the northernmost extremity of the Woodlot require specific management for Pacific Water Shrew. These streams will be removed from the Woodlot area to become Wildlife Habitat Area (WHA) for the red listed species. Table 7: Fish and Riparian zone management goals, indicators, targets and associated strategies Goal Goal 5: Maintain riparian ecosystems, including their health and viability. + Goal 6: Maintain the viability of fish and associated habitat. + Indicator Target Strategy 5.1 Harvesting activities within riparian zones (ha) Riparian Zone Strategy 5.2 Construction and Deconstruction activities within riparian zones (m2 road) 6.1 Viability of fish passage through harvest areas (% Change) 6.2 Protection of fish habitat (% Change) Riparian Zone Strategy Fish and Wildlife Strategy Fish and Wildlife Strategy 15 | P a g e 2.2.5 Wildlife: It is recognized that species known to be at risk including threatened and endangered species require additional management implications. According to the BC Conservation Data Centre (CDC), two red listed Species at Risk (SAR) exist within the Woodlot 1699 boundary; Pacific Water Shrew (Sorex bendirii) and Oregon Spotted Frog (Rana pretiosa). These two species co-exist in riparian habitats, and require best management practices (appendix B) in all future management activities. Historically, Spotted Owl (Strix occidentalis), a red listed species has nested in the Harrison drainage. Although no individuals have been identified in or adjacent to Woodlot 1699, management for nesting sites should occur. The CDC also recognizes Masked Sensitive Area Species Identifiers polygons which overlap with the Woodlot (B.C. Conservation Data Centre, 2008). Management for wildlife values focuses on protecting habitat of all identified species (Table 8). Harrison River hosts the third largest gathering of Bald Eagles in North America due to the abundance of salmon running up the river each year (Tourism harrison, 2015a). Hawks are also commonly seen scavenging in the region (Clark, 1997). Aquatic and shoreline birds, including Great blue herons feed in the shallows of Harrison Bay year round. No identified sensitive areas coincide with the management unit. The region is also known to host mammals, including “black-tailed deer, black bears, coyotes, raccoons, muskrats, beavers, mink, weasels and river otters” (Clark, 1997). Management for Ungulate Winter Range (UWR) does not exist within the Woodlot area, and no required management for other species is known. Table 8: Wildlife management goals, indicators, targets and associated strategies Goal Indicator Goal 7: Respect and protect wildlife and their habitats throughout management activities. ** Goal 8: Manage and work to protect rare and threatened species in and adjacent to the management unit. + 7.1 Protection of wildlife habitat (% Change) 8.1 Pacific Water Shrew management (m) Target Strategy Fish and Wildlife Strategy 8.1.1 Maintain a 100m buffer on all potential Pacific Water Shrew habitat by January 2020 16 | P a g e 2.2.6 Carbon: Carbon has been recognized as a critical value in forests as globally we continue to monitor and attempt to reduce the emissions of greenhouse gasses (GHGs). Forests have been acknowledged as a large carbon sink for the world, increasing the importance of forest management practices to enhance the sink potential of forest lands. It is estimated that a single hectare of mature trees absorbs ~6.4 tonnes of Carbon dioxide (CO2) annually (Canadian Council of Forest Ministers, 2009), making management a critical component in the initiative to prevent further climate change. Carbon offset markets exist on a cap-and-trade system in British Columbia. Protocols developed under the B.C. Emission Offset Regulations and the Greenhouse Gas Reduction Targets Act, provide guidance for the design, development, quantification and verification of carbon offset projects (Greig & Bull, 2011). The value of carbon offsets is still debatable in the province; however a market for sequestering carbon exists. It is required that additionally be proven in order to obtain credits for carbon resource management (Table 9). Considering the objective to ensure maximum economic benefits to the Woodlot managers, Carbon Budget Modelling (CBM) software will identify the viability of managing for carbon. Table 9: Carbon management goals, indicators, targets and associated strategies Goal Goal 9: Ensure carbon stock is maintained or improved. + Indicator Target 9.1 Maximize revenue per unit area ($/ha) 9.1.1 Revenue from carbon sequestration is greater than other management alternatives Strategy 2.2.7 Timber: British Columbia’s economy was traditionally built on the abundance of natural resources, including forests. The forest industry in BC employed 235,900 in 2012, an increase of 1% from 2011 (Selective Cuttings, 2013). As measured in 2009, ~$9.07 billion in economic activity each year (Forestry Innovation Investment Ltd., 2015) is generated from forestry, logging and manufacturing in British Columbia. Woodlot 1699 is a relatively small area, with a current harvest limit of 1777 m3/year. Benefits from harvesting the timber resources in the Woodlot have the potential to aid the local community and Woodlot managers. A major objective for management in the area is to ensure maximum economic returns to the managers and associated contractual developers, while maintaining the ecological 17 | P a g e integrity of the forest resources. Ecological effectiveness will be managed through the Woodlot License Planning and Practices regulations, as set out by FRPA (Table 10). Table 10: Timber management goals, indicators, targets and associated strategies Goal Indicator Goal 10: Improve 10.1 Regeneration Stock and maintain the (Seed suitability) stand health and 10.2 Regeneration stocking vigour through forest standards post-harvest management (% Change) activities. + Goal 11: Generate 11.1 Harvest fiber at a economic benefits sustainable rate through (m3/year) management 11.2 Generate positive return activities. + on investments ($ earned/$ spent) Target Strategy Regeneration Strategy Regeneration strategy 11.1.1 Harvest at a rate at or below the LRSY by January 2020 Economic Operability Strategy 2.2.8 Recreation: Woodlot 1699 is located ~4.5km up the West Harrison FSR. Being in close proximity to Vancouver, the area is highly used by recreationalists, the local community, and many individuals from the lower mainland. There are no hiking or biking trails located within the Woodlot boundary; however there are two campgrounds directly adjacent to the area. Grace Lake and Wolf Lake recreational sites are highly used, and access exists year round. West Harrison camping is managed with an agreement between the Sts’ailes First Nations and the Recreation Sites and Trails BC. The area is rich with diverse recreational opportunities including fishing, hunting, kayaking, hot springs, hiking and motorized vehicle access. Scenic views and activities such as sand sculpture competitions attract multiple users year round (Tourism Harrison, 2015b) Harrison Lake is located directly below Woodlot 1699, and is heavily used by recreationalists who kayak, boat, and swim in the lake. The high level of use constrains management through Visual Quality Objectives (VQOs), and a corporate responsibility to maintain good public relations. Harrison Hot Springs Resort and Spa is located on the edge of Harrison Lake. The hot springs are a major attraction to the area, and bring in many travellers each year. Motorized vehicle recreationalists also commonly use the West Harrison FSR for both access and 4x4 activities. 18 | P a g e Recreation poses little threat to sustainable management of Woodlot 1699. The main objective of managing to recreation is to ensure stakeholder values are maintained, and that management activities do not produce negative externalities to the users in the area (Table 11). Table 11: Recreation management goals, indicators, targets and associated strategies Goal Goal 12: Utilize public interest in forest management planning. ** Indicator Target 12.1 Meetings with community association (meetings/year) Strategy Stakeholder engagement strategy 2.2.9 Cultural Heritage: Harrison historically housed aboriginal people who settled there more than 10,000 years ago. Woodlot 1699 is located directly adjacent to the traditional, cultural grounds of the Sts’ailes First Nations. The forested area may contain values important to this First Nations band, where consultation regarding traditional practices and rights are required. Particular concern exists for Culturally Modified Trees (CMT’s) and Spirit Poles. These features have been identified by the Sts’ailes First Nations to potentially exist within the Woodlot boundary. Figure 5: Sts’ailes Traditional Territory and the location of Woodlot 1699 (Sts'ailes Band, 2010a). 19 | P a g e Currently there are 992 Sts’ailes Band Members, governed by a member elected council. The Band is a non-profit, independent and progressive group, who is not involved in the treaty process (Sts'ailes Band, 2010a). The Sts’ailes Band aims to provide services and programs to support and enrich the community members, emphasizing the importance of local-controlled decision making and community and staff informed governance structure (Sts'ailes Band, 2010b). Establishing a sustainable relationship with the Sts’ailes First Nations is essential to developing Woodlot 1699 in the future. Currently, an agreement exists between the Woodlot managers and the aboriginal group to allow road access for compensation of firewood. Maintaining this relationship is of the utmost importance, and cultural values and features must be recognized in the establishment of Woodlot license plans and all future management activities (Table 12). Table 12: Cultural Heritage management goals, indicators, targets and associated strategies Goal Goal 13: Establish mutually beneficial relationships with local First Nation Communities. ** Goal 14: Recognize and respect First Nations legal and customary rights ** Goal 15: Protect and identify culturally significant features. ** Indicator Target Strategy 13.1 Meeting with First Nation Bands. (meetings/year) First Nation Accommodation and Consultation Strategy 14.1 Consultation and accommodation to recognized Aboriginal lands (meetings/year) 15.1 Culturally Modified Trees (Number of CMTs identified) First Nation Accommodation and Consultation Strategy First Nation Accommodation and Consultation Strategy 20 | P a g e 2.2.10 Visual Quality: Visual Quality is an essential component of forest management, especially in areas that are frequented as much as Harrison Lake. Visuals are of most concern in areas that can be seen from the town of Harrison Hot Springs, as this is where the most views per year will occur. Within the boundaries of Woodlot 1699, there are two separate visual quality classifications, retention and partial retention. The most stringent classification is retention, as the maximum allowable alteration on the visual landscape is 1.5% (Ministry of Forests, Lands and Natural Resource Operations, 2013b). The partial retention objectives are met by maintaining a maximum alteration of 7% across the landscape. Both of these constraints will ensure that the surrounding community won’t be negatively affected by the visuals caused by harvest operations (Table 13). Immediately adjacent to the Woodlot, there is a set of 360 Kilovolt transmission lines supporting the community of Harrison Hot Springs. The Visual Impact Assessment Guidebook states that, “the existing non-visually effective green-up alterations within and immediately adjacent to, the unit must be considered in this evaluation (Ministry of Forests, 2001).” Since the transmission lines are immediately adjacent to both the retention and partial retention polygons, they must be included when conducting visual assessments. Table 13: Visual Quality management goals, indicators, targets and associated strategies Goal Indicator Target Goal 16: Respect and comply with all visual quality constraints on the land base. + 16.1 Visual Quality Objectives (VQO) compliance (% Landscape Alteration) 16.1.1 Ensure Partial Retention VQO polygons < 7% landscape unit alteration by January 2020 16.1.2 Ensure Retention VQO polygons < 1.5% landscape unit alteration by January 2020 16.2 Visual Quality maintenance (Compliance/Cu tting Period) Strategy Visual Quality Strategy 21 | P a g e 2.2.11 Legal Obligation: As part of British Columbia’s Crown land, Woodlot 1699 must be managed to meet all provincial and local laws. Forest practices on B.C.’s land base are governed by the Ministry of Forests, Lands and Natural Resources Operations (MoFLNRO). FRPA is a results-based regulation governing “the activities of forest and range licensees” (Ministry of Forests, Lands and Natural Resource Operations, 2015). The act aims to demonstrate the balance of benefits from B.C. forest products, including cost efficiency and sustainably managed, renewable sources of fibre (Government of British Columbia , 2007). The management planning provided in this document will comply with the Woodlot License Planning and Practices Regulations. These regulations exist within the FRPA framework to govern sustainable management for small tenure holders. Using this information, all management activities and decisions in Woodlot 1699 will ensure due diligence in accordance with laws, regulations and associated agreements (Table 14). Table 14: Legal Obligation management goals, indicators, targets and associated strategies Goal Indicator Goal 17: Respect all national, provincial and local laws throughout all management activities and operations. ** 17.1 Compliance with all legal requirements (# Infractions) Target Strategy Legal Compliance Strategy 2.2 Management Strategies: Management strategies are developed for each indicator with no measurable target. These strategies aim to provide structure to management activities in order to obtain compliance with all goals and indicators. Appendix E outlines all management strategies. 22 | P a g e 3.0 Scenario Modelling In this plan, five forest management scenarios are modeled. Each scenario prioritises different management objectives to provide the client with comparative, empirical information to facilitate an informed decision. The scenarios were modeled over a 300 year period in time steps of 10 years. The base case “business-as-usual” scenario utilizes data from the current management plan established in 2006 when the pre-existing Timber Sale Licence was converted to the Woodlot Licence now held by the client. This base case provides a baseline to gauge the effects of the other four scenarios considering timber harvested, area harvested, growing stock and carbon sequestered. 3.1 Modelling Software In tandem with spatial GIS data provided by Chartwell Consultants Ltd., two modelling software packages were employed: Forest Planning Studio – ATLAS (FPS-ATLAS); and, The operational-scale Carbon Budget Model of the Canadian Forest Sector (CBM-CFS3). 3.1.1 FPS-ATLAS All five forest management scenarios were modeled with Forest Planning Studio – ATLAS. Developed by UBC’s Forest Resources Management Department, FPS-ATLAS is a spatially explicit harvest simulation model that is ideal for scheduling timber harvests to satisfy both spatial and temporal constraints and objectives. These constraints and objectives include seral stage distribution, linear buffers, uniform harvest flows and minimum opening sizes. A Long Run Sustained Yield – is modelled for all scenarios. 3.1.2 CBM-CFS3 The operational-scale Carbon Budget Model of the Canadian Forest Service was used for the proposed No Harvest Carbon scenario. CBM-CFS3 is an aspatial stand- and landscape-level model used to simulate the dynamics of all forest carbon stocks (Grieg and Bull 2009). The software quantifies the effects of natural disturbances and different management scenarios on the flux of forest carbon pools over time. Being aspatial, management scenario data generated in an external timber supply model is required. The output data from FPS-ATLAS is input into a Microsoft access tool called F2C. This tool performs a series of queries to create the input tables used by CBM-CFS3 to develop carbon yield curves (Appendix F). It is important to note that the accuracy of the carbon projections produced by CBM-CFS is limited by the accuracy and quality of the inputted merchantable volume data from FPS-ATLAS (Grieg and Bull 2009). 23 | P a g e 3.2 General Modelling Assumptions Table 15 outlines the assumptions that were made for the forest management scenarios. Table 15: General modelling assumptions General Assumptions in Modelling 1 Harvested polygons are regenerated with a 70% / 30% Coastal Douglas-fir / Western redcedar mix (the dominant natural tree species in the CWH dm) at a 1600 stems per hectare density 2 Regeneration delay of 2 years for all plantations 3 Only THLB inventory utilized in harvest to eliminate 13% of the gross woodlot area composed of lakes, lake buffers, streams, stream buffers, roads and road buffers 4 Polygons comprising 6% of gross area of woodlot are designated as future roads and did not contribute to harvests 5 The government-mandated 7% maximum landscape alteration constraint for Partial Retention VQO zones may be accurately translated into an equivalent constraint that requires that a minimum of 93% of PR VQO zones must have standing timber on it that is at least 18 years old. 6 Polygons situated in steep areas (slope > 60%) have a reduction factor applied to them. The areas of these polygons contribute to the 93% visual constraint requirement (i.e. the netdown for steep slopes is satisfied by the age constraint in PR VQO zones) 7 The government-mandated 1.5% maximum landscape alteration constraint for Retention VQO zones may be accurately translated into an equivalent constraint that requires that a minimum of 97% of R VQO zones must have standing timber on it that is at least 18 years old 8 Each stand group’s minimum harvest age is set to maximum MAI (culmination age), as derived from their respective growth and yield curves (Appendix G) 9 Polygons are harvested on an “oldest first” priority 10 Large-scale natural disturbance events such as forest fires, insect infestations, pathogen outbreaks and extreme wind storms do not occur 11 For fertilization scenarios, fertilization was applied to each stand group at an age 10 years prior to that stand group’s culmination age. Fertilization is only applied to softwood-leading stand groups (western redcedar-leading and coastal Douglas-fir-leading) For genetic gain/plus seed scenarios, an expected gain of 3.5% at index age 60 was applied (Magnussen & Yanchuk, 1994) 12 13 Harvesting is assumed to be carried out to a utilization level of 12.5 cm diameter at breast height (1.3 m) for all species 14 TIPSY will adequately forecast the growth and yield of mixed species stands for our purposes of modelling planted stands and for the breakdown of log grades for the harvest of natural stands 15 The stands comprising 16% of the woodlot licence area, identified as being in riparian management areas, steep unstable sites and low productivity sites will have the attributes that would allow them to be part of the required 8% Wildlife Tree Retention areas 24 | P a g e 3.3 Forest Management Scenarios The scenarios modelled include a base case, three scenarios that aim to increase the AAC and one scenario that focuses on the sequestration of carbon and subsequent sale of carbon credits. Each scenario will be discussed in turn and are briefly summarized below in Table 16. A constraint table detailing these constraints for each of our five scenarios may be found in Table 17 and is a useful reference. Table 16: Management plan scenario descriptions # Scenario 1 Base Case 2 Max Harvest 3 Max Harvest with fertilization 4 Max Harvest with fertilization and genetic gain 5 No Harvest for Carbon Description Emulates the forest management practices that are being carried out today. The AAC is currently set at 1,777 m3 per year and this scenario attempts to model for a higher sustainable AAC without altering any constraints. This scenario manages for Visual Quality Objectives, Riparian resources, Pacific Shrew Habitat and Long Run Sustained Yield. Attempts to justify increasing the AAC by showing that LRSY may be higher than currently set at by altering stream buffer widths. The objective is to harvest at a maximum sustainable rate, without the use of fertilization or + seed. This scenario manages for Visual Quality Objectives, Riparian resources and Long Run Sustained Yield. Attempts to justify increasing the AAC by showing that LRSY may be higher than currently estimated. The objective is to harvest at a maximum sustainable rate, with fertilization applied 10 years prior to target harvest age. This scenario manages for Visual Quality Objectives, Riparian resources and Long Run Sustained Yield. Attempts to justify increasing the AAC by showing that LRSY may be higher than currently estimated. The objective is to harvest at a maximum sustainable rate, with fertilization applied 10 years prior to target harvest age and planting seedlings grown from + seed. This scenario manages for Visual Quality Objectives, Riparian resources and Long Run Sustained Yield. Quantifies the effect that prohibiting all timber harvesting in the woodlot would have on carbon stocks. The objective is to sell carbon credits on the market to offset foregone timber revenues. This scenario manages for Visual Quality Objectives, Riparian Resources, wildlife habitat and forest carbon stock. 25 | P a g e Table 17: Constraint table for all management plan scenario modelling Constraint Name Description No Harvest Disable Harvesting Applied to (area) 1 - Base Case Visual Quality Objective – Partial Retention Minimum 93% of area in PR VQO zones must be at least 18 years of age Visual Quality Objective Retention Minimum 97% of area in R VQO zone must be at least 18 years age Management Zone for Pacific Water Shrew 30% Basal Area removal in 45m zone exterior to the 30m Reserve Zone 30m stream buffers 5m road buffers 20m lake buffers 45m stream buffers 2 - Max Harvest 3 - Max Harvest with Fertilization 4 – Max Harvest with Fertilization and Genetic Gain 5 -No Harvest for Carbon Entire Woodlot 20m stream buffers 20m lake buffers 5m road buffers Partial Retention VQO Zones n/a Retention VQO Zone n/a n/a 26 | P a g e 3.3.1 Base Case Scenario The Base Case scenario is used as a benchmark to compare the effects of the other four scenarios. It is modelled by replicating the constraints of the current AAC calculations. This includes Visual Quality restraints, initially modelled by setting a constraint requiring 90% of the partial retention VQO polygons to have timber at least 5.2m in height. The height requirement is translated into an age requirement of 18 years based off of a woodlot aggregate growth and yield curve. During the writing of the 2006 Woodlot Management Plan, the requirements for Partial Retention VQO zones were an allowable maximum landscape alteration of 10%. Over the past 9 years, the Partial Retention requirements have become more stringent, allowing only 7% maximum landscape alteration. We therefore adjusted the minimum % area that must satisfy the 18 years age constraint years upwards from 90% to 93%. The Retention zones are modelled in a very similar fashion, limiting the minimum area that must be 18 years of age to 97%. The Base Case scenario also incorporates a 30m “core” no harvest zone and a 45m “management” zone (allowing 30% basal area removal) adjacent to all previously identified streams in order to manage for the Pacific Water Shrew. 3.3.2 Maximum Harvest Scenario The Maximum Harvest Scenario is modelled to quantify the degree to which the AAC may be increased, considering the implementation of a 20m core buffer around all streams as opposed to the base case. This scenario does not satisfy Wildlife Habitat Area requirements for Pacific Water Shrew, as it is assumed this area will be replaced. The scenario complies with visual constraints in a manner identical to the Base Case. The management objective of this scenario is to provide the maximum long term volume to the client. 3.3.3 Maximum Harvest with Fertilization Scenario This scenario explores the impacts of fertilization application on the Long Run Sustained Yield of the Woodlot. Increasing growth rates and shortening the time a stand takes to reach culmination, the rotation ages are decreased allowing more timber to be harvested sustainably on an annual basis. Fertilization is modelled by altering the growth and yield curves of fertilized stand groups. For managed stands, new TIPSY growth and yield curves are created, with fertilization applied 10 years prior to each stand group’s target harvest age (culmination age). 27 | P a g e Fertilization responses are based off of Ministry defaults. For natural stands, a more unique approach is taken, considering VDYP does not support a fertilization function. First, the regular VDYP curve for an unfertilized natural stand is drawn for each stand group. Then, a second VDYP curve was drawn with the Site Index increased by 1 or 2 in order to realize an 8% to 10% increase in volume, consistent with nitrogen fertilization in Douglas-fir in the Pacific Northwest (Sidell, Harrison, Briggs, Collier, Gonyea, & Luxmoore, 1986). The absolute vertical difference between the unfertilized and fertilized curves at the point of fertilization (10 years prior to culmination age) is then added to the unfertilized curve. This shifts the VDYP curve upwards from the point of fertilization onwards. graphically illustrates this process. This scenario results in increased harvest rates, while also managing for Visual Quality Objectives and riparian resources. 1000 Resultant Fertilization Curves for VDYP 900 800 Volume (m3 per hectare) 700 600 Vertical difference between regular curve and site index- increased curve at point of fertilization is then added to regular curve to produce resultant curve that mimics fertilization 500 400 300 Site Index + 1 Site Index + 0 Resultant Curve 200 100 0 0 50 100 150 200 Age (years) 250 300 Figure 6: Modelling methods for applying fertilization to natural stands using VDYP 28 | P a g e 350 3.3.4 Maximum Harvest with fertilization and genetic gain scenario This scenario attempts to justify an increase to the AAC by planting seedlings derived from “plus seed”, or seed with some amount of genetic gain. Planting trees grown from plus seed increases the volume available for harvesting in the future. Genetic gain seed also affects timber supply indirectly, by reducing minimum harvest age and green-up ages. In Douglas-fir “plus seed”, a range of genetic gain between 25% volume is identified (Magnussen & Yanchuk, 1994). Considering the range of genetic gain, a 3.5% genetic gain effect is modelled. New TIPSY growth and yield curves are created for all stand groups, utilizing the “genetic gain” function in TIPSY. TIPSY accounts for genetic gain by increasing the height growth of trees, with volume estimates based off of the percentage height growth increase, however TIPSY is likely to not very accurately account for genetic gain for mixed species stands. Previously existing natural stands are not modelled considering they are already established. This scenario also manages for fertilization, Visual Quality Objectives and riparian resources identically to the previous scenario. 3.3.5 No Harvest for Carbon Scenario The final scenario modelled prohibits any future harvesting in the woodlot. This scenario quantifies the amount of carbon potentially sequestered if the client decided to manage entirely for carbon over a 100 year period. To demonstrate additionality, this scenario establishes a baseline and calculates the tonnes of Carbon sequestered by abstaining from any timber harvesting. While this scenario would result in no timber harvested, it would provide best management for Visual Quality Objectives, riparian resources, wildlife habitat and forest carbon pools out of all five scenarios. 3.4 Modelling Results This section provides comparison of each of the management scenario. To facilitate efficient analysis of the scenarios by the client, the outputs from FPS-ATLAS and CBM-CFS3 will be shown. These outputs include: Volume harvested (m3/year) Species harvested (m3/year) Total growing stock (m3) 29 | P a g e 3.4.1 Harvested volume Table 18 presents the Long Run Sustained Yield (LRSY) of each scenario and the variation between each from the Base Case. It should be noted that these relative changes are based off of the Base Case scenario and that the effects from one scenario to the next are cumulative. For instance, the effect of fertilization on LRSY was only an increase of 50 m3/year (or 2%) compared to the Max Harvest scenario. The use of genetic gain in planted seedlings did not at all prove to increase the LRSY. Figure 7 below displays the harvest volumes modelled for each scenario, spanning 300 years from the present. Each scenario’s harvest over time follows a similar trajectory, with the Base Case experiencing the smallest harvest and the other three scenarios oscillating around an average annual harvest of 2,500 m3 / year. Table 18: Long Run Sustained Yield (LRSY) of each modelled scenario and the variation from the Base Case Scenario LRSY (m3 / year) Difference from Base Case (%) Base Case 2,050 N/A Max Harvest 2,400 +17 Max Harvest with Fertilization 2,450 +19.5 Max Harvest with Fertilization and Genetic Gain 2,400 +17 No Harvest - Carbon 0 N/A 30 | P a g e 35000 Long Run Sustained Yield of all Scenarios Decadal Harvest Volume (m3 / 10 years) 30000 25000 20000 Base Case 15000 Max Harvest 10000 Max Harvest with Fertilization and Genetic Gain Max Harvest with Fertilization 5000 No Harvest - Carbon 0 0 50 100 150 Years from present 200 250 Figure 7: Long Run Sustained Yield (LRSY) of each modelled scenario 3.4.2 Species harvested The relative proportion of species harvested in the Base Case scenario is depicted in Figure 8. Douglas-fir remains as the most prominent species in the woodlot – comprising 63% of the total volume harvested throughout the 300 year model. This is a result of the high proportion of Douglas-fir leading stands presently growing and high proportion of Douglas-fir in future plantations. Comprising 18% of the total volume harvested over the 300 years, Western Hemlock is the next most common harvested species until year 230, when all Hemlock stands are converted to Douglas-fir and Western redcedar. Western redcedar volumes contribute 17% to the total harvest, the majority of which occurs in the latter 150 years. 31 | P a g e 300 18000 Decadal Harvest (m3 / 10 years) 16000 Base Case Scenario: Volume Harvested by Species 14000 Fd 12000 Hw 10000 Cw hardwoods 8000 Pl 6000 4000 2000 10 20 30 40 50 60 70 80 90 100 110 120 130 140 150 160 170 180 190 200 210 220 230 230 230 240 250 260 270 280 290 300 0 Years from present Figure 8: Harvested volumes by species in the Base Case Scenario The change is species harvested over time in the Max Harvest Scenario is depicted in Figure 9. While the absolute volumes of species harvested are different from the base case, the proportion of species harvested is similar to the Base Case. This scenario harvests 63%, 18% and 17% of the total harvest over the 300 year period coming from Douglas-fir, Western hemlock and Western redcedar respectively. 32 | P a g e 20000 Maximum Harvest Scenario: Volume Harvested by Species 18000 Decadal Harvest (m3 / 10 years) 16000 Fd 14000 Hw 12000 Cw 10000 hardwoods 8000 6000 4000 2000 10 20 30 40 50 60 70 80 90 100 110 120 130 140 150 160 170 180 190 200 210 220 230 240 250 260 270 280 290 300 0 Years from present Figure 9: Harvested volumes by species in the Maximum Harvest Scenario 3.4.3 Growing Stock The volume of non-reserve growing stock, regardless of age, is an indication of the amount of volume available for harvest. Figure 10 shows the non-reserve growing stocks of all five scenarios over time. The associated age class distributions can be found in appendix H. With the exception of the No Harvest – Carbon Scenario, all scenarios display a similar growing stock over time. The growing stock increases in the first few decades and then gradually declines and plateaus at a constant level. The Base Case Scenario has the smallest volume of non-reserve growing stock, while the other three increased harvest scenarios have slightly higher non-reserve growing stock levels. This is due to increased harvesting and thus more conversion of old stands into higher yielding planted stands. The total growing stock, including reserve areas, is expressed in Figure 11. The No Harvest – Carbon Scenario has the highest total growing stock, due to the entirety of the woodlot being allowed to grow without disturbance. The Base Case Scenario has the next highest total growing stock due to the wider stream buffers, while the other three scenarios are nearly identical. 33 | P a g e Volume of Non-Reserve Growing Stock (m3) 450000 400000 Non-Reserve Growing Stock 350000 300000 250000 basecase 200000 Max Harvest 150000 Max Harvest with Fertilization 100000 Max Harvest with Fertilization & Genetic Gain 50000 No Harvest - Carbon 0 10 20 30 40 50 60 70 80 90 100 110 120 130 140 150 160 170 180 190 200 210 220 230 240 250 260 270 280 290 300 0 Years from present Figure 10: Non-reserve growing stock of all scenarios 700000 Total Growing Stock 600000 Total Growing Stock (m3) Basecase 500000 Max Harvest 400000 Max Harvest with Fertilization 300000 Max Harvest with Fertilization & Genetic Gain 200000 No Harvest - Carbon 100000 0 10 20 30 40 50 60 70 80 90 100 110 120 130 140 150 160 170 180 190 200 210 220 230 240 250 260 270 280 290 300 0 Years from present Figure 11: Total growing stock of all scenarios 34 | P a g e 4.0 Comparative Analysis of Scenarios: To compare each scenario modelled, two forms of comparative analysis are completed. First, a ranking of the scenario’s ability to meet, maintain or improve the values identified in the Goals and Indicators section is completed. This utilizes a dense ranking system and calculates the scenario which has the highest rank based on each value. Values that compare equally between scenarios receive the same ranking number and values with negative or positive externalities receive subsequent ranking numbers. Table 19 identifies the ranking convention, and table 20 expresses how each scenario is ranked. The second comparative analysis completed is an economic analysis of each scenario. This is completed using the log market prices from March 17, 2015. For the purposes of this analysis, the woodlot’s harvest 50 years into the future is forecasted in order to evaluate the estimated revenues and costs of each scenario. Utilizing a valuation spreadsheet (Appendix I), each scenario is compared by cost and total value to identify which scenario provides the greatest profit to the client. The two comparative analysis models will be summarized and weighted to identify the optimal solution for future management. Each scenario will be given a rank from 1-5 to represent the optimal solution for each ranking system. In this ranking, a rank of 5 equates to the most favorable scenario, and a rank of 1 equates to the least. As the client’s main objective is to maximize profit, the economic satisfaction will be weighted 2/3 while the value satisfaction ranking will be weighted 1/3. 4.1 Value Satisfaction Ranking: Table 19: Ranking System Effectiveness to meet Values Least Key 1 Neural 2 3 Most 4 5 35 | P a g e Table 20: Management Plan Scenario Ranking Value Base Case Max Harvest Fertilization +Seed No Harvest Carbon Biodiversity 3 3 4 3 5 Water 3 2 2 3 4 Soils 3 2 5 4 3 Fish/Riparian 2 2 2 2 3 Wildlife 3 3 3 3 4 Carbon 3 2 4 4 5 Timber 4 5 4 4 1 Recreation 3 3 3 3 4 Cultural Heritage 3 3 3 3 3 Visual Quality 3 2 4 4 3 Legal Obligation 3 3 3 3 3 Total 33 30 37 36 39 Rank 2 1 4 3 5 4.1.1 Biodiversity: The No Harvest - Carbon and Max Harvest with Fertilization scenarios rank the highest in satisfying the requirements for biodiversity as expressed in the Goals and Indicators of this plan. These scenarios will contribute to prolonging the life of stands, moving them towards an old growth seral stage. The other scenarios rank neutrally for managing biodiversity, as a moderate proportion of natural stand groups will be harvested. This is assumed to maintain biodiversity at a stable level across the land base. 4.1.2 Water: Water resource values are ranked by the level of impact a scenario has on natural hydrological cycles. The No Harvest - Carbon scenario ranked the highest in satisfying the values identified in the Goals and Indicators, as water quality will be maintained. The Base Case and Max Harvest with Fertilization and Genetic Gain scenarios ranked neutrally in maintaining water values, as potential impacts from harvesting activities do exist. The Max Harvest with Fertilization scenario ranked lowest due to the impact fertilizer may have on water quality. 36 | P a g e 4.1.3 Soils: The No Harvest - Carbon scenario ranked highest for soil conservation values due to the indicators requiring restrictions of permanent access structures, harvest area and landslides from harvesting activities. The scenarios which include harvesting result in higher impacts to the soil condition, therefore resulting in a lower ranking. 4.1.4 Fish/Riparian: The scenarios that involve harvesting the entire Woodlot area rank the lowest for maintaining riparian quality and fish ecosystems. This is due to the potential for negative impacts from harvesting adjacent to riparian ecosystems. The other scenarios rank moderately in maintaining riparian ecosystems. 4.1.5 Wildlife: The No Harvest - Carbon scenario, which strictly focuses on carbon sequestration, ranks highest for maintaining wildlife values. This is due to the increased proportion of late seral forests that would mature over time in the absence of harvesting in the stands devoted to carbon sequestration. All other scenarios rank neutrally with regards to maintaining wildlife values as it is expected that wildlife may still have feasible and viable habitat potential within the woodlot after harvesting. 4.1.6 Carbon: The Maximum Harvest scenario ranks lowest in ensuring carbon stock is maintained due to the increased volume harvested with each cut. The Base Case scenario ranks neutrally, as carbon stock neither increased nor depleted as compared to the current management regime. Both the Max Harvest with Fertilization and the Max Harvest with Fertilization and Genetic Gain scenarios ranked slightly positively as the benefits obtained from both silvicultural prescriptions increases growth, and therefore carbon sequestration. The No Harvest - Carbon scenario ranks highest for ensuring carbon values are met as the quantity of carbon stock is increased with the associated management activities. 4.1.7 Timber: The Maximum Harvest scenario ranks highest for maintaining timber values. This is due to the increased economic revenues from harvesting larger volumes of timber, as well as the capability of maintaining stand health and vigor throughout increased harvest activities. The Base Case, Max Harvest with Fertilization and Max Harvest with Fertilization and Genetic Gain scenarios rank slightly higher than neutral for maintaining timber values, as stand health is maintained, and economic benefits from harvesting are accrued by the managers. The No Harvest - Carbon scenario ranks lowest as economic viability from timber is lost. However, this scenario does contribute to maintaining forest health. 37 | P a g e 4.1.8 Recreation: The No Harvest - Carbon scenario ranks highest for meeting the goals associated with recreation values. This is because this scenario reduces the effect of harvesting on the forested area, and maintains the area for use by recreationalists. All other scenarios rank equally for maintaining recreation values as public values will be maintained throughout any harvesting activities through the use of the stakeholder engagement strategy. 4.1.9 Cultural Heritage: All scenarios rank equally for ensuring cultural values are maintained throughout management activities. Through agreements with the Sts’ailes First Nations to provide firewood access, and ensuring all cultural features are identified, reported and, when required, maintained, all goals will be met throughout all scenarios. It is believed that no scenarios will have a negative impact on these values and associated goals. 4.1.10 Visual Quality: The Max Harvest with Fertilization and Max Harvest with Fertilization and Genetic Gain scenarios rank highest in meeting the requirements for visual quality values due to their increased growth, and therefore more effective green up time. This results in a smaller window of visual landscape alteration. The No Harvest - Carbon scenario ranked neutrally for maintaining visual quality values as the eliminated harvest results in no negative or positive externalities on the land base. The Maximum Harvest scenario ranks lowest with regards to meeting Visual Quality Objectives, as the level of landscape alteration may be higher due to the increased level of harvest. 4.1.11 Legal Obligation: Legal obligation is ranked equally for all scenarios as all management activities will follow the FRPA regulations and legal requirements as stated by law. 38 | P a g e 4.2 Economic Satisfaction Ranking: The economic satisfaction ranking is completed using the decadal volumes harvested from years 41-50 of the management scenarios. The volumes used in these calculations are strictly merchantable, requiring no further waste estimations. It is assumed that current log prices can be used in this analysis as a forecasting log value is difficult due to the high volatility of the market. Therefore, no discounting has been conducted for the revenues generated as well as current and future costs. Decade 5 was chosen arbitrarily for the comparison, and is purely utilized as a benchmark to compare each scenario’s economic viability. The values calculated as profits can be expected through each decadal harvest period. The input volumes were calculated by multiplying the total volume for each stand group harvested in that decade by the species breakdown and associated grades for decade 5. Sample calculation tables and associated costs for each scenario can be found in Appendix I. Table 21 summarizes the economic output from each scenario. All harvesting costs are collected from the client for use in this analysis (Appendix I). It is assumed that Hemlock exports equate to 30% of harvested volume, and that the logs are worth $40/m 3 more than the domestic prices. It is also assumed that for all scenarios, 50% of the harvest is ground based. 10% of the harvest is allocated to right of way clearing and the remaining 40% is considered to be harvested by cable yarding system. Stumpage rates for each species are collected from Section 7.2 of the Coast Appraisal Manual (CAM) (Timber Pricing Branch, 2014) (Appendix J). Planting costs are assumed to be equivalent to the Basic Silviculture Costs presented in Section 6.6 of the CAM. Hauling distance is calculated by Google Maps to be 127, where the distance from the woodlot to the Highway 7 intersection with Morris Road is 16.59km, and the distance from the intersection to the port of Vancouver is 110.41 km. Assuming each load can carry 40m3, the cost per load equates to $14.53/m3. Each trip is estimated to take 5 hours, based on 1.5 hours driving each way, and 0.5 hours loading and unloading. Cost of Fertilizer is calculated to be $667.60/ha considering delivery cost of $560/tonne of urea, application cost of $244/ha, and helicopter costs of $180/ha (Scott, 2015). Application is calculated based on the harvest area for each scenario. Application occurs approximately 10 years prior to harvest. 39 | P a g e Cost for genetic gain seed is obtained from the Fansier function in TIPSY v. 4.3. It was determined that genetic gain seed cost $0.03 extra per stem. Considering 1600 stems/ha planting stock, the total cost for utilizing +seed is obtained. To analyze the potential value for utilizing the landbase for carbon credits, carbon budget modelling considers the carbon stock for a 100 year period. Unlike the other scenarios, the profit is only collected in year 0, and no other decades. The value of carbon credits considered the carbon stock, the conversion of carbon to CO2e, and the total volume of Woodlot 1699 (Appendix H). Table 21: Economic output of each scenario modelled Satisfaction Base Case Max Harvest Fertilization +Seed No Harvest Carbon Cost $1,275,561.81 $1,623,733.14 $1,670,432.67 $1,735,800.11 $294,080.00 Revenue $1,474,245.55 $1,950,567.78 $1,988,523.37 $2,114,642.42 $1,764,480.00 Profit $198,683.74 $326,834.64 $318,090.69 $335,981.69 $539,146.67 Profit/m3 $10.05 $12.46 $11.90 $11.66 $1.79 Rank: 2 5 4 3 1 5.0 Recommendations: Table 22: Final scenario comparison and ranking Scenario Economic Satisfaction (2/3 weight) 2 Weighting Total Satisfaction Base Case Value Satisfaction (1/3 weight) 2 2 1 Max Harvest 1 5 3.67 4 Fertilization 4 4 4 5 +Seed 3 3 3 3 No Harvest 5 1 2.33 2 40 | P a g e 5.1 Rationale: The comparison in table 22 suggests that the Fertilization scenario provides a superior management alternative. The Fertilization scenario ranked high in meeting ecological requirements set out in the Goals and Indicators section, as well as providing a high economic return to the client. The scenario maximized harvest rates, with increased yields which decreased green up and visualization times. By comparison to the Base Case scenario, this scenario improved ecological and economic management. The Maximum Harvest scenario ranked second best in the analysis. This is due to the 2/3 weighting for economic satisfaction, as the profit obtained by increasing the harvest exceeded all other scenarios. Ecologically, this scenario ranked lowest due to the increased impact on the land base. One benefit from the Maximum Harvest scenario is the increased revenue with no added costs. The effect on visualization, water quality and wildlife in this scenario are all reduced from the increased harvest rates. Increasing the Long Run Sustained Yield is a feasible option for the management of the Woodlot. The “Plus Seed”/Genetic Gain scenario ranked third in satisfying the objectives of the client. Biodiversity is negatively affected by utilizing genetic gain seed, however benefits in visual objectives, carbon and timber values is experienced. Economically, this scenario provided fairly high economic return. The costs associated with using genetic gain seed is extremely high, resulting in lower profits for the client. The No Harvest Carbon scenario ranked fourth to satisfy the needs of the client. Although it is believed that this is not the optimal scenario, based on the ecological benefits this scenario increases the benefits to the land base. Considering carbon credit sales revenue is collected immediately by the client. Revenue is only collected once for this scenario, however, this scenario provides benefits to wildlife, carbon sequestration, recreation and biodiversity. The Baseline scenario ranked lowest in total satisfaction; however it is the belief of the Aurea Consulting team that the Baseline is a more appropriate management strategy than the No Harvest Carbon scenario. This scenario ranked moderately in meeting the FRPA values identified in the Goals and Indicators section, as well as in the economic satisfaction ranking. In Conclusion, It is determined that a combination of increasing the allowable harvest and using nitrogen based fertilizer will optimize management of Woodlot 1699. 41 | P a g e Bibliography Agriculture and Agri-Food Canada. (2013, June 26). Canadian Soil Information System. Retrieved March 25, 2015, from Desription of soil BC POG~~~~~N (POIGNANT): http://sis.agr.gc.ca/cansis/soils/bc/POG/~~~~~/N/description.html B.C. Conservation Data Centre. (2008). Conservation Data Centre Mapping Service. Retrieved March 15, 2015, from Mapped Known Locations of SPecies and Ecological Communities at Risk: http://webmaps.gov.bc.ca/imfx/imf.jsp?site=imapbc&savessn=Ministry%20of%20Environment /Conservation_Data_Centre.ssn Canadian Council of Forest Ministers. (2009). Canada's Forests: CO2 Sink or Source? Ottawa: Canadian Council of Forest Ministers. Clark, B. (1997). Harrison-Chehalis Wildlife Management Area Management Plan. Vancouver: Environmental Stewardship Lower Mainland Region. Forestry Innovation Investment Ltd. (2015). Forestry and the British Columbia Economy. Vancouver: Forestry Innovation Investment Ltd. Freshwater Fisheries Society of BC. (2014). Fish Stockign Reports. Retrieved March 25, 2015, from Archived Fish Stocking Report: http://www.gofishbc.com/fish-stocking-reports/archivereports/ReportOutputResult.aspx?StockSpecies=all&StockStrains=all&StockGenotypes=all&Fish Stages=all&Town=HARRISON&WaterBodyID=00271HARR&YearFrom=2005&YearTo=2014 Government of British Columbia . (2007). Revitilizing the Forest Economy. Retrieved March 16, 2015, from Ministry of Forests and Range: http://www.for.gov.bc.ca/mof/plan/frp/07.htm Government of British Columbia. (2015). Ministry of Environment. Retrieved March 15, 2015, from Habitat Wizard: http://www.env.gov.bc.ca/habwiz/ Greig, M., & Bull, G. (2011). Carbon management in British Columbia's forests: An update on opportunities and challenges. Vancouver: BC Journal of Ecosystems and Management. Klinka, K., Chourmouzis, C., & Varga, P. (2005). Site Units of the University of British Columbia Malcolm Knapp Research Forest. Vancouver: UBC Malcolm Knapp Reserach Forest. Kruger Products. (2006). Timber Supply Analysis Report for Woodlot # 1699 at Grace Lake. Chilliwack: Chilliwack Forest District. Lisaak Forest Resources Ltd. (2011). Sustainable Forest Managment Plan. Ucluelet: Lisaak Forest Resources Ltd. Magnussen, A., & Yanchuk, D. (1994). Time Trends of Predicted Breeding Vlues in Selected Crosses of Coastal Douglas-fir in British Columbia: A Methodological Study. Forest Science, 663-685. 42 | P a g e Ministry of Environment. (2015a). Soils. Retrieved March 13, 2015, from B.C. Ministry of Environment: http://env.gov.bc.ca/soils/landscape/part3.html Ministry of Environment. (2015b). Habitat Wizard Home. Retrieved March 25, 2015, from Habitat Wizard: http://maps.gov.bc.ca/ess/sv/habwiz/ Ministry of Forests. (2001, January 1). Forest Practices Code Guidebook. Retrieved March 3, 2015, from Visual Impact Assesment Guidebook: http://www.for.gov.bc.ca/TASB/LEGSREGS/FPC/FPCGUIDE/visual/Httoc.htm Ministry of Forests and Range. (1995). Forest Practices Code of British Columbia: Biodiversity Guidebook. Victoria: Province of British Columbia. Ministry of Forests, Lands and Natural Resource Operations. (2013a). A Guide to Visual Quality Objectives. Victoria: Ministry of Forests, Lands and Natural Resource Operations. Ministry of Forests, Lands and Natural Resource Operations. (2013b, March 1). BC Ministry of Forests, Lands and Natural Resource Operations. Retrieved March 16, 2015, from Visual Recource Management Home Page: www.for.gov.bc.ca/hfp/values/visual/index.htm Ministry of Forests, Lands and Natural Resource Operations. (2015). Forest and Range Practices Act. Retrieved March 16, 2015, from Government of British Columbia: http://www.for.gov.bc.ca/code/ Natural Resources Canada. (2014, April 17). Sustainable Forest Management. Retrieved March 19, 2015, from Government of Canada: http://www.nrcan.gc.ca/forests/canada/sustainable-forestmanagement/13183 O'Connor, P. (2007). Woodlot License # 1699 Management Plan. Chilliwack: Chilliwack Forest District. Pedersen, L. (2004). Fraser Timber Supply Review. Chilliwack: British Columbia Ministry o fForests. PEFC. (2015). Sustainable Forest Management. Retrieved March 19, 2015, from Caring for our forests globally: http://www.pefc.org/standards/sustainable-forest-management Scott, M. (2015, February 10). Personal Communication. Campbell, River, BC, Canada: Western Forest Products Ltd. Selective Cuttings. (2013, April 9). Forest sector employment in 2012: stabilizing but challenges remain. Retrieved March 13, 2015, from Natural Resources Canada: http://cfs-scf.nrcanrncan.gc.ca/selective-cuttings/21 Sidell, A. R., Harrison, R. B., Briggs, D. G., Collier, R., Gonyea, R., & Luxmoore, R. J. (1986). Long-term Results of Nitrogen Fertilization in Pacific Northwest Coastal Douglas-fir Plantations. Retrieved March 18, 2015, from http://www.forestsoils.org/smc/20yearFertilizationResults/webposter/ 43 | P a g e Sts'ailes Band. (2010a). Maps & Facts. Retrieved March 15, 2015, from Sts'ailes Band: http://www.stsailes.com/about/the-community/maps-facts Sts'ailes Band. (2010b). Who we are. Retrieved March 15, 2015, from Sts'ailes Band: http://www.stsailes.com/about/who-we-are Timber Pricing Branch. (2014). Coast Appraisal Manual. Victoria: BC Ministry of Forests, Lands and Natural Resource Operations. Tourism harrison. (2015a). Harrison Lake & River. Retrieved March 15, 2015, from Harrison Hot Springs: http://www.tourismharrison.com/Harrison-lake Tourism Harrison. (2015b). Tourism Harrison Hot Springs. Retrieved March 25, 2015, from Visitors Guide: http://www.tourismharrison.com/ 44 | P a g e Appendix A – Glossary of Terms and Abbreviations Abbreviations AAC - Annual Allowable Cut BCTS - BC Timber Sales BMP - Best Management Practices BEC - Biogeoclimatic Ecosystem Classification CanSIS - Canadian Soil Information System CBM - Carbon Budget Modelling CO2 - Carbon Dioxide CO2-e - Carbon Dioxide Equivalent CAM - Coast Appraisal Manual CWH - Coastal Western Hemlock COSEWIC - Committee on the Status of Endangered Wildlife in Canada CDC - Conservation Data Center CMT - Culturally Modified Tree DBH - Diameter at Breast Height DM - Dry Maritime EBM - Ecosystem Based Management ECA - Effective Clear Cut Area FPS - Forest Planning Studio FSC - Forest Stewardship Council FRPA - Forests and Range Practices Act GHG - Greenhouse Gasses HCVF - High Conservation Value Forests LRSY - Long Run Sustainable Yield 45 | P a g e MAI - Mean Annual Increment MoFLNRO - Ministry of Forests, Range and Natural Resource Operations NAR - Net Area to be Reforested OGMA - Old Growth Management Areas SARA - Species at Risk Act SFM - Sustainable Forest Management TIPSY - Table Interpolation for Stand Yields THLB - Timber Harvesting Land Base UWR - Ungulate Winter Range UBC - University of British Columbia VDYP - Variable Density Yield Projections VQO - Visual Quality Objectives WHA - Wildlife Habitat Areas WLPPR - Woodlot License Planning and Practice Regulations WMP - Woodlot Management Plan Glossary of Terms Adaptive Management: A systematic process for continually improving management policies and practices by integrating the outcomes of operations: Biodiversity: The degree of variation of life on the landscape. This can refer to ecosystem variation or species variation. Goal: A category of conditions or processes by which sustainable forest management may be assessed and is characterized by a set of related indicators that are monitored periodically to assess change. Indicator: A quantitative or Qualitative measure (measurement) of an aspect of a goal which can be measured or described and which, when observed periodically, will demonstrate trends. 46 | P a g e Appendix B – Pacific Water Shrew Best Management Practices Summarized from: Craig et al. 2010 – BMP Guidelines for Pacific Water Shrew Habitat: Valley bottom forestland along streams and wetlands Riparian specialist, usually captured within 60m of watercourses or wetlands Has been captured along a variety of watercourses including the edges of lakes, ponds, marshes, swamps, channelized watercourses and small ephemeral creeks Home ranges are long and linear running parallel to the water’s edge Feeds on a large proportion of aquatic origin insects – forages extensively in water More abundant in mature forests than young stands Prefers sites with abundant LWD and good cover of fine litter Not found above 850m elevation Based on available data, the best quality habitat is currently defined as: a riparian area around and including a permanent stream or creek (<10m wide) or any size wetland (including swamps, marshes, lakes, ocean beaches, etc.) with a mature coniferous forest (structural stages 5-7) of western red-cedar and or western hemlock or a mature deciduous or mixed forest (structural stages 4- 7) habitat surrounding the stream or wetland sufficient to protect the normal functioning of the riparian ecosystem (i.e. a protective area) Other suitable and / or important habitats include: sites similar to those described above but at younger structural stages, non-forested sites around streams/wetlands with heavy shrub cover, ephemeral or intermittent waterways, streams 10-20m (bankfull width) with suitable surrounding habitat and, rich moist habitat corridors for connecting habitat patches - site indicators of rich moist habitat; skunk cabbage, salmon berry, devils club Two habitat models have been produced using the observations of quality habitat identified above: 1) Habitat suitability/capability rating has been assigned to areas based on Biogeoclimatic zone site series 47 | P a g e (Terrestrial Ecosystem Mapping [TEM]; Craig 2009) and 2) habitat suitability rating have been assigned to habitat based on characteristics of the stream and surrounding vegetation (Sensitive Habitat Inventory Mapping [SHIM]; Craig 2006). Habitat Protection: 100m wide protective areas on either side of currently suitable or capable Pacific Water Shrew habitat, or in areas where Pacific Water Shrew is known to occur. Within the protective area low-impact activities such as the construction of a small walking trail (following guidelines outlined in the stewardship document “Access Near Aquatic Areas”) can occur in the outer 40m. No significant construction or habitat alteration should occur anywhere within the protective area. If low or nil suitable habitat occurs within 100m of habitat with moderate or high suitability, the habitat ranked as low or nil should be included in the protective area and restored to a suitable condition (unless naturally unsuitable). Watercourse and Wetland Crossings: The following suggestions should be implemented wherever possible to minimize habitat loss and fragmentation due to stream and wetland crossings (listed from least to most damaging) Move the crossing and all associated roadways away from known or potential habitat Use bridges over streams and wetlands instead of culverts. This ensures greater continuity of habitat below the bridge and the retention of natural vegetation. Bridges should be long enough to have no impact on the stream or wetland (including pilings). Natural plant stock should be planted to replace any vegetation removed during bridge building within 100m of the stream or wetland. In areas where plants cannot be established (e.g. under wide, low bridges) CWD can be placed to increase cover and foraging habitat If culverts are used they should be large-diamater (at least 2 m diameter) with open bottoms. Open-bottomed pipe arch curve culverts will increase the connectivity of habitat by maintaining a natural substrate. Closed bottom culverts should not be used. Natural plant stock should be planted to connect the remaining natural vegetation and create a pathway through the culvert. Culverts should not be longer than 30m and should not have large drops that would impede water shrew movement. 48 | P a g e Results Based Management: The Best Management Practices document uses the best available science and existing legislated requirements to define environmental objectives and performance targets to facilitate protection and recovery of the Pacific Water Shrew. Users of this guide that meet these objectives and targets demonstrate due diligence in protection and recovery of this species. 49 | P a g e Appendix C – Visual Quality Assessments In order to ensure the social responsibilities of harvesting are met, and to comply with all legal requirements, Aurea Consulting completed visual assessments on all harvesting polygons. Within the boundaries of Woodlot 1699 there are two separate visual classification units, a partial retention and a retention, which were both modelled using constraints in the FPS-Atlas simulation runs. In order to get an image of the landscape around the woodlot, Google Earth Pro was used. An image of the area was saved as a JPEG file, and then imported into ARC-GIS. This map was then georeferenced using known locations in the shapefiles received from the client, Chartwell Consultants. The polygon shapes used in the assessments were output by the FPS-Atlas program that was used to model the harvesting scenarios. These polygons were inputted into the ARC-GIS program where they could be turned into a polyline file, and imported into the ARC-Scene program. Within ARC-Scene, each individual polygon was placed on the landscape one by one and viewed from multiple viewpoints. These viewpoints were collected from the Data BC website, by searching ‘Visual Landscape Inventory - Viewing Points’ (http://catalogue.data.gov.bc.ca/dataset/visual-landscape-inventory-viewing-points-spatialview), and some additional points were added in order to maximize the efficiency of the assessment. Once the correct viewpoints were established, they could be overlaid onto the Google Earth Pro image that has been imported from the ARC-GIS program. This image can now be raised to the correct elevation bands in order to give a representative view of the landscape. With the topography correctly shown, the polylines can now be added to the hillside and viewed from various viewpoints that will be most visually affected. Figure 12: Placing a tree in Arc-Scene. Note that the 3D Graphics toolbar is selected in the top right corner and the last tree placed has a white 3-D box around it. 50 | P a g e In order to determine total affected visual landscape, trees were placed around all edges of each polyline using the 3D-Graphics tool. The tree heights were kept constant at 28 meters tall, and the symbol used was ‘Coast Redwood 2’. The correct placement and tool is shown in figure C 1. Once all the trees have been placed around the polyline shape, the affected visual landscape can then be calculated. This is done by dividing the total affected area by a cutblock by the total area of the visual landscape Figure 13: Areas shown as total visual landscape area (in red) and effect from harvest operations (in yellow) Figure C 2. This analysis is done from multiple points in order to effectively measure the affected landscape. In figure C 2, the total visual landscape is outlined in red, and the visual impact of harvesting is shown by the yellow area. To determine the total affected landscape you would apply the following equation; % 𝐴𝑓𝑓𝑒𝑐𝑡𝑒𝑑 𝑉𝑖𝑠𝑢𝑎𝑙 𝐿𝑎𝑛𝑑𝑠𝑐𝑎𝑝𝑒 = 𝐴𝑟𝑒𝑎 𝑖𝑛 𝑦𝑒𝑙𝑙𝑜𝑤 𝑥 100 𝐴𝑟𝑒𝑎 𝑜𝑢𝑡𝑙𝑖𝑛𝑒𝑑 𝑖𝑛 𝑟𝑒𝑑 To calculate both of the areas, a screen shot was taken of the entire area, and then brought into ARCGIS where the measurements can be done. For this assessment, the total landscape could not be in the same image (ie. The horizon slope didn’t meet water on screen) and therefore, the area outlined in red was used, which is associated with a major drainage/gully. Using the reduced area is fine, as this area will inflate the total affected visual landscape percentage. When a discrepancy with the provincial visual objectives is found, it is necessary to complete the analysis with the total landscape to get a better estimate of the actual effect on the visual landscape. 51 | P a g e ± PR PR PR PR PR PR PR R PR REC_EVQO_C PR 0 0.25 0.5 1 Kilometers R Figure 14 Map showing the two different visual classifications on in the woodlot. R is retention and PR is partial retention visual constraints. 52 | P a g e Appendix D – FSC Principles Means to Address Table Table 23: FSC principles and the associated criteria and how the management plan addresses them. FSC Principle Principle #1: Compliance with laws and FSC Principles The Organization* shall comply with all applicable laws*, regulations and nationally- ratified* international treaties, conventions and agreements. Criteria Criteria 1.1: The Organization* shall be a legally defined entity with clear, documented and unchallenged legal registration*, with written authorization from the legally competent* authority for specific activities. Criteria 1.2: The Organization* shall demonstrate that the legal status* of the Management Unit*, including tenure* and use rights*, and its boundaries, are clearly defined. Criteria 1.3: The Organization* shall have legal* rights to operate in the Management Unit*, which fit the legal status* of The Organization and of the Management Unit, and shall comply with the associated legal obligations in applicable national and local laws* and regulations and administrative requirements. The legal rights shall provide for harvest of products and/or supply of ecosystem services* from within the Management Unit. The Organization shall pay the legally prescribed charges associated with such rights and obligations. Criteria 1.5: The Organization* shall comply with the applicable national laws*, local laws*, ratified* international conventions and obligatory codes of practice*, relating to the transportation and trade of forest products within and from the Management Unit*, and/or up to the point of first sale. Criteria 1.6: The Organization* shall identify, prevent and resolve disputes over issues of statutory or customary law*, which can be settled out of court in a timely manner, through engagement* with affected stakeholders*. Means to Address Indicator: 16.1 Target: Strategy: Legal Compliance Strategy Indicator: 16.1 Target: Strategy: Legal Compliance Strategy Indicator: 16.1 Target: Strategy: Legal Compliance Strategy Indicator: 16.1 Target: Strategy: Legal Compliance Strategy Indicator: 16.1, 8.1, 3.1 Target: Strategy: Legal Compliance Strategy, Stakeholder Engagement Strategy, First Nation Accommodation and 53 | P a g e FSC Principle Principle #2: Workers Rights and Employment Conditions The Organization* shall maintain or enhance the social and economic wellbeing of workers*. Principle #3: Indigenous Peoples’ Rights The Organization* shall identify and uphold* indigenous peoples’* legal and customary rights* of ownership, use and management of land, territories and resources affected by management activities. Criteria Criteria 2.1: The Organization* shall uphold* the principles and rights at work as defined in the ILO Declaration on Fundamental Principles and Rights at Work (1998) based on the eight ILO Core Labour Conventions. Criteria 2.3: The Organization* shall implement health and safety practices to protect workers* from occupational safety and health hazards. These practices shall, proportionate to scale, intensity and risk* of management activities, meet or exceed the recommendations of the ILO Code of Practice on Safety and Health in Forestry Work. Criteria 2.5: The Organization* shall demonstrate that workers have job-specific training and supervision to safely and effectively implement the management plan* and all management activities. Criteria 3.1: The Organization* shall identify the indigenous peoples* that exist within the Management Unit* or are affected by management activities. The Organization shall then, through engagement* with these indigenous peoples, identify their rights of tenure*, their rights of access to and use of forest resources and ecosystem services*, their customary rights* and legal rights and obligations, that apply within the Management Unit. The Organization shall also identify areas where these rights are contested. Criteria 3.2: The Organization* shall recognize and uphold* the legal and customary rights* of indigenous peoples* to maintain control over management activities within or related to the Means to Address Consultation Strategy Indicator: 16.1 Target: Strategy: Legal Compliance Strategy Indicator: 16.1 Target: Strategy: Legal Compliance Strategy Indicator: 16.1 Target: Strategy: Legal Compliance Strategy Indicator: 3.1, 4.1, 5.1, 8.1 Target: Strategy: First Nation Accommodation and Consultation Strategy, Stakeholder Engagement Strategy Indicator: 3.1, 4.1, 5.1, 8.1 Target: Strategy: First Nation Accommodation and Consultation Strategy, 54 | P a g e FSC Principle Principle #4: Community Relations The Organization* shall contribute to Criteria Management Unit* to the extent necessary to protect their rights, resources and lands and territories. Delegation by indigenous peoples of control over management activities to third parties requires Free, Prior and Informed Consent*. Criteria 3.3: In the event of delegation of control over management activities, a binding agreement between The Organization* and the indigenous peoples* shall be concluded through Free, Prior and Informed Consent*. The agreement shall define its duration, provisions for renegotiation, renewal, termination, economic conditions and other terms and conditions. The agreement shall make provision for monitoring by indigenous peoples of The Organization’s compliance with its terms and conditions. Criteria 3.4: The Organization* shall recognize and uphold* the rights, customs and culture of indigenous peoples* as defined in the United Nations Declaration on the Rights of Indigenous Peoples (2007) and ILO Convention 169 (1989). Criteria 3.5: The Organization*, through engagement* with indigenous peoples*, shall identify sites which are of special cultural, ecological, economic, religious or spiritual significance and for which these indigenous peoples hold legal or customary rights*. These sites shall be recognized by The Organization and their management, and/or protection shall be agreed through engagement with these indigenous peoples. Criteria 4.1: The Organization* shall identify the local communities* that exist within the Means to Address Stakeholder Engagement Strategy Indicator: 3.1, 4.1, 8.1 Target: Strategy: First Nation Accommodation and Consultation Strategy, Stakeholder Engagement Strategy Indicator: 3.1, 4.1 Target: Strategy: First Nation Accommodation and Consultation Strategy Indicator: 3.1, 4.1 Target: Strategy: First Nation Accommodation and Consultation Strategy Indicator: 8.1, 16.1 Target: Strategy: Stakeholder 55 | P a g e FSC Principle Criteria maintaining or enhancing the social and economic wellbeing of local communities*. Management Unit* and those that are affected by management activities. The Organization shall then, through engagement* with these local communities*, identify their rights of tenure*, their rights of access to and use of forest resources and ecosystem services*, their customary rights* and legal rights and obligations, that apply within the Management Unit. Criteria 4.2: The Organization* shall recognize and uphold* the legal and customary rights* of local communities* to maintain control over management activities within or related to the Management Unit* to the extent necessary to protect their rights, resources, lands and territories. Delegation by local communities of control over management activities to third parties requires Free, Prior and Informed Consent*. Criteria 4.3: The Organization* shall provide reasonable* opportunities for employment, training and other services to local communities*, contractors and suppliers proportionate to scale and intensity of its management activities. Criteria 4.4: The Organization* shall implement additional activities, through engagement* with local communities*, that contribute to their social and economic development, proportionate to the scale, intensity and socio-economic impact of its management activities. Criteria 4.5: The Organization*, through engagement* with local communities*, shall take action to identify, avoid and mitigate significant negative social, environmental and economic Means to Address engagement strategy, Legal Compliance Strategy Indicator: 8.1 Target: Strategy: Stakeholder engagement strategy Indicator: Target: Strategy: Stakeholder engagement strategy Indicator: Target: Strategy: Stakeholder engagement strategy Indicator: 8.1 Target: Strategy: Stakeholder engagement strategy 56 | P a g e FSC Principle Criteria impacts of its management activities on affected communities. The action taken shall be proportionate to the scale, intensity and risk* of those activities and negative impacts. Criteria 4.6: The Organization*, through engagement* with local communities*, shall have mechanisms for resolving grievances and providing fair compensation to local communities and individuals with regard to the impacts of management activities of The Organization. Criteria 4.7: The Organization*, through engagement* with local communities*, shall identify sites which are of special cultural, ecological, economic, religious or spiritual significance, and for which these local communities hold legal or customary rights*. These sites shall be recognized by The Organization, and their management and/or protection shall be agreed through engagement with these local communities. Principle #5: Benefits from the Forest The Organization* shall efficiently manage the range of multiple products and services of the Management Unit* to maintain or enhance long term economic viability* and the range of environmental and social benefits. Criteria 5.1: The Organization* shall identify, produce, or enable the production of, diversified benefits and/or products, based on the range of resources and ecosystem services* existing in the Management Unit* in order to strengthen and diversify the local economy proportionate to the scale* and intensity* of management activities. Criteria 5.2: The Organization* shall normally harvest products and services from the Management Unit* at or below a level which can be permanently sustained. Criteria 5.3: The Organization* shall demonstrate that the Means to Address Indicator: 8.1 Target: Strategy: Stakeholder engagement strategy Indicator: 8.1 Target: Strategy: Stakeholder engagement strategy Indicator: 11.2 Target: Strategy: Economic Operability Strategy Indicator: 11.1 Target: 11.1.1 Strategy: Economic Operability Strategy Indicator: 4.1, 8.1 Target: 57 | P a g e FSC Principle Criteria positive and negative externalities* of operation are included in the management plan*. Criteria 5.4: The Organization* shall use local processing, local services, and local value adding to meet the requirements of The Organization where these are available, proportionate to scale, intensity and risk*. If these are not locally available, The Organization shall make reasonable* attempts to help establish these services. Criteria 5.5: The Organization* shall demonstrate through its planning and expenditures proportionate to scale, intensity and risk*, its commitment to longterm economic viability*. Principle #6: Environmental Values and Impacts The Organization* shall maintain, conserve and/or restore ecosystem services* and environmental values* of the Management Unit*, and shall avoid, repair or mitigate negative environmental impacts. Criteria 6.1: The Organization* shall assess environmental values* in the Management Unit* and those values outside the Management Unit potentially affected by management activities. This assessment shall be undertaken with a level of detail, scale and frequency that is proportionate to the scale, intensity and risk* of management activities, and is sufficient for the purpose of deciding the necessary conservation measures, and for detecting and monitoring possible negative impacts of those activities. Criteria 6.2: Prior to the start of site-disturbing activities, The Organization* shall identify and assess the scale, intensity and risk* of potential impacts of management activities on the identified environmental values*. Criteria 6.3: The Organization* shall identify and implement effective actions to prevent Means to Address Strategy: Stakeholder engagement strategy, First Nation Accommodation and Consultation Strategy Indicator: Target: Strategy: Stakeholder engagement strategy Indicator: 11.1, 11.2 Target: Strategy: Economic Operability Strategy Indicator: 2.1, 7.2, 14.1 Target: 2.1.1, Strategy: Fish and Wildlife Strategy, Indicator: 13.1, 14.1 Target: Strategy: Riparian Zone Strategy, Soil Strategy, Fish and Wildlife Strategy, Water Resource Management Strategy Indicator: 13.1, 14.1 Target: Strategy: Riparian Zone Strategy, 58 | P a g e FSC Principle Criteria negative impacts of management activities on the environmental values*, and to mitigate and repair those that occur, proportionate to the scale, intensity and risk* of these impacts. Criteria 6.4: The Organization* shall protect rare species* and threatened species* and their habitats* in the Management Unit* through conservation zones*, protection areas*, connectivity* and/or (where necessary) other direct measures for their survival and viability. These measures shall be proportionate to the scale, intensity and risk* of management activities and to the conservation status and ecological requirements of the rare and threatened species. The Organization shall take into account the geographic range and ecological requirements of rare and threatened species beyond the boundary of the Management Unit, when determining the measures to be taken inside the Management Unit. Criteria 6.6: The Organization* shall effectively maintain the continued existence of naturally occurring native species and genotypes, and prevent losses of biological diversity*, especially through habitat management in the Management Unit*. The Organization shall demonstrate that effective measures are in place to manage and control hunting, fishing, trapping and collecting. Criteria 6.7: The Organization* shall protect or restore natural water courses, water bodies, riparian zones and their connectivity. The Organization shall avoid negative impacts on Means to Address Soil Strategy, Fish and Wildlife Strategy, Water Resource Management Strategy Indicator: 2.1, 15.1 Target: 2.1.1, 2.1.2, 15.1.1 Strategy: HCVF Strategy, Pacific Water Shrew Strategy Indicator: 13.1, 14.1 Target: Strategy: Riparian Zone Strategy, Soil Strategy, Fish and Wildlife Strategy, Water Resource Management Strategy, Stakeholder engagement strategy Indicator: 6.1, 6.2, 7.1, 13.3, 13.4, 14.1 Target: Strategy: Fish and Wildlife Strategy, Water Resource Management Strategy, Riparian 59 | P a g e FSC Principle Principle #7: Management Planning The Organization* shall have a management plan* consistent with its policies and objectives* and proportionate to scale, intensity and risks* of its management activities. The management plan shall be implemented and kept up to date based on monitoring information in order to promote adaptive management*. The associated planning and procedural documentation shall be sufficient to guide staff, inform affected stakeholders* and interested stakeholders* and to justify management decisions. Criteria Means to Address water quality and quantity and mitigate and remedy those that occur. Zone Strategy Criteria 7.1: The Organization* shall, proportionate to scale, intensity and risk* of its management activities, set policies (visions and values) and objectives* for management, which are environmentally sound, socially beneficial and economically viable. Summaries of these policies and objectives shall be incorporated into the management plan*, and publicized. Indicator: Target: Strategy: Stakeholder engagement strategy, First Nation Accommodation and Consultation Strategy, Legal Compliance Strategy Criteria 7.3: The management plan* shall include verifiable targets by which progress towards each of the prescribed management objectives* can be assessed. Indicator: Target: All Applicable Strategy: All Applicable Criteria 7.4: The Organization shall update and revise periodically the management planning and procedural documentation to incorporate the results of monitoring and evaluation, stakeholder engagement* or new scientific and technical information, as well as to respond to changing environmental, social and economic circumstances. Criteria 7.5: The Organization* shall make publicly available* a summary of the management plan* free of charge. Excluding confidential information, other relevant components of the management plan shall be made Indicator: 3.1, 8.1 Target: Strategy: Stakeholder engagement strategy, First Nation Accommodation and Consultation Strategy Indicator: Target: Strategy: Stakeholder engagement strategy 60 | P a g e FSC Principle Principle #8: Monitoring and Assessment The Organization* shall demonstrate that, progress towards achieving the management objectives*, the impacts of management activities and the condition of the Management Unit*, are monitored and evaluated proportionate to the scale, intensity and risk* of management activities, in order to implement adaptive management*. Principle #9: High Conservation Criteria available to affected stakeholders* on request, and at cost of reproduction and handling. Criteria 7.6: The Organization* shall, proportionate to scale, intensity and risk* of management activities, proactively and transparently engage affected stakeholders* in its management planning and monitoring processes, and shall engage interested stakeholders* on request. Criteria 8.1: The Organization* shall monitor the implementation of its management plan*, including its policies and objectives*, its progress with the activities planned, and the achievement of its verifiable targets. Criteria 8.2: The Organization* shall monitor and evaluate the environmental and social impacts of the activities carried out in the Management Unit*, and changes in its environmental condition Criteria 8.3: The Organization* shall analyze the results of monitoring and evaluation and feed the outcomes of this analysis back into the planning process. Criteria 8.4: The Organization* shall make publicly available* a summary of the results of monitoring free of charge, excluding confidential information. Criteria 9.1: The Organization*, Means to Address Indicator: 8.1 Target: Strategy: Stakeholder engagement strategy Indicator: All Applicable Target: Strategy: All Applicable Indicator: 2.1, 6.1, 6.2, 7.2, 9.1, 9.2, 9.3, 10.1, 12.1, 13.1, 13.2, 13.3, 13.4, 14.1 Target: 2.1.1, 2.1.2, 9.1.1, 9.2.1, 9.3.1, 12.1.1, 12.1.2 Strategy: Visual Quality Strategy, Regeneration Strategy, Riparian Zone Strategy, Fish and Wildlife Strategy, HCVF Strategy Indicator: Target: Strategy: All Applicable Indicator: Target: Strategy: Stakeholder engagement strategy Indicator: 2.1 61 | P a g e FSC Principle Values The Organization* shall maintain and/or enhance the High Conservation Values* in the Management Unit* through applying the precautionary approach*. Principle #10: Implementation of Management Activities Management activities conducted by or for The Organization* for the Management Unit* shall be selected and implemented consistent with The Organization’s economic, environmental and social policies and objectives* and in compliance with the Principles* and Criteria* collectively. Criteria Means to Address through engagement* with affected stakeholders*, interested stakeholders* and other means and sources, shall assess and record the presence and status of the following High Conservation Values* in the Management Unit*, proportionate to the scale, intensity and risk* of impacts of management activities, and likelihood of the occurrence of the High Conservation Values. Target: 2.1.2 Strategy: HCVF Strategy Criteria 9.2: The Organization* shall develop effective strategies that maintain and/or enhance the identified High Conservation Values*, through engagement* with affected stakeholders*, interested stakeholders* and experts. Criteria 9.4: The Organization* shall demonstrate that periodic monitoring is carried out to assess changes in the status of High Conservation Values*, and shall adapt its management strategies to ensure their effective protection. The monitoring shall be proportionate to the scale, intensity and risk* of management activities, and shall include engagement* with affected stakeholders*, interested stakeholders* and experts. Criteria 10.1: After harvest or in accordance with the management plan*, The Organization* shall, by natural or artificial regeneration methods, regenerate vegetation cover in a timely fashion to pre-harvesting or more natural conditions. Criteria 10.5: The Organization* Indicator: 2.1, 3.1, 8.1 Target: 2.1.1 Strategy: HCVF Strategy, Stakeholder engagement strategy, First Nation Accommodation and Consultation Strategy Indicator: 2.1 Target: 2.1.2 Strategy: HCVF Strategy Indicator: 9.4, 10.1, 10.2 Target: Strategy: Regeneration Strategy Indicator: 1.1, 1.2, 6.1, 9.1, 9.3, 62 | P a g e FSC Principle Criteria Means to Address shall use silvicultural* practices that are ecologically appropriate for the vegetation, species, sites and management objectives*. 9.4, 10.1, 10.2, 11.1, 13.2, 13.3, 13.4, 14.1, 15.1 Target: 1.1.1, 1.2.1, 9.1.1, 9.3.1, 11.1.1, 13.2.1, 15.1.1 Strategy: Riparian Zone Strategy, Regeneration Strategy, Water Resource Management Strategy, Fish and Wildlife Strategy Indicator: 2.1, 6.1, 6.2, 7.1, 7.2, 9.1, 9.2, 9.3, 9.4, 13.1, 13.2, 13.3, 13.4, 14.1 Target: 2.1.1, 9.1.1, 9.2.1, 9.3.1, 13.1.1, 13.2.1 Strategy: HCVF Strategy, Riparian Zone Strategy, Fish and Wildlife Strategy, Regeneration Strategy, Water Resource Management Strategy. Criteria 10.10: The Organization* shall manage infrastructural development, transport activities and silviculture* so that water resources and soils are protected, and disturbance of and damage to rare* and threatened species*, habitats*, ecosystems* and landscape values* are prevented, mitigated and/or repaired. Criteria 10.11: The Organization* shall manage activities associated with harvesting and extraction of timber and non-timber forest products* so that environmental values* are conserved, merchantable waste is reduced, and damage to other products and services is avoided. Indicator: 1.1, 1.2, 2.1, 5.1, 13.1 Target: 1.1.1, 1.2.1, 2.1.1, 13.1.1 Strategy: HCVF Strategy, First Nation Accommodation and Consultation Strategy, 63 | P a g e Appendix E – Management Strategies E1 – Economic Viability Strategy Goals: 11 Indicators: 11.1, 11.2 Purpose: To ensure forest harvesting provides the opportunity for economic benefits to stakeholders, shareholders and the affected community. Rationale: Woodlot 1699 is managed by a private consultant, and therefore its main objective is profit maximization. These benefits include direct revenue to the woodlot managers, contractors and the provincial government. Potential benefits exist to the local community through employment opportunities. It is important to manage for these benefits while continually maintaining the ecological integrity of the management unit. Strategy: 1. Ensure total value of harvest operations is greater than the cost to harvest timber resources. 2. Develop a long run sustained yield (LRSY) to be maintained throughout harvesting activities. (FSC 5.2) 3. Research all viable economic opportunities prior to proceeding with management activities. 4. Demonstrate a commitment to long-term economic viability. (FSC 5.5) 5. Develop a community employment objective in order to ensure potential benefits to the community are received. (FSC 5.1) 6. Ensure local processes, and value adding services are used where feasible. (FSC 5.4) 7. Monitor strategies to ensure compliance and improvements. 64 | P a g e E2 – First Nations Consultation and Accommodation Strategy Goals: 3, 5 Indicators: 3.1, 5.1 Purpose: To establish a working relationship and ensure appropriate accommodations occur for local First Nations. Rationale: Woodlot 1699 occurs immediately adjacent to the traditional, cultural grounds of the Sts’ailes First Nations. The forested area may contain values important to this First Nations band, where consultation regarding traditional practices and rights are required. Engaging the Sts’ailes First Nations in management planning is both ethical and essential in obtaining valuable information and feedback regarding management activities, and access requirements. Strategy: 1. Create a Woodlot 1699 stakeholder advisory committee for consultation with local First Nations. 2. Develop mechanisms for resolving grievances and ensuring compensation to First Nations bands impacted by management activities. 3. Determine all sites of special cultural, ecological, economic, religious or spiritual significance so they may be discussed with all affected stakeholders prior to management activities. (FSC 3.5) 4. Ensure availability for affected First Nations bands to protect and utilize their traditional knowledge, and provide compensation for their intellectual property. (FSC 3.6) 5. Develop an access agreement with local First Nations bands to compensate for use of their traditional lands (FSC. 3.3) 6. Complete required consultation meetings prior to the 31st of December of each calendar year. 7. Monitor strategies to ensure compliance and improvements. 65 | P a g e E3 – Fish and Wildlife Strategy Goals: 7, 14 Indicators: 7.1, 7.2, 14.1, Purpose: To ensure that terrestrial and aquatic species and their associated ecosystems are maintained throughout all management activities. Rationale: Adequate protection of ecosystems which support both aquatic and terrestrial life is essential to sustainable forest management. Woodlot 1699 has species at risk concerns for two species; Pacific Water Shrew (Sorex bendirii) and Oregon Spotted Frog (Rana pretiosa). Historically, Spotted owl (Strix occidentalis) has had nesting sites in the Harrison drainage, and therefore monitoring for nests should occur regularly. Fish passage within Woodlot 1699 is not a concern, however the proximity of the management unit to Harrison Lake creates water quality and quantity concerns. Maintaining wildlife and fish populations in the management unit and adjacent areas also plays a considerable role in public relations, due to the high level of recreational users in the area. Strategy: 1. Ensure that there is no loss of identified wildlife habitat within or adjacent to the management unit. 2. Ensure that fish passages and habitat in the management unit are maintained and improved where feasible. 3. Management of all threatened and/or endangered species identified in the management unit is done by best management practices. 4. Maintain the best management practices for Pacific Water Shrew, as described in appendix A. 5. Ensure wildlife trees are retained where feasible to meet the required targets. 6. Complete biological assessments prior to management activities. 7. Update assessment reports prior to each 5 year cut control period. 8. Monitor strategies to ensure compliance and improvements. 66 | P a g e E4 – High Conservation Value Forest (HCVF) Strategy Goals: 2 Indicators: 2.1 Purpose: To ensure that High Conservation Forest Values are sustained or enhanced through management activities. Rationale: Sustainable forest management requires protection of forests identified to contain high value attributes. HCFV attributes include species diversity, landscape level ecosystems and mosaics, ecosystems and habitats, critical ecosystem services, community needs and cultural values. Identification and management of such areas is a priority for woodlot 1699 managers in managing the land sustainably. Strategy: 1. Complete a High Conservation Value Forest assessment and report 2. Create conservation attribute maps for all identified values from assessments. 3. Establish management strategies from assessments and reports for all identified values. (FSC 9.2) 4. Consult stakeholders directly affected by the identification of High Conservation Values. (FSC 9.3) 5. Develop monitoring system to ensure continual management of High Conservation Values. 6. Update assessment reports prior to each 5 year cut control period. 7. Monitor strategies to ensure compliance and improvements. 67 | P a g e E5 – Legal Compliance Strategy Goals: 16 Indicators: 16.1 Purpose: To ensure that all federal, provincial and municipal laws are followed. Rationale: In order to maintain tenure to Woodlot 1699, it must be proven that the consultants hold the right to access and harvest timber on the land base. The managers of Woodlot 1699 will adhere to all federal, provincial and local laws and regulations in order to maintain professional ethics and good forest stewardship. While adhering to all laws and regulations, workers’ rights must be accounted for. Strategy: 1. Create an occupational health and safety committee (OH&S). 2. OH&S Committee meetings are to be held monthly to review any safety concerns. 3. Ensure the International Labor Organization (ILO) code of practice on safety and health in forest work is followed. 4. Maintain up-to date copies of applicable legislation and make readily available to required personnel. 5. Ensure stumpage is paid for the full scaled volume of all harvested timber. 6. Ensure professional reliance is maintained throughout all management activities, as required by the Association of British Columbia Forest Professionals (ABCFP), or other legislating parties. 7. Ensure forest management practices lie within the managers’ professional scope. 8. Monitor strategies to ensure compliance and improvement. 68 | P a g e E6 – Regeneration Strategy Goals: 9, 10 Indicators: 9.4, 10.1, 10.2 Purpose: To ensure forests maintain species and ecosystem diversity throughout management activities. Rationale: Sustainable forest management includes adequate regeneration, as required by law in British Columbia. Through BC’s strict reforestation regulations the genetic, species and ecosystem diversity must be maintained across the province. The woodlot license holder must specify stocking standards for areas referred to as free growing stands. The standards required by the Chief Forester for Seed use are in place to ensure the identity, adaptability, diversity and productivity of the provinces tree gene resources are maintained. Strategy: 1. Adhere to the Chief Forester’s Standards for Seed Use (WLPPR 32) 2. Adhere to all stocking standards (WLPPR 32) 3. Develop pre-harvest maps to show BEC zones and site series for the associated area, as well as the stocking standards applying to each harvested zone. 4. Ensure species diversity is maintained through forest management activities. (FSC 6.6) 5. Complete planting of regenerating stock within 12 months of harvest activities. 6. Meet all Regeneration Delay and Free growing obligations within a specified time frame. 7. Ensure revegetation of deactivated or deconstructed roads is completed within 2 years of the inactivity. 8. Complete regeneration surveys in each standard unit to assess forest health and ensure adequate stocking. 9. Update assessment reports prior to each 5 year cut control period. 10. Monitor strategies to ensure compliance and improvements. 69 | P a g e E7 – Riparian Zone Strategy Goals: 6, Indicators: 6.1, 6.2 Purpose: To ensure riparian areas are protected and maintained throughout management activities. Rationale: Riparian areas are the interface between land and a body of water. These areas are essential to the survivorship of both terrestrial and aquatic species, and contribute to the overall biodiversity of a landscape. Water passing through these zones may be used for human consumption. Sustainable forest management in these zones is essential for fish and wildlife longevity. Strategy: 1. Complete riparian zone assessment report prior to harvest activities. 2. Ensure there is zero removal of resources within riparian zones, unless required for safety concerns. 3. Ensure channel stability is maintained throughout forest management activities. 4. Restrict development of roads within any riparian zones, unless proven to be the only viable option. 5. Develop management guidelines for all rare or threatened species within riparian ecosystems. 6. Complete harvest activities in a manner that is unlikely to harm or destroy fish and wildlife habitat. 7. Ensure zero material adverse effect of fish passage. 8. Update assessment reports prior to each harvest. 9. Monitor strategies to ensure compliance and improvements. 70 | P a g e E8 – Stakeholder Engagement Strategy Goals: 4, 8 Indicators: 4.1, 8.1 Purpose: To ensure that all stakeholders concerns are heard and addressed in order to properly manage the land base. Rationale: The West Harrison drainage is a highly used area adjacent to Harrison Mills, BC. With campgrounds and lake recreational areas adjacent to the woodlot, the forested areas may contain values important to the public, stakeholders and other operators in the region. Engaging the affected stakeholders in management planning is both ethical and essential in obtaining valuable information and feedback regarding management activities in such a highly used area. Strategy: 1. Create a Woodlot 1699 stakeholder advisory committee for consultation with local communities and stakeholders. (FSC 4) 2. Develop mechanisms for resolving grievances and ensuring compensation to individuals who are impacted by management activities. (FSC 4.6) 3. Ensure local operators are provided the opportunity to bid on harvesting, road construction and silviculture contracts. (FSC 4.3) 4. Determine all sites of special cultural, ecological, economic, religious or spiritual significance so they may be discussed with all affected stakeholders prior to management activities. (FSC 4.7) 5. Ensure availability to the public and affected stakeholders of all non-confidential aspects of the management plan, management activities, and assessments completed. 6. Complete required consultation meetings prior to the 31st of December of each calendar year. 7. Monitor strategies to ensure compliance and improvements. 71 | P a g e E9 – Visual Quality Strategy Goals: 12 Indicators: 12.2 Purpose: To ensure that visual quality is maintained throughout management activities on the land base. Rationale: Visual quality is an important aspect of managing forests for social acceptance. Large openings, unnatural shaped cutblocks and bare ground have the potential to be visually unappealing, creating requirements for special consideration in visually sensitive areas. Woodlot 1699 has two partial retention VQO polygons, as well as one retention VQO polygon. These sites must be managed for visual quality to ensure a positive public perception of management activities on the land base. As described in the Visual Impact Assessment Guidebook, all preexisting and proposed operations must be included in the Visual Impact Assessment; therefore the power line project adjacent to Woodlot 1699 must be included. Strategy: 1. Complete the Visualization Process to ensure all VQO requirements are established. 2. Develop a Visual Impact Assessment from the Visualization Process to identify possible externalities from management activities (FSC 5.3) 3. Make Visual Impact Assessment available for public viewership. (FSC 7.5) 4. Develop new Visual Impact Assessments prior to each 5 year cut control period. 5. Monitor strategies to ensure compliance and improvements. 72 | P a g e E10 – Water Resource Management Strategy Criterion: 13 Indicators: 13.3, 13.4 Purpose: To ensure that water quality and quantity are maintained and/or improved throughout management activities. Rationale: Water quality in the management unit is of the utmost concern. Directly east of the management unit is Harrison Lake, which is highly used by the local community, as well as seasonal tourists. Sustainable forest management should therefore ensure the conservation of both quantity and quality of the water resource in the management unit. Strategy: 1. Adhere to the Water Act. 2. Develop a water resource quality assessment report prior to harvest activities. 3. Make assessment report findings publicly available for review. 4. Ensure zero harmful or destructive material is deposited or transported to water that is used for human consumption. 5. Maintain quantity of water flowing through the management unit throughout all management activities. 6. Ensure no fertilization occurs within 10m of any water resources. (FPPR) 7. Update assessment reports prior to each 5 year cut control period. 8. Monitor strategies to ensure compliance and improvements. 73 | P a g e Appendix F – Carbon Modelling and the F2C Tool This appendix is intended to provide guidelines for the quantification and reporting of forest carbon stocks. As of November 2013 the Pacific Carbon Trust has been eliminated and amalgamated into the new Climate Investment Branch of the Ministry of Environment’s Climate Action Secretariat. The Pacific Carbon Trust had established project guidelines for land-based carbon offset projects under BC’s Forest Carbon Offset Protocol. Though the Pacific Carbon Trust has been eliminated, this protocol is still relevant and will serve to provide management guidance until the Climate Action Secretariat finishes developing regulations for reporting, offsets, and compliance. Four project types are eligible under the BC Forest Carbon Protocol 1) Conservation Projects Prevention of direct human-induced conversion of forest land to non-forest land Avoided harvesting or conservation of forest lands in not included in this category 2) Improved Forest Management Projects Management practice that reduces carbon emissions and/or increases carbon sinks Eligible management activities may include: reduced harvesting, restoration practices, increased conservation, reduced burning of slash piles or reducing width of roads and skid trails 3) Reforestation Projects The re-establishment of trees through planting. Project land must have been forest land in the recent past (last 20 years) or have reduced forest cover due to natural or human induced disturbance 4) Afforestation Projects Direct human-induced conversion of non-forest land to forested land through planting Project land must not have been forest land in the recent past (last 20 years) 74 | P a g e For each project type, only management activities that deviate from an established baseline will be eligible for certification as credible carbon offsets. This baseline is “business as usual” management and will be used to demonstrate additionality. Additionality answers the question: if the forest management activity was not implemented would the emissions reductions still have occurred? Or would the project have occurred anyway without revenue from offsets? If the answer is yes, the project cannot demonstrate additionality and will not be eligible for certification as credible carbon offsets. The following is a series of guidelines to help ensure carbon stocks are credibly quantified and reported: 1. Maintain current Forest Inventory and Silviculture Activity Reports Ensure that forest inventory is updated to demonstrate accurate estimates of carbon stocks Record all silviculture activities to show their influence on forest carbon stocks 2. Record all natural and human-induced disturbances Maintain records of all biotic and abiotic disturbances to demonstrate their impact on carbon Ensure any loss of productive forest land is recorded and quantified 3. Maintain records of secondary emission sources Record trip and work activity to account for all pertinent fossil fuel emissions 4. Maintain records of all harvesting, conservation, and rehabilitation costs Record costs of these activities to allow for a financial analysis of the baseline “business as usual” management and the alternative carbon positive forest management Following the above guidelines will help companies involved in forest carbon management ensure that all carbon projects are credibly quantified and reported upon introduction of the Climate Action Secretariat’s new regulations for reporting, offsets and compliance. 75 | P a g e Appendix G – Minimum Harvestable Age by Stand Group Table 24: Minimum harvestable age separated by stand group code, defined in table E 2 Stand Group 111 112 121 122 131 132 141 142 201 202 321 322 331 332 401 402 501 502 601 602 701 702 Species Labels 1 – Fd leading 2 – Hw leading 3 – Cw leading 4 – Mb leading 5 – Dr leading 6 – Pl leading 7 – W leading 8 – N/A Site Index Labels 0 – N/A 1 – SI < 20 2 – 20 < SI < 25 3 – 25 < SI < 30 4 – SI > 30 Minimum Harvest Age (years) 110 110 90 90 80 80 110 70 100 100 100 90 80 90 30 80 40 80 90 100 110 90 Status Labels 1 – Existing stand (VDYP) 2 – Managed stand (TIPSY) Table 25: Description of stand group 3 digit code 76 | P a g e Appendix H – Age Class Distribution Through Time H1 Base case Scenario Age Distribution of Base Case Scenario 500 year 0 Area (ha) 400 year 50 year 100 300 year 150 200 Year 200 Year 300 100 Year 200 0 year 100 year 0 Age Distribution (yr) Figure 15: Age class distribution throughout management activities in the Base Case Scenario 77 | P a g e 78 | P a g e H2 Max Harvest with Fertilization Scenario Age Distribution of Max Harvest Scenario Area(ha) year 0 Year 50 Year 100 Year150 Year 200 Year 300 Year 200 0-50 50-100 Year 100 100-150 150-200 200-250 250-300 300-400 Age Distribution (yr) year 0 400-500 500-700 Figure 16: Age class distribution throughout management activities in the Maximum Harvest Fertilization Scenario 79 | P a g e 80 | P a g e H3 No Harvest - Carbon Scenario Age Distribution of Base Case Scenario 450 year 0 400 year 50 Area (ha) 350 year 100 300 250 200 150 100 50 0 year 150 Year 200 Year 300 Year 200 0-50 50-100 100-150 150-200 year 100 200-250 250-300 300-400 year 0 400-500 500-700 Age Distribution (yr) Figure 17: Age class distribution where no harvest occurs 81 | P a g e 82 | P a g e Appendix I – Financial Evaluations I1 Base Case Scenario: Figure 18: Base Case Revenue Calculations 83 | P a g e Figure 19: Base Case Cost Calculations 84 | P a g e I2 Maximum Harvest Scenario: Figure 20: Maximum Harvest Revenue Calculations 85 | P a g e Figure 21: Maximum Harvest Cost Calculations 86 | P a g e I3 Maximum Harvest Fertilization Scenario: Figure 22: Maximum Harvest Fertilization Revenue Calculations 87 | P a g e Figure 23: Maximum Harvest Fertilization Cost Calculations I4 Cost of Fertilizer: Table 26: Cost for fertilizer 88 | P a g e I5 Genetic Gain Seed Scenario: Figure 24: Genetic Gain Scenario Revenue Calculation 89 | P a g e Figure 25: Genetic Gain Scenario Cost Calculation I6 No Harvest Carbon Scenario: Table 27: Carbon Credit Revenue and Cost Calculations 90 | P a g e Appendix J – Average Stumpage Rates Table 28: Average stumpage rates for the Chilliwack Forest District (adapted from the Coast Appraisal Manual, 2014) 91 | P a g e


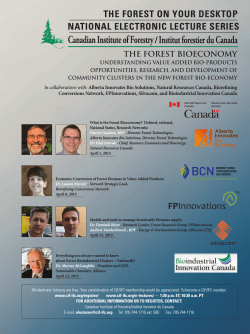


© Copyright 2026