
Assessment of the Patient with Hyperacute Stroke: Imaging and Therapy 1
Radiology
Review
James M. Provenzale, MD
Reza Jahan, MD
Thomas P. Naidich, MD
Allan J. Fox, MD
Index terms:
Brain, CT, 10.1211
Brain, MR, 10.1214, 10.12144
Brain, infarction, 10.78, 17.78
Cerebral blood vessels, thrombosis,
173.78, 174.78
Review
Thrombolysis, 10.1265, 17.1265
Published online
10.1148/radiol.2292020402
Radiology 2003; 229:347–359
Abbreviations:
ACA ⫽ anterior cerebral artery
ECASS ⫽ European Cooperative
Acute Stroke Study
MCA ⫽ middle cerebral artery
NIHSS ⫽ National Institutes of Health
Stroke Scale
NINDS ⫽ National Institute of
Neurological Disorders and Stroke
PCA ⫽ posterior cerebral artery
tPA ⫽ tissue plasminogen activator
1
From the Department of Radiology,
Duke University Medical Center, Box
3808, Durham, NC 27710-3808
(J.M.P.); Department of Radiology,
University of California, Los Angeles
(R.J.); Department of Radiology,
Mount Sinai Medical Center, New
York, NY (T.P.N.); and Department of
Medical Imaging, University of Toronto, Sunnybrook & Women’s College Health Sciences Centre, Toronto,
Ontario, Canada (A.J.F.). From the
2000 RSNA scientific assembly. Received April 3, 2002; revision requested June 6; revision received October 17; accepted December 10.
Address correspondence to J.M.P.
©
RSNA, 2003
Assessment of the Patient
with Hyperacute Stroke:
Imaging and Therapy1
Neuroimaging is an important part of the assessment of patients with hyperacute
stroke. As new treatments that may reverse cerebral ischemia have been developed,
the role of neuroimaging has changed from simply anatomic depiction of early
infarction to identification, by means of physiologic (rather than simply anatomic)
information, of regions that are at risk for infarction. The goal of such imaging
techniques is to monitor successes and complications of recently developed treatments such as thrombolysis.
©
RSNA, 2003
Computed tomography (CT) remains the imaging modality that is most commonly used for
initial evaluation of the patient with hyperacute stroke. It is important that radiologists be
adept at recognizing the subtle findings of cerebral infarction in the first few hours after
symptom onset. However, advanced magnetic resonance (MR) imaging techniques are very
valuable in better defining the extent of initial infarct and in showing the region that is at risk
to proceed to infarction if no therapy is provided (ie, the so-called ischemic penumbra).
The U.S. Food and Drug Administration has approved intravenous recombinant tissue
plasminogen activator (tPA) for the treatment of acute ischemic stroke within 3 hours of
symptom onset. In this review, we will (a) explain the difficulties that are encountered
with commonly used neuroimaging techniques for hyperacute stroke assessment,
(b) explore the issues involved in determining mechanisms of stroke and the arterial
territory involved in an infarct, and (c) critically assess the methods available to reduce the
size of cerebral infarctions in the hyperacute setting.
INTRODUCTION
The proportion of the elderly in the general population has substantially increased in the
past few decades. The number of people with acute ischemic stroke has also increased. At
the same time, the past decade has seen the verification of new treatments for acute stroke,
which represents a true advance for stroke patients (1,2). Neuroimaging is an important
part of the assessment of patients for these new treatments, as well as for monitoring of
successes and complications.
For decades, the role of neuroimaging for acute stroke has been one of exclusion of
lesions that mimic ischemic stroke (eg, intracerebral hemorrhage, subdural hematoma,
cerebritis, hemiplegic or hemisensory migraine, and causes of focal seizures such as tumors
and arteriovenous malformations). Before the introduction of the new treatments, imaging could reasonably be performed within a rather wide time window after symptom
onset, because imaging findings did not typically alter stroke therapy.
The introduction of intravenous thrombolysis with tPA has radically changed the role of
neuroimaging for stroke evaluation. The notable randomized studies of intravenous
thrombolysis treatment have been the European Cooperative Acute Stroke Study (ECASS)
trial and the American National Institute of Neurological Disorders and Stroke (NINDS)
trial (1,2). Neuroimaging played an important (although different) role in each of these
studies. The ECASS trial prescribed that patients with stroke symptoms of less than 6 hours
in duration and who did not have identifiable infarction of greater than one-third of the
middle cerebral artery (MCA) territory on CT images be considered for randomization for
possible treatment with intravenous tPA (1). The ECASS results showed that many cases
were admitted to the trial despite large infarctions because of nonrecognition of the subtle
347
Radiology
findings of hyperacute infarction. These
findings, which had been described years
earlier, include decrease in gray matter
attenuation relative to that of white matter, sulcal compression, and high attenuation in the affected arteries (3). When
an expert ECASS panel classified the CT
images as showing less or more than onethird of the MCA territory, the large majority of the most serious hemorrhagic
complications were associated with infarcts greater than one-third of the MCA
territory and had a poorer outcome (4).
For those with small or no visible infarction, the outcome was significantly improved and the treatment was validated.
The importance of quick and accurate
evaluation of acute stroke patients to determine eligibility for thrombolytic therapy was firmly planted.
The NINDS trial established that intravenous tPA treatment is efficacious if administered less than 3 hours after symptom onset (2,5). Because multiple clinical
parameters must be verified before treatment, little latitude in time exists for imaging studies to be performed. The clinical catchphrase “time is brain” is used by
stroke associations, stroke teams, and
stroke neurologists to emphasize that
time-consuming complex imaging studies and analyses decrease the therapeutic
options available to patients and the likelihood of a successful intervention.
The field of stroke imaging has greatly
advanced in the past few years, and the
clinical utility of new techniques is under
investigation. However, the time limitations for imaging mandated by the brief
therapeutic window has allowed emphasis on easily accessible rapid imaging
techniques (such as CT) to be maintained, rather than less accessible longer
techniques (such as MR imaging). Unenhanced brain CT remains the most commonly performed neuroimaging technique prior to the decision to deploy
intravenous tPA (6). A well-trained radiologist will often be able to discern the
extent of early ischemia if appropriate
attention is paid to the unenhanced CT
study.
IMAGING FINDINGS IN
HYPERACUTE STROKE
The accuracy of interpretation of early
stroke on CT images is greatly improved
if each case is used as a self-learning
project (7). Critical comparison of initial
CT studies (obtained during the hyperacute stroke stage) to follow-up CT or
diffusion-weighted MR imaging studies is
348
䡠
Radiology
䡠
November 2003
Figure 1. Hypoattenuating basal ganglia sign in a 62-year-old man with ischemic symptoms
referable to the right MCA territory. (a) Transverse unenhanced CT image obtained 6 hours
after onset of symptoms shows subtle hypoattenuating appearance of the right lentiform
nucleus (arrows) relative to appearance of the left lentiform nucleus, consistent with early
infarction. (b) Transverse unenhanced CT image obtained 28 hours after onset of symptoms
shows that the right lentiform nucleus (arrows) now has a markedly hypoattenuating appearance.
an important method for increasing the
sensitivity and specificity of individual
image interpreters. To use images to help
diagnose the presence and extent of cerebral infarction within the time window
allowed for innovative stroke therapies, it
is important that the radiologist be familiar with the features of cerebral ischemia
evident on CT and MR images. These
findings are outlined in the following
sections.
CT Findings
CT findings obtained within the first
3– 6 hours of cerebral ischemia, when
present, are often subtle. Nonetheless, at
most institutions CT remains the initial
imaging study for evaluation of acute
stroke because it is widely accessible, convenient, has a short imaging time, and is
sensitive for detection of hemorrhage.
However, advances in CT imaging technology and innovations in image assessment have allowed CT findings to be documented earlier and earlier. For instance,
the conspicuity of infarcts on unenhanced CT images can be increased by
use of variable window width and center
level settings at a workstation (as opposed to printed film with standard CT
window settings) to accentuate the gray
matter–white matter contrast (8). The
distinction between normal brain and
edematous tissue is thereby increased.
The important CT findings during the
early stages of cerebral ischemia can be
classified as (a) mass effect, (b) hypoattenuating appearance of gray matter structures,
and (c) presence of one or more hyperattenuating arteries. Any combination of
these findings may be present, or all may
be absent.
The finding of hypoattenuating gray
matter structures is typically seen as a
gray matter structure becoming isoattenuating to adjacent white matter structures or, in essence, blurring of the gray
matter–white matter junction. One example is the so-called insular ribbon sign,
in which the insula (which is composed
of gray matter) becomes isoattenuating
to adjoining white matter (9). Another
example is hypoattenuation of the basal
ganglia, which then becomes isoattenuating to adjacent white matter structures
such as the internal capsule and the external capsule (Fig 1). Examples of early
mass effect include narrowing of the sylvian fissure (in MCA infarcts) or loss of
cortical sulci (Fig 2). The hyperattenuating artery sign is thought to represent
stasis of flow due to arterial thrombus;
this sign is most frequently seen in MCA
thrombosis but can be seen in any cerebral vessel (3,10). Unfortunately, normal
arteries relatively often appear hyperattenuating, and this sign should be careProvenzale et al
Radiology
Figure 2. Subtle mass effect as an indication of early infarction in a 72-year-old man with
symptoms referable to the left MCA. (a) Transverse contrast material– enhanced CT image
obtained 4 hours after onset of symptoms shows effacement of sulci in left temporal lobe
(arrows), as compared with the right temporal lobe, consistent with early infarction. (b) Transverse unenhanced CT image obtained 32 hours after onset of symptoms shows hypoattenuation
and increased mass effect in the left temporal lobe (straight arrows) and insula (curved arrow).
fully interpreted in light of clinical history and other CT findings.
MR Imaging
Conventional spin-echo MR imaging is
more sensitive and specific than CT for
detection of cerebral ischemia during the
1st few hours after symptom onset (Fig
3). The findings seen at this stage are
hyperintense signal on T2-weighted images, mass effect, loss of arterial flow
voids, and stasis of contrast material
within vessels in affected territories after
contrast material administration; in addition but less commonly, hypointense signal is seen on T1-weighted images (11).
Many early findings are analogous to
those seen on CT images. For instance,
the distinction between gray matter
structures and adjacent white matter
structures can be lost on T2-weighted MR
images (owing to increased signal intensity in white matter structures) in a manner similar to the loss of the gray matter–
white matter distinction seen on CT
images. On the other hand, loss of MR
imaging flow voids and stasis of contrast
material within arteries subserving an infarcted territory does not directly reflect
the presence of thrombus itself (as is the
case with the hyperattenuating artery CT
sign) but instead reflects stasis of flow
distal to a thrombus. Despite the greater
Volume 229
䡠
Number 2
sensitivity of conventional MR images
compared with CT images in the 1st few
hours, false-negative MR studies can be
seen within the 1st few hours if diffusionweighted or perfusion-weighted sequences
are not performed.
Diffusion-weighted MR imaging is a
technique that is even more sensitive
than conventional MR imaging for detection of hyperacute cerebral ischemia (12).
For this reason, it is routinely used at
centers designed for treatment of early
stroke. Diffusion-weighted MR imaging is
based on the principle that the random
(brownian) motion of water molecules in
living tissues can be quantitatively measured by using specific gradient pulses in
conjunction with a 90°–180° pulse sequence. After application of such a pulse
sequence, signal is lost in tissues due to a
variety of factors. Tissues with a higher
rate of water diffusion undergo greater
signal loss in a given period of time than
do tissues with a lower rate of water diffusion. As a result, tissues with a lower
rate of water diffusion appear brighter.
After the onset of cell death (cytotoxic
edema), mechanisms for maintaining
steady-state proportions of intracellular
and extracellular water are altered, and
the proportion of water in the intracellular
space increases. The overall rate of microscopic water motion within such tissue is
diminished. Therefore, tissues containing
cells undergoing cytotoxic edema appear
bright on diffusion-weighted images. High
signal intensity on diffusion-weighted images can be seen in the 1st few hours after
stroke onset (ie, within the generally accepted time frame for thrombolysis), at a
time when T2-weighted images still show a
normal appearance (Fig 4) (12). Results of
animal studies have shown that abnormal
signal intensity on diffusion-weighted images can be seen within minutes after the
onset of cerebral ischemia (12). However,
because cerebral ischemia does not occur
under controlled conditions in humans
(such as is the case in animal experiments),
the precise time of onset of abnormal signal intensity in humans is not known with
certainty. In addition, in many cases of
hyperacute stroke in which hyperintense
signal is already present on T2-weighted
images, diffusion-weighted imaging better
defines the size of the ischemic region.
Although diffusion-weighted ischemic
changes are generally considered to be
permanent (and therefore reflect infarction) in clinical studies, recent evidence
has shown that in some cases such
changes can be reversed with prompt
treatment. In one study in which large
artery recanalization was achieved by using tPA within 6 hours of symptom onset
(13), diffusion-weighted image abnormalities were seen to substantially decrease in a number of patients within 9
hours after thrombolysis. In about half of
patients, however, a secondary increase
in the size of the diffusion-weighted imaging abnormality was seen within 1
week.
Although diffusion-weighted imaging
has proved to be a valuable tool for evaluation of hyperacute stroke, in most
cases diffusion-weighted images do, in
fact, show regions of irreversible ischemia. However, it is also important for
the stroke neurologist to define the area
that is at risk of proceeding to infarction
if no therapy is administered. MR perfusion imaging is a technique that allows
depiction of both areas of irreversible
ischemia and areas of reversible ischemia
(Fig 5). MR perfusion imaging can be performed by using various techniques, including exogenous techniques (eg, use of
infusion MR contrast agents) and endogenous techniques (eg, arterial spin tagging) (14). In addition, exogenous methods can be performed by using T2*weighted techniques or T1-weighted
techniques. However, dynamic susceptibility-contrast (T2*-weighted) MR imaging is probably the most commonly used
technique for stroke imaging, with many
Assessment of the Patient with Hyperacute Stroke
䡠
349
Radiology
Figure 3. Discrepancy between size of infarct seen on CT and MR images in a 59-year-old man with ischemic symptoms referable to the right
hemisphere. (a) Transverse unenhanced CT image obtained 16 hours after symptom onset shows right frontal lobe infarct (straight arrow)
containing hemorrhagic regions. Note a more subtle area of hypoattenuation (curved arrow) posterior to hemorrhagic focus, consistent with
another region of early infarction. (b) Transverse diffusion-weighted MR image (b ⫽ 1,000 sec/mm2) obtained 4 hours after a shows area of high
signal intensity consistent with infarction in a region larger than that seen in a. Apparent diffusion coefficient map (not shown) showed decrease
of approximately 40% in apparent diffusion coefficient, indicating restricted water diffusion (consistent with early infarction) in this region
compared with that of normal brain. (c) Dynamic susceptibility-contrast (T2*-weighted) cerebral blood volume map (repetition time msec/echo
time msec, 1,500/80) obtained a few minutes after b shows region of decreased cerebral blood volume (arrows) that conforms closely to region of
restricted water diffusion shown in b. Therefore, a matched diffusion-perfusion abnormality is seen in this patient.
of the other techniques reserved for tumor imaging or other research topics. In
the dynamic susceptibility-contrast technique, a bolus of MR contrast material is
rapidly infused intravenously and a hemodynamic map is generated that is
based on the degree of signal intensity
decrease produced by the contrast material. From such maps, various parameters,
such as relative cerebral blood volume,
mean transit time, and bolus arrival time,
can be calculated.
The exact role of each of the major MR
perfusion parameters in evaluation of the
hyperacute stroke patient is a matter of
active debate. However, it appears that
mean transit time maps generally show
the largest area of abnormality and often
overestimate final infarct size; relative cerebral blood volume maps tend to underestimate final infarct size. In one study in
which investigators compared blood volume maps, blood flow maps, and mean
transit time maps with change in size
from initial infarct size to final infarct
size(15), a mismatch between initial
blood flow maps and a diffusion abnormality more often predicted growth of
infarct than did a mismatch between initial blood volume maps and a diffusion
abnormality. In that study, however,
blood volume maps best correlated with
change in infarct size from initial imag350
䡠
Radiology
䡠
November 2003
Figure 4. Discordant findings between T2-weighted and diffusion-weighted MR images in a
63-year-old man with ischemic symptoms of 3 hours duration referable to the right hemisphere.
(a) Transverse T2-weighted MR image (2,700/80) shows no abnormalities in the right hemisphere. (b) Diffusion-weighted MR image (b ⫽ 1,000 sec/mm2) obtained a few minutes after a
shows two foci of high signal intensity in the right centrum semiovale. Apparent diffusion
coefficient map (not shown) confirmed that these regions had restricted water diffusion, consistent with early infarction.
ing to follow-up imaging. The authors
noted that this finding may have reflected the result of threshold effects.
Another MR perfusion imaging parameter that shows preliminary promise is
flow heterogeneity (16). The capacity to
Provenzale et al
Radiology
Figure 5. Discordant findings between diffusion-weighted and hemodynamic MR images in a 60-year-old man with ischemic symptoms of 5 hours
duration referable to the left hemisphere. (a) Transverse contrast-enhanced T1-weighted MR image (500/20) shows stasis of contrast material in
many arteries within the left MCA distribution (arrows). (b) Transverse diffusion-weighted MR image (b ⫽ 1,000 sec/mm2) obtained during the same
MR examination as a shows focal regions of high signal intensity within the anterior portion of the left MCA territory. On apparent diffusion
coefficient map (not shown), these regions were seen to have restricted water diffusion, consistent with early infarction. Posterior portion of MCA
territory has normal signal intensity and normal apparent diffusion coefficient values. Therefore, the area containing arteries showing stasis of
contrast material was larger than that of restricted diffusion. (c) Mean transit time map obtained a few minutes after b. Prolonged mean transit time
(consistent with ischemia) is shown as red and orange areas; normal transit time is yellow. Large region of prolonged mean transit time (arrows)
is seen. Note that area of ischemia on this map is much larger than area of restricted water diffusion seen in b; however, it conforms relatively well
to the area of stasis of contrast material seen in a. The portion of tissue with prolonged mean transit time that has normal signal intensity on b
(diffusion-perfusion mismatch) may represent the so-called ischemic penumbra.
alter the heterogeneity of blood transit
times (also referred to as flow heterogeneity) is believed to be a major function
of the cerebrovascular autoregulatory
system. In normal brain tissue, probability density functions of relative flows
show a distribution of values that are
skewed toward high capillary flow velocities. In animals, decreases in cerebral
perfusion pressure are associated with
loss of high-flow components (17). Recently, investigators have shown that increases in mean transit time are associated with loss of the high-flow-velocity
components and produce a resultant homogenization of capillary flows, which
was predictive of final infarct size (16).
It is generally accepted that tissue that
is seen to have abnormalities on both
perfusion and diffusion-weighted images
has already undergone infarction (ie, irreversible ischemia). However, tissue that
is seen to have perfusion abnormalities
but normal diffusion imaging properties
is thought by many investigators to represent reversible ischemia. In particular,
tissue showing such a “diffusion-perfusion mismatch” is thought by many investigators to represent the so-called ischemia penumbra—that is, the region of
Volume 229
䡠
Number 2
decreased perfusion that is potentially reversible because it is above the level critical for maintenance of the Na⫹ K⫹
⫺
ATPase pump (18). This penumbra has
long been sought as a potential therapeutic target; whether this mismatch represents a therapeutic target is a matter of
active investigation. However, this information is potentially valuable to the
treating physician because it helps determine the risk-benefit ratio in a particular
patient. For example, a patient with no
(or a very small) degree of mismatch is
considered unlikely to benefit from
thrombolytic therapy. In such a patient,
the ratio of benefit (clinical recovery) to
cost (ie, complications of therapy) would
generally be considered to be low.
Recently, hemodynamic CT imaging
has become available, which may provide the hemodynamic information
needed for assessment of hyperacute
stroke with the use of CT, rather than
MR, imaging. Early results with this technique have shown that it is sensitive for
detection of early cerebral ischemia (19).
Postprocessing of CT perfusion imaging
data, like that for MR perfusion imaging
data, is short (ie, can be performed in less
than 2 minutes) and does not substan-
tially delay decision making in the hyperacute stroke setting. Results of early investigations of CT perfusion imaging
(20) suggest that cerebral blood volume
deficits may indicate regions of irreversible hemodynamic deficit (in a manner
similar to that provided by diffusionweighted MR images). Furthermore, cerebral blood volume deficits may predict
minimal final infarct size (20). On the
other hand, some investigators (21) believe cerebral blood volume and mean
transit time deficits on CT perfusion images may represent both infarcted tissue
and surrounding tissue that is likely to proceed to infarction if no therapy is provided
(ie, the so-called ischemic penumbra).
VARIABILITY OF VASCULAR
DISTRIBUTIONS AND
ETIOLOGY OF BORDER-ZONE
INFARCTIONS
Physicians considering whether to treat
acute stroke by means of intraarterial
thrombolysis or conservative management often use anatomic CT or MR images to assess affected vascular territories
and determine whether infarction is em-
Assessment of the Patient with Hyperacute Stroke
䡠
351
Radiology
bolic or hypotensive in nature. Unfortunately, increasing evidence indicates that
neither the territories affected nor the nature of the stroke can be accurately diagnosed on the basis of such anatomic
studies. An evaluation of patterns of cerebral watershed territories illustrates the
extent of this problem. Schneider (22)
and Zulch (23) each defined border-zone
infarctions as ischemic lesions situated in
the border zone between two neighboring
vascular territories (22–26). The incidence
of such border-zone infarcts ranges from
0.7% to 3.2% of cerebral infarctions
(27,28). Early work suggested that lesions
restricted to the border zones would
more likely represent hypotensive events,
whereas those situated within the arterial
territories (and branches) would more
likely be embolic (29–32). Continuing research has now led to major reassessment
of previous concepts of normal vascular
distributions, border zones, and hypotensive infarctions.
Difficulties in Determination of
Arterial Territories Affected by
Infarction
To determine whether an individual
has sustained a border-zone infarction,
one must be able to determine the territories supplied by the major intracerebral
arteries. However, initial indications that
one could reliably use the anatomic locus
of the infarction to predict the involved
vessel are now open to question. It is
apparent that identification of specific arterial territories in an individual patient
is more difficult than was initially realized. For instance, marked variation has
been found in the laterality of the anterior cerebral artery (ACA) supply. One
ACA supplies portions of the contralateral cerebral hemisphere in 12%–25% of
brains (33–35). The area of contralateral
supply is usually small, but in 4%–7% of
brains there is a major contralateral supply (33–35). In addition, great variability
is seen in the volume of brain supplied by
the major cerebral arteries. In one study
of vascular distributions of major cerebral arteries, van der Zwan et al (26)
showed that no groups of hemispheres
exhibited the same combinations of arterial territorial volumes. The ACA could
supply 18%–35% of any one hemisphere;
the MCA, 34%– 64% of the same hemisphere; and the posterior cerebral artery
(PCA), 9%– 40% of that hemisphere (26).
Thus, van der Zwan et al concluded that
“the location of a cortical infarct in or at
the border of the area of variation, visualized with CT or MR imaging, gives no
352
䡠
Radiology
䡠
November 2003
certainty about the pathogenesis of the
disease. Although the occurrence of bilateral infarcts may suggest a hemodynamic
pathogenesis, the interpretation of the
CT or MR images based exclusively on
the location of the infarct may lead to
false diagnosis” (25, p 936).
Identification of Specific Border
Zones in Individual Patients
Another problem encountered in determining whether an infarct is a borderzone infarct is that of definition of specific border zones in a particular patient.
van der Zwan et al (24 –26) studied the
vascular territories in 25 unfixed human
brains obtained at postmortem examination. After ligation of the posterior medial choroidal and anterior choroidal
arteries, these authors individually cannulated the two ACAs distal to the anterior communicating artery, the two PCAs
distal to the posterior communicating artery, and the two MCAs. They then simultaneously infused colored medium
into all arteries, taking care to maintain
the perfusion pressure in each vessel at a
constant 93 mm Hg until the distributions of the perfusate stabilized at welldefined borders. They designated these
borders the “equal pressure boundaries.”
van der Zwan et al (24 –26) found that
the locations of the equal pressure
boundaries (EPBs) varied greatly in both
the superficial and the deep arterial distributions of each vessel. Not one brain
showed a symmetric pattern of intracerebral perfusion. So many variations existed that the authors simply described
the results in terms of minimal and maximal regions of distribution for each vessel. Notably, the MCA territory on the
convexity extended far upward to reach
the interhemispheric fissure, separating
the convexity distributions of the ACA
from those of the PCA in 26% of cases
(25). The EPB for the ACA and PCA lay
anywhere along the length of the brain
from the superior frontal gyrus to the
occipital lobe on both the superior and
the medial surfaces of the hemisphere
(25). The EPB for the ACA and MCA varied equally widely over the convexity
from the superior frontal gyrus to the
inferior frontal sulcus, while the EPB for
the PCA and MCA varied anywhere from
the superior temporal sulcus on the convexity to the occipitotemporal sulcus on
the inferior surface of the brain (25).
Thus, the superior portion of the precentral gyrus (Brodmann area 4) was supplied by the ACA in 94% of cases, the
MCA in 4% of cases, and the PCA in 2%
of cases. Furthermore, the superior portion of the postcentral gyrus (Brodmann
areas 1–3 and 5) was supplied by the ACA
in 78% of cases, the MCA in 6% of cases,
and the PCA in 16% of cases (25). Curiously, these authors did not address the
problem of bihemispheric ACA supply.
They acknowledged that ligation of the
choroidal vessels led to distortion of the
EPB along the hippocampus but did not
elaborate on any possible distortion introduced into the other territories assessed (25).
Because of the great variability outlined above, it is now common to describe cortical infarctions as “territorial”
if they fall completely within the maximum possible “van der Zwan territory”
of a cerebral artery, and as potentially
“border zone” if the infarction falls outside these maxima.
Reassessment of Stroke Mechanism
in Border-Zone Infarctions
Another difficulty encountered by the
radiologist assessing imaging studies in a
patient suspected of having a borderzone infarction is that the mechanism of
infarction in border-zone infarcts is less
clear than was previously thought. Border-zone (watershed) infarctions were
originally conceived of as the common
consequence of severe large vessel disease
complicated by acute (or acute plus later
sustained) hypotension (29 –31). However, border-zone infarctions are uncommon in unselected patients with acute
stroke and do not occur more often in
patients with hemodynamic compromise
than in those with cardiac sources of
stroke (36). No evidence has been found
for a selective increase in cerebral oxygen
extraction fraction in patients with carotid artery occlusion (37,38). In one
study of 110 patients with carotid artery
occlusion (39), no statistically significant
difference was found in the incidence of
cortical border-zone infarctions between
patients with and those without evidence
of hemodynamic compromise (measured
as increased oxygen extraction fraction at
positron emission tomography). Cortical
border-zone infarcts have been noted as
often in patients with cardiac sources of
embolism (3.2%) as in those with severe
carotid artery obstruction (⬎70% stenosis or occlusion) (3.6%) (36). Moreover,
border-zone infarctions are rarely (5.2%)
the initial manifestation of carotid occlusion, as might be expected for acute lowflow states (40). Instead, border-zone infarction accounts for 72% of delayed
strokes in patients with occluded internal
Provenzale et al
Radiology
carotid arteries (40). Thus, the specific
hemodynamic basis of border-zone infarctions is not established.
Considerations of the causes of borderzone infarction now emphasize the
known phenomenon of “directed embolization” (41– 44). The majority of cerebral artery bifurcations are of unequal
size, with the smaller vessel exiting at an
acute angle to the larger parent vessel. As
a consequence, particulate matter may be
directed with the flow toward the end
territories of the major vessels at the border zone (44). It has been shown (41) that
experimental embolic infarctions involved the ACA in 8% of trials if only one
embolus was released into the circulation
but involved the ACA in 50% of trials if
several emboli were released (in which
case the first embolus never lodged in the
ACA). Therefore, an initial occlusion of
MCA branches may redirect flow (and
flow-directed emboli) into the ACA (41).
These observations have subsequently
been confirmed and the concept extended to the entire cerebrovascular tree
(42,43). Cerebral watershed infarction as
a result of emboli has been documented
in patients at postmortem examination,
resulting in the conclusion that the infarctions were caused by directed embolization (44). These data indicate the
high likelihood that border-zone infarctions result from directed cardiac or arterial emboli. Hennerici et al concluded
that “the cortical wedge-type of borderzone infarction, said to result from hemodynamic compromise in low-flow
perfusion territories, is an ambiguous observation and may be seen in patients
with cerebral embolism and hemodynamic compromise due to severe carotid
disease” (36). Microemboli in relation to
border-zone infarctions are now well recognized (29,45). Recently, attempts have
been made to synthesize these concepts
by suggesting that reduced cerebral perfusion limits the ability of blood flow to
clear emboli from the vessels, allowing
them to pass to the border zones (46).
Emerging Concepts
The vascular resistance of arteries in
the white matter has been shown to be
about 3.8 times the vascular resistance in
the gray matter (26). Allowing for that
difference, the caliber (diameter) of the
parent cerebral artery correlates well (r ⫽
0.73) with the volume of the gray and
white matter irrigated by each vessel (26).
The mean diameters of the postcommunicating ACA (2.24 mm), the postcommunicating PCA (2.04 mm), and the
Volume 229
䡠
Number 2
MCA (2.70 mm) lie in direct relative proportion as the supplied territory (26).
Measurement of the diameters of these
vessels in healthy individuals would provide one measure of the anatomic variations present in each hemisphere and
perhaps serve as a guide to later analysis
of any strokes.
Deep border-zone infarctions appear to
correlate well with hemodynamic compromise (47). It has been shown that in a
group of patients with internal carotid
occlusion, a “rosary” pattern of deep
white matter infarcts was present only in
patients with increased cerebral oxygen
extraction fraction in the involved hemisphere (sensitivity, 22%; specificity, 100%)
(39). This pattern was described as consisting of three or more lesions 3 mm in diameter or larger arranged in a linear fashion
parallel to the lateral ventricle in the centrum semiovale or corona radiata. Results
of other studies (48 –51) also support the
validity of deep watershed infarctions being related to hemodynamic compromise.
Thus, at least one imaging sign appears to
correlate with hemodynamic compromise.
Analysis of Infarct Frequency
Distribution
Another approach to infarct analysis is
to determine the frequency with which
infarctions affect each of a large number
of defined anatomic zones. Specific analysis of the distribution of any infarct may
then be compared with the zonal frequency distributions of diverse infarcts as
a guide to the nature of the lesion. Application of such analysis to 30 border-zone
infarctions studied among 150 supraventricular infarctions showed that parasagittal border-zone cortical infarctions exhibit a bimodal frontal and parietal
distribution (52). The anterior corticalsubcortical border zone (ACA/MCA) infarcts show peak frequency at the junction of the superior frontal sulcus and
precentral sulcus and involve the adjacent portions of the superior frontal gyrus, middle frontal gyrus, precentral gyrus, and paracentral lobule. The posterior
cortical-subcortical (distal ACA/MCA or
PCA/MCA) border-zone infarctions most
frequently involve the superior parietal
lobule and the precuneus. As a consequence, detection of small foci of abnormal signal intensity specifically at these
two sites should increase the index of
suspicion for a possible source of emboli
or other risk factors for stoke. However,
until the individual vascular territories
can be displayed easily in vivo at the time
of stroke assessment, imaging display of
infarct topography can provide only inferences with regard to the specific arteries affected and the mechanisms involved.
THROMBOLYTIC THERAPY
The majority of ischemic strokes are due
to thromboembolic arterial occlusions
(53,54). Angiographic studies obtained in
stroke patients within 8 hours of symptom onset show arterial occlusions corresponding to the symptoms in more than
80% of cases (6,55). An acute arterial occlusion rapidly produces a core of infarcted brain tissue surrounded by hypoxic but potentially salvageable tissue—
in other words, the ischemic penumbra
(56 –59).
The important role of thrombosis in
stroke combined with the success of
thrombolysis in acute myocardial infarction has generated great interest in cerebral fibrinolysis. The goal of thrombolytic therapy is rapid restoration of blood
flow and preservation of the ischemic
penumbra. The U.S. Food and Drug Administration has approved intravenous
recombinant tPA for the treatment of
acute ischemic stroke within 3 hours of
symptom onset (2). In addition, intraarterial thrombolysis has been shown to
improve neurologic outcome in patients
with acute ischemic stroke (6). The following sections highlight the results of
various clinical trials.
Intravenous Thrombolysis
Two thrombolytic agents have been
utilized in trials of acute stroke treatment
with intravenous medication: streptokinase and tPA (1,2,60 – 64).
Intravenous streptokinase.—Three trials
of intravenous streptokinase for treatment of acute stroke have been reported:
the Multicenter Acute Stroke Trial–Europe, the Multicenter Acute Stroke Trial–
Italy, and the Australian Streptokinase
Trial (60 – 62). The dose of streptokinase
given in these trials was the same as that
given in the acute myocardial infarction
trials, namely, 1.5 million IU. Treatment
was initiated within 4 hours in the Australian trial and within 6 hours in the
other two trials (60 – 62). All of the streptokinase trials were halted prematurely
due to poor outcome or an excess rate of
mortality in the treated group, making it
unlikely that streptokinase will be used
in subsequent randomized trials for acute
ischemic stroke.
Several reasons can be cited for the failure of streptokinase in these trials. First,
Assessment of the Patient with Hyperacute Stroke
䡠
353
Radiology
the dose of streptokinase was likely high
because it was equivalent to the dose
used in the coronary thrombolysis trials.
A lower dose might have been effective
but with lower mortality. For instance,
approximately two-thirds of the cardiac
dose was used in the successful NINDS
intravenous tPA trial (2). Second, in all
three trials the patients reporting negative results were treated up to 4 hours and
6 hours after onset of symptoms. The
investigators in the Australian trial (62)
suggested that streptokinase may be effective if given within 3 hours of symptom onset. However, the number of patients treated within this time was not
large enough to show statistical significance. The third reason for failure of
streptokinase may have been the use of
antiplatelet and antithrombotic agents
within the first 24 hours after treatment,
resulting in a higher risk of hemorrhage.
In the NINDS tPA trial, use of antiplatelet
and antithrombotic agents was avoided
in the first 24 hours after administration
of tPA, perhaps leading to safer use of the
thrombolytic drug. On the basis of results
from the abovementioned studies, the
American Academy of Neurology recommendation regarding streptokinase in
treatment of acute stroke (65), published
in 1996, states that outside the setting of
a clinical trial, streptokinase administration is not indicated for the management
of acute ischemic stroke.
Intravenous tPA.—Four phase 3 trials of
intravenous tPA for acute ischemic stroke
have been published (1,2,63,64). Food
and Drug Administration approval of tPA
was based on data from the NINDS tPA
trial (2). The study was composed of two
clinical trials, part I and part II, with both
trials conducted in identical fashion by
using the same inclusion and exclusion
criteria (2). Altogether, 624 patients were
treated within 3 hours of symptom onset
with a dose of 0.9 mg of tPA per kilogram
of body weight and a maximum dose of
90 mg.
In part I of the study, early outcome
was evaluated. The primary hypothesis
tested in part I was that at 24 hours, a
greater proportion of patients treated
with tPA would improve by 4 or more
points on the National Institutes of
Health Stroke Scale (NIHSS), as compared
with scores of patients receiving a placebo. Indeed, 47% (67 of 144) of patients
treated with tPA improved by 4 or more
points on the NIHSS, compared with
39% (57 of 147) in the placebo group
(P ⫽ .21).
In part II of the study, the long-term
functional outcome of patients at 3
354
䡠
Radiology
䡠
November 2003
months was evaluated. The primary hypothesis tested in part II was that there
would be a significant difference between
the tPA group and the placebo group in
terms of the proportion of patients with
minimal or no deficit. Minimal or no deficit was defined according to one of the
following four outcome scales: NIHSS
score of 0 or 1, Barthel Index greater than
95, modified Rankin Scale score of 0 or 1,
and Glasgow Outcome Scale score of 1.
For all four outcome measures, the
tPA treated group fared better than the
placebo group. The tPA patients were
32% (NIHSS), 38% (Barthel Index), 50%
(modified Rankin Scale), and 55% (Glasgow Outcome Scale) more likely to have
a good outcome as defined above. The
absolute percentage difference was 11%–
13%, depending on the outcome measure being used—that is, for every 100
patients treated with tPA, there would be
an additional 11–13 patients with minimal or no deficit, compared with 100 patients not treated with tPA. The NINDS
investigators have also reported follow-up in these patients at 12 months
(66,67). The patients treated with tPA
were at least 30% more likely to have
minimal or no deficit at 1-year follow-up.
There was no significant difference in
mortality at 12 months between the two
groups (24% vs 28%, P ⫽ .29). The results
indicate a sustained benefit of tPA at 12
months. Overall, 6% of the patients receiving tPA had symptomatic intracranial hemorrhage, compared with 0.6% in
the placebo group. Despite the higher
rate of symptomatic intracranial hemorrhage in the tPA group, there was no significant difference in mortality between
the two groups.
Several explanations have been proposed to account for these apparently
contradictory findings (68). On the one
hand, tPA may have decreased mortality
by reducing the size of infarction and,
hence, reducing the likelihood of death.
Alternatively, the patients with symptomatic intracranial hemorrhage had
large infarction that, even without hemorrhage, would have had high associated
mortality. In other words, in the tPA
group, patients with large infarctions
died with hemorrhagic transformation,
while in the placebo group these same
patients died but without hemorrhagic
transformation. This would result in a
higher rate of symptomatic intracranial
hemorrhage in the tPA group but no significant difference in mortality between
the two groups.
The NINDS investigators sought to
identify variables associated with hemor-
rhage in patients who received tPA (5).
The only variables independently associated with a risk of symptomatic intracranial hemorrhage were severity of neurologic deficit as measured with the NIHSS
and presence of brain edema or mass effect on CT images obtained prior to treatment. Despite this fact, however, patients
with a severe neurologic deficit were
more likely to have a favorable outcome
if treated with tPA than were those who
received the placebo.
The results were similar in the analysis
of patients with edema or mass effect
seen on pretreatment CT images. The investigators thus concluded that despite a
higher rate of symptomatic intracranial
hemorrhage, patients with severe stroke
or edema or mass effect on pretreatment
CT images are reasonable candidates for
tPA if it is administered within 3 hours of
symptom onset (5). The NINDS investigators also performed a subgroup analysis to identify stroke patients in whom
treatment with tPA was particularly hazardous or efficacious (69). They concluded that no pretreatment information
significantly affected outcome.
Three additional phase 3 trials with intravenous tPA have been reported:
ECASS, ECASS II, and Alteplase Thrombolysis for Acute Non-interventional
Therapy in Ischemic Stroke (ATLANTIS)
(1,63,64). All had negative results. The
ECASS was a prospective, multicenter,
double-blind, placebo-controlled study
and differed from the NINDS study in
several important aspects (1). First, the
dose of tPA in ECASS was 1.1 mg/kg with
a maximum dose of 100 mg; the NINDS
study used a dose of 0.9 mg/kg and a
maximum dose of 90 mg. Second, patients were treated up to 6 hours after
onset of symptoms. Third, patients with
a major early sign of ischemia on CT images (defined as hypoattenuation involving more than one-third of the MCA territory) were excluded. The primary
treatment end point included Barthel Index and modified Rankin Scale scoring at
90 days. In the intent-to-treat analysis,
no significant difference in either of the
two primary end points was seen between the two groups of patients, which
was thought to be due to the fact that
there were protocol violations in a substantial number of patients included in
the analysis. To further address this issue,
an analysis of the target population was
also performed by excluding 109 patients
that were included in the trial but were
later found to have been associated with
protocol violations. Analysis of the target
population revealed no significant differProvenzale et al
Radiology
ence in Barthel Index scores between the
two groups but a significant difference in
the modified Rankin Scale score in favor
of the tPA treated patients. Sixty-six of
the excluded 109 patients were excluded
because of abnormalities on CT images
(52 had major early infarction signs, two
had primary hemorrhage, 12 had unavailable or uninterpretable CT images).
The investigators concluded that tPA is
beneficial in improving some functional
outcomes in a subgroup of patients with
moderate to severe neurologic deficits
and without extended signs of ischemia
on initial CT image. Identification of this
subgroup of patients is difficult, however,
and largely depends on identification of
early signs of infarct on CT images. Furthermore, treatment of ineligible patients is associated with an unacceptable
risk of hemorrhage and death. Therefore,
the investigators concluded that intravenous tPA administration within 6 hours
of symptom onset could not be recommended.
In the ECASS, no significant difference
in the frequency of parenchymal hemorrhage in general was found between the
tPA and placebo groups in either the intent-to-treat or the target population analyses. However, large parenchymal hemorrhages were more frequent in the tPAtreated group. For that reason, the ECASS
II trial was designed with a lower dose of
intravenous tPA (0.9 mg/kg, chosen to
match NINDS criteria) given within 6
hours of symptom onset. The investigators found no significant difference in
the primary end point (modified Rankin
Scale score at 90 days) between the tPA
and placebo groups. The results did not
confirm a significant benefit for tPA.
The approved use of tPA remained restricted to patients presenting within 3
hours of symptom onset. However, this
severely restricted the use of the drug, as
evidenced by data showing that, since
approval of the drug, fewer than 5% of all
stroke patients were receiving tPA
(64,70,71). Therefore, the ATLANTIS trial
set out to assess the safety and efficacy of
tPA (0.9 mg/kg, with maximum dose of
90 mg as in NINDS trial) in patients 3–5
hours after symptom onset. This trial was
a phase 3, placebo-controlled, doubleblind, randomized study. The primary
end point was an excellent neurologic
recovery at day 90 (NIHSS score ⱕ 1). In
the target population, 32% of the patients in the placebo group and 34% of
the patients in the tPA group had an excellent recovery at 90 days (P ⫽ .65).
There was a significant increase in the
occurrence of symptomatic intracranial
Volume 229
䡠
Number 2
hemorrhage in the tPA group (1.1% vs
7.0%; P ⬍ .001). Therefore, this study did
not show a significant benefit of tPA in
patients treated 3–5 hours after ictus.
On the basis of these results, the recommendation of the American Academy
of Neurology is that tPA administered intravenously within 3 hours of symptom
onset is indicated in patients meeting the
inclusion and exclusion criteria as set
forth on the basis of the NINDS tPA trial
data (65). However, intravenous administration of tPA more than 3 hours after
stroke is not recommended.
Despite the approval of tPA for treatment of acute ischemic stroke, outlined
above, there has been much trepidation
about its use, and several criticisms have
been advanced. It has been pointed out
that many patients with symptoms of
acute ischemic stroke may not have occlusive thromboemboli (72). The evaluation of patients with stroke is typically
performed rapidly, with no pathophysiologic assessment to document the presence of an occlusive clot. It has been argued, then, that many patients will
receive a potentially dangerous drug although they do not have the problem for
which the drug is intended. Additionally,
concern has been raised about whether
use of tPA would be less efficacious in
general community practice, as compared with use in the idealized tertiarycare university hospital conditions under
which the trial was carried out.
The Standard Treatment with Alteplase
to Reverse Stroke, or STARS, study was
designed to address concerns over the use
of tPA in the community setting (73). In
this prospective multicenter study, the
results of intravenous tPA treatment of
patients with acute ischemic stroke in 57
medical centers (24 academic, 33 community) in the United States were reported. The results confirmed the beneficial effects of tPA administered within 3
hours of symptom onset, with findings
similar to those obtained in the NINDS
trial. However, conflicting data were
found in another study in which results
were reported for stroke patients treated
with intravenous tPA in essentially all
the hospitals in Cleveland, Ohio (74).
The results of that study showed a significantly higher rate of symptomatic intracranial hemorrhage and mortality in patients receiving the drug. However, a
large percentage of patients in the study
had deviations from national treatment
guidelines. As in other studies, evidence
of a learning curve for use of tPA, which
was reflected in a decrease in the occurrence of guideline deviations and an in-
crease in the rate of intravenous tPA use
over time, was seen in the Cleveland experience (74).
Intraarterial Thrombolysis
In order for thrombolytic drugs to induce lysis of acute thromboemboli, a
therapeutic dose of the drug must reach
the target. However, if major arteries are
blocked, intravenous administration
may result in insufficient drug delivery.
Therefore, much interest has developed
in intraarterial delivery of thrombolytic
agents. Compared with intravenous therapy, localized intraarterial thrombolysis
has the theoretical advantage of achieving faster and more complete recanalization with use of a lower dose. Because the
agent is administered during cerebral angiography, clot lysis can be directly assessed, allowing drug infusion to be
stopped when clot lysis is achieved (Fig
6). This feature allows an optimal amount
to drug to be administered and may diminish the risk of adverse effects. In addition, intraarterial treatment can be initiated up to 6 hours after symptom onset,
and the therapeutic window is wider
than for that for intravenous therapy.
The first report of intraarterial thrombolysis, in which five patients with vertebrobasilar occlusion were treated, was
published in 1983 (75). Three patients
had successful recanalization, and all
three had subsequent neurologic improvement. One year later, the same investigators reported treating two patients
with distal internal carotid artery occlusions by using urokinase (76). Both patients showed clinical improvement.
Since then, a large number of case series
have been published (77–90). Neurologic
improvement has been reported to be
variable in these studies: Minimal or no
neurologic deficit was reported in 15%–
75% of patients. Differences in multiple
factors across studies likely contributed
to this wide variation in outcome, including differences in (a) grading system
used for assessment of outcome, (b) dose
of thrombolytic agent used, (c) baseline
patient demographics (eg, age and baseline neurologic status), and (d) sites of
arterial occlusion. Complete recanalization was seen, on the average, in approximately 40% of patients, and partial recanalization was seen in 35% (77–90).
These rates of recanalization are higher
than those reported for intravenous
thrombolysis (96 –98). Thus far, however,
no randomized trials have been performed to compare intraarterial and intravenous thrombolysis.
Assessment of the Patient with Hyperacute Stroke
䡠
355
Radiology
Figure 6. Reversal of diffusion abnormalities
after intraarterial thrombolysis in a 75-year-old
woman with acute onset of left hemiplegia.
(a) Right common carotid angiogram, anteroposterior view, obtained before therapy shows
occlusion of proximal portion of right MCA.
(b) Right common carotid angiogram, anteroposterior view, obtained after intraarterial
thrombolysis with 20 mg of tPA infused during
2 hours shows complete recanalization of the
artery. (c) Top left: Diffusion-weighted MR image (DWI; b ⫽ 1,000 mm/sec2) obtained before
therapy shows high signal intensity consistent
with restricted diffusion, indicative of ischemia. Top right: Apparent diffusion coefficient
(ADC) map obtained before therapy confirms
that restricted diffusion is present within area
of high signal intensity on diffusion-weighted
image. Bottom left: Diffusion-weighted image
obtained within a few hours after treatment
shows reversal of abnormal signal intensity
seen on pretreatment diffusion-weighted image. Bottom right: Apparent diffusion coefficient map obtained after therapy shows that
area of restricted diffusion has resolved. In this
patient, it was thought that ischemic penumbra included the region of restricted diffusion;
therefore, thrombolysis and resumption of
normal flow allowed rescue of penumbral tissue.
As with intravenous thrombolysis, only
results from randomized trials can be used
to answer questions regarding the safety
and efficacy of intraarterial therapy. Two
such randomized trials have been performed for intraarterial thrombolysis:
Prolyse in Acute Cerebral Thromboembolism Trial (PROACT) and PROACT II
(6,56). The larger of the two trials, PROACT II, included patients treated within 6
hours of symptom onset who had angiographically demonstrated occlusion of
the MCA (M1 or M2 occlusion) (6). The
primary outcome of the trial was the ability to live independently at 3 months
after stroke. Of the 474 patients who underwent angiography, 180 were enrolled,
with 121 receiving intraarterial prourokinase and low-dose intravenous heparin
and 59 receiving low-dose intravenous
heparin alone. At 2 hours, 67% of patients receiving prourokinase had complete or partial recanalization, compared
with 18% in the heparin-only group (P ⬍
.001). The primary outcome of the study
was attained by 40% of the patients
treated with prourokinase, compared
with 25% in the heparin-only group (P ⫽
.04). However, symptomatic intracranial
hemorrhage was seen in 10% of patients
undergoing thrombolysis, compared with
2% in the heparin-only group (P ⫽ .06).
Nonetheless, the authors of the study determined that intraarterial thrombolysis
within 6 hours of symptom onset was
356
䡠
Radiology
䡠
November 2003
shown to have a benefit in patients with
MCA occlusion. The U.S. Food an Drug
Administration did not approve prourokinase after the PROACT II study and instead asked that an additional study be
performed, requiring two positive phase
3 trials prior to approval of the drug. Ab-
bott Laboratories is currently considering
reopening the PROACT trial.
Intraarterial Thrombolysis Trials in
Posterior Circulation
A stroke in the posterior circulation
stroke differs in several respects from
Provenzale et al
Radiology
ischemic stroke in the anterior circulation. First, clinical outcome in patients
with vertebrobasilar occlusion is less favorable; death occurs in the majority of
patients, and severe deficit occurs in most
survivors (83,94,95). In addition, patients with posterior circulation ischemic
events often have coexistent severe intracranial large-artery atherosclerotic disease (96). This feature, which presents a
unique problem because of the high risk
of rethrombosis after treatment, is uncommon in anterior circulation ischemic
events (75,83,87). Study results have suggested that thrombolysis beyond 6 hours
in the anterior circulation can be associated with high rates of hemorrhagic transformation and poor outcome (102). No
conclusive data exist to indicate increased
risk beyond 6 hours in posterior circulation
strokes; however, to our knowledge, no
randomized trials of intraarterial thrombolysis in patients with vertebrobasilar
stroke have been performed. In addition, although thrombolysis has been attempted
up to 24 hours after symptom onset in
patients with posterior circulation ischemic events, the issue of how long a delay after symptom onset can be tolerated
before the start of treatment has not been
specifically examined (75,77,87).
In one pilot study in which the safety
and efficacy of intraarterial urokinase
were evaluated in patients with severe
brainstem stroke and vertebrobasilar occlusion, 16 patients with vertebrobasilar
occlusion were treated within 24 hours of
symptom onset (98). Incremental doses
of urokinase were administered until clot
lysis was achieved or a maximal dose of 1
million U was given. Complete or partial
recanalization was initially achieved in
13 of 16 (81%) patients. Of these, reocclusion occurred within 24 hours in two,
giving a final recanalization rate of 69%.
The 6-month functional status was assessed with the Barthel Index, with a good
outcome defined as a score 60 or greater.
Eleven (69%) patients survived, nine (56%)
with a good outcome and two (12%) with
severe deficit. Recanalization correlated
with survival (P ⫽ .02), but the time between symptom onset and thrombolysis
was not predictive of outcome. The authors concluded that intraarterial thrombolysis in the posterior circulation is safe,
feasible, and capable of achieving recanalization in the majority of patients.
Combined Intravenous and
Intraarterial Treatment
One major disadvantage of intraarterial thrombolysis is treatment delay due
Volume 229
䡠
Number 2
to the need to assemble the neurointerventional team and prepare the angiography suite. A combined approach of intravenous and intraarterial thrombolysis
allows the advantages of both treatment
strategies. Intravenous therapy is initiated without delay but at a lower dose
than is used in standard intravenous
therapy. This technique allows some tPA
to be given intraarterially, which provides a higher recanalization rate than
can potentially be achieved than with
intravenous treatment alone. The Emergency Management of Stroke study is the
only reported trial of combined intravenous and intraarterial thrombolysis (99).
This study was a double-blind randomized trial with a total of 35 patients enrolled within 3 hours of symptom onset.
Seventeen patients were randomized to
receive intravenous tPA at a dose of
0.6 mg/kg (maximum dose, 60 mg), and
18 patients in the second arm of the
study received an intravenous placebo.
These patients then underwent immediate angiography. If no clot was visualized, angiography was stopped. If a clot
was visualized, intraarterial treatment
with tPA was initiated with 20 mg of the
drug given over 2 hours or until recanalization was achieved. The study showed
higher recanalization rates in the combined intravenous-intraarterial group
(55% full recanalization) than in the intravenous-only group (10% full recanalization). The numbers of patients with
symptomatic hemorrhage in the two
groups were similar, and no differences
in 7-day or 3-month outcomes were seen,
although more deaths were recorded
in the combined intravenous-intraarterial group. The investigators concluded
that the combined approach was feasible,
reasonably safe, and worthy of further
study.
Currently, the combined intravenousintraarterial strategy is being evaluated in
a larger pilot trial, the Interventional
Management of Stroke trial, which is supported by the National Institutes of
Health. The trial involves 14 centers in
North America and will include 80 patients. Patients with an NIHSS score of
greater than 10 within 3 hours of symptom onset will be offered treatment with
intravenous tPA at 0.6 mg/kg, followed
by angiography. If an arterial occlusive
lesion persists, up to 22 mg tPA will be
injected intraarterially during 2 hours.
Outcomes will be compared with those of
the placebo group of the NINDS trial.
Mechanical Therapies
The experience of interventional cardiologists in treating acute myocardial infarction may predict the future of interventional neuroradiologists in treating
ischemic stroke. Randomized studies in
the setting of acute myocardial infarction
have shown the superiority of mechanical strategies such as angioplasty and mechanical clot lysis in improving outcome,
compared with outcomes associated with
thrombolytic agents alone (100). The use
of angioplasty in reopening cerebral vessels in patients with ischemic symptoms
has been reported (101). A potential disadvantage of this strategy is the possibility of forcing the clot into the deep
penetrating arteries, with worsening
ischemia and the potential risk of arterial
rupture. The Angiojet catheter (Possis
Medical, Minneapolis, Minn), which is
able to fragment and vacuum extract
clot, has also been used to treat patients
with acute cerebral ischemia (102). Methods of delivery of energy to fragment a
clot, including the use of ultrasound and
laser devices, are also being developed.
However, a current limitation of mechanical devices is the relatively larger
catheter size and limited flexibility,
which impede access to the tortuous vessels of the intracranial circulation.
CONCLUSION
In the past decade, substantial improvements have been made in imaging of hyperacute cerebral infarction. Nonetheless, the simplest and most available
technique—namely, CT—remains the
imaging method that is most relied on
for evaluation of hyperacute stroke patients. The NINDS tPA trial has shown
the safety and efficacy of intravenous tPA
in treatment within 3 hours of symptom
onset in patients with ischemic stroke.
The effectiveness and safety of intravenous tPA beyond 3 hours is yet to be
shown. Intraarterial delivery of tPA appears to lyse clots more effectively than
does intravenous delivery and has extended the time window for intervention
to 6 hours. Nonetheless, intraarterial delivery takes longer, and, thus far, no direct comparison of the two methods of
treatment has been reported. The approach of combined intraarterial and intravenous thrombolysis has the theoretical advantage of combining the benefits
of both methods; the results of the Interventional Management of Stroke trial are
eagerly awaited. Mechanical approaches
to ischemic stroke may eliminate the
Assessment of the Patient with Hyperacute Stroke
䡠
357
Radiology
need for thrombolytic drugs that increase
the risk of reperfusion hemorrhage. However, further advances in catheter technology are required to meet the special
requirements of clot lysis in the cerebral
circulation. The future treatment of acute
ischemic stroke will likely include a combination of mechanical strategies and
thrombolytic agents that minimize the
risk of intracranial hemorrhage and maximize recanalization rates.
16.
17.
18.
References
1.
Hacke W, Kaste M, Fieschi C, et al. Intravenous thrombolysis with recombinant tissue
plasminogen activator for acute hemispheric stroke: the European Cooperative
Acute Stroke Study (ECASS). JAMA 1995;
274:1017–1025.
Tissue plasminogen activator for acute ischemic stroke. The National Institute of Neurological Disorders and Stroke rt-PA stroke
study group. N Engl J Med 1995; 333:1581–
1587.
Gacs G, Fox AJ, Barnett HJM, Vinuela F. CT
visualization of intracranial arterial thromboembolism. Stroke 1983; 14:756 –762.
Von Kumer R, Allen KL, Holle R, et al. Acute
stroke usefulness of early CT findings before
thrombolytic therapy. Radiology 1997; 205:
327–333.
Intracerebral hemorrhage after intravenous
t-PA therapy for ischemic stroke: the NINDS
t-PA Stroke Study Group. Stroke 1997; 28:
2109 –2118.
Furlan AJ, Higashida R, Weschler L, et al.
Intra-arterial prourokinase for acute ischemic stroke: the PROACT II study—a randomized controlled trial. JAMA 1999; 282:
2003–2011.
Marks MP, Holmgren EB, Fox AJ, Patel S,
von Kummar R, Froehlich J. Evaluation of
early computed tomographic findings in
acute ischemic stroke. Stroke 1999; 30:389 –
392.
Lev MH, Farkas J, Gemmete JJ, et al. Acute
stroke: improved nonenhanced CT detection— benefits of soft-copy interpretation
by using variable window width and center
level settings. Radiology 1999; 213:150 –
155.
Truwit CL, Barkovich AJ, Gean-Marton A,
Hibri, Norman D. Loss of the insular ribbon:
another early CT sign of acute middle cerebral artery infarction. Radiology 1990; 176:
801–806.
Tomsick TA, Brott TG, Chambers AA, et al.
Hyperdense middle cerebral artery sign on
CT: efficacy in detecting middle cerebral artery thrombosis. AJNR Am J Neuroradiol
1990; 11:473–477.
Elster AD, Moody DM. Early cerebral infarction:gadopentetate dimeglumine enhancement. Radiology 1990; 177:627–632.
Provenzale JM, Sorensen AG. Diffusionweighted MR imaging in acute stroke: theoretical considerations and clinical applications. AJR Am J Roentgenol 1999; 173:1459 –
1468.
Kidwell CS, Saver JL, Mattiello J, et al.
Thrombolytic reversal of acute human cerebral ischemic injury shown by diffusion/
perfusion magnetic resonance imaging.
Ann Neurol 2000; 47:462–469.
Petrella JR, Provenzale JM. MR perfusion
imaging of the brain: techniques and applications. AJR Am J Roentgenol 2000; 175:
207–220.
Sorensen AG, Copen WA, Ostergaard L, et
2.
3.
4.
5.
6.
7.
8.
9.
10.
11.
12.
13.
14.
15.
358
䡠
Radiology
䡠
November 2003
19.
20.
21.
22.
23.
24.
25.
26.
27.
28.
29.
30.
31.
32.
33.
34.
al. Hyperacute stroke: simultaneous measurement of relative cerebral blood volume,
relative cerebral blood flow, and mean tissue transit time. Radiology 1999; 210:519 –
527.
Ostergaard L, Sorensen AG, Chesler DA, et
al. Combined diffusion-weighted and perfusion-weighted flow heterogeneity magnetic resonance imaging in acute stroke.
Stroke 2000; 31:1097–1103.
Hudetz AG, Feher G, Kampine JP. Heterogeneous autoregulation of cerebrocortical capillary flow: evidence for functional thoroughfare channels? Microvasc Res 1996; 51:131–
136.
Astrup J, Siesjo BK, Symon L. Thresholds in
cerebral ischemia: the ischemic penumbra.
Stroke 1981; 12:723–725.
Eastwood JD, Lev MH, Azhari T, et al. CT
perfusion imaging with deconvolution
analysis:A pilot study of patients with acute
middle cerebral artery stroke. Radiology
2002; 222:227–237.
Lev MH, Segal AZ, Farkas J, et al. Utility of
perfusion-weighted CT imaging in acute
middle cerebral artery stroke treated with
intra-arterial thrombolysis: prediction of final infarct volume and clinical outcome.
Stroke 2001; 32:2021–2028.
Heiss WD. Ischemic penumbra: evidence
from functional imaging in man. J Cereb
Blood Flow Metab 2000; 20:1276 –1293.
Schneider M. Durchblutung und sauerstoffversorgung des gehirns. Verh Dtsch Tes
Kreislaufforsch 1953; 19:3–12.
Zulch KJ. The cerebral infarct: pathology,
pathogenesis, and computed tomography.
Berlin,Germany:Springer-Verlag,1985;123–
145.
van der Zwan A, Hillen B. Review of the
variability of the territories of the major
cerebral arteries. Stroke 1991; 22:1078 –
1084.
van der Zwan A, Hillen B, Tulleken CAF,
Dujovny M, Dragovic L. Variability of the
territories of the major cerebral arteries.
J Neurosurg 1992; 77:927–940.
van der Zwan A, Hillen B, Tulleken CAF,
Dujovny M. A quantitative investigation of
the variability of major cerebral arterial territories. Stroke 1993; 24:1951–1959.
Bogousslavsky J, Van Melle G, Regli F. The
Lausanne stroke registry: analysis of 1, 000
consecutive patients with first stroke. Stroke
1988; 19:1083–1092.
Bories J, Derhy S, Chiras J. Second part: roles
of scanning; CT, PET and MRI—CT in hemispheric ischaemic attacks. In Bories J, ed.
Cerebral ischaemia: a neuroradiological
study. Berlin, Germany: Springer-Verlag,
1985; 18 –33.
Adams JH, Brierley JB, Connor RCJ, Treip C.
The effects of systemic hypotension upon
the human brain: clinical and neuropathologic observations in 11 cases. Brain 1966;
89:235–268.
Brierley JB, Excell BJ. The effects of profound systemic hypotension upon the
brain of M. rhesus: physiological and
pathological observations. Brain 1966; 89:
269 –298.
Torvik A. The pathogenesis of watershed
infarcts in the brain (editorial). Stroke 1984;
15:221–223.
Romanul FCA, Abramowicz A. Changes in
brain and pial vessels in arterial borer zones.
Arch Neurol 1964; 11:40 –65.
Baptista AG. Studies on the arteries of the
brain. II. the anterior cerebral artery: some
anatomic features and their clinical implications. Neurology 1963; 13:825–835.
Moniz E. Die cerebral arteriographie und
35.
36.
37.
38.
39.
40.
41.
42.
43.
44.
45.
46.
47.
48.
49.
50.
51.
52.
phlebographie. Berlin, Germany: SpringerVerlag, 1949; 413.
Perlmutter D, Rhoton AL Jr. Microsurgical
anatomy of the distal anterior cerebral artery. J Neurosurg 1978; 49:204 –228.
Hennerici M, Daffertschofer M, Jakobs L.
Failure to identify cerebral infarct mechanisms from topography of vascular territory
lesions. AJNR Am J Neuroradiol 1998; 19:
1067–1074.
Carpenter DA, Grubb RL Jr, Powers WJ. Borderzone hemodynamics in cerebrovascular
disease. Neurology 1990; 40:1587–1592.
Derdeyn CP, Simmons NR, Videen TO, et al.
Absence of selective deep white matter ischemia in chronic carotid disease:a positron
emission tomographic study of regional oxygen extraction. AJNR Am J Neuroradiol
2000; 21:631–638.
Derdeyn CP, Khosla A, Videen TO, et al.
Severe hemodynamic impairment and border zone–region infarction. Radiology 2001;
220:195–201.
Bogousslavsky J, Regli F. Borderzone infarctionsdistaltointernalcarotidarteryocclusion:
prognostic implications. Ann Neurol 1986;
20:346 –350.
Einsiedel-Lechtape H. Neuroradiology of
vascular and atrophic lesions in the geriatric age: secondary emboli—a frequent sequela of complete extracranial internal carotid artery occlusion. Neuroradiology
1978; 16:96 –100.
Gacs GY, Merei FT, Bodosi M. Balloon catheter as a model of cerebral emboli in humans. Stroke 1982; 13:39 –42.
Gacs GY, Fox AJ, Barnett HJM, Vinuela F.
Occurrence and mechanisms of occlusion
of the anterior cerebral artery. Stroke 1983;
14:952–959.
Pollanen MS, Deck JHN. Directed embolization is an alternate cause of cerebral watershed infarction. Arch Pathol Lab Med 1989;
113:1139 –1141.
Torvik A, Skullerud K. Watershed infarcts in
the brain caused by micro emboli. Clin
Neuropathol 1982; 1:99 –105.
Caplan LR, Hennerici M. Hypothesis: impaired clearance of emboli (washout) is an
important link between hypoperfusion,
embolism, and ischemic stroke? Arch Neurol 1998; 55:1475–1482.
Waterston JA, Brown MM, Butler P, Swash
M. Small deep cerebral infarcts associated
with occlusive internal carotid artery disease:
a hemodynamic phenomenon? Arch Neurol 1990; 47:953–957.
Yamauchi H, Fukuyama H, Yamaguchi S,
Miyoshi T, Kimura J, Konishi J. High-intensity area in the deep white matter indicating hemodynamic compromise in internal
carotid artery occlusive disorders. Arch
Neurol 1991; 48:1067–1071.
Isaka Y, Nagano K, Narita M, Ashida K,
Iamizumi M. High signal intensity on T2weighted magnetic resonance imaging and
cerebral hemodynamic reserve in carotid
occlusive disease. Stroke 1997; 28:354 –357.
Mull M, Schwarz M, Thron A. Cerebral
hemispheric low-flow infarcts in arterial occlusive disease. Lesion patterns and angiomorphological conditions. Stroke 1997; 28:
118 –123.
Krapf H, Widder B, Skalej M. Small rosarylike infarctions in the centrum ovale suggest hemodynamic failure. AJNR Am J Neuroradiol 1998; 19:1479 –1484.
Naidich TP, Firestone MI, Blum JT, Abrams
KJ. Vascular territories and watersheds:a
zonal frequency analysis of the gyral-sulcal
extent of cerebral infarctions. III. MCA and
watershed infarctions. Neuroradiology (in
press).
Provenzale et al
53.
Radiology
54.
55.
56.
57.
58.
59.
60.
61.
62.
63.
64.
65.
66.
67.
68.
69.
Feussner JR, Matchar DB. When and how to
study the carotids. Ann Intern Med 1988;
109:805–818.
Zeumer H, Freitag HJ, Knospe V. Intravascular thrombolysis in central nervous system cerebrovascular disease. Neuroimaging
Clin N Am 1992; 2:359 –369.
del Zoppo GJ, Poeck K, Pessin M, et al. Recombinant tissue plasminogen activator in
acute thrombotic and embolic stroke. Ann
Neurol 1992; 32:78 –86.
del Zoppo GJ, Higashida RT, Furlan AJ, Pessin MS, Rowley HA, Gent M. PROACT:a
phase II randomized trial of recombinant
pro-urokinase by direct arterial delivery in
acute middle cerebral artery stroke. Stroke
1998; 29:4 –11.
Baron J. Mapping the ischemic penumbra
with PET: implications for acute stroke
treatment. Cerebrovascular Diseases 1999;
9:193–201.
Heiss WD, Thiel A, Grond M, Graf R. Which
targets are relevant for therapy of acute
ischemic stroke? Stroke 1999; 30:1486 –
1489.
Nagesh V, Welch KM, Windham JP, et al.
Time course of ADCw changes in ischemic
stroke: beyond the human eye! Stroke 1998;
29:1778 –1782.
Thrombolytic therapy with streptokinase in
acute ischemic stroke: the Multicenter
Acute Stroke Trial–Europe Study Group.
N Engl J Med 1996; 335:145–150.
Randomised controlled trial of streptokinase, aspirin, and combination of both in
treatment of acute ischaemic stroke. Multicentre Acute Stroke Trial–Italy (MAST-I)
Group. Lancet 1995; 346:1509 –1514.
Donnan GA, Davis SM, Chambers BR, et al.
Streptokinase for acute ischemic stroke with
relationship to time of administration: Australian Streptokinase (ASK) Trial Study
Group. JAMA 1996; 276:961–966.
Hacke W, Kaste M, Fieschi C, et al. Randomised double-blind placebo-controlled trial
of thrombolytic therapy with intravenous
alteplase in acute ischaemic stroke (ECASS
II): Second European-Australasian Acute
Stroke Study Investigators. Lancet 1998; 352:
1245–1251.
Clark WM, Wissman S, Albers GW, Jhamandas JH, Madden KP, Hamilton S. Recombinant tissue-type plasminogen activator (Alteplase) for ischemic stroke 3 to 5 hours
after symptom onset: The ATLANTIS
study—a randomized controlled trial. JAMA
1999; 282:2019 –2026.
Practice advisory: thrombolytic therapy for
acute ischemic stroke–summary statement—report of the Quality Standards Subcommittee of the American Academy of
Neurology. Neurology 1996; 47:835–839.
Kwiatkowski TG, Libman R, Frankel M, et
al. The NINDS rt-PA Stroke Study: sustained
benefit at 1 year. Stroke 1998; 29:288.
Kwiatkowski TG, Libman RB, Frankel M, et
al. Effects of tissue plasminogen activator
for acute ischemic stroke at 1 year: National
Institute of Neurological Disorders and
Stroke Recombinant Tissue Plasminogen
Activator Stroke Study Group. N Engl J Med
1999; 340:1781–1787.
Broderick JP. Recanalization therapies for
acute ischemic stroke. Semin Neurol 1998;
18:471–484.
The NINDS t-PA Stroke Study Group. Generalized efficacy of t-PA for acute stroke:
subgroup analysis of the NINDS t-PA stroke
trial. Stroke 1997; 28:2119 –2125.
Volume 229
䡠
Number 2
70.
71.
72.
73.
74.
75.
76.
77.
78.
79.
80.
81.
82.
83.
84.
85.
86.
Chiu D, Krieger D, Villar-Cordova C, et al.
Intravenous tissue plasminogen activator
for acute ischemic stroke: feasibility, safety,
and efficacy in the first year of clinical practice. Stroke 1998; 29:18 –22.
Tanne D, Bates VE, Verro P, et al. Initial
clinical experience with IV tissue plasminogen activator for acute ischemic stroke: a
multicenter survey—the t-PA Stroke Survey
Group. Neurology 1999; 53:424 –427.
Libman RB, Wirkowski E, Alvir J, Rao TH.
Conditions that mimic stroke in the emergency department. Implications for acute
stroke trials. Arch Neurol 1995; 52:1119 –
1122.
Albers GW, Bates VE, Clark WM, Bell R,
Verro P, Hamilton SA. Intravenous tissuetype plasminogen activator for treatment of
acute stroke: the Standard Treatment with
Alteplases to Reverse Stroke (STARS) study.
JAMA 2000; 283:1145–1150.
Katzan IL, Furlan AJ, Lloyd LE, et al. Use of
tissue-type plasminogen activator for acute
ischemic stroke: the Cleveland area experience. JAMA 2000; 283:1151–1158.
Zeumer H, Hacke W, Ringelstein EF. Local
intraarterial thrombolysis in vertebrobasilar
thromboembolic disease. AJNR Am J Neuroradiol 1983; 4:401–404.
Zeumer H, Hundgen R, Ferbert A, Ringelstein EB. Local intraarterial fibrinolytic
therapy in inaccessible internal carotid occlusion. Neuroradiology 1984; 26:315–317.
Zeumer H, Freitag HJ, Zanella F, Thie A,
Arning C. Local intra-arterial fibrinolytic
therapy in patients with stroke: urokinase
versus recombinant tissue plasminogen activator (r-TPA). Neuroradiology 1993; 35:
159 –162.
Jansen O, von Kummer R, Forsting M,
Hacke W, Sartor K. Thrombolytic therapy in
acute occlusion of the intracranial internal
carotid artery bifurcation. AJNR Am J Neuroradiol 1995; 16:1977–1986.
Theron J, Courtheoux P, Casasco A, et al.
Local intraarterial fibrinolysis in the carotid
territory. AJNR Am J Neuroradiol 1989; 10:
753–765.
Barr JD, Mathis JM, Wildenhain SL, Wechsler L, Jungreis CA, Horton JA. Acute stroke
intervention with intraarterial urokinase infusion. J Vasc Interv Radiol 1994; 5:705–
713.
del Zoppo GJ, Ferbert A, Otis S, et al. Local
intra-arterial fibrinolytic therapy in acute
carotid territory stroke: a pilot study. Stroke
1988; 19:307–313.
Mori E, Tabuchi M, Yoshida T, Yamadori A.
Intracarotid urokinase with thromboembolic occlusion of the middle cerebral artery. Stroke 1988; 19:802–812.
Hacke W, Zeumer H, Ferbert A, Bruckmann
H, del Zoppo GJ. Intraarterial therapy improves outcome in patients with acute vertebrobasilar disease. Stroke 1988; 19:1216 –
1222.
Ezura M, Kagawa S. Selective and superselective infusion of urokinase for embolic
stroke. Surg Neurol 1992; 38:353–358.
Barnwell SL, Clark WM, Nguyen TT, O’Neill
OR, Wynn ML, Coull BM. Safety and efficacy of delayed intraarterial urokinase therapy with mechanical clot disruption for
thromboembolic stroke. AJNR Am J Neuroradiol 1994; 15:1817–1822.
Brandt T, von Kummer R, Müller-Küppers
M, Hacke W. Thrombolytic therapy of acute
basilar artery occlusion: variables affecting
87.
88.
89.
90.
91.
92.
93.
94.
95.
96.
97.
98.
99.
100.
101.
102.
recanalization and outcome. Stroke 1996;
27:875–881.
Becker KJ, Monsein LH, Ulatowski J, Mirski
M, Williams M, Hanley DF. Intraarterial
thrombolysis in vertebrobasilar occlusion.
AJNR Am J Neuroradiol 1996; 17:255–262.
Ueda T, Sakaki S, Kumon Y, Ohta S. Multivariable analysis of predictive factors related to outcome at 6 months after intraarterial thrombolysis for acute ischemic
stroke. Stroke 1999; 30:2360 –2365.
Jahan R, Duckwiler GR, Kidwell CS, et al.
Intraarterial thrombolysis for treatment of
acute stroke: experience in 26 patients with
long-term follow-up. AJNR Am J Neuroradiol 1999; 20:1291–1299.
Suarez JI, Sunshine JL, Tarr R, et al. Predictors of clinical improvement, angiographic
recanalization, and intracranial hemorrhage after intra-arterial thrombolysis for
acute ischemic stroke. Stroke 1999; 30:2094 –
2100.
Yamaguchi T, Hayakawa T, Kiuchi H. Intravenous tissue plasminogen activator ameliorates the outcome of hyperacute embolic
stroke. Cerebrovasc Dis 1993; 3:269 –272.
Wolpert SM, Bruckmann H, Greenlee R, et
al. Neuroradiologic evaluation of patients
with acute stroke treated with recombinant
tissue plasminogen activator. AJNR Am J
Neuroradiol 1993; 14:3–13.
Mori E, Yoneda Y, Tabuchi M, et al. Intravenous recombinant tissue plasminogen activator in acute carotid artery territory
stroke. Neurology 1992; 42:976 –982.
Bruckmann H, Ferbert A, del Zoppo GJ,
Hacke W, Zeumer H. Acute basilar thrombosis: angiologic-clinical comparison and
therapeutic implications. Acta Radiol 1987;
369:38 –42.
Archer CR, Horenstein S. Basilar artery occlusion:clinical and radiographic correlation. Stroke 1977; 8:383–391.
Bogousslavsky J, Regli F, Maeder P, Meuli R,
Nader J. The etiology of posterior circulation infarcts: a prospective study using
magnetic resonance imaging and magnetic
resonance angiography. Neurology 1993; 43:
1528 –1533.
del Zoppo GJ, Zeumer H, Harker LA. Thrombolytic therapy in stroke: possibilities and
hazards. Stroke 1986; 17:595–607.
Mitchell PJ, Gerraty RP, Donnan GA, et al.
Thrombolysis in the vertebrobasilar circulation: The Australian urokinase stroke
trial—a pilot study. Cerebrovasc Dis 1997;
7:94 –99.
Lewandowski CA, Frankel M, Tomsick TA,
et al. Combined intravenous and intra-arterial r-TPA versus intra-arterial therapy of
acute ischemic stroke: Emergency Management of Stroke (EMS) Bridging Trial. Stroke
1999; 30:2598 –2605.
Weaver WD, Simes RJ, Betriu A, et al. Comparison of primary coronary angioplasty
and intravenous thrombolytic therapy for
acute myocardial infarction: a quantitative
review. JAMA 1997; 278:2093–2098.
Balousek PA, Knowles HJ, Higashida RT, del
Zoppo GJ. New interventions in cerebrovascular disease: the role of thrombolytic therapy and balloon angioplasty. Curr Opin
Cardiol 1996; 11:550 –557.
Bücker A, Schmitz-Rode T, Vorwerk D,
Günther RW. Comparative in vitro study of
two percutaneous hydrodynamic thrombectomy systems. J Vasc Interv Radiol 1996;
7:445–449.
Assessment of the Patient with Hyperacute Stroke
䡠
359


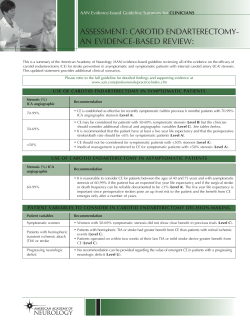


© Copyright 2026