
by on June 9, 2014. For personal use only. Downloaded from jnm.snmjournals.org
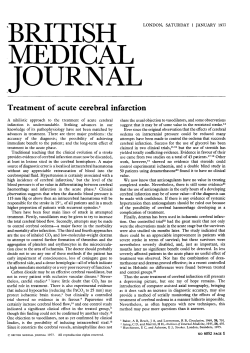
Downloaded from jnm.snmjournals.org by on June 9, 2014. For personal use only.
Cerebral Infarction within Six Hours of Onset: Prediction of Completed Infarction with
Technetium-99m-HMPAO SPECT
Eku Shimosegawa, Jun Hatazawa, Atsushi Inugami, Hideaki Fujita, Toshihide Ogawa, Yasuo Aizawa, Iwao Kanno, Toshio
Okudera and Kazuo Uemura
J Nucl Med. 1994;35:1097-1103.
This article and updated information are available at:
http://jnm.snmjournals.org/content/35/7/1097
Information about reproducing figures, tables, or other portions of this article can be found online at:
http://jnm.snmjournals.org/site/misc/permission.xhtml
Information about subscriptions to JNM can be found at:
http://jnm.snmjournals.org/site/subscriptions/online.xhtml
The Journal of Nuclear Medicine is published monthly.
SNMMI | Society of Nuclear Medicine and Molecular Imaging
1850 Samuel Morse Drive, Reston, VA 20190.
(Print ISSN: 0161-5505, Online ISSN: 2159-662X)
© Copyright 1994 SNMMI; all rights reserved.
Downloaded from jnm.snmjournals.org by on June 9, 2014. For personal use only.
Cerebral Infarction within Six Hours of Onset:
Prediction of Completed Infarction with
Technetium-99m-HMPAO SPECT
Eku Shimosegawa,
Jun Hatazawa,
Atsushi
Inugami,
Hideaki Fujita, Toshihide
Ogawa, Yasuo Aizawa,
Iwao Kanno, ToshioOkuderaand Kazuo Uemura
Department ofRadioIo@ji and Nuclear Medicine, Research Institute ofBrain and Blood Vessels-Akita, Akita, Japan
emia is performed on the same basis. However,
determi
nation of the ischemic threshold has been dependent upon
brainperfusioninthehyperacutestageof stroke.Methods:We data obtained in experimentalstudies of uniformocclusion
investigatedcerebral I@oodflow using
@1c-HMPAO
SPECT in models or the clinical investigation of patients with sub
31 patients
within6 hraftertheonsetofcerebralinfarction
and acute or chronic cerebral infarction (2—6).
analyzedthereIa@onship
betweenabnormalperfusionandmor
Although it has been difficult to estimate the flow thresh
phologicalchanges on follow-up CT scans. Patientswere clas
old in the acute stage of cerebral ischemia in the clinical
sified into an infarctgroup and a noninfarctgroup,and the setting, a new radiopharmaceutical agent for SPEC!'
lesionson SPECTimageswere dMdedinto infarctand pail
imaging,
@“@Tc-hexamethylpropylene
amine oxime
infarctregions.Results: Amonga total of 30 infarctreg@ns,
(HMPAO),
has
facilitated
emergency
hemodynamic
stud
threelesionsstudiedat 1.5,2.5and5 hr afterthe ictusshowed
local hyperperfusionsuggestiveof early postischemichyper ies and made the rapid semiquantitative evaluation of ce
emia,whilethe other27 lealonsdemonstratedlocalhypoperfu rebral blood flow (CBF) possible. The twin purposes of the
sion. @@Jl
of thepail-infarctregionsshowedmoderatehypoperfu present study are to investigate CBF abnormalities by
Technebum-99m-HMPAO can be used to evaluate abnormal
sion. The noninfarct group COnSISted
of five patients, four of
SPEC!' within 6 hr after the onset of cerebral ischemia and
whom showedno perfusionabnormalubes.
The lesion-to-con
tralateralradioactMtyratiosfortheinfarctandpail-infarctregions
wererespectively
0.48 ±0.14and0.75 ±0.10inthepatients
with hypoperfusion,
whilethe right-to-leftratioin the noninfarct
to use CBF to determinethe CBF thresholdfor the survival
of brain tissue. The CBF threshold in the present study is
defined as the critical value for the morphological change
with referringC!' images. A retrospective clinical analysis
group was 0.97 ±0.10. ConclusIon: This SPECT study of was performed with the aim of providing useful informa
cerebralbloodflowdemonstrates
thatlocalhyperpertusion
oc
tion for the early prediction of completed cerebral infarc
cursin someinfarctsevenw@iin6 hrof onsetandthatinfarcted
and morphologicalviable brain can be distinguishedby a lesion tion.
to-contralateral
radioactivftyratioof 0.6w@inthistimerange.
SUBJECTSAND METhODS
Key Words:cerebralinfarction,
SPECT,technetium-99mSubjects
HMPAO,
cerebral
bkodflow
Thirty-onepatients(age39—86
years;14womenand17men)
J Nuci Med1994;35:1097-1103
who were clinically diagnosed as having supratentorial infarction
wereanalyzedon admission.Neurologicalexaminationwas per
formed. (A clinical proffle of the patients is presented in Table 1.)
The majordeficits on admissionwere hemiparesisin 27 patients,
aphasia in two patients and disorientation in two patients. All
patients had a sudden onset of symptoms and the time of onset
he ischemic threshold is one of the intriguingconcepts
in the management of cerebral infarction. Some of the
wasdeterminedbyreliableinformation
obtainedfromthepatients
therapeutic interventions for chronic cerebral infarction,
i.e., anastomotic bypass surgery and carotid endarterec
themselves or their relatives. Cerebral embolism, defined as the
finding of atnal fibrillation on the admission electrocardiogram
and/or emboli in the main intracranial arteries seen on the initial
tomy, are based on the concept that improvingblood flow
to oligemic brain tissue can normalize the imbalance be cerebralangiogram(7—8),
was observedin 21 of 31 patients.
tween blood supply and metabolism (1—2).
Similarly, the Computedtomography(CT)
wasperfonnedonadmissioninorder
intravenous or intra-arterial injection of thrombolytic to rule out intracranial hemorrhage. Patients with lacunas and
agents soon aftervascular occlusion in acute cerebralisch infratentorial infarction were retrospectively excluded by the find
ings on follow-up CT and/or magnetic resonance imaging (MRI).
Recehied
Oct.5, 1993;revisionacceptedMar.1,1994.
Forcorrespondenceand
reprintscoi1@t8w Shwnosegawa@
MD,Department
ofR@Iogyand
NUc1earMed@ne,
5-10Senshu-Kubc@aMachi,
AkItaOlO,Japan.
Predictionof CompletedInfarctionby
SPECTProcedure
A HeadtomeH or SET 080 SPEC!'system (ShimazuCo.,
Kyoto,Japan)was usedforCBFimaging.TheHeadtomeII is a
@1c-HMPAO
•
Shimosegawaat al.
1097
@
1@
Downloaded from jnm.snmjournals.org by on June 9, 2014. For personal use only.
TABLEI
ClinicalProfileof the Subjects
SubjectSPECT
interventionalno.
Age/Sex
examinationWA
time after onset (hr) Angiographicfindingon admission
onType
of
Follow-upCTtherapy
RePerIUSIOn
160/M1
.5ACA
branth ocdusion with blushCor,
CorNonePartial266,'M1
.5NoneNNoneUnknown359/PA1
.6MCA
ocdusionCorNoneUnknown462/F1
ocdusionCorIntra-arterlalNo
reperfusion574fF1 .7K@A
.7ICA
occlusionCorIntra-artehalPart@680/F1
.8A@A
occlusionCorNoneUnknown765/F1
and MCA branch
.8MCA
ocdusionCorNoneUnknown846/F2.0MCA
reperfusion966/F2.0MCA
branch occlusionCorIntra-arterialNo
occlusionCorIntra-aiterialPartial1056/M2.0ACA
CorNoneUnknown1
occlusionCor,
176/M2.2MCA
CorNoneUnknown1275/M2.3MCA
and ACAbranch ocdus@nCor,
ocdus@onCorNoneUnknown1374/F2.3MCA
ocdusionCorIntra-artetialPartial1476/F2.4blush
branth
onlyCorNoneComplete1586/PA2.5NoneCorNoneUnknown1669/M2.8MCA
ocdunionWMNoneUnknown1765/F2.8M@A
ocdusionNIntra-arterialComplete1872/F3.0ICA
ocdusionCor—WMNoneUnknown1982/F3.2MCA
ocduslonCorIntra-arterialPartial2070/M3.2ICA
ocdusionCorNoneUnknown2166/M3.7M@A
ocdusionCorNoneUnknown2273/M3.7ICA
branch
ocdusionCor—WMNoneUnknown2339/M4.0NoneNNoneUnknown2459/PA4.0MCA
branch occlusionCorIntra-arteiialNo
reperfunion2577/M4.1NoneNNoneUnknown2663/M4.6NoneCorNoneUnknown2759/F4.7NoneCcx,
CorNoneUnknown2853/M5.2NoneWMNoneUnknown2968/F5.3NoneNNoneUnknown3074/F5.4NoneCor,
WMNoneUnknown3167/M5.7ICA
ocdusionCor—WMNoneUnknown
ACA = antenorcerebralartery-@
MCA = m@dlecerebralartery;ICA = internalcerebralartery@
WA = low densityarea@
Cor = cortex;WM = white
matter@
and N = normodensity.
three-ring scanner that obtains six to nine slices of 17 mm in Study Protocol and Groups
thickness with a 35-mm interslice gap and has a high-resolution
The protocol of the present study is outlinedin Figure 1. Initial
(HR) collimator. The in-plane and z-direction spatial resolution
were respectively 11 mm and 17 mm with FWHMs. The SET 080
is a continuous cylindrical ring scanner that obtains 32 tomo
graphic transaxialslices. Using a HR collimator, the slice thick
ness was set at 23 mm with no interslice gap. The in-plane and
@
Cr scanning
for screening
preceded
theSPECFexamination.
SPEC!'imagingwasstarted10mmaftertheintravenousinjection
of @‘@‘Tc-HMPAO
(740 MBq). All SPEC!' images were obtained
within 6 hr after the onset, and follow-up CT scanning was per
formed between Days 2 and 10. The plane for SPEC!' imagingwas
manuallyadjustedto
be parallelto the orbito-meatalline in order
z-directionspatialresolutionwererespectively11mmand18mm
with FWHMs. SPEC!' data acquisitiontime was 27 mm on aver to match the CT plane.
Using follow-up CT on morphological changes, the patients
age, and the raw data obtained by both SPEC!' systems were
were
classified into two groups: (1) an infarctgroup consisting of
transferredto a Data General ECLIPSE-S120 or MV-7890 SH
processing system and reconstructedon a 128 x 128imagematrix
using Butterworth ifitered backprojection Attenuation was cor
onset
61w
dsyl
daylO
rected using a pool phantom containing 110—220
MBq of
@Tc.
V
V
V
Discrepancies in radioactivity between the right and left sides
,
f
4
4
admI@Io@ li@@
L@!@aJ
I2nd @T
I
were less than 5%by region of interest (ROIs) analysis using this
:
,@
phantom. Linearizationcorrection accordingto Lassen et al. was
performedby assumingthat the cerebellarblood flow without
diaschisis was 55 ml/100 mi/mm (9—11).
Imaging and ROl analysis
morphological reference
fer SPECT
Cr imageswereobtainedusinga GeneralElectric9800HiLight system with a 10-mm slice thickness.
1098
FIGURE1. CTandSPECT
protocol.
TheJournalofNuclearMedicine
•
Vol.35 •
No.7 •
July1994
Downloaded from jnm.snmjournals.org by on June 9, 2014. For personal use only.
patientswho showedcompletedinfarction associatedwith neuro
logical deficits and (2) a noninfarct group consisting of patients
with neurological deficits on admission who showed no structural
changes on follow-up CT and recovered from their deficits. The
patients in the infarct group were classified on the basis of infarct
area and pen-infarct area, which were respectively definedas the
area of abnormalperfusionarea correspondingto the low-density
area on follow-up CF and the surrounding regions. SPEC!' lesions
were visually assessed by comparison with the uptake of the
contralateral normal brain and were interpreted by one to two of
the authors who are experts in nuclear medicine.
A
3 hr
ROI Selectionand DataAnalysis
In the infarctgroup, symmetricalmirrorROIs were located on
the lesions and the contralateralnormalbrain, and the lesion-to
contralateral radioactivity ratio (LIC ratio)was calculated for both
the infarct and the pen-infarct areas. The significanceof the dii
ferences in the L/C ratio was determined for the infarct and
pen-infarct areas. The time course of changes in the LIC ratio was
assessed by comparing patients imaged within 3 hr after onset and
those imaged 3—6hr after onset. In addition, to investigate the
difference of severity of ischemia in the different type of infarc
tion, we analyzed I/C ratios of the infarct and pen-infarct area
between the patients with and without cerebral embolism in this
infarctgroup.
In the noninfarctgroup, no abnormaldensities could be iden
tifiedon follow-upCT, so mirrorhemisphericalROIswere located
days
B
VI
on the rightandleftsides, andtheright-to-leftradioactivityratio
(R/L ratio) was calculated.
Statistical analysis was performed with a paired t-test.
FiGURE2. A 65-yr-old
womanw@isudden
onsetoftotalapha
RESULTS
Twenty-six patients were classified into the infarct group
with a total of 30 infarcts on follow-up C!'. The initial
sia. (A) Axial CT image (left)obtainedon admissionat 3 hr after
onset shows no definiteabnormaldensity in the cerebralparen
chyma. Follow-upCT Image (right)obtainedon Day 6 shows a
completedinfarctthat correspondsto the area of severehypoper
fusionseenin (B).The surroundingpail-Infarctarea remainsintact.
SPEC!' images showed a decrease in CBF corresponding
(B)Ax@SPECTimagesobtainedat 1.8 hrafteronsetat approxi
to 27 of 30 infarct areas (Fig. 2), but the other three areas
showed extremely high CBF (Fig. 3). Cerebral angiogra
phy on admission revealed early recanalizationof the oc
matelythe samelevelas the imagesin (A)demonstratean areaof
severe low perfualon(arrows)endosed by a large area of mild
hypoperfusionarea (arrowheads),wt*h is consistentwiththe tern
cluded arteries supplying two of these three hyperperfused
areas, and all three areas showed typical signs of infarction
toryoftherightmiddlecerebralartery.
on serial follow-up C!' scans. Twenty of 21 patients with
cerebral embolism belonged to the infarct group and all of
them showed severe hypoperfusion areas consistent with
completed infarctionon follow-up C!'.
For the pen-infarctareas, 25 showed abnormalperfusion
on the initialSPEC!' images, and all of these areas showed
mild hypoperfusion when compared to the contralateral
ROl Analysis
The relationshipbetween the radioactivity ratio and the
time from the onset of the ictus-to-tracerinjection is illus
trated in Figure 5. The earliest dot above 1.4 in the L/C
ratio was observed at 1.5 hr after the onset. L/C ratios for
the infarctarea were used to divide the patients into hypo
normalbrain(Fig. 2). The extent of these pen-infarct areas perfusionand hyperperfusiongroups(Fig.6). The average
paralleledthe distributionof the affectedvascular territory I_4/Cratio of the infarct area in the hypoperfusion group was
of the complete infarcts. The other infarctswere associated 0.48 ±0.14, while that of the pen-infarct area and average
with severe hypoperfusion of the anterior and/or middle
cerebral artery territories corresponding to the actual in
farct area. No pen-infarct area could be defined on the
SPEC!' images.
Except in one case, the noninfarct group consisted of
RIL ratio of the nonmfarct group were 0.75 ±0.10 and
0.97 ±0.10,respectively.Thus,theL/C ratioof theinfarct
area was significantly lower than that of the pen-infarct
area in the hypoperfusiongroup (p < 0.001), and the range
of overlap between the infarct area and pen-infarct area
five patients who showed no perfusion abnormalities ratios was from 0.51 to 0.67. Accordingly, completed in
within 6 hr after the onset (Fig. 4).
farction and survival of braintissue could be distinguished
Predictionof CompletedInfarctionby
@rc-HMPAO
•
Shimosegawaat al.
1099
Downloaded from jnm.snmjournals.org by on June 9, 2014. For personal use only.
A
B
L
C
FIGURE3. A76-yr-old
woman
withsudden
onsetoflefthemipa
restsand dysarthria.(A)AxialCT imagesobtainedon admisalonat
2 hr after the onset show diffuselow-densityareas in the bilateral
peilventilculardeepwhite matterand an old Calcifiedscardueto a
left occipital subcorticai hemorrhage. (B) Correspondingaxial
SPECTimagesobtalned2.4hraftertheonset.An areaof severe
hyperperlusion (arrows) surrounded by a larger zone of mild hypo
perfusion is seen in the territory of the right anterior cerebral artery.
(C)Follow-up
CTimagesobtainedonDay7.Theareaofhyperper
fusion on initial SPECT images shows hemorrhagic transformation
(arrows)enciosedby a well-definedlow densityarea.
by a 40% decrease of CBF compared to the contralateral study (18). The present study also demonstrated that even
normal brain in the present SPEC!' analysis.
within 6 hr after infarction, there was an area of extremely
In the hypoperfusion group, a total of 22 infarct areas low perfusion surrounded by a region of moderate hypo
caused by cerebral embolism showed a remarkable de
crease in L/C ratios. The average L1ICratio of these infarct
areas was 0.45 ±0.14, which was significantlylower than
those of remainingfive infarct areas (p < 0.02). The aver
age LIC ratio of the pen-infarct areas did not show signif
icant differences between the types of cerebral infarction.
No significant differences were observed between the
average LIC ratios of the infarct and pen-infarct areas
within the first 3 hr and 3—6
hr after the onset of ictus,
therefore no time dependency of the LIC ratio was de
tected within 6 hr of infarction (Fig. 7).
DISCUSSION
Since functional imaging was introduced into the diag
nosis of acute cerebral infarction, the extent of the area of
perfusion, which was consistent with the completed infarct
and the surroundingnormal tissue on follow-up C!' scans.
The area of pen-infarct hypoperfusion paralleled the vas
cular territory of the vessel supplying the completed infarct
zone. After this short durationof ischemia, brainedema is
not marked and a mass effect would not alter the blood flow
in the adjacent brain tissue. The distribution of pen-infarct
hypoperfusion was in accord with the result from an 1@I@
iodoamphetamine (1@I-IMP) study performed in patients
with subacute and chronic cerebral infarction (15). This
indicates that it may be due mainly to direct alterations of
blood flow in brain tissue with good collateral circulation,
although
the effect of deafferentiation
cannot
be com
pletely excluded.
Focal hyperemia on SPEC!' images obtained within 6 hr
ischemia considerably beyond the region of overt struc after the ictus is a new finding in the present study. Al
tural change has been pointed out by many authors (6,12— though early angiographic vasodilatation or hyperemia
15). This pen-infarct hypoperfusion has been suggested to (i.e., early venous filling and/or capillary blush) has already
be caused by either the direct hemodynamic effects of been reported in a case of temporary embolic occlusion
vessel occlusion or by disconnection and deactivation of and has been confirmed to indicate a lesion with increased
the cortex in the pen-infarct area (6,12—15).
Selective neu CBF (19—20),
no functional CBF studies have previously
ronal loss is one suggested mechanism (16—17),
though it disclosed luxury perfusionwithin the time range that we
In fact, a recent PET study noted
could not be completely confirmedby a neuropathological investigated (21—22).
1100
TheJournalof NuclearMedicine•
Vol.35 •
No.7 •
July 1994
Downloaded from jnm.snmjournals.org by on June 9, 2014. For personal use only.
B•
A
day10
1 hr
C
FiGURE4. A 65-yr-old
womanwiththesuddenonsetofcorn
plate left hemiparesis. (A) No parenchyrnal abnormalities are seen
onboththeinitialaxialCTimagesobtainedonadmission(left;1hr
aftertheonset)andthefollow-upCTimage(right;10daysafterthe
onset).(B) SPECTimagesobtainedat 2.8 hr afterthe onsetdem
onstratea d@fuse
areaof moderatehypoperfusion
consistentwith
theterritoryof the ilght-rniddle
cerebralartery(whitearrowheads).
The A/L ratioof this patientwas0.79.(C)Cerebralangiography
performedon the day of admission(left) shows ocdusion of the
horizontal segment of the right-middle cerebral artery (arrow). Foi
low-upangiography
demonstrates
successfulrecanal@ation
of the
occluded artery after thrombotytic therapy (hght@.
with little metabolic alteration at 5—18hr
Development of cerebral infarction is related to the se
after the onset of cerebral infarction (23). In the present
verity and duration of ischemia, so a simple method of flow
SPEC!' study, hyperemic lesions were observed from 1.5
threshold determination is needed when therapeutic inter
vention is under consideration. Although the possibility of
luxury perfusion cannot be excluded even when rCBF is
within a normalrangeand CBF measurementalone cannot
hyperperfusion
hr after the ictus. Two of the three patients with these
lesions underwent cerebral angiography on the day of ad
mission and one had multiple occluded vessels with frag
mentation of emboli in the corresponding distribution. The
other patient showed only a slight angiographic blush that
was consistent with the completed infarctarea. These find
ings strongly suggest early recanalization of an occluded
artery and may represent the phenomenon of “postisch
emic hyperemia―(13). Angiographic recanalization has
been reportedwithin 24 hraftercerebralinfarction(24) and
is supposed to accelerate the increase of local CBF caused
by vasodilatation in response to a decreased tissue pH
along with the elevation of lactic acid. An experimental
study has demonstratedthat the magnitudeand durationof
reactive hyperemia are related to the magnitudeand dura
tion of CBF reduction (3). Although reperfusion is gener
ally regarded as an indicator of a good clinical outcome
(23), marked early focal hyperemia
may follow critical
ischemia and thus may indicate irreversible brain damage.
The fact that all of the hyperemic regions in the present
study corresponded
to low-density areas on follow-up C!'
scans would support this suggestion.
Predictionof CompletedInfarctionby
differentiate metabolic inactivity from normal tissue func
tion (25), we tried to set an ischemic threshold of morpho
logical change for SPECT measurement of CBF by corn
paring the L/C ratios between infarct and pen-infarct areas.
The groupwith hypoperfusionof the infarctarea showed a
52% decrease in CBF when compared to the contralateral
normalbrain. Consideringthe lowest L/C ratio of the pen
infarct area, a decrease of approximately 40% in CBF
compared to the contralateral normal brain appears to rep
resent the borderline between reversible and irreversible
structural brain damage in the present series. However, an
LJC ratio above 0.6 in the infarct area may also include
relatively hyperemic lesions with reduced metabolism, so
measurement of cerebral metabolism may be necessary for
the accurate determination of an ischemic threshold.
Therefore, our findings would suggest that a patient with an
LIC ratio considerably below 0.6 should not be included in
a trial of therapeutic reperfusion, even if seen within 6 hr of
the ictus.
@Tc-HMPAO
•
Shimosegawaat al.
1101
@
@,
Downloaded from jnm.snmjournals.org by on June 9, 2014. For personal use only.
2.5
S
0
tiC ratio
ofInfarct
area
i/C ratio of perllrdarct area
A i@it
ratioofnon-Irdarct
group
2.0
I .5
S
!
@
1.5
•
0
Co 1.0
S
@
1.0
@
0.5
a-
@c@1
@D
c9
•
• S•••
•OS.
1
0.5
P
@f
0
S
S
0.0 •
0
0-
rr
4
2
S
3
4
5
6hr
Time from onset to RI Injection
Intarcl
(@.3 hr)
Infarct
(<3 hr)
perilnfarcl
(.3
fir)
perilnfarcl
(@c3 hr)
FIGURE5. Ascatter
plotoftheL/CandR/LSPECTratios
vers@ FiGURE7. ComparIson
oftheaverageL/Cratiosoftheinfarct
thetimeof radiotracer
injectionafteronset.TheearliestL/Cratio andpen-infarct
areasinrelationtothedurationofischemia.
Thereis
above 1.4 was observedat 1.5 hr from onset.
notimedependency
oftheL/Cratiowithinthistimerange.
Types of strokes have been known to affect the clinical
course of the patient; the selection of therapy would be
QuantitativeCBF measurement has given a lower isch
emic threshold than that obtained in the present SPEC!'
differentamong the causes of ischemia. Cerebralembolism
study (5,15). Various methodological
differences may be
is one of the most applicable targets of early interventional
related to this discrepancy. For example, scattered radia
treatment, however, few hemodynamic studies have been tion has more effect on SPEC!' imaging than on PET im
investigatedin acute stages of infarction.The present study aging. Without scatter correction, the CBF values for both
demonstrates that CBF of the infarct area was remarkably the ischemic region and the normal brain are overestimated
reduced just after onset of ischemia when the cause was by SPEC!', and the magnitude of the error would be
induced by cardiogenic emboli. Remediable time range greater in the better perfused areas. Lower spatial resolu
would be short in this kind of infarction so that rapid tion could be another reason for the higher SPEC!' thresh
estimation of CBF by SPEC!' may offer informationin the old because of the lack of separation of CBF in the gray
choice of therapy and prediction of the clinical course.
andwhite matteror in the infarctand peti-infarct areas. In
addition, when the cerebellar CBF used for the reference is
lower than 55 ml/100 mi/mm, underestimationof the con
tralateral normal CBF may occur after linearization con
rection (26), and this would make the denominator of the
L/C ratio smallercompared to that obtained in PET stud
ies. The pharmacokinetics of
@Tc-HMPAOprovide an
other reason for the overestimation of CBF in the infarct
and peri-infarctareas. SPECT can exaggerate the CBF in
these areas by including the plasma activity in the dilated
1.S
p<O.0O1
0
—
Co
vascularcomponent(27—28).
In the present study, the area
1.0
of hyperperfusionin the infarctgroupmay have been over
estimated because it contained an increased cerebralblood
0.5
1+
Infarct group
(Infarct regIon)
volume. ComparativeSPEC!' studies using ‘@I-IMP
and
Infarct group
(p.rllnfarcl
regIon)
Non-Infarct group
‘33Xe
have shown that the infarct and asymptomatic
thresholds of the [iN ratio obtained by ‘@I-IMP
SPEC!'
are 39—48%
and 65—72%,
respectively (5,29). Both of these
thresholds are lower than that obtained in our study. They
correlated well with the data obtained by PET or ‘33Xe
SPEC!'. Differences in the kinetic behavior of the tracers
FiGURE6. LICSPECTratios
oftheinfarct
andper-infarct
areas may have contributedto this discrepancy as well as to the
in the infarctgroupandthe R/LSPECTratiosof the noninfarct
group.TheaverageL/Cratioofthe infarctareainthe hypoperfusion methodological differences in CBF measurement.
The populationin the present study consisted of patients
groupwas ulgnificanflylowerthan that of the pen-infarctarea (p <
with a mixture of temporary and permanent vascular oc
0.001).
1102
TheJournalof NuclearMedicine•
Vol.35 •
No.7 •
July 1994
Downloaded from jnm.snmjournals.org by on June 9, 2014. For personal use only.
clusion. Thus, it should be taken into account that the
previous data on ischemic threshold, both of morphologi
cal and symptomatic changes, were mostly determinedby
the clinical studies performed more than 6 hr after the
onset of symptoms or by investigating an animal model
(3,4, 12, 14,23,25,29).
The different examination times for
PET and SPEC!' studiesof CBF maybe one of the reasons
for the different thresholds. A recent PET study using an
animal model of permanent middle cerebral artery occlu
sion revealed that the CBF in the affected cortex immedi
ately after occlusion ranged from —‘50%
to 67% of that in
the contralateral cortex (30). These values were higher
than those obtained
in PET studies of chronic cerebral
infarction and were compatible with the results of the
present study. The heterogeneity of the ischemic state in
our clinical populationwould be an additionalfactor in the
higher L,'C ratios of both groups and the lack of a time
CONCLUSION
The present study detected hyperemia and the critical
blood flow level in a very early stage of cerebral ischemia.
Although SPEC!' measurement has some drawbacks in
estimating quantitative CBF, it provides information for
evaluating hemodynamic alterations in patients with acute
cerebral ischemia and should help to determine whether
interventional reperfusion is worthwhile. Further investi
gation to allow more precise evaluation of blood flow and
metabolic parameterswithin this time rangemay be worth
while when noninvasive systems for quantitativemeasure
ment of brain function have been developed that can be
applied in the emergency setting.
Metab1988;8(suppl
1):S52—560.
11. YonekuraY, NishizawaS, Mukai T, et at. SPECl@with [99mTc]-d,l.hex
amethyl-propylene amine oxime (HM.PAO) compared with regional cere
bral bloodflow measuredby PET: effectsof linearization.I CerebBlood
FlowMetab1988;8(suppl
1):S82—589.
12. KuhI DE, PhelpsME, Kowell AP, Metter El, 5dm C, WinterJ. Effectsof
stroke on local cerebral metabolism and perfusion: mapping by emission
computedtomographyof I8@T@and ‘3NH3.
Ann Neural 1980;8:47-60.
13. OlsenST, LarsenB, SkriverEB, HerningM, EnevoidsenE, LassenNk
Focalcerebralhyperemiain acutestroke:incidence,pathophysiology
and
clinicalsignificance.
Stroke1981;12:598—607.
14. OlsenSI, LarsenB, HerningM, SkriverEB, LassenNA. Bloodflow and
ischemic penumbra in patients with acute stroke. Stroke 1983;14:332—341.
15. RaynaudC, RancureiG,SamsonY, et al. Pathophysiologic
studyof chronic
infarcts with 1-123isopropyl iodo-amphetamine(IMP): the importance of
peal-infarctarea. Stroke 1987;18:21—29.
16. LassenNA, OlsenTS, HojgaardK, Skriver E. Incompleteinfarction:a
CF-negativeirreversible ischemic brain lesion.I Cereb Blood Flow Metab
1983;3(suppl1):5602—S603.
17. Mies G, Auer LM, EbhardtG, TraupeH, HeissWD. Flow and neuronal
densityin tissuesurroundingchronicinfarction.Stroke1983;14:22—27.
18.Nedergaard
M, AstrupJ, KlinkenL. Celldensityandcortexthickness
in
the borderzone surroundingold infarctsin the humanbrain. Stroke 1984;
6:1033—1039.
19. Cronqvist5, LarocheF. Transitoryhyperemiain focal cerebralvascular
lesionsstudiedby angiographyand regionalcerebralbloodflow measure
ments.BrlRadiol 1967;40:270—274.
20.TaverasJM,
GilsonJM,DavisDO,KilgoreB,Rumbaugh
CL Angiography
in cerebral infarction. Radiology 1969;93:549—558.
21.Bushnell
DL, Gupta5, MlcochAG,RomynA, BarnesWE,KaplanE.
Demonstration of focal hyperemia in acute cerebral infarction with iodine
123iodoamphetamine.JNuclMed 1987;28:1920-1923.
22. StrashunA, DunnEK, SarkarSS,AbelW, HotsonG, SciafaniS. Revers
ACKNOWLEDGMENTS
il,le increasedtechnetium-99m-HMPAO cerebral cortical activity: a scinti
The authors thankYasuaki Shouji for his assistance in prepar
ing the figures. An outline of this work was presented at the 40th
Annual Meeting of the Society of Nuclear Medicine (Toronto,
Ontario,Canada,June1993).
graphicreflectionofluxurianthyperperfusion.JNuclMed
1992;33:117—119.
23.Marchal
G,SerratiC,RiouxP,etal.PETimaging
ofcerebral
perfusion
and
oxygenconsumptionin acuteischaemicstroke: relation to outcome. Lancet
1993;341:925—927.
24. FieschiC, ArgentinoC, Lenzi GL, SacchettiML, Toni D, BozzaoL.
Clinicalandinstrumental
evaluationof patientswith ischemicstrokeWithin
the firstsix hours.I NeuroiSci 1989;91:311—322.
REFERENCES
25@
WiseRJS,Bernard
S,Frackowiak
RSJ,LeggNJ,Jones1. Serialobserva
1. LassenNA, AstrupJ. Ischemic
penumbra.
In: WoodJH, ed. Cerebral
blood flow: physiolo@jcand clinical aspects. New York: McGraw-Hill;
1987:458—466.
2. Jafar JJ, Crowell RM. Focal ischemic thresholds. In: Wood JH, ed. Cere
bralbloodflow:physiologic andclinicalaspects. New York: McGraw-Hill;
1987:449—457.
3. JonesTH, Morawetz RB, Crowd RM, et al. Thresholdsof focalcerebral
ischemiain awakemonkeys.I Neumswg 1981;54:fl3-782.
4. Lenzi GL, Frackowiak RSJ, JonesT. Cerebraloxygenmetabolismand
blood flow in human cerebral ischemic infarction. I Cereb Blood Flow
Metab 1982;2:321—335.
5. Nakano S, Kinoshita K, Jinnouchi S, Hoshi H, Watanabe K. Critical
cerebralblood flow thresholdsstudiedby SPECF usingxenon-133and
Iodine-123
iodoamphetamine.
I NuciMed 1989;30:337-342.
6. RaynaudC, Rancurel0, Tzourio N, et al. SPECF analysisof recentcare
bral infarction.Stroke1989;20:192—204.
7. The National Institute of Neurological and Communicative Disorders and
Stroke. Reporton the nationalsurveyof stroke.Stroke 1981;12(suppl1):
Predictionof Completed Infarctionby
Wycombe:BrierPress;1987:14—18.
10. InugamiA, Kanno I, Uemura K, et al. Linearizationcorrectionof °°“Tc
labeledhexamethyl-propylene
amineoxime (HMPAO) imagein termsof
regional CBF distribution: comparison to C―02inhalation steady-state
methodmeasuredby positronemissiontomography.I CerebBloodFlow
vascularreactivityin collaterallyperfusedbrain tissue:evidenceof an
dependent decrease.
34—35.
8. The National Institute of Neurological Disorders and Stroke. aassification
of cerebrovascular
diseasesIll. Strake 1990;21:637—676.
9. LassenNA, AndersenAR, NeirinckxRD. Eli PJ,CostaDC. Validationof
Ceretec.In: Eli PJ, CostaDC, Cullum ID, Jarrift PH, Lui D, eds. TCBF
Atlas—she clinical application of TCBF imaging by SPECT. Hig)
tionsonthepathophysiolo@jr
of acutestroke:thetransitionfromischemiato
infarctionasreflectedin regionaloxygenextraction.Brain 1983;106:197222.
26.Gemmell
HG,EvansNTS,Besson
JAO,etal.Regional
cerebral
bloodflow
imaging:a quantitativecomparisonof technetium-99m
HMPAOSPECT
with C―02PET.JNucIMed 1990;31:1595-1600.
27. HayashidaK, Nishimura T, Imakita 5, UeharaT. Reverseredistribution of
Tc-99mHMPAOat thesiteof mild cerebralischemia.I Nucl Med 1988;
29(suppl):914.
28.Hayashida
K, Nishimura
T, ImakitaS,Uehara
T. Fillingoutphenomenon
with technetium-99mHMPAO brain SPECI' at the site of mild cerebral
ischemia.
I NuciMed 1989;30:591—598.
29. NakanoS, KinoshitaK, Jinnouchi5, HoshiH, WatanabeK. Comparative
studyof regionalcerebralbloodflow imagesby SPEC!'usingXe-133,
Iodine-123IMP andtechnetium-99m
HM-PAO.I Nucl Med 1989;30:157164.
30.Pappata
5,FioreliiM,RommelT,
etal.PETstudyofchanges
inlocalbrain
hemodynamics
andoxygenmetabolism
afterunilateralmiddlecerebralar
tety occlusion in baboons.I Cereb Blood Flow Metab 1993;13:416—424.
@“Tc-HMPAO
•
Shimosegawaat al.
1103


© Copyright 2026