
Supplementary Mat - Bullard Laboratories
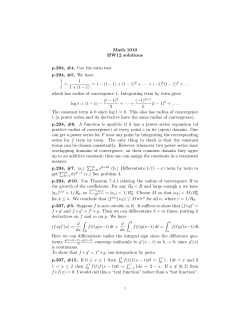
Supplementary Materials:
High interseismic coupling in the Eastern Makran
(Pakistan) subduction zone.
N. Y. Lina , R. Joliveta,e , M. Simonsa , P. S. Agramb , H. R. Martensa , Z. Lic ,
S. H. Lodid
a
Seismological Laboratory, Geological and Planetary Sciences, California Institute of
Technology, 1200 E California Blvd, Pasadena, CA 91125, USA.
b
Jet Propulsion Laboratory, California Institute of Technology, 4800 Oak Grove Drive,
Pasadena, California 91109, USA.
c
COMET, School of Civil Engineering and Geosciences, Newcastle University, Newcastle
upon Tyne, NE1 7RU, United Kingdom.
d
Department of Civil Engineering, NED University of Engineering and Technology,
Karachi 75270, Pakistan.
e
now at COMET, Bullard Labs, Department of Earth Sciences, University of Cambridge,
Madingley Road, CB3 0EZ, Cambridge, UK.
Preprint submitted to Earth Planet. Sci. Lett.
March 17, 2015
1. InSAR Processing
In this section, we show additional figures about the processing of the
InSAR data. Supplementary materials also include geocoded line-of-sight
velocity maps and corresponding maps of the line-of-sight vector in GRD
format. For each track, the file Mints Velocity.grd contains the line-of-sight
velocity of the ground in cm/yr, the file Mints Error.grd contains the uncertainty along the line-of-sight in cm/yr and the files Incidence East.grd,
Incidence North.grd and Incidence Up.grd contains the East, North and
Up components of the line-of-sight vector at each pixel. The files can be
downloaded at:
2
1.1. InSAR data set
Perpendicular Baseline (m)
600
400
200
0
-200
-400
-600
2003
2004
2005
2006
2007
2008
2009
2010
Time (yrs)
Figure S-1: Baseline plot of Track 220 - Plot of the perpendicular baseline of
SAR acquisitions as a function of time along Envisat track 220. Blue dots are
acquisitions and black lines indicate the interferograms formed by combination of
these acquisitions.
3
Perpendicular Baseline (m)
200
100
0
-100
-200
2003
2004
2005
2006
2007
2008
2009
2010
Time (yrs)
Figure S-2: Baseline plot of Track 449 - Plot of the perpendicular baseline of
SAR acquisitions as a function of time along Envisat track 449. Blue dots are
acquisitions and black lines indicate the interferograms formed by combination of
these acquisitions.
4
600
Perpendicular Baseline (m)
400
200
0
-200
-400
-600
-800
2003
2004
2005
2006
2007
2008
2009
2010
Time (yrs)
Figure S-3: Baseline plot of Track 177 - Plot of the perpendicular baseline of
SAR acquisitions as a function of time along Envisat track 177. Blue dots are
acquisitions and black lines indicate the interferograms formed by combination of
these acquisitions.
5
26˚N
28˚N
62˚E
20050622
20050413
64˚E
E
ECMWF Dry Delay
62˚E
20050622
20050413
64˚E
ECMWF Wet Delay
62˚E
20050622
20050413
64˚E
MERIS Wet Delay
62˚E
20050622
0
20050413
64˚E
Tidal Load Signal
62˚E
InSAR
64˚E
4˚
26˚N
28˚N
1.2. Atmospheric and Tidal Corrections
Figure S-4: Example of cumulative corrections for InSAR
6
Figure S-4: Example of cumulative corrections for InSAR - From Left
to Right: Synthetic interferometric phase delay between Envisat ASAR acquisitions on June 22nd, 2005 and April 13th, 2005. Predictions have been computed to model the hydrostatic and wet delays using input from ECMWF’s ERAInterim, the wet delay using input from Medium Resolution Imaging Spectrometer
(MERIS) and the tidal load signal using inputs from the oceanic model FES2004.
We correct the original interferogram (far right) by combining the hydrostatic delay from ECMWF, the wet delay from MERIS and the tidal load signal. More
details on the correction method can be found in Jolivet et al. (2014).
7
20100407−20091118
Ocean Tidal Load Signal
Difference in
Ramp Estimates
28˚N
28˚N
0
mm
2
cm
2
1
0
−1
−2
−2
26˚N
26˚N
62˚E
64˚E
62˚E
64˚E
Figure S-5: Effect of the ocean tidal load signal on the long wavelength
field - Left: Prediction of the oceanic tidal load signal for the interferogram
combining Envisat acquisitions on November 18th, 2009 and April 7th, 2011. Tidal
constituents from the FES2004 tidal model are M2, S2, N2, O1, P1, Q1, S1, K1,
M4, MF and MM. Right: Difference in estimated orbital ramp on interferogram
with and without the signal of the oceanic tidal load. The orbital ramp is modeled
as a linear function of range and azimuth. Correcting from OTL signals allows to
better estimate the long wavelength of the deformation field (Jolivet et al., 2014).
8
1.3. Comparison of velocity maps
63˚E
64˚E
63˚E
65˚E
64˚E
65˚E
28˚N
28˚N
27˚N
27˚N
100 km
25˚N
63˚E
64˚E
LOS
2
1
0
−1
−2
1
100 km
65˚E
26˚N
mm/yr
mm/yr
26˚N
LO S
63˚E
0
64˚E
25˚N
65˚E
28˚N
28˚N
27˚N
27˚N
100 km
25˚N
63˚E
64˚E
LOS
2
1
0
−1
−2
1
100 km
65˚E
26˚N
mm/yr
mm/yr
26˚N
LO S
63˚E
0
64˚E
65˚E
25˚N
Figure S-6: Line-Of-Sight velocity maps - Left Maps of the Line-Of-Sight
(LOS) velocity along Envisat tracks 220, 449 and 177 derived using the New Small
Baseline Subset method (NSBAS; top row) and the Multiscale Interferometric
Time Series method (MInTS; bottom row) (see Fig. 1 in the main text for the
respective positions of Envisat tracks). White arrow indicates the LOS pointing
from the satellite. Positive velocity is toward satellite. Right Maps of uncertainty
on the LOS velocity derived using the NSBAS method (top row) and the MInTS
method (bottom row) along Envisat tracks 220, 449 and 177.
9
2. Comparing the effect of different azimuth of plate convergence
on the inferred geodetic coupling
As we use the back-slip formulation to invert for the degree of fault locking
that explains our dataset, we need to assume the azimuth of convergence of
the Arabia plate with respect to Eurasia. Following the recent recognition
of the Ormara micro plate, that has no emerged land, the convergence is
not fully constrained. For our preferred model, we use a 10o N azimuth of
convergence as it fits with both estimates from geodesy and geology (see
references in Fig. S-7). However, some discussion is needed about the effect
of a variable convergence azimuth.
Although very few data were available to constrain the focal mechanism,
the slip vector of the 1945 M8 Makran earthquake shows a 20-25o W azimuth
(Byrne et al., 1992). In addition, the analysis of significant earthquakes
(M>5) over the 2004-2012 period on the megathrust reveals a large range of
slip vector azimuths Ekstr¨om et al. (2012). Therefore, we test models with
a different azimuths of convergence, 8o W and north. We apply the same
methodology as presented in the main text. For each of the these test, the
models do not fit the data as well as our preferred orientation and do not
predict at all the few GPS velocities available in the region (see Figure S8 for the 8o W azimuth of convergence and Figure S-9 for a North oriented
convergence).
10
(b) Eastern Makran
(a) Western Makran
0
−90
40
30
20
10
0
0
10
20
30
90
40
−90
40
30
20
10
0
10
20
30
90
40
Convergent Rate (mm/yr)
Convergent Rate (mm/yr)
(c) Azimuth from earthquakes rake
(eastern Makran)
0
preferred convergence azimuth
geology
geodesy (global)
geodesy (regional)
1945, Mw 8.1, Makran
Significant earthquakes
−90
8
6
4
2
0
2
4
6
8
90
Magnitude (Mw)
Figure S-7: Azimuth of plate convergence from geology, geodesy and seis-
mology - a. Azimuths and rates of convergence derived from geological and
geodetic studies for western Makran (i.e. west of the Sistan Suture Zone). b. Azimuths and rates of convergence from geological and geodetic studies for eastern
Makran. c. Azimuths and moment magnitude extracted from significant thrust
earthquakes (source: Global CMT catalog, Ekstr¨om et al. (2012) and Byrne et al.
(1992)). The direction of convergence used in our preferred model is indicated in
a., b. and c. by a thick green line. References for a. and b. include: Gripp and
Gordon (1990); Argus and Gordon (1991); DeMets et al. (1994); Drewes (1998);
S McClusky (2000); Drewes and Angermann (2001); Gripp and Gordon (2002);
Sella et al. (2002); Kreemer et al. (2003); McClusky et al. (2003); Prawirodirdjo
and Bock (2004); Vernant et al. (2004); Reilinger et al. (2006); Drewes (2009);
Argus et al. (2010); DeMets et al. (2010).
11
Data (Khan et al. 2008; Szeliga et al, 2012)
1 cm/yr
a.
Mean Posterior PDF (Convergence 10° W)
Mean Posterior PDF (Convergence 8° E)
PASN
GWAD
ORMA
b.
Fault Coupling LOS Velocity (mm/yr)
400
−1
1.0
−5
0.5
−3
−1
1
Log10(Normalized Sensitivity)
0
100
200
300
400
1
0
−1
1.0
−5
0.5
−3
−1
1
Log10(Normalized Sensitivity)
0
100
200
300
Center (Track 449)
400
1
0
−1
1.0
−5
0.5
0.0
−3
−1
1
Log10(Normalized Sensitivity)
0
100
200
300
East (Track 177)
Fault Coupling LOS Velocity (mm/yr)
300
0
0.0
d.
200
1
0.0
c.
100
West (Track 220)
Fault Coupling LOS Velocity (mm/yr)
Distance to the trench (km)
0
400
Distance to the trench (km)
Figure S-8: Coupling inferred using a 8o W azimuth of convergence of the
Arabia plate - See next page for caption
12
Figure S-8: Coupling inferred using a 8o W convergence azimuth of the
Arabia plate - a. Gray arrows are GPS velocities along the coast of eastern
Makran with their associated uncertainties. Red arrows are the predictions from
the mean posterior PDF of fault coupling estimated with a 10o E azimuth of convergence (see main text). Blue arrows are predictions from the mean posterior
PDF of fault coupling estimated with a 8o W azimuth of convergence. b. Top:
Trench-perpendicular profile of the LOS velocity inferred from data on Envisat
track 220 (black line) and the associated standard deviation (gray shading). Red
line is the prediction from the mean posterior PDF of fault coupling when including estimates of the prediction error, Cp . Green line is the prediction from the
mean posterior PDF of fault coupling without including Cp . Bottom: Posterior
PDFs (black boxes), mean of the posterior PDF (red line) and mean of the posterior PDF without accounting for Cp (green line) of fault coupling inferred from
the profile of LOS velocity on track 220. Background color is the sensitivity (see
main text). c. Same as b. with the data from track 449. d. Same as b. with
data from track 177.
13
Data (Khan et al. 2008; Szeliga et al, 2012)
1 cm/yr
a.
Mean Posterior PDF (Convergence 10° W)
Mean Posterior PDF (Convergence 8° E)
PASN
GWAD
ORMA
0
Fault Coupling LOS Velocity (mm/yr)
400
−1
1.0
−5
0.5
−3
−1
1
Log10(Normalized Sensitivity)
0
100
200
300
400
1
0
−1
1.0
−5
0.5
−3
−1
1
Log10(Normalized Sensitivity)
0
100
200
300
Center (Track 449)
400
1
0
−1
1.0
−5
0.0
−3
−1
1
Log10(Normalized Sensitivity)
0.5
0
100
200
300
East (Track 177)
Fault Coupling LOS Velocity (mm/yr)
300
0
0.0
d.
200
1
0.0
c.
100
West (Track 220)
Fault Coupling LOS Velocity (mm/yr)
Distance to the trench (km)
b.
400
Distance to the trench (km)
Figure S-9: Coupling inferred using straight north convergence of the
Arabia plate - See next page for caption
14
Figure S-9: Coupling inferred using a straight north convergence of the
Arabia plate -
a. Gray arrows are GPS velocities along the coast of east-
ern Makran with their associated uncertainties. Red arrows are the predictions
from the mean posterior PDF of fault coupling estimated with a 10o E azimuth
of convergence (see main text). Blue arrows are predictions from the mean posterior PDF of fault coupling estimated with straight north convergence. b. Top:
Trench-perpendicular profile of the LOS velocity inferred from data on Envisat
track 220 (black line) and the associated standard deviation (gray shading). Red
line is the prediction from the mean posterior PDF of fault coupling when including estimates of the prediction error, Cp . Green line is the prediction from the
mean posterior PDF of fault coupling without including Cp . Bottom: Posterior
PDFs (black boxes), mean of the posterior PDF (red line) and mean of the posterior PDF without accounting for Cp (green line) of fault coupling inferred from
the profile of LOS velocity on track 220. Background color is the sensitivity (see
main text). c. Same as b. with the data from track 449. d. Same as b. with
data from track 177.
15
3. Effect of along-strike variations of the along-dip width of the
coupled zone.
In the main text, we invoke the possibility that variations of the width of
the coupled zone may be a possibility to explain the azimuth of the velocity
measured at the site GWAD. Indeed, given the elastic response of the ground
to slip on a patch embedded in an elastic half-space (stratified or homogeneous), a station located above a creeping patch, next to a locked patch, will
be “dragged” toward the locked patch. We illustrate this possibility using
a simple forward 3D model of the subduction. The geometry of the fault
follows the megathrust geometry defined by Byrne et al. (1992). We discrete
the fault in 10 × 15 km patches, with infinitely long patches on the edges, to
avoid edge effects. The response to slip on each patch is computed using a
layered elastic half-space, using the same characteristics as described in the
main text. We construct a synthetic distribution of coupling that fits, to first
order, with the available GPS velocities (Fig. S-10).
In our toy model, coupling is enforced to follow a gaussian function of
the distance to the trench. Maximum coupling is 1, while minimum is 0.
The characteristic width of the gaussian varies along-strike: (1) between the
easternmost edge of the model and the limit indicated in blue in figure S-10,
the width of the gaussian is of 50 km, (2) from the limit, to the westernmost
edge of the model, the width of the gaussian decreases linearly to 10 km.
This configuration results in a dual distribution of coupling with a large
region with high coupling (0.8 to 1.0) to the east and a smaller region with
intermediate coupling to the west.
We compute the velocities at the stations ORMA, PASN and GWAD
16
and on regularly spaced position in the vicinity of these stations. Although
we do not fit completely the GPS velocities, which is expected as we do
not optimise the solution, the predicted velocity field shows a variation in
the azimuth of the predicted ground velocities, from 10o N to the east (i.e.
parallel to the azimuth of convergence imposed) to 21o N. An infinitely long
fault with constant coupling would predict parallel velocity vectors, with
a 10o N azimuth. Such three-dimensional effect could therefore explain the
variation in azimuth of the velocity at site GWAD.
17
1 cm/yr
a.
Data (Khan et al. 2008; Szeliga et al, 2012)
Predictions from Synthetic Coupling Model
Predicted Velocity
Azimuth:
GWAD
21°N
PASN
13°N
b.
ORMA
10°N
50 km
North
Depth (km)
10
20
m
30 k
20-
30
40
0.00
0.50
1.00
60-
Coupling
ly
high
the ne
f
o
zo
th
Wid oupled
c
75 k
m
50
Figure S-10: Variation of the azimuth of predicted velocities due to along-
strike variations of coupling - a. Black arrows are GPS velocities at equally
sampled locations predicted by the coupling model in b.. Thick grey arrows are
GPS velocities measured by Khan et al. (2008) and Szeliga et al. (2012). Dark
red arrows are velocities predicted by the coupling model shown in b. Background
shading is topography from SRTM. White shading indicates the area where predicted GPS velocities deviates significantly from the 10o N azimuth expected. b.
3-D view of the synthetic coupling model used to explore the effect of along-strike
variations of coupling. Dashed line at the surface indicates the area covered in a.
18
References
Argus, D. F., Gordon, R. G., 1991. No-net-rotation model for current plate velocities in incorporating plate model model NUVEL-1. Geophys. Res. Lett. 18 (11),
2039–2042.
Argus, D. F., Gordon, R. G., Heflin, M. B., Ma, C., Eanes, R. J., Willis, P., Peltier,
W. R., Owen, S. E., 2010. The angular velocities of the plates and the velocity
of Earth’s centre from space geodesy. Geophys. J. Int. 180 (3), 913–960.
Byrne, D. E., Sykes, L. R., Davis, D. M., 1992. Great thrust earthquakes and aseismic slip along the plate boundary of the Makran Subduction Zone. J. Geophys.
Res. 97 (B1), 449–478.
DeMets, C., Gordon, R. G., Argus, D. F., 2010. Geodetically current plate motions.
Geophys. J. Int. 181 (1), 1–80.
DeMets, C., Gordon, R. G., Argus, D. F., Stein, S., 1994. Effect of recent revisions
to the geomagnetic reversal time scale on estimates of current plate motions.
Geophys. Res. Lett. 21 (20), 2191–2194.
Drewes, H., Angermann, D., 2001. The actual plate kinematic and crustal deformation model 2000 (apkim2000) as a geodetic reference system. In: AIG 2001
Scientific Assembly, Budapest.
Drewes, H., 1998. Combination of VLBI, SLR and GPS determined station velocities for actual plate kinematic and crustal deformation models. In: Geodynamics. M. Feissel, Springer.
Drewes, H., 2009. Geodetic Reference Frames. Springer, Ch. The actual plate kinematic and crustal deformation model APKIM2005 as basis for a non-rotating
ITRF, pp. 95–99.
19
Ekstr¨
om, G., Nettles, M., Dziewonski, A. M., 2012. The global CMT project 20042010: Centroid-moment tensors for 13,017 earthquakes. Phys. Earth Planet.
Inter. 200, 1–9.
Gripp, A. E., Gordon, R. G., 1990. Current plate velocities relative to the hotspots
in incorporating the NUVEL-1 gloabl plate motion model. Geophys. Res. Lett.
17 (8), 1109–1112.
Gripp, A. E., Gordon, R. G., 2002. Young tracks of hotspots and current plate
velocities. Geophys. J. Int. 150 (2), 321–361.
Jolivet, R., Agram, P. S., Lin, N. Y., Simons, M., Doin, M.-P., Peltzer, G., Li, Z.,
2014. Improving InSAR geodesy using Global Atmospheric Models. J. Geophys.
Res. 119, B010588.
Khan, M. A., Bendick, R., Bhat, M. I., Bilham, R., Kakar, D. M., Khan, S. F.,
Lodi, S. H., Qazi, M. S., Singh, B., Szeliga, W., A, W., 2008. Preliminary
geodetic constraints on plate boundary deformation on the western edge of the
Indian plate from TriGGnet (Tri-University GPS Geodesy Network). J. Him.
Earth Sci. 41, 71–87.
Kreemer, C., Holt, W. E., Haines, A. J., 2003. An integrated global model of
present-day plate motions and plate boundary deformation. Geophys. J. Int.
154 (1), 8–34.
McClusky, S. et al, 2000. Global Positioning System constraints on plate kinematics
and dynamics in the eastern Mediterranean and Caucasus. J. Geophys. Res.,
105 (B3), 5695–5719.
McClusky, S., Reilinger, R., Mahmoud, S., Ben Sari, D., Tealeb, A., 2003. GPS
20
constraints on Africa (Nubia) and Arabia plate motions. Geophys. J. Int.,
155 (1), 126–138.
Prawirodirdjo, L., Bock, Y., 2004. Instantaneous global plate motion model from
12 years of continuous GPS observations. J. Geophys. Res. 109 (B8).
Reilinger, R., McClusky, S., Vernant, P., Lawrence, S., Ergintav, S., Cakmak, R.,
Ozener, H., Kadirov, F., Guliev, I., Stepanyan, R., Nadariya, M., Hahubia, G.,
Mahmoud, S., Sakr, K., ArRajehi, A., Paradissis, D., Al-Aydrus, A., Prilepin,
M., Guseva, T., Evren, E., Dmitrotsa, A., Filikov, S. V., Gomez, F., Al-Ghazzi,
R., Karam, G., 2006. GPS constraints on continental deformation in the AfricaArabia-Eurasia continental collision zone and implications for the dynamics of
plate interactions. J. Geophys. Res. 111 (B5), B05411.
Sella, G. F., Dixon, T. H., Mao, A. L., 2002. REVEL: A model for Recent plate
velocities from space geodesy. J. Geophys. Res. 107 (B4).
Szeliga, W., Bilham, R., Kakar, D. M., Lodi, S. H., 2012. Interseismic strain accumulation along the western boundary of the Indian subcontinent. J. Geophys.
Res. 117 (B8), B08404.
Vernant, P., Nilforoushan, F., Hatzfeld, D., Abbassi, M. R., Vigny, C., Masson,
F., Nankali, H., Martinod, J., Ashtiani, A., Bayer, R., Tavakoli, F., CHERY,
J., 2004. Present-day crustal deformation and plate kinematics in the Middle
East constrained by GPS measurements in Iran and northern Oman. Geophys.
J. Int. 157 (1), 381–398.
21


© Copyright 2026