
Standing Waves Objective Physics Lab I
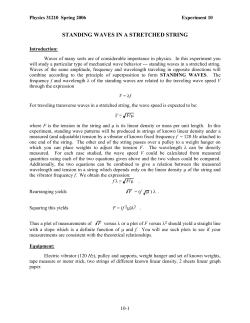
Standing Waves
Physics Lab I
Objective
In this series of experiments, the resonance conditions for standing waves on a string will
be tested experimentally.
Equipment List
PASCO SF-9324 Variable Frequency Mechanical Wave Driver, PASCO PI-9587B Digital
Frequency Generator, Table Rod, Elastic String, Table Clamp with Pulley, Set of 50 g
and 100 g Masses with Mass Holder, Meter Stick.
Theoretical Background
Consider an elastic string. One end of the string is tied to a rod. The other end is under
tension by a hanging mass and pulley arrangement. The string is held taut by the applied
force of the hanging mass. Suppose the string is plucked at or near the taut end. The
string begins to vibrate. As the string vibrates, a wave travels along the string toward
the fixed end. Upon arriving at the fixed end, the wave is reflected back toward the taut
end of the string with the same amount of energy given by the pluck, ideally.
Suppose you were to repeatedly pluck the string. The time between each pluck is
1 second and you stop plucking after 10 seconds. The frequency of your pluck is then
defined as 1 pluck per every second. Frequency is a measure of the number of repeating
cycles or oscillations completed within a definite time frame. Frequency has units of
Hertz abbreviated Hz.
As you continue to pluck the string you notice that the set of waves travelling back
and forth between the taut and fixed ends of the string constructively and destructively
interact with each other as they propagate along the string. The wave patterns move
left to right and right to left from end to end as a result of constructive and destructive
interactions for the given frequency (1 pluck per second). At certain frequencies however
the interaction between the waves from either end is not present and the resulting wave
pattern is a standing wave. Standing waves occur when there is no left or right motion
2
Standing Waves
of the wave patterns. Frequencies producing standing waves are resonant frequencies.
Figure 1 shows the first and second set of standing wave patterns for a string held taut.
Figure 1: Standing Waves on a String
As shown on Figure 1, the stationary string positions in the standing wave pattern
are known as nodes, while the positions with maximum amplitude in the pattern are
known as antinodes. The first standing wave pattern is referred to as the fundamental
or first harmonic of the string. In this pattern, there are no nodes between the two
ends of the string (the fixed ends are nodes for the pattern, though they are generally
disregarded since they are present in all the patterns). The next standing pattern, with
one node between the two ends, is known as the second harmonic. Standing waves with
more nodes between the ends are higher harmonics (i.e. third harmonic, forth harmonic,
etc.).
It is possible to determine the resonant frequencies for standing waves on a string by
considering some properties of the standing wave and the string. First notice that the
distance between two nodes represents half a wavelength, λ, of the standing wave, as
shown as in Figure 1. The wavelength can be related to the length bounded by the two
ends. This is the length of the string undergoing propagation, L. For the fundamental,
one half of the full wavelength is contained within the bounds. For the second harmonic,
one full wavelength is contained within bounds. The third harmonic would have two
nodes, which would mean there would be one and a half wavelengths between the string
ends. The progression of wavelengths can be expressed by the following mathematical
equation:
2L
n = 1, 2, 3 . . .
(1)
λn =
n
In this equation, λn is the wavelength of the standing wave, L is the length of the string
bounded by the left and right ends, and n is the standing wave pattern, or harmonic,
number. For the fundamental, n would be one; For the second harmonic, n would be
two, etc. The resonant frequency can be found by using the relationship between the
wavelength and the frequency for waves as shown in the following equation:
v = λf.
(2)
v:F06
Standing Waves
3
In this equation, v is the (phase) velocity of the waves on the string, λ is the wavelength
of the standing wave, and f is the resonant frequency for the standing wave. For waves
on a string the velocity of the waves is given by the following equation:
s
v=
T
m
, µ= .
µ
`
(3)
In this equation, v is the velocity of the waves on the string, T is the tension in the string,
and µ is the mass density of the string given by the total mass of the string m divided
by the total length of the string `. Note: ` includes the length of the string bounded by
the left and right ends and the length of the string stretched by the hanging mass.
These relationships will be tested experimentally in this series of experiments.
Procedure
Figure 2: Experimental Arrangement
Wave Velocity Determination
In this section, the propagation speed for waves on the stretched string used in this series
of experiments will be determined.
1. Place 200 g on the mass holder which is draped over the table. Record the mass
of the hanging weight on your data sheet as M ; Be sure to include the mass of the
hanger.
2. Measure the length of the stretched string from the end of the wave driver to the
center of the pulley. Record this length on your data sheet as L.
3. With the power turned off, turn the amplitude on the frequency generator down to
its minimum setting. With the amplitude at its minimum setting, turn the power
on and set the range to 100.00 Hz. Do this by pressing the down arrow (5) on
the function generator.
v:F06
4
Standing Waves
4. Turn the frequency adjustment down until the frequency display reads about 5 Hz.
5. With the frequency adjustment set to 5 Hz, turn the amplitude adjustment to half
way between the minimum and maximum value.
6. Increase the frequency until the fundamental standing wave mode is excited on the
string. Continue increasing the frequency until this mode reaches its maximum
amplitude value. Note, the amplitude referred to here is measured qualitatively.
You should see the height of wave pattern increase as the frequency increases.
The maximum frequency value corresponding to the maximum height of the string
should be recorded. It is important that the amplitude adjust knob on the frequency
generator remains fixed.
Frequency as a Function of Wavelength
In this portion of the lab, the frequency the higher harmonic modes will be measured
experimentally.
1. With the string vibrating in the fundamental standing wave mode, continue increasing the drive frequency to find the higher harmonics. With each of the harmonics
at maximum amplitude, record the frequency displayed on the frequency generator
on your data sheet as fexp .
2. Estimate and record the uncertainty in the length of the string and the uncertainty
in the frequency.
Data Analysis
Wave Velocity Determination
1. Use the mode number (n = 1) and the string length L to calculate the wavelength
of the standing wave λ.
2L
n = 1, 2, 3 . . .
(4)
λn =
n
2. Use the wavelength λ and the measured resonant frequency of the standing wave
f to calculate the wave speed v.
v = λf.
(5)
3. Use the mass of the hanging weight M to calculate the tension T in the string,
then use this tension and the wave velocity v to calculate the mass density µ of the
string.
s
T
.
(6)
T = M g, v =
µ
v:F06
Standing Waves
5
Frequency as a Function of Wavelength
1. For each standing wave mode n, use the length of the string L to calculate the
wavelength of the standing wave λ.
λn =
2L
n = 1, 2, 3 . . .
n
(7)
2. For each wavelength, use the wave velocity calculated previously to calculate and
record the theoretical value of each standing wave frequency ftheo .
v = λf.
(8)
3. Calculate the percent difference between experimental value and theoretical value
of the resonant frequency.
4. From the theory for resonance on string, it can be shown that each of the harmonics is an integer multiple of the fundamental. Test this relationship by taking
each experimentally measured frequency and divide by the fundamental frequency
measured previously.
fexp
fn = nf1 =⇒ nexp =
.
(9)
f1
5. Graph the experimental frequency fexp as a function of the inverse of the wavelength 1/λ, also known as the wave number k. Draw the line that comes closest to
these data point, and determine the slope and y-intercept of this line.
6. Calculate the percent uncertainty in the length and the frequency using the following equation:
% uncertainty = 100 ×
measurement uncertainty
.
smallest measured value
(10)
7. From the percent uncertainty in the length and frequency, determine the largest
percent uncertainty in the experiment.
Selected Questions
1. If additional mass had been added to the hanger, the string would have stretched
more and the total length of the string would have increased. What effect would
this have on the following: the mass density µ, the wave velocity v, the standing
wave wavelength λ, and the standing wave resonant frequency f ?
2. Instead of using v = λf
q to determine the wave velocity a method involving the
alternate formula, v = T /µ, could have been used: measure and record the total
mass and length of the string, calculate µ, measure and record the hanging mass,
calculate the tension, calculate the wave velocity. Why is this a less than ideal way
to determine the wave velocity for this experiment? (Hint: Consider the previous
question.)
v:F06


© Copyright 2026