
Annual Statistics 2010‐2011
Annual Statistics 2010‐2011 MANITOBA HEALTH Health Information Management Manitoba Health Annual Statistics 2010‐2011 2 Table of Contents Preface....................................................................................................................................................7 How to Use This Report.....................................................................................................................8 Important Notes and Data Cautions...................................................................................................9 Additional Publications to Consider..................................................................................................10 Demographics......................................................................................................................................11 Map of Manitoba Regional Health Authorities...................................................................................12 Population Pyramids.........................................................................................................................13 Pregnancy ........................................................................................................................................14 Births.................................................................................................................................................15 Deaths...............................................................................................................................................16 Population Health Status and Mortality.............................................................................................17 Premature Mortality...........................................................................................................................18 Infant Mortality..................................................................................................................................19 Child Mortality...................................................................................................................................20 Disease and Injury...............................................................................................................................21 Hypertension (High Blood Pressure)................................................................................................22 Diabetes............................................................................................................................................23 Acute Myocardial Infarction (Heart Attack).......................................................................................24 Stroke................................................................................................................................................25 Chronic Conditions............................................................................................................................26 Injury Hospitalizations.......................................................................................................................27 Injury Mortality...................................................................................................................................28 Manitoba Health Annual Statistics 2010‐2011 3 Depression.................................................................................................................................32 Personality Disorders.................................................................................................................33 Schizophrenia............................................................................................................................34 Substance Abuse.......................................................................................................................35 Hospitalization for Self-Inflicted Injury...............................................................................................36 Suicide..............................................................................................................................................37 Health Services Insurance Plan ........................................................................................................39 Insured Services per Capita............................................................................................................40 Use of Medical Services......................................................................................................................41 Number of General Practitioners, Specialists, Nurses and Nurse Practitioners...............................42 Physician Use...................................................................................................................................43 Continuity of Care.............................................................................................................................44 Ambulatory Care Visits.....................................................................................................................45 Use of Hospital Services.....................................................................................................................47 Map of Hospitals by Facility..............................................................................................................48 Use of Hospitals................................................................................................................................49 Hospital Separations.........................................................................................................................50 Location of Hospitalization by Region of Residence.........................................................................51 Hospitalization for Ambulatory Care Sensitive Conditions................................................................52 Alternate Level of Care.....................................................................................................................53 High Profile Surgeries.........................................................................................................................55 Coronary Artery Bypass Graft Surgery.............................................................................................56 Hip Replacement..............................................................................................................................57 Knee Replacement...........................................................................................................................58 Paediatric Dental Extraction..............................................................................................................59 Cataract Surgery...............................................................................................................................60 Manitoba Health Annual Statistics 2010‐2011 4 Women's Reproductive Health...........................................................................................................61 Hysterectomy.....................................................................................................................................62 Caesarean Section............................................................................................................................63 Vaginal Birth after Caesarean Section..............................................................................................64 Use of Home Care Services...............................................................................................................65 Average Monthly Number of Clients Receiving Coordinated Home Care Services by RHA............66 Average Monthly Number of Clients Receiving Selected Services by Category..............................67 Number of Assessments for Admission, Admissions and Discharges..............................................68 Use of Personal Care Homes.............................................................................................................69 Map of Personal Care Homes by Facility Size..................................................................................70 Personal Care Home Admissions.....................................................................................................71 Median Wait Times for Personal Care Home Admission..................................................................72 Median Length of Stay at Personal Care Homes..............................................................................73 Preventative Services.........................................................................................................................75 Breast Cancer Screening..................................................................................................................76 Cervical Cancer Screening...............................................................................................................77 Immunizations...................................................................................................................................78 Prescription Drug Use.........................................................................................................................79 Pharmaceutical Use..........................................................................................................................80 Drugs Dispensed per User...............................................................................................................81 Total Drug Expenditures by Plan and RHA......................................................................................82 Glossary...............................................................................................................................................83 Manitoba Health Annual Statistics 2010‐2011 5 This page intentionally left blank. Manitoba Health Annual Statistics 2010‐2011 6 Preface Manitoba Health’s Annual Statistics report has been redesigned for a broad audience that includes health professionals, researchers, policymakers and the general public. This report describes Manitoba’s population, health utilization and health status using key health indicators measured both over time and for the most recent fiscal year. How has the report changed? THE CONTENT: The focus of the report is population‐based rather than service‐based. This allows the reader to understand how a particular indicator differs from one region to another within Manitoba. THE LOOK: The report now includes more graphics with accompanying text to assist the reader in interpreting the data. Wherever possible, graphs are presented by regional health authority to allow greater specificity of the population to assist planners in understanding the health needs of their particular region. Any inquiries pertaining to this publication generally or in reference to specific graphs should be addressed to: Health Information Management Branch Manitoba Health Room 4041 300 Carlton Street Winnipeg, Manitoba R3B 3M9 Phone: (204) 786‐7229 Milton Sussman Deputy Minister Manitoba Health Manitoba Health Annual Statistics 2010‐2011 7 How to Use This Report The Manitoba Health Annual Statistics Report is a descriptive report comprised of thirteen sections. The report looks at the distribution of the population, mortality, disease and injury, prevalence of mental illness, physician and hospital services, use of home care and personal care homes, preventative services and prescription drug use. Unless otherwise stated, indicators in this report are population‐based rather than service‐based. In other words, the indicators reflect where people live, not where they received services. For most indicators the report provides a rate by regional health authority (RHA) and then a more in‐ depth look or “Highlight” at the Manitoba level. For some indicators, the data is only presented at the Manitoba level. The majority of the indicators report data for the 2010/2011 fiscal year. Where most recent data was not available, the prior year was used. However, in some instances due to small numbers, multiple years had to be combined to ensure confidentiality and to achieve stable rates. For more information on how the indicators were calculated and defined please refer to the glossary. Indicators found in this report show similar trends to indicators found in other public documents. However, exact rates in this report cannot be directly compared due to different inclusion and exclusion criteria. The report provides descriptive analyses of indicators, not explanatory. Indicators are produced using administrative data, which does not include information on context, history or local circumstances. The information in this report should be used in conjunction with information from other sources so that regional and provincial planners and decision‐makers can make well‐informed decisions. Manitoba Health Annual Statistics 2010‐2011 8 Important Notes and Data Cautions Throughout the report, RHAs are shown in a particular order based on their overall health status as measured by the premature mortality rate (PMR). PMR was calculated by the Manitoba Centre for Health Policy in the RHA Indicators Atlas 20091. A death before the age of 75 is considered to be premature; therefore the PMR is the average annual rate of deaths before the age of 75, per 1,000 residents under 75. The RHA with the lowest PMR (best overall health status) appears at the top of the graph. The RHA with the highest PMR (poorest overall health status) appears at the bottom of the graph. Two types of rates are presented in this report: crude rates and adjusted rates. Crude rates: A crude rate is the expression of the frequency of an event in a defined population in a defined period of time. It is calculated by dividing the number of observations by the suitable population and multiplying by an appropriate multiplier (such as 100 to create a percentage). Although crude rates do not take differences in population structure into account they are vital for policy and programming as they represent the actual rate in a given population. Adjusted Rates: The adjustment of rates is a statistical process that makes groups such as those in particular geographic areas comparable by removing the effects of demographic differences such as age and gender distribution. Essentially, adjusted rates tell us what the rates would be if each geographic area had the same age and sex distribution. Therefore, adjusted rates are fictional rates which use statistical models to remove the effects of age and sex differences to allow for comparisons across populations. Accordingly, while adjusted rates have been statistically modelled to be comparable to each other, they should be considered fictional in the sense that they do not measure anything directly. Please note that these adjusted rates cannot be compared to other rates which have not received the same adjustment. Statistical Testing: Statistical testing was performed to determine whether regional rates were statistically significantly different from the Manitoba rate for each time period. If a difference was statistically different, then we are 99% confident that this difference is not just due to chance. Please note the following data cautions when reading the graphs: (*) Indicates that the region is statistically different from Manitoba. (!) Indicates that the regional rate should be used with caution due to small numbers. (‐) Indicates that the regional rate is suppressed because the numerator contains a small number of individuals which could potentially be identified. (..) Indicates that there was no data for this time period. ____________________________ 1. Fransoo R, Martens P, Burland E, The Need to Know Team, Prior H, Burchill C. Manitoba RHA Indicators Atlas 2009. Winnipeg, MB: Manitoba Centre for Health Policy, September 2009. Manitoba Health Annual Statistics 2010‐2011 9 Additional Publications to Consider While this report has attempted to provide an overview of statistics from across the health care system, it is by no means exhaustive. For more detailed information on cancer incidence and mortality, please refer to the following link from CancerCare Manitoba – http://www.cancercare.mb.ca/home/cancer_research/epidemiology_and_cancer_registry/reports/ The Regional Health Authorities also provide statistics in the comprehensive Community Health Assessments which are conducted every five years. The reports for each RHA can be found at: Assiniboine – http://www.assiniboine‐rha.ca/images/uploads/ARHA_CHA_Final.pdf Brandon – http://www.brandonrha.mb.ca/export/sites/brandonrha/galleries/pdf/news/CHA_2009.pdf Burntwood – http://www.brha.mb.ca/community_assessment_report2009.htm Central – http://www.rha‐central.mb.ca/data/CHA‐document‐RHA‐Central.pdf Churchill – http://www.churchillrha.com/pdfs/comhel09.pdf Interlake – http://www.irha.mb.ca/data/1/rec_docs/7499_CHA_2010_IRHA_Comprehensive_Report.pdf NOR‐MAN – http://www.norman‐rha.mb.ca/documents/2009‐2010NRHACHAReport‐ElectronicVersion.pdf North Eastman – http://www.neha.mb.ca/2009chareport.pdf Parkland – http://www.prha.mb.ca/Publications/PRHA%20CHA%202009_FINAL%20pdf.pdf South Eastman – http://www.sehealth.mb.ca/data//1/rec_docs/2876_South_Eastman_Comprehensive_CHA_2008‐09.pdf Winnipeg – http://www.wrha.mb.ca/research/cha2009/index.php Manitoba Health Annual Statistics 2010‐2011 10 Demographics The following section provides an overview of the demographics of the population of Manitoba. This includes population distribution and size, pregnancies, births and deaths. In 2010/2011, Manitoba had a population of 1,230,270 residents. There were a total of 19,124 pregnancies in the same year. There were 15,735 babies born in 2009/2010. In the same time period, 9,822 Manitobans died, with the majority of these deaths being due to circulatory disease and cancer. Manitoba Health Annual Statistics 2010‐2011 11 DEMOGRAPHICS Map of Manitoba Regional Health Authorities Manitoba Health Annual Statistics 2010‐2011 12 DEMOGRAPHICS Population Pyramids Male Female 10% 85+ 80‐84 75‐79 70‐74 65‐69 60‐64 55‐59 50‐54 45‐49 40‐44 35‐39 30‐34 25‐29 20‐24 15‐19 10‐14 5‐9 0‐4 5% 0% 5% 10% Figure 1: Population pyramid for Manitoba, 2010/2011 Figure 1 shows the age and sex composition of the Manitoba population, based on records of residents registered with Manitoba Health on June 1, 2010. The percentage of the population within each particular age group is shown for males and females. In 2010/2011, the total population of Manitoba was 1,230,270 residents, of which 49% were male and 51% were female. In the population pyramid two distinct bulges can be seen. One represents those in their mid forties and early fifties, and the second represents those in their late teens. Figure 2 shows the age and sex composition of Manitoba First Nations people based on records of self‐reported First Nations residents registered with Manitoba Health on June 1, 2010. First Nations people in Manitoba are a much younger population. Of the 88,874 people who declared their First Nations status to Manitoba Health, 56% were under the age Manitoba Health Annual Statistics 2010‐2011 of 25, compared to only 33% for the Manitoba population overall. For more information on Manitoba’s population, please refer to the Manitoba Health Population Report at http://www.gov.mb.ca/health/population/index.html Male Female 20% 10% 85+ 80‐84 75‐79 70‐74 65‐69 60‐64 55‐59 50‐54 45‐49 40‐44 35‐39 30‐34 25‐29 20‐24 15‐19 10‐14 5‐9 0‐4 0% 10% 20% Figure 2: Population pyramid for Manitoba First Nations people, 2010/2011 13 DEMOGRAPHICS Pregnancy Manitoba (65.1) South Eastman 64.1 Central 72.0 Assiniboine 64.6 Brandon 63.0 Winnipeg 59.6 Interlake 64.3 North Eastman 74.4 Parkland 72.9 Churchill (!) 66.3 NOR-MAN 83.5 (*) Burntwood 111.6 0.0 20.0 40.0 60.0 80.0 100.0 120.0 Figure 3: Age-adjusted rate of pregnancies per 1,000 female residents ages 15 to 49 by RHA, 2010/2011 Figure 3 shows the age‐adjusted rate of pregnancies for Manitoba women ages 15 to 49 by RHA of residence. Pregnancies include all live births, stillbirths, abortions and ectopic pregnancies. 35-39 11.7% 40-44 2.5% In 2010/2011, there were a total of 19,124 pregnancies among Manitoba women ages 15 to 49, representing a rate of 65.1 pregnancies per 1,000 women in the same age group. Burntwood RHA had a significantly higher age‐adjusted pregnancy rate with the rate almost two times that observed for Manitoba overall. 45-49 15-19 0.2% 9.6% 20-24 21.5% 30-34 25.2% The majority of pregnancies were among women ages 20 to 34, as 76% of the pregnancies were represented by women in this age group (Figure 4). 25-29 29.3% Figure 4: Percentage of total pregnancies by age group, 2010/2011 Manitoba Health Annual Statistics 2010‐2011 14 DEMOGRAPHICS Births Manitoba (13.0) (*) So uth Eastman 14.8 (*) Central 16.1 Assinib o ine 12.1 Brand o n 13.7 (*) Winnip eg 11.5 (*) Interlake 10.6 No rth Eastman 12.7 (*) Parkland 9.1 Churchill 9.8 (*) NOR-MAN 22.8 (*) Burntwo o d 27.4 0.0 5.0 10.0 15.0 20.0 25.0 30.0 Figure 5: Crude rate of total births per 1,000 residents by RHA of residence, 2009/2010 Figure 5 shows the crude number of live births by RHA of residence, per 1,000 population. newborns per 1,000 population. Rates varied significantly across the province, ranging from a high of 27.4 births per 1,000 population in Burntwood to a low of 9.1 births per 1,000 population in Parkland. In 2009/2010, there were 15,735 babies born to Manitoba residents, representing a rate of 13 The majority of babies born in Manitoba had an average birth weight (2,500g to 4,000g), with 80% of newborns within this group (Figure 6). Of the remaining newborns, 14% had a high birth weight (greater than 4,000g) and 6% had a low birth weight (less than 2,500g). 100% 90% 80% 70% 60% 50% 40% 30% 20% 10% 0% Low Birth Weight Average Birth Weight High Birth Weight Figure 6: Percentage of total live births by weight, 2009/2010 Manitoba Health Annual Statistics 2010‐2011 15 DEMOGRAPHICS Deaths Manitoba (8.1) (*) South Eastman 7.0 Central 7.5 Assiniboine 7.5 Brandon 8.3 Winnipeg 8.0 Interlake 8.5 North Eastman 7.6 Parkland 8.9 Churchill 6.8 (*) NOR-MAN 12.6 (*) Burntwood 14.5 0.0 2.0 4.0 6.0 8.0 10.0 12.0 14.0 16.0 Figure 7: Age- and sex-adjusted rate of death per 1,000 residents by RHA, 2009/2010 Figure 7 shows the age‐ and sex‐adjusted death rate per 1,000 population by region of residence. population. The age‐and sex‐adjusted death rates in Burntwood and NOR‐MAN RHAs were significantly higher than Manitoba overall while the rate in South Eastman was significantly lower. In 2009/2010, 9,822 Manitoba residents died, representing a rate of 8.1 deaths per 1,000 Respiratory 8% Mental /Behavioural 6% Injuries 7% Endocrine & Metabolism 5% Nervous 4% Cancer 28% Digestive 4% Ill Defined Signs & Symptoms 2% In Manitoba overall, the most common cause of death was circulatory disease, followed by cancer. These two causes represented 58% of all deaths (Figure 8). Genitourinary 2% Other 4% Circulatory 30% Figure 8: Percentage of death by cause, 2009/2010 Manitoba Health Annual Statistics 2010‐2011 16 Population Health Status and Mortality The following section provides an overview of population health status and mortality within Manitoba. This includes premature mortality rates, infant mortality rates and child mortality rates. From 2005/2006 to 2009/2010 on average 3,724 Manitoba residents died each year before the age of 75. For the same time period there was an annual average of 95 infant deaths and 106 deaths of children between the ages of 1 to 19. The rate of death for male children remained consistently higher than female children. Manitoba Health Annual Statistics 2010‐2011 17 POPULATION HEALTH STATUS & MORTALITY Premature Mortality Manitoba (3.4) (*) South Eastman 2.5 (*) Central 2.9 Assiniboine 3.2 Brandon 3.1 Winnipeg 3.2 Interlake 3.5 North Eastman 3.7 (*) Parkland 4.0 Churchill (!) 3.3 (*) NOR-MAN 4.3 (*) Burntwood 6.7 0.0 1.0 2.0 3.0 4.0 5.0 6.0 7.0 8.0 Figure 9: Age- and sex-adjusted rate of premature death per 1,000 residents under the age of 75 by RHA, 2005/2006 to 2009/2010 Figure 9 shows the age‐ and sex‐adjusted premature mortality rate. Premature mortality is defined as death before the age of 75. On average, there were 3,724 Manitoba residents that died before the age of 75, representing a rate of 3.4 deaths per 1,000 residents under the age of 75. The premature mortality rates in NOR‐MAN, Parkland and Burntwood RHAs were significantly higher than in Manitoba overall. Manitoba Health Annual Statistics 2010‐2011 18 POPULATION HEALTH STATUS & MORTALITY Infant Mortality Manitoba (6.4) South Eastman 5.6 Central 6.1 Assiniboine 8.5 (*) Brandon (!) 1.8 Winnipeg 6.3 Interlake 6.1 North Eastman (!) 5.9 Parkland (!) 5.2 Churchill (..) 0.0 NOR-MAN 9.5 (*) Burntwood 9.4 0.0 1.0 2.0 3.0 4.0 5.0 6.0 7.0 8.0 9.0 10.0 Figure 10: Crude rate of infant deaths per 1,000 infants by RHA, 2005/2006 to 2009/2010 Figure 10 shows the crude rate of infant death by RHA of residence. Infants are defined as individuals less than one year of age. From 2005/2006 to 2009/2010, there were 477 deaths among Manitoba infants, representing a rate of 6.4 deaths per 1,000 infants. The infant mortality rate in Burntwood RHA was significantly higher than Manitoba overall, while the rate in Brandon was significantly lower. Figure 11 shows the infant mortality rate in Manitoba over time. The overall infant mortality rate in Manitoba appeared to be relatively stable over time. However, the gap between males and females, where males historically have had a higher infant mortality rate, seemed to be narrowing. 10 8 6 4 2 0 00/01 01/02 02/03 03/04 04/05 05/06 06/07 07/08 08/09 09/10 F e m a le 5.7 5.2 5.7 6.3 6.4 5.4 6.7 6.4 5.8 5.9 M a le 7.6 8.0 8.4 8.8 6.9 6.6 6.1 8.5 6.7 6.2 M a n it o b a 6.7 6.7 7.1 7.5 6.7 6.0 6.4 7.5 6.3 6.0 Figure 11: Crude rate of infant deaths per 1,000 infants by fiscal year Manitoba Health Annual Statistics 2010‐2011 19 POPULATION HEALTH STATUS & MORTALITY Child Mortality M an ito b a (34.5) 17.7 (*) S o uth E as tm an 37.1 Central A s s inib o ine 46.7 B rand o n 14.6 (*) W innip eg 24.2 Interlak e 24.9 (*) N o rth E as tm an 63.4 P ark land 48.9 Churc hill (..) 0.0 68.8 (*) NO R-M A N (*) B urntwo o d 110.6 0.0 20.0 40.0 60.0 80.0 100.0 120.0 Figure 12: Age- and sex-adjusted rate of death per 100,000 children ages 1 to19 by RHA, 2005/2006 to 2009/2010 Figure 12 shows the age‐ and sex‐adjusted rate of child death by RHA of residence. Children are defined as individuals between ages 1 and 19. higher than Manitoba overall, while the rates in Winnipeg and South Eastman were significantly lower. From 2005/2006 to 2009/2010, there were 528 deaths among Manitoba children. This represented a rate of 34.5 deaths per 100,000 children ages 1 to 19. The child mortality rates in Burntwood, North Eastman and NOR‐MAN RHAs were significantly Figure 13 shows the child mortality rate in Manitoba over time. The child mortality rate in Manitoba appeared to be stable over time, with the mortality rate in males remaining consistently higher than that of females. 60 50 40 30 20 10 0 00/01 01/02 02/03 03/04 04/05 05/06 06/07 07/08 08/09 09/10 Female 27.2 20.6 19.4 20.8 24.8 26.3 31.2 27.1 25.0 29.5 Male 46.7 41.1 45.2 37.1 49.8 43.0 40.7 44.0 34.1 42.9 Manitoba 37.2 31.1 32.6 29.2 37.6 34.8 36.1 35.8 29.7 36.4 Figure 13: Age- and sex-adjusted rate of death per 100,000 children age 1 to 19 by fiscal year Manitoba Health Annual Statistics 2010‐2011 20 Disease and Injury The following section provides an overview of the burden of illness for selected diseases and chronic conditions, along with injury hospitalizations and deaths due to injury. In 2009/2010, 27.2% of Manitobans over the age of 19 had hypertension, and 7.5% of Manitobans age one and older had diabetes. In the same time period, there were approximately 4 heart attacks and 3 strokes for every 1,000 Manitoba residents age 40 and older. In 2010/2011, 46.5% of Manitobans age 20 and older had one or more of the following chronic conditions: arthritis, asthma/COPD, coronary heart disease, diabetes or stroke. For the same time period, there were 8,983 injury‐related hospitalizations. In 2009/2010 there were 629 deaths where injury was the cause of death. Manitoba Health Annual Statistics 2010‐2011 21 DISEASE AND INJURY Hypertension (High Blood Pressure) Manitoba (27.2%) South Eastman 25.7% Central 26.1% Assiniboine 27.0% Brandon 26.4% Winnipeg 27.0% Interlake 28.4% (*) North Eastman 30.4% (*) Parkland 30.4% Churchill 31.6% NOR-MAN 25.8% (*) Burntwood 0.0% 35.0% 5.0% 10.0% 15.0% 20.0% 25.0% 30.0% 35.0% 40.0% Figure 14: Age- and sex-adjusted percent of residents with hypertension age 20 and older by RHA, 2009/2010 Figure 14 shows the age‐ and sex‐adjusted prevalence of hypertension among Manitoba residents age 20 and older by RHA of residence. with hypertension was significantly higher in Burntwood, Parkland and North Eastman RHAs when compared to Manitoba overall. In 2009/2010, there were 235,683 Manitobans with hypertension (high blood pressure). This represented 27.2% of the total population age 20 and older. Hypertension prevalence varied across the province, as the percentage of people living Figure 15 shows hypertension prevalence in Manitoba over time. The proportion of people living with hypertension appeared to have increased steadily from 21.7% in 2000/2001 to 27.2% in 2009/2010. 4 0 .0 % 3 5 .0 % 3 0 .0 % 2 5 .0 % 2 0 .0 % 1 5 .0 % 1 0 .0 % 5.0% 0.0% M a n it o b a 00/01 0 1 /0 2 0 2 /0 3 0 3 /0 4 0 4 /0 5 0 5 /0 6 06/07 07/08 08/09 09/10 2 1 .7 % 2 2 .5 % 2 3 .3 % 24.1% 24.7% 25.3% 2 5 .9 % 2 6 .4 % 2 6 .8 % 2 7 .2 % Figure 15: Age- and sex-adjusted percent of residents with hypertension age 20 and older by fiscal year Manitoba Health Annual Statistics 2010‐2011 22 DISEASE AND INJURY Diabetes Manitoba (7.5%) (*) South Eastman 6.0% (*) Central 6.3% Assiniboine 7.3% Brandon 7.5% Winnipeg 7.0% Interlake 7.9% (*) North Eastman 9.2% 9.0% (*) Parkland 13.9% (*) Churchill 12.1% (*) NOR-MAN 17.0% (*) Burntwood 0.0% 2.0% 4.0% 6.0% 8.0% 10.0% 12.0% 14.0% 16.0% 18.0% Figure 16: Age- and sex-adjusted percent of residents with diabetes age one and older by RHA, 2009/2010 Figure 16 shows the age‐ and sex‐adjusted prevalence of diabetes among Manitoba residents age one and older by RHA of residence. Figure 17 shows diabetes prevalence in Manitoba over time. The proportion of people living with diabetes increased steadily from 5.2% in 2000/2001 to 7.5% in 2009/2010. In 2009/2010, there were 90,005 Manitobans with diabetes, representing 7.5 % of the total population age one and older. Diabetes prevalence varied across the province ranging from a high of 17.0% in Burntwood RHA to a low of 6.0% in South Eastman. 10.0% 9.0% 8.0% 7.0% 6.0% 5.0% 4.0% 3.0% 2.0% 1.0% 0.0% M a n it o b a 0 0 /0 1 01/02 02/03 03/04 04/05 05/06 06/07 07/08 08/09 0 9 /1 0 5.2% 5.5% 5.8% 6.0% 6.3% 6.6% 6.9% 7.1% 7.3% 7.5% Figure 17: Age- and sex-adjusted percent of residents with diabetes age one and older by fiscal year Manitoba Health Annual Statistics 2010‐2011 23 DISEASE AND INJURY Acute Myocardial Infarction (Heart Attack) Manitoba (4.2) South Eastman 3.3 Central 4.5 Assiniboine 4.6 Brandon 4.3 Winnipeg 3.9 Interlake 5.2 North Eastman 4.2 (*) Parkland 6.5 Churchill (-) NOR-MAN 4.9 Burntwood 3.8 0.0 1.0 2.0 3.0 4.0 5.0 6.0 7.0 Figure 18: Age- and sex-adjusted rate of heart attack per 1,000 residents age 40 and older by RHA, 2009/2010 Figure 18 shows the age‐ and sex‐adjusted rate of heart attack (AMI) in Manitoba residents age 40 and older by RHA of residence. In 2009/2010, there were 2,420 heart attacks among Manitoba residents, representing a rate of 4.2 heart attacks per 1,000 population age 40 and older. Rates varied across the province. When compared to Manitoba overall, a significantly higher rate of heart attacks occurred among Parkland residents. Figure 19 shows the rate of heart attacks in Manitoba over time. The rate of heart attacks appeared to be on a downward trend from 2000/2001 to 2005/2006. The rate increased in 2006/2007 and then levelled off, remaining relatively stable up to 2009/2010. 6.0 5.0 4.0 3.0 2.0 1.0 0.0 M a n it o b a 00/01 01/02 02/03 03/04 04/05 05/06 06/07 07/08 08/09 09/10 4 .9 4 .7 4 .6 4 .4 4 .4 3 .8 4 .1 4 .2 4 .3 4 .2 Figure 19: Age- and sex-adjusted rate of heart attack per 1,000 residents age 40 and older by fiscal year Manitoba Health Annual Statistics 2010‐2011 24 DISEASE AND INJURY Stroke Manitoba (2.6) 2.9 South Eastman Central 2.7 Assiniboine 2.6 (*) Brandon 1.7 Winnipeg 2.6 Interlake 2.6 North Eastman 2.6 Parkland 3.3 Churchill (..) NOR-MAN 3.0 (*) Burntwood 5.8 0.0 1.0 2.0 3.0 4.0 5.0 6.0 7.0 Figure 20: Age- and sex-adjusted rate of stroke per 1,000 residents age 40 and older by RHA, 2009/2010 Figure 20 shows the age‐ and sex‐adjusted stroke rate in Manitoba residents age 40 and older by RHA of residence. strokes occurred among Burntwood residents, and a significantly lower rate of strokes occurred among Brandon residents. In 2009/2010, there were 1,514 strokes among Manitoba residents, representing a rate of 2.6 strokes per 1,000 population age 40 and older. Rates varied across the province. When compared to Manitoba overall, a significantly higher rate of Figure 21 shows the stroke rate in Manitoba residents over time. The rate of strokes decreased over time, from 3.5 per 1,000 population in 2000/2001 to 2.6 per 1,000 population in 2009/2010. 4 .0 3 .0 2 .0 1 .0 0 .0 M a n it o b a 00/01 01/02 02/03 03/04 04/05 0 5 /0 6 06/07 07/08 08/09 09/10 3 .5 3.2 3.1 3.1 2.6 2 .6 2.7 2.8 2.7 2.6 Figure 21: Age-and sex-adjusted rate of stroke per 1,000 residents age 40 and older by fiscal year Manitoba Health Annual Statistics 2010‐2011 25 DISEASE AND INJURY Chronic Conditions Manitoba (46.5%) (*) South Eastman 43.7% (*) Central 43.5% Assiniboine 45.4% (*) Brandon 49.9% Winnipeg 46.4% Interlake 47.8% (*) North Eastman 49.6% (*) Parkland 51.2% Churchill 50.6% NOR-MAN 47.0% Burntwood 0.0% 48.4% 10.0% 20.0% 30.0% 40.0% 50.0% 60.0% Figure 22: Age- and sex-adjusted percent of residents with chronic conditions age 20 and older by RHA, 2010/2011 Figure 22 shows the age‐ and sex‐adjusted percent of people living with chronic conditions. The chronic condition rate is defined as the percent of the population age 20 and older having one or more of the following conditions: arthritis, asthma/COPD, coronary heart disease, diabetes or stroke. In 2010/2011, 417,524 Manitobans age 20 and older received medical care for one or more chronic conditions, representing 46.5% of the Manitoba population of the same age group. The percent of the population with at least one chronic condition ranged from 43.5% in Central to 51.2% in Parkland. Three Conditions 6.8% Four Conditions 1.6% Five Conditions 0.2% Two Conditions 24.6% One Condition 66.8% Of those residents living with a chronic condition, Figure 23 shows the proportion with one or multiple chronic conditions. Two‐thirds (66.8%) of those with a chronic condition had just one condition, 24.6% had two conditions and the remaining 8.6% had three or more chronic conditions. Figure 23: Percentage of residents with chronic conditions age 20 and older, by the number of chronic conditions, 2010/2011 Manitoba Health Annual Statistics 2010‐2011 26 DISEASE AND INJURY Injury Hospitalization Manitoba (7.3) South Eastman 6.2 Central 7.4 Assiniboine 8.2 Brandon 7.2 (*) Winnipeg 5.8 Interlake 7.1 North Eastman 8.4 (*) Parkland 14.2 (*) Churchill 26.2 (*) NOR-MAN 12.4 (*) Burntwood 22.3 0.0 5.0 10.0 15.0 20.0 25.0 30.0 Figure 24: Age- and sex-adjusted rate of hospitalization for injury per 1,000 residents by RHA, 2010/2011 Figure 24 shows the age‐ and sex‐adjusted rate of injury hospitalizations per 1,000 residents. Figure 25 shows the rate of injury hospitalization in 2010/2011 among Manitobans by age and sex. An elevated rate of injury hospitalization rates was evident for those ages 15 to 29, particularly for males. The rate in males remained higher than females until the age of 60. At the age of 65 the female rate exceeded that of males. Injury hospitalization rates for both sexes began to increase at the age of 65 and continued to increase exponentially up to age 90+. In 2010/2011, there were 8,983 hospitalizations related to injury among Manitoba residents, representing a rate of 7.3 injury hospitalizations per 1,000 population. Rates varied significantly across the province. Residents of Burntwood and Churchill RHAs had over three times the rate of injury hospitalizations compared to Manitoba overall. Residents of Winnipeg had the lowest injury hospitalization rates. 8 0 .0 7 0 .0 6 0 .0 5 0 .0 4 0 .0 3 0 .0 2 0 .0 1 0 .0 0 .0 0 1 -4 5 -9 1 0 -1 4 1 5 -1 9 2 0 -2 4 2 5 -2 9 3 0 -3 4 3 5 -3 9 4 0 -4 4 4 5 -4 9 5 0 -5 4 5 5 -5 9 6 0 -6 4 6 5 -6 9 7 0 -7 4 7 5 -7 9 8 0 -8 4 8 5 -8 9 90+ M a le 2.7 2 .6 2 .2 3 .5 8 .7 9 .2 7 .8 6 .2 6 .8 6 .3 6 .1 6 .0 6 .3 5 .8 7 .0 9 .1 1 5 .9 2 3 .9 3 2 .7 6 4 .0 F e m a le 1.5 2 .5 1 .1 2 .6 6 .3 5 .1 4 .3 4 .7 3 .7 4 .1 4 .2 4 .6 5 .0 6 .7 8 .1 1 1 .6 1 9 .8 3 1 .3 5 2 .4 7 5 .6 Figure 25: Age‐ and gender‐specific rate of hospitalization for injury per 1,000 residents, 2010/2011 Manitoba Health Annual Statistics 2010‐2011 27 DISEASE AND INJURY Injury Mortality Manitoba (0.52) South Eastman 0.42 Central 0.40 Assiniboine 0.41 Brandon (!) 0.32 Winnipeg 0.46 Interlake 0.65 North Eastman 0.57 (*) Parkland Churchill (..) 0.83 0.00 (*) NOR-MAN 1.11 (*) Burntwood 0.00 1.64 0.20 0.40 0.60 0.80 1.00 1.20 1.40 1.60 1.80 Figure 26: Age- and sex-adjusted rate of death due to injury per 1,000 residents by RHA, 2009/2010 deaths per 1,000 population. The age‐and sex‐ adjusted death rates in Burntwood, NOR‐MAN and Parkland RHAs were significantly higher than Manitoba overall, with Burntwood RHA having an injury mortality rate three times that of the rate in Manitoba. Figure 26 shows the age‐ and sex‐adjusted rate of death for which an injury was the cause, per 1,000 residents. In 2009/2010, there were 629 deaths due to injury for Manitoba residents, representing a rate of 0.52 In Manitoba overall the most common cause of injury death was falls, followed by violence to self. These two causes combined represented 52% of all injury‐related deaths (Figure 27). Other, 12.4% Fire and Flames, 2.2% Suffocation and Choking, 2.5% Falls, 30.0% Drowning, 2.7% Violence by Others, 7.8% Poisoning, 13.5% Violence to Self, 22.4% Motor Vehicle, 14.1% Figure 27: Percentage of injury deaths, by cause, 2009/2010 Manitoba Health Annual Statistics 2010‐2011 28 Prevalence of Mental Illness and Use of Services The following section provides an overview of the prevalence of mental illness. Between 2006/2007 and 2010/2011, approximately 25% of Manitobans age 10 and older received medical care for at least one of the following mental illnesses: depression, anxiety, substance abuse, personality disorder, or schizophrenia. In 2010/2011 there were approximately 572 hospitalizations related to self‐inflicted injury for Manitoba residents. This represented a rate of 53.1 self‐inflicted injury hospitalizations per 100,000 residents age 10 and older. On average, there were 178 suicides per year for the period of 2005/2006 to 2009/2010. This represented a suicide rate of less than one for every thousand Manitoba residents. Manitoba Health Annual Statistics 2010‐2011 29 PREVALENCE OF MENTAL ILLNESS AND USE OF SERVICES Cumulative Mental Illness Manitoba (25.2%) 21.4% (*) South Eastman 20.8% (*) Central 21.6% (*) Assiniboine 29.6% (*) Brandon 26.6% (*) Winnipeg 23.3% (*) Interlake 24.0% North Eastman 27.6% (*) Parkland 26.7% Churchill 22.1% (*) NOR-MAN 23.9% Burntwood 0.0% 5.0% 10.0% 15.0% 20.0% 25.0% 30.0% 35.0% Figure 28: Age- and sex-adjusted prevalence for cumulative mental illness among residents age 10 and older by RHA, 2006/2007 to 2010/2011 Figure 28 shows the age‐ and sex‐adjusted prevalence for cumulative mental illness among Manitoba residents age 10 and older by RHA of residence. Cumulative mental illness is defined as receiving medical care for at least one of: depression, anxiety disorders, substance abuse, schizophrenia or a personality disorder. From 2006/2007 to 2010/2011, there were 250,265 Manitoba residents treated for at least one of these mental illnesses, representing 25.2% of Manitoba residents age 10 and older. The age‐and sex‐ adjusted rates in Brandon, Winnipeg and Parkland were significantly higher than the Manitoba rate, while all other regions with the exception of Churchill, North Eastman and Burntwood were significantly lower. Manitoba Health Annual Statistics 2010‐2011 30 PREVALENCE OF MENTAL ILLNESS AND USE OF SERVICES Anxiety Manitoba (8.6%) 6.1% (*) South Eastman 5.9% (*) Central 6.1% (*) Assiniboine 11.6% (*) Brandon 9.7% (*) Winnipeg 6.7% (*) Interlake 7.2% (*) North Eastman 11.3% (*) Parkland 5.7% (*) Churchill 6.3% (*) NOR-MAN 5.0% (*) Burntwood 0.0% 2.0% 4.0% 6.0% 8.0% 10.0% 12.0% 14.0% Figure 29: Age- and sex-adjusted prevalence for anxiety among residents age 10 and older by RHA, 2006/2007 to 2010/2011 Figure 29 shows the age‐ and sex‐adjusted prevalence for anxiety among Manitoba residents age 10 and older by RHA of residence. From 2006/2007 to 2010/2011, there were 85,452 Manitoba residents treated for anxiety, Manitoba Health Annual Statistics 2010‐2011 representing 8.6% of Manitoba residents age 10 and older. The age‐and sex‐adjusted rates in Brandon, Winnipeg and Parkland were significantly higher than the Manitoba rate, while all other regions were significantly lower. 31 PREVALENCE OF MENTAL ILLNESS AND USE OF SERVICES Depression Manitoba (19.7%) 17.3% (*) South Eastman (*) Central 17.1% (*) Assiniboine 17.1% 22.8% (*) Brandon 20.8% (*) Winnipeg 18.5% (*) Interlake 18.9% North Eastman 21.3% (*) Parkland 15.5% Churchill (*) NOR-MAN 15.2% (*) Burntwood 15.1% 0.0% 5.0% 10.0% 15.0% 20.0% 25.0% Figure 30: Age- and sex-adjusted prevalence for depression among residents age 10 and older by RHA, 2006/2007 to 2010/2011 Figure 30 shows the age‐ and sex‐adjusted prevalence for depression among Manitoba residents age 10 and older by RHA of residence. From 2006/2007 to 2010/2011, there were 195,953 Manitoba residents treated for depression, Manitoba Health Annual Statistics 2010‐2011 representing 19.7% of Manitoba residents age 10 and older. The age‐and sex‐adjusted rates in Brandon, Parkland and Winnipeg were significantly higher than the Manitoba rate, while all other regions with the exception of North Eastman and Churchill were significantly lower. 32 PREVALENCE OF MENTAL ILLNESS AND USE OF SERVICES Personality Disorders Manitoba (0.79%) 0.38% (*) South Eastman 0.55% (*) Central 0.48% (*) Assiniboine 0.72% Brandon 0.95% Winnipeg 0.44% (*) Interlake 0.37% (*) North Eastman 1.05% (*) Parkland 0.94% Churchill (!) 0.64% NOR-MAN 0.49% (*) Burntwood 0.00% 0.20% 0.40% 0.60% 0.80% 1.00% 1.20% Figure 31: Age- and sex-adjusted prevalence for personality disorders among residents age 10 and older by RHA, 2006/2007 to 2010/2011 Figure 31 shows the age‐ and sex‐adjusted prevalence for personality disorders among Manitoba residents age 10 and older by RHA of residence. disorder, representing 0.79% of Manitoba residents age 10 and older. The age‐and sex‐adjusted rate was significantly higher in Parkland when compared to the Manitoba rate. From 2006/2007 to 2010/2011, there were 7,885 Manitoba residents treated for a personality Manitoba Health Annual Statistics 2010‐2011 33 PREVALENCE OF MENTAL ILLNESS AND USE OF SERVICES Schizophrenia Manitoba (0.78%) (*) South Eastman 0.44% (*) Central 0.45% 0.32% (*) Assiniboine 0.74% Brandon Winnipeg 0.94% (*) Interlake 0.50% (*) North Eastman 0.39% (*) Parkland 1.07% Churchill (!) 1.39% NOR-MAN 0.62% Burntwood 0.00% 0.84% 0.20% 0.40% 0.60% 0.80% 1.00% 1.20% 1.40% 1.60% Figure 32: Age- and sex-adjusted prevalence for schizophrenia among residents age 10 and older by RHA, 2006/2007 to 2010/2011 Figure 32 shows the age‐ and sex‐adjusted prevalence for schizophrenia among Manitoba residents age 10 and older by RHA of residence. From 2006/2007 to 2010/2011, there were 7,746 Manitoba residents treated for schizophrenia, Manitoba Health Annual Statistics 2010‐2011 representing 0.78% of Manitoba residents age 10 and older. The age‐and sex‐adjusted rate in Parkland was significantly higher than Manitoba overall. 34 PREVALENCE OF MENTAL ILLNESS AND USE OF SERVICES Substance Abuse Manitoba (5.0%) (*) South Eastman 3.8% (*) Central 3.5% Assiniboine 4.7% (*) Brandon 6.2% Winnipeg 5.0% Interlake 4.8% (*) North Eastman 5.6% (*) Parkland 5.9% (*) Churchill 14.4% (*) NOR-MAN 7.6% (*) Burntwood 0.0% 10.0% 2.0% 4.0% 6.0% 8.0% 10.0% 12.0% 14.0% 16.0% Figure 33: Age- and sex-adjusted prevalence for substance abuse among residents age 10 and older by RHA, 2006/2007 to 2010/2011 Figure 33 shows the age‐ and sex‐adjusted prevalence for substance abuse among Manitoba residents age 10 and older by RHA of residence. representing 5.0% of Manitoba residents age 10 and older. The age‐and sex‐adjusted rate for Churchill was almost 3 times higher than the Manitoba rate. From 2006/2007 to 2010/2011, there were 50,048 Manitoba residents treated for substance abuse, Manitoba Health Annual Statistics 2010‐2011 35 PREVALENCE OF MENTAL ILLNESS AND USE OF SERVICES Hospitalization for Self-Inflicted Injury South Eastman Manitoba (53.1) 37.0 Central 25.7 Assiniboine 49.4 Brandon 62.5 Winnipeg 44.1 Interlake 44.1 North Eastman 69.2 (*) Parkland 169.0 Churchill (..) (*) NOR-MAN 169.9 (*) Burntwood 132.7 0.0 20.0 40.0 60.0 80.0 100.0 120.0 140.0 160.0 180.0 Figure 34: Age- and sex-adjusted rate of hospitalization due to self-inflicted injury per 100,000 residents age 10 and older by RHA, 2010/2011 Figure 34 shows the age‐ and sex‐adjusted rate of hospitalization for which a self‐inflicted injury was the cause, per 100,000 residents age 10 and older. In 2010/2011, there were 572 hospitalizations due to self‐inflicted injury among Manitoba residents, representing a rate of 53.1 hospitalizations per Manitoba Health Annual Statistics 2010‐2011 100,000 population. The age‐and sex‐adjusted hospitalization rates in Burntwood, NOR‐MAN and Parkland RHAs were significantly higher than Manitoba overall, with Parkland and NOR‐MAN residents having a self‐inflicted injury rate over three times that of the Manitoba rate. 36 PREVALENCE OF MENTAL ILLNESS AND USE OF SERVICES Suicide Manitoba (0.17) 0.10 (*) South Eastman 0.12 Central 0.15 Assiniboine 0.10 Brandon 0.16 Winnipeg 0.18 Interlake 0.34 (*) North Eastman 0.23 Parkland Churchill (..) 0.00 0.26 NOR-MAN 0.41 (*) Burntwood 0.00 0.05 0.10 0.15 0.20 0.25 0.30 0.35 0.40 0.45 Figure 35: Age- and sex-adjusted rate of death due to suicide per 1,000 residents age 10 and older by RHA, 2005/2006 to 2009/2010 Figure 35 shows the age‐ and sex‐adjusted rate of death for which suicide was the cause, per 1,000 Manitoba residents age 10 and older. From 2005/2006 to 2009/2010, there were 892 deaths due to suicide among Manitoba residents, representing a rate of 0.17 deaths per 1,000 population. The age‐ and sex‐adjusted death rates in Burntwood and North Eastman were significantly higher than Manitoba overall. Figure 36 shows the death rate for suicide by age and sex. From 2005/2006 to 2009/2010, the rate for males was higher than females for all age groups with the exception of ages 10 to 14. 0 .3 5 0 .3 0 0 .2 5 0 .2 0 0 .1 5 0 .1 0 0 .0 5 0 .0 0 1 0 -1 4 1 5 -1 9 2 0 -2 4 2 5 -4 4 4 5 -6 4 65+ F e m a le 0.09 0.19 0.11 0.11 0 .1 0 0 .0 4 M a le 0.04 0.26 0.31 0.26 0 .2 8 0 .2 3 Figure 36: Crude rate of suicide deaths per 1,000 residents by age and gender, 2005/2006 to 2009/2010 Manitoba Health Annual Statistics 2010‐2011 37 This page intentionally left blank. Manitoba Health Annual Statistics 2010‐2011 38 Health Services Insurance Plan Manitoba residents, who are Canadian citizens or have immigrant status, and who are either a permanent resident of Manitoba or reside in Manitoba for at least six months of the year, are eligible for Manitoba Health coverage. The Health Services Insurance Plan operates outside the Provincial Consolidated Fund and provides for payment of insured services for hospitals, personal care homes, and health care providers on behalf of Manitoba residents. Other plans include the prescription drugs program (Pharmacare), Ambulance, Air Ambulance, and Northern Patient Transportation programs. Manitoba Health Annual Statistics 2010‐2011 39 HEALTH SERVICES INSURANCE PLAN Insured Services per Capita $4,000 F a c ilit ie s & H e a lt h A u t h o rit ie s P ro v in c ia l P ro g ra m s To t a l $3,500 M e d ic a l P h a rm a c a re $3,000 $2,500 $2,000 $1,500 $1,000 $500 $0 2006/2007 2007/2008 2008/2009 2009/2010 2010/2011 Figure 37: Crude rate of the cost of insured services per capita by fiscal year Figure 37 represents the cost per capita of insured services in Manitoba. Pharmacare 5% Provincial Programs 3% Medical 21% Facilities & Health Authorities 71% In 2010/2011, approximately four billion dollars was spent on insured services in Manitoba, representing $3,677 per capita. Figure 38 shows the distribution of total costs. In 2010/2011, 71% of the total cost was attributed to facilities and regional health authorities followed by medical services for fee for service physicians (21%), Pharmacare programs (5%) and provincial programs (3%). Figure 38: Percentage of total cost, 2010/2011 Manitoba Health Annual Statistics 2010‐2011 40 Use of Medical Services The following section provides an overview of the use of medical services in Manitoba. This includes number of physicians and nurses, physician use, continuity of care and ambulatory care visit rates. In 2010 there were 17,118 nurses and 2,442 physicians registered in Manitoba. Seventy‐nine percent of Manitoba residents saw a physician at least once in 2010/2011. On average these Manitobans saw a physician about four times. Slightly over seventy percent (70.3%) of residents saw the same physician for more than 50% of their ambulatory visits. Manitoba Health Annual Statistics 2010‐2011 41 USE OF MEDICAL SERVICES Number of General Practitioners, Specialists, Nurses and Nurse Practitioners 1,400 1,184 1,129 1,200 1,089 1,258 1,232 1,150 1,196 1,105 1,167 1,129 2006 1,000 2007 800 2008 2009 600 2010 400 200 0 S p ec ialis ts G eneral P rac titio ners Figure 39: Number of General Practitioners and Specialists in Manitoba, 2006 - 2010 Figure 39 shows the number of general practitioners and specialists in Manitoba as reported by the College of Physicians and Surgeons of Manitoba by calendar year. For 2010, there were a total of 2,442 physicians in Manitoba. This consisted of nearly even numbers of family physicians and specialists. Figure 40 shows the number of registered nurses (RN), licensed practical nurses (LPN) and registered psychiatric nurses (RPN) as reported by the College of Registered Nurses of Manitoba. For 2010, there were 17,017 nurses registered with the College of Registered Nurses of Manitoba, of which 75% were registered nurses. The remaining 25% consisted of registered psychiatric nurses and licensed practical nurses. Figure 41 shows the number of nurse practitioners in Manitoba. The number of registered nurse practitioners increased from 32 in 2006 to 101 in 2010. 14,000 12,000 120 12,996 12,6 27 12,160 11,980 11,811 101 100 81 10,000 80 65 RNs 8,000 LP Ns 60 49 6,000 RPNs 4,000 2,8 60 2,8 89 2,93 0 2,95 3 40 32 3,041 20 2,000 978 963 971 963 980 0 0 2006 2007 2008 2009 2010 Figure 40: Number of RNs, LPNs and RPNs in Manitoba, 2006 - 2010 Manitoba Health Annual Statistics 2010‐2011 2006 2007 2008 2009 2010 Figure 41: Number of Nurse Practitioners in Manitoba, 2006 – 2010 42 USE OF MEDICAL SERVICES Physician Use Manitoba (79.0%) (*) South Eastman 74.6% Central 76.8% Assiniboine 77.3% (*) Brandon 83.9% Winnipeg 80.8% Interlake 79.8% North Eastman 79.5% Parkland 80.0% Churchill 86.2% (*) NOR-MAN 69.6% (*) Burntwood 0.0% 71.1% 10.0% 20.0% 30.0% 40.0% 50.0% 60.0% 70.0% 80.0% 90.0% 100.0% Figure 42: Age- and sex-adjusted percent of residents who used physician services by RHA, 2010/2011 Figure 42 shows the age‐ and sex‐adjusted percent of Manitobans who used physician services by RHA of residence. In 2010/2011, 79% of Manitoba residents saw a physician at least once during the year. Brandon had a significantly higher physician use rate when compared to the Manitoba rate. Manitoba Health Annual Statistics 2010‐2011 Residents of the north appeared to have lower rates. However, these values are affected by missing data for services provided by salaried physicians. These results should be interpreted with caution. 43 USE OF MEDICAL SERVICES Continuity of Care Manitoba (70.3%) South Eastman 71.6% (*) Central 61.7% (*) Assiniboine 65.4% (*) Brandon 62.4% Winnipeg 73.8% Interlake 70.3% North Eastman 69.8% Parkland 67.4% (*) Churchill 95.0% NOR-MAN 71.2% (*) Burntwood 47.2% 0.0% 10.0% 20.0% 30.0% 40.0% 50.0% 60.0% 70.0% 80.0% 90.0% 100.0% Figure 43: Age- and sex-adjusted percent of residents with more than 50% of ambulatory visits to the same physician by RHA, 2010/2011 a significantly lower continuity of care when compared to the Manitoba rate. Figure 44 shows the age‐ and sex‐ specific percent of residents with at least 50% of visits made to the same physician. Manitoba residents between the ages of 1 and 24 had a continuity of care that was lower than that of other ages. Figure 43 shows the age‐ and sex‐adjusted percent of Manitoba residents with more than 50% of ambulatory visits made to the same physician, by RHA of residence. In 2010/2011, 70.3% of residents had more than 50% of their visits to the same physician. Burntwood, Assiniboine, Brandon and Central had 90.0 80.0 70.0 60.0 50.0 40.0 30.0 20.0 10.0 0.0 01-04 05-09 10-14 15-19 20-24 25-29 30-34 35-39 40-44 45-49 50-54 55-59 60-64 65-69 70-74 75-79 80-84 85-89 90+ Male 79.8 <1 61.2 59.5 59.9 57.5 56.2 59.0 63.0 67.2 72.7 76.8 80.2 83.3 78.6 69.7 77.7 80.0 81.1 80.4 81.2 Female 81.1 61.6 56.8 56.0 54.5 54.7 60.0 65.5 70.0 73.9 77.4 79.5 81.7 78.0 69.7 76.7 80.5 82.2 83.0 84.6 Figure 44: Crude percent of residents with more than 50% of ambulatory visits to the same physician, by age and sex, 2010/2011 Manitoba Health Annual Statistics 2010‐2011 44 USE OF MEDICAL SERVICES Ambulatory Care Visits Manitoba (3.8) (*) South Eastman 3.0 (*) Central 3.2 Assiniboine 3.8 (*) Brandon 4.8 Winnipeg 3.9 Interlake 3.8 North Eastman 4.0 (*) Parkland 4.3 (*) Churchill 4.9 (*) NOR-MAN 3.0 Burntwood 3.6 0 1 2 3 4 5 6 Figure 45: Age- and sex-adjusted average number of ambulatory care visits by RHA, 2010/2011 Figure 45 shows the age‐ and sex‐adjusted average number of visits to a physician per Manitoba resident. Services provided to a patient while admitted to hospital and visits for prenatal care have been excluded. Inf ectious and Parasitic 3% Injury & Poisoning 5% In Manitoba overall, the most common reason for a physician visit was respiratory disease, representing 12% of all visits (Figure 46). Neoplasms Endocrine, Metabolic 1% Disease, Immun.Disorders 7% Factors Infl. & Contact Health Serv. 10% Blood, Blood-Forming Organs1% Symptoms,Signs,IllDefined Conditions 9% Conditions Orgin. in Perinatal Per. <1% In 2010/2011, there was an average of almost four visits to physicians per Manitoba resident. Brandon, Churchill and Parkland’s visit rates were significantly higher than the Manitoba visit rate. Mental Disorders 8% Nervous Sys. & Sense Organs 6% Musculoskel.Sys. & Conn.Tis. 9% Circulatory 10% Congenital Anomalies <1% Skin & Subcutaneous Tissue 5% Pregnancy, Childbirth, Puerperium <1% Genitourinary Digestive 4% 5% Respiratory 12% Figure 46: Percentage of visits by reason, 2010/2011 Manitoba Health Annual Statistics 2010‐2011 45 This page intentionally left blank. Manitoba Health Annual Statistics 2010‐2011 46 Use of Hospital Services The following section provides an overview of the use of hospital services, appropriateness of care and proportion of alternate level of care days in Manitoba. This includes use of hospitals, hospital separation rates, location of hospitalization by RHA, hospitalizations for ambulatory care sensitive conditions and alternate level of care days. In 2010/2011, there were 75 acute and chronic care facilities along with 2 long term psychiatric facilities. Eight percent of Manitoba residents were admitted as an inpatient to a hospital in 2010/2011. In total, there were 119,649 inpatient hospitalizations. Ambulatory care sensitive conditions (ACSC) is a measure of access to appropriate medical care. While not all admissions for these conditions are avoidable, significantly elevated rates often reflect problems obtaining access to primary care. In 2010/2011, the rate of hospitalization for ACSC was 8.1 per 1,000 residents. Alternate level of care (ALC) days are inpatient days in which a patient no longer requires the level of care their care setting provides, and where the patient is awaiting discharge to a more appropriate non‐acute care setting. In 2010/2011, 3.5% of all hospitalized cases had one or more ALC days associated with it. Manitoba Health Annual Statistics 2010‐2011 47 USE OF HOSPITAL SERVICES Map of Hospitals by Facility Size (c) Province of Manitoba, 2012 Updated January 2012 Bed counts include all acute, chronic care, rehab and psychiatric beds located in each facility. Cartography by: Health Information Management, Manitoba Health Churchill Tadoule Lake Lac Brochet Hudson Bay Brochet Reindeer Lake ve Ri Southern Indian Lake r Churc hill Lynn Lake r ve Ri Split Lake Ha ye s Stephens Lake Rive r South Indian Lake Gillam Shamattawa York Factory Lake Nelson House Nelso n Highrock Thompson God s River Knee Sipiwesk Lake Lake Oxford House Snow Lake Cross Lake Flin Flon God's River Gods Lake God's Lake Cross Lake Red Sucker Lake Wasagamack Norway House Garden Hill St. Therese Point The Pas Island Lake 50 25 km Cedar 0 50 100 150 200 Lake Lake Poplar River Legend Winnipeg Lake Berens River Pauingassi under 16 beds 61 - 125 beds 16 - 30 beds over 125 beds 31 - 60 beds Nursing Stations Winnipegosis Swan River Little Grand Rapids Bloodvein Winnipegosis Roblin Grandview Hodgson Ashern St Rose du Lac WINNIPEG ENLARGEMENT Dauphin Arborg Eriksdale Russell McCreary Rossburn Birtle Erickson Teulon Minnedosa Stonewall Rivers Virden Selkirk Neepawa Gladstone Hamiota Carberry Brandon Swan Deloraine Baldur Killarney Lake Pinawa Seven Oaks Health Sciences Centre Manitoba Adolescent Treatment Centre Grace Deer Lodge Misericordia Notre Dame Carman Morris Winkler Concordia St. Boniface Riverview Ste. Anne St. Claude Glenboro Boissevain Beausejour Portage la Prairie Treherne Souris Melita Powerview/ Pine Falls Gimli Shoal Lake Steinbach St. Pierre-Jolys Victoria Altona Vita Crystal City Emerson Manitoba Health Annual Statistics 2010‐2011 48 USE OF HOSPITAL SERVICES Use of Hospitals Manitoba (8.0%) South Eastman 8.1% Central 8.5% Assiniboine 9.5% Brandon 8.1% Winnipeg 6.6% Interlake 8.2% North Eastman 8.8% (*) Parkland 12.4% (*) Churchill 14.3% (*) NOR-MAN 11.5% (*) Burntwood 0.0% 17.0% 2.0% 4.0% 6.0% 8.0% 10.0% 12.0% 14.0% 16.0% 18.0% Figure 47: Age- and sex-adjusted percent of residents admitted to hospital by RHA, 2010/2011 Figure 47 shows the age‐ and sex‐adjusted percent of Manitobans who were admitted to hospital by RHA of residence. In 2010/2011, eight percent of Manitoba residents were admitted at least once to a hospital. Burntwood, NOR‐MAN, Churchill and Parkland RHAs had a significantly higher percentage of residents with one or more admissions than Manitoba overall, with the percentage in Burntwood being a little more than 2 times that observed for Manitoba overall. Manitoba Health Annual Statistics 2010‐2011 49 USE OF HOSPITAL SERVICES Hospital Separations Manitoba (97) South Eastman 99.7 Central 107.7 (*) Assiniboine 122.3 Brandon 90.9 (*) Winnipeg 72.1 Interlake 101.4 North Eastman 110.0 (*) Parkland 173.3 (*) Churchill 184.0 (*) NOR-MAN 169.4 (*) Burntwood 283.9 0.0 50.0 100.0 150.0 200.0 250.0 300.0 Figure 48: Age- and sex-adjusted rate of separation for inpatient hospitalization per 1,000 residents by RHA, 2010/2011 Figure 48 shows the age‐ and sex‐adjusted rate of separation for inpatient hospitalizations, per 1,000 residents. A separation is defined as anytime a patient leaves a facility because of a discharge, transfer or death. Manitoba Health Annual Statistics 2010‐2011 In 2010/2011, there were 119,649 inpatient separations among Manitoba residents, representing a rate of 97 per 1,000 Manitoba residents. Rates in Parkland, Churchill, NOR‐MAN, Assiniboine and Burntwood RHAs were significantly higher than Manitoba overall. 50 USE OF HOSPITAL SERVICES Location of Hospitalization by Region of Residence South Eastman Central Assiniboine Brandon Winnipeg Interlake North Eastman Parkland Churchill NOR-MAN Burntwood Manitoba 0% 10% RHA Hospital 20% 30% 40% Other RHA Hospital 50% 60% 70% Winnipeg Hospital 80% 90% 100% Out of Province Hospital Figure 49: Crude percent of hospitalization by location and RHA, 2010/2011 Figure 49 shows the crude proportion of where hospitalizations took place by region of patient’s residence. In 2010/2011, there were 119,649 inpatient separations among Manitoba residents. About 76% Manitoba Health Annual Statistics 2010‐2011 of Manitoba residents were hospitalized within the region that they lived in, 15% of residents living outside of Winnipeg were hospitalized in Winnipeg, 6.2% were hospitalized in a different region and 2.5% were hospitalized outside the province. 51 USE OF HOSPITAL SERVICES Hospitalization for Ambulatory Care Sensitive Conditions Manitoba (8.1) South Eastman 5.6 Central 7.2 Assiniboine 9.6 Brandon 5.6 (*) Winnipeg 5.0 Interlake 7.3 North Eastman 8.2 (*) Parkland 17.2 Churchill (!) 16.8 (*) NOR-MAN 19.3 (*) Burntwood 29.3 0.0 5.0 10.0 15.0 20.0 25.0 30.0 35.0 Figure 50: Age- and sex-adjusted rate of ambulatory care sensitive conditions per 1,000 residents by RHA, 2010/2011 Figure 50 shows the age‐ and sex‐adjusted rate of hospitalization for ambulatory care sensitive conditions (ACSC) by RHA of residence. ACSC are a set of conditions comprised of 17 diseases/diagnoses which have been identified as observably responsive to primary care. ACSC hospitalizations accordingly can function as an indirect measure of primary care access. Although significantly higher rates are presumed to reflect problems obtaining access to primary care, not all admissions for these conditions are avoidable. In 2010/2011, the rate of hospitalization for ACSC was 8.1 per 1,000 Manitoba residents. Burntwood, NOR‐MAN and Parkland had significantly higher hospitalization rates for these conditions, with the rate in Burntwood being close to 4 times that observed for Manitoba overall. Manitoba Health Annual Statistics 2010‐2011 52 USE OF HOSPITAL SERVICES Alternate Level of Care Manitoba 7 Churchill 6 Burntwood NorMan 40 15 3 132 4 48 7 Parkland 46 9 Assiniboine Central 6 Interlake 8 South Eastman 7 North Eastman 8 Brandon 8 7 Winnipeg 0 88 70 60 52 86 52 24 20 40 60 Acute 80 100 120 140 ALC Figure 51: Average length of stay for alternate level of care and acute patient stays by RHA of hospital, 2010/2011 Figure 51 shows the average lengths of stay for acute care hospitalizations, and for hospitalizations where a portion of the stay included alternate level of care (ALC). Inpatient days are identified as ALC when a patient no longer requires the level of care their care setting provides, and where the patient is awaiting discharge to a more appropriate non‐acute care setting, such as personal care home placement. With ALC days 3.5% Without ALC days 96.5% Figure 52: Crude percent of total hospitalized cases associated with and without alternate level of care days, 2010/2011 Figure 52 shows the crude proportion of total hospitalizations with and without associated ALC days. In 2010/2011, there were 4,863 hospitalizations in which a portion of the stay included ALC days, representing 3.5% of all hospitalized cases. The average length of stay for an ALC case was approximately 40 days, compared to 7 days for a non ALC (acute) case. Manitoba Health Annual Statistics 2010‐2011 53 This page intentionally left blank. Manitoba Health Annual Statistics 2010‐2011 54 High Profile Surgeries The following section provides an overview of high profile surgery rates for the Manitoba population, including rates for coronary artery bypass grafts (CABG), hip replacement surgeries, knee replacement surgeries, cataract surgeries and paediatric dental extractions. For the period of 2006/2007 to 2010/2011, there were 1.5 coronary artery bypass graft surgeries per 1,000 Manitoba residents age 40 and older. In 2010/2011, there were 2.3 hip replacement surgeries and 3.4 knee replacement surgeries per 1,000 Manitoba residents age 40 and older. In 2009/2010, there were 29.1 cataract surgeries per 1,000 Manitoba residents age 50 and older. There were 14.8 dental surgeries per 1,000 children under the age of six in 2010/2011. Manitoba Health Annual Statistics 2010‐2011 55 HIGH PROFILE SURGERIES Coronary Artery Bypass Graft Surgery Manitoba (1.50) 1.63 South Eastman Central 1.44 Assiniboine 1.41 Brandon 1.37 Winnipeg 1.45 Interlake 1.52 North Eastman 1.58 Parkland 1.74 Churchill (-) (*) NOR-MAN 2.08 (*) Burntwood 0.00 2.23 0.50 1.00 1.50 2.00 2.50 3.00 3.50 Figure 53: Age- and sex-adjusted coronary artery bypass graft surgery rate per 1,000 residents age 40 and older by RHA, 2006/2007 to 2010/2011 Figure 53 shows the age‐and sex‐ adjusted coronary artery bypass graft (CABG) surgery rate among Manitoba residents age 40 and older, by RHA of residence. For the period of 2006/2007 to 2010/2011, an average of 848 coronary artery bypass surgeries were performed on Manitoba residents per year, representing a rate of 1.50 surgeries per 1,000 for those age 40 and older. The age‐ and sex‐ adjusted rates in NOR‐MAN and Burntwood RHAs were significantly higher than Manitoba overall. Manitoba Health Annual Statistics 2010‐2011 56 HIGH PROFILE SURGERIES Hip Replacement Manitoba (2.3) South Eastman 2.1 Central 2.5 Assiniboine 2.4 Brandon 2.4 Winnipeg 2.2 Interlake 2.1 North Eastman 2.8 Parkland 2.5 Churchill (-) NOR-MAN (!) 1.8 Burntwood 3.0 0.0 0.5 1.0 1.5 2.0 2.5 3.0 3.5 Figure 54: Age-and sex-adjusted hip replacement surgery rate per 1,000 residents age 40 and older by RHA, 2010/2011 Figure 54 shows the age‐and sex‐ adjusted hip replacement surgery rate among Manitoba residents age 40 and older, by RHA of residence. In 2010/2011, there were 1,317 hip replacement surgeries performed on Manitoba residents, representing a rate of 2.3 per 1,000 for those age 40 and older. Figure 55 shows the hip replacement surgery rate in Manitoba over time. The hip replacement surgery rate in Manitoba increased from 1.5 in 2001/2002 to 2.3 in 2010/2011. 3.0 2.5 2.0 1.5 1.0 0.5 0.0 Manitoba 01/02 02/03 03/04 04/05 05/06 06/07 07/08 08/09 09/10 10/11 1.5 1.6 1.8 1.7 2.2 2.3 2.2 2.1 1.9 2.3 Figure 55: Age-and sex- adjusted hip replacement surgery rate per 1,000 residents age 40 and older by fiscal year Manitoba Health Annual Statistics 2010‐2011 57 HIGH PROFILE SURGERIES Knee Replacement Manitoba (3.4) 4.0 South Eastman (*) Central 4.2 Assiniboine 3.0 Brandon 3.2 Winnipeg 3.1 (*) Interlake 4.2 North Eastman 4.1 Parkland 3.0 Churchill (..) NOR-MAN 4.0 (*) Burntwood 6.3 0.0 1.0 2.0 3.0 4.0 5.0 6.0 7.0 Figure 56: Age-and sex-adjusted knee replacement surgery rate per 1,000 residents age 40 and older by RHA, 2010/2011 Figure 56 shows the age‐and sex‐ adjusted total knee replacement surgery rate among Manitoba residents age 40 and older, by RHA of residence. residents, representing a rate of 3.4 per 1,000 for those age 40 and older. The age‐ and sex‐ adjusted rates in Burntwood, Central and Interlake RHAs were significantly higher than Manitoba overall. In 2010/2011, there were 1,985 total knee replacement surgeries performed on Manitoba Figure 57 shows knee replacement surgery rate in Manitoba over time. The knee replacement surgery rate in Manitoba appeared to have increased from 2.3 in 2001/2002 to 3.4 in 2010/2011. 5.0 4.0 3.0 2.0 1.0 0.0 Manitoba 01/02 02/03 03/04 04/05 05/06 06/07 07/08 08/09 09/10 10/11 2.3 2.4 2.4 2.4 3.4 4.0 3.5 3.7 3.4 3.4 Figure 57: Age- and sex-adjusted knee replacement surgery rate per 1,000 residents age 40 and older by fiscal year Manitoba Health Annual Statistics 2010‐2011 58 HIGH PROFILE SURGERIES Paediatric Dental Extraction Manitoba (14.8) (*) South Eastman (!) 2.5 Central 12.4 (*) Assiniboine 7.2 (*) Brandon (!) 4.0 (*) Winnipeg 7.0 Interlake 10.8 (*) North Eastman 21.0 Parkland 12.2 Churchill (-) (*) NOR-MAN 56.2 (*) Burntwood 77.3 0.0 20.0 40.0 60.0 80.0 100.0 Figure 58: Age- and sex-adjusted rate of dental extraction for children under the age of six per 1,000 children under the age of six by RHA, 2010/2011 Figure 58 shows the age‐ and sex‐adjusted rate of dental extractions among Manitoba children under the age of six by RHA of residence. In 2010/2011, there were 1,388 hospitalizations for dental extractions among Manitoba children under the age of six, representing a rate of 14.8 hospitalizations per 1,000 children. The age‐ and sex‐adjusted hospitalization rates in Burntwood, NOR‐MAN and North Eastman RHAs were significantly higher than Manitoba overall, with Burntwood RHA having a hospitalization rate 5 times that of the rate in Manitoba. Manitoba Health Annual Statistics 2010‐2011 59 HIGH PROFILE SURGERIES Cataract Surgery Manitoba (29.1) South Eastman 26.8 Central 28.6 Assiniboine 29.0 Brandon 28.4 Winnipeg 28.7 Interlake 26.3 North Eastman 24.6 (*) Parkland 39.1 Churchill (-) NOR-MAN 31.4 Burntwood 31.1 0.0 5.0 10.0 15.0 20.0 25.0 30.0 35.0 40.0 45.0 Figure 59: Age-and sex-adjusted rate of cataract surgery per 1,000 residents age 50 and older by RHA, 2009/2010 Figure 59 shows the age‐and sex‐adjusted rate for cataract surgery among Manitoba residents age 50 and older by RHA of residence. rate of 29.1 residents per 1,000 for those age 50 and older. The age‐ and sex‐ adjusted rate in Parkland RHA was significantly higher than Manitoba overall. In 2009/2010, there were 10,979 cataract surgeries performed on Manitoba residents, representing a Manitoba Health Annual Statistics 2010‐2011 60 Women’s Reproductive Health The following section provides an overview of selected women’s reproductive health indicators, including hysterectomy rates, proportion of deliveries by caesarean section and proportion of vaginal births after caesarean sections. In 2010/2011, of every 1,000 Manitoba women between the ages of 20 to 84 approximately 4 had a hysterectomy. Provincially, 21.6% of total deliveries were caesarean deliveries among women between the ages of 15 to 54, and 31.7% of women having a previous caesarean section delivered vaginally. Manitoba Health Annual Statistics 2010‐2011 61 WOMEN’S REPRODUCTIVE HEALTH Hysterectomy Manitoba (3.8) South Eastman 3.9 Central 4.3 Assiniboine 4.8 Brandon 4.6 Winnipeg 3.6 Interlake 4.3 North Eastman 5.0 Parkland 2.2 Churchill (..) NOR-MAN 3.1 Burntwood 2.7 0 1 2 3 4 5 6 Figure 60: Age-adjusted hysterectomy rate per 1,000 female residents ages 20 to 84 by RHA, 2010/2011 Figure 60 shows the age‐adjusted hysterectomy rate among Manitoba female residents ages 20 to 84 by RHA of residence. hysterectomies per 1,000 female population ages 20 to 84. None of the age‐adjusted rates by RHA were significantly different than Manitoba overall. In 2010/2011, there were 1,791 females that had a hysterectomy, representing a rate of 3.8 70 to 79 8% 80 + 20 to 29 3% 1% 30 to 39 16% 60 to 69 12% In Manitoba overall, 41% of the hysterectomies were performed on females between the ages of 40 to 49 (Figure_61). 50 to 59 19% 40 to 49 41% Figure 61: Hysterectomies performed by age group, 2010/2011 Manitoba Health Annual Statistics 2010‐2011 62 WOMEN’S REPRODUCTIVE HEALTH Caesarean Section Manitoba (21.6%) South Eastman 17.8% Central 22.7% (*) Assiniboine 26.5% (*) Brandon 29.9% Winnipeg 21.5% Interlake 18.0% North Eastman 19.3% (*) Parkland 27.4% Churchill (..) NOR-MAN 22.4% (*) Burntwood 0.0% 16.0% 5.0% 10.0% 15.0% 20.0% 25.0% 30.0% 35.0% F i g u r e 6 2 : Age-adjusted percent of caesarean sections for females delivering ages 15 to 54 by RHA, 2010/2011 Figure 62 shows the age‐adjusted percentage of caesarean sections among total deliveries by Manitoba females ages 15 to 54, by RHA of residence. In 2010/2011, there were a total of 3,299 caesarean sections among Manitoba females ages 15 to 54, representing 21.6% of total deliveries for females in the same age group. Brandon, Assiniboine and Parkland RHAs had significantly higher age‐adjusted percentages of caesarean sections when compared to Manitoba overall. Manitoba Health Annual Statistics 2010‐2011 63 WOMEN’S REPRODUCTIVE HEALTH Vaginal Birth after Caesarean Section Manitoba (31.7%) 42.0% South Eastman Central 32.3% Assiniboine 21.2% (*) Brandon (!) 14.6% Winnipeg 33.7% Interlake 38.5% North Eastman 50.4% Parkland (-) Churchill (..) 0.0% NOR-MAN (-) 37.1% Burntwood 0.0% 10.0% 20.0% 30.0% 40.0% 50.0% 60.0% F i g u r e 6 3 : Age-adjusted percent of vaginal births after caesarean sections for females delivering ages 15 to 54 by RHA, 2010/2011 Figure 63 shows the age‐adjusted percent of vaginal births among Manitoba females ages 15 to 54, who previously had a caesarean section by RHA of residence. Manitoba Health Annual Statistics 2010‐2011 In 2010/2011, there were a total of 562 vaginal births after caesarean sections by Manitoba females ages 15 to 54, representing 31.7% of females who previously had a caesarean section and delivered in the same age group. 64 Use of Home Care Services The following section provides an overview of the home care program in Manitoba. The home care program has the responsibility for the development and implementation of a comprehensive range of in‐home services. The program also maintains and manages the assessment and waiting list for personal care home placement in each regional health authority. This section includes statistics on the average number of clients receiving co‐ ordinated care and the average number of clients receiving services and assessments for admission to the home care program. In 2010/2011, there were 17,202 Manitoba residents assessed for admission. During this time period, 15,481 were admitted, while 14,710 were discharged. Of those that were assessed, 89.9% were admitted for home care services; the remainder were either ineligible, or not admitted due to other reasons. In 2010/2011, an average of 23,691 clients received home care services each month. A majority of clients received services from a home care attendant in any given month, while about a third of clients received services from a registered nurse. Manitoba Health Annual Statistics 2010‐2011 65 USE OF HOME CARE SERVICES Average Monthly Number of Clients Receiving Coordinated Home Care Services by RHA South Eastman 1,109 Central 1,849 Assiniboine 1,582 Brandon 714 Winnipeg 14,337 Interlake 1,507 North Eastman 655 Parkland 1,223 Churchill 8 NOR-MAN 423 Burntwood 284 Manitoba 23,691 - 5,000 10,000 15,000 20,000 25,000 Figure 64: Average monthly number of clients receiving coordinated home care services by RHA, 2010/2011 Figure 64 shows the average monthly number of clients receiving coordinated home care services by RHA of residence. Manitoba Health Annual Statistics 2010‐2011 In 2010/2011, there was an average of 23,691 clients receiving home care services each month. 66 USE OF HOME CARE SERVICES Average Monthly Number of Clients Receiving Selected Services by Category 16,000 14,000 14,248 13,762 13,617 12,965 11,292 12,000 9,857 10,000 9,265 8,111 7,723 8,000 6,000 4,000 5,975 5,809 5,745 5,739 3,530 2,950 2,000 5,645 3,450 1,102 1,018 5,240 3,777 3,127 1,084 1,195 1,049 2006/2007 Home Support Service 2007/2008 Home Care Attendants 2008/2009 Registered Nursing 2009/2010 Licensed Practical Nursing 2010/2011 Therapy Figure 65: Average monthly number of clients receiving selected services by category,2006/2007 to 2010/2011 Figure 65 shows the average monthly number of persons receiving selected services by category. (Note that some clients may be receiving services in multiple categories.) Manitoba Health Annual Statistics 2010‐2011 In 2010/2011, a majority of home care clients were provided services by a home care attendant, while a substantial minority were provided services by a registered nurse. 67 USE OF HOME CARE SERVICES Number of Assessments for Admission, Admissions and Discharges 20,000 17,880 18,000 16,000 14,925 14,382 17,309 16,235 15,653 17,471 15,754 15,620 17,202 15,481 14,710 17,299 15,650 14,596 14,000 12,000 10,000 8,000 6,000 4,000 2,000 2006/2007 2007/2008 Assessed for Admission 2008/2009 Admissions to Home Care 2009/2010 2010/2011 Discharges From Home Care Figure 66: Number of assessments for admission, admissions and discharges, 2006/2007 to 2010/2011 Figure 66 shows the number of assessments for admission to the home care program, as well as admissions to and discharges from the home care program. period, 15,481 clients were admitted and 14,710 clients were discharged. Of those that were assessed, 89.9% were admitted for home care services; the remainder were either ineligible, or not admitted due to other reasons. In 2010/2011, there were 17,202 Manitoba residents assessed for admission. During this time Manitoba Health Annual Statistics 2010‐2011 68 Use of Personal Care Homes The following section provides an overview of personal care home (PCH) and respite care in Manitoba. This includes PCH admissions, median wait time for personal care home admission, and median length of stay. PCHs are residential facilities which are predominately intended for adults age 75 and older that may have a chronic condition, and for residents with a disability. In 2010/2011, there were 125 PCHs in Manitoba. In Manitoba, 3% of the population age 75 and older were admitted to a PCH from 2009/2010 to 2010/2011. The median wait time for placement into a PCH was approximately 10 weeks, and the median length of time a resident spent in PCH was approximately two years. Length of stay is associated with level of care on admission, as sicker patients stay in a PCH half the amount of time than healthier patients do. Manitoba Health Annual Statistics 2010‐2011 69 USE OF PERSONAL CARE HOMES Map of Personal Care Homes by Facility Size (c) Province of Manitoba, 2012 Updated January 2012 Bed counts include all personal care home beds located in each facility. Cartography by: Health Information Management, Manitoba Health Hudson Bay Reindeer Lake ve Ri Southern Indian Lake r r ve Ri Ha ye s Stephens Lake Split Lake Rive r Churc hill Lake Nelson Highrock Nelson House Thompson River Gods Knee Sipiwesk Lake Lake Cross Lake Flin Flon Gods Lake Norway House Island The Pas Lake 50 25 km Cedar 0 50 100 150 200 Lake Lake Poplar River Legend Winnipeg Lake under 16 beds 61 - 125 beds 16 - 30 beds over 125 beds Winnipegosis Swan River Benito 31 - 60 beds Winnipegosis Gilbert Plains Roblin Hodgson Ashern St Rose du Lac Dauphin Russell Arborg Grandview McCreary Eriksdale Sandy Lake Rossburn Teulon Shoal Lake Birtle Minnedosa Gladstone Stonewall Hamiota Elkhorn Neepawa Rivers Portage Wawanesa Souris Glenboro Hartney Boissevain Melita Deloraine Baldur Killarney Selkirk Beausejour Macgregor Carberry Brandon Virden Reston Powerview/ Pine Falls Gimli Erickson Treherne St. Claude Carman Notre Dame Manitou Pilot Mound * Oakbank Ste. Anne St. Adolphe Morris Winkler Altona Steinbach Grunthal St. Pierre Vita Lac du Bonnet Whitemouth WINNIPEG * 37 Personal Care Homes representing 5,486 licensed beds were in operation as of March 31, 2010 Morden Emerson Manitoba Health Annual Statistics 2010‐2011 70 USE OF PERSONAL CARE HOMES Personal Care Home Admissions Manitoba (3.0%) South Eastman 2.6% Central 3.1% Assiniboine 3.2% Brandon 3.5% Winnipeg 3.0% Interlake 3.0% (*) North Eastman 2.0% Parkland 3.6% Churchill (..) NOR-MAN 3.7% Burntwood 0.0% 3.2% 0.5% 1.0% 1.5% 2.0% 2.5% 3.0% 3.5% 4.0% 4.5% 5.0% Figure 67: Age- and sex-adjusted percent of residents age 75 and older admitted to a personal care home by RHA, 2009/2010 - 2010/2011 Figure 67 shows the age‐ and sex‐adjusted proportion of Manitoba residents age 75 and older admitted for the first time to a personal care home. On average, there were 2,550 Manitoba residents age 75 and older admitted to a personal care home Manitoba Health Annual Statistics 2010‐2011 each year for the period of 2009/2010 to 2010/2011. This represented 3% of the Manitoba population of the same age group. Regionally, the age‐and sex‐adjusted proportion was significantly lower for North Eastman residents age 75 and older. 71 USE OF PERSONAL CARE HOMES Median Wait Times for Personal Care Home Admission Manitoba (9.6) (*) South Eastman 18.7 (*) Central 15.2 (*) Assiniboine 17.0 (*) Brandon 6.6 (*) Winnipeg 5.9 (*) Interlake 21.1 (*) North Eastman 27.4 (*) Parkland 4.9 Churchill (..) 0.0 NOR-MAN 12.3 Burntwood 9.9 0.0 5.0 10.0 15.0 20.0 25.0 30.0 Figure 68: Median wait time (weeks) from assessment to admission of residents age 75 and older by RHA, 2009/2010 - 2010/2011 Figure 68 shows the amount of time it took for half of all Manitoba residents age 75 and older to be admitted after being assessed as requiring placement into a personal care home. There were a total of 5,100 Manitoba residents age 75 and older admitted to a personal care home in Manitoba Health Annual Statistics 2010‐2011 the 2009/2010 to 2010/2011 time period. The median wait time was about 10 weeks. Regionally, the wait time varied. North Eastman, South Eastman, Central, Assiniboine and Interlake had significantly higher wait times, while Brandon, Parkland and Winnipeg had significantly lower wait times when compared to Manitoba overall. 72 USE OF PERSONAL CARE HOMES Median Length of Stay (Years) at Personal Care Homes Level of Care All 1‐2 3 4 South Eastman 2.15 2.69 1.77 1.26 Central 2.23 3.13 2.17 1.47 Assiniboine 2.27 2.58 1.77 2.83 Brandon 2.69 2.87 2.01 2.67 Winnipeg 1.73 2.48 1.48 1.24 Interlake 2.22 3.79 1.71 1.29 North Eastman 2.73 4.76 2.06 3.61 Parkland 2.23 4.17 1.95 1.46 NOR‐MAN 2.21 2.13 2.23 1.53 Burntwood 2.38 1.31 (‐) (‐) Manitoba 1.94 2.66 1.69 1.41 Table 1: Median length of time (years) spent in a personal care home for residents age 75 and older by RHA, 2009/2010 - 2010/2011 Table 1 shows the length of time for which half of all Manitoba residents age 75 and older stayed in PCH following admission, by level of care at admission. On average, there were 2,988 Manitoba residents age 75 and older discharged from a personal care home each year for the period of 2009/2010 to 2010/2011. The overall median length of stay was Manitoba Health Annual Statistics 2010‐2011 1.94 years. Regionally, the length of stay varied from a high of 2.73 years in North Eastman to 1.73 years in Winnipeg. Across levels of care, residents admitted as a level 4 (sicker patients) had a length of stay of 1.41 years compared to those admitted as a level 1 or 2 (healthier patients) who had a length of stay of 2.66 years. 73 This page intentionally left blank. Manitoba Health Annual Statistics 2010‐2011 74 Preventative Services The following section provides an overview of preventative and screening services for selected programs available in Manitoba. Detailed information on immunizations have not been included in this report, as they are shown in Manitoba Health`s Annual Immunization report: http://www.gov.mb.ca/health/publichealth/surveillance/reports.html#influenza In Manitoba, breast screening mammograms are provided through the Manitoba Breast Screening Program to check women age 50 and older for early signs of breast cancer. For the period of 2009/2010 to 2010/2011, there were 89,766 Manitoba female residents ages 50 to 69 who had a mammogram, representing 62.7% of the female population in the same age group. Papanicolaou (Pap) tests are also provided to Manitoba females ages 18 to 69 for the early detection of cervical cancer. For the period of 2008/2009 to 2010/2011, there were 255,465 Manitoba females ages 18 to 69 who had a Pap test, representing 63% of the female population for the same age group. Manitoba Health Annual Statistics 2010‐2011 75 PREVENTATIVE SERVICES Breast Cancer Screening Manitoba (62.7%) 66.9% (*) South Eastman Central 61.2% (*) Assiniboine 67.2% (*) Brandon 66.0% Winnipeg 62.7% Interlake 62.5% (*) North Eastman 58.8% Parkland 64.3% Churchill 52.5% NOR-MAN 62.7% (*) Burntwood 0.0% 48.3% 10.0% 20.0% 30.0% 40.0% 50.0% 60.0% 70.0% 80.0% 90.0% 100.0% Figure 69: Age-adjusted percent of female residents ages 50 to 69 who received a mammogram by RHA, 2009/2010 to 2010/2011 Figure 69 shows the age‐ adjusted percent of Manitoba females ages 50 to 69 who received at least one mammogram in a two‐year period, by RHA of residence. For the period of 2009/2010 to 2010/2011, there were 89,766 Manitoba females ages 50 to 69 who had a mammogram, representing 62.7% of the female population for the same age group. The age‐ adjusted percentages in Brandon, South Eastman and Assiniboine RHAs were significantly higher, while the percentages for North Eastman and Burntwood were significantly lower than Manitoba overall. Manitoba Health Annual Statistics 2010‐2011 76 PREVENTATIVE SERVICES Cervical Cancer Screening Manitoba (63.1%) 66.8% South Eastman Central 59.9% Assiniboine 54.9% Brandon 72.6% Winnipeg 65.9% Interlake 64.1% North Eastman 63.5% Parkland 56.8% Churchill 54.6% (*) NOR-MAN 40.0% (*) Burntwood 0.0% 34.9% 10.0% 20.0% 30.0% 40.0% 50.0% 60.0% 70.0% 80.0% Figure 70: Age-adjusted percent of female residents ages 18 to 69 who received a Pap test by RHA, 2008/2009 to 2010/2011 Figure 70 shows the age‐adjusted percent of Manitoba females ages 18 to 69 who received at least one Papanicolauo (Pap) test in a three‐year period, by RHA of residence. For the period of 2008/2009 to 2010/2011, there were 255,465 Manitoba females ages 18 to 69 who Manitoba Health Annual Statistics 2010‐2011 had a Pap test, representing 63% of the female population in the same age group. The age‐ adjusted percentages in NOR‐MAN and Burntwood RHAs were significantly lower than Manitoba overall. 77 PREVENTATIVE SERVICES Immunizations 57.3% South Eastman 48.4% 56.7% 50.8% Central 61.6% Assiniboine 53.4% 69.0% 63.4% Brandon 65.8% 60.5% Winnipeg 61.5% Interlake 51.0% 60.2% 53.8% North Eastman 62.7% Parkland 51.7% 58.8% Churchill 48.5% 68.0% NOR-MAN 57.1% 53.7% Burntwood 34.3% 63.7% 57.1% Manitoba 0.0% 10.0% 20.0% 30.0% 40.0% Pneumococcal 65+ 50.0% 60.0% 70.0% 80.0% 90.0% 100.0% Inf luenza 65+ Figure 71: Percent of Manitoba residents age 65 and older immunized for influenza and pneumococcal, 2009 For 2009, 57.1% of Manitobans age 65 and older were immunized for influenza (flu) and 63.7% had a current pneumococcal immunization. For more information on immunization please follow the link below. http://www.gov.mb.ca/health/publichealth/surveillance/reports.html#influenza Manitoba Health Annual Statistics 2010‐2011 78 Prescription Drug Use The following section provides an overview of prescription drug use in Manitoba, and paid expenditures by drug benefit plan. In 2010/2011, 68.8% of Manitoba residents had at least one prescription dispensed. On average, these residents were prescribed 3 different types of drugs in the fiscal year. Manitoba paid $239 million in drug expenditures for eligible Manitobans through the Pharmacare program, $56 million through Family Services, $14.5 million through nursing home care and $3 million through dispensing for those in palliative care. Manitoba Health Annual Statistics 2010‐2011 79 PRESCRIPTION DRUG USE Pharmaceutical Use Manitoba (68.8%) (*) South Eastman 64.6% Central 65.5% Assiniboine 70.6% (*) Brandon 76.6% Winnipeg 69.1% Interlake 71.2% North Eastman 67.3% (*) Parkland 73.9% Churchill 71.5% NOR-MAN 68.6% (*) Burntwood 0.0% 63.7% 20.0% 40.0% 60.0% 80.0% 100.0% Figure 72: Age- and sex-adjusted percent of residents who had at least one prescription dispensed by RHA, 2010/2011 Figure 72 shows the age‐ and sex‐adjusted percent of Manitoba residents who had at least one prescription dispensed in a one year period, by RHA of residence. sex‐ adjusted percentage for Brandon and Parkland RHAs were significantly higher, while Burntwood and South Eastman RHAs percentages were significantly lower than Manitoba overall. In 2010/2011, about 69% of Manitoba residents had at least one prescription dispensed. The age‐ and Manitoba Health Annual Statistics 2010‐2011 80 PRESCRIPTION DRUG USE Drugs Dispensed per User Manitoba (3.2) (*) South Eastman 2.7 (*) Central 2.8 Assiniboine 3.3 (*) Brandon 3.9 Winnipeg 3.1 Interlake 3.4 North Eastman 3.3 (*) Parkland 4.2 (*) Churchill 3.9 (*) NOR-MAN 3.9 (*) Burntwood 4.0 0.0 1.0 2.0 3.0 4.0 5.0 6.0 7.0 8.0 9.0 10.0 Figure 73: Age- and sex-adjusted average number of drugs dispensed per resident by RHA, 2010/2011 Figure 73 shows the age‐ and sex‐adjusted average number of drugs dispensed per Manitoba resident, by RHA of residence. Manitoba Health Annual Statistics 2010‐2011 In 2010/2011, an average of 3.2 drugs was dispensed per Manitoba resident. The age‐ and sex‐ adjusted number varied significantly across the province, ranging from 2.7 drugs per South Eastman resident to 4.2 drugs per Parkland resident. 81 PRESCRIPTION DRUG USE Total Drug Expenditures by Plan and RHA Pharmacare $136,277,616 $10,037,729 $7,501,140 $12,170,607 $18,109,275 $19,602,297 $18,134,780 $13,460,010 $2,360,186 $1,272,855 $108,034 $239,034,531 Winnipeg Brandon N.Eastman South Eastman Interlake Central Assiniboine Parkland NOR-MAN Burntwood Churchill Manitoba Nursing Home $8,673,891 $1,447,229 $461,040 $667,684 $978,407 $192,635 $1,518,613 $753,895 $175,064 $1,652 $14,870,110 Family Services $41,642,112 $2,575,466 $578,350 $1,608,575 $2,128,250 $2,679,717 $1,434,516 $2,625,773 $560,568 $336,092 $16,033 $56,185,452 Palliative Care $1,499,241 $157,157 $107,745 $159,658 $272,420 $340,424 $492,275 $163,179 $917 $58,633 . $3,251,649 Table 2: Total paid drug expenditures by plan and RHA, 2010/2011 Table 2 shows the total paid expenditures by drug benefit plan and by RHA of residence. In 2010/2011, Manitoba paid $239 million in drug expenditures for eligible Manitoba residents through the Pharmacare program, $56.2 million through Family Services, $14.9 million for those in Nursing Homes and $3.3 million for those in Palliative Care. Figure 74 shows the total paid expenditures by drug benefit plan for Manitoba over time. The total expenditures by plan increased from 2006/2007 to 2010/2011, with Pharmacare representing the largest proportion of expenditures. $300,000,000 $250,000,000 $200,000,000 $150,000,000 $100,000,000 $50,000,000 $0 2006/2007 2007/2008 2008/2009 2009/2010 2010/2011 Pharmacare $212,332,831 $223,574,935 $223,574,935 $237,645,360 $239,034,531 Nursing Home $15,298,464 $14,841,278 $14,841,278 $15,428,213 $14,870,110 Family Services $48,667,470 $49,761,903 $49,761,903 $54,342,227 $56,185,452 Palliative Care $2,320,770 $2,745,874 $2,745,874 $3,010,905 $3,251,649 Figure 74: Total paid expenditures by fiscal year Manitoba Health Annual Statistics 2010‐2011 82 Glossary The Glossary provides explanations and definitions for the indicators and key terms used in this report. The method used to calculate each indicator is described in this section. Manitoba Health Annual Statistics 2010‐2011 83 GLOSSARY Acute Myocardial Infarction (Heart Attack) Rate Calculated as the number of hospitalizations or deaths due to acute myocardial infarction (AMI) in 2009/2010 in residents age 40 or older per 1,000 residents age 40 or older. The denominator was residents age 40 or older as of June 1, 2009. Rates were age‐ and sex‐adjusted to the Manitoba population age 40 or older. AMI is defined by ICD‐9‐CM code 410 or ICD‐10‐CA code I21 in the most responsible diagnosis field for hospitalization or as the cause of death in Vital Statistics death files. Persons discharged alive from hospital after less than three days were excluded as likely ‘rule‐out’ AMI cases. Adjusted Rate The adjustment of rates is a statistical process that makes groups such as those in particular geographic areas comparable by removing the effects of demographic differences such as age and gender distribution. Essentially, adjusted rates tell us what the rates would be if each geographic area had the same age and sex distribution. Therefore, adjusted rates are fictional rates which use statistical models to remove the effects of age and sex differences and to allow for comparisons across populations. Accordingly, while adjusted rates have been statistically modelled to be comparable to each other, they should be considered fictional in the sense that they do not measure anything directly. Please note that these adjusted rates cannot be compared to other rates which have not received the same adjustment. Alternate Level of Care (ALC) Inpatient hospital days are identified as ALC when a patient no longer requires the level of care their care setting provides, and where the patient is awaiting discharge to a more appropriate non‐acute care setting, such as personal care home placement. The average lengths of stay for acute care hospitalizations, and for hospitalizations where a portion of the stay included ALC were calculated for 2010/2011. Ambulatory Care Visit Rate The average number of visits to physicians per resident in 2010/2011. The denominator was all residents as of June 1, 2010. The number was age‐and sex‐adjusted to the Manitoba population. The term ‘ambulatory visits’ captures virtually all contacts with physicians, except during inpatient hospitalization. Ambulatory visits include regular office visits, walk‐in clinics, home visits, nursing home visits, visits to outpatient departments of hospitals, and emergency room visits (where data are recorded). Anxiety Prevalence Rate The proportion of residents age 10 or older diagnosed with anxiety from 2006/2007 to 2010/2011, by any of the following: Manitoba Health Annual Statistics 2010‐2011 84 GLOSSARY one or more hospitalizations with a diagnosis for anxiety states, phobic disorders or obsessive‐ compulsive disorders, ICD‐9‐CM codes 300.0, 300.2, 300.3; ICD‐10‐CA codes F40, F41.0, F41.1, F41.3, F41.8, F41.9, F42 three or more physician visits with a diagnosis for anxiety disorders, ICD‐9‐CM code 300. The proportion was age‐and sex‐adjusted to the Manitoba population age 10 or older. Birth Rate Calculated as the number of live births in 2009/2010 per 1,000 residents. The denominator was all residents as of June 1, 2009. The Vital Statistics birth records were used to count live births. Birth Weight The weight of the baby at birth. Birth weight was taken from the Vital Statistics birth records. Birth weight is usually classified as follows: Low – an infant who weighs less than 2,500 grams at birth Average – an infant who weighs between 2,500 and 4,000 grams at birth High – an infant who weighs greater than 4,000 grams at birth Breast Cancer Screening Rate The proportion of female residents ages 50 to 69 that had at least one mammogram in a two‐year period between 2009/2010 and 2010/2011. The denominator was all female residents ages 50 to 69 as of June 1, 2010. The proportion was age‐adjusted to the Manitoba female population ages 50 to 69. The indicator includes both screening and diagnostic mammograms, identified by the following tariffs in the physician claims: 7098 (Radiology, Intraluminal Dilatation, Mammography, Bilateral) 7099 (Radiology, Intraluminal Dilatation, Mammography, Unilateral) 7104 (Screening Mammography Bilateral) Cataract Surgery Rate The number of cataract replacement surgeries performed on residents age 50 or older, per 1,000 residents age 50 or older in 2009/2010. The denominator was residents age 50 or older as of June 1, 2009. The rate was age‐and sex‐adjusted to the Manitoba population age 50 or older. Cataract surgery was defined by a physician claim with tariff codes 5611, 5612 and tariff prefix 2 (surgery), or a hospital separation with ICD‐9‐CM procedure codes 13.11, 13.19, 13.2, 13.3, 13.41, 13.42, 13.43, 13.51, 13.59, or CCI code 1.CL.89. Additional cataract surgeries for Manitoba residents were added from medical reciprocal claims for out of province procedures, including Alberta (tariff code 27.72) and Saskatchewan (tariff codes 135S, 136S, 226S and 325S). The most recent medical reciprocal claims data available is for the 2009/2010 fiscal year; therefore 2009/2010 cataract surgery rates are provided. Manitoba Health Annual Statistics 2010‐2011 85 GLOSSARY Caesarean Section Rate The proportion of caesarean section procedures among female residents ages 15 to 54 delivering in 2010/2011. The denominator was total deliveries among female residents ages 15 to 54 in 2010/2011. The rate was age‐adjusted to the Manitoba female population ages 15 to 54 delivering in 2010/2011. Caesarean section procedures were defined by ICD‐9‐CM procedure codes 74.0, 74.1, 74.2, 74.9 or CCI code 5.MD.60 in any procedure field in hospital abstracts. Cervical Cancer Screening Rate The proportion of female residents ages 18 to 69 that received at least one Papanicolaou (Pap) test in a three‐ year period between 2008/2009 to 2010/2011. The denominator was all female residents ages 18 to 69 on June 1, 2009. The proportion was age‐adjusted to the Manitoba female population ages 18 to 69. The indicator is defined by a physician visit with a tariff code for a Pap test, including a visit for a physical or regional exam with a Pap test, or a visit for Pap testing only. The tariffs used were as follows: 8470 – Regional gynaecological exam, including cytological smear of the cervix, provided by a GP/FP 8495 – complete physical and gynaecological exam, including cytological smear of the cervix, provided by an OB/GYN specialist 8496 – regional gynaecological exam, including cytological smear of the cervix, provided by an OB/GYN specialist 8498 – complete physical and gynaecological exam, including cytological smear of the cervix, provided by a GP/FP 9795 – cytological smear of the cervix for cancer screening Child Mortality Rate The child mortality rate was calculated as the number of deaths among children ages 1 to 19 years from 2005/2006 to 2009/2010 per 100,000 children ages 1 to 19 years in the same time period. The rates were age‐ and sex‐adjusted to the overall Manitoba population ages 1 to 19 years old. The Vital Statistics death records were used to count deaths. Rates fluctuate in areas with small populations; therefore five years of data was used instead of a single year. Chronic Conditions Prevalence Rate The proportion of residents age 20 or older having one or more of the following conditions: arthritis, asthma/COPD, coronary heart disease, diabetes or stroke (see definitions below) in 2010/2011. The denominator was residents age 20 or older with active Manitoba registration on March 31, 2011. The proportion was age‐and sex‐adjusted to the Manitoba population age 20 or older. The chronic conditions were defined as follows: Arthritis: o at least one hospitalization or two physician visits over a five‐year period (2006/2007 to 2010/2011) with a diagnosis defined by ICD‐9‐CM codes 274, 446, 710‐721, 725‐729, 739 or ICD‐10‐CM codes M00‐M03, M05‐M07, M10‐M25, M30‐M36, M65‐M79 Manitoba Health Annual Statistics 2010‐2011 86 GLOSSARY Asthma/COPD: o at least one hospitalization or one physician visit over a five‐year period (2006/2007 to 2010/2011) with a diagnosis defined by ICD‐9‐CM code 493 or ICD‐10‐CM codes J43‐J46, or o at least one prescription for asthma receiving medication over a five‐year period (2006/2007 to 2010/2011) as defined by drug groups R03A (Adrenergics, inhalants), R03B (Other drugs for obstructive airway diseases, inhalants), R03C (Adrenergics for systemic use), R03D (other systemic drugs for obstructive airway diseases) Coronary Heart Disease: o at least one hospitalization or one physician visit over a five‐year period (2006/2007 to 2010/2011) with a diagnosis defined by ICD‐9‐CM codes 410‐414 or ICD‐10‐CM codes I20‐I22, I24‐I25 Diabetes: o at least one hospitalization or two physician visits over a three‐year period (2008/2009 to 2010/2011) with a diagnosis defined by ICD‐9‐CM code 250 or ICD‐10‐CM codes E10‐E14, or o at least one prescription for diabetes receiving medication over a three‐year period (2008/2009 to 2010/2011) as defined by all DINs associated with the following second level ATC code: A10 (drugs used in diabetes) Stroke: o at least one hospitalization or one physician visit over a five‐year period (2006/2007 to 2010/2011) with a diagnosis defined by ICD‐9‐CM codes 430‐438 or ICD‐10‐CM codes G41, I60‐ I69 Continuity of Care The proportion of residents receiving more than 50% of their ambulatory visits over a two‐year period (2009/2010 to 2010/2011) from the same physician. The denominator includes all residents with at least three ambulatory visits in the same two‐year time period. The proportion was age‐and sex‐adjusted to the Manitoba population. For children ages 0 to 14, visits included those to a GP/FP or Pediatrician; for those ages 15 to 59, only GP/FPs were used; for those age 60+, it could be a GP/FP or an Internal Medicine specialist. Coronary Artery Bypass Graft Surgery Rate The number of bypass surgeries performed on residents age 40 or older, per 1,000 residents age 40 or older in 2010/2011. The denominator was residents age 40 or older as of June 1, 2010. The rate was age‐and sex‐ adjusted to the Manitoba population age 40 or older. Bypass surgery was defined by ICD‐9‐CM procedure codes 36.10‐36.16, 36.19 or CCI code 1.IJ.76 in any procedure field in hospital abstracts. Cumulative Mental Illness Prevalence Rate The proportion of residents age 10 or older who received treatment for any of the following from 2006/2007 to 2010/2011: depression, anxiety, substance abuse, personality disorders, or schizophrenia. The proportion was age‐and sex‐adjusted to the Manitoba population age 10 or older. See corresponding glossary entries for definitions on specific mental illnesses. Manitoba Health Annual Statistics 2010‐2011 87 GLOSSARY Death Causes The distribution of causes of death in 2009/2010 based on Vital Statistics files, using the 21 chapters of the International Classification of Diseases (ICD‐10‐CA) system. Results are provided at the Manitoba level, but not by RHA due to the relatively small number of deaths by cause in smaller areas. Death Rate The death rate was calculated as the number of deaths in 2009/2010 per 1,000 residents. The denominator was all residents as of June 1, 2010. The rates were age‐ and sex‐ adjusted to the overall Manitoba population. The Vital Statistics death records were used to count deaths. Depression Prevalence Rate The proportion of residents age 10 or older diagnosed with depression from 2006/2007 to 2010/2011, by any of the following: one or more hospitalizations with a diagnosis for depressive disorder, affective psychoses, neurotic depression or adjustment reaction, ICD‐9‐CM codes 296.2‐296.8, 300.4, 309, 311; ICD‐10‐CA codes F31, F32, F33, F34.1, F38.0, F38.1, F41.2, F43.1, F43.2, F43.8, F53.0, F93.0 one or more physician visits with a diagnosis for depressive disorder, affective psychoses or adjustment reaction, ICD‐9‐CM codes 296, 309, 311 one or more hospitalizations with a diagnosis for anxiety disorders, ICD‐9‐CM code 300; ICD‐10‐CA codes F32.0, F34.1, F40, F41, F42, F44, F45.0, F45.1, F45.2, F48, F68.0, F99 and one or more prescriptions for an antidepressant or mood stabilizer, ATC codes N03AB02, N03AB52, N03AF01, N0FAN01, N06A one or more physician visits with a diagnosis for anxiety disorders, ICD‐9‐CM code 300, and one or more prescriptions for an antidepressant or mood stabilizer, ATC codes N03AB02, N03AB52, N03AF01, N0FAN01, N06A The proportion was age‐and sex‐adjusted to the Manitoba population age 10 or older. Diabetes Prevalence Rate The proportion of residents age 1 or older with at least one hospitalization or at least two physician visits with a diagnosis of diabetes within a two‐year period (2008/2009 to 2009/2010). A diabetes diagnosis is defined as ICD‐9‐CM codes 250 or ICD‐10‐CA codes E10‐E14. The denominator was residents age 1 or older as of June 1, 2009. The proportion was age‐ and sex‐ adjusted to the Manitoba population age 1 or older. Although the case definition uses a two‐year period to define cases, an annual number is derived by using the earliest date of hospitalization or the later of the two physician claims as the case date. The definition for diabetes was derived from the Canadian Chronic Disease Surveillance System (CCDSS). This definition has been validated and is the definition utilized by Manitoba Health. Manitoba Health Annual Statistics 2010‐2011 88 GLOSSARY Drug Program Expenditures by Plan and RHA The total paid expenditures by drug benefit plan and RHA of residence is shown for 2010/2011. Drug program expenditures are grouped in to the following categories: Pharmacare, Nursing Home, Family Services and Palliative Care. Expenditure data is taken from DPIN. Pharmacare is a drug benefit program for eligible Manitoba residents, regardless of disease or age, whose income is seriously affected by high prescription drug costs. Pharmacare coverage is based on both an individual’s total family income and the amount they pay for eligible prescription drugs. Each year the individual is required to pay a portion of the cost of the eligible prescription drugs. This amount is the annual Pharmacare deductible. The deductible is set based on the adjusted family income. Drugs Dispensed per User The average number of different types of drugs dispensed to each resident who at least one prescription in 2010/2011. The number was age‐and sex‐adjusted to the Manitoba population. A ‘different’ drug type was determined by fourth‐level class of the Anatomic, Therapeutic, Chemical (ATC) classification system. This level essentially separates drugs used for different health problems. A person could have several prescriptions for drugs in the same 4th level ATC class, but this would only count as one drug type in the year. Drugs Programs Information Network (DPIN) DPIN is an electronic, on‐line, point‐of‐sale prescription drug database. It links all community pharmacies (but not pharmacies in hospitals or personal care homes) and captures information about all Manitoba residents, including most prescriptions dispensed to Status Indians. DPIN contains information such as unique patient identification, age, date of birth, sex, medication history, over‐the‐counter medication history, patient postal code, new drug prescribed, date dispensed, and unique pharmacy identification number. DPIN is maintained by Manitoba Health. First Nations Residents Residents who have registered with Manitoba Health as a Status or Treaty Indian. Entitlements of land, voting rights, and Band membership are received by registered First Nations. A registered First Nation resident may be living in a First Nation community (on‐reserve) or in a non‐First Nation community (off‐reserve). Hip Replacement Rate The number of total hip replacements performed on residents age 40 or older, per 1,000 residents age 40 or older in 2010/2011. The denominator was all residents age 40 or older as of June 1, 2010. The rate was age‐ and sex‐adjusted to the Manitoba population age 40 or older. Hip replacements were defined by ICD‐9‐CM codes 81.50, 81.51, or 81.53 or CCI code 1.VA.53.LA‐PN or 1.VA.53.PN‐PN in any procedure field in hospital abstracts. This definition includes revisions on previously performed hip replacements and excludes partial hip replacements. Manitoba Health Annual Statistics 2010‐2011 89 GLOSSARY Home Care The Manitoba Home Care Program, established in its present form in 1974, is the oldest comprehensive, province‐wide, universal home care program in Canada. Home Care is provided to Manitoba residents of all ages based on assessed need and taking into account other resources available to the individual including families, community resources and other programs. Home Care services are provided free of charge. Reassessments at pre‐determined intervals are the basis for decisions by case managers to discharge individuals from the Program or to change the type or amount of services delivered by the Home Care Program. Home Care: Number of Assessments for Admission, Admissions and Discharges The overall number of assessments, admission and discharges to Manitoba residents from 2006/2007 to 2010/2011 is shown. Assessments are made by case managers and may or may not lead to an admission in to the Home Care Program. Home Care: Monthly Number of Clients Receiving Services by Category The average monthly number of Manitoba residents receiving coordinated Home Care services by category of service from 2006/2007 to 2010/2011 is shown. Home Care services are grouped in to the following services: Home Support Service, Home Care Attendants, Registered Nursing, Licensed Practical Nursing, and Therapy. Note that clients may be receiving services in multiple categories. Home Care: Monthly Number of Clients Receiving Services by RHA The average monthly number of Manitoba residents receiving coordinated Home Care services by RHA of residence in 2010/2011 is shown. Hospital Discharge Abstract Database Hospital abstracts are completed at the point of discharge for all separations from acute care facilities. Abstracts are completed for all inpatient stays as well as some day surgery stays. Since April 1, 2004, they include up to 25 diagnosis codes based on the International Classification of Diseases, 10th Revision, Canada (ICD‐10‐CA) and 20 procedure (intervention) codes based on the Canadian Classification of Health Interventions (CCI). Information on Manitoba residents who are admitted to out of province acute care facilities is captured through reciprocal Hospital Claims data, housed at Manitoba Health. Hospital Separation Rate The total number of inpatient hospital separations of residents, per 1,000 residents in 2010/2011. The denominator is all residents as of June 1, 2010. The rate was age‐and sex‐adjusted to the Manitoba population. A separation from a health care facility occurs anytime when a patient leaves because of discharge, transfer or death. In a fiscal year, a resident could be hospitalized more than once, so this indicator shows the total number of separations from acute care facilities. Manitoba Health Annual Statistics 2010‐2011 90 GLOSSARY Hospital Use Rate The proportion of residents who were admitted to an acute care hospital at least once in 2010/2011. The denominator was all residents as of June 1, 2010. The proportion was age‐and sex‐adjusted to the Manitoba population. All inpatient hospitalizations of residents were included regardless of the location of the hospital (both within and outside of Manitoba). Outpatient and day surgery services were excluded. Hospitalization Rate for Ambulatory Care Sensitive Conditions (ACSC) The rate at which residents ages 0 to 74 were hospitalized for ambulatory care sensitive conditions, per 1,000 residents ages 0 to 74 in 2010/2011. The denominator was all residents ages 0 to 74 as of June 1, 2010. The rate was age‐and sex‐adjusted to the Manitoba population ages 0 to 74. All Manitoba hospitals were included; PCHs and Long‐Term Care facilities were excluded (Deer Lodge and Riverview). Individuals who died in hospital were excluded from the numerator. ACSC are a set of conditions comprised of 17 diseases/diagnoses, which have been identified as observably responsive to primary care. ACSC hospitalizations accordingly can function as an indirect measure of primary care access. Although significantly higher rates are presumed to reflect problems obtaining access to primary care, not all admissions for these conditions are avoidable. ACSC include (with ICD‐10‐CA and CCI codes): Congenital syphilis: Z38 & A50 Immunization‐related & preventable conditions (primary diagnoses): A35, A37, A80, I00, I01 Hemophilus meningitis for age 1‐5 only: G00.0 Epilepsy: G40, G41 Convulsions: R56 Severe ENT infections: procedure code 1.DF.53.JATS and diagnosis code H66, J02, J03, J06, J312 Pulmonary tuberculosis: A15.0, A15.1, A15.2, A15.3, A15.7, A15.9, A16.0, A16.1, A62, A16.7, A16.9 Other tuberculosis: A15.4, A15.5, A15.6, A15.8, A16.3, A16.4, A16.5, A16.8, A17, A18, A19 COPD: J41, J42, J43, J44, J47. there is a new combo code of acute lower respiratory infection for patients with COPD (J44) and J10.0, J11.0, J12, J13, J14, J15, J16, J18, J21, J22 Acute bronchitis: secondary diagnosis of J41, J42, J43, J44, J47 where J20 is the primary diagnosis Bacterial pneumonia: primary diagnosis of J13, J14, J15.3, J15.4, J15.7, J15.9, J16, J18. Exclude cases with secondary diagnosis of sickle cell anemia: D57.0, D57.1, D57.2, and D57.8. exclude patients < 2 months old Asthma: primary diagnosis of J45 Congestive heart failure: i. exclude cases with certain cardiac interventions (all categories):1.HB.53, 1.HB.54, 1.HB.55, 1.HD.53, 1.HD.54, 1.HD.55, 1.HZ.53, 1.HZ.55, 1.HZ.85, 1.IJ.50, 1.IJ.57.GQ, 1.IJ.76 ii. Where the primary diagnosis is: I50, J81 Manitoba Health Annual Statistics 2010‐2011 91 GLOSSARY Hypertension: primary diagnosis of I10.0, I10.1, I11 and exclude cardiac surgery as stated above. Angina: exclude cases with any surgical intervention in CCI section 1, 2 or 5. And include primary diagnosis of I20, I23.82, I24.0, I24.8, I24.9 Cellulitis: incision of skin and subcutaneous tissue intervention. Exclude cases with any surgical intervention except incision of skin and subcutaneous tissue where it is the only listed intervention. Include primary diagnosis of :L03, L04, L08, L44.4, L88, L92.2, L98.0, L98.3 Diabetes: primary diagnosis of: E10.1, E10.6, E10.7, E10.9, E11.0, E11.1, E11.6, E11.7, E11.9, E13.0, E13.1, E13.6, E13.7, E13.9, E14.0, E14.1, E14.6, E14.7, E14.9 Hypoglycemia: primary diagnosis of E16.0, E16.1, E16.2 Gastroenteritis: K52.2, K52.8, K52.9 Kidney/urinary infection: N10, N11, N12, N13.6, N15.8, N15.9, N16.0‐N16.5, N28.83‐N28.85, N36.9, N39.0, N39.9 Dehydration/volume depletion: primary diagnosis of E86 Iron deficiency anemia: age <= 5 and primary diagnosis of: D50.1, D50.8, D50.9 Nutritional deficiencies: primary diagnosis of E40, E41, E42, E43, E55.0, E64.3 Failure to thrive: age < 1 and primary diagnosis of R62 Pelvic inflammatory disease: i. exclude cases with surgical procedure of hysterectomy: 1.RM.87, 1.RM.89, 1.RM.91, 5.CA.89.CK, 5.CA.89.DA, 5.CA.89.GB, 5.CA.89.WJ, 5.CA.89.WK ii. primary diagnosis of: N70, N73, N99.4 for females only Dental conditions: K02‐K06, K08, K09.8, K09.9, K12, K13 Hypertension Prevalence Rate The proportion of residents age 20 or older with at least one hospitalization or at least two physician visits with a diagnosis of hypertension within a two‐year period (2008/2009 to 2009/2010). A hypertension diagnosis is defined as ICD‐9‐CM codes 401‐405 or ICD‐10‐CA codes I10‐I13, I15. The denominator was residents age 20 or older as of June 1, 2010. The proportion was age‐ and sex‐adjusted to the Manitoba population age 20 or older. Although the case definition uses as two‐year period to define cases an annual number is derived by using the earliest date of hospitalization or the later of the two physician claims as the case date. The definition for hypertension was derived from the Canadian Chronic Disease Surveillance System (CCDSS). This definition has been validated and is the definition utilized by Manitoba Health. Hysterectomy Rate The number of hysterectomy surgeries performed on female residents ages 20 to 84, per 1,000 female residents ages 20 to 84 in 2010/2011. The denominator was female residents ages 20 to 84 as of June 1, 2010. The rate was age‐adjusted to the Manitoba female population ages 20 to 84. Hysterectomy surgery was defined by ICD‐9‐CM procedure codes 68.30 – 68.90 or CCI codes 1.RM.87BAGX, 1.RM.87.CAGX, 1.RM.87.DAGX, 1.RM.87.LAGX, 1.RM.89, 1.RM.91 in any procedure field in hospital abstracts. Manitoba Health Annual Statistics 2010‐2011 92 GLOSSARY Immunization for Influenza (Flu) Rate The proportion of residents age 65 or older who received a vaccine for influenza in 2009. The denominator was all residents age 65 or older as of June 1, 2009. Flu shots were defined by physician tariff codes 8791, 8792, 8793, or 8799 in Manitoba Immunization Monitoring System (MIMS) data. Immunization for Pneumonia Rate The proportion of residents age 65 or older who ever received a vaccine for pneumonia as of 2009. The denominator was all residents age 65 or older as of June 1, 2009. For most seniors, a pneumococcal vaccination is considered a ‘once in a lifetime’ event, so these rates show the cumulative percent of residents who ever had a pneumococcal vaccination, as defined by physician tariff codes 8681‐8694 and 8961 in MIMS data. Infant Mortality Rate The infant mortality rate was calculated as the number of deaths among infants under one year of age from 2005/2006 to 2009/2010 per 1,000 live births in the same time period. The Vital Statistics death records were used to count deaths. Rates fluctuate in areas with small populations; therefore five years of data was used instead of a single year. Injury Hospitalization Rate The number of hospital separations of residents for which any injury code was included as one of the diagnoses in hospital abstracts in 2010/2011 per 1,000 residents. The denominator was all residents as of June 1, 2010. Rates were age‐and sex‐adjusted to the Manitoba population. Hospitalizations were defined as any inpatient stay with an external cause of injury diagnosis code, ICD‐9‐CM codes E800‐E999; ICD‐10‐CA codes V01‐Y89. Excluded from the hospitalizations due to injury are those related to medical error or complications, as follows: misadventures during surgical or medical care, ICD‐9‐CM codes E870‐E876; ICD‐10‐CA codes Y60‐Y69, Y88.1 reactions or complications due to medical care, ICD‐9‐CM codes E878‐E879; ICD‐10‐CA codes Y70‐Y84, Y88.2, Y88.3 adverse effects due to drugs, ICD‐9‐CM codes E930‐E949; ICD‐10‐CA codes Y40‐Y59, Y88.0 All Manitoba hospitals were includes; PCHs and Long‐Term Care facilities were excluded (Riverview, Deer Lodge, Rehabilitation Centre for Children and Adolescent Treatment Centre). Newborn birth injuries or deaths, stillbirths and brain deaths were excluded. Injury Mortality Causes The distribution of causes of injury death in 2009/2010 based on Vital Statistics files, using the International Classification of Diseases (ICD‐10‐CA) system. Excluded are codes for misadventures, reactions, complications, or adverse effects of medical, surgical or pharmaceutical treatments (see list in Injury Mortality Rate). Results are provided at the Manitoba level, but not by RHA due to the relatively small number of deaths by cause in smaller areas. Manitoba Health Annual Statistics 2010‐2011 93 GLOSSARY Injury Mortality Rate The injury mortality rate was calculated as the number of deaths due to injury in 2009/2010 per 1,000 residents, based on Vital Statistics death codes. The denominator was all residents as of June 1, 2009. Rates were age‐and sex‐adjusted to the Manitoba population. Injury deaths were defined as records with ICD‐10‐CA cause of death codes of V01‐Y89. Excluded from the hospitalizations due to injury are those related to medical error or complications, as follows: misadventures during surgical or medical care, ICD‐9‐CM codes E870‐E876; ICD‐10‐CA codes Y60‐Y69, Y88.1 reactions or complications due to medical care, ICD‐9‐CM codes E878‐E879; ICD‐10‐CA codes Y70‐Y84, Y88.2, Y88.3 adverse effects due to drugs, ICD‐9‐CM codes E930‐E949; ICD‐10‐CA codes Y40‐Y59, Y88.0 Insured Services per Capita The total dollars spent on insured services in Manitoba in 2010/2011 per capita. The denominator is the number of residents as of June 1, 2010. The Health Services Insurance Plan operates outside the Provincial Consolidated Fund and provides for payment of insured services for hospitals, personal care homes, and health care providers on behalf of Manitoba residents. Other plans include the prescription drugs program (Pharmacare), Ambulance, Air Ambulance, and Northern Patients Transportation programs. Knee Replacement Rate The number of total knee replacements performed on residents age 40 or older, per 1,000 residents age 40 or older in 2010/2011. The denominator was all residents age 40 or older as of June 1, 2010. The rate was age‐ and sex‐adjusted to the Manitoba population age 40 or older. Knee replacements were defined by ICD‐9‐CM codes 81.54, 81.55, or CCI code 1.VG.53 in any procedure field in hospital abstracts. This definition includes revisions on previously performed knee replacements. Location of Hospitalization Of all hospitalizations of residents, this is the proportion of separations that occurred in a hospital within the RHA, in another RHA, in Winnipeg, or out of province in 2010/2011. If a patient was transferred between hospitals, each stay was counted as a separate event and was attributed to the appropriate location. Paediatric Dental Extraction Rate The number of dental extractions among resident children under the age of six, per 1,000 children under the age of six in 2010/2011. The denominator was resident children under the age of six as of June 1, 2010. The rate was sex‐adjusted to the Manitoba population under the age of six. Dental extractions were defined by ICD‐9‐CM codes 23.01, 23.09, 23.11, 23.19 or CCI codes 1.FE.57, 1.FE.89. Paediatric dental extractions performed outside of hospitals were not included (e.g., in dentists’ offices) and so the rates reported may underestimate the extent of severe early childhood tooth decay. Manitoba Health Annual Statistics 2010‐2011 94 GLOSSARY Personal Care Homes (PCH) Personal care homes, or nursing homes, are residential facilities for persons with chronic illness or disability who can no longer remain safely at home even with home care services. Residents of personal care homes are predominantly older adults. In Manitoba, personal care homes can be proprietary (for profit) or non‐ proprietary. Personal care home data is populated by assessment, admission and discharge forms. An assessment form for placement in to a personal care home is filled out by the resident while in an acute care facility or at home. The assessment application is reviewed to decide if the person is eligible for admission. There may be a waiting period between admission approval and actual admission. Personal Care Home, Admissions The percentage of residents age 75 and older admitted to a PCH in a year (values shown are the annual average for 2009/2010 to 2010/2011). Residence was assigned based on the location of the PCH. The denominator was all residents age 75 and older from 2009/2010 to 2010/2011. The proportion was age‐and‐sex adjusted to the Manitoba population age 75 and older. Personal Care Home, Median Length of Stay at Personal Care Homes The median length of stay (in years) of PCH residents, age 75 and older, according to their level of care on admission. The median length of stay is the amount of time which half of all residents stayed. Personal Care Home, Median Wait Time for Admission The amount of time it took for half of all residents, age 75 and older, to be admitted, after being assessed as requiring PCH placement. The median wait time is provided in weeks and is shown for the two‐year time period of 2009/2010 to 2010/2011. Personality Disorders Prevalence Rate The proportion of residents age 10 or older diagnosed with personality disorders from 2006/2007 to 2010/2011, by any of the following: one or more hospitalizations with a diagnosis for personality disorders, ICD‐9‐CM code 301; ICD‐10‐CA codes F34.0, F60, F61, F62, F68.1, F68.8, F69 one or more physician visits with a diagnosis for personality disorders, ICD‐9‐CM code 301. The proportion was age‐and sex‐adjusted to the Manitoba population age 10 or older. Pharmaceutical Use Rate The proportion of residents who had at least one prescription dispensed in 2010/2011. The denominator was all residents as of June 1, 2010. The proportion was age‐and‐sex adjusted to the Manitoba population. This includes all prescriptions dispensed from community‐based pharmacies across Manitoba. Prescription data is captured in Manitoba’s Drug Programs Information Network (DPIN) (see glossary entry above). Manitoba Health Annual Statistics 2010‐2011 95 GLOSSARY Physician Claims These are claims for payment submitted to the provincial government by physicians for services they provide. Fee for service physicians receive payment based on these claims, while those submitted by salaried physicians are only for administrative purposes (referred to as “shadow billing”). Physician Use Rate The proportion of residents who received at least one ambulatory visit in 2010/2011. The denominator was all residents as of June 1, 2010. The proportion was age‐and sex‐adjusted to the Manitoba population. The term ‘ambulatory visits’ captures virtually all contacts with physicians, except during inpatient hospitalization. Ambulatory visits include regular office visits, walk‐in clinics, home visits, nursing home visits, visits to outpatient departments of hospitals, and emergency room visits (where data are recorded). Population Population data shown in this report was based on records of residents registered with Manitoba Health on June 1, 2010. Registered individuals include persons who reside in the province of Manitoba, as well as new Manitobans arriving from another province (eligible for coverage after a waiting period of up to 3 months), new Manitobans from another country (eligible for coverage immediately if they have landed immigrant status), and foreign citizens holding a one‐year or more work permit. Manitoba residents not covered include armed forces, RCMP personnel and federal penitentiary inmates. Population Pyramid A graph showing the age and sex distribution of a population. The percentage of residents within each five‐ year age group is shown for both males and females. Most developing countries have a population pyramid triangular in shape, indicating a very young population with few people in the oldest age groups. Most developed countries have a population pyramid that looks more rectangular with the young and middle‐aged people representing similar and smaller percentages of the population, and more elderly people in the top part of the pyramid. Premature Mortality Rate Calculated as the number of deaths to residents under the age of 75 years in 2009/2010 per 1,000 residents under the age of 75 years. The denominator was residents under the age of 75 years as of June 1, 2009. The rates were age‐ and sex‐ adjusted to the overall Manitoba population. The Vital Statistics death records were used to count deaths Pregnancy Rate The pregnancy rate was calculated using data from hospital records by taking the ratio of all live and still births, abortions and ectopic pregnancies for females ages 15 to 49 in 2010/2011 to the female population ages 15 to 49. The denominator was female residents ages 15 to 49 as of June 1, 2010. Rates were age‐ and sex‐ adjusted to the Manitoba female population ages 15 to 49. Manitoba Health Annual Statistics 2010‐2011 96 GLOSSARY Pregnancy was defined as follows: A hospitalization for one of the following diagnoses: o Live birth: ICD10 ‐ Z37, ICD9 – V27 o Missed Abortion: ICD10 – O02.1, ICD9 ‐ 632 o Ectopic Pregnancy: ICD10 – O00, ICD9 – 633 o Abortion (spontaneous or medical): ICD10 – O03, O04, O05, O06, O07 ICD9 – 634, 635, 636, 637 o Intrauterine death: ICD10 – O36.4, ICD9‐ 656.4 ‐ OR – A Hospitalization with one of the following procedures: o Surgical Termination of Pregnancy: CCI – 5.CA.89, 5.CA.90, ICD9 ‐ 69.01, 69.51, 74.91 o Surgical Removal of extra‐uterine (ectopic) pregnancy: CCI – 5.CA.93, ICD9 – 66.62, 74.3 o Pharmacological Termination of Pregnancy: CCI – 5.CA.88, ICD9 ‐ 75.0 o Interventions during labour and delivery: CCI – 5.MD.50, 5.MD.60 Regional Health Authority (RHA) Manitoba's health care system is a broad network of services and programs. Overseeing this system is Manitoba Health, a department of the provincial government. For the most part, the actual services are delivered through local regional health authorities ‐ eleven regional agencies set up by the province to meet the local needs of Manitobans. As of July 1, 2002, the RHAs were Winnipeg, Brandon, North Eastman, South Eastman, Interlake, Central, Assiniboine, Parkland, NOR‐MAN, Burntwood and Churchill. The decision to regionalize the operation and administration of health in Manitoba was a major change in the way that health care is planned and delivered. In this model, the regional health authorities are responsible within the context of broad provincial policy direction, for assessing and prioritizing needs and health goals, and developing and managing an integrated approach to their own health care system. The Regional Health Authorities Act legislation came into force in 1997. It sets out the conditions under which the RHAs are incorporated, as well as defining duties and responsibilities of the RHAs and the Minister of Health. Both parties are responsible for policy, assessment of health status and ensuring effective health planning and delivery. Manitoba Health Annual Statistics 2010‐2011 97 GLOSSARY Indicators in this report, unless otherwise indicated, are presented by RHA of residence. In other words, indicators reflect where people live, not where they received services. Schizophrenia Prevalence Rate The proportion of residents age 10 or older diagnosed with schizophrenia from 2006/2007 to 2010/2011, by any of the following: one or more hospitalizations with a diagnosis for schizophrenia, ICD‐9‐CM code 295; ICD‐10‐CA codes F20, F21, F23.2, F25 one or more physician visits with a diagnosis for schizophrenia, ICD‐9‐CM code 295. The proportion was age‐and sex‐adjusted to the Manitoba population age 10 or older. Self‐Inflicted Injury Hospitalization Rate The number of hospital separations of residents age 10 or older for which any self‐inflicted injury code was included as one of the diagnoses in 2010/2011 per 1,000 residents age 10 or older. The denominator was residents age 10 or older as of June 1, 2010. Rates were age‐and sex‐adjusted to the Manitoba population age 10 or older. Hospitalizations were defined as any inpatient stay with a self‐inflicted external cause of injury diagnosis code, ICD‐9‐CM codes E950‐E959; ICD‐10‐CA codes X60‐X84. Stroke Rate Calculated as the number of hospitalizations or deaths due to stroke in 2009/2010 in residents age 40 or older per 1,000 residents age 40 or older. The denominator was residents age 40 or older as of June 1, 2009. Rates were age‐ and sex‐adjusted to the Manitoba population age 40 or older. Stroke is defined by ICD‐9‐CM codes 431, 434, 436 or ICD‐10‐CA codes I61, I63, I64 in the most responsible diagnosis field for hospitalization or as the cause of death in Vital Statistics death files. This definition will not capture minor strokes, which did not result in hospitalization or death. Substance Abuse Prevalence Rate The proportion of residents age 10 or older diagnosed with substance abuse from 2006/2007 to 2010/2011, by any of the following: one or more hospitalizations with a diagnosis for alcoholic or drug psychoses, alcohol or drug dependence or nondependent abuse of drugs, ICD‐9‐CM code 291, 292, 303, 304, 305; ICD‐10‐CA codes F10‐F19, F55 one or more physician visits with a diagnosis for alcoholic or drug psychoses, alcohol or drug dependence or nondependent abuse of drugs, ICD‐9‐CM code 291, 292, 303, 304, 305. The proportion was age‐and sex‐adjusted to the Manitoba population age 10 or older. Manitoba Health Annual Statistics 2010‐2011 98 GLOSSARY Suicide Rate The number of deaths due to suicide among residents age 10 or older from 2005/2006 to 2009/2010 per 1,000 residents. The denominator was residents age 10 or older per year from 2005/2006 to 2009/2010. Rates were age‐and sex‐adjusted to the Manitoba population age 10 or older. Suicides were defined as any death record in Vital Statistics data with any of the following causes: accidental poisoning, ICD‐9‐CM codes E850‐E854, E858, E862, E868; ICD‐10‐CA codes X40‐X42, X46, X47 poisoning with undetermined intent, ICD‐10‐CA codes Y10‐Y12, Y16, Y17 self‐inflicted poisoning, ICD‐9‐CM codes E950‐E952; ICD‐10‐CA codes X60‐X69 self‐inflicted injury by hanging, strangulation and suffocation, ICD‐9‐CM code E953; ICD‐10‐CA code X70 self‐inflicted injury by drowning, ICD‐9‐CM code E954; ICD‐10‐CA code X71 self‐inflicted injury by firearms and explosives, ICD‐9‐CM code E955; ICD‐10‐CA codes X72‐X75 self‐inflicted injury by smoke, fire, flames, steam, hot vapours and hot objects, ICD‐9‐CM codes E958.1, E958.2; ICD‐10‐CA codes X76, X77 self‐inflicted injury by cutting or piercing instruments, ICD‐9‐CM code E956; ICD‐10‐CA codes X78, X79 self‐inflicted injury by jumping from high places, ICD‐9‐CM code E957; ICD‐10‐CA code X80 self‐inflicted injury by jumping or lying before a moving object, ICD‐9‐CM code E958.0; ICD‐10‐CA code X81 self‐inflicted injury by crashing a motor vehicle, ICD‐9‐CM code E958.5; ICD‐10‐CA code X82 self‐inflicted injury by other and unspecified means, ICD‐9‐CM codes E958.3, E958.4, E958.6‐E958.9; ICD‐10‐CA codes X83, X84 late effects of self‐inflicted injury, ICD‐9‐CM code E959 Vaginal Birth of Caesarean Section Rate The proportion of female residents ages 15 to 54 giving birth vaginally who had previously had at least one delivery by caesarean section in 2010/2011. The denominator was female residents ages 15 to 54 delivering in 2010/2011 who had at least one previous caesarean section delivery. A woman is determined to have experienced a delivery after C‐section if each of the following criteria is met using hospital abstract data: 1. Presence of a uterine scar from previous surgery (ICD‐9‐CM diagnosis code of 654.2 or ICD‐10 code of O34.201 or O75.701) 2. Any single ICD‐9‐CM or ICD‐10 diagnoses code indicating a delivery ICD‐9‐CM V27.0, V27.2, V27.3, V27.5, or V27.6, in any position ICD‐10 ‐CA O1, O2, O4, O6, O7, O8, O9, O30‐O35, O37, O36.0, O36.1, O36.2, O36.3, O36.5, O36.6, O36.7, O36.8, O36.9 and with a sixth digit of ‘1' or ‘2'; Z37.0, Z37.2, Z37.3, Z37.5, or Z37.6, in any position Manitoba Health Annual Statistics 2010‐2011 99 GLOSSARY To obtain the numerator, all women with current caesarean section deliveries are removed from the denominator pool. Caesarean section deliveries are identified by ICD‐9‐CM procedure codes 74.0, 74.1, 74.2, 74.4, or 74.99 CCI procedure code 5.MD.60 in any position. The percent is age‐adjusted to the Manitoba female population ages 15 to 54. Vital Statistics Database Birth Database: The central Vital Statistics Registry in each province and territory provides data from birth registrations to Statistics Canada. The following data items are reported for each birth by all provinces and territories for inclusion in the Canadian Vital Statistics system: Date and place of birth Child’s sex, birth weight and gestational age Parent’s age, marital status and birthplace Mother’s place of residence Type of birth (single or multiple) Death Database: The central Vital Statistics Registry in each province and territory provides data from death certificates to Statistics Canada. The following data items are reported for each death by all provinces and territories for inclusion in the Canadian Vital Statistics system: Age, sex, marital status, place of residence and birth place of the deceased Date of death Underlying cause of death classified to the “World Health Organization International Classification of Disease and Related Health Problems” (ICD) Province or territory of occurrence of death Place of accident Autopsy information Manitoba Health Annual Statistics 2010‐2011 100


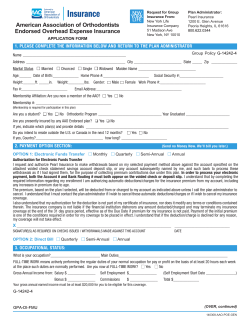

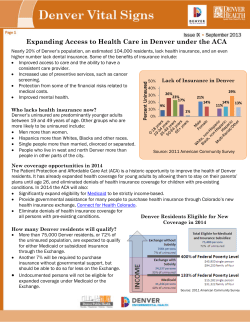


© Copyright 2026