
ANNUAL REPORT AND FINANCIAL STATEMENTS 2014
ROBUST RESILIENT STABLE ANNUAL REPORT AND FINANCIAL STATEMENTS 2014 Cherkizovo Group is the largest meat and feed producer in Russia. The Company is one of the top three producers in the poultry, pork, and sausage markets. The Company’s most well-known brands are Cherkizovo, Petelinka, Chicken Kingdom, and Mosselprom. The founding family of the Cherkizovo Group control a 65% stake in the Company, with 35% of its capital stock publicly traded on the London (LSE:CHE) and Moscow (MOEX:GCHE) stock exchanges. The Company has a vertically integrated structure, which includes grain growing, grain elevator storage, feed production, livestock breeding, growing and slaughtering, as well as meat processing and product distribution. Cherkizovo Group continues to demonstrate long-term and stable sales and profit growth. The Company’s consolidated revenue in 2014 reached 1.8 billion dollars and it produced more than 800 thousand tonnes of meat products. The Cherkizovo Group business strategy incorporates organic growth through the construction of new facilities, as well as asset consolidation. In the last decade alone, the Company has invested over 50 billion roubles in the development of the agro-industrial sector in Russia. THE COMPETITIVE ADVANTAGE OF A VERTICALLY INTEGRATED AND DIVERSIFIED BUSINESS MODEL LEARN MORE ABOUT 2014 RESULTS: PAGE 02 COMPANY BUSINESS MODEL: PAGE 10 STRATEGIC ACQUISITIONS: PAGE 18 FINANCIAL PERFORMANCE: PAGE 30 Visit our corporate website: www.cherkizovo.com GENERAL OVERVIEW 01-12 Key Indicators 02 Results Overview04 Market Overview06 Brands for Millions of Consumers 08 Vertical Integration and Diversification 10 STEPS TO LEADERSHIP POULTRY SALES VOLUME 416,622 TONNES PORK Cherkizovo Group is among the top three Russian pork producers. Almost all of the company’s pork complexes are built from scratch, using modern technology, while our production processes are developed by a team with international experience. SALES VOLUME 170,172 TONNES +22% +8% FOR MORE INFORMATION, SEE PAGE 22 GOVERNANCE 44-55 Corporate Governance46 Board of Directors 50 Executive Management Board52 Directors’ Report54 FOR MORE INFORMATION, SEE PAGE 24 FINANCIAL STATEMENTS FINANCIAL STATEMENTS 56-85 Financial Statements 58 Shareholders’ Information 85 UNDER THE QUALITY SEAL MEAT PROCESSING In 2014, Cherkizovo sausage trade mark rebranded, which allowed us to achieve growth even in a stagnant market. Investing in a new sales system and launching a line of ready-to-cook meat products also contributed to our success. SALES VOLUME 144,189 TONNES +7% FOR MORE INFORMATION, SEE PAGE 26 2014 ANNUAL REPORT GOVERNANCE The Company is the second largest poultry producer in Russia, with a portfolio of the most popular poultry brands. In 2014, Cherkizovo Group made a notable step towards market leadership, with the acquisition of Lisko-Broiler. RESULTS OF INVESTMENT Chairman’s Statement14 Chief Executive Officer’s Statement16 Acquisition of Lisko-Broiler 18 Cherkizovo Group’s Success Factors20 Report by Segment 22 Financial Review30 Employment Policies and Sustainable Development 42 BUSINESS REVIEW BUSINESS REVIEW 13-43 GENERAL OVERVIEW A robust, resilient, and stable business The Company’s strategy, which combines investment in organic growth and business consolidation, enabled it to set new historical records in sales, revenues, and profits in 2014. INCREASING EFFECTIVENESS GRAIN The Company only started developing its own crop production three years ago, but the results are already apparent. In 2014, the Group’s harvest increased by 39%, and grain sales by 70%, while grain self-sufficiency exceeded 20%. SALES VOLUME 237,106 TONNES +70% FOR MORE INFORMATION, SEE PAGE 28 1 KEY INDICATORS 1,795.6 CONSOLIDATED REVENUE USD MLN POULTRY 990.5 232.4 REVENUE EBITDA 437.9 216.1 REVENUE EBITDA 570.3 18.6 REVENUE EBITDA 40.7 12.7 REVENUE EBITDA USD MLN PORK USD MLN MEAT PROCESSING USD MLN GRAIN USD MLN 48% SHARE IN GROUP REVENUE* USD MLN 22% SHARE IN GROUP REVENUE* USD MLN 28% SHARE IN GROUP REVENUE* USD MLN 2% SHARE IN GROUP REVENUE* USD MLN ** not including inter-segment sales 2 2014 ANNUAL REPORT GENERAL OVERVIEW 24% 345.7 EBITDA USD MLN EBITDA MARGIN NET PROFIT USD MLN 48% SHARE IN GROUP EBITDA* 195.2 USD MLN SEGMENT PROFIT OF MARKET SHARE OF SALES VOLUME** -2.7 No.2 SEGMENT LOSS 10% 6 144,000 Т OF MARKET SHARE IN THE CENTRAL FEDERAL DISTRICT SEGMENT PROFIT WHEAT BARLEY SUNFLOWER CORN COMPLEXES OF SALES VOLUME** FINANCIAL STATEMENTS 5.7 USD MLN 2014 ANNUAL REPORT 417,000 Т SEGMENT PROFIT IN RUSSIA OF MARKET SHARE ** not including Group expenses PRODUCTION CLUSTERS 15 170,000 Т USD MLN 3% SHARE IN GROUP EBITDA* 8 No.3 6% 177.6 USD MLN 4% SHARE IN GROUP EBITDA* IN RUSSIA GOVERNANCE 45% SHARE IN GROUP EBITDA* No.2 11% BUSINESS REVIEW 438.7 PLANTS OF SALES VOLUME** 140,000 237,000 Т HA OF LAND BANK OF SALES VOLUME** ** rounded figures 3 RESULTS OVERVIEW LARGEST MEAT AND FINISHED FEED PRODUCER Cherkizovo Group is the largest meat and feed producer in Russia. In 2014, the Company produced over 800 thousand tonnes of meat products and about 1.4 million tonnes of finished feed. The consolidated revenue was USD 1.8 billion (RUB 68.7 billion). EVERY LINK IN THE AGRICULTURAL CHAIN Cherkizovo Group unites agricultural land, feed mills, poultry farms and pork complexes, meat processing plants and trading companies. DISTRIBUTION MEAT PROCESSING POULTRY AND PORK FEED PRODUCTION POULTRY CLUSTERS 8 PORK COMPLEXES MEAT PROCESSING COMPLEXES 6 PRODUCTS IN 2014 (THOUSAND TONNES) LAND CLUSTERS FEED MILLS 3 4 15 808 6 GRAIN LAND BANK In 2014, Cherkizovo Group increased its production output and sales in all segments, with impressive results. The total sales volume exceeded 800 thousand tonnes of meat products. About 1.4 million tonnes of feed was produced for animal and poultry. Thanks to the acquisition of Lisko-Broiler, Cherkizovo Group notably increased its poultry market sales, and the Company’s revenues totalled nearly USD 1.8 billion. The RUB revenue has increased by 30%, from RUB 52.8 billion to RUB 68.7 billion. Cherkizovo is one of the top three companies in the poultry and pork markets and one of the leaders in the meat processing market. 2014 ANNUAL REPORT GENERAL OVERVIEW STRATEGIC LOCATION OF ASSETS BUSINESS REVIEW Cherkizovo Group’s production facilities are located in the most densely populated area of the Russian Federation. The “production belt” is located in the Central Federal District, about 350-400 km from the Moscow agglomeration – the largest market in the country with the highest purchasing power. Revenue shares by segment GOVERNANCE 2% 28% 48% 22% FINANCIAL STATEMENTS POULTRY PORK MEAT PROCESSING GRAIN 8 full-cycle poultry clusters, with a production capacity of 550,000 tonnes live weight 15 modern pork complexes, with a total production capacity of 200,000 tonnes 6 meat processing complexes, with a total production capacity of 190,000 tonnes Operating land bank of 60,000 ha and grain elevators, with a total storage capacity of 700 thousand tonnes Sales volume, thousand tonnes Sales volume, thousand tonnes Sales volume, thousand tonnes Sales volume, thousand tonnes 417 170 144 237 FOR MORE INFORMATION, SEE PAGE 22 2014 ANNUAL REPORT FOR MORE INFORMATION, SEE PAGE 24 FOR MORE INFORMATION, SEE PAGE 26 FOR MORE INFORMATION, SEE PAGE 28 5 MARKET OVERVIEW IMPORT SHARE IN MEAT CONSUMPTION IN RUSSIA (%) 37% 33% 36% 36% 27% 27% 22% 15% Beef 6% 2000 2002 2004 2006 2008 2010 2012 2014 2015F Pork Poultry The import share in the market has decreased due to a combination of measures taken to protect the Russian market and support local producers. In 2014, import bans on meat, special economic measures, and rouble devaluation were among additional reasons for an abrupt decline in imports. In 2015, imports are expected to decrease considerably compared to 2014. CHANGING STRUCTURE OF MEAT MARKET IN RUSSIA (VOLUME, %) 100% 80% 60% 40% Beef 20% Pork Meat consumption patterns in Russia are changing. The beef share is decreasing and the consumption of poultry – the most affordable source of animal protein – is rising. Poultry is also becoming a beef substitute in sausage production. Poultry 0% 2000 2005 2010 2015F ANNUAL MEAT CONSUMPTION PER CAPITA IN 2014 (KG) 83* 76 83 93 109 71 Biological standards (75 kg) USSR (1988) Russia EU Canada Australia USA In recent years, meat consumption in Russia has been growing steadily, to the point where it has reached European level (more than 70 kg per capita). However, it remains lower than in the former USSR. Households may begin to cut their expenses due to the economic crisis, and this may result in stagnating or decreasing meat consumption. * 2020 forecast. VOLUME OF MEAT MARKET IN RUSSIA (MLN TONNES) 9.5 9.6 2010 2011 10.1 10.6 10.3 2012 2013 2014 In 2014, due to the decrease in imports, the meat market reduced slightly in volume and totalled between 10 and 11 million tonnes. According to the forecasts, 2015 is likely to witness further market contraction due to a lower spending during the crisis. However, the decrease in consumption will be largely offset by import reductions. Source: Company’s management with reference to the data provided by the Federal State Statistics Service and the Federal Customs Service. * Volume of poulty, pork, and beef markets combined. 6 2014 ANNUAL REPORT GENERAL OVERVIEW STATE SUPPORT FOR AGRICULTURAL ENTERPRISES Under the Russian Tax Code, agricultural producers’ activity qualifies as tax-free profit. For Cherkizovo Group, this applies to its poultry, pork, and grain segments. Agricultural producers may be reimbursed for their interest payments on investment loans for production development, as well as on working capital. This legal provision means that Cherkizovo Group has a low cost of debt maintenancе. IMPORT QUOTAS REGIONAL DEVELOPMENT PROGRAMMES Meat import quotas have been introduced in Russia for the protection of local producers. The annual quota amounts to 360,000 tonnes of poultry and 430,000 tonnes of pork. Imports in excess of the quota are subject to high import duties. Pursuant to signed treaties, this standard has continued since Russia’s accession to the World Trade Organization (WTO) in 2012, with no fixed term for poultry and a quota expiration date of 2020 for pork imports. GOVERNANCE INTEREST RATE SUBSIDY BUSINESS REVIEW PREFERENTIAL TAXATION In a number of Russian regions, local programmes apply to support investors in large agro-industrial projects. Under these programmes, investors may be provided with direct subsidies and preferential loans. Local administrations may also assume an obligation to provide new agricultural enterprises with the required infrastructure. ROUBLE DEVALUATION EFFECT FINANCIAL STATEMENTS The sharp devaluation of the rouble at the end of 2014 resulted in a substantial increase in the price of imported products. Imported meat products are therefore no longer affordable, which creates an additional competitive advantage for domestic producers. As of 1 January 2014, the exchange rate was as follows: 32.7 roubles for 1 US dollar and 45.0 roubles for 1 euro. By 31 December 2014, it had increased to 56.3 and 68.3 respectively. US DOLLAR/ROUBLE AND EURO/ROUBLE EXCHANGE RATES IN 2014 80 68.3 70 56.3 60 50 40 45.0 Euro 32.7 30 January March 2014 ANNUAL REPORT May July September November December US Dollar 7 BRANDS FOR MILLIONS OF CONSUMERS Cherkizovo has been one of the country’s most popular brands for 40 years. Its range includes nearly 250 types of sausage products, as well as chilled and frozen meat, ready-tocook products, ham and meat delicacies. Under the Taste Empire trademark, the Company produces a range of four types of ham, using the best cuts of meat and original recipes. The Penzensky Meat and Poultry range includes nearly 200 types of sausage products: cooked sausages, frankfurters, sausage links, wieners, part-smoked and cooked smoked sausages, smoked meat products and ham. 1 EFFECTIVE LOCATION OF PRODUCTION FACILITIES BRANDS THAT CONSUMERS LOVE 11 13 9 3 4 5 8 7 6 2 10 12 16 14 15 17 Petelinka is the best-known line of chilled chicken in Russia. The range includes more than 40 products. In 2014, Petelinka was named as one of the year’s best brands by the National Trade Association. 8 Under the Home Chicken brand, the Company produces organic chilled poultry products, including both whole carcasses and parts. The brand is sold at the largest retail chains in Moscow and the Central Federal District. Chicken Kingdom is one of the nation’s favourite ranges of chilled and frozen poultry. Birds are raised in a healthy environment in the Bryansk and Lipetsk regions. 2014 ANNUAL REPORT Meat Guberniya offers high-quality sausage products at an affordable price. The range includes cooked, semi-smoked sausages and frankfurters. The bright and colourful package is a distinctive feature of this trademark. PORK COMPLEX POULTRY COMPLEX CROPLANDS Located in the Penza region, Vasilievskaya Poultry Farm is one of the oldest poultry farms in the Volga region. Vasilievsky Broiler is the market leader in the chilled poultry segment of the Volga Federal District and Central Federal District. 2014 ANNUAL REPORT 1 Kaliningrad 2 Rostov-on-Don 3 Bryansk region 4 Kursk region 5 Orel region 6 Voronezh region 7 Lipetsk region 8 Tula region 9 Moscow region 10 Tambov region 11 St. Petersburg 12 Penza region 13 Vologda region 14 Ulyanovsk region 15 Samara 16 Kazan 17 Chelyabinsk Mosselprom is one of the most famous brands in Moscow and the Moscow region. Poultry farms in the Moscow, Kursk, and Tula regions produce chilled and frozen poultry and ready-to-cook products. PRODUCTS FINANCIAL STATEMENTS FEED MILL LOCATION GOVERNANCE MEAT PROCESSING PLANT No. BUSINESS REVIEW DISTRIBUTION CENTRE A strong distribution system is one of Cherkizovo Group’s most significant competitive advantages. The Company has its own fleet of refrigerated trucks (more than 1,000), which allows us to deliver fresh refrigerated meat to our retail partners and distributors quickly and efficiently. Our distribution network reaches more than 110 million people – representing 80% of the country’s population. GENERAL OVERVIEW Ulyanovsky is one of the oldest meat processing plants in the Volga region, with an almost 50-year history. Under the Ulyanovsky trademark, the Company produces high-quality sausage products that have won many awards in various exhibitions. Cherkizovo Group is a reliable partner and supplier to the largest retail chains in Russia. Retail chains choose Cherkizovo because of its quality, reliability, fast delivery and willingness to respect the interests of partners and constantly improve services. 9 VERTICAL INTEGRATION AND DIVERSIFICATION Cherkizovo Group is a vertically integrated and well-diversified company. Because of this, the Company continues its high-rate growth each year and remains confident under any market conditions. Over the past ten years, Cherkizovo Group has invested over 50 billion roubles in the development of the Russian agroindustrial sector, having built modern pork complexes, poultry farms and feed mills from scratch. The Company has also purchased and modernised a number of assets, thereby increasing its market share. One the key competitive advantages for Cherkizovo Group is its ability to manage the entire production and supply chain. The Company controls every production stage: finished feed formulation and production, chicken egg incubation and broiler raising, raising pigs, slaughtering and processing. We are therefore able to decrease our expenses, achieve production and logistical synergy, maintain our margins at all in-house stages and create highquality products. In order to increase vertical integration, Cherkizovo Group supplemented its meat production with its own crop raising. Grain is one of the most important elements of Company development because Cherkizovo Group uses over one million tonnes of grain for feed production each year. The grain segment has been developing rapidly: over the three years of its existence, the Company’s own grain harvests have doubled. 242,000 tonnes of grain harvest 1.4 MILLION tonnes of finished feed 60,000 ha sown in 2014 10 2014 ANNUAL REPORT POULTRY MEAT PROCESSING Production of over half a million tonnes of broiler meat and the most well-known brands of chilled poultry Strong Cherkizovo brand and chilled meat from Company farms BUSINESS REVIEW PORK In 2014, about 40% of pork was supplied to the Company meat processing plants OVERVIEWOVERVIEW GENERAL DISTRIBUTION 22 warehouse complexes and 1,000 refrigerator trucks for prompt delivery to partners A diversified business model enables Cherkizovo Group to be confident in any market situation. The profitability of the meat processing segment is inversely related to the profitability of the poultry and pork segments. When meat prices grow, the processing segment is under pressure, but the profitability of poultry and pork increases. In contrast, when meat prices fall, the profitability of poultry and pork decreases, but the profits of meat processing rise. Cherkizovo Group income from animal farming is well diversified: about half of the Company’s revenues and profits are derived from poultry, which is less volatile than pork. The Company consistently increases its share of branded products in poultry, ensuring even higher stability for this business segment. FEED PRODUCTION Cherkizovo produces the entire volume of finished feed required by the Company GOVERNANCE GRAIN The Company increases its vertical integration by raising grain crops. In 2014, the crop yield increased by 39%, amounting to 242,000 tonnes LAND BANK The Company’s land bank includes over 140,000 ha In 2014, 60,000 ha was cultivated in the Black Earth region tonnes of pork supplied to the Company’s meat processing plants FINANCIAL STATEMENTS 67,000 80% of the population of the Russian Federation is covered by our distribution 8 Full-cycle poultry clusters 2014 ANNUAL REPORT 15 Pork complexes 11 12 2014 ANNUAL REPORT GENERAL OVERVIEW BUSINESS REVIEW Chairman’s Statement14 Chief Executive Officer’s Statement16 Acquisition of Lisko-Broiler 18 Cherkizovo Group’s Success Factors 20 – Poultry 22 – Pork24 – Meat Processing 26 – Grain 28 Financial Overview 30 Employment Policies and Sustainable Development42 BUSINESS REVIEW ROBUST GOVERNANCE GROWTH DUE TO A VERTICALLY INTEGRATED AND BALANCED BUSINESS MODEL Poultry Sales growth FINANCIAL STATEMENTS 22% Pork Revenue growth 29% 2014 ANNUAL REPORT 13 CHAIRMAN’S STATEMENT In 2014, we achieved well-deserved results thanks to our multi-year development – part of our strategy to invest in the expansion of our own production capacity and increase market share through the acquisition of high-quality assets. Thus, we were able to build a powerful, diversified agro-company embracing all the links of the agricultural chain – agricultural land, feed mills, poultry farms and pork complexes, meat processing plants, and trading companies. We have built a successful and sustainable company, which continues to grow even under the conditions of the most difficult financial crises. For me, Cherkizovo Group is more than just a business. I see our Company’s mission as providing Russian citizens with high-quality products at affordable prices. The past year has clearly demonstrated how important this is. As a result of the worsening of the epizootic situation in European countries, the importation of meat from the EU was banned in March. In August, as a response to the sanctions against the Russian Federation, one-year special economic measures were taken, prohibiting the importation of food products from the U.S., Canada, and EU countries. This convinced even the most hopeless skeptics that Russia can and must achieve full self-sufficiency in food products and that import substitution in the agricultural market must become a key focus and essential task for both the Government and producers. 14 2014 ANNUAL REPORT GENERAL OVERVIEW The acquisition of Lisko-Broiler enabled us to sharply increase our sales and rate of return in poultry. The meat processing segment demonstrated great competitiveness, having ensured sales growth under the conditions of the stagnating market. In the grain segment, new records were set in crop capacity and gross yield. Within Cherkizovo Group, a very strong management team has been formed at all levels, which confidently leads the Company towards new successes. In 2014, we considerably reinforced our team in poultry, which is a key segment for the Company, accounting for almost half of its total revenues. I would like to thank all Cherkizovo employees for their excellent work and impressive achievements in 2014. The Company continued to develop new projects, such as Eletsprom and Tambov Turkey. Despite the geopolitical difficulties, our Spanish partners continued to invest in Tambov Turkey. The Ministry of Agriculture and Administration of the Tambov region support the Tambov Turkey project, and we have made great progress in its implementation. On the other hand, rouble devaluation will make Russian agricultural products much more competitive in the world markets and may stimulate export development once full import substitution and saturation of the Russian market have been achieved. The wide experience of the Cherkizovo Group management, a balanced business model and continuous work on the cost reduction will enable the Company to work confidently in 2015. Igor Babaev Chairman FINANCIAL STATEMENTS Dividend Policy In 2014, for the first time in the Group’s history, the Board of Directors recommended the payment of dividends. An extraordinary general meeting of shareholders approved this decision and, as a result, over RUB 1.5 billion, or RUB 34.44 per share, was paid to shareholders. I am certain that it is a very important, useful and timely decision. In the future, the Board of Directors will use its best efforts to create a permanent dividend yield for shareholders, in the interests of the Company’s long-term development. Prospects The events that occurred in Q4 2014 – sharp rouble devaluation and associated twofold increase in grain prices, as well as significant increase in the key interest rate of the Central Bank – have led to a difficult to forecast and largely negative situation in the market in 2015. Due to the decrease in income of the population, the demand for meat products may decline, but we expect this factor to be offset by import reductions. The increase in the cost of credit resources will make many producers, including Cherkizovo Group, focus on cost reduction and review investment plans. IN 2015, CHERKIZOVO GROUP WILL CELEBRATE ITS 10-YEAR ANNIVERSARY. FOR ALL OF THOSE YEARS, THE COMPANY HAS DEMONSTRATED STABLE GROWTH AND ACHIEVED NEW RECORDS THANKS TO A SMART LONG-TERM STRATEGY. 2014 ANNUAL REPORT GOVERNANCE Board of Directors and Management In the reporting year, the composition of the Board of Directors remained unchanged. Out of 7 members of the Board of Directors, 4 are non-executive directors, suggesting a high level of corporate governance. Independent members of the Board of Directors have multi-year industrial experience in various fields, which is crucial for the Company’s development. BUSINESS REVIEW Group Operations In the reporting year, the Group’s indicators in all segments increased in real and monetary terms. A favourable situation in the markets contributed to this increase. The veterinary restrictions introduced in March resulted in a notable rise in prices for meat products, while due to investments that we had made earlier in production and marketing, our sales continued to grow. 15 CHIEF EXECUTIVE OFFICER’S STATEMENT In 2014, the market was influenced by various factors, both economic and geopolitical. On one hand, we observed stable high prices for meat products and the country’s record-high grain harvest, and on the other hand, we witnessed a sharp devaluation of the rouble and a twofold increase in grain prices in Q4. However, most of the year was quite favourable for agricultural companies. The companies that benefited the most from the favourable market situation were the ones that have been best prepared for it: companies that invested in production, diversified their business, fought for efficiency and cost reduction, built supply chains, ensured financial control, and developed their own brands and partnerships with key retailers. Such companies are prepared for the good times and will be able to withstand the tough times. Cherkizovo Group is one of these companies. Results of the Group’s Operations After a very tough year, 2013, when the market was under the influence of many negative factors, in 2014 Cherkizovo Group returned to its normal profitability and growth rates. Not only did the Company manage to compensate loss incurred in 2013, it also created a safety margin, which will definitely be of use in a difficult 2015. In 2014, Cherkizovo Group set another historic record in revenue – which for the first time exceeded RUB 68 billion – in EBITDA, which was about RUB 17 billion, and in production, in terms of volume (over 800 thousand tonnes of meat products). These impressive figures were due to a number of factors. First of all, they are the result of multi-year investments in organic growth. Having completed an investment programme and focused on efficiency in pork, Cherkizovo Group came close to a volume of 180 thousand tonnes. Previously, this figure had been declared as a maximum production output using the existing capacities, but now, due to increased efficiency, the Company is able to exceed it by 12-15% without additional investment. Secondly, Cherkizovo Group continued its consolidation of the country’s meat market, having acquired the Voronezh company Lisko-Broiler in Q1. This enabled us to achieve a twofold increase in terms of volume, based on the results of the year in the poultry sector, and to significantly increase our market share. 16 2014 ANNUAL REPORT GENERAL OVERVIEW OVERVIEW Another factor influencing the market in 2015 will be the availability of credit resources and their cost. At present, the Government is developing a range of measures designed to support agricultural producers and mitigate any negative consequences of the increase in the key interest rate. Despite a relatively negative forecast for the macroeconomic situation in 2015, the position of Cherkizovo Group is stable. The Company works in the food segment, where consumer demand will remain regardless of any type of crisis. The financial position of Cherkizovo Group is strong, the Company generates steady cash flows and all of its loan obligations are denominated in rouble. In the course of the preparation of this report, it has become known that the Government included Cherkizovo Group in a list of strategically important enterprises. Our company has great experience in operation during crises, and we look to the future with confidence. Sergey Mikhailov CEO FINANCIAL STATEMENTS As a consequence, the market faced considerable deficit, which resulted in a sharp rise in pork prices in April-May. Due to the fact that the primary demand for pork comes from meat processing plants, by midsummer, processors had to switch to cheaper poultry. The increase in demand for poultry resulted in a notable price rise. Prospects The sharp rouble devaluation that took place in Q4 2014 will become the most important factor affecting the market in 2015. Costs for agricultural manufacturers have increased sharply because 60-80% of the cost of production is directly or indirectly tied to foreign currency. Therefore, we can confidently forecast considerable pressure on the cost of production and a decline in the profitability of producers. This may result in further market consolidation. Due to the fall in available income of the population, there is likely to be a decrease in meat consumption per capita. IN 2014 CHERKIZOVO GROUP SET A HISTORIC RECORD IN REVENUE AND PROFIT, HAVING INCREASED SALES VOLUMES IN ALL SEGMENTS AND CONTINUED THE PROCESS OF CONSOLIDATION OF THE POULTRY SECTOR. 2014 ANNUAL REPORT GOVERNANCE State Regulation and Macroeconomics Government actions had a significant influence on the market. In Q1, for veterinary safety reasons, the importation of meat from the European Union, which traditionally had been the primary pork supplier, was completely banned; before that, the importation of meat from the U.S. and Canada was banned due to the use of feed additives prohibited in the Russian Federation. The importation of live pigs from the EU had been banned as early as 2012. In December 2014, because of the crisis in the currency market, the key interest rate of the Bank of Russia was increased sharply, having reached 17% by the end of the year. Due to the fact that this decision was made just before the New Year holidays, its consequences – namely, a notable increase in loan interest rates and decreased availability of borrowed funds – will have a significant effect on the market in 2015. BUSINESS REVIEW Thirdly, due to the import restrictions in Q1, prices for meat products have increased considerably, and remained high until the year end. Thus, in 2014, in line with the Company forecast, very high revenues and profitability rates were achieved. In 2014, for the first time in its history, Cherkizovo Group paid dividends to its shareholders. In the future, the Company will commit to ensuring permanent dividend yields in the interests of the shareholders. 17 ACQUISITION OF LISKO-BROILER SYNERGY In Q1 2014, Cherkizovo Group acquired the Voronezh company Lisko-Broiler, taking further steps towards a leadership position in the poultry market. ACQUIRED ASSETS TERMS OF THE TRANSACTION BENEFITS OF THE TRANSACTION Lisko-Broiler was the largest poultry producer in the Voronezh region and one of the leaders in the markets of the Central and Southern Federal Districts. According to Russian Poultry Union estimates, as of the date of transaction Lisko was the seventh largest poultry enterpriser in the country, with a nationwide market share of about 2% by volume. At the time of the transaction, the LiskoBroiler business was evaluated at 5 billion roubles, including debt. Cherkizovo Group assumed Lisko-Broiler’s debt obligations. Acquisition was financed through the Company’s own funds. The acquisition of Lisko-Broiler significantly increased the business scale of Cherkizovo Group. The Company’s poultry production capacities have reached a landmark 500 thousand tonnes live weight per year and its market share grew. The transaction was made at a 4.8 EV/ EBITDA ratio, based on the 2014 LiskoBroiler forecast indicators. However, a further rise in prices in the poultry market, as a result of which the Company’s profit was higher than the forecast, reduced this ratio considerably and made the acquisition even more profitable. According to expert estimates, the acquisition price is lower than the cost of building a similar production facility from scratch. Because of this transaction, Cherkizovo Group improved its access to the market in the southern part of the country. The transaction has already had a noticeable synergetic effect. LiskoBroiler’s enterprises are situated in the Voronezh region, where Cherkizovo Group’s agricultural land is located. This allows for the construction of a vertically integrated chain. The distribution system created by Cherkizovo Group will allow for improved representation of Lisko products on shelves and reduce logistics costs. The production capacity of Lisko-Broiler is about 95,000 thousand tonnes live weight per year. The company’s production assets which are now owned by Cherkizovo Group include 7 poultry sites, a complex that slaughters and processes 9,000 heads per hour, 4 parent flock sites with the capacity to slaughter 4,000 heads per hour, 2 reproduction flock sites, a hatchery with a capacity of 80 million eggs per year; a feed mill with a capacity of 40 tonnes per hour; grain elevator with overall storage capacity of 100,000 tonnes; 2 utilisation facilities (including a meat and bone meat production facility and rendering facility). All of these production facilities are built in accordance with modern standards and are highly efficient. 18 2014 ANNUAL REPORT GENERAL OVERVIEW BUSINESS REVIEW GOVERNANCE CHERKIZOVO INCREASED ITS MARKET SHARE* 100% 14% 100% 14% Prioskolie Cherkizovo 13% 7% 7% 6% 5% 57% 6% 5% 55% Before the transaction Belgarnkorm Resurs FINANCIAL STATEMENTS 11% Severnaya Other * After the transaction as of March 2014, management’s estimate. PRODUCTION OUTPUTS AND DEVELOPMENT PLANS, THOUSAND TONNES +22% 417 58 +16% 343 343 359 2013 2014 Cherkizovo 483 85 388 +41% 2015 F* Lisko * Forecast. 2014 ANNUAL REPORT 19 CHERKIZOVO GROUP’S SUCCESS FACTORS The Company has shown revenue and profit growth for the past nine years. The investment attractiveness of Cherkizovo is determined by a number of factors. No.1 RIGHT STRATEGY No.2 BALANCED BUSINESS MODEL No.3 PORTFOLIO OF STRONG BRANDS The Company’s strategy provides for a combination of organic growth through investment in new production and the acquisition of finished businesses, increasing the Group’s market share and ensuring synergy. To this end, the Company acquired the poultry facilities of Chicken Kingdom (2007), Mosselprom (2011), and Lisko-Broiler (2014). Most of Cherkizovo Group’s pork complexes, on the other hand, have been built from scratch, in accordance with the most modern production efficiency standards. As a result, in the years of the maximum consumption growth, the Company took leading positions in all segments. Cherkizovo unites animal farming and meat processing plants. These business areas are inversely related to the price situation in the market. If meat prices rise, profits in poultry and pork also grow. If prices fall and the profitability of animal farming is under pressure, meat processing benefits from the low prices. Diversification between the potentially more profitable but at the same time more volatile pork sector, where most sales are in the B2B segment, and the stable demand for poultry in the B2C market allows for the neutralisation of the influence of price fluctuations. This means that, in case of any development in the market situation, Cherkizovo Group has an opportunity to increase its profitability in particular segments and maintain business stability. Cherkizovo Group has built a portfolio of strong poultry and sausage brands. The Company is especially proud of its Petelinka brand, which demonstrates the highest level of trademark awareness and consumer loyalty, primarily in the strategically important market of Moscow and the Moscow region, where about 10% of the country’s population resides. In 2014, the Company rebranded its flagship meat processing brand as Cherkizovo, making it more up-to-date and dynamic. The advertising campaign emphasised an essential competitive advantage – that the Company has its own farms and production facilities, as well as control over all production stages. 20 2014 ANNUAL REPORT GENERAL OVERVIEW BUSINESS REVIEW GOVERNANCE No.5 FAVOURABLE REGULATION No.6 STABLE FINANCIAL POSITION Cherkizovo Group has a strong management team, both at the top and middle management levels. Cherkizovo employs managers and specialists who have received education in Russia and abroad and have work experience in the largest Russian and foreign companies. For example, the core of the financial team consists of managers with experience of working in the “Big 4” international accounting firms. A number of foreign specialists who have come through every stage of operative work in the most effective animal breeding companies in the U.S. and Brazil are engaged in the production process. The agro-industrial complex and food safety of the country are of the utmost importance to the Russian Government. For this reason, the country has created a favourable regulatory and tax environment for food producers. For example, Russia’s Tax Code provides for a zero income tax rate for agricultural manufacturers and there is an interest rate subsidising system, allowing for the reduction of a loan debt burden. After Russia’s accession to the WTO in 2012, import quotas were preserved, with a high customs duty rate for out-of-quota imports. A stable cash flow and the opportunity to borrow at a low rate enabled Cherkizovo Group to invest over RUB 50 billion in production development. At the same time, the Company maintained a comfortable Debt to EBITDA level, as a rule, not exceeding 4. Virtually all loan obligations of the Company are denominated in RUB, which almost fully eliminates currency risk. The stability of the financial condition of the Company is confirmed by Moody’s rating (B2, Stable). Historically, the Company has reinvested all of its profits. In 2014, for the first time in its history, the Group paid dividends to its shareholders. 2014 ANNUAL REPORT 21 FINANCIAL STATEMENTS No.4 MANAGEMENT TEAM POULTRY The acquisition of Lisko-Broiler enabled Cherkizovo Group to significantly increase poultry volumes. Based on the year’s results, sales have increased by 22% in volume terms. Cherkizovo Group has 8 full-cycle poultry production clusters. The total production capacity exceeds half a million tonnes live weight per year, which is more than 200 million broilers. The poultry segment today provides for half of the Group’s revenues and profits. Poultry continues to develop, both due to new capacity commissioning and strategic acquisitions. POULTRY MARKET, 2014 14% Prioskolie 11% Cherkizovo Belgarnkorm Resurs 6% 59% 5% Severnaya 5% Other Source: Russian Poultry Union. SALES, THOUSAND TONNES 417 +22% 343 22 194 260 2010 2011 319 2012 The consumption of diet-friendly, proteinrich and affordable poultry is increasing both in Russia and in the world. Russian poultry production meets over 90% of the domestic market requirements. Cherkizovo Group has become one of the the drivers of growth in the poultry sector in our country. Over the last ten years, the Company has acquired, reconstructed and expanded poultry farms in Central Russia, implementing the most advanced technologies of veterinary safety and production efficiency. 2013 In March 2014, Cherkizovo Group announced the acquisition of the Voronezh plant Lisko-Broiler, which occupied the leading positions in its region and a number of regions of the South of Russia (for more information on the Lisko-Broiler acquisition, see pages 18-19). At the end of the year, the first poultry breeding site of the Eletsprom project in the Lipetsk region was also commissioned. Its capacity is about 30 thousand tonnes per year. The demand for poultry remained high in 2014. After the introduction of a veterinary ban on pork imports from the EU and the the subsequent market deficit, there was increased demand for poultry by meat producers, who increased its share in their production. The growth in demand resulted in a price rise in Q3, with the prices remaining high throughout the second half of the year. Based on the year’s results, Cherkizovo Group increased its poultry sales by 22%, to 417 thousand tonnes in terms of sellable weight, out of which 58 thousand tonnes were produced at Lisko-Broiler facilities (starting from the moment of acquisition by Cherkizovo Group on 25 March). 2014 2014 ANNUAL REPORT GENERAL OVERVIEW During the year, the Company introduced three innovative poultry categories to the market. These are products in a special roasting bag; a line of various ready-to-cook healthy nutrition products for cooking in a steamer or slow-cooker, and poultry products for cooking in a microwave oven. These product categories meet the changing needs of consumers, who want to buy healthy products for their families without spending too much time on cooking. Sales data clearly demonstrate the success of these new Petelinka ready-tocook products. +17% 990.5 2014 2013 844.4 2012 842.1 Gross profit +96% 297.5 2014 152.0 2013 232.9 2012 EBITDA +187% 232.4 2014 81.1 2013 176.1 2012 Segment profit +430% 195.2 2014 2013 FINANCIAL STATEMENTS In 2014, Cherkizovo Group conducted three full-scale advertising campaigns and a social marketing campaign – the first in the Company’s history, within the framework of which, RUB 1 from each product was donated to the United Way charity to support orphanages in the Company’s regions of operation. The first-ever TV campaign for the Chicken Kingdom brand was also launched. Sales GOVERNANCE One of the most important competitive advantages of Cherkizovo Group in the poultry market is its portfolio of strong brands. Until recently, the Petelinka trademark was the only poultry brand widely advertised on national TV channels. Because of this, Petelinka has record-high brand awareness among consumers (over 90%) and consumer loyalty. KEY FINANCIAL INDICATORS (USD MILLION) BUSINESS REVIEW Revenue in monetary terms increased by 17%, amounting to an impressive USD 990.5 million. EBITDA almost tripled, having reached USD 232.4 million. At the same time, thanks to the combination of high poultry prices and steady grain prices, EBITDA margin reached 24%, based on the year’s results. 36.8 2012 129.9 Key Operating Indicators Meat yield, % Adjusted feed conversion rate (1 kg liveweight) Average growing period, days Average daily gain, g* Liveability, % 2013 73.9 1.77 36.6 54.2 94.1 2014 74.3 1.76 37.1 54.5 92.9 Change +0.4 p.p. -0.6 % +1.4 % +0.6 % -1.2 p.p. * Calculation methodology changed. 00 2014 ANNUAL REPORT 23 PORK In 2014, thanks to high pork prices, the Company fully benefited from multibillion investments made in the pork segment for the last 5 years. The EBITDA margin set a record of 49%, allowing for the compensation of any 2013 losses. In the early 2000s, the Russian pork sector was in a difficult situation. The country depended heavily on imports. The industrial pork sector was distressed; pork complexes built during Soviet times failed to meet modern efficiency requirements and were uncompetitive. A major share of pork was raised in household farms that were unable to ensure the required livestock veterinary protection. Understanding the necessity of import substitution and the prospects of this segment, Cherkizovo began to develop an industrial pork sector in Central Russia. In total, Cherkizovo Group invested in the creation and acquisition of new pork complexes worth over half a billion USD, with pork becoming the most capitalintensive project for the Company. PORK MARKET, 2014 13% Miratorg 6% Rusagro Cherkizovo 6% Agro-Belogorie 6% 66% Agrarian Group 3% Other Source: National Pork Producers Union. SALES, THOUSAND TONNES 158 24 88 91 2010 2011 170 +8% From the outset, all pork complexes, which the Company built in the Voronezh, Lipetsk, Tambov, and Penza regions, were designed in accordance with the modern requirements for production efficiency and veterinary safety. According to independent expert estimates, pork complexes built by Cherkizovo Group are not only as good as modern foreign sites, but even outperform them by many parameters. In order to ensure highquality animal reproduction, in 2012 Cherkizovo Group acquired a swine nucleus unit at which purebred Yorkshire, Landrace, and Large White pigs are bred. One of the competitive advantages of Cherkizovo Group in pork is an international team of experienced experts. We have invited to work with us the best vets and pig breeding and fattening specialists from the U.S. and Brazil, both leading countries in the pork market. These specialists had worked in such well-known companies as Smithfield and BRF Brazil Foods. The introduction of world practices at our sites enabled us to reach a high level of piglet survival and feed conversion. 104 2012 2013 2014 2014 ANNUAL REPORT GENERAL OVERVIEW +29% 437.9 2014 338.8 2013 251.8 2012 Gross profit +263% 207.4 2014 57.2 2013 92.4 2012 EBITDA +266% 216.1 2014 59.0 2013 94.0 2012 Segment profit +1,320% 177.6 2014 2013 12.5 2012 63.7 Key Operating Indicators Pigs weaned per crate per year, heads Market hog average weight of the farm, kg Feed conversion at fattening Finisher feed conversion KG sold per production sow 2014 ANNUAL REPORT FINANCIAL STATEMENTS Due to the fact that most of the pork investment project has already been completed, and no new capacities were commissioned in 2014, segment sales in terms of volume grew by 8%, from 158 to 170 thousand tonnes. This growth did not require any additional investment. According to management estimates, further work for increasing operating efficiency will allow increased volumes without any additional capital costs in the future. While in previous years, the production capacity of Cherkizovo Group in pork was estimated at 180185 thousand tonnes per year, the continuous improvement of operating indicators (such as the number of weaned piglets per sow; survival rate; and average weight of commodity pig) allows for a confident prediction of 200,000 tonnes per year in the short term. Sales GOVERNANCE Cherkizovo Group’s average sales price for live pigs in the first half of 2014 increased by 50% as compared to the corresponding period of 2013, when a price downfall was observed. The price for pigs remained quite high up to the end of the year, which enabled the pork segment to set historic records in revenues, totalling USD 437.9 million (+29% to 2013) and in EBITDA that reached USD 216.1 million versus USD 59 million in the previous year. The EBITDA margin was 49%. KEY FINANCIAL INDICATORS (USD MILLION) BUSINESS REVIEW In 2014, the pork market was primarily affected by the veterinary ban on the importation of pork from the EU introduced in March. Because that the import share was 20-25% of the market, the restrictions resulted in a certain deficit. At the beginning of Q2, when demand for meat traditionally increases in anticipation of the summer season, this caused a significant rise in prices. 2013 107.9 110.5 3.0 10.9% 2,035 2014 109.2 117.3 2.7 7.1% 2,129 Change +1.2 % +6.2 % -9.2 % -3.8 p.p. +4.6 % 25 MEAT PROCESSING In 2014, the profitability of the meat processing segment was under pressure due to high prices for raw materials. However, the segment team managed to achieve sales growth in the stagnating market and significantly increase sales efficiency. In 2014, the sausage products market was still in a stagnant state: experts estimate its growth in terms of volume within a limit of 2%. The Cherkizovo Group meat processing segment indicators are much higher than the average: sales in terms of volume grew by 7%, having reached 144 thousand tonnes versus 135 thousand tonnes in the previous year. The key success factor was a continuing focus on marketing and distribution: in a highly competitive market, the winner is not the one who produces more, but the one who best knows consumers’ needs and has better sales. MEAT PROCESSING MARKET IN THE CENTRAL FEDERAL DISTRICT, 2014* 15% Ostankino 10% Cherkizovo Tsaritsino 8% 58% Mikoyan Prodo (Klinsky) 6% Other 3% * Company’s data. SALES, THOUSAND TONNES 142 2010 26 145 127 2011 2012 135 2013 The meat processing market in Russia is highly fragmented. Nearly all large cities and towns have meat processing plants that produce a wide assortment of sausages and frankfurters and occupy a significant share of the local market, but are invisible at the national level. Cherkizovo Group is one of the few producers whose products are successfully sold in dozens of cities and towns throughout the country, and our meat processing brand is deservedly recognised by trading partners and end consumers. 144 +7% In 2014, new IT solutions were introduced in order to improve the quality and efficiency of operations; the commercial policy, the trading personnel structure and system were modified. Significant work was undertaken on range optimisation, in order to focus on the most successful and profitable positions. As a result, the number of products in the range was reduced twice, to about 250 products. Thanks to a focus on MML (minimum must list – key required products), the share of MML in the total sales volume increased from 32% in the beginning of the year to 55% at year end. Cherkizovo continued to build on the success of its Cherkizovo Express case-ready chilled meat products, launched in 2013. Sales of ready-to-cook products have reached an impressive figure of 2,000 tonnes per month and continue to grow stably. 2014 2014 ANNUAL REPORT OVERVIEWOVERVIEW GENERAL In order to ensure uninterrupted work for the entire supply chain, in 2014 Cherkizovo Group began full reconstruction of the Dankovsky Meat Processing Plant, acquired in 2013. Dankovsky is located in the Lipetsk region, where the key pig-raising capacities of the Group are situated. At the facilities of the meat processing plant, a modern slaughterhouse will be built, which will be commissioned in the first half of 2015. 2014 ANNUAL REPORT 2014 -0.2% 570.3 2013 571.6 568.5 2012 Gross profit -42% 81.7 2014 140.3 2013 117.3 2012 EBITDA 2014 -70% 18.6 61.4 2013 56.2 2012 Segment profit 2014 FINANCIAL STATEMENTS It was the Company’s own raw material base that became the basis for an extremely successful advertising campaign, “Quality from Farm to Fork”, launched in late summer on national TV channels. A memorable commercial showed every stage of the production of high-quality sausage products, using the Company’s own grain, its own livestock farms, and its own production facilities, with prompt delivery. Product rebranding contributed to the success of the marketing campaign: sausage products are now known as “Cherkizovo” (instead of “Cherkizovsky”), while new packaging emphasises the freshness and quality of the product. Sales GOVERNANCE 2014 has clearly demonstrated another competitive advantage of Cherkizovo Group in meat processing, namely the Group’s own raw materials base. While a number of sausage producers faced considerable difficulties with raw materials, and many of them had to suspend production, all branches of Cherkizovo Meat Processing Plant regularly received fresh chilled pork from the Company’s own farms. Not only did this allow the Company to maintain the highest quality of products, it also guaranteed uninterrupted supply, which is especially important for retail partners. KEY FINANCIAL INDICATORS (USD MILLION) STRATEGIC BUSINESS REVIEW REPORT At the same time, the meat processing segment profitability was under significant pressure due to a sharp rise in prices for fresh meat. For example, the price for pork carcasses reached 190 roubles in Q3 2014, which is twice as high as in Q1 2013. As a result, the segment EBITDA profitability decreased from 11% to 3%, and the segment EBITDA was USD 18.6 million versus USD 61.4 million in the previous year. However, at the Group level, the decrease in the meat processing segment profit was offset by a significant profit growth in the poultry and pork segments. -2.7 (-106%) 2013 2012 41.1 36.4 Key Operating Indicators Meat on the bone yield, % to live weight Labor productivity, tonnes/person Productivity of workshop workers, output tonnes/person MML sales share (%) 2013 70.6 28.2 30.7 32.0 2014 73.0 31.5 41.5 55.0 Change +2.4 p.p. +3.3 % +10.8 % +23 p.p. 27 GRAIN In 2014, the crop areas of the grain segment were expanded and new agricultural equipment was purchased. The segment demonstrated a 39% harvest increase, and record-high harvests of certain cultivated crops, as well as high profitability levels. CROP HARVEST DATA FOR 2013-2014 2013 Grain yield Crop tonnes Wheat Corn Barley Peas Sunflower Other Total 78,336 43,041 23,425 12,683 13,816 3,355 174,656 2014 Cultivated Grain yield ha 15,656 4,852 7,165 6,235 3,929 2,290 40,127 Cultivated tonnes 124,766 42,159 25,283 23,256 18,869 7,929 242,263 ha 21,150 9,973 4,592 6,578 7,606 7,858 57,757 GROSS GRAIN CROP 242 +39% 175 116 28 0 0 2010 2011 2012 2013 Russia is among only five countries where the largest land areas are suitable for agriculture. During the last 15 years, the country has become a net exporter of grain. In 2014, Russia saw a record-high grain harvest of over 100 million tonnes. This was a prerequisite for the preservation of prices sufficient for livestock farmers. However, after the rouble devaluation in Q4, rouble grain prices flew up. This was associated with the fact that grain is an export commodity. When export prices in USD began to increase, it pulled the internal prices along. As a result, prices have more than doubled over the past few months. Cherkizovo Group is a large grain consumer: every year the Company uses about one million tonnes of grain for feed production. Taking into account the high volatility of the grain market, which manifests itself in noticeable price fluctuations and an occasional physical deficit of grain in certain regions, Cherkizovo Group has been developing its own crop raising operational landbank for three years. Having started from a crop area of 40,000 ha in 2012, the Company is now cultivating 60,000 ha in 2014. Cherkizovo lands are located in the most fertile region in Russia – the Central Black Earth region. As compared to the previous year, Cherkizovo Group increased its harvest by 39% to 242 thousand tonnes (bunker weight). In the course of the harvesting campaign, land areas of over 60,000 ha were cultivated in the Voronezh, Lipetsk, Moscow, and Orel regions. As of today, the the Grain segment covers approximately 20%-25% of the Group’s grain needs, and this figure continues to grow. Sales volumes in the grain segment, based on the results of 2014, increased by 70%, amounting to 237,106 tonnes of various crops, as compared to 139,565 tonnes in 2013. Due to the grain price rise in the second half of the year, financial indicators were also strong: EBITDA more than doubled to USD 12.7 million, with an EBITDA margin level of 31%. 2014 2014 ANNUAL REPORT OVERVIEWOVERVIEW GENERAL +52% 40.7 2014 26.8 2013 35.8 2012 Gross profit +120% 18.0 2014 8.2 2013 14.0 2012 EBITDA +149% 12.7 2014 5.1 2013 13.8 2012 Segment profit +185% 5.7 2014 2013 2012 FINANCIAL STATEMENTS In the autumn of 2014, 29 thousand hectares were successfully sown with winter wheat. In 2015, the crop areas will be increased by another 30 thousand hectares in the Tambov region. Thus, crop areas will be more than 90 thousand hectares, which will allow the Company to increase its degree of grain self-sufficiency. Sales GOVERNANCE The yield growth was paralleled with the development of grain storage capacities. In the middle of the year, the Company commissioned the Mikhailovsky elevator, with storage capacity of 100 thousand tonnes, in the Penza region. During the reconstruction of the Mikhailovsky feed mill, including the elevator, grain storages of a silo type were established from 9 reservoirs of 12 thousand tonnes each. By the end of 2014, the Company had reached an important landmark of 700,000 tonnes of grain storage. In mid-2015, the first turn of elevators of the “Eletsprom” project will be commissioned, at which point Cherkizovo Group grain storage capacity will exceed 1 million tonnes. KEY FINANCIAL INDICATORS (USD MILLION) 2.0 7.2 CROP YIELDS OF CHERKIZOVO GROUP AND ON AVERAGE FOR RUSSIA IN 2014 (CWT/HA) Cherkizovo Group, bunker weight Wheat Barley Sunflower 2014 ANNUAL REPORT STRATEGIC BUSINESS REVIEW REPORT Together with the increase in gross grain yield, Cherkizovo Group has demonstrated significant crop yield improvement. Gross winter wheat yield increased by 23%, from 51 cwt/ha in 2013 to 62 cwt/ha in 2014 (the average crop yield for the country, according to the Ministry of Agriculture, was 26 cwt/ha). This was facilitated by timely investment in a high-performance equipment fleet, strict compliance with winter wheat sowing technology and the consistent application of agricultural approaches. A record-high harvest of grain and legumes was observed in certain regions. The winter wheat yield in the Voronezh region has reached a recordhigh value of 66 cwt/ha with a target value of 50 cwt/ha; peas in the Orel region – 46 cwt/ha, with a target value of 30 cwt/ha. 59.0 55.1 24.8 Cherkizovo Group, net weight 56.0 52.3 23.6 Average yield for Russia 26.1 23.5 13.9 29 FINANCIAL REVIEW In 2014, Cherkizovo’s revenue increased by 30% in roubles to RUB 68.7 billion, and the EBITDA margin reached 24%. After a very challenging 2013, the reporting year, in contrast, saw an extremely favourable environment for agricultural enterprises. At the end of 2013, grain prices decreased to а comfortable level, which was maintained up until the rouble depreciation in Q4 2014. After the ban on EU meat imports in March 2014, there was a significant growth in pork prices, followed by a growth in poultry prices. The Group therefore managed to fully regain its profitability ratio in key segments. The acquisition of Lisko-Broiler in Q1 became an additional driver of growth, which led to a notable increase in poultry sales. Due to the increase in poultry prices, the returns from this acquisition as early as within the first year exceeded those forecast by the management team. BUSINESS REVIEW Cherkizovo is the leading integrated and diversified meat producer in the Russian Federation. Our principal operations consist of the production and sale of processed meat products, primarily in the European part of Russia; the breeding of broilers, and the processing and sale of chilled and frozen poultry products produced at facilities in the Bryansk, Kursk, Lipetsk, Moscow, Penza, Tula, and Voronezh regions, as well as the breeding of pigs at facilities in the Lipetsk, Moscow, Orel, Penza, Tambov, Vologda, and Voronezh regions, the sale of live pigs, and the production of grain on the Company’s land bank. We also carry out trading and distribution operations and produce the feed consumed in our Poultry and Pork operations. Revenues, USD million Our operations are structured into four divisions: Meat Processing, Poultry, Pork, and Grain. Our Poultry division consists of eight production clusters and the associated sales and trading operations. Our Pork operations comprise fifteen integrated pork complexes. We operate six meat processing plants, where we process raw meat into fresh and ready-to-cook products, and process it further into processed meat, sausages, hams, and other products. The division also carries out associated sales and trading operations. EBITDA, USD million Our Grain division operated a 60,000-hectare land bank in 2014. Cherkizovo operates six plants producing the feed consumed in other divisions. All operating divisions can also be involved in other non-core activities. Expenses for our corporate headquarters are recorded under Corporate Expenditure. 1,795.6 438.7 30 Ludmila Mikhailova Chief Financial Officer In 2014, we produced 808 thousand tonnes of meat products, which significantly exceeds the results of any other company in this sector. According to the Russian Poultry Union and our own estimates, we have the largest sales of poultry in the markets of Moscow and the Moscow region, and we are the second-largest producer nationally. We are also the third-largest producer in the highly fragmented Russian pork industry. According our management team’s estimates based on the market analysis, we are the second-largest producer in the meat processing market in the Central Federal District. In 2014, we sold 416,622 sellable weight tonnes of poultry products (including 58,417 sellable weight tonnes of poultry products produced by LiskoBroiler since its acquisition on 25 March), 170,172 live-weight tonnes of pork, and 144,189 tonnes of meat products. Grain sales were 237,106 tonnes. The Group also produced more than 1.4 million tonnes of feed for internal consumption. 2014 ANNUAL REPORT GENERAL OVERVIEW Reimbursement of interest payments Agricultural enterprises are also eligible for the reimbursement of up to two-thirds of the official Central Bank of Russia (CBR) refinancing rate from the Russian federal authorities for interest payable on loans, as well as up to one-third of the official CBR refinancing rate from regional authorities. The CBR’s refinancing rate during 2014 was at 8.25%. The volume of sales and average selling prices in each of our divisions are generally highest in the second quarter, at the start of the summer season, and in the fourth quarter, at the beginning of the New Year holiday season. Post-holiday economising, combined with the period of Lent before Russian Orthodox Easter, makes the year’s first quarter generally the quietest selling period. Seasonality also affects average selling prices, as retail consumers generally buy more (and more expensive) high-quality products in the fourth quarter. In addition, because feed costs are lower when crops are harvested, the second half of the year is notably more profitable for pork and poultry production. INTEREST RATES AND CURRENCY EXCHANGE Our reporting currency is the US dollar; the Group’s functional currency is the Russian rouble (RUB). The rouble is not fully convertible outside the Russian Federation. Within the Russian Federation, official exchange rates are determined daily by the CBR. Market rates and official rates may differ. In November 2014, the CBR switched to a floating exchange rate formation mechanism. Our products are typically priced in roubles, and our direct costs, including raw materials (other than some feed components and veterinary drugs), labour and transportation, are also largely incurred in roubles. Other costs, such as interest, are incurred in roubles and and a very minor portion is euros. In 2014, the rouble sharply depreciated against global currencies. According to the CBR, the official exchange rates as of 1 January 2014 were as follows: 32.66 roubles per 1 US dollar and 45.06 roubles per 1 euro; as of 31 December 2014 56.26 and 68.34 respectively. In 2014, the rouble depreciated against the US dollar by 72%, and against the euro by 52%. Considering that the depreciation mostly took place in November and December, the average rouble to US dollar exchange rate used in our calculations was 38.42. At 31 December 2014, 99% of our long-term outstanding debt (excluding finance leases) consisted of rouble-denominated loans. 99% of our long-term debt outstanding at 31 December 2013 consisted of roubledenominated loans. Virtually all of our short-term debt balance (excluding the current portion of long-term loans) at 31 December 2014 and 2013 was roubledenominated. We have not entered into any transactions to hedge against the interest rate risk. EBITDA margin 24% Net profit, USD million 345.7 2014 ANNUAL REPORT 31 FINANCIAL STATEMENTS We account for interest on these loans on a net basis, after taking the subsidies into account. As of 31 December 2014, approximately 90% (down from 91% at the end of 2013) of the aggregate principal amount of our loans was eligible for, and received, the subsidies, which reduced interest for the year by $51.6 million (2013: $70.1 million). As of 31 December 2014, our effective interest rate applicable to the loans to which the interest subsidies applied ranged from 4% to 4.97%, compared with the weighted average interest rate on outstanding amounts under the loans, which ranged from 8.0% to 15.6%. As of 31 December 2014, our cost of debt in rouble terms was at 3.5% (2013: 2.9%). The favourable interest rate subsidies are not available to non-production agriculturerelated operations, such as our trading, mergers and acquisitions and meat processing operations. SEASONALITY GOVERNANCE Favourable profit tax In line with the Tax Code of the Russian Federation, enterprises engaged in agricultural production in Russia benefit from the zero profit tax rate. Our Poultry, Pork, and Grain operating divisions benefit from this rate. Our non-agricultural operations, such as the trading operations, feed production, and meat processing do not benefit from this rate. As a result of these reduced tax rates, our overall effective tax rate in 2014 was 0.7% (2013: 3.2%), compared to the general corporate profit tax rate in Russia of 20%. BUSINESS REVIEW STATE SUPPORT FOR AGRICULTURAL PRODUCTION IN THE RUSSIAN FEDERATION FINANCIAL REVIEW RESULTS OF OPERATIONS Group Results On a reported currency basis (US dollars), sales increased by 9%, to $1,795.6 million (2013: $1,654.9 million). Gross profit increased by 66%, to $594.1 million (2013: $358.4 million). Operating expenses as a percentage of gross sales decreased from 16% in 2013 to 14%. Net income in 2014 was at $345.7 million (2013: $64.5 million). The impressive increase in income was mostly due to the low base effect after a difficult 2013. The adjusted EBITDA increased by 143% to $438.7 million (2013: $180.6 million), due mostly to the low base effect. The adjusted EBITDA margin in 2014 increased significantly and was at 24% (2013: 11%). Earnings per share increased fivefold to $7.88. CONSOLIDATED INCOME STATEMENT Year ended 31 December 2014 Year ended 31 December 2013 Sales incl. sales volume discount incl. sales returns Cost of sales Gross profit Gross margin Operating expenses Operating income Operating margin Income before income tax and minority interest Net income attributable to Cherkizovo Group 1,795,562 (92,932) (18,330) (1,201,452) 594,110 33.1% (246,530) 347,580 19.4% 349,212 345,695 1,654,919 (81,402) (14,863) (1,296,472) 358,447 21.7% (269,783) 88,664 5.4% 66,397 64,465 Net profit margin Weighted average number of shares outstanding Earnings per share Net income attributable to Cherkizovo Group per share – basic and diluted Consolidated adjusted EBITDA reconciliation* Income before income tax and minority interest Add: Gain from bargain purchase Interest expense, net of subsidies Interest income Other financial expence Foreign exchange loss, net Depreciation and amortisation Consolidated adjusted EBITDA* Adjusted EBITDA margin 19.4% 43,851,090 3.9% 43,843,090 7.88 1.47 349,212 66,397 (38,113) 26,131 (6,978) 16 17,312 91,138 438,718 24.4% 25,095 (5,719) 3,000 91,867 180,640 10.9% (in thousands of US dollars) 32 2014 ANNUAL REPORT GENERAL OVERVIEW (in thousands of USD) Total sales including other sales including sales volume discount Interdivision sales Sales to external customers % of total sales Pork Grain 570,287 1,007 (59,090) (487) 569,800 31.7% 990,491 33,304 (33,842) (32,019) 958,472 53.4% 437,862 7,284 (182,793) 255,069 14.2% 40,693 798 (29,218) 11,475 0.7% 746 746 746 0.0% (244,517) (10,307) 244,517 0.0% 1,795,562 32,832 (92,932) 1,795,562 100.0% (488,598) 81,689 14.3% (73,514) 8,175 (692,974) 297,517 30.0% (114,958) 182,559 (230,430) 207,432 47.4% (17,752) 189,680 (22,708) 17,985 44.2% (8,730) 9,255 (1,097) (351) -47.1% (34,271) (34,622) 234,355 (10,162) 4.2% 2,695 (7,467) (1,201,452) 594,110 33.1% (246,530) 347,580 1.4% (3,639) (7,186) (2,650) -0.5% (771) 10,393 18.4% 23,470 (10,862) 195,167 19.7% 229 49,881 43.3% (1,087) (11,022) 177,571 40.6% 893 26,424 22.7% 17 (3,538) 5,734 14.1% 26 3,452 -4,641.0% (12,671) (9,963) 38,113 (19,143) -2,566.1% (624) 988 3.1% (16,440) 16,440 (7,467) 3.1% - 19.4% (10,350) (26,131) 38,113 349,212 19.4% (247) 91,138 (2,650) 195,167 177,571 5,734 (19,143) (7,467) 349,212 7,186 (98) (775) 4,512 10,393 18,568 3.3% 10,862 (8,458) 2,133 (17,145) 49,881 232,440 23.5% 11,022 (748) (1,342) 3,177 26,424 216,104 49.4% 3,538 (17) 3,452 12,707 31.2% (38,113) 9,963 (14,097) 26,768 988 (33,634) -4,508.5% (16,440) 16,440 (7,467) 3.1% (38,113) 26,131 (6,978) 16 17,312 91,138 438,718 24.4% Interdivision Total Consolidated Reconciliation between net division profit and income attributable to Cherkizovo Group Total net division profit Net income attributable to non-controlling interests Income taxes Net income attributable to Cherkizovo Group 2014 ANNUAL REPORT 349,212 (3,764) 247 345,695 33 FINANCIAL STATEMENTS Operating margin Other income and expenses, net Financial expenses, net Gain from bargain purchase Division profit/(loss) Division profit margin Supplemental information: Income tax expense Depreciation expense Adjusted EBITDA* reconciliation Division (loss)/profit Add: Gain from bargain purchase Interest expense, net Interest income Other financial (income)/expense Foreign exchange loss/(gain) Depreciation and amortisation Adjusted EBITDA* Adjusted EBITDA margin* Poultry GOVERNANCE Cost of sales Gross profit Gross margin Operating expenses Operating income Meat Processing Corporate assets/ expenditures BUSINESS REVIEW AUDITED 12 MONTH 2014 CONSOLIDATED SELECTED FINANCIAL DATA FINANCIAL REVIEW POULTRY DIVISION Thanks to the acquisition of Lisko-Broiler, total sales in the Poultry division in 2014 increased by an impressive 22%, to 416,622 tonnes of sellable weight (2013: 342,637 tonnes), including 58,417 tonnes of sellable weight produced by Lisko-Broiler since its acquisition by the Group on 25 March 2014. Average prices in rouble terms increased by 18% y-o-y from 77.12 RUB/kg in 2013 to 90.70 RUB/kg in 2014 (all prices in this review are presented net of VAT). Average prices in the Poultry division in dollar terms decreased by 2% y-o-y, from $2.42/kg in 2012 to $2.36/kg in 2013. The decrease in prices in dollar terms is due to the depreciation of the rouble. Total sales in the Poultry division increased by 17% to $990.5 million (2013: $844.4 million). Gross profit increased twofold, to $297.5 million (2013: $152.0 million), while the divisional gross margin increased to 30% (2013: 18%). The adjusted EBITDA increased by 187% to $232.4 million (2013: $81.1 million), and the adjusted EBITDA margin increased to 24% (2013: 10%). Operating expenses as a percentage of gross sales decreased to 12%, from 14% in 2013. Operating income increased to $182.6 million (2013: $37.2 million), and the operating margin was 18% (2013: 4%). Segment profit in the Poultry division was $195.2 million (2013: $36.8 million). POULTRY DIVISION INCOME STATEMENT DATA (in thousands of US dollars) Total sales Interdivision sales Sales to external customers Cost of sales Gross profit Gross margin Operating expenses Operating income Operating margin Other income and expenses, net Interest expense, net Division profit Division profit margin Poultry division adjusted EBITDA reconciliation* Division profit Add: Interest expense, net of subsidies Interest income Other financial income Foreign exchange gain Depreciation and amortisation Poultry division adjusted EBITDA* Adjusted EBITDA margin 34 Year ended 31 December 2014 Year ended 31 December 2013 990,491 (32,019) 958,472 (692,974) 297,517 30.0% (114,958) 182,559 18.4% 23,470 (10,862) 844,350 (16,229) 828,121 (692,308) 152,042 18.0% (114,844) 37,198 4.4% 8,371 (8,812) 195,167 19.7% 36,757 4.4% 195,167 10,862 (8,458) 2,133 (17,145) 49,881 232,440 23.5% 36,757 8,812 (6,189) (2,116) 43,846 81,110 9.6% 2014 ANNUAL REPORT GENERAL OVERVIEW Sales volume in the Pork division in 2014 increased by 8% y-o-y, to 170,172 tonnes of live weight, compared to 157,565 tonnes in 2013. Sales volume growth was mostly due to the improvement of operating efficiency. Total sales in the Pork division increased by 29%, to $437.9 million (2013: $338.8 million). Gross profit increased by more than three times to $207.4 million in 2014 (2013: $57.2 million). Divisional gross margin was at 47% (2013: 17%). Average prices in rouble terms increased by 47% y-o-y, from 65.68 RUB/kg in 2013 to 96.25 RUB/kg in 2014. Pork price growth was due to the ban on EU meat imports imposed in March 2014. Average prices in dollar terms increased by 22% y-o-y, from $2.06/kg in 2013 to $2.51/kg in 2014 (live weight). Operating expenses as a percentage of gross sales decreased from 10% in 2013 to 4%, due to the notable increase in total sales. Operating income was at $189.7 million (2013: $23.3 million), and our operating margin was at 43% (2013: 7%). BUSINESS REVIEW PORK DIVISION Segment profit in the Pork division was at $177.6 million (2013: $12.6 million). The adjusted EBITDA increased to $216.1 million (2013: $59.0 million). The adjusted EBITDA margin was at 49% (2013: 17%). GOVERNANCE PORK DIVISION INCOME STATEMENT DATA (in thousands of US dollars) Division profit Division profit margin Pork division adjusted EBITDA reconciliation* Division profit Add: Interest expense, net of subsidies Interest income Other financial income Foreign exchange loss Depreciation and amortisation Pork division adjusted EBITDA* Adjusted EBITDA margin 2014 ANNUAL REPORT Year ended 31 December 2013 437,862 (182,793) 255,069 (230,430) 207,432 47.4% (17,752) 189,680 43.3% (1,087) (11,022) 338,770 (97,203) 241,567 (281,577) 57,193 16.9% (33,936) 23,257 6.9% (221) (10,481) 177,571 40.6% 12,555 3.7% 177,571 11,022 (748) (1,342) 3,177 26,424 216,104 49.4% 12,555 10,481 (310) 534 35,725 58,985 17.4% 35 FINANCIAL STATEMENTS Total sales Interdivision sales Sales to external customers Cost of sales Gross profit Gross margin Operating expenses Operating income Operating margin Other income and expenses, net Interest expense, net Year ended 31 December 2014 FINANCIAL REVIEW MEAT PROCESSING DIVISION Sales volumes in the Meat Processing division in 2014 increased by 7% y-o-y, to 144,189 tonnes compared to 134,530 tonnes in 2013. The increase in volume was due to the focus on marketing and distribution activities. Average prices in rouble terms increased by 12% y-o-y, from 148.78 RUB/kg in 2013 to 167.29 RUB/kg in 2014. Average prices in dollar terms decreased by 7% y-o-y, to $4.35/kg in 2014, from $4.67/kg in 2013. The decrease in prices in dollar terms is due to the depreciation of the rouble. Total sales in the Meat Processing division were at $570.3 million (2013: $571.6), divisional gross profit decreased by 42% to $81.7 million (2013: $140.3 million). Divisional gross margin was at 14% (2013: 25%). The decrease in profit was attributed to the high raw meat prices in 2014. The adjusted EBITDA decreased by 70%, to $18.6 million (2013: $61.4 million), and the adjusted EBITDA margin was at 3% (2013: 11%). Operating expenses as a percentage of gross sales decreased from 15% in 2013 to 13%. Operating income decreased to $8.2 million (2013: $52.1 million). Operating margin was at 1% (2013: 9%). Losses in the Meat Processing division were at $2.7 million (2013: $41.1 million profit). MEAT PROCESSING DIVISION INCOME STATEMENT DATA (in thousands of US dollars) Total sales Interdivision sales Sales to external customers Cost of sales Gross profit Gross margin Operating expenses Operating income Operating margin Other income and expenses, net Interest expense, net Division (loss) profit Division profit margin Meat processing division adjusted EBITDA reconciliation* Division (loss) profit Add: Interest expense, net of subsidies Interest income Other financial income Foreign exchange loss Depreciation and amortisation Meat processing division adjusted EBITDA* Adjusted EBITDA margin 36 Year ended 31 December 2014 Year ended 31 December 2013 570,287 (487) 569,800 (488,598) 81,689 14.3% (73,514) 8,175 1.4% (3,639) (7,186) 571,593 (229) 571,364 (431,332) 140,261 24.5% (88,135) 52,126 9.1% (858) (10,139) (2,650) -0.5% 41,129 7.2% (2,650) 7,186 (98) (775) 4,512 10,393 18,568 3.3% 41,129 10,139 (304) 1,201 9,211 61,376 10.7% 2014 ANNUAL REPORT GENERAL OVERVIEW Cherkizovo harvested more than 242,000 tonnes of grain (bunker weight), which is 39% higher than in 2013, reported at about 175,000 tonnes (bunker weight). Harvest in net weight was at about 229,000 tonnes. In the agricultural season, the Company sowed approximately 60,000 hectares in the Orel, Lipetsk, and Voronezh regions. Sales volume in the Grain division increased by 70% y-o-y in 2014, to 237,106 tonnes of different crops, from 139,565 tonnes in 2013. Wheat, barley, and corn accounted for 81% of sales (in tonnes) in 2014. Sale price in rouble terms in 2014 increased by 20%, to 7.21 RUB/kg, from 6.01 RUB/kg in 2013. Sales price in US dollars in 2014 remained almost at the same level and amounted to $0.19/kg. Total sales in the Grain division increased by 52%, to $40.7 million (2013: $26.8 million). Divisional gross profit totalled $18.0 million (2013: $8.2 million). The divisional gross margin was at 44% (2013: 31%). Operating expenses as a percentage of gross sales remained almost at the same level, and amounted to 21% (2013: 20%). The division’s operating income tripled to $9.3 million (2013: $2.9 million). The operating margin was at 23% (2013: 11%). Net income amounted to $5.7 million (2013: $2.0 million). BUSINESS REVIEW GRAIN DIVISION The adjusted EBITDA increased to $12.7 million (2013: $5.1 million), and the adjusted EBITDA margin was at 31% (2013: 19%). GOVERNANCE GRAIN DIVISION INCOME STATEMENT DATA (in thousands of US dollars) Division profit Division profit margin Grain division adjusted EBITDA reconciliation* Division profit Add: Interest expense, net of subsidies Interest income Foreign exchange gain Depreciation and amortisation Grain division adjusted EBITDA* Adjusted EBITDA margin 2014 ANNUAL REPORT Year ended 31 December 2013 40,693 (29,218) 11,475 (22,708) 17,985 44.2% (8,730) 9,255 22.7% 17 (3,538) 26,765 (13,428) 13,337 (18,566) 8,199 30.6% (5,283) 2,916 10.9% 11 (881) 5,734 14.1% 2,046 7.6% 5,734 2,046 3,538 (17) 881 (11) 3,452 12,707 31.2% (1) 2,185 5,100 19.1% 37 FINANCIAL STATEMENTS Total sales Interdivision sales Sales to external customers Cost of sales Gross profit Gross margin Operating expenses Operating income Operating margin Other income and expenses, net Interest expense, net Year ended 31 December 2014 FINANCIAL REVIEW LIQUIDITY AND CAPITAL RESOURCES CAPITAL REQUIREMENTS In addition to our working capital requirements, we need capital to finance the following: • Capital expenditure, particularly in connection with further development of our production segments; • Potential acquisitions; Debt Net debt at the end of reporting period was $463.5 million, or RUB 26,073.6 million (at the end of 2013: $756.1 million, or RUB 24,747.7 million). Total debt was $493.3 million, or RUB 27,752.5 million (at the end of 2013: $841.0 million, or RUB 27,526.4 million). Debt in dollar terms decreased substantially due to devaluation of rouble. Cost of debt in roubles in 2014 3.5% Of total debt, long-term debt was approximately $253.9 million, or 51% of the debt portfolio. Short-term debt was $239.4 million, or 49% of the portfolio. All of the debt of Cherkizovo is roubledenominated. The cost of debt in 2014 was 3.5% (2013: 2.9%). The portion of subsidised debt in the portfolio was 90%. Cash and cash equivalents totalled $17.9 million at 31 December 2014. • Repayment of debt. We anticipate that capital expenditure, potential acquisitions and the repayment of long-term debt will represent the most significant use of funds over the next few years. We generally rely on operating cash flows and bank loans to finance capital expenditure. In 2014, the major sources of our funds were our operating cash flows, short-term and long-term loans. We financed our capital expenditure primarily with long-term loans. TOTAL DEBT, 2013 TOTAL DEBT, 2014 9% 10% 91% 38% 841 USD MLN 38 90% 49% 62% long-term 493 USD MLN 51% long-term short-term short-term subsidised loans subsidised loans unsubsidised loans unsubsidised loans 2014 ANNUAL REPORT GENERAL OVERVIEW SUBSIDIES CASH FLOW In 2014, the Group accrued $2.2 million, or RUB 82.8 million of direct subsidies (2013: $23.9 million, or RUB 756.7 million). In 2014, subsidies were granted in line with the Government’s decision to compensate agricultural producers who suffered from the feed price increase. Interest reimbursement to the Group amounted to $51.6 million, or RUB 1,983.6 million (2013: $70.1 million, or RUB 1,652.2 million). The table below shows data on cash flow connected with operating activities for the two years ending 31 December 2014 and 2013. Exchange rate fluctuations during 2014 impacted the figures in our cash flow statement, particularly the figures in operating and financing activities (the average dollar/rouble exchange rate was in 2014: 38,422, compared to 31,848 in 2013). GOVERNANCE In 2014, the Group’s capital expenditure amounted to $174.9 million (2013: $161.1 million). $72.3 million of this amount was invested in the Poultry division, mainly in the Eletsprom project. The Pork division received $68.9 million of investment, which was used to buy and produce sows and build feed mills and new feeding stations. $19.1 million was invested in the Meat Processing division, mainly in maintenance and upgrade of equipment, and $10.6 million was invested in the Grain division, mostly to buy new equipment. BUSINESS REVIEW CAPITAL EXPENDITURE CASH FLOW 2013, US $000 300,033 178,326 Cash flow from (used in) investing activities: (243,108) (155,064) Cash flow from (used in) financing activities: Net (decrease) increase in cash and cash equivalents: (73,961) 6,109 (46,476) 23,205 FINANCIAL STATEMENTS 2014, US$000 Cash flows from (used in) operating activities: CAPITAL EXPENDITURE, US $000 2014 174,978 2013 161,109 2012 186,523 2011 241,795 173,636 2010 Poultry division 2014 ANNUAL REPORT Pork division Meat Processing division Other 39 FINANCIAL REVIEW CASH FROM (USED IN) OPERATING ACTIVITIES CASH FROM (USED IN) INVESTING ACTIVITIES Net cash from operating activities at $300 million in 2014. Net cash used in investing activities increased to $243.1 million (2013: $155.1 million). Of that, $86.7 million was used to acquire Lisko-Broiler. In 2014, the Сompany increased its working capital to $108.2 million, compared to working capital of $10.3 million in 2013. Working capital increased due to the increase of $42.6 million in the inventories, compared to a decrease of $7.3 million in 2013, and a growth in trade receivables by $35.8 million, compared to the decline of $2.3 million in 2013. A significant inventory increase y-o-y resulted from the Сompany’s decision to increase its stock of grain, soybean meal and premixes. In 2013, the Сompany’s inventory decreased slightly, by $7.3 million. A increase in trade receivables was due to a rise in production volume and the development of new distribution channels. Despite the significant increase in working capital in 2014, the Company substantially increased its cash from operating activities as well in 2014, compared to 2013, due to a large growth in net income, which amounted to $300 million, compared to $178.3 million in 2013. CASH FROM (USED IN) FINANCING ACTIVITIES Net cash used in financing activities was reported at $74.0 million in 2014, compared to net cash in 2013 that amounted to $6.1 million. The main change was due to the payment of dividends, as well as a decline in net cash proceeds from long-term borrowings. LIQUIDITY As of 31 December 2014, we had total cash and cash equivalents at $17.9 million (2013: $64.4 million). We also had working capital of $30.2 million, compared to $35.3 million in 2013. Since 31 December 2014, we have continued to meet our obligations to trade creditors from operating cash flow and debt financing. Our trade working capital, which we define as current assets less current liabilities, excluding short-term loans and the current portion of long-term loans, was $269.6 million as of 31 December 2014 (2013: $352.5 million). In 2014, trade receivables decreased to $70.3 million (2013: $82.7 million). Trade receivables from related parties at 31 December 2014 were $3.7 million (2013: $5.2 million). Trade receivables’ turnover averaged 21 days as of 31 December 2014 (2013: 18 days). The allowance for doubtful accounts was $1.8 million (2013: $5.4 million). A decision to create a reserve is taken for every counterpart individually. Our trade accounts payable decreased, and amounted to $76.7 million at 31 December 2014 (2013: $121.1 million). Trade payables to related parties were at $0.3 million (2013: $1.2 million). Trade payables’ turnover averaged 34 days (2013: 45 days). As of 31 December 2014, advances paid, amounted to $39.9 million (2013: $39.9 million). Of our total net advances, $3.0 million was to related parties (2013: $1.2 million). The allowance for doubtful accounts at 31 December 2013 was $1.4 million (2013: $2.6 million). Our inventory consists primarily of raw materials and goods for resale, work in progress, livestock and finished goods. As of 31 December 2014 and 31 December 2013, our inventories were at $220.2 million and $281.6 million respectively. The value of our livestock at 31 December 2014 was $86.4 million (2013: $129.6 million). Other receivables mainly comprise subsidies due from the government, which decreased to $16.7 million in 2014 (2013: $36.9 million). 40 2014 ANNUAL REPORT GENERAL OVERVIEW We belive that 2015 prospectives look challenging and hard to forecast. Certainly, the market will feel the impact of the crisis that has already had a negative effect on the economy of the Russian Federation in 2014. The majority of Cherkizovo’s expenses are pegged to the US dollar and euro, either directly (supply of hatching eggs, soybean meals, veterinary drugs, and feed additives) or indirectly (growth of grain cost, which is Despite a very complicated economic picture, Cherkizovo plans to bolster production and increase sales volume across all segments in 2015. Ludmila Mikhailova Chief Financial Officer One other significant factor that will impact the whole market is a substantial rise in the cost of debt after the CBR key rate increase in December 2014. The Russian government has proposed several measures to support agricultural enterprises’ solvency and to make loans more affordable. However, we can anticipate a future increase in the cost of loans. In this situation, Cherkizovo will revise its aggressive plans on capital investments for the benefit of longterm financial stability. GOVERNANCE The consumption of meat may go down considerably due to a decline in real disposable income. We anticipate that decrease in consumption will be offset by a substantial decrease in imports that became unprofitable due to the devaluation of the rouble. an export product and thus dollardenominated). Therefore, we can confidently predict greater pressures on product costs and, as a result, declining profitability from peak values in 2014. Our management anticipates that a well-balanced and diversified business structure and constant cost reduction practice will help to mitigate the negative impact of rouble devaluation. BUSINESS REVIEW OUTLOOK FINANCIAL STATEMENTS *Non-GAAP financial measures. This review includes financial information prepared in accordance with accounting principles generally accepted in the United States of America, or US GAAP, as well as other financial measures referred to as non-GAAP. The non-GAAP financial measures should be considered in addition to, but not as a substitute for, the information prepared in accordance with US GAAP. Adjusted Earnings before Interest, Income Tax, Depreciation and Amortisation (“Adjusted EBITDA”). Adjusted EBITDA represents income before income tax and non-controlling interests adjusted for interest, depreciation and amortisation and foreign exchange differences as shown in the reconciliation in Appendix 1. Adjusted EBITDA margin is defined as Adjusted EBITDA as a percentage of our net revenues. Our adjusted EBITDA may not be similar to adjusted EBITDA measures of other companies; is not a measurement under accounting principles generally accepted in the United States and should be considered in addition to, but not as a substitute for, the information contained in our consolidated statement of operations. We believe that adjusted EBITDA provides useful information to investors because it is an indicator of the strength and performance of our ongoing business operations, including our ability to fund discretionary spending such as capital expenditures, acquisitions and other investments and our ability to incur and service debt. While depreciation and amortisation are considered operating costs under generally accepted accounting principles, these expenses primarily represent the non-cash current period allocation of costs associated with long-lived assets acquired or constructed in prior periods. Our adjusted EBITDA calculation is commonly used as one of the bases for investors, analysts and credit rating agencies to evaluate and compare the periodic and future operating performance and value of companies within our industry. Net debt is calculated as total debt minus cash and cash equivalents, short-term bank deposits and long-term bank deposits. All prices are net of VAT. For price calculation in dollar terms, the Company used the average exchange rate for 2014: 38.422 USD/RUB; 2013: 31.848 USD/RUB; 2014 ANNUAL REPORT 41 EMPLOYMENT POLICIES AND SUSTAINABLE DEVELOPMENT EMPLOYMENT POLICIES Our employees are our most valuable asset, and Cherkizovo seeks to excel in the recruitment, motivation, education and training of all personnel. The Group’s HR policies are designed to ensure we recruit and retain high quality people at all levels of the business. Legislation and Benefits Employees work a 40-hour week, including a daily one-hour lunch break. Each of our facilities has a staff canteen at which food is available at low cost (and for free for some categories of staff). In addition, each employee is given a food hamper at New Year. We reward employees for particular achievements. These include key good work, reaching output targets, long service and outstanding contribution. Women are entitled to paid maternity leave, and their jobs are kept open for three years. They are also given a cash gift on the birth of a child. In addition, we give financial assistance to newly married couples and in cases of disability or bereavement. The Company organises and partly funds summer camps for employees’ children, and many of our operations have a gym or facilities for football and tennis. Cherkizovo has its own corporate newsletter, which aims both to inform employees about key events at Cherkizovo and in our marketplace, and to help the development of our corporate culture. Health Our employees are given medical examinations three times a year. Those who work with raw meat receive additional examinations and innoculations. All employees are given flu injections every autumn. We have medical centres at which employees can receive help, although Russian citizens have government medical insurance that entitles them to free treatment. Training When new people join the Group, we provide introductory training on the Company and its history, as well as on production, distribution, sales and our quality policy. Professional development is an ongoing priority for our employees. We consider the shortage of suitably trained people to be one of the major risks to our business. As a result, we work closely with final year students in educational establishments in an effort to attract the best people. We have also introduced programmes to give existing senior members of staff international training. Equal opportunities We do not consider age, colour, ethnic origin, gender, political or other opinions, religion or sexual orientation to be a barrier to employment or advancement. SUSTAINABLE DEVELOPMENT Cherkizovo remains focused on its commitment to be a good corporate citizen. We aim to reduce the impact we make on the environment, and to have a positive interaction with the communities in which we operate. We also make considerable efforts to ensure effective communication with our shareholders, suppliers, and employees. Health, safety and environment We comply with the applicable environmental legislation and observe biological and veterinary safety requirements in our poultry and pig farming operations. This involves ensuring: of at least five kilometres. This prevents the transfer of diseases between generations of animals and between breeding and production stock. We also take prevailing winds into consideration when choosing locations. Comfort. We stimulate the healthy growth and development of our poultry and pigs by controlling air temperature and circulation, lighting and humidity. All full/All empty. Individual sites only contain animals of the same generation. Sites are cleaned and disinfected between production periods. Traceability. To ensure the high quality of our products, we control all stages of production, from feed production to breeding, processing and distribution. Preventative Measures. We seek to operate our agricultural facilities to international best practice standards. We undertake a large number of preventative measures to ensure that our sites are safe, both to limit stock’s susceptibility to disease and to prevent the spread of any diseases which may occur. These measures include: Balanced feed. We produce our own feed made to special formulas to ensure it contains the optimum balance of energy and protein, microelements, vitamins and amino acids. Specialisation and separation of sites. We carry out all stages of production at discrete sites, divided by minimum sanitation zones 42 • Strictly controlling access to sites; • Prohibiting the movement of staff between sites; • Ensuring the effective operation of veterinary and sanitary stations; • Providing staff with work shoes and clothing; • Using disposable packaging for deliveries; • Prohibiting staff from visiting countries which suffer from pig and poultry diseases; • Regularly eliminating potential carriers of disease, such as rodents and insects; • Regularly testing blood samples from our pigs and poultry; • Clinically examining and taking veterinary care of stock; • Vaccinating to required procedures. Environmental Measures. We have systems at all sites that control waste water, air pollution and energy consumption. • Limiting the number of visitors, including foreign delegations; 2014 ANNUAL REPORT GENERAL OVERVIEW CHARITABLE PROGRAMMES BUSINESS REVIEW Charitable support for the underprivileged is an integral part of Cherkizovo Group’s corporate social responsibility programme. Every year, the Company supports the United Way and Diema’s Dream charitable foundations. These foundations adhere to principles of transparency and openness, publishing reports that contain programme details, contributions and a report on expenses. GOVERNANCE In 2014, the Company held its firstever social marketing campaign, Petelinka: Help for Children. As part of this campaign, the Company assumed responsibility to send 1 rouble from each product sold under the Petelinka brand to the United Way charitable foundation. Funds raised (more than 6 million roubles) were sent to orphanages in seven regions in which the Company has its operations, in the Moscow, Bryansk, Voronezh, Kursk, Lipetsk, Penza, and Tula regions. FINANCIAL STATEMENTS 2014 ANNUAL REPORT 43 Sales Volume (000’ Tonnes) 00M Title to be placed (000’ Tonnes) 00M 44 2014 ANNUAL REPORT GENERAL OVERVIEW GOVERNANCE Corporate Governance 46 Board of Directors 50 Management Board 52 Directors’ Report 54 BUSINESS REVIEW RESILIENT GOVERNANCE TEAM OF PROFESSIONAL MANAGERS Average length of professional team’s experience in the consumer sector FINANCIAL STATEMENTS 10 YEARS Number of non-executive directors 4 2014 ANNUAL REPORT 45 CORPORATE GOVERNANCE Cherkizovo’s shares are listed on the Moscow exchange (MOEX) and the London Stock Exchange (LSE). On the Moscow Exchange, our shares are included in the quotation list A1. We are required to comply with the corporate governance standards of the Russian Federation and Great Britain. These include: The obligation to have at least three non-executive directors. Cherkizovo’s Board of Directors includes four nonexecutive directors, as defined in the Corporate Governance Code recommended by the Federal Service for Financial Monitoring. We believe that Mr. Musheg Mamikonian, Mr. Samuel Lipman, Mr. Marcus Rhodes and Mr. Vitaliy Podolskiy can be regarded as independent directors in accordance with the Corporate Governance Code approved by the Federal Service for Financial Monitoring and the Corporate Governance Combined Code of the United Kingdom; The formation of an Executive Board. Cherkizovo formed its Executive Board in June 2010. At the end of 2014, it had 11 members; The formation of an Audit Committee, whose exclusive functions are appraising nominated auditors for the Company, evaluating audit reports, as well as assessing the efficiency of internal control procedures and suggesting improvements. The Committee was formed in April 2006, and membership is reviewed annually by the independent directors of the Board; 46 The formation of a Personnel and Remuneration Committee, consisting of members of the Board. The Personnel and Remuneration Committee was formed in July 2010 and in 2012, the Statement concerning the Personnel and Remuneration Committee was updated. Its members are re-elected annually; The formation of an Investment and Strategic Planning Committee, consisting of members of the Board. The Investment and Strategic Planning Committee was formed in June 2012, with the appropriate statement being approved and members being elected; Adoption of a bylaw on insider trading. The register of information regarding issuer insider trading was accepted on December 28, 2011; Presence of the Corporate Audit and Risk Management department. The Corporate Audit and Risk Management department is responsible for building an efficient system of corporate control in Cherkizovo Group, providing support to the corporate control system and testing of the system. The office operates under Russian law, corporate procedures and regulations, orders issued by the CEO of Cherkizovo Group, and the applicable regulation. The presence in the internal documents of the obligation of the members of the Board of Directors and the Executive Board, the CEO, including the managing organisation and its officials, to disclose information on the possession of securities, and on the selling and/or purchasing securities; Approval of a document that defines regulations and requirements for information disclosure. The statement regarding information disclosure was accepted on 25 April 2011; 2014 ANNUAL REPORT GENERAL OVERVIEW • Determine the business priorities of the Company; • Convene annual and extraordinary general shareholders’ meetings, excluding the cases mentioned in paragraph 8 of Article 55 of the federal Law On Joint-Stock Companies; • Approve the agenda of the general shareholders’ meeting; • Determine the effective date when compensation paid to the executive bodies of the Company: the Chairman of the Executive Board and members of the Executive Board; • Recommend the amount of bonuses and compensation paid to the members of the Revision Committee of the Company and determination of the compensation for the auditor of the Company; • Recommend the amount of the dividend and its payment procedure; • Use the reserve fund and other funds of the Company; • Approve the internal documents of the Company, excluding the approval of anything which, according to the federal Law On Joint-Stock Companies, is the purview of a general shareholders’ meeting and other internal documents, approval of which is the purview of the CEO of the Company; • Adopt the general shareholders’ meeting • Create branches and other representative • Increase the charter capital • Approve major transactions in cases agenda; • Place bonds and other emission securities in cases stipulated by the federal Law On Joint-Stock Companies; • Determine the price (monetary value) of the property, the price of emission securities to be placed or repurchased in cases stipulated by the federal Law On Joint-Stock Companies; • Purchase shares, bonds and other securities placed by the Company in cases provided for by the federal Law On Joint-Stock Companies; • Appoint executive bodies of the Company and establish conditions for the early termination of their authorities – elect the Chairman of the Executive Board and appoint the members of the Executive Board; 2014 ANNUAL REPORT specified in Chapter X of the federal Law On Joint-Stock Companies; • Approve transactions specified in Chapter XI of the federal Law On Joint-Stock Companies; • Approve the Company’s registrar and its contract conditions, as well as termination of this contract; • Determine the Company’s participation in other organisations, except in cases stipulated in subparagraph 18 of paragraph 1 of Article 48 of the federal Law On Joint-Stock Companies; • Approve the Company’s strategic plans for a period exceeding three (3) years; • Approve the Company’s plans, annual budgets and investment programmes; • Approve the Company’s capital costs, the amount of which exceeds ten million dollars ($10,000,000), or the rouble equivalent of this amount, if such capital expenditures were not provided for by the appropriate approved annual Company’s budget; programmes for Company employees; • Approve mergers and acquisitions, the amount of which exceeds ten million dollars ($10,000,000), or the rouble equivalent of this amount, if such transactions were not provided for by the appropriate approved annual Company budget; • Action any other issues as provided for by the federal Law On Joint-Stock Companies. Federal law prohibits the Board of Directors from acting on issues that fall within the exclusive purview of a general shareholders’ meeting. The Company Charter requires a majority of the directors present at a Board meeting to vote for an action in order for it to be approved. The exceptions are major transactions, for which Russian legislation requires a unanimous vote. A Board meeting is considered to be duly assembled and legally competent to act when a majority of the Board members are present. Board of Directors meetings shall be held in accordance with the annual schedule and as necessary, but not less than 5 times a year. The Board met 12 times during 2014. Corporate Secretary In order to provide for the Company’s Board of Directors and organisational work flow, the Board of Directors shall elect the corporate secretary for the term of the Board of Directors office. The activities of the corporate secretary are governed by the respective regulation approved in 2013. Chief Executive Officer The Company’s Chief Executive Officer (CEO) is responsible for the day-to-day operations of the Company, with the exception of matters exclusively in the purview of the Company’s general shareholders’ meeting, the Board of Directors, and the Executive Board. The CEO also acts as Chairman of the Executive Board. 47 FINANCIAL STATEMENTS of the Company by distribution of additional shares bound by the number and categories/types of authorised shares; offices; • Approve the terms of the share option GOVERNANCE making a list of people who are entitled to participate in the general shareholders’ meeting, and other questions related to the preparation and holding of the Company’s general shareholders’ meeting that, according to provisions of Chapter VII of the federal Law On Joint-Stock Companies, are the purview of the Board of Directors; • Establish the amount of bonuses and BUSINESS REVIEW The Role of the Board The Board is responsible for the general management of the Company and has the exclusive power to: CORPORATE GOVERNANCE The CEO organises the implementation of decisions of the Company’s general shareholders’ meeting, the Board of Directors, and the Executive Board. The CEO acts in the name of the Company without warrant and represents the interests of the Company, conducts transactions, approves personnel, issues orders and provides direction to all employees of the Company. The CEO is elected by the Board for a period of up to five years. His contract is signed by the Chairman of the Board of Directors and authorised by the Board. Contract conditions are approved by the Board of Directors. Only upon approval of the Board of Directors may the CEO combine his position with other executive roles in the management of other organisations. If the CEO is not able to carry out his responsibilities, the Board of Directors has the right to make a decision on the early discontinuance of his authority and assign a new CEO. Executive Board The quantitative and personal composition of the Executive Board is approved by the Company’s Board of Directors after proposals of the Chairman of the Executive Board, and must be optimal for constructive business discussions, as well as timely and effective decision-making. The authority of the Executive Board is determined by the Company’s Charter. The Executive Board is authorised to: • Approve prospective plans, as well as the business priorities of the Company and its subsidiaries; • Review results of the activities of Company’s subsidiaries; • Approve incentive programme for Company’s employees, as well as employees in its subsidiaries; • Consider and adopt decisions on the signing of collective contracts and agreements by the Company and its subsidiaries; • Consider other issues, presented for consideration upon the proposal of a member of the Executive Board. 48 The Executive Board has the right to summon the Company’s officials for reporting and acquire technical, economical, business and other information on the Company’s activities, as well as information on its subsidiaries’ activities, and fulfill other duties within the frame of the Board authority. • Evaluate the conclusions Internal Control/Risk Management The Board of Directors holds overall responsibility for ensuring that the Company maintains an adequate system of internal control and risk management, and for reviewing its effectiveness. • Analyse the approval system for Internal control is also carried out by the Revision Committee, the activities of which are governed by the Company’s Charter and the Regulation on the Revision Committee. The commission oversees and coordinates audits of financial and economic activities of the Company. Its principal duties are to ensure that the Company’s activities comply with the applicable Russian legislation, do not infringe on shareholders’ rights, and that accounting and reporting do not contain material misstatements. The members of the commission are elected for one year at the AGM and may not include the Chief Executive Officer or other members of the Board. The Code of Corporate Policy (governance) of Cherkizovo Group OJSC was incorporated on 11 January 2010. On 14 December 2011, a special anonymous hotline for Company employees was implemented. Audit Committee The members of the Audit Committee in 2014 were Mr Musheg Mamikonian, Mr Samuel Lipman and Mr Marcus Rhodes, who chairs the Committee. As a chartered accountant and a retired E&Y audit partner, Marcus Rhodes possesses relevant financial experience. The Audit Committee maintains a formal agenda of items that are to be considered at each Committee meeting and within the annual audit cycle. The exclusive responsibilities of the Audit Committee are to: • Evaluate the candidates for the position of independent auditor of the Company and provide the results of that evaluation to the Board of Directors of the Company; of the independent auditor of the Company; • Evaluate the efficiency of current procedures for internal control and risk management of the Company, preparing suggestions for their improvement; nonstandard operations of the Company and develop suggestions for the Board of Directors for its improvement. The Audit Committee is required to: • Provide the Board of Directors with the results of their assessment of candidates for the position of independent auditor and prepare recommendations regarding the candidates for the position of independent auditor of the Company; • Prepare recommendations regarding the amount of compensation for the independent auditor of the Company based on the nature and extent of their service; • Hold a competitive selection process for the position of independent auditor, if there is to be one; • Analyse and discuss, together with the independent auditor of the Company, major issues that appear in the course of auditing financial (accounts) reporting prior to the publication of such reporting; • Evaluate the opinions of the independent auditor of the Company and analyse related comments by management before providing these opinions to the general shareholders’ meeting of the Company (provided in the form of information materials for the AGM); • Check transactions made by affiliated persons of the Company; • Ensure the consistency of financial reporting prepared in accordance with international standards (IFRS, US GAAP); • Consider messages from the Internal Control Department – which controls procedures of internal control of the financial and economic activity of the Company, evaluation of the efficiency of the internal control system, risk management and corporate governance – about detected breaches and evaluate such breaches; 2014 ANNUAL REPORT OVERVIEWOVERVIEW GENERAL • Consider annual reports from the Internal Control Department of the Company; management procedures, and develop and provide the Board of Directors with suggestions and recommendations regarding the improvement of such procedures; • Analyse and develop suggestions for the Board of Directors regarding improvements to the approval system for nonstandard operations of the Company; • Prepare conclusions, either in response to • Consider reports, opinions and other documents of the Revision Committee of the Company regarding detected breaches within a certain period; • Provide for consideration at the Board of Directors’ meetings conclusions about breaches detected in the period under review and suggest solutions for their elimination and prevention of future recurrence; • As necessary, develop special tasks or projects for the Internal Control Department; • Analyse the activity and organisational structure of the Internal Control Department and take measures to avoid or eliminate unnecessary restrictions in the activity of the Internal Control Department by either managing entities, Company officials or other Company personnel; • Discuss press releases of the Company regarding profits, financial results, and the outlook for the Company that are provided to analysts and rating agencies; • Take any other actions necessary for the Audit Committee to effectively function. 2014 ANNUAL REPORT • The Company’s HR policy; The Committee’s main objective is to propose and issue recommendations to the Company’s Board on a number of issues, including: • Adopting base performance targets • Determining the priority activities for to reward the Company’s Board of Directors, members of the Executive Board, and the Chief Executive Officer (the Company’s bodies of management). The main tasks of the Committee include first examination and issuing of recommendations to the Board on the following areas of policy: • Corporate recruitment; • Remuneration paid to members of the bodies of management; • Human resources policy in affiliates and subsidiaries; • Formation of the Executive Board; • Appointment of the Company’s Chief Executive Officer, Chairman of the Executive Board, and members of the Executive Board; • Recruitment and nomination of independent directors; • Determining remuneration paid to the Company’s key executives; • Corporate management structure; • Training of human resources, including key executives; • Other issues as decided by the Board or instructed by the Board Chairman; the Company; • Examining the Company’s development strategy; its strategic goals and objectives, both long-term and annually, and the Company’s long-term investment programmes. In accordance with the above-mentioned goals, the Committee is also responsible for: • First consideration and recommendations to the Board on issues related to the Company’s strategic planning and investment policy; • Evaluating the efficiency of interaction between the Company’s structural units, whose responsibilities under internal documents of the Company cover management of strategic planning and investment processes, and the Board, and issuing recommendations to the Board based on this evaluation; • Evaluating the efficiency of the Company’s long-term performance and issuing recommendations to the Board to improve the Company’s development strategy and specific business directions, based on the need to raise corporate efficiency and taking into consideration product and capital market trends, as well as the performance of the Company and its competitors, and other factors; • Working together with the Company’s Chief Executive Officer, Executive Board, and authorised designated business directions in the Company. 49 FINANCIAL STATEMENTS • Approve the work plans of the Internal Control Department; The Committee’s main objective is to propose and issue recommendations to the Company’s Board on issues including: The Committee adheres to a formal list of issues within its area of responsibility that must be discussed at each meeting during the financial year. GOVERNANCE requests by the Board of Directors or on their own initiative, for different issues within its purview, and annually provide the Board of Directors with reports on the work of the Audit Committee during the previous year; The Committee adheres to a formal list of issues within its area of responsibility that must be discussed at each meeting during the financial year. Investments and Strategic Planning Committee In 2014, the members of the Investments and Strategic Planning Committee were Mr. Sergei Mikhailov, Mr. Samuel Lipman, Mr. Evgeny Mikhailov, and Mr. Musheg Mamikonian as the Committee Chairman. STRATEGIC BUSINESS REVIEW REPORT • Evaluate internal control and risk Personnel and Remuneration Committee In 2014, the members of the Personnel and Remuneration Committee were Mr. Musheg Mamikonian, Mr. Marcus Rhodes, and Mr. Vitaliy Podolskiy as the Committee Chairman. BOARD OF DIRECTORS EXECUTIVE DIRECTORS Name and position IGOR BABAEV CHAIRMAN OF THE BOARD SERGEI MIKHAILOV CHIEF EXECUTIVE OFFICER EVGENY MIKHAILOV HEAD OF INVESTMENTS PROJECT DEPARTMENT Biography Igor Babaev has served as Chief Executive Officer of most of the Group’s companies since 1998. He joined Cherkizovsky MPP in 1988 as chief engineer, becoming president and a member of the Board of Directors in 1993. Before joining Cherkizovsky MPP, he held a number of senior management positions within several meat processing companies across Russia. He graduated from Krasnodar Polytechnic Institute in 1971 and received a PhD from the Moscow Technological Institute of Meat and Dairy Processing Industry in 1981. He holds the distinction of “Honoured Worker of the Food Industry of the Russian Federation” and has been an acting member of the Russian Engineering Academy since 1994. In 2009, Mr. Babaev was awarded the Order of Honour. Sergei Mikhailov has been CEO of Cherkizovo Group since 2006. Previously, he was Deputy President and Chief Operating Officer of Cherkizovsky MPP from 2000 before joining AIC Cherkizovsky as Deputy President of Marketing and Sales in 2004. In the same year, he was appointed General Director of the Cherkizovsky Trade House. He founded the aTelo, Inc Telecommunications Company in 1998 in the United States, serving as a director until 2001. He was an intern at Goldman Sachs in 1997, moving to become a financial analyst at Morgan Stanley in 1999. He graduated with a BSc in Finance from Georgetown University (Washington DC) in 2000. Evgeny Mikhailov has led Cherkizovo’s Investments Project Department since 2006 and has served on the Board of AIC Mikhaylovskiy since joining as the first Deputy General Director in 2004. He was a financial analyst at Morgan Stanley in 2002, following a period in 2001 as assistant to the vice-president at Washington DC’s aTelo, Inc. He received a BSc in Economics from the University of California, Los Angeles in 2004. 50 2014 ANNUAL REPORT GENERAL OVERVIEW MUSHEG MAMIKONIAN NON-EXECUTIVE DIRECTOR, CHAIRMAN OF THE INVESTMENT AND STRATEGIC PLANNING COMMITTEE VITALIY PODOLSKIY NON-EXECUTIVE DIRECTOR, CHAIRMAN OF THE PERSONNEL AND REMUNERATION COMMITTEE MARCUS RHODES NON-EXECUTIVE DIRECTOR, CHAIRMAN OF THE AUDIT COMMITTEE Samuel Lipman joined the Board of Directors in April 2006. He also currently serves as founder and President of The Lipman Company, which has been providing management consulting services to the broiler industry since 1997. He has served as Chief Executive Officer of Broiler of the Future LLC since 2007 and as President of Stromyn Breeders LLC, an investment holding company, since 2003. Mr. Lipman founded and was President and Chief Executive Officer of Golden Rooster in Lipetsk, Russia from 1996 to 2000. He graduated from Colby College, USA in 1972. Musheg Mamikonian joined the Board of Directors in 2006. Since 1997, Mr. Mamikonian has held senior positions in such meat processing companies as OJSC Lianozovsky Sausage Plant, OJSC Dmitrovsky Meat Plant, and OJSC CMPP. Since 2013, he has been the President of the Meat Council of the Common Economic Space (CES ). Mr. Mamikonian graduated from Yerevan Polytechnic Institute in 1981 and received a PhD from Moscow Technological Institute of Meat and Dairy Processing Industry in 1986. He holds over 100 patents for technical and technological inventions, and in 1999 received a Russian Federation State award for achievements in Science and Technology. Vitaliy Podolskiy joined the Board of Directors of Cherkizovo Group in June 2012. He has 17 years of experience in the financial and retail/FMCG sectors in the USA, UK, Germany and Russia. He has held the position of Chief Financial Officer (CFO) at Perekrestok and X5 Retail Group NV. Between 2008 and 2013, Mr. Podolskiy held senior management positions in companies working in the food retail markets in Russia and Central Asia and served on the board of directors at Caesar Satellite, Rosinter Restaurants Holding, Kukhni Marii, Uyuterra, and Kazakhstan Kagazy. He graduated from the Moscow State University named after M. V. Lomonosov in 1991. In 1995, he received an MBA in International Business and Finance from the University of Chicago. Marcus Rhodes joined the Board of Directors of Cherkizovo Group in February 2009. He has 30 years’ experience in auditing and accounting and has spent the last 20 years in Russia. From 1996 to 2008, he was an audit partner in the practices of Arthur Andersen and Ernst & Young, and also a director of Spartacus Private Equity Group Ltd. He has served as an independent director on the boards of directors of Phosagro Group, Rosinter Restaurants Holding and Tethys Petroleum. Mr. Rhodes earned a BA degree (Hons) in Economics from Loughborough University in England in 1982 and has been a member of the Institute of Chartered Accountants in England and Wales since 1986. He is also a member of the non-executive group of the Institute in London. GOVERNANCE SAMUEL LIPMAN NON-EXECUTIVE DIRECTOR BUSINESS REVIEW NON-EXECUTIVE DIRECTORS 51 FINANCIAL STATEMENTS 2014 ANNUAL REPORT EXECUTIVE MANAGEMENT BOARD SERGEI MIKHAILOV CHIEF EXECUTIVE OFFICER Sergei Mikhailov has been CEO of Cherkizovo Group since 2006. Previously, he was Deputy President and Chief Operating Officer of Cherkizovsky MPP from 2000 before joining AIC Cherkizovsky as Deputy President of Marketing and Sales in 2004. In the same year, he was appointed General Director of the Cherkizovsky Trade House. He founded the aTelo, Inc Telecommunications Company in 1998 in the United States, serving as a director until 2001. He was an intern at Goldman Sachs in 1997, moving to become a financial analyst at Morgan Stanley in 1999. He graduated with a BSc in Finance from Georgetown University (Washington DC) in 2000. LUDMILA MIKHAILOVA CHIEF FINANCIAL OFFICER Ludmila Mikhailova has been CFO since 2006, having previously held the posts of Deputy General Director of the Company and first Deputy President of AIC Cherkizovsky. In 2005, she was Deputy General Director of Cherkizovo Group. Mrs. Mikhailova worked as a financial analyst at General Mills Corporation Canada (Toronto) in 2004, joining from ING Barings (London) and also served at McFarlane Gordon Inc. (Toronto). Before this, she served as financial analyst at Cherkizovsky MPP for two years until 1998. Mrs. Mikhailova graduated from the Financial Academy of the Government of the Russian Federation in 1998 and also completed a Canadian Securities Course at the Canadian Securities Institute. She holds an MBA from York University (Canada), 1999. VLADISLAV BELYAEV HEAD OF IT Vladislav Belyaev has been Head of IT since February 2012. Prior to joining Cherkizovo, from 2008 to 2012 he was Head of the Enterprise Management Systems department at OJSC VimpelCom. He previously held senior positions at JSC CafeMax and OJSC Moscow Industrial Bank. He graduated from the Moscow Institute of Radio Engineering, Electronics and Automation, and also the Moscow State University named after M. V. Lomonosov. YURY DYACHUK HEAD OF LEGAL DEPARTMENT Yury Dyachuk has been Head of Cherkizovo Group’s Legal Department since 2006. He has 20 years’ legal practice experience and, in 2005, he led the legal support team during the restructuring of Cherkizovo Group. He has also served as Head of the Legal Department of AIC Cherkizovsky and was head of the Legal Department at CMPP. Mr. Dyachuk has a degree in Civil Law from the Moscow State Law Academy (1995). ALEXANDR ZHUKOVSKIY HEAD OF AGRO DIVISION Alexandr Zhukovskiy has held the position of Head of Pork division since April 2013. In 2014, he was promoted to Head of Agro Division. He has 32 years of management experience and has worked in key positions with leading international companies, notably Mars, Dancake, Eurofoods, InBev, Istok, and PepsiCo. He has experience in the management of construction projects, business integration and reorganisation, as well as training and development and safety and security. He graduated from the Air Forces Engineering Training School (Riga) and the Air Forces Academy (Moscow), with gold medals for academic excellence. 52 2014 ANNUAL REPORT GENERAL OVERVIEW ALEXEY SKOROBOGATOV HEAD OF PROCUREMENT AND LOGISTICS BUSINESS REVIEW Alexey Skorobogatov has been Cherkizovo Group’s Head of Procurement since October 2011, having spent the previous three years as Procurement Director at the Danone Nutricia Baby Food Company, responsible for Eastern Europe. Before joining Danone in 2009, he was Head of Procurement at OJSC Wimm-Bill-Dann Foods. Prior to this, he founded and headed the procurement and logistics department at OJSC MTS. He is a graduate of the Pyatigorsk State Linguistic University. SERGEY POLYAKOV HEAD OF POULTRY DIVISION GOVERNANCE Sergey Polyakov has been the Head of the Poultry Division Management Company since 2014. From 2000 to 2009 he held management positions at Sodrugestvo Group. From 2009 to 2011 he was CEO in PRODO. Before joining Cherkizovo Group, Sergei Polyakov worked at the United Grain Company OJSC, where he served as CEO and was in charge of the company’s business activities. Sergei Polyakov graduated with honours from the economics department of the European Humanities University. ANDREI KHIZHNYAK HEAD OF COMMERCIAL AND MARKETING STRATEGY ANDREY CHOLOKYAN HEAD OF MEAT PROCESSING DIVISION Andrey Cholokyan has been Cherkizovo Group’s Head of Meat Processing since 2010, and was formerly Deputy Director for Development and Marketing at the Lianozovo Sausage Plant. Before this, he held senior positions at the Ostankinsky, Biryulyovsky and Cherkizovsky meat processing plants. He is a graduate of the Moscow Technological Institute of the Meat and Dairy Processing Industry and holds a PhD in Economics. SERGEY CHUMAK HEAD OF STRATEGIC AND ORGANISATIONAL DEVELOPMENT Sergey Chumak has been the Head of Strategic and Organisational Development since 2014. He has 15 years of international experience in strategic consulting. Sergey participated in projects associated with changes in restructuring, strategy development, and the establishment of management systems for Russian and international companies in various industries (engineering, car distributing, FMCG, retail, hospitality and restaurant business, pharmacological sector, media). He has gained consulting experience in IPO launch, mergers and acquisitions. Sergey graduated from Harvard Business School (Executive programs), as well as Loyola College and the Sellinger School of Business and Management (MBA). 2014 ANNUAL REPORT 53 FINANCIAL STATEMENTS Andrei Khizhnyak took the post of Head of Commercial and Marketing Strategy in 2013. He has 17 years of management experience in marketing and sales in various markets. Prior to joining Cherkizovo Group, he worked for such companies as OJSC United Confectioners, Razgulyay-Market LLC, and the OST Group of Enterprises. From 2001 to 2004, he led the marketing activities of Cherkizovsky MPP and AIC Cherkizovsky. In 2010, he was recognised as one of the five best commercial directors in Russia, having previously also been acknowledged as one of the best directors for food marketing in 2007 by the Managers’ Association of the Russian Federation. He graduated from the Moscow State Law Academy with a specialisation in Law. DIRECTORS’ REPORT The directors present their annual report and audited financial statements for the year ending 31 December 2014. PRINCIPAL ACTIVITIES AND REVIEW OF THE BUSINESS Cherkizovo is the leading integrated diversified meat producer in the Russian Federation. Operations are structured into four divisions: Poultry division, Pork division, Meat Processing division, and Grain division. Each division, with the exception of Grain, incorporates its own distribution unit, sales unit, network of trading centres, and marketing department; each is also involved in non-core activities such as accompanying services. FUTURE DEVELOPMENTS DIRECTORS IN THE YEAR The group’s stated objective is to become the undisputed leading integrated diversified producer of meat and meat products in the Russian Federation. To achieve this aim, it will continue to modernise existing meat processing facilities, invest in its poultry facilities – and look for possible acquisitions – build new sales and distribution centres where these will increase its geographic spread, and invest in its pork and grain business. The following served as directors of the Company during the year ending 31 December 2014 (in alphabetic order): Poultry Division. Eight poultry complexes make up the Poultry division. The management believes that there are opportunities for continuing expansion, in what is a fragmented market, through acquisition as well as organic growth. Pork Division. This comprises fifteen pork complexes. GOING CONCERN Meat Processing Division. This comprises six plants at which raw meat is processed into fresh and ready-to-cook products, and a wide range of other processed products, including salamis, sausages, hams and delis. Grain Division. This has an operational land bank with more than 60,400 hectares. More information about the business is set out in the Chairman’s Statement, on pages 12 and 13 and the Chief Executive Officer’s Review, on pages 14 and 15, as well as on individual segment overviews on pages 20 to 27. 54 After reviewing the 2015 budget and longer-term plans of the Group, the directors are satisfied that, at the time of the approval of the financial statements, it is appropriate to adopt the going concern basis in preparing the financial statements of the group. • Igor Babaev Chairman of the Board • Samuel Lipman Non-Executive Director • Musheg Mamikonian Non-Executive Director • Evgeny Mikhailov Head of Investments Project Department • Sergei Mikhailov Chief Executive Officer • Vitaliy Podolskiy Non-Executive Director • Marcus Rhodes Non-Executive Director DIVIDENDS In 2014 the Cherkizovo Group paid out dividends on common shares in the amount of 1,514,264,391 roubles or 34 rubles 44 kopecks per share. 2014 ANNUAL REPORT GENERAL OVERVIEW BUSINESS REVIEW DISCLOSURE OF INFORMATION TO AUDITORS Our charter provides that our entire Board of directors may be re-elected at each Annual General Meeting. The Board is elected through cumulative voting, under which each shareholder may cast an aggregate number of votes equal to the number of voting shares he or she holds,multiplied by the number of people to be elected to the Board. Each shareholder is entitled to cast all his or her votes for one candidate or to spread them out between a number of candidates. The directors may be removed as a group at any time before the end of their terms of office, without cause, by a majority vote at a shareholder meeting. So far as each director is aware, there is no relevant audit information of which the Company’s auditors are unaware. Each director has taken all steps that he ought to have taken in his duty as a director to make himself aware of any relevant audit information and to establish that the Company’s auditors are aware of that information. GOVERNANCE ELECTION AND RE-ELECTION OF DIRECTORS FINANCIAL STATEMENTS CORPORATE SECRETARY According to Best Practice in Corporate Governance, to ensure the efficient functions of the Board of Directors and the organisation of its document flow, in June 2012 the Board of Directors appointed a corporate secretary. For the term of the current Board, from June 2014 to June 2015, Mr. Valeriy Kuprienko was elected to be Corporate Secretary. 2014 ANNUAL REPORT 55 Sales Volume (000’ Tonnes) 00M Title to be placed (000’ Tonnes) 00M 56 2014 ANNUAL REPORT GENERAL OVERVIEW FINANCIAL STATEMENTS Financial Statements 58 Shareholder Information 85 BUSINESS REVIEW STABLE GOVERNANCE HIGH PERFORMANCE AND FIRST DIVIDEND PAYOUT Earning per share (US $) FINANCIAL STATEMENTS 7.88 Dividend per share (RUB) 34.44 2014 ANNUAL REPORT 57 STATEMENT OF MANAGEMENT’S RESPONSIBILITIES FOR THE PREPARATION AND APPROVAL OF THE CONSOLIDATED FINANCIAL STATEMENTS FOR THE YEAR ENDED 31 DECEMBER 2014 Management is responsible for the preparation of consolidated financial statements that present fairly the financial position of OJSC Cherkizovo Group and subsidiaries (together “the Group”) as of 31 December 2014, and the results of its operations, cash flows and changes in equity for the year then ended, in compliance with accounting principles generally accepted in the United States of America (“US GAAP”). In preparing the consolidated financial statements, management is responsible for: • properly selecting and applying accounting policies; • presenting information, including accounting policies, in a manner that provides relevant, reliable, comparable and understandable information; • providing additional disclosures when compliance with the specific requirements in US GAAP are insufficient to enable users to understand the impact of particular transactions, other events and conditions on the Group’s consolidated financial position and financial performance; and, Management is also responsible for: • designing, implementing and maintaining an effective and sound system of internal controls throughout the Group; • maintaining adequate accounting records that are sufficient to show and explain the Group’s transactions and disclose with reasonable accuracy at any time the consolidated financial position of the Group, and which enable them to ensure that the consolidated financial statements of the Group comply with US GAAP; • maintaining statutory accounting records in compliance with Russian legislation and accounting standards; • taking such steps as are reasonably available to them to safeguard the assets of the Group; and • preventing and detecting fraud and other irregularities. The consolidated financial statements of the Group for the year ended 31 December 2014 were approved by management on 26 February 2015. • making an assessment of the Group’s ability to continue as a going concern. On behalf of the Management: 58 Sergei Mikhailov Chief Executive Officer Ludmila Mikhailova Chief Financial Officer 26 February 2015 26 February 2015 2014 ANNUAL REPORT GENERAL OVERVIEW INDEPENDENT AUDITOR’S REPORT BUSINESS REVIEW TO THE BOARD OF DIRECTORS AND SHAREHOLDERS OF OJSC CHERKIZOVO GROUP: Management’s Responsibility for the Financial Statements Management is responsible for the preparation and fair presentation of these consolidated financial statements in accordance with accounting principles generally accepted in the United States of America (“US GAAP”) and for such internal control as management determines is necessary to enable the preparation of financial statements that are free from material misstatement, whether due to fraud or error. We believe that the audit evidence we have obtained is sufficient and appropriate to provide a basis for our audit opinion. Opinion In our opinion, the consolidated financial statements present fairly, in all material respects, the consolidated financial position of the Group as of 31 December 2014, and its financial performance and its cash flows for the year then ended in accordance with accounting principles generally accepted in the United States of America. 26 February 2015 Moscow, Russian Federation Sedov Andrew, Partner (license no. 01-000487) ZAO Deloitte & Touche CIS FINANCIAL STATEMENTS Auditor’s Responsibility Our responsibility is to express an opinion on these consolidated financial statements based on our audit. We conducted our audit in accordance with Russian Federal Auditing Standards and International Standards on Auditing. Those standards require that we comply with ethical requirements and plan and perform the audit to obtain reasonable assurance about whether the consolidated financial statements are free from material misstatement. as well as evaluating the overall presentation of the consolidated financial statements. An audit involves performing procedures to obtain audit evidence about the amounts and disclosures in the consolidated financial statements. The procedures selected depend on the auditor’s judgment, including the assessment of the risks of material misstatement of the consolidated financial statements, whether due to fraud or error. In making those risk assessments, the auditor considers internal control relevant to the entity’s preparation and fair presentation of the consolidated financial statements in order to design audit procedures that are appropriate in the circumstances, but not for the purpose of expressing an opinion on the effectiveness of the entity’s internal control. An audit also includes evaluating the appropriateness of accounting policies used and the reasonableness of accounting estimates made by management, The Entity: OJSC Cherkizovo Group Independent Auditor: ZAO “Deloitte & Touche CIS” Certificate of registration in the Unified State Register № 1057748318473 of 22.09,2005, issued by Moscow Interdistrict Inspectorate of the Russian Ministry of Taxation № 46. Certificate of state registration № 018,482, issued by the Moscow Registration Chamber on 30.10,1992. Address: 5B, Lesnaya street, Moscow, Russian Federation, 125047 Certificate of registration in the Unified State Register № 1027700425444 of 13.11,2002, issued by Moscow Interdistrict Inspectorate of the Russian Ministry of Taxation № 39. Certificate of membership in «NP «Audit Chamber of Russia» (auditors’ SRO) of 20.05,2009 № 3026, ORNZ 10201017407. 2014 ANNUAL REPORT GOVERNANCE We have audited the accompanying consolidated financial statements of OJSC Cherkizovo Group and subsidiaries (together “the Group”), which comprise the consolidated balance sheet as of 31 December 2014, and the consolidated income statement, consolidated statement of comprehensive income, consolidated cash flow statement, and the consolidated statement of changes in equity for the year then ended, and a summary of significant accounting policies and other explanatory information. 59 CONSOLIDATED BALANCE SHEET As of 31 December 2014 ASSETS Current assets: Cash and cash equivalents Trade receivables, net of allowance for doubtful accounts of 1,761 and of 5,357 as of 31 December 2014 and 2013, respectively Advances paid, net of allowance for doubtful accounts of 1,384 and 2,550 as of 31 December 2014 and 2013, respectively Inventory Deferred tax assets Other receivables, net of allowance for doubtful accounts of 147 and of 466 as of 31 December 2014 and 2013, respectively Other current assets Total current assets Non-current assets: Property, plant and equipment, net Goodwill Other intangible assets, net Deferred tax assets Notes receivable, net Investments in joint venture Long-term deposits in banks Other non-current assets Total non-current assets Total assets 2014 US$000 2013 US$000 3 17,909 64,385 4 70,250 82,656 5 20 39,934 220,202 2,670 39,859 281,562 2,794 6 7 21,110 47,490 419,565 43,289 54,268 568,813 8 9 944,865 9,904 1,377,691 17,368 9 20 11 26,555 1,213 9,878 5,261 11,934 1,612 1,011,222 1,430,787 41,635 3,482 1,690 13,006 20,513 2,747 1,478,132 2,046,945 10 The accompanying notes are an integral part of these consolidated financial statements. 60 2014 ANNUAL REPORT GENERAL OVERVIEW 2013 US$000 76,703 239,390 15,179 1,144 21,645 121,113 317,223 19,192 153 28,274 Advances received 19,541 24,859 Payables for non-current assets 10,204 9,741 LIABILITIES AND SHAREHOLDERS’ EQUITY Current liabilities: Trade accounts payable Short-term borrowings Tax related liabilities Deferred tax liabilities Payroll related liabilities 12 13 20 Interest payable 3,478 3,951 389,360 9,469 533,502 253,914 1,980 1,040 194 2,965 260,093 523,812 6,760 2,241 333 1,938 535,084 15 240,019 (2,243) 15 240,112 (2,406) Other accumulated comprehensive loss (648,198) (144,613) Retained earnings Total shareholders' equity 1,173,692 763,285 859,373 952,481 Non-controlling interests 18,049 25,878 Total equity Total liabilities and equity 781,334 1,430,787 978,359 2,046,945 Non-current liabilities: Long-term borrowings Deferred tax liabilities Tax related liabilities Payables to shareholders Other liabilities Total non-current liabilities Commitments and contingencies 25 14 The accompanying notes are an integral part of these consolidated financial statements. 2014 ANNUAL REPORT 61 FINANCIAL STATEMENTS Equity: Share capital Additional paid-in capital Treasury shares 12 20 13 22 GOVERNANCE 1,603 Other payables and accruals Total current liabilities BUSINESS REVIEW 2014 US$000 CONSOLIDATED INCOME STATEMENT For the year ended 31 December 2014 2014 US$000 2013 US$000 Sales Cost of sales Gross profit 15 16 1,795,562 (1,201,452) 594,110 1,654,919 (1,296,472) 358,447 Selling, general and administrative expense Other operating income (expense), net Operating income Other (expense) income, net Financial expense, net Gain from bargain purchase 17 8 18 19 24 (258,720) 12,190 347,580 (10,350) (26,131) 38,113 (264,021) (5,762) 88,664 2,828 (25,095) - Income before income tax Income tax 20 349,212 247 66,397 (2,121) 349,459 (3,764) 345,695 64,276 189 64,465 43,851,090 7.88 43,843,090 1.47 43,851,090 43,849,900 7.88 1.47 Net income Less: Net (income) loss attributable to non-controlling interests Net income attributable to Cherkizovo Group Weighted average number of shares outstanding – basic: Net income attributable to Cherkizovo Group per share – basic (in US dollars): Weighted average number of shares outstanding – diluted: Net income attributable to Cherkizovo Group per share –diluted (in US dollars): 14 The accompanying notes are an integral part of these consolidated financial statements. 62 2014 ANNUAL REPORT GENERAL OVERVIEW CONSOLIDATED STATEMENT OF COMPREHENSIVE INCOME For the year ended 31 December 2014 BUSINESS REVIEW 2013 US$000 349,459 64,276 Other comprehensive loss Translation adjustment to presentation currency Other comprehensive loss Total comprehensive loss (515,178) (515,178) (165,719) (73,474) (73,474) (9,198) Less: Comprehensive loss attributable to non-controlling interests Comprehensive loss attributable to Cherkizovo Group 7,829 (157,890) 2,952 (6,246) Net income GOVERNANCE 2014 US$000 FINANCIAL STATEMENTS The accompanying notes are an integral part of these consolidated financial statements. 2014 ANNUAL REPORT 63 CONSOLIDATED CASH FLOW STATEMENT For the year ended 31 December 2014 2014 US$000 2013 US$000 349,459 64,276 91,138 3,033 17,312 (2,328) (12,190) (38,113) (35) 91,867 5,387 3,000 (2,419) 5,762 147 Changes in operating assets and liabilities (Increase) decrease in trade receivables Increase in advances paid (Increase) decrease in inventory Increase in other receivables and other current assets Decrease in other non-current receivables (Decrease) increase in trade accounts payable Increase in tax related liabilities Increase in other current payables (35,754) (25,485) (42,602) (12,954) 69 (8,951) 4,668 12,766 2,282 (12,935) 7,332 (19,960) 338 17,767 1,526 13,956 Total net cash from operating activities 300,033 178,326 (174,978) (165,448) 29,004 15,281 Cash flows from (used in) operating activities: Net income Adjustments to reconcile net income to net cash from operating activities: Depreciation and amortisation Bad debt expense Foreign exchange loss Deferred tax benefit (Gain) loss on disposal of property, plant and equipment Gain from bargain purchase Other adjustments, net Cash flows from (used in) investing activities: Purchases of long-lived assets Proceeds from sale of property, plant and equipment Acquisitions of subsidiaries, net of cash acquired (Note 24) Investments in joint venture Issuance of long-term loans and placing of long-term deposits Repayment on long-term loans issued Placing of deposits and issuance of short-term loans Repayment of short-term loans issued and redemption of deposits Total net cash used in investing activities (81,700) (1,130) 3,706 (3,987) (15,689) - - 1,289 (6,152) (51,432) 2,701 50,363 (243,108) (155,064) The accompanying notes are an integral part of these consolidated financial statements. 64 2014 ANNUAL REPORT GENERAL OVERVIEW BUSINESS REVIEW 2014 US$000 2013 US$000 Proceeds from long-term loans 52,305 147,025 Repayment of long-term loans (129,027) (161,328) Cash flows from (used in) financing activities: (6,984) Proceeds from short-term loans 297,367 294,743 Repayment of short-term loans (263,230) (266,317) Dividends Acquisitions of entities under common control and non-controlling interests (Note 24) (31,376) - - (1,030) Total net cash (used in) from financing activities (73,961) 6,109 Total cash from (used in) operating, investing and financing activities (17,036) 29,371 Impact of exchange rate difference on cash and cash equivalents (29,440) (6,166) Net increase in cash and cash equivalents: (46,476) 23,205 Cash and cash equivalents at the beginning of the year 64,385 41,180 Cash and cash equivalents at the end of the year 17,909 64,385 Supplemental Information: Income taxes paid 3,002 12,076 Interest paid 79,535 96,597 Subsidies for compensation of interest expense received 65,120 48,872 10,204 9,741 Non cash transactions: Property, plant and equipment acquired through vendor financing The accompanying notes are an integral part of these consolidated financial statements. 2014 ANNUAL REPORT 65 FINANCIAL STATEMENTS - GOVERNANCE Repayment of long-term loans from related parties CONSOLIDATED STATEMENT OF CHANGES IN EQUITY For the year ended 31 December 2014 Share capital Treasury shares US$000 Number of shares US$000 Number of shares Balances at 1 January 2013 Net income (loss) Other comprehensive loss Share-based compensation (Note 14) Purchase of subsidiaries Purchase of non-controlling interests and effect of legal restructuring (Note 24) Balances at 31 December 2013 15 - 43,963,773 - (2,550) 144 - (124,183) 7,000 - 15 43,963,773 (2,406) (117,183) Balances at 1 January 2014 Net income Other comprehensive loss Share-based compensation (Note 14) Dividends Balances at 31 December 2014 15 15 43,963,773 43,963,773 (2,406) 163 (2,243) (117,183) 9,000 (108,183) The accompanying notes are an integral part of these consolidated financial statements. 66 2014 ANNUAL REPORT GENERAL OVERVIEW BUSINESS REVIEW Retained earnings US$000 Other accumulated comprehensive loss US$000 Total shareholders’ equity US$000 Non-controlling interests US$000 Total equity US$000 231,402 4 - 794,908 64,465 - (72,812) (70,711) - 950,963 64,465 (70,711) 148 - 37,403 (189) (2,763) 52 988,366 64,276 (73,474) 148 52 8,706 240,112 859,373 (1,090) (144,613) 7,616 952,481 (8,625) 25,878 (1,009) 978,359 240,112 (93) 240,019 859,373 345,695 (31,376) 1,173,692 (144,613) (503,585)* (648,198) 952,481 345,695 (503,585) 70 (31,376) 763,285 25,878 3,764 (11,593) 18,049 978,359 349,459 (515,178) 70 (31,376) 781,334 FINANCIAL STATEMENTS * Other comprehensive loss is comprised of the translation adjustment associated with translating the Group’s financial statements from the Russian Rouble (functional currency) to the US Dollar (reporting currency). See Note 2. 2014 ANNUAL REPORT GOVERNANCE Additional paid-in capital US$000 67 NOTES TO THE CONSOLIDATED FINANCIAL STATEMENTS For the year ended 31 December 2014 (In thousands of USD, unless noted otherwise) 1 BUSINESS AND ENVIRONMENT The business of the Group OJSC Cherkizovo Group (the “Company”) and subsidiaries (together “the Group”) operations are spread over the full production cycle from grain and feed production and breeding to meat processing and distribution. The operational facilities of the Group include four meat processing plants, fifteen pig production complexes, six poultry production complexes, three feed mills production plants and four grain farming complexes and swine nucleus unit. The Group also operates three trading houses with subsidiaries in eight major Russian cities. The Group’s geographical reach covers Moscow, the Moscow region, the regions of Saint Petersburg, Kaliningrad, Penza, Lipetsk, Vologda, Ulyanovsk, Chelyabinsk, Tambov, Krasnodar, Ekaterinburg, Rostov-on-Don, Briansk, Voronezh, Belgorod, Kursk, Orel and Kazan. The Group is represented in the European part of Russia through its own distribution network. The Group owns locally recognised brands which include Cherkizovo («Черкизово»), Petelinka («Петелинка»), Kurinoe Tsarstvo («Куриное Царство») and Imperia Vkusa («Империя вкуса») and has a diverse customer base. At 31 December 2014 and 2013 the number of staff employed by the Group approximated 21,303 and 20,349, respectively. Operating environment Emerging markets such as Russia are subject to different risks than more developed markets, including economic, political and social, and legal and legislative risks. Laws and regulations affecting businesses in Russia continue to change rapidly, tax and regulatory frameworks are subject to varying interpretations. The future economic direction of Russia is heavily influenced by the fiscal and monetary policies adopted by the government, together with developments in the legal, regulatory, and political environment. Because Russia produces and exports large volumes of oil and gas, its economy is particularly sensitive to the price of oil and gas on the world market, which decreased significantly during 2014. Starting from March 2014, sanctions have been imposed in several packages by the U.S. and the E.U. on certain Russian officials, businessmen and companies. International credit agencies downgraded Russia’s long-term foreign currency sovereign rating with a negative outlook. In December 2014, the Central Bank of the Russian Federation significantly increased its key interest rate, which resulted in growth of interest rates on domestic borrowings. The exchange rate of the Russian Rouble depreciated significantly. These developments may result in reduced access of the Russian businesses to international capital and export markets, capital flight, further weakening of the Ruble and other negative economic consequences. The impact of further political and economic developments in Russia on future operations and financial position of the Group is at this stage difficult to determine. 2 SUMMARY OF SIGNIFICANT ACCOUNTING POLICIES Accounting principles The Group’s subsidiaries maintain their accounting books and records in accordance with Russian or foreign statutory accounting regulations, as applicable. The accompanying consolidated financial statements have been prepared in order to present the consolidated financial position, results of operations and cash flows of the Group in accordance with accounting principles generally accepted in the United States of America (“US GAAP”). The accompanying consolidated financial statements differ from the financial statements prepared for statutory purposes in Russia or foreign jurisdictions in that they reflect certain adjustments that are appropriate to present the financial position, results of operations and cash flows in accordance with US GAAP. Basis of consolidation The consolidated financial statements of the Group include the accounts of the Company and subsidiaries controlled through 68 direct ownership of the majority of the voting interests as described in Note 24. Subsidiaries acquired or disposed of during the periods presented are included in the consolidated financial statements from the date of acquisition or to the date of disposal. Business combinations under common control are accounted for in a manner similar to a pooling of interests (see Business combinations accounting policy). Foreign currency translation The functional currency of the Company, and each of its subsidiaries, is the Russian rouble. Management has selected the US Dollar as the Group’s reporting currency and translates the consolidated financial statements into US Dollars. Assets and liabilities are translated at reporting period end exchange rates. Equity items are translated at historical exchange rates. Income and expense items are translated at 2014 ANNUAL REPORT The following table summarizes the exchange rates of the Russian rouble to 1 US dollar at 31 December 2014 and 2013 and average rates during the years then ended:: as well as other immature animals purchased for breeding are initially accounted for as inventory. Immature cattle and pigs are not considered to be in service until they reach maturity, at which time their accumulated cost becomes subject to depreciation. The Group treats breeding animals as property, plant and equipment with costs to be depreciated over their useful lives, as follows: Age of transfer to property, plant and equipment, years Exchange rate 56,2584 34,9591 Sows Cattle 34,9999 36,1909 47,4243 32,7292 30,4142 Value added tax Value Added Tax (“VAT”) related to sales is payable based upon invoices issued to customers. Input VAT incurred on purchases may be offset, subject to certain restrictions, against VAT related to sales. Input VAT related to purchase transactions that are subject to offset against taxes payable after the financial statement date are recognized in the consolidated balance sheets on a net basis. 31,6130 32,7977 32,5334 The principal management estimates underlying these consolidated financial statements include estimations used in assessing long-lived assets for impairment, allowances for bad debts, valuation allowances for deferred tax assets, recognition of subsidies receivable from regional and federal authorities and valuation of assets and liabilities of acquired entities used in determining purchase price allocation. Trade receivables, advances paid and allowance for doubtful accounts Trade receivables and advances paid are stated at their originally recorded value less allowance for doubtful debts, which approximates their fair value. Advances paid represent prepayments to suppliers for goods and services which are expected to be realized within twelve months. Group companies provide an allowance for doubtful accounts based on management’s periodic review of receivables, including the turnover of account balances. Accounts receivable are written off when evidence exists that they will not be collectible. Inventory Inventory, including work in-process, is valued at the lower of cost or market value. Cost is determined using the average cost method. Cost is the sum of the expenditures and charges, direct and indirect, in bringing goods to their existing condition or location. It includes the applicable allocation of fixed production and variable overhead costs. Write downs are made for unrealizable inventory in full. Livestock Animals with short productive lives, such as poultry, are classified as inventory on the balance sheet. Full cost absorption (which includes all direct and indirect costs) is used in determining the asset value of livestock. Newborn cattle and pigs, 2014 ANNUAL REPORT Property, plant and equipment Property, plant and equipment are stated at historical cost. Depreciation is calculated on a straight-line basis over the estimated remaining useful lives of the related assets, as follows: Land Buildings and infrastructure Machinery and equipment Vehicles Cattle Sows Other Indefinite life 10-60 years 3-22 years 3-10 years 7 years 2 years 3-10 years Capitalised interest expense Interest is capitalised on expenditures made in connection with capital projects in the amount of interest expense that could have been avoided if expenditures for the assets had not been made. Interest is only capitalised for the period when construction activities are actually in progress and until the resulting properties are put into operation. Business combinations The acquisition of businesses from third parties is accounted for using the purchase method of accounting. On acquisition, identifiable assets and liabilities of an entity are measured at their fair values as at the date of acquisition. The interest of noncontrolling shareholders is stated at fair value at the date of acquisition. Acquisitions of entities under common control are accounted for on a carryover basis, which results in the historical book value of assets and liabilities of the acquired entity being combined with that of the Company. For material common control transactions the consolidated historical financial statements of the Group are retroactively restated to reflect the effect of the acquisition as if it occurred at the beginning of the earliest period presented. Consideration paid is reflected as a decrease in additional paid in capital. Investments in joint venture During the year ended 31 December 2012 the Group, together with Grupo Corporativo Fuertes, S.L., established a joint venture, LLC Tambovskaya Indeika. A joint venture is a contractual arrangement whereby the Group and other parties undertake an economic activity when the strategic financial and operating policy decisions relating to the activities of the joint venture require the unanimous consent of the parties sharing control. The Group reports its interests in joint venture using the equity method of accounting whereby an interest in the joint venture is initially recorded at cost and adjusted thereafter for post-acquisition changes in the Group’s share of net assets of the joint venture. When a Group transacts with its jointly controlled entity, profits and losses resulting from the transactions with the joint venture are recognised in the Group’s consolidated financial statements only to the extent of interests in the joint venture entity that are not related to the Group. 69 FINANCIAL STATEMENTS Cash and cash equivalents Cash and cash equivalents represent cash on hand and in bank accounts and short-term highly liquid investments having original maturities of less than three months. 2 7 GOVERNANCE Management estimates The preparation of the consolidated financial statements in conformity with US GAAP requires management to make estimates and assumptions that affect the reported amounts of assets and liabilities at the date of the consolidated financial statements and the reported amounts of sales and expenses during the reporting period. The estimates and associated assumptions are based on historical experience and other factors that are considered to be relevant. Actual results could differ from those estimates. The estimates and underlying assumptions are reviewed on an on-going basis. 1 2 BUSINESS REVIEW 31 December 2014 Average exchange rate for the first quarter of year 2014 Average exchange rate for the second quarter of year 2014 Average exchange rate for the third quarter of year 2014 Average exchange rate for the forth quarter of year 2014 31 December 2013 Average exchange rate for the first quarter of year 2013 Average exchange rate for the second quarter of year 2013 Average exchange rate for the third quarter of year 2013 Average exchange rate for the forth quarter of year 2013 Depreciation, years GENERAL OVERVIEW the weighted average rates of exchange prevailing during the reporting period (i.e. on a quarterly basis). The resulting translation adjustment is recorded as a separate component of other comprehensive (loss) income. Goodwill and other intangible assets Goodwill arising on acquisitions is recognized as an asset and initially measured at cost, being the excess of the consideration paid over the Group’s interest in the net fair value of the identifiable assets, liabilities and contingent liabilities acquired. Goodwill is not deductible for income tax purpose in the Russian Federation. Other intangible assets represent trademarks and computer software acquired. The fair value of the Group’s acquired trademarks is determined using a relief from royalty method based on expected sales by trademark. All trademarks have been determined to have an indefinite life. Management evaluates a number of factors to determine whether an indefinite life is appropriate, including product sales history, operating plans and the macroeconomic environment. Intangible assets with determinable useful lives and computer software are amortized over their useful lives. Goodwill and intangible assets deemed to have indefinite lives are reviewed for impairment at least annually or earlier if indications of impairment exist. For purposes of testing goodwill for impairment, management has determined that each segment represents a reporting unit. The Group first assess qualitative factors to determine whether the existence of events or circumstances leads to a determination that it is more likely than not that the fair value of a reporting unit is less than its carrying amount. If, after assessing the totality of events or circumstances, the Group determines it is more likely than not that the fair value of a reporting unit is less than its carrying amount, then the Group performs the two-step impairment test. The first step used to identify potential impairment involves comparing each reporting unit’s estimated fair value to its carrying value, including goodwill. The Group uses a discounted cash flow approach to estimate the fair value of its reporting units. If the estimated fair value of a reporting unit exceeds its carrying value, goodwill is considered to not be impaired. If the carrying value exceeds estimated fair value, there is an indication of potential impairment and the second step is performed to measure the amount of impairment. In estimating the fair value, the Group is required to make a number of estimates and assumptions including assumptions related to projected future cash flows, estimated growth and discount rates. A change in these underlying assumptions could cause a change in the results of the tests and, as such, could result in impairment in future periods. The second step of the process involves the calculation of an implied fair value of goodwill for each reporting unit for which step one indicated impairment. The implied fair value of goodwill is determined similar to how goodwill is calculated in a business combination, by measuring the excess of the estimated fair value of the reporting unit as calculated in step one, over the estimated fair values of the individual assets, liabilities and identifiable intangibles as if the reporting unit were being acquired in a business combination. If the implied fair value of goodwill exceeds the carrying value of goodwill assigned to the reporting unit, there is no impairment. If the carrying value of goodwill assigned to a reporting unit exceeds the implied fair value of the goodwill, an impairment charge is recorded for the excess. An impairment loss cannot exceed the carrying value of goodwill assigned to a reporting unit, and the loss establishes a new basis in the goodwill. Subsequent reversal of goodwill impairment losses is not permitted. Impairment of long-lived assets, except for goodwill and intangible assets with indefinite lives When events and circumstances occur indicating that the carrying amount of a long-lived asset (group) may not be recoverable, the Group estimates the future undiscounted cash flows expected to be derived from the use and eventual disposition of the asset (group). If the sum of the expected future cash flows (undiscounted and without interest charges) is less than the carrying amount of the long-lived asset (group), the Group then calculates impairment as the excess of the carrying value of the asset (group) over the estimate of its fair market value. Loans receivable not held for sale Loans that management has the intent and ability to hold for the foreseeable future or until maturity or payoff are reported in 70 the balance sheet at outstanding principal adjusted for any chargeoffs, an allowance for loan losses and any deferred fees or costs on originated loans, and any unamortized premiums or discounts. Notes receivable Notes receivable purchased are valued at cost upon acquisition with any discounts or premiums arising on purchase reported in the balance sheet as direct deductions / additions to the face value. Amortisation of such discounts / premiums is recorded as additions to / reductions from interest income. Notes receivable for which the Group has the intent and ability to hold to maturity are classified as held to maturity. Revenue recognition The Group derives its revenue from four main sources: sale of processed meat, poultry, pork and grain crops. Revenue is recognised when the products are shipped or when goods are received by its customer, title and risk of ownership has passed, the price to the buyer is fixed or determinable and recoverability is reasonably assured. In accordance with the Group’s standard sales terms, title is transferred and the customer assumes the risks and rewards of ownership upon shipment. However, on contracts with certain large retail chains, title transfers upon acceptance of goods by the customer at delivery. Sales made under these contracts are recognized upon acceptance by customer. Sales are recognised, net of VAT, discounts and returns. The Group grants discounts to customers primarily based on the volume of goods purchased. Discounts are based on monthly, quarterly, or annual target sales. Discounts range up to 32% for the meat processing segment and 12% for the poultry segment. No discounts are offered in the pork or grain segments. The discounts are graduated to increase when actual sales exceed target sales. Discounts are accrued against sales and accounts receivable in the month earned. Any consideration given to direct or indirect customers of the Group in the form of cash, are included in the consolidated income statements as a deduction from sales in the period to which it relates. The Group offers product guarantees to its customers, providing them with an option to return damaged and non conforming goods and goods of initial improper quality. The period that goods may be returned is set to a maximum of one month from the date of shipment. Returns are accounted for as deductions to sales in the period to which sales relate. Marketing expenses Marketing costs are expensed as incurred. Marketing expenses are reflected in selling, general and administrative expense in the accompanying consolidated income statements. Government subsidies In accordance with Russian legislation, enterprises engaged in agricultural activities receive certain subsidies. The largest of such subsidies received relate to reimbursement of interest expense on qualifying loans. The Group records interest subsidies as an offset to interest expense during the period to which they relate. The Group also regularly receives subsidies from regional authorities based on volumes of meat production and feed purchased. These amounts are recorded as reductions to cost of sales during the period to which they relate. Taxation Deferred tax assets and liabilities are recognized for the expected future tax consequences of existing differences between the financial and tax reporting bases of assets and liabilities, as well as loss carry forwards, using enacted tax rates expected to be in effect at the time these differences are realized. Under Russian tax law, the Group is precluded from filing a consolidated tax return and offsetting tax assets and tax liabilities for the different legal entities. Accordingly, deferred tax assets are offset, as appropriate, with 2014 ANNUAL REPORT Fair value of financial instruments Fair value is defined as the price that would be received to sell an asset or paid to transfer a liability in an orderly transaction between market participants at the measurement date. In determining fair value, the Group uses various valuation approaches. A hierarchy has been established for inputs used in measuring fair value that maximizes the use of observable inputs and minimizes the use of unobservable inputs by requiring that the most observable inputs be used when available. Observable inputs are inputs that market participants would use in pricing the asset or liability based on market rates obtained from sources independent of the Company. Unobservable inputs are inputs that reflect the Company’s estimates about the assumptions market participants would use in the pricing of the asset or liability based on the best information available. The hierarchy is broken down into three levels based on the reliability of inputs as follows: As of 31 December 2014, approximately 42% of accounts receivable were outstanding with three third-party customers. • Level One: Quoted prices for identical instruments in active As of 31 December 2014, approximately 15% of advances paid were outstanding with three third-party vendor for planned future purchases of raw materials. • Level Two: Inputs other than quoted prices included within Level Non-controlling interest Non-controlling interest that resulted from acquisitions that occurred before 1 January 2009 was accounted for at historical value, which is the non-controlling interest’s share in the book value of a subsidiary’s net assets on the date, when the control over a subsidiary was established by the Group. Non-controlling interest that resulted from acquisitions completed after 1 January 2009 has been accounted for at fair value as of the date when control over a subsidiary is established by the Group. Leases Leases are classified as capital leases whenever the terms of the lease transfer substantially all the risks and rewards of ownership to the lessee. All other leases are classified as operating leases. Assets held under capital leases are recognised as assets of the Group at their fair value or, if lower, at the present value of the minimum lease payments, each determined at inception of the lease. The corresponding liability is included in the balance sheet as debt from capital leases. Lease payments are apportioned between interest expense and reduction of the lease obligation so as to achieve a constant rate of interest on the remaining balance of the liability. Interest expense is charged directly against income, 2014 ANNUAL REPORT markets that are observable. 1 that are observable, either directly or indirectly. • Level Three: Unobservable inputs for the asset or liability. This hierarchy requires the use of observable market data when available. The carrying amounts of cash and cash equivalents, trade and other current receivables, trade and other payables and accruals reported in the consolidated balance sheet approximate fair value due to the short maturity of those instruments. The Group has various borrowings that are measured at amortised cost. Solely for the purpose of presentation, the Group has estimated fair value based on expected discounted cash flows incorporating interest rates on other similar debt adjusted for the Group’s estimated non-performance risk, including credit risk (Note 21). Other similar debt was determined based on rates available for similar facilities in the Russian Federation at 31 December 2014. Non-performance risk was estimated based on spreads between the rates obtained by the Group and average interest rates in the Russian Federation on other similar debt at the reporting date. Additionally, the Group has various loans and notes receivable classified as held to maturity. Solely for the purpose of presentation, the Group has estimated the fair value of these instruments based on the expected discounted cash flows incorporating the Group’s weighted average cost of capital (Note 21). Effect of accounting pronouncements adopted In July 2013, the Financial Accounting Standards Board (FASB) issued Accounting Standards Update (“ASU”) No. 2013-11, “Presentation of unrecognized tax benefit when a net operating loss carryforward, a similar tax loss, or a tax credit carryforward exists”, which amends 71 FINANCIAL STATEMENTS The maximum amount of loss due to credit risk, based on the carrying value of trade receivables, other receivables and advances paid that the Group would incur if related parties failed to perform according to the terms of contracts, was 11,602 as of 31 December 2014. GOVERNANCE Concentration of credit risk Financial instruments that potentially expose the Group to concentration of credit risk consist primarily of cash and cash equivalents, long-term deposits, accounts receivable from customers and advances paid to vendors. As of 31 December 2014 95% of total cash and cash equivalents were held in two of top 10 banks by assets in Russia and 95% of total long-term deposits were held in Gazprombank, which is one of top 5 banks by assets in Russia. Pension costs The Group makes payments for employees into the Pension fund of the Russian Federation. Effective 1 January 2012, for agro entities all contributions to the Pension fund were calculated by application of a fixed rate of 16% and taxable annual gross remuneration of each employee limited to 512,000 roubles (16 thousand USD). For all other entities of the Group contributions to the Pension fund were calculated by application of a fixed rate of 22% and taxable annual gross remuneration of each employee limited to 512,000 roubles (16 thousand USD) plus annual gross remuneration above the limit were taxable at 10%. Effective 1 January 2013 the limit for all entities increased to 568,000 roubles (18 thousand USD), the rate for agro entities increased to 21% and for all other entities of the Group remained unchanged. Effective 1 January 2014, the limit for all entities increased to 624,000 roubles (16,000 US dollars). The Group does not have any additional pension obligations other than said contributions. BUSINESS REVIEW Positions taken in the tax returns of the subsidiaries forming part of the Group may be subject to challenge by the taxing authorities upon examination. The Group recognises the benefit of uncertain tax positions in the consolidated financial statements for positions which are considered more likely than not of being sustained based on the technical merits of the position on audit by the tax authorities. The measurement of the tax benefit recognized in the consolidated financial statements is based upon the largest amount of tax benefit that, in management’s judgment, is greater than 50% likely of being realized based on a cumulative probability assessment of the possible outcomes. The Group classifies uncertain tax positions as well as penalties and fines as tax related liabilities. The Company recognizes interest and penalties accrued related to unrecognized tax positions as part of the provision for income taxes. unless it is directly attributable to qualifying assets, in which case it is capitalised in accordance with the Group’s general policy on interest costs. GENERAL OVERVIEW deferred tax liabilities at each legal entity within the Group. The effect on deferred tax assets and liabilities of changes in tax rates is recognized in the statement of operations in the period in which the enactment date changes. Deferred tax assets are reduced through the establishment of a valuation allowance at such time as, based on available evidence, it is more likely than not that the deferred tax assets will not be realized. The Group adjusts valuation allowances to measure deferred tax assets at the amount considered realizable in future periods if the Group’s facts and assumptions change. In making such determination, the Group considers all available positive and negative evidence, including future reversals of existing taxable temporary differences, projected future taxable income, tax planning strategies and recent financial operations. Topic 740 of the Codification. The update provides that a liability related to an unrecognized tax benefit should be offset against a deferred tax asset for a net operating loss carryforward, a similar tax loss or a tax credit carryforward if such settlement is required or expected in the event the uncertain tax position is disallowed. In that case, the liability associated with the unrecognized tax benefit is presented in the financial statements as a reduction to the related deferred tax asset for a net operating loss carryforward, a similar tax loss or a tax credit carryforward. In situations in which a net operating loss carryforward, a similar tax loss or a tax credit carryforward is not available at the reporting date under the tax law of the jurisdiction or the tax law of the jurisdiction does not require, and the entity does not intend to use, the deferred tax asset for such purpose, the unrecognized tax benefit should be presented in the financial statements as a liability and should not be combined with deferred tax assets. This amendment is effective prospectively for fiscal years, and interim periods within those years, beginning after 15 December 2013. The Group adopted the requirements of ASU No. 2013-11 from 1 January 2014. This adoption did not have an impact on the Group’s results of operations, financial position or cash flows. New accounting pronouncements In April 2014, the FASB issued ASU 2014-08, Reporting Discontinued Operations and Disclosures of Disposals of Components of an Entity, an amendment to FASB Accounting Standards Codification (ASC) Topic 205, Presentation of Financial Statements, and FASB ASC Topic 360, Property, Plant and Equipment. The update revises the definition of discontinued operations by limiting discontinued operations reporting to disposals of components of an entity that represent strategic shifts that have (or will have) a major effect on an entity’s operations and financial results, removing the lack of continuing involvement criteria and requiring discontinued operations reporting for the disposal of an equity method investment that meets the definition of discontinued operations. The update also requires expanded disclosures for discontinued operations, including disclosure of pretax profit or loss of an individually significant component of an entity that does not qualify for discontinued operations reporting. This ASU is effective for the Group prospectively beginning in fiscal 2015, with early adoption permitted. The adoption of this guidance is not expected to have a material impact on the Group’s consolidated results of operations, financial position or cash flows. In May 2014, the FASB issued ASU 2014-09, Revenue from Contracts with Customers, issued as a new Topic, ASC Topic 606. The new revenue recognition standard provides a five-step analysis of transactions to determine when and how revenue is recognized. The core principle of the guidance is that a Company should recognize revenue to depict the transfer of promised goods or services to customers in an amount that reflects the consideration to which the entity expects to be entitled in exchange for those goods or services. This ASU is effective for the Group beginning in fiscal 2017 and can be adopted by the Group either retrospectively or as a cumulative-effect adjustment as of the date of adoption. The Group has not yet selected a transition method and is currently evaluating the impact of the amended guidance on its consolidated financial statements. 3 CASH AND CASH EQUIVALENTS Cash and cash equivalents as of 31 December 2014 and 2013 comprised: Cash in hand Bank accounts, including bank deposits Total cash and cash equivalents 2014 US$000 2013 US$000 96 17,813 17,909 205 64,180 64,385 Bank accounts, including bank deposits, includes short-term bank deposits with original maturity of less than 3 months of 704 and 52,674 as of 31 December 2014 and 2013, respectively. 4 ALLOWANCE FOR DOUBTFUL TRADE RECEIVABLES The following table summarizes the changes in the allowance for doubtful trade receivables for the years ended 31 December 2014 and 2013: Balance at beginning of the year Additional allowance, recognized during the year Trade receivables written off during the year Translation difference Balance at end of the year 5 INVENTORY Inventory as of 31 December 2014 and 2013 comprised: Raw materials Livestock Work in-process Finished goods Total inventory 6 OTHER RECEIVABLES, NET Other receivables, net, as of 31 December 2014 and 2013 comprised: Subsidies receivable for interest expense reimbursement Subsidies receivable for purchase of feed Other receivables Allowance for doubtful other receivables Total other receivables, net 72 2014 US$000 2013 US$000 5,357 573 (2,557) (1,612) 1,761 7,986 2,273 (4,384) (518) 5,357 2014 US$000 2013 US$000 107,285 86,436 17,915 8,566 220,202 107,355 129,592 23,743 20,872 281,562 2014 US$000 2013 US$000 16,128 541 4,588 (147) 21,110 36,715 173 6,867 (466) 43,289 2014 ANNUAL REPORT Other current assets as of 31 December 2014 and 2013 comprised: VAT and other taxes receivable Spare parts Prepaid expenses Receivables from insurance company Loans receivable Other assets Total other current assets 2013 US$000 27,290 8,255 4,169 3,929 3,510 337 47,490 34,039 10,655 2,979 1,029 5,566 54,268 of approximately 50,000 heads of pigs. The units will go through the complete sanitation which will take from 3 to 6 months. All of the destroyed animals were insured and the Group expects to receive full compensation equal to their cost within the 12 months. The amount of expected compensation was accrued and included in receivables from insurance company. 8 PROPERTY, PLANT, AND EQUIPMENT, NET The carrying amounts of property, plant and equipment as of 31 December 2014 and 2013 comprised: 2013 US$000 22,323 543,106 197,261 36,041 9,865 1,356 101,886 33,027 944,865 38,667 804,449 286,106 51,841 23,925 1,923 135,601 35,179 1,377,691 2014 US$00 The following table summarizes the movements in property, plant and equipment for the year ended 31 December 2014: Balance at beginning of the year Additions Acquired through business combination (Note 24) Depreciation charge Disposals Translation difference Balance at end of the year Net book values of vehicles and machinery and equipment include 5,007 and 5,265 of leased equipment as of 31 December 2014 and 2013, respectively. Net book values of buildings, infrastructure and leasehold improvements include 3,713 and 6,055 of leased buildings and infrastructure as of 31 December 2014 and 2013, respectively. Accumulated depreciation on leased property and equipment amounted to 6,632 and 10,113 as of 31 December 2014 and 2013, respectively. FINANCIAL STATEMENTS Accumulated depreciation amounted to 295,589 and 416,737 as of 31 December 2014 and 2013, respectively. Depreciation expense amounted to 90,090 and 91,196 for the years ended 31 December 2014 and 2013, respectively, which includes depreciation of leased equipment. 1,377,691 174,978 149,044 (96,390) (18,827) (641,631) 944,865 Gain (loss) on disposal of property, plant and equipment of 12,190 and (5,762) was recognized in other operating expense, net in the consolidated income statement for the years ended 31 December 2014 and 2013, respectively. 9 GOODWILL AND OTHER INTANGIBLE ASSETS, NET Goodwill and other intangible assets as of 31 December 2014 and 2013 comprised: Goodwill Other intangible assets Total goodwill and other intangible assets, net 2014 US$000 2013 US$000 9,904 26,555 36,459 17,368 41,635 59,003 Goodwill The changes in the carrying amount of goodwill for 2014 and 2013 were as follows: Balance at 31 December 2012 US$000 Translation (loss) Balance at 31 December 2013 US$000 Translation (loss) Balance at 31 December 2014 US$000 18,452 (1,084) 17,368 (7,464) 9,904 As of 31 December 2014, management performed an annual impairment test for the meat processing and poultry reporting units and determined that goodwill was not impaired. 2014 ANNUAL REPORT GOVERNANCE Land Buildings, infrastructure and leasehold improvements Machinery and equipment Vehicles Sows Other Construction in-progress and equipment for installation Advances paid for property, plant and equipment Total property, plant and equipment, net 2014 US$000 BUSINESS REVIEW In the last week of December 2014, African Swine Fever (further ASF) was discovered at Group’s units in Orel region, which has a big population of wide boars and high ASF risks. Pigs from that unit were sent to Voronezh unit for fattening, which caused a transmission of the disease. As a result of the ASF outbreak, the Group closed two units in the Orel and Voronezh regions and slaughtered and disposed 2014 US$000 GENERAL OVERVIEW 7 OTHER CURRENT ASSETS 73 Other intangible assets 2014 US$000 Other intangible assets as of 31 December 2014 and 2013 comprised: 2013 US$000 Gross carrying amount Accumulated amortisation 4,883 (881) 21,596 - Computer software Indefinite life trademarks Other intangible assets Other intangible assets, net Net carrying amount Gross carrying amount Accumulated amortisation Net carrying amount 4,002 5,419 (1,324) 4,095 21,596 36,074 - 36,074 1,367 (410) 957 1,702 (236) 1,466 27,846 (1,291) 26,555 43,195 (1,560) 41,635 Computer software Software is amortised over its useful life ranging from two to ten years. Indefinite life trademarks Kurinoe Tsarstvo («Куриное Царство») trademark The carrying value of the Kurinoe Tsarstvo trademark was 13,675 and 22,761 as of 31 December 2014 and 2013, respectively. Cherkizovo («Черкизово») trademark The carrying value of the Cherkizovsky trademark was 7,745 and 13,313 as of 31 December 2014 and 2013, respectively. As of 31 December 2014 and 2013, management tested the Kurinoe Tsarstvo trademark for impairment and determined that the trademark was not impaired. As of 31 December 2014 and 2013, management tested the Cherkizovsky trademark for impairment and determined that the trademark was not impaired. 10 LONG-TERM DEPOSITS IN BANKS Long-term deposits in banks as of 31 December 2014 and 2013 comprised: Deposits in Gazprombank Deposits in Odinbank Long-term deposits in banks Effective % Maturity 2014 US$00 2013 US$000 8% 10.5% 2019 2017 11,400 534 11,934 19,596 917 20,513 Effective % Maturity 2014 US$00 2013 US$000 2.75% 8.36% 2022 2014 9,878 9,878 1,690 1,690 11 NOTES RECEIVABLE, NET Notes receivable, net as of 31 December 2014 and 2013 comprised: Tambovskaya Indeika Gazprombank Notes receivable 12 BORROWINGS Borrowings of the Group as of 31 December 2014 and 2013 comprised: Capital leases Bonds Bank loans Lines of credit Loans from government Other borrowings 2014 US$00 2013 US$000 Interest rates WAIR* EIR** Current Non-current Current Non-current 10.91%-15.30% 9.75% 9.50%-15.00% 8.00%-15.60% 14.12% 9.75% 11.60% 10.91% 14.12% 9.75% 4.97% 4.00% 1,215 45,179 192,996 239,390 4,606 44,438 54,170 149,356 117 1,227 253,914 493,304 803 91,909 224,511 317,223 7,076 76,384 2,099 435,441 201 2,611 523,812 841,035 Total borrowings * * WAIR represents the weighted average interest rate on outstanding loans. ** EIR represents the effective rate on borrowings at year end, adjusted by government subsidies for certain qualifying debt. Since approvals for subsidies are submitted annually by the Group as required by law, the existence of such subsidies in any given year is not necessarily indicative of their existence in future periods. See Note 19 for further disclosure of government subsidies related to interest on borrowings. The contractual maturity of long-term borrowings (excluding capital leases) for the six years ending 31 December 2020 and thereafter is as follows: Maturity of long-term borrowings Total borrowings 2015 US$000 2016 US$000 2017 US$000 2018 US$000 2019 US$000 2020 US$000 >2010 US$000 92,825 119,311 46,832 29,305 16,279 11,736 25,845 Total US$000 342,133*** *** Calculated as total non-current borrowings less non-current capital leases plus current portion of non-current borrowings (excluding capital leases). 74 2014 ANNUAL REPORT Capital leases As of 31 December 2014 and 2013, the Group used certain fixed assets under leasing contracts that qualified for treatment as capital leases. The lower of the incremental borrowing rate and the rate implicit in the lease agreement was used in capitalizing the leases. Interest on the majority of borrowings is paid on a monthly or quarterly basis, with the exception of bonds, for which the interest is paid on a semi-annual basis. The total minimum lease payments due under these lease agreements comprised: Payments falling due 2014 US$000 2013 US$000 Total minimum lease payments US$000 Portion related to interest US$000 Total minimum lease payments US$000 Portion related to interest US$000 1,914 699 1,774 971 1,588 547 1,741 868 In year three 1,323 420 1,731 756 630 In year four 900 315 1,708 In year five 639 251 968 511 2,140 451 4,897 1,204 8,504 2,683 12,819 4,940 Bank loans Gazprombank Borrowings from Gazprombank consist of four short-term rouble denominated loans with interest ranging from 11.0% to 13.5% per annum and three long-term rouble denominated loan with interest ranging from 10.8% to 13.0% per annum. The amount outstanding of short-term loans and long-term loans was 48,133 as of 31 December 2014. Rosselhozbank Borrowings from Rosselhozbank consist of two short-term rouble denominated loans with interest 10.0% per annum and seven long-term rouble denominated loans with interest ranging from 12.0% to 15.0% per annum. The amount outstanding of the shortterm and long-term loans were 5,333 and 35,419 as of 31 December 2014 and 31 December 2013, respectively. Lines of credit Savings Bank of Russia Borrowings from the Savings Bank of Russia consist of twenty eight rouble denominated lines of credit with interest ranging from 8.6% to 13.0% per annum. Several of these instruments are guaranteed by related parties. Some of these facilities are guaranteed by municipal authorities. Principal payments are due from 2015 to 2019. The amount outstanding was 202,567 and 375,382 as of 31 December 2014 and 31 December 2013, respectively. Gazprombank Borrowings from Gazprombank consist of seven rouble denominated lines of credit with interest ranging from 9.1% to 11.5% per annum. Some of these facilities are guaranteed by related parties. Principal 2014 ANNUAL REPORT Bank Zenith Borrowings from Bank Zenith consist of four long-term rouble denominated lines of credit with an interest rate of 13.0% per annum. Some of these facilities are guaranteed by related parties. Principal is due upon maturity up to 2016. The amount outstanding was 10,439 and 34,506 as of 31 December 2014 and 31 December 2013, respectively. Rosselhozbank Borrowings from Rosselhozbank consist of nineteen rouble and one euro denominated lines of credit with fixed interest rates ranging from 10.0% to 15.0% per annum. Some of these facilities are guaranteed by related parties. Principal payments are due from 2015 to 2020. The amount outstanding was 31,392 and 137,748 for rouble denominated and 305 and 2,475 for euro denominated lines of credit as of 31 December 2014 and 31 December 2013, respectively. VTB Bank Borrowings from VTB consist of thirty one rouble denominated lines of credit with interest rates ranging from 10.99% to 15.6% per annum. Principal payments are due from 2015 to 2017. The amount outstanding was 34,520 as of 31 December 2014. Unused lines of credit The total amount of unused credit on lines of credit as of 31 December 2014 is 314,293. The unused credit can be utilized from 2015 to 2016 with expiration of available amounts varying as follows: 55,351 expires by 31 December 2015, 258,942 expires by December 2016. Other borrowings Other borrowings primarily represent unsecured loans from shareholders and contractors with interest rates 0%. Principal payments are due from 2015 to 2020. Collateral under borrowings Shares of and participating interests in the following Group companies are pledged as collateral under certain borrowings as of 31 December 2014: • JSC Vasiljevskaya – 51%; • LLC Cherkizovo Pork – 100%; • LLC Tambovmyasoprom – 51%; • LLC Kurinoe Tsarstvo – Bryansk – 99%; 75 FINANCIAL STATEMENTS Savings Bank of Russia Borrowings from Savings Bank of Russia consist of one long-term rouble denominated loan with an interest rate of 9.5% per annum. Principal of the long-term loan is due on maturity in 2016. Amount outstanding was 10,462 as of 31 December 2014. payments are due from 2015 to 2022. The amount outstanding was 63,143 and 109,841 as of 31 December 2014 and 31 December 2013, respectively. GOVERNANCE Bonds Bonds due in April 2016 In April 2014, the Group placed 3,000,000 bonds in roubles (95,831) at par value (1,000 roubles or 31.62 USD at the issuance date) with a maturity date in April 2016. The Group accounts for these instruments at amortized cost. 500,000 (15,812) of these bonds were purchased by a Group company upon issuance, for the purpose of selling on the market when funds are required; such bonds have not, to date, been sold on the market. The remaining 2,500,000 bonds (44,438 using the 31 December 2014 exchange rate) held by third parties are presented as non-current debt as of 31 December 2014. The coupon rate on the bonds, payable semi-annually, is set at 9.75% per annum. BUSINESS REVIEW Within one year In year two After year five GENERAL OVERVIEW As of 31 December 2014, the Group’s borrowings were denominated in the following currencies: 492,999 in Russian roubles, 305 in Euro. As of 31 December 2013, the Group’s borrowings were denominated in the following currencies: 834,519 in Russian roubles, 2,626 in Euro and 3,890 in USD. • CJSC Agroresurs-Voronezh– 100%; • LLC Resurs (Tambov) – 100%; • CJSC LipetskMyaso – 100%; • JSC Kurinoe tsarstvo – 98%; • LLC Lisko Broiler – 99%. Inventory with a carrying value of 14,681 and 39,469 was pledged as security under certain borrowings as of 31 December 2014 and 31 December 2013, respectively Property, plant and equipment with a carrying value of 338,202 and 606,703 was pledged as security under loan agreements as of 31 December 2014 and 31 December 2013, respectively. Certain significant loan agreements contain covenants requiring the maintenance of minimum revenue turnover through accounts at the respective banks. Certain significant loan agreements with the Savings Bank of Russia, Gazprombank, VTB Bank and Rosselkhozbank contain financial covenants requiring maintenance of specific debt or net debt to EBITDA ratios. The Group is in compliance with these covenants as of 31 December 2014. 13 TAX RELATED LIABILITIES Current tax related liabilities as of 31 December 2014 and 2013 comprised: Value added tax Payroll related taxes Property tax payable Personal income tax withheld Transportation tax Other taxes Total short-term tax related liabilities Non-current tax related liabilities as of 31 December 2014 and 2013 comprised: Corporate income tax Payroll related taxes Value added tax Total long-term tax related liabilities 14 SHAREHOLDERS’ EQUITY Share capital As of 31 December 2014 and 2013, issued shares of the Company had a par value of 0.01 roubles. The total number of authorized shares was 54,702,600 and the number of issued shares was 43,963,773 (share capital amounted to 15 at 31 December 2014 and 2013). The number of outstanding shares as of 31 December 2014 was 43,855,590. All issued and outstanding shares have equal voting rights. The Company is authorized to issue preferred shares not exceeding 25% of its ordinary share capital. No such shares are currently issued. Dividends In accordance with Russian legislation, earnings available for dividends are limited to retained earnings of the Company, calculated in accordance with statutory rules in local currency. In respect of 2012 and 2013, dividends of approximately RUB 34.44 (USD 0.72) per share (31,376 in total) were approved at the extraordinary shareholders’ meeting on 10 November 2014 and have been fully paid during the year ended 31 December 2014. Shares granted to employees in 2011 In 2011 the controlling shareholder of the Group and one of the Group’s subsidiaries have entered into two share compensation agreements directly with management relating to outstanding shares held by the controlling shareholder and treasury shares, respectively. The total amount of shares covered by the agreements was 38,000 (57,000 GDR’s) with multiple service periods ranging through June 2014 as follows: • 10,000 shares (15,000 GDR’s) with a service period through December 2011, including 3,000 shares from the controlling shareholder and 7,000 from treasury (such options were exercised during the year ended 31 December 2012). 76 2013 US$000 9,279 2,309 1,883 1,122 104 482 15,179 11,434 2,612 2,820 1,764 127 435 19,192 2014 US$000 2013 US$000 1,033 7 1,040 2,227 11 3 2,241 • 10,000 shares (15,000 GDR’s) with a service period through December 2012, including 3,000 shares from the controlling shareholder and 7,000 from treasury (such options were exercised during the year ended 31 December 2013). • 18,000 shares (27,000 GDR’s) with a service period through June 2014, including 9,000 shares from the controlling shareholder and 9,000 from treasury (such options were exercised during the year ended 31 December 2014). Under the share compensation agreements management has the right to purchase shares at par value (0.01 roubles) after the end of each respective service period. Management estimated the fair value of share options at the grant date at 950. During the years ended 31 December 2014 and 2013 the Group recognized management remuneration amounting to 71 and 148, respectively, relating to share based payments. Total compensation cost related to nonvested awards not yet recognized at 31 December 2014 and 2013 equals nil and 71, respectively. During the years ended 31 December 2014 and 2013 18,000 and 10,000 options were exercised by management of the Group, respectively, and there were no forfeitures or cancellations. The additional management remuneration recognized as a result of share options granted had no impact on total income tax provisions for the Group as such remuneration is not tax deductible in the Russian Federation. Earnings per share Earnings per share for the years ended 31 December 2014 and 2013 have been determined using the weighted average number of Group shares outstanding over the period. The calculation of weighted average number of shares outstanding after dilution for the reporting periods was as follows: Weighted average number of shares outstanding - basic Add back incremental treasury shares in respect of share options Weighted average number of shares outstanding - diluted 2014 US$000 2014 2013 43,851,090 43,851,090 43,843,090 6,810 43,849,900 2014 ANNUAL REPORT 2014 US$000 2013 US$000 Produced goods and goods for resale Other sales Sales volume discounts Sales returns Total sales 1,873,992 32,832 (92,932) (18,330) 1,795,562 1,689,306 61,878 (81,402) (14,863) 1,654,919 Cost of sales for the years ended 31 December 2014 and 2013 comprised: 2014 US$000 2013 US$000 Raw materials and goods for resale Personnel (excluding pension costs) Depreciation Utilities Pension costs Other Total cost of sales 846,646 144,591 82,422 73,750 25,445 28,598 1,201,452 929,262 153,738 85,393 74,715 27,539 25,825 1,296,472 GENERAL OVERVIEW 15 SALES Sales for the years ended 31 December 2014 and 2013 comprised: 16 COST OF SALES Most of the subsidies received in the year ended 31 December 2013 relate to government compensation to agricultural producers who suffered from a significant price increase for mixed feed in the fourth quarter of 2012. BUSINESS REVIEW Raw materials and goods for resale include as an offset subsidies received from local governments in the amount of 2,125 and 24,793 for the years ended 31 December 2014 and 2013, respectively. These subsidies were received based on the amount of meat produced. 17 SELLING, GENERAL, AND ADMINISTRATIVE EXPENSE Selling, general and administrative expense for the years ended 31 December 2014 and 2013 comprised: 2013 US$000 96,087 29,288 17,627 15,944 14,799 14,085 13,382 10,969 8,716 4,768 3,033 2,930 2,897 3,585 1,049 1,148 2,373 16,040 102,072 29,755 16,671 15,443 12,083 13,759 7,705 13,729 6,474 5,437 5,387 3,978 3,205 2,860 1,588 1,762 1,606 20,507 258,720 264,021 2014 US$000 2013 US$000 6,978 (17,312) (16) (10,350) 5,719 (3,000) 109 2,828 2014 US$000 2013 US$000 25,101 1,030 26,131 24,586 509 25,095 18 OTHER (EXPENSE) INCOME NET Other (expense) income, net for the years ended 31 December 2014 and 2013 comprised: Interest income Foreign exchange loss Other (expense) income, net Total other (expense) income, net 19 FINANCIAL EXPENSE, NET Financial expense, net for the years ended 31 December 2014 and 2013 comprised: Interest expense, net of subsidies Capital lease expense Total financial expense, net In accordance with Russian legislation, enterprises engaged in agricultural activities and enterprises involved in purchasing meat receive subsidies on certain qualifying loans. The Group has accounted for such subsidies by reducing the interest expense on the associated loans by 51,614 and 70,111 for the years ended 31 December 2014 and 2013, respectively. 2014 ANNUAL REPORT Interest expense capitalised in the years ended 31 December 2014 and 2013 was 2,895 and 4,564 (net of subsidies of 4,369 and 3,324), respectively. 77 FINANCIAL STATEMENTS Total selling, general and administrative expense 2014 US$000 GOVERNANCE Personnel (excluding pension costs) Transportation Pension costs Materials and supplies Rent expenses Taxes (other than income tax) Advertising and marketing Security services Depreciation and amortisation Audit, consulting and legal fees Bad debt expense Utilities Veterinary services Information technology and communication services Bank charges Repairs and maintenance Insurance Other 20 INCOME TAX The income tax benefit (expense) for the years ended 31 December 2014 and 2013 comprised: Current provision Deferred tax benefit Income tax benefit (expense) Most of the Group’s taxes are levied and paid in the Russian Federation. 2014 US$000 2013 US$000 (2,081) 2,328 247 (4,540) 2,419 (2,121) Under Russian legislation, the statutory income tax rate for entities designated as agricultural entities is 0%. The statutory tax rate for non-agricultural entities is 20%. The income tax (benefit) expense can be reconciled to the theoretical tax provision at the statutory rate for the years ended 31 December 2014 and 2013 as follows: Income before income tax Income before income tax of entities taxed at zero rates (agricultural entities and other tax regimes) Income before income tax of generally taxed entities Statutory tax rate (agricultural entities and other tax regimes) Statutory tax rate (General) Theoretical income tax expense at the statutory tax rate (General) for generally taxed entities Expenses not deductible for Russian statutory taxation purposes, net Gain from bargain purchase Other permanent differences Change in valuation allowance Actual income tax provision Deferred tax assets/(liabilities) arising from tax effect of temporary differences: Property, plant and equipment and intangibles Trade receivables Loss carry forward Valuation allowance Other assets and liabilities Net deferred tax asset (liability) At 31 December 2014 and 2013, temporary differences associated with undistributed earnings of subsidiaries were not recognized in these consolidated financial statements, because the Group is in a position to control the timing of the reversal of such temporary differences and it is probable that such differences will not reverse in the foreseeable future. 2014 US$000 2013 US$000 349,212 66,396 336,467 12,745 0% 20% 2,549 4,307 (7,623) 520 (247) 43,876 22,520 0% 20% 4,504 1,476 (590) (3,269) 2,121 2014 US$000 2013 US$000 (5,825) (2,142) 4,456 (167) 4,436 759 (8,289) 1,132 4,018 (265) 2,767 (637) The valuation allowance is attributable to tax loss carryforwards which are not expected to be utilised by management. As the Group does not have a legal right to offset deferred tax assets and deferred tax liabilities between different legal entities, management expects that the Group will not be able to utilize all of the tax loss carryforwards as certain of the Group’s subsidiaries are expected to have operating losses in the future. The Group’s tax loss carryforwards expire as follows: 2017 US$000 2018 US$000 2019 US$000 2020 US$000 2021 US$000 2022 US$000 2023 US$000 2024 US$000 280 125 66 113 782 1,801 4,594 14,519 Tax loss carry forwards Total amount of tax loss carryforwards, against which valuation allowance was created, equalled 835 as of 31 December 2014. Total US$000 22,280 2014 US$000 2013 US$000 Deferred tax asset – long-term portion Deferred tax liability – long-term portion Long-term deferred tax liability, net 1,213 (1,980) (767) 3,482 (6,760) (3,278) Deferred tax asset – current Deferred tax liability – current Current deferred tax asset, net Total deferred tax asset (liability), net 2,670 (1,144) 1,526 759 2,794 (153) 2,641 (637) (637) (932) 2,328 759 (2,779) (277) 2,419 (637) The movements in the net deferred tax liability for the years ended 31 December 2014 and 2013 comprised: Net deferred tax liability, beginning of the year Impact of translation gain (loss) and other adjustments Deferred tax benefit Net deferred tax asset (liability), end of the year 78 2014 ANNUAL REPORT The carrying values and fair values of the Group’s loans and notes receivable, long-term deposits in banks and borrowings with the exception of capital leases, as of 31 December 2014 and 2013 are as follows: Loans receivable* Long-term deposits in banks Notes receivable, net Borrowings other than capital leases ** (Note 12) 2014 US$000 2013 US$000 Carrying value Fair value Carrying value Fair value 3,510 11,934 9,878 487,483 3,296 8,413 4,813 462,835 790 1,690 833,156 507 1,282 800,178 GENERAL OVERVIEW 21 FAIR VALUE OF FINANCIAL INSTRUMENTS * Loans receivable include both the long-term loans to affiliates and short-term loans receivable. ** Cost of debt of 13.9% was applied, which did not include the effect of subsidies for interest expense. 22 RELATED PARTIES Trading transactions Trading transactions with related parties comprise mostly of purchases of grain crops from and rendering of storage services to TZK NAPKO, Agrarnaya Gruppa and CJSC Penzamyasoprom. The Group also sells sausages, raw meat and poultry to a retail chain “Myasnov”. All noted related parties are entities under common ownership and control with the Group. Trade receivables, trade payables and advances issued are associated with such transactions. The Group expects to settle such balances in the normal course of business. During the year ended 31 December 2012 the Group also received an advance from its joint venture (Tambovskaya Indeika) for future supply of machinery and equipment to be purchased by the Group and resold to the joint venture. Financing transactions During the year ended 31 December 2014 сertain shareholders have personally guaranteed certain of the bank loans and lines of credit for a total amount of 23,776. During the year ended 31 December 2014, the Group loaned 9,878 to its joint venture Tambovskaya Indeika. The notes are unsecured, denominated in RUB with a fixed interest rate of 2.75% per annum. The notes are payable, together with interest, after 8 years. Balances Trade receivables Other non-current receivables Advances paid Advances paid for property, plant and equipment Other receivables Trade payables Other payables Long-term borrowings Long-term payables to shareholders For the years ended 31 December 2014 and 2013, transactions with companies under common control are summarized as follows: the Group identified an error in comparative information in the related party note related to omission of disclosure of transactions and balances with the related party Myasnov. In 2013, sales to Myasnov were approximately USD 50 million. As required Balances Trade receivables Advances paid Other receivables Trade payables Advances received Other payables Notes receivable, net For the years ended 31 December 2014 and 2013, transactions with the Group’s joint ventures are summarized as follows: 2014 ANNUAL REPORT 3,675 1,095 447 2,274 178 256 13 97 166 5,117 2,134 556 193 1,010 86 687 333 2014 US$000 2013 US$000 56,604 3,973 1,129 2,591 15,089 51,575 2,986 830 171 18,702 by US GAAP, comparative information in the note for the year ended 31 December 2013 has been retrospectively adjusted for a correction of the error. As of 31 December 2014 and 2013 balances with the Group’s joint ventures are summarized as follows: Transactions Sales Rent income Purchases of goods and other services 2013 US$000 2014 US$000 2013 US$000 (restated)* 68 2,573 1,292 65 10,851 9,878 75 666 186 14,666 47 - 2014 US$000 2013 US$000 (restated)* 162 135 3,323 159 23 766 79 FINANCIAL STATEMENTS Transactions Sales Rent income Purchases of security services Purchases of property, plant and equipment Purchases of goods and other services 2014 US$000 GOVERNANCE As of 31 December 2014 and 2013 balances with companies under common control are summarized as follows: * BUSINESS REVIEW Related parties include shareholders, entities under common ownership and control with the Group, members of key management personnel and affiliated companies. The Company and its subsidiaries enter into various transactions with related parties such as the sale and purchase of inventory. In addition, the Group enters into financing transactions with related parties. 23 SEGMENT REPORTING The Group’s operations are divided into four segments by types of products produced: meat processing, poultry, pork and grain. Substantially all of the Group’s operations are located within the Russian Federation. All segments have different segment managers responsible for the segments’ operations. The chief operating decision maker (the Chief Executive Officer) is the individual responsible for allocating resources to and assessing the performance of each segment of the business. The meat processing segment is involved in the production of a wide range of meat products, including sausages, ham and raw meat. The pork and poultry segments produce and offer distinctive products, such as semi-finished poultry products, raw meat, eggs and other poultry meat products in the poultry segment and raw pork meat in the pork segment. The grain segment was acquired by the Group in May 2011 together with Mosselprom and is involved in the farming of wheat and other crops. All four segments are involved in other business activities, including production of dairy and other services, which are non-core business activities. The Group evaluates segment performance based on income before income tax. The Group accounts for inter-segment sales and transfers as if the sales or transfers were to third parties. The accounting policies of the segments are the same as those described in the summary of significant accounting policies. Segment information at 31 December 2014 and for the year then ended comprised: Total sales including other sales including sales volume discounts Intersegment sales Sales to external customers Meat Processing US$000 Poultry US$000 Pork US$000 Grain US$000 Corporate US$000 Intersegment Total consolidated US$000 US$000 570,287 990,491 437,862 40,693 746 (244,517) 1,795,562 1,007 33,304 7,284 798 746 (10,307) 32,832 (59,090) (33,842) - - - - (92,932) (487) (32,019) (182,793) (29,218) - 244,517 - 569,800 958,472 255,069 11,475 746 - 1,795,562 (488,598) (692,974) (230,430) (22,708) (1,097) 234,355 (1,201,452) 81,689 297,517 207,432 17,985 (351) (10,162) 594,110 (73,514) (114,958) (17,752) (8,730) (34,271) 2,695 (246,530) 8,175 182,559 189,680 9,255 (34,622) (7,467) 347,580 Other income (expense), net (3,639) 23,470 (1,087) 17 (12,671) (16,440) (10,350) Financial expense, net (7,186) (10,862) (11,022) (3,538) (9,963) 16,440 (26,131) - - - - 38,113 - 38,113 Segment profit (2,650) 195,167 177,571 5,734 (19,143) (7,467) 349,212 Supplemental information Expenditure for segment property, plant and equipment Depreciation and amortisation expense 19,067 72,254 68,917 10,623 4,117 - 174,978 10,393 49,881 26,424 3,452 988 - 91,138 (771) 229 893 26 (624) - (247) Cost of sales Gross profit Operating expense Operating income Gain from bargain purchase Income tax expense (benefit) 80 2014 ANNUAL REPORT Total sales including other sales including sales volume discounts Intersegment sales Sales to external customers Meat Processing US$000 Poultry US$000 Pork US$000 Grain US$000 Corporate US$000 Intersegment Total consolidated US$000 US$000 571,593 844,350 338,770 26,765 566 (127,125) 1,654,919 269 44,433 15,161 2,015 - - 61,878 (51,744) (29,658) - - - - (81,402) (229) (16,229) (97,203) (13,428) (36) 127,125 - 571,364 828,121 241,567 13,337 530 - 1,654,919 (1,296,472) (431,332) (692,308) (281,577) (18,566) (525) 127,836 140,261 152,042 57,193 8,199 41 711 358,447 Operating expense (88,135) (114,844) (33,936) (5,283) (26,874) (711) (269,783) 52,126 37,198 23,257 2,916 (26,833) - 88,664 Operating income Other income (expense), net (858) 8,371 (221) 11 14,282 (18,757) 2,828 (10,139) (8,812) (10,481) (881) (13,539) 18,757 (25,095) Segment profit 41,129 36,757 12,555 2,046 (26,090) - 66,397 Supplemental information Expenditure for segment property, plant and equipment Depreciation and amortisation expense 28,963 75,832 36,296 17,968 2,050 - 161,109 9,211 43,846 35,725 2,185 900 - 91,867 1,333 608 45 69 66 - 2,121 Financial expense, net Income tax expense (benefit) 2014 US$000 2013* US$000 Meat Processing Poultry Pork Grain Total for reportable segments Corporate assets and intersegment eliminations Total assets 187,610 791,407 501,088 50,256 1,530,361 (99,574) 1,430,787 281,072 1,017,146 746,724 69,624 2,114,567 (67,622) 2,046,945 * GOVERNANCE The reconciliation between segment assets and total assets per the consolidated balance sheets as of 31 December 2014 and 2013 is as follows: BUSINESS REVIEW Cost of sales Gross profit GENERAL OVERVIEW Segment information at 31 December 2013 and for year then ended comprised: During the year ended 31 December 2014 the Group changed presentation of segment assets in the segment note. Since that period the Group excludes investments of holding company from corporate assets and correspondingly increases assets of reportable segments with such amounts. The comparative information for the year ended 31 December 2013 has been retrospectively adjusted to reflect the change in the segment reporting, in order to increase comparability. Operating expenses include selling, general and administrative expense and other operating expense, net. FINANCIAL STATEMENTS Corporate does not represent a segment. Items included within Corporate represent reconciling items between the balances of the reportable segments, and the consolidated totals for the Group, and include payroll and other expenses of the holding company. Corporate assets comprise cash in bank received from both the issuance of new shares and bond issues and certain other assets. 2014 ANNUAL REPORT 81 24 SUBSIDIARIES, ACQUISITIONS, DIVESTITURES Subsidiaries As of 31 December 2014 and 2013, the Company controlled all meat processing and agricultural companies through its 100% ownership in OJSC Cherkizovsky Meat Processing Plant, AIC Mikhailovsky Ltd. and CJSC Mosselprom. As of 31 December 2014 and 2013, the Group included the following principal companies: Name of company Legal form Nature of business OJSC Cherkizovsky Meat Processing Plant (JSC CMPP) LLC PKO Otechestvennyi Product LLC Cherkizovo-Kashira (Cherkizovo-Kashira Ltd.) TPC Cherkizovo Ltd. (Cherkizovo-2) CJSC Petelinskaya OJSC Vasiljevskaya OJSC Kurinoe Tsarstvo CJSC Kurinoe Tsarstvo Bryansk CJSC Mosselprom LLC Lisko Broiler LLC Petelino Trade House Open Joint Stock Company Meat processing plant Limited Liability Company Limited Liability Company Meat processing plant Meat processing plant Limited Liability Company Closed Joint Stock Company Open Joint Stock Company Open Joint Stock Company Closed Joint Stock Company Closed Joint Stock Company Limited Liability Company Limited Liability Company CJSC Botovo LLC Cherkizovo-Pork LLC Kuznetsovsky Kombinat LLC Tambovmyasoprom LLC Budenovets Agrofirm LLC Lipetskmyaso LLC RAO Penzenskaya Grain Company (PZK) LLC Orelselprom Closed Joint Stock Company Limited Liability Company Limited Liability Company Limited Liability Company Limited Liability Company Limited Liability Company Limited Liability Company Procurement company Raising poultry Raising poultry Raising poultry Raising poultry Raising poultry Raising poultry Trading company: distribution of poultry Pig breeding Pig breeding Pig breeding Pig breeding Pig breeding Pig breeding Pig breeding LLC Resurs LLC Agroresurs-Voronezh LLC Cherkizovo-Feed Production LLC TD Myasnoe Tsarstvo Limited Liability Company Limited Liability Company Limited Liability Company Limited Liability Company LLC Voronezhmyasoprom Limited Liability Company LLC Cherkizovo-Grain Production Limited Liability Company Limited Liability Company Acquisition of LISKO Broiler On 24 March 2014, the Group completed an acquisition of 100% of the share capital of ZAO LISKO Broiler (“LISKO”) for cash consideration of 90,180 of which 86,655 has been paid as of 31 December 2014 (presented in the cash flow statement net of cash acquired of 4,955) and 1,401 is payable upon completion of ownership registration of certain land plots. The residual difference relates to translation difference. LISKO is the largest poultry producer in the Voronezh Region and one of the market leaders in the Central and Southern Federal Districts. Based on Russian Poultry Union data, LISKO ranks seventh among top poultry producers with a 2% nationwide market share in volume. Its production capacity is approximately 95,000 tonnes (live weight) per year. LISKO’s full-cycle production assets that will be integrated to Cherkizovo Group include (all LISKO production facilities are built in accordance with modern standards and are highly efficient): • 7 poultry production facilities; • 4 parent flock sites with a slaughtering facility of 4,000 heads per hour; 82 Pig breeding and grain crops cultivation Pig breeding Pig breeding Mixed feed production Trading company: distribution of pork Genetic pig breading and grain crops cultivation Grain crops cultivation % 31.12,2014 % 31.12,2013 95% 95% 95% 95% 95% 95% 88% 100% 100% 100% 100% 100% 95% 95% 88% 100% 100% 100% 100% - 88% 76% 100% 100% 100% 100% 100% 88% 76% 100% 100% 99% 100% 100% 100% 100% 100% 100% 100% 100% 100% 100% 100% 100% 100% 100% 100% 100% 100% 100% • 2 reproduction flock sites; • Slaughtering complex with capacity of 9,000 heads per hour; • Hatchery with capacity of 80 million eggs per year; • Feed mill with 40 tonnes per hour capacity; • Grain storage facility with overall storage capacity of 100,000 tonnes; • Meat and bone meal production facility; • Rendering facility. The results of LISKO’s operations have been included in the consolidated financial statements from the acquisition date. In the condensed consolidated interim financial statements for the six month ended 30 June 2014 the acquisition was accounted for using historical book values as provisional values based on the assumption that the historical book values were equivalent to fair value at the date of acquisition since there was no other information available at that time. 2014 ANNUAL REPORT Purchase price Inventory Other current assets Property, plant and equipment Trademarks Short-term loans and finance leases Other current liabilities Long-term loans and finance leases Total assets acquired and liabilities assumed Goodwill / (gain from bargain purchase) recognized on acquisition 89,356 25,924 8,917 97,515 (12,304) (7,889) (36,810) 75,353 14,003 90,180 26,372 8,917 149,044 963 (12,304) (7,889) (36,810) 128,293 (38,113) and was selling non-core business to a strategic investor. The following pro forma financial information presents consolidated income statements as if the acquisition occurred as of the beginning of the prior annual reporting period (1 January 2013). In determining proforma amounts, all non-recurring costs were determined to be immaterial. Pro forma information is presented for all preceding comparative periods: Pro forma Information Sales Operating income Net income Weighted average number of shares outstanding Earnings per share (USD) For the year ended 31 December 2014 US$000 (UNAUDITED) For the year ended 31 December 2013 US$000 (UNAUDITED 1,826,052 350,449 352,288 43,851,090 8.03 1,806,607 92,131 68,692 43,843,090 1.57 Actual results of LISKO Broiler from the date of acquisition (24 March 2014) to 31 December 2014 US$000 Sales Operating income Net income Legal restructuring in meat processing segment In April 2013, 8 companies of the meat processing segment were transferred to JSC Cherkizovsky Meat Processing Plant (JSC CMPP) by the means of exchange of additionally issued shares of JSC CMPP for shares of the aforementioned 8 companies. The Group paid 1,009 in cash to certain holders of non-controlling interests in these 8 companies, who executed their right to sell shares to the Group during the reorganization. As a result of the reorganization, non-controlling interests decreased by 8,625. The 7,616 excess of the adjustment to the carrying amount of the non-controlling interest (8,625) over the cash paid (1,009) was recognized as an increase in additional paid-in capital. In addition, the Group’s share of accumulated other comprehensive loss was increased by 1,090 through a corresponding increase in additional paid-in capital. 25 COMMITMENTS AND CONTINGENCIES Legal As of 31 December 2014 and 31 December 2013, several Group companies reported negative net assets in their statutory financial statements. In accordance with the Civil Code of the Russian Federation, a liquidation process may be initiated against a company reporting negative net assets. Management believes that it is remote that the liquidation process will be initiated against those companies. The Group has been and continues to be the subject of legal proceedings and adjudications from time to time. Management believes that the resolution of all such outstanding matters will not have a material impact on the Group’s financial position, results of operations or cash flows. and federal authorities. The tax authorities in the Russian Federation frequently take an assertive position in their interpretation of the legislation and assessments and as a result, it is possible that transactions and activities may be challenged. It is therefore possible that significant additional taxes, penalties and interest may be assessed. Under certain circumstances reviews may cover longer periods. Where uncertainty exists, the Group has accrued tax liabilities as management’s best estimate of the probable outflow of resources which will be required to settle such liabilities. Management believes that it has provided adequately for tax liabilities based on its interpretations of tax legislation. However, the relevant authorities may have differing interpretations, and the effects could be significant. Taxation Laws and regulations affecting businesses in the Russian Federation continue to change rapidly. These changes are characterized by different interpretations and arbitrary application by the authorities. Management’s interpretation of such legislation as applied to the activity of the Group may be challenged by the relevant regional Russian transfer pricing legislation was amended starting from 1 January 2013 to introduce additional reporting and documentation requirements. The new legislation allows the tax authorities to impose additional tax liabilities in respect of certain transactions, including but not limited to transactions with related parties, if they consider transaction to be priced not at arm’s length. As the practice 2014 ANNUAL REPORT 83 FINANCIAL STATEMENTS Acquisition of Dankovskiy Combinat On 14 April 2013, the Group completed an acquisition of 95% of the share capital of Dankovskiy Combinat for cash consideration of 1,130. The meat processing plant is located in Dankov city - Lipetsk region, close to the Group’s existing pig breading farms. The company, founded in 1936, is specialized in the slaughtering, boning and freezing of cattle and pigs, as well as in the production of sausages. Slaughter capacity of the plant is approximately 500 pigs per shift, the production capacity for finished products is about 68 tonnes per day. The plant has a cold room for 500 tonnes of storage. The Group plans to increase the acquiree’s slaughter capacity. 126,514 32,761 31,990 GOVERNANCE These unaudited pro forma results have been prepared for comparison purposes only. The unaudited pro forma information does not purport to represent what the Group’s financial position or results of operations would actually have been if these transactions had occurred at the beginning of the period or to project the Group’s future results of operations. The actual results of operations of LISKO are included in the consolidated financial statements of the Group only from the date of acquisition and were: BUSINESS REVIEW A bargain purchase gain arose because the seller was acting under pressure of changing business environment in Russia (see Note 1) 2014 US$000 GENERAL OVERVIEW A valuation report was obtained subsequently and the Group also completed stock counts of acquired assets and correspondingly adjusted purchase price for any shortage or surplus, therefore consolidated financial statements for the year ended 31 December 2014 have been adjusted to adjust the fair values of the following assets, liabilities and purchase price at the acquisition date: 2014 US$000 (as previously reported in six month ended 30 June 2014) of implementation of the new transfer pricing rules has not yet developed and wording of some clauses of the rules is unclear, the impact of challenge of the Group’s transfer pricing positions by the tax authorities cannot be reliably estimated. insurance policy of approximately 1,133,654 with a number of insurance companies. The Group holds no other insurance policies in relation to operations, or in respect of public liability or other insurable risks. Environmental remediation costs The Group’s management believes that the Group is in compliance with applicable legislation and is not aware of any potential environmental claims; therefore, no liabilities associated with such costs are recorded as of 31 December 2014. Capital commitments At 31 December 2014, the Group had capital projects in progress at JSC Vasiljevskaya, CJSC Kurinoe Tsarstvo – Bryansk, JSC Kurinoe Tsarstvo, and CJSC Mosselprom. As part of these projects, commitments had been made to contractors of approximately 26,489 towards completion of the projects. Insurance The Group holds insurance policies in relation to certain assets. As of 31 December 2014 the Group secured part of its livestock with a total insurance policy of approximately 88,889 and part of property, plant and equipment and other assets with a total Also the Group is in the process of implementing SAP. As part of this project, commitments have been made to contractors of approximately 5,062 toward completion of the project. Operating lease commitments Obligations under non-cancellable operating lease agreements for the five years ending 31 December 2018 and thereafter are as follows: Total commitments 2015 US$000 2016 US$000 2017US$000 2018 US$000 2019 US$000 > 2019 US$000 Total US$00 4,902 4,876 3,395 1,878 1,529 23,866 40,446 26 SUBSEQUENT EVENTS The Group has evaluated subsequent events through 26 February 2015, the date on which the consolidated financial statements were issued and no material subsequent events were identified. 84 2014 ANNUAL REPORT Registered office OJSC Cherkizovo Group Business Centre White Square 5 Lesnaya Street, Building “B” Moscow 125047 Russian Federation Tel: +7 (495) 788-3232 Fax: +7 (495) 788-3233 Website: www.cherkizovo.com Registered number 1057748318473 70 Pyatnitskaya Street Moscow 113095 Russian Federation Solicitors English Law Cleary Gottlieb Steen & Hamilton LLP City Place House 55 Basinghall Street London EC2V 5EH United Kingdom Public Relations Alexander Kostikov Head of IR and Communications MANAGEMENT Registrars OJSC Obyedinennaya Registratsionnaya Kompaniya (OJSC ORK) Depository The Bank of New York Mellon One Wall Street New York NY 10286 United States of America BUSINESS REVIEW Company Lawyer Yury Dyachuk GENERAL OVERVIEW SHAREHOLDERS INFORMATION Tel: +7 (495) 745-78-91, +7 (495) 504-28-86 Auditors ZAO Deloitte and Touche CIS Business Centre White Square Photo by: Alexander Milykh, Dmitry Lomakin FINANCIAL STATEMENTS 5 Lesnaya St., Building “B” Moscow 125047 Russian Federation OJSC Cherkizovo Group 12th floor, White Square Office Centre Lesnaya str. 5B Moscow 125047 Russia Tel: +7 (495) 788-3232 www.cherkizovo.com


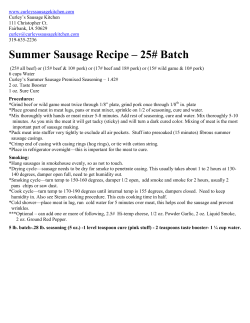


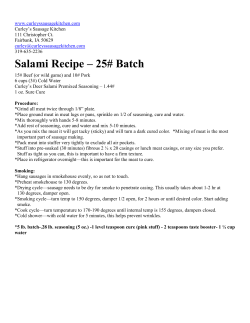

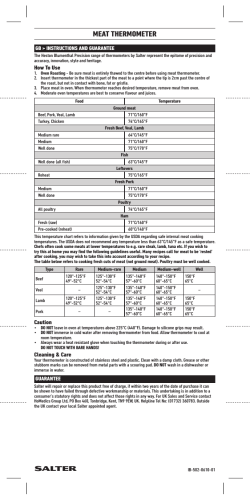
© Copyright 2026