
Students with Lower GPA`s Participate Differently in Class From
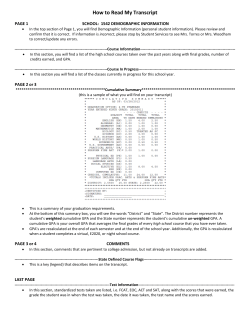
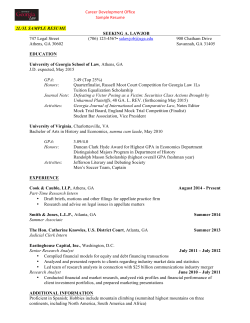
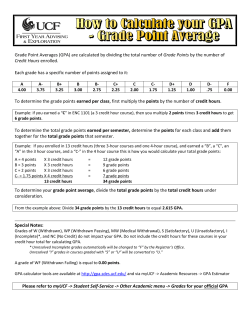
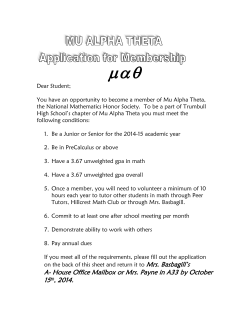
Students with Lower GPA’s Participate Differently in Class From Those with High GPA’s (Knowing This, What Should We Do?)
Perry Samson ([email protected]) & Frank Marsik ([email protected]), Atmospheric, Oceanic & Space Sciences, College of Engineering, University of Michigan-Ann Arbor
DRIVING QUESTION
Student grades are often strongly related to a student’s
prior success as measured by incoming GPA. Is this
because these students lack cognitive ability or is it
due to undeveloped study skills? Kuh et al. (2008)
have argued that student learning is linked to student
engagement. Are lower GPA students less engaged?
1. EXAM SCORES VS. GPA
In this course the student’s first exam scores were
related to their incoming GPA (Figure 2). This
relationship is consistent with results found elsewhere
(McKay, Miller, & Tritz, 2012).
STUDY DESIGN
Student participation was measured using the
Echo360 Active Learning Platform (see Figure 1)
which measures:
1. Attendance,
2. Number of questions answered in class,
3. Number of questions correct in class,
4. Volume of notes taken,
5. Number of notes taken, and
6. Number of questions asked.
During the first weeks of AOSS 102 (winter 2015)
student participation was measured and the data was
matched with data obtained from the University’s
Data Warehouse that includes each student’s
incoming grade point average (GPA). These data were
then matched with each student’s score from the first
hourly exam.
Figure 2. Scatter plot of AOSS 102 scores on exam 1 in winter
2015 versus the incoming GPA of each student (r2 = 0.20).
This outcome is disheartening as it infers that learning
is controlled by the inherent cognitive ability of the
student and less what can be done in class to promote
student success.
2. EXAM SCORES VS. PARTICIPATION
The data from the Active Learning Platform were
used to identify relationships between levels of student
participation and exam scores. Figure 3 shows
• Attendance, often the only recorded measure of participation, was unrelated to exam scores.
• The number of lecture captures viewed was weakly
related to exam scores.
Figure 1. Student view of the Active Learning Platform in
which they can take notes, answer instructor questions, ask
questions, bookmark slides and indicate confusion. All actions by the student are also automatically linked to the captured lecture.
• The number of times notes were taken was strongly
related to exam scores.
• The number of slides the students viewed during
class was strongly related to exam scores.
Figure 3. Relationship of attendance, lecture capture views,
number of notes taken and number of slides viewed to exam 1
scores.
Figure 4. Relationships between how students participate in
class and their incoming GPA.
3. PARTICIPATION VS. GPA
4. WHAT SHOULD WE DO?
Data from the Active Learning Platform was stratified
by the incoming GPA of each student to see if there
were systemic differences in participation patterns at
different levels of incoming GPA. The results, shown in
Figure 4, illustrate that between the beginning of the
semster and the first exam:
1. The level of attendance between four bins of GPA
was not dissimilar.
2. The level of lecture capture views increased from 2
minutes on average for GPA < 2.5 to 44 minutes on
average for GPA > 3.5.
3. The number of notes taken increased by a factor of
more than four between GPA < 2.5 and GPA > 3.5.
4. The number of slides actively viewed during class
roughly doubled from GPA < 2.5 to GPA > 3.5.
Hence those students with low GPA are not
participating at the same level as students with high
GPA.
These results suggest that the relationship between
grades and GPA identifies in Figure 1 is probably due to
a combination of issues beyond cognitive ability and
definitely includes differences in the motivation and/or
study skills of students.
Hypothesizing that the relationship between GPA and
grades can be explained by differences in student
partifcipation begs the question ...now what?
In AOSS 102 an intervention has begun where each
student was presented with these results in a survey
and asked to describe the relationships and nonexistent, weak or strong. Students were asked if they
were happy with their exam 1 grade and, if not, what
they planned to do differently when preparing for the
second exam. The students’ pattern of participation
is being monitored to see to what degree this
intervention leads to changed engagement and if those
changes affect exam scores.
REFERENCES
Kuh, G. D., Cruce, T. M., Shoup, R., Kinzie, J., & Gonyea, R. M. (2008).
Unmasking the Effects of Student Engagement on First-Year College
Grades and Persistence. The Journal of Higher Education, 79(5), 540.
McKay, T., Miller, K., & Tritz, J. (2012). What to do the Actionable Intellegence:
E2Coach as an Intervention Engine. Paper presented at the Learning
Analytics and Knowledge 2012, Vancouver, Canada. http://sitemaker.
umich.edu/ecoach/files/lak_2012_submission.pdf


© Copyright 2026