
i
i
Acknowledgements
This publication has been prepared by the Epidemiology Unit in the Population Health Branch of the
Tasmanian Department of Health and Human Services.
The unit wishes to acknowledge the input of staff from the following areas within the Department of Health
and Human Services:
Population Health and Wellbeing
Population Health Equity
Physical Activity and Community Nutrition
Senior Advisory Team
Healthy Settings
Cancer Screening and Control Unit
COPMM, Safety and Quality Care Reform
Communicable Disease Prevention Unit
External Organisations
Cancer Registry, Menzies Research Institute, Hobart
Cancer Council of Tasmania
Tasmanian Medicare Local
This work is copyright. It may be reproduced in whole or in part for study and training purposes subject to
the inclusion of an acknowledgment of the source. It may not be reproduced for commercial usage or sale.
Reproduction for purposes other than those indicate above requires written permission for the
Department of Health and Human Services, Tasmania.
Enquiries about this publication should be directed to:
The Manager
Epidemiology Unit
Population Health
Department of Health and Human Services
GPO Box 125
Tasmania 7001
This publication can be downloaded at: http://www.dhhs.tas.gov.au/pophealth/epidemiology
ii
Foreword
Monitoring the health of Tasmanians is fundamental to providing evidence-based services and health
promotion strategies and programs to improve health.
The demand for timely and relevant health information is increasing and has become an indispensable
resource for health planners, decision makers and others interested in contemporary health issues and the
changing demands on our health system.
The national and Tasmanian data collections used in this report will provide valuable information on the
extent of the preventable health burden and opportunities for prevention.
Health Indicators Tasmania 2013 brings together the key markers of Tasmania’s health, including the latest
demographics, health equity, population ageing, lifestyle risk factors, major causes of morbidity and
mortality, primary care issues and other issues of concern.
This report, a companion to The State of Public Health Report 2013, has been expanded from previous
editions and contains broader and more detailed health statistical information and commentary.
Although life expectancy has increased over time, the proportion of Tasmanians with chronic diseases and
disability has also increased.
Cancer and cardiovascular disease continue to be the main causes of death in the population.
Tobacco smoking remains Tasmania’s single most preventable risk factor, rates of harmful alcohol
consumption are higher in Tasmania than Australia as a whole and physical inactivity and poor nutrition are
still too high among our population.
The majority of Tasmania’s adult population is overweight or obese.
Social indicators show a mixed picture of progress, with some improvements in education and incomes, but
also higher unemployment noted since 2006.
However, levels of income and education remain, for the most part, well below the average for most other
jurisdictions.
These data overall clearly demonstrate serious health issues are affecting growing numbers of people in our
population.
Many of these health issues are preventable.
I strongly encourage readers to also review the State of Public Health Report 2013 as it discusses the
strategic and operational directions that should be adopted by the health system and community more
widely to address these challenges.
I thank the dedicated staff of the Epidemiology Unit and others within Population Health who have
contributed to the development of Health Indicators Tasmania 2013.
Dr Roscoe Taylor
Chief Health Officer/Director of Public Health
iii
.
Contents
ACKNOWLEDGEMENTS .............................................................................................................................................................................. II
FOREWORD ................................................................................................................................................... III
LIST OF TABLES .......................................................................................................................................... VII
LIST OF FIGURES ......................................................................................................................................... IX
KEY FINDINGS ............................................................................................................................................ XIV
INTRODUCTION .......................................................................................................................................... 17
POPULATION PROFILE .............................................................................................................................. 19
POPULATION DISTRIBUTION .................................................................................................................................................................. 19
AGE AND SEX DISTRIBUTION ................................................................................................................................................................. 20
ABORIGINAL AND TORRES STRAIT ISLANDER POPULATION .............................................................................................................. 21
FERTILITY RATES ....................................................................................................................................................................................... 22
POPULATION GROWTH .......................................................................................................................................................................... 23
FAMILY CHARACTERISTICS ...................................................................................................................................................................... 24
EDUCATION .............................................................................................................................................................................................. 25
EMPLOYMENT............................................................................................................................................................................................ 26
INCOME ..................................................................................................................................................................................................... 31
PRIVATE HEALTH INSURANCE ................................................................................................................................................................ 32
HEALTH EXPENDITURE ............................................................................................................................................................................ 33
HEALTH EQUITY ......................................................................................................................................... 34
SOCIO-ECONOMIC DISADVANTAGE ..................................................................................................................................................... 34
ABORIGINAL AND TORRES STRAIT ISLANDERS..................................................................................................................................... 40
GEOGRAPHIC REMOTENESS .................................................................................................................................................................... 41
HEALTH LITERACY ................................................................................................................................................................................... 45
Health Literacy and Health Outcomes ............................................................................................................................................................. 45
How Tasmania is Performing ............................................................................................................................................................................... 46
Conclusions ................................................................................................................................................................................................................. 46
POPULATION HEALTH - KEY INDICATORS .......................................................................................... 47
SELF-ASSESSED HEALTH STATUS ............................................................................................................................................................ 47
LIFE EXPECTANCY .................................................................................................................................................................................... 49
INFANT MORTALITY................................................................................................................................................................................. 50
HOSPITALISATIONS .................................................................................................................................................................................. 51
POTENTIALLY PREVENTABLE HOSPITALISATIONS................................................................................................................................. 52
MORTALITY AND CAUSES OF MORTALITY ........................................................................................................................................... 56
LEADING CAUSES OF MORTALITY.......................................................................................................................................................... 56
AVOIDABLE MORTALITY.......................................................................................................................................................................... 59
BURDEN OF DISEASE ................................................................................................................................................................................ 61
Healthy Life Expectancy......................................................................................................................................................................................... 63
HEALTH SCREENING .................................................................................................................................. 66
CANCER SCREENING AND DETECTION ................................................................................................................................................ 66
Breast Cancer ............................................................................................................................................................................................................ 66
Bowel Cancer ............................................................................................................................................................................................................. 67
Cervical Cancer ......................................................................................................................................................................................................... 70
PRIORITY HEALTH CONDITIONS............................................................................................................ 72
CHRONIC CONDITIONS ......................................................................................................................................................................... 72
Disability Prevalence ................................................................................................................................................................................................ 73
Oral Health ................................................................................................................................................................................................................ 74
KEY CHRONIC CONDITIONS .................................................................................................................... 76
CANCER INCIDENCE AND MORTALITY ................................................................................................................................................. 76
Prostate Cancer......................................................................................................................................................................................................... 81
Breast Cancer ............................................................................................................................................................................................................ 82
iv
Colorectal Cancer ..................................................................................................................................................................................................... 84
Lung Cancer ............................................................................................................................................................................................................... 85
Melanoma of Skin .................................................................................................................................................................................................... 87
Lymphoma .................................................................................................................................................................................................................. 88
Cervical Cancer ......................................................................................................................................................................................................... 90
CARDIOVASCULAR DISEASE .................................................................................................................................................................... 92
Hypertension and High Blood Cholesterol ....................................................................................................................................................... 92
Ischaemic Heart Disease ....................................................................................................................................................................................... 93
Stroke (Cerebrovascular Accident)...................................................................................................................................................................... 96
DIABETES MELLITUS.................................................................................................................................................................................. 99
INJURY ......................................................................................................................................................................................................104
Transport Injuries ...................................................................................................................................................................................................104
Land Transport and Farm Injuries ....................................................................................................................................................................107
Accidental Falls ........................................................................................................................................................................................................110
MENTAL HEALTH ...................................................................................................................................................................................112
Prevalence .................................................................................................................................................................................................................112
Mortality ....................................................................................................................................................................................................................114
ASTHMA...................................................................................................................................................................................................116
ARTHRITIS AND MUSCULOSKELETAL CONDITIONS ..........................................................................................................................118
Rheumatoid Arthritis .............................................................................................................................................................................................120
Osteoarthritis ...........................................................................................................................................................................................................121
Osteoporosis .............................................................................................................................................................................................................122
CHRONIC KIDNEY DISEASE ..................................................................................................................................................................124
COMMUNICABLE DISEASES.................................................................................................................... 126
Sexually Transmissible Infections ......................................................................................................................................................................127
Blood Borne Viruses ...............................................................................................................................................................................................129
Enteric Diseases ......................................................................................................................................................................................................132
Vaccine Preventable Diseases ............................................................................................................................................................................136
Vector Borne Diseases ..........................................................................................................................................................................................139
Zoonoses ...................................................................................................................................................................................................................141
Other Communicable Diseases..........................................................................................................................................................................141
RISK AND PROTECTIVE FACTORS ........................................................................................................ 142
SMOKING.................................................................................................................................................................................................142
ALCOHOL................................................................................................................................................................................................147
Lifetime Risk .............................................................................................................................................................................................................147
Single Occasion Risk ..............................................................................................................................................................................................149
PHYSICAL ACTIVITY ...............................................................................................................................................................................152
NUTRITION .............................................................................................................................................................................................155
Fruit and Vegetable Consumption.....................................................................................................................................................................155
Breastfeeding ...........................................................................................................................................................................................................157
Iodine Status ............................................................................................................................................................................................................158
BODY MASS INDEX ................................................................................................................................................................................159
ILLICIT DRUGS ........................................................................................................................................................................................163
HEALTH PROFILE OF POPULATION 60 YEARS AND OVER ............................................................. 164
COMMUNITY INTEGRATION .................................................................................................................................................................164
SELF-ASSESSED PHYSICAL AND MENTAL HEALTH...............................................................................................................................165
CHRONIC CONDITIONS .......................................................................................................................................................................166
IMPACT OF SOCIO-ECONOMIC FACTORS ...........................................................................................................................................168
RISK FACTORS ........................................................................................................................................................................................169
RISK FACTOR INTERACTIONS AND EFFECTS ON CHRONIC CONDITIONS ....................................................................................171
PRIMARY HEALTH CARE.......................................................................................................................... 173
PRIMARY HEALTH CARE WORKFORCE ...............................................................................................................................................173
USE OF PRIMARY CARE SERVICES .........................................................................................................................................................174
ACCESS AND SATISFACTION ISSUES .....................................................................................................................................................174
APPENDIX 1 – LOCAL AREA DATA ....................................................................................................... 176
NORTHERN REGION SUMMARY ...........................................................................................................................................................176
Break O’Day ............................................................................................................................................................................................................176
Dorset.........................................................................................................................................................................................................................176
Flinders .......................................................................................................................................................................................................................177
George Town............................................................................................................................................................................................................177
v
Launceston ................................................................................................................................................................................................................177
Meander Valley .......................................................................................................................................................................................................177
Northern Midlands ................................................................................................................................................................................................178
West Tamar .............................................................................................................................................................................................................178
SOUTHERN REGION SUMMARY ............................................................................................................................................................178
Brighton .....................................................................................................................................................................................................................178
Central Highlands...................................................................................................................................................................................................179
Clarence.....................................................................................................................................................................................................................179
Derwent Valley ........................................................................................................................................................................................................179
Glamorgan/Spring Bay ..........................................................................................................................................................................................179
Glenorchy ..................................................................................................................................................................................................................180
Hobart........................................................................................................................................................................................................................180
Huon Valley ..............................................................................................................................................................................................................180
Kingborough .............................................................................................................................................................................................................180
Sorell ...........................................................................................................................................................................................................................181
Southern Midlands .................................................................................................................................................................................................181
Tasman ......................................................................................................................................................................................................................181
NORTH WEST REGION SUMMARY ......................................................................................................................................................181
Burnie .........................................................................................................................................................................................................................181
Central Coast ...........................................................................................................................................................................................................182
Circular Head ..........................................................................................................................................................................................................182
Devonport .................................................................................................................................................................................................................182
Kentish .......................................................................................................................................................................................................................182
King Island ................................................................................................................................................................................................................183
Latrobe .......................................................................................................................................................................................................................183
Waratah/Wynyard .................................................................................................................................................................................................183
West Coast ...............................................................................................................................................................................................................183
Risk Factor Prevalence ..........................................................................................................................................................................................184
Health Screening Prevalence ..............................................................................................................................................................................186
Disability Prevalence ..............................................................................................................................................................................................187
Mortality Rates ........................................................................................................................................................................................................188
Potentially Avoidable Mortality ...........................................................................................................................................................................189
Hospitalisations .......................................................................................................................................................................................................190
Potentially Preventable Hospitalisations ..........................................................................................................................................................191
Communicable Diseases ......................................................................................................................................................................................192
Communicable Disease Notifications ..............................................................................................................................................................193
Cancer Incidence ....................................................................................................................................................................................................194
Key Data Sources by Type of Data..................................................................................................................................................................195
Key Data Sources by Type of Survey ...............................................................................................................................................................196
APPENDIX 3 – METHODS ......................................................................................................................... 198
Age-specific Rate.....................................................................................................................................................................................................198
Age-standardised Rates ........................................................................................................................................................................................198
Avoidable Mortality ................................................................................................................................................................................................198
Modelling of Trends ...............................................................................................................................................................................................198
Notification Rate .....................................................................................................................................................................................................198
Relative Standard Error ........................................................................................................................................................................................198
Standardised Mortality Ratio ..............................................................................................................................................................................199
Standardised incidence Ratio..............................................................................................................................................................................199
Socio-economic Status ..........................................................................................................................................................................................199
Statistical Significance ...........................................................................................................................................................................................199
APPENDIX 4 – WORKING IN HEALTH PROMOTING WAYS ............................................................ 200
APPENDIX 5 - GLOSSARY ........................................................................................................................ 204
BIBLIOGRAPHY .......................................................................................................................................... 207
vi
List of Tables
TABLE 1: REGIONAL POPULATION DISTRIBUTION, 2011.......................................................................................................................... 19
TABLE 2: POPULATION DISTRIBUTION BY AGE, AUSTRALIA AND TASMANIA, 2011 ............................................................................. 20
TABLE 3: MEDIAN AGE BY JURISDICTION, 2011 ......................................................................................................................................... 20
TABLE 4: INDIGENOUS IDENTIFICATION, TASMANIA 2011 ...................................................................................................................... 21
TABLE 5: INDIGENOUS POPULATIONS BY JURISDICTION, 2011 AND 2006 ............................................................................................ 21
TABLE 6: AGE DISTRIBUTION BY INDIGENOUS STATUS, TASMANIA 2011.............................................................................................. 21
TABLE 7: POPULATION GROWTH, TASMANIA 1986-2011 ...................................................................................................................... 23
TABLE 8: ACTUAL AND PROJECTED MEDIAN AGE, TASMANIA AND AUSTRALIA, 2006-2050 ............................................................. 24
TABLE 9: FAMILY COMPOSITION*, TASMANIA AND AUSTRALIA, 2011 .................................................................................................. 24
TABLE 10: ONE PARENT FAMILIES, TASMANIA, 2001-2011 ..................................................................................................................... 25
TABLE 11: WORKFORCE PARTICIPATION RATES BY JURISDICTION, 2011 AND DECEMBER 2012 ...................................................... 27
TABLE 12: LONG-TERM UNEMPLOYMENT RATES* BY JURISDICTION, DECEMBER 2012 ........................................................................ 28
TABLE 13: EMPLOYMENT CHARACTERISTICS BY REGION, 2011............................................................................................................... 30
TABLE 14: MEDIAN WEEKLY GROSS INDIVIDUAL INCOME BY JURISDICTION, 2001-2011.................................................................... 31
TABLE 15: MEDIAN WEEKLY GROSS HOUSEHOLD INCOME BY INCOME SOURCE AND JURISDICTION, 2011 ..................................... 31
TABLE 16: LIFE EXPECTANCY AT BIRTH BY INDIGENOUS STATUS, AUSTRALIA 2005-07 ..................................................................... 40
TABLE 17: PROFOUND/SEVERE CORE ACTIVITY LIMITATION BY INDIGENOUS STATUS, 18 YEARS AND OVER, 2008 ........................ 40
TABLE 18: NEED FOR ASSISTANCE WITH CORE ACTIVITIES* BY INDIGENOUS STATUS, AUSTRALIA 2011 ......................................... 40
TABLE 19: POPULATION DISTRIBUTION BY REMOTENESS CATEGORY, 2011 ......................................................................................... 41
TABLE 20: POTENTIALLY PREVENTABLE HOSPITALISATIONS* BY REMOTENESS CLASSIFICATION, 2010-11 ....................................... 42
TABLE 21: LIFE EXPECTANCY AT BIRTH BY JURISDICTION, 2011 ............................................................................................................. 49
TABLE 22: LIFE EXPECTANCY AT BIRTH FOR INDIGENOUS PEOPLE, AUSTRALIA 2005-07 ................................................................... 49
TABLE 23: INFANT MORTALITY RATE PER 1 000 LIVE BIRTHS BY JURISDICTION, 2011.......................................................................... 50
TABLE 24: TOP TEN CAUSES OF DEATH IN TASMANIA, 2010 ................................................................................................................ 56
TABLE 25: LEADING CAUSES OF DEATH BY AGE AND SEX, TASMANIA, 2003-07 ............................................................................... 57
TABLE 26: TOP TEN CAUSES OF DEATH, TASMANIA AND AUSTRALIA, 2010 ........................................................................................ 58
TABLE 27: DIFFERENTIALS IN BURDEN (DALYS) IN TASMANIA AND AUSTRALIA FOR THE 10 LEADING SPECIFIC CAUSES, 2003 .. 61
TABLE 28: PAST AND PROJECTED FUTURE CHANGES IN HEALTH LOSS (DALYS), BY SELECTED BROAD CAUSE GROUP, AUSTRALIA,
1993-2023 .......................................................................................................................................................................................... 62
TABLE 29: LIFE EXPECTANCY AND EXPECTED YEARS WITH DISABILITY AT BIRTH, BY SEX, 1998 AND 2009 ..................................... 64
TABLE 30: LIFE EXPECTANCY AND EXPECTED YEARS WITH DISABILITY AT AGE 65, BY SEX, 1998 AND 2009 .................................. 65
TABLE 31: BREAST CANCER SCREENING RATES BY SOCIO-ECONOMIC STATUS, AUSTRALIA 2009-10 .............................................. 66
TABLE 32: ALL-SIZE AND SMALL (<15 MM) INVASIVE BREAST CANCER DETECTION RATES* IN FEMALES............................................ 67
TABLE 33: BOWEL CANCER SCREENING PARTICIPATION* BY SOCIO-ECONOMIC STATUS, AUSTRALIA 2008-11 ............................ 69
TABLE 34: FOBT POSITIVITY RATES* BY SOCIO-ECONOMIC STATUS, AUSTRALIA 2008-11 ............................................................... 69
TABLE 35: PARTICIPATION RATES* IN CERVICAL SCREENING, AGE 20-69 YEARS, BY SOCIO-ECONOMIC STATUS, AUSTRALIA 200910.......................................................................................................................................................................................................... 70
TABLE 36: NEGATIVE CYTOLOGY TEST RESULTS IN FEMALES AGED 20-69 YEARS, TASMANIA AND AUSTRALIA, 2010 ................... 71
TABLE 37: PREVALENC (AUSTRALIAN BUREAU OF STATISTICS 2011)E OF SELF-REPORTED SELECTED CHRONIC CONDITIONS,
TASMANIA, 2011-12 .......................................................................................................................................................................... 72
TABLE 38: ABSENCE OF CARIES (DMFT = 0) EXPERIENCE FOR CHILDREN AGED 5-12 YEARS BY JURISDICTION, 2006 ..................... 75
TABLE 39: DIABETES INCIDENCE RATE BY GENDER AND TYPE, TASMANIA 2011 ................................................................................100
TABLE 40: DIABETES INCIDENCE RATE, TASMANIAN REGIONS, 2011...................................................................................................101
TABLE 41: HOSPITALISATIONS FOR TRANSPORT INJURIES BY MODE OF TRANSPORT, TASMANIA 2007-11 ....................................107
TABLE 42: TOP FIVE CAUSES OF HOSPITALISED FARM INJURY, 15 YEARS AND OVER, TASMANIA 2007-11 ......................................108
TABLE 43: NUMBER OF DISEASE NOTIFICATION DUE TO GONORRHOEA BY SEX, TASMANIA 2007-11...........................................128
TABLE 44: NUMBER OF DISEASE NOTIFICATION DUE TO SYPHILIS BY SEX, TASMANIA 2007-11 .......................................................129
TABLE 45: AUSTRALIAN CHILDHOOD IMMUNISATION REGISTER - % OF CHILDREN* FULLY IMMUNISED .........................................136
TABLE 46: NUMBER OF DISEASE NOTIFICATIONS DUE TO TUBERCULOSIS BY SEX, 2007-11 .............................................................141
TABLE 47: CURRENT SMOKERS*, 18-24 YEARS, TASMANIA AND AUSTRALIA, 2004-2007-08 .........................................................144
TABLE 48: CURRENT SMOKERS BY SPECIFIC AGE GROUPS AND GENDER, TASMANIA AND AUSTRALIA 2011-12 ........................... 145
TABLE 49: NHMRC ALCOHOL GUIDELINES 2001 AND 2009 .............................................................................................................147
vii
TABLE 50: INADEQUATE PHYSICAL ACTIVITY LEVELS BY AGE, TASMANIA 2001-2011-12 .................................................................153
TABLE 51: PROPORTION OF SECONDARY SCHOOL STUDENTS REPORTING ADEQUATE LEVELS* OF PHYSICAL ACTIVITY, TASMANIA
2005 TO 2011 ..................................................................................................................................................................................154
TABLE 52: PROPORTION OF SECONDARY SCHOOL STUDENTS CONSUMING RECOMMENDED LEVELS OF FRUIT AND VEGETABLES,
TASMANIA 2002-08 .........................................................................................................................................................................156
TABLE 53: PROPORTION OF INFANTS EVER BREASTFED, 2010 ..............................................................................................................158
TABLE 54: FEMALES WHO GAVE BIRTH BY SELF-REPORTED BMI STATUS AND MEASURED BMI FOR FEMALES 18-34 YEARS,
TASMANIA 2010 AND 2011-12......................................................................................................................................................162
TABLE 55: SOCIAL CAPITAL, 60 YEARS AND OVER, TASMANIA 2009 ...................................................................................................164
TABLE 56: EMPLOYMENT STATUS, AGE 60-70 YEARS, TASMANIA 2009 ...............................................................................................165
TABLE 57: PSYCHOLOGICAL DISTRESS LEVELS, 60 YEARS AND OVER, TASMANIA 2009 .....................................................................166
TABLE 58: SELF-ASSESSED HEALTH BY ARTHRITIS DIAGNOSIS, 60 YEARS AND OVER, TASMANIA 2009 ............................................167
TABLE 59: PREVALENCE OF SELECTED CHRONIC CONDITIONS BY GENDER, 60 YEARS AND OVER, TASMANIA 2009 ................... 167
TABLE 60: FINANCIAL SECURITY STATUS BY HEALTH STATUS, 60 YEARS AND OVER, TASMANIA 2009 ...........................................168
TABLE 61: INSUFFICIENT PHYSICAL ACTIVITY BY HOUSEHOLD INCOME QUINTILES, 60 YEARS AND OVER, TASMANIA 2009 ....... 168
TABLE 62: TYPE OF PHYSICAL ACTIVITY, 60 YEARS AND OVER AND TOTAL ADULT POPULATION, TASMANIA 2009 .................... 171
TABLE 63: SELF-ASSESSED HEALTH BY PHYSICAL ACTIVITY LEVELS, 60 YEARS AND OVER, TASMANIA 2009 ....................................171
TABLE 64: BMI STATUS BY PHYSICAL ACTIVITY LEVELS, 60 YEARS AND OVER AND TOTAL ADULT POPULATION, TASMANIA 2009
............................................................................................................................................................................................................171
TABLE 65: SELECTED CHRONIC CONDITIONS BY BMI STATUS, 60 YEARS AND OVER, TASMANIA 2009 .........................................172
TABLE 66: TASMANIAN PRIMARY HEALTH CARE WORKFORCE PER 100 000 POPULATION BY REGION, 2011................................ 173
TABLE 67: PRIMARY HEALTH SERVICES ACCESSED IN THE LAST 12 MONTHS, TASMANIANS AGED 18 YEARS AND OVER, 2009 ... 174
TABLE 68: DIFFICULTY ACCESSING HEALTH SERVICE BY TYPE OF SERVICE, 18 YEARS AND OVER, TASMANIA 2010 ....................... 174
TABLE 69: TOP 5 BARRIERS TO ACCESSING SERVICES, 18 YEARS AND OVER, TASMANIA 2010 .........................................................174
TABLE 70: GP SERVICE BARRIERS, 15 YEARS AND OVER, TASMANIA 2009 ...........................................................................................175
TABLE 71: SATISFACTION WITH HEALTH SERVICES USED IN THE LAST 12 MONTHS, 18 YEARS AND OVER, TASMANIA 2009 ....... 175
TABLE 72: SATISFACTION WITH GP SERVICES USED IN THE LAST 12 MONTHS, 15 YEARS AND OVER, TASMANIA 2010-11......... 175
TABLE 73: RISK FACTOR PREVALENCE 2009 ...........................................................................................................................................184
TABLE 74: HEALTH SCREENING PREVALENCE 2009 ...............................................................................................................................186
TABLE 75: AGE-STANDARDISED RATES FOR POTENTIALLY AVOIDABLE MORTALITY BY LGA, TAS 2003-07 .................................. 189
TABLE 76: AGE-STANDARDISED RATES (ASR) FOR POTENTIALLY PREVENTABLE HOSPITALISATIONS BY LGA, TASMANIA, 2007-11
............................................................................................................................................................................................................191
TABLE 77: NOTIFIABLE DISEASES IN TASMANIA .......................................................................................................................................192
TABLE 78: CRUDE NOTIFICATION RATES FOR INFECTIOUS DISEASES BY LGA, 2007-11 ...................................................................193
TABLE 79: AGE-STANDARDISED INCIDENCE RATES FOR CANCERS (ASR) BY LGA, 2005-09...........................................................194
viii
List of Figures
FIGURE 1: PROPORTION OF POPULATION BY REMOTENESS CLASSIFICATION, TASMANIA 2011 ......................................................... 19
FIGURE 2: AGE AND SEX DISTRIBUTION, TASMANIA 2011 ....................................................................................................................... 20
FIGURE 3: TOTAL FERTILITY RATE BY JURISDICTION, 2001 AND 2011 ................................................................................................... 22
FIGURE 4: PROJECTED TOTAL POPULATION* BY AGE, TASMANIA 2011-2056...................................................................................... 23
FIGURE 5: ACTUAL AND PROJECTED POPULATION AGED 65 YEARS AND OVER AS A PROPORTION OF THE TOTAL POPULATION 24
FIGURE 6: PROPORTION OF ONE PARENT FAMILIES BY JURISDICTION, 2011 ......................................................................................... 25
FIGURE 7: COMPLETED YEAR 12, BY JURISDICTION, AGED 15 YEARS AND OVER, 2011 ....................................................................... 26
FIGURE 8: HIGHEST LEVEL OF SCHOOLING COMPLETED, 15 YEARS AND OVER, TASMANIA 2011 ...................................................... 26
FIGURE 9: UNEMPLOYMENT RATES BY JURISDICTION, DECEMBER 2012................................................................................................. 28
FIGURE 10: UNDER-EMPLOYMENT RATES BY JURISDICTION, 2011 .......................................................................................................... 29
FIGURE 11: UNDER-EMPLOYMENT RATES, TASMANIA AND AUSTRALIA, 2001-11................................................................................ 29
FIGURE 12: MEDIAN WEEKLY GROSS HOUSEHOLD INCOME* BY JURISDICTION, 2011 ......................................................................... 31
FIGURE 13: INCOME SUPPORT PAYMENTS AS A PROPORTION OF ALL HOUSEHOLDS BY JURISDICTION, 2011 .................................. 32
FIGURE 14: PRIVATE HEALTH INSURANCE PARTICIPATION BY STATE AND TERRITORY, 2011 ............................................................ 32
FIGURE 15: HEALTH TO GDP SPENDING RATIO, AUSTRALIA 1999-00 – 2009-10.............................................................................. 33
FIGURE 16: TOTAL HEALTH EXPENDITURE PER PERSON, TASMANIA AND AUSTRALIA 2000-01 – 2009-10 ..................................... 33
FIGURE 17: -ESTIMATED POVERTY RATES FOR STATES AND TERRITORIES, 2011.................................................................................... 34
FIGURE 18: SELF-ASSESSED HEALTH BY HOUSEHOLD INCOME QUINTILES, POPULATION 18 YEARS AND OVER, TASMANIA 2009 .. 35
FIGURE 19: PROPORTION OF POPULATION IN THE LOWEST QUINTILE OF THE SEIFA INDEX OF RELATIVE DISADVANTAGE BY
JURISDICTION, 2007-08 ..................................................................................................................................................................... 35
FIGURE 20: POTENTIALLY PREVENTABLE HOSPITALISATIONS BY SOCIO-ECONOMIC STATUS (SEIFA), TASMANIA 2009-11 .......... 36
FIGURE 21: AVOIDABLE MORTALITY BY SOCIO-ECONOMIC STATUS (SEIFA), AGE 0-74 YEARS, AGE-STANDARDISED RATES PER
100 000 POPULATION, TASMANIA 1998-00 – 2005-07 .............................................................................................................. 36
FIGURE 22: SELF-REPORTED DIAGNOSED DIABETES AND HYPERTENSION PREVALENCE* BY SOCIO-ECONOMIC STATUS (SEIFA),
POPULATION 18 YEARS AND OVER, TASMANIA 2009.................................................................................................................... 37
FIGURE 23: FIVE-YEAR CANCER SURVIVAL RATES* BY SOCIO-ECONOMIC STATUS (SEIFA), TASMANIA 2003-2007 ....................... 37
FIGURE 24: DAILY SMOKING PREVALENCE BY SOCIO-ECONOMIC STATUS (SEIFA), POPULATION 18 YEARS AND OVER, TASMANIA
2009 ..................................................................................................................................................................................................... 38
FIGURE 25: OBESE BMI BY SOCIO-ECONOMIC DISADVANTAGE (SEIFA), POPULATION 18 YEARS AND OVER, TASMANIA 2009 .. 38
FIGURE 26: INSUFFICIENT CONSUMPTION OF FRUIT AND VEGETABLES BY SOCIO-ECONOMIC STATUS (SEIFA), POPULATION 18
YEARS AND OVER, TASMANIA 2009 ................................................................................................................................................. 39
FIGURE 27: PROPORTION OF ADULTS WHO EXPERIENCED FOOD INSECURITY BY HOUSEHOLD INCOME QUINTILES, TASMANIA,
2009 ..................................................................................................................................................................................................... 39
FIGURE 28: SELF-ASSESSED HEALTH BY INDIGENOUS STATUS (ASR), TASMANIA 2008........................................................................ 41
FIGURE 29: POPULATION RESIDING IN OUTER REGIONAL, REMOTE AND VERY REMOTE AREAS BY JURISDICTION, 2011 ................ 42
FIGURE 30: STANDARDISED MORTALITY RATES* (ALL-CAUSE) PER 1 000 POPULATION BY REMOTENESS CLASSIFICATION, 2011 . 43
FIGURE 31: POTENTIALLY AVOIDABLE MORTALITY RATES (ALL-CAUSE) PER 100 000 POPULATION BY REMOTENESS
CLASSIFICATION, 2003-007 .............................................................................................................................................................. 43
FIGURE 32: DISABILITY RATES BY REMOTENESS CLASSIFICATION, 2009.................................................................................................. 44
FIGURE 33: SELECTED BEHAVIOURAL RISK FACTORS BY REMOTENESS CLASSIFICATION, 2011-12 ...................................................... 44
FIGURE 34: SELF-ASSESSED HEALTH STATUS, 15 YEARS AND OVER, TASMANIA AND AUSTRALIA, 2011-12 ...................................... 47
FIGURE 35: SELF-ASSESSED FAIR/POOR HEALTH STATUS, 15 YEARS AND OVER, BY JURISDICTION, 2011-12 ..................................... 48
FIGURE 36: SELF ASSESSED HEALTH STATUS, AGED 15 YEARS AND OVER, TASMANIA 2004-2011-12 ............................................... 48
FIGURE 37: LIFE EXPECTANCY AT BIRTH, TASMANIA AND AUSTRALIA 1985-2011.............................................................................. 49
FIGURE 38: INFANT MORTALITY RATES, TASMANIA AND AUSTRALIA, 2000-2011............................................................................... 50
FIGURE 39: ALL-CAUSE HOSPITALISATIONS BY SEX, TASMANIA, 2002-11 ............................................................................................. 51
FIGURE 40: ALL-CAUSE HOSPITALISATIONS BY SEX, 65 YEARS AND OVER, TASMANIA, 2002-11 ....................................................... 51
FIGURE 41: POTENTIALLY PREVENTABLE HOSPITALISATIONS BY JURISDICTION, 2001-02 - 2010-11 ................................................ 52
FIGURE 42: POTENTIALLY PREVENTABLE HOSPITALISATIONS BY JURISDICTION, 2010-11 ................................................................... 53
FIGURE 43: POTENTIALLY PREVENTABLE HOSPITALISATIONS BY CATEGORY IN TASMANIA, 2010-11 ............................................... 53
FIGURE 44: POTENTIALLY PREVENTABLE HOSPITALISATIONS BY CATEGORY IN TASMANIA, 2001-02-2010-11 .............................. 54
FIGURE 45: POTENTIALLY PREVENTABLE HOSPITALISATIONS BY TYPE OF CONDITION, TASMANIA, 2010-11 .................................. 54
ix
FIGURE 46: POTENTIALLY PREVENTABLE HOSPITALISATIONS BY REGION IN TASMANIA, 2007-11 ..................................................... 55
FIGURE 47: AGE-STANDARDISED MORTALITY RATE, TASMANIA AND AUSTRALIA, 2003-07............................................................. 56
FIGURE 48: POTENTIALLY AVOIDABLE MORTALITY FROM ALL-CAUSES, UNDER 75 YEARS, AUSTRALIA, 2009 .................................. 59
FIGURE 49: POTENTIALLY AVOIDABLE MORTALITY, POPULATION 0-74 YEARS, TASMANIA, 1978-2007 ........................................... 59
FIGURE 50: POTENTIALLY AVOIDABLE MORTALITY, POPULATION 0-74 YEARS, BY REGION, TASMANIA, 2005-07 ....................... 60
FIGURE 51: POTENTIALLY AVOIDABLE (PREVENTABLE AND AMENABLE) MORTALITY, POPULATION 0-74 YEARS, TASMANIA, 19782007 ..................................................................................................................................................................................................... 60
FIGURE 52: LIFE EXPECTANCY AND EXPECTED YEARS OF LIFE WITH AND WITHOUT DISABILITY FOR AUSTRALIANS BORN IN 2009
.............................................................................................................................................................................................................. 63
FIGURE 53: LIFE EXPECTANCY AND EXPECTED YEARS OF LIFE WITH/WITHOUT DISABILITY FOR AUSTRALIANS AGE 65 YEARS IN
2009 ..................................................................................................................................................................................................... 65
FIGURE 54: BREAST SCREENING PARTICIPATION RATES* FOR FEMALES 50-69 YEARS BY JURISDICTION, 2009-10............................ 66
FIGURE 55: BOWEL CANCER SCREENING PARTICIPATION RATE* BY JURISDICTION, 2008-11 ............................................................ 68
FIGURE 56: FAECAL OCCULT BLOOD TEST (FOBT) POSITIVITY RATES*, TASMANIA AND AUSTRALIA 2008-11.............................. 69
FIGURE 57: PARTICIPATION RATE* IN CERVICAL SCREENING, AGE 20-69 YEARS, BY JURISDICTION, 2009-10.................................. 70
FIGURE 58: DISABILITY RATES BY JURISDICTION, 2009 ............................................................................................................................. 73
FIGURE 59: DISABILITY RATES BY AGE, AUSTRALIA 2009 ......................................................................................................................... 73
FIGURE 60: PROPORTION OF CHILDREN AGED 5-6 YEARS WITH DMFT >0 IN DECIDUOUS TEETH BY JURISDICTION, 2006 ........... 74
FIGURE 61: ORAL HEALTH (MEAN DMFT*) OF CHILDREN AGED 5-6 YEARS BY JURISDICTION, 2002 AND 2006 .............................. 74
FIGURE 62: PROPORTION OF CHILDREN AGED 12 YEARS WITH DMFT >0 IN PERMANENT TEETH BY JURISDICTION, 2006 ............ 75
FIGURE 63: ORAL HEALTH (DMFT*) OF CHILDREN AGED 12 YEARS BY JURISDICTION, 2002 AND 2006........................................... 75
FIGURE 64: ALL CAUSES CANCER* INCIDENT CASES BY AGE, TASMANIA, 2005-09 .............................................................................. 76
FIGURE 65: AGE-SPECIFIC INCIDENCE RATES FOR ALL CANCERS COMBINED*, TASMANIA 2005-09 .................................................. 77
FIGURE 66: ALL CAUSES CANCER INCIDENT CASE PROJECTIONS, POPULATION 65 YEARS AND OVER, TASMANIA, 1996-2051 .... 78
FIGURE 67: MOST COMMON CANCERS DIAGNOSED IN TASMANIAN MALES, 2005-09 ........................................................................ 78
FIGURE 68: MOST COMMON CANCERS DIAGNOSED IN TASMANIAN FEMALES, 2005-09 .................................................................... 78
FIGURE 69: AGE-STANDARDISED INCIDENCE RATES FOR THE TOP FIVE CANCERS IN TASMANIA AND AUSTRALIA, 2005-09 ........ 79
FIGURE 70: AGE-STANDARDISED MORTALITY RATES FOR SELECTED CANCERS, TASMANIA AND AUSTRALIA, 2007-10 ................. 80
FIGURE 71: AGE-STANDARDISED INCIDENCE RATE FOR PROSTATE CANCER (ICD-10 C61) BY REGION, TASMANIA, 2005-09 ... 81
FIGURE 72: AGE-STANDARDISED INCIDENCE RATE FOR PROSTATE CANCER (ICD-9 185, ICD-10 C61), TASMANIA, 1986-2009
.............................................................................................................................................................................................................. 81
FIGURE 73: AGE-STANDARDISED MORTALITY RATE FOR PROSTATE CANCER (ICD-9 195, ICD-10 C61), TASMANIA, 1978-2010
.............................................................................................................................................................................................................. 82
FIGURE 74: AGE-STANDARDISED INCIDENCE RATE FOR BREAST CANCER (ICD-10 C50) BY REGION, TASMANIA, 2005-09 ........ 82
FIGURE 75: AGE-STANDARDISED INCIDENCE RATE FOR BREAST CANCER (ICD-9 174, ICD-10 C50), TASMANIA, 1986-2009 .. 83
FIGURE 76: AGE-STANDARDISED MORTALITY RATE FOR BREAST CANCER (ICD-9 174, ICD-10 C50), TASMANIA, 1978-2010 . 83
FIGURE 77: AGE-STANDARDISED INCIDENCE RATE FOR COLORECTAL CANCER (ICD-10 C18-C21) BY REGION, TASMANIA,
2005-09 ............................................................................................................................................................................................... 84
FIGURE 78: AGE-STANDARDISED INCIDENCE RATE FOR COLORECTAL CANCER (ICD-9 153-154, ICD-10 C18-C21),
TASMANIA, 1986-2009...................................................................................................................................................................... 84
FIGURE 79: AGE-STANDARDISED MORTALITY RATE FOR COLORECTAL CANCER (ICD-9 153-154, ICD-10 C18-C21),
TASMANIA, 1978-2010...................................................................................................................................................................... 85
FIGURE 80: AGE-STANDARDISED INCIDENCE RATE FOR LUNG CANCER (ICD-10 C33-C34) BY REGION, TASMANIA, 2005-09 . 85
FIGURE 81: AGE-STANDARDISED INCIDENCE RATE FOR LUNG CANCER (ICD-9 162, ICD-10 C33-C34), TASMANIA, 1986-2009
.............................................................................................................................................................................................................. 86
FIGURE 82: AGE-STANDARDISED MORTALITY RATE FOR LUNG CANCER (ICD-9 162, ICD-10 C34), TASMANIA, 1978-2010 .... 86
FIGURE 83: AGE-STANDARDISED INCIDENCE RATE FOR MELANOMA OF SKIN (ICD-10 C43) BY REGION, TASMANIA, 2005-09 . 87
FIGURE 84: AGE-STANDARDISED INCIDENCE RATE FOR MELANOMA OF SKIN (ICD-9 172, ICD-10 C43), TASMANIA, 1986-2009
.............................................................................................................................................................................................................. 87
FIGURE 85: AGE-STANDARDISED MORTALITY RATE FOR MELANOMA OF SKIN (ICD-9 172, ICD-10 C43), TASMANIA, 1978-2010
.............................................................................................................................................................................................................. 88
FIGURE 86: AGE-STANDARDISED INCIDENCE RATE FOR LYMPHOMAS (ICD-10 C81-C85) BY REGION, TASMANIA, 2005-09...... 88
FIGURE 87: AGE-STANDARDISED INCIDENCE RATE FOR LYMPHOMA (ICD-9 200-202, ICD-10 C81-C85), TASMANIA, 19862009 ..................................................................................................................................................................................................... 89
x
FIGURE 88: AGE-STANDARDISED MORTALITY RATE FOR LYMPHOMAS (ICD-9 200-202,ICD-10 C81-C85),TASMANIA,19782007 ..................................................................................................................................................................................................... 89
FIGURE 89: AGE-STANDARDISED INCIDENCE RATE FOR CERVICAL CANCER (ICD-10 C53) BY REGION, TASMANIA, 2005-09 .... 90
FIGURE 90: AGE-STANDARDISED INCIDENCE RATE FOR CERVICAL CANCER (ICD-9 180, ICD-10 C53), TASMANIA, 1986-2009
.............................................................................................................................................................................................................. 90
FIGURE 91: AGE-STANDARDISED MORTALITY RATE FOR CERVICAL CANCER (ICD-9 180, ICD-10 C53), TASMANIA, 1978-2010
.............................................................................................................................................................................................................. 91
FIGURE 92: PREVALENCE OF HYPERTENSION AND HIGH BLOOD CHOLESTEROL*, TASMANIA AND AUSTRALIA, 2011-12 ............. 92
FIGURE 93: PREVALENCE OF HYPERTENSIVE DISEASE AND HIGH CHOLESTEROL*, TASMANIA 1995-2011-12 .................................. 93
FIGURE 94: AGE-STANDARDISED HOSPITAL SEPARATION RATE FOR ISCHAEMIC HEART DISEASE (ICD-10 I20-I25), ....................... 93
FIGURE 95: AGE-STANDARDISED HOSPITAL SEPARATION RATE FOR ISCHAEMIC HEART DISEASE (ICD-10 I20-I25), ....................... 94
FIGURE 96: AGE-STANDARDISED MORTALITY RATE FOR ISCHAEMIC HEART DISEASE (ICD-10 I20-I25) BY REGION, ...................... 94
FIGURE 97: AGE-STANDARDISED MORTALITY RATE FOR ISCHAEMIC HEART DISEASE (ICD-9 410-414, ICD-10 I20-I25)
TASMANIA, 1978-2010...................................................................................................................................................................... 95
FIGURE 98: AGE-STANDARDISED HOSPITAL SEPARATION RATE FOR STROKES (ICD-10 I60-I69, G45-G46) BY REGION,
TASMANIA, 2007-11 .......................................................................................................................................................................... 96
FIGURE 99: AGE-STANDARDISED HOSPITAL SEPARATION RATE FOR STROKES (ICD-10 I60-I69, G45-G46), TASMANIA, 2000-11
.............................................................................................................................................................................................................. 97
FIGURE 100: AGE-STANDARDISED MORTALITY RATE FOR STROKES (ICD-10 I60-I69, G45-G46) BY REGION, TASMANIA 2007-10
.............................................................................................................................................................................................................. 98
FIGURE 101: AGE-STANDARDISED MORTALITY RATE FOR STROKES (ICD-9 430-438, ICD-10 I60-I69), ........................................ 98
FIGURE 102: PREVALENCE OF SELF-REPORTED DIABETES MELLITUS BY DIABETES TYPE*, TASMANIA AND AUSTRALIA, 2011-12 .... 99
FIGURE 103: PREVALENCE OF SELF-REPORTED DIABETES MELLITUS*, TASMANIA 1995-2011-12 .....................................................100
FIGURE 104: AGE-STANDARDISED HOSPITAL SEPARATION RATE FOR DIABETES (ICD-10 E10-E14) BY REGION, TASMANIA 200711........................................................................................................................................................................................................101
FIGURE 105: AGE-STANDARDISED HOSPITAL SEPARATION RATE FOR DIABETES (ICD-10 E10-E14), TASMANIA 2000-2011 ..... 102
FIGURE 106: AGE-STANDARDISED MORTALITY RATE FOR DIABETES (ICD-10 E10-E14) BY REGION, TASMANIA, 2007-10 ........ 102
FIGURE 107: AGE-STANDARDISED MORTALITY RATE FOR DIABETES (ICD-9 250, ICD-10 E10-E14), 1978-80 – 2008-10 ....... 103
FIGURE 108: AGE-STANDARDISED HOSPITAL SEPARATION RATE FOR TRANSPORT INJURIES (ICD-10 V01-V99) BY REGION,
TASMANIA 2007-2011.....................................................................................................................................................................104
FIGURE 109: AGE-STANDARDISED HOSPITAL SEPARATION RATE FOR TRANSPORT INJURIES (ICD-10 V01-V99), TASMANIA 200011........................................................................................................................................................................................................105
FIGURE 110: AGE-STANDARDISED MORTALITY RATE FOR TRANSPORT INJURIES (ICD-10 V01-V99) BY REGION, TASMANIA 200710........................................................................................................................................................................................................106
FIGURE 111: AGE-STANDARDISED MORTALITY RATE FOR TRANSPORT INJURIES (ICD-9 E800-E848, ICD-10 V01-V99),
TASMANIA, 1978-80 – 2008-10 ....................................................................................................................................................106
FIGURE 112: AGE-STANDARDISED HOSPITAL SEPARATION RATE FOR QUAD BIKE INJURIES (ICD-10-AM V86.2), ........................ 107
FIGURE 113: CRUDE HOSPITALISATION RATES OF FARM-RELATED INJURIES (ALL-CAUSE) BY AGE AND SEX, TASMANIA 2007-11
............................................................................................................................................................................................................109
FIGURE 114: CRUDE HOSPITALISATION RATES OF FARM-RELATED INJURIES (ALL-CAUSE), TASMANIA 2002-11 ............................ 109
FIGURE 115: AGE-STANDARDISED HOSPITAL SEPARATION RATE FOR ACCIDENTAL FALLS (ICD-10 W00-W19) BY REGION,
TASMANIA 2007-11 .........................................................................................................................................................................110
FIGURE 116: AGE-STANDARDISED HOSPITAL SEPARATION RATE FOR ACCIDENTAL FALLS ( ICD-10 W00-W19), AGE 65 YEARS
AND OVER, TASMANIA, 2000-11....................................................................................................................................................110
FIGURE 117: AGE-STANDARDISED MORTALITY RATE FOR ACCIDENTAL FALLS (ICD-10 W00-W19), AGE 65 YEARS AND OVER BY
REGION, TASMANIA, 2007-10 ........................................................................................................................................................111
FIGURE 118: AGE-STANDARDISED MORTALITY RATE FOR ACCIDENTAL FALLS (ICD-9 E880-E888, ICD-10 W00-W19), AGE 65
YEARS AND OVER, TASMANIA, 1978-80-2005-07 .......................................................................................................................111
FIGURE 119: PREVALENCE OF DIAGNOSED MENTAL AND BEHAVIOURAL PROBLEMS BY JURISDICTION, 2011-12 .......................... 112
FIGURE 120: PREVALENCE OF MENTAL AND BEHAVIOURAL PROBLEMS BY AGE, TASMANIA, 2011-12 .............................................113
FIGURE 121: PREVALENCE OF HIGH/VERY HIGH PSYCHOLOGICAL DISTRESS BY JURISDICTION, 18 YEARS AND OVER, TASMANIA
2011-12 .............................................................................................................................................................................................113
FIGURE 122: PREVALENCE OF HIGH/VERY HIGH PSYCHOLOGICAL DISTRESS BY AGE GROUP, 18 YEARS AND OVER, TASMANIA
2011-12 .............................................................................................................................................................................................114
FIGURE 123: AGE-STANDARDISED MORTALITY RATES FOR SUICIDE (ICD-10 X60-X84) BY REGION, TASMANIA 2007-10 ........ 114
xi
FIGURE 124: AGE-STANDARDISED MORTALITY RATE FOR SUICIDE (ICD-9 E950-E959, ICD-10 X60-X84), TASMANIA, 19782011 ...................................................................................................................................................................................................115
FIGURE 125: PREVALENCE OF SELF-REPORTED CURRENT ASTHMA*, TASMANIA AND AUSTRALIA, 2011-12 .................................. 116
FIGURE 126: PREVALENCE OF SELF-REPORTED CURRENT ASTHMA*, TASMANIA, 1995-2011-12 .....................................................116
FIGURE 127: AGE-STANDARDISED HOSPITAL SEPARATION RATE FOR ASTHMA (ICD-10 J45-J46) BY REGION, TASMANIA, 2007-11
............................................................................................................................................................................................................117
FIGURE 128: AGE-STANDARDISED HOSPITAL SEPARATION RATE FOR ASTHMA (ICD-10 J45-J46) BY SEX, TASMANIA, 2000-11 117
FIGURE 129: MUSCULOSKELETAL CONDITIONS(A)(B) PREVALENCE, TASMANIA AND AUSTRALIA, 2011-12 .....................................118
FIGURE 130: MUSCULOSKELETAL CONDITIONS PREVALENCE, CRUDE RATES, TASMANIA 1995-2011-12 ......................................119
FIGURE 131: AGE-STANDARDISED HOSPITAL SEPARATION RATE FOR ARTHRITIS AND MUSCULOSKELETAL CONDITIONS (ICD-10
M05-M06, M15-M19, M80-M82) BY REGION, TASMANIA, 2007-11.......................................................................................119
FIGURE 132: AGE-STANDARDISED HOSPITAL SEPARATION RATE FOR ARTHRITIS AND MUSCULOSKELETAL CONDITIONS (ICD-10
M05-M06, M15-M19, M80-M82), TASMANIA, 2000-11...........................................................................................................120
FIGURE 133: AGE-STANDARDISED HOSPITAL SEPARATION RATE FOR RHEUMATOID ARTHRITIS (ICD-10 M05-M06) BY REGION,
TASMANIA, 2007-11 ........................................................................................................................................................................120
FIGURE 134: AGE-STANDARDISED HOSPITAL SEPARATION RATE FOR RHEUMATOID ARTHRITIS (ICD-10M05-M06), TASMANIA,
2000-11 .............................................................................................................................................................................................121
FIGURE 135: AGE-STANDARDISED HOSPITAL SEPARATION RATE FOR OSTEOARTHRITIS (ICD-10 M15-M19) BY REGION,
TASMANIA, 2007-11 ........................................................................................................................................................................121
FIGURE 136: AGE-STANDARDISED HOSPITAL SEPARATION RATE FOR OSTEOARTHRITIS (ICD-10 M15-M19), TASMANIA, 2000-11
............................................................................................................................................................................................................122
FIGURE 137: AGE-STANDARDISED HOSPITAL SEPARATION RATE FOR OSTEOPOROSIS (ICD-10 M80-M82) BY REGION,
TASMANIA, 2007-11 ........................................................................................................................................................................122
FIGURE 138: AGE-STANDARDISED HOSPITAL SEPARATION RATE FOR OSTEOPOROSIS (ICD-10 M80-M82), TASMANIA, 2000-11
............................................................................................................................................................................................................123
FIGURE 139: AGE-STANDARDISED INCIDENCE RATE OF TREATED ESKD PER 100 000 POPULATION* BY JURISDICTION, 2009.. 124
FIGURE 140: CRUDE INCIDENCE RATES AND PROJECTIONS OF TREATED ESKD PER 100 000 POPULATION, TASMANIA 1989 2020 ...................................................................................................................................................................................................125
FIGURE 141: TOP TEN NOTIFIED INFECTIOUS DISEASES IN TASMANIA, 2007-11 ................................................................................126
FIGURE 142: NOTIFICATION RATE FOR CHLAMYDIA, TASMANIA, 2007-11 ........................................................................................127
FIGURE 143: NOTIFICATION RATE FOR CHLAMYDIA, TASMANIA AND AUSTRALIA, 1997-2011 ......................................................128
FIGURE 144: NOTIFICATION RATE FOR CHLAMYDIA BY AGE AND SEX, TASMANIA, 2007-11 ..........................................................128
FIGURE 145: NOTIFICATION RATE FOR HEPATITIS B-UNSPECIFIED, TASMANIA, 2007-11 ...............................................................130
FIGURE 146: NOTIFICATION RATE FOR HEPATITIS B-UNSPECIFIED, TASMANIA AND AUSTRALIA, 1997-2011 ............................... 131
FIGURE 147: NOTIFICATION RATE FOR HEPATITIS C-UNSPECIFIED, TASMANIA, 2007-11 ................................................................131
FIGURE 148: NOTIFICATION RATE FOR HEPATITIS C-UNSPECIFIED, TASMANIA AND AUSTRALIA, 1999-2011 .............................. 132
FIGURE 149: NOTIFICATION RATE FOR CAMPYLOBACTERIOSIS, TASMANIA, 2007-11 .....................................................................132
FIGURE 150: NOTIFICATION RATE FOR CAMPYLOBACTERIOSIS, TASMANIA AND AUSTRALIA, 1997-2011 ....................................133
FIGURE 151: NOTIFICATION RATE FOR SALMONELLOSIS, TASMANIA, 2007-11 .................................................................................133
FIGURE 152: NOTIFICATION RATE FOR SALMONELLOSIS, TASMANIA AND AUSTRALIA, 1997-2011 ...............................................134
FIGURE 153: NOTIFICATION RATE FOR GIARDIASIS, TASMANIA, 2007-11 ..........................................................................................134
FIGURE 154: NOTIFICATION RATE FOR GIARDIASIS, TASMANIA, 1997-2011......................................................................................135
FIGURE 155: NOTIFICATION RATE FOR CRYPTOSPORIDIOSIS, TASMANIA, 2007-11 ..........................................................................135
FIGURE 156: NOTIFICATION RATE FOR CRYPTOSPORIDIOSIS, TASMANIA AND AUSTRALIA, 2001-11 ............................................136
FIGURE 157: NOTIFICATION RATE FOR PERTUSSIS, TASMANIA, 2007-11 ............................................................................................137
FIGURE 158: NOTIFICATION RATE FOR PERTUSSIS, TASMANIA AND AUSTRALIA, 1997-2011 ..........................................................137
FIGURE 159: NOTIFICATION RATE FOR PNEUMOCOCCAL DISEASE (INVASIVE), TASMANIA, 2007-11 .............................................138
FIGURE 160: NOTIFICATION RATE FOR PNEUMOCOCCAL DISEASE (INVASIVE), TASMANIA AND AUSTRALIA, 2001-11 ............... 138
FIGURE 161: MENINGOCOCCAL CASE NOTIFICATIONS, TASMANIA, 2001-11 ...................................................................................139
FIGURE 162: NOTIFICATION RATE FOR ROSS RIVER VIRUS INFECTION, TASMANIA, 2007-11 .........................................................140
FIGURE 163: NOTIFICATION RATE FOR ROSS RIVER VIRUS INFECTION, TASMANIA AND AUSTRALIA, 1997-2011 ....................... 140
FIGURE 164: DAILY SMOKERS 18 YEARS AND OVER BY JURISDICTION, 2011-12 ................................................................................142
FIGURE 165: CURRENT SMOKERS* 18 YEARS AND OVER BY JURISDICTION, 2011-12 ........................................................................143
FIGURE 166: CURRENT SMOKERS* 18 YEARS AND OVER, TASMANIA, 2001-2011-12 ......................................................................143
FIGURE 167: CURRENT SMOKERS* BY AGE, TASMANIA AND AUSTRALIA, 2011-12 ...........................................................................144
xii
FIGURE 168: PROPORTION OF SECONDARY SCHOOL STUDENTS WHO ARE CURRENT SMOKERS*, TASMANIA 1984-2011......... 146
FIGURE 169: SELF-REPORTED SMOKING STATUS DURING PREGNANCY FOR PUBLIC AND PRIVATE PATIENTS, TASMANIA, 2010.. 146
FIGURE 170: ALCOHOL CONSUMPTION EXCEEDING LIFETIME RISK 2009 GUIDELINES, 18 YEARS AND OVER, TASMANIA AND
AUSTRALIA, 2011-12 .......................................................................................................................................................................147
FIGURE 171: RISKY ALCOHOL CONSUMPTION FOR LONG TERM HARM (2001 GUIDELINES), 18 YEARS AND OVER, TASMANIA,
2001-2011-12 ..................................................................................................................................................................................148
FIGURE 172: ALCOHOL CONSUMPTION EXCEEDING LIFETIME RISK 2009 GUIDELINES, 18 YEARS AND OVER, BY GENDER,
TASMANIA AND AUSTRALIA, 2011-12 ..........................................................................................................................................148
FIGURE 173: ALCOHOL CONSUMPTION EXCEEDING SINGLE OCCASION RISK 2009 GUIDELINES, 18 YEARS AND OVER BY
JURISDICTION, 2011-12 ...................................................................................................................................................................149
FIGURE 174: ALCOHOL CONSUMPTION EXCEEDING SINGLE OCCASION RISK 2009 GUIDELINES, 18 YEARS AND OVER, BY AGE,
TASMANIA AND AUSTRALIA, 2011-12 ..........................................................................................................................................149
FIGURE 175: ALCOHOL CONSUMPTION EXCEEDING SINGLE OCCASION RISK 2009 GUIDELINES, 18 YEARS AND OVER, BY
GENDER, TASMANIA AND AUSTRALIA, 2011-12 ..........................................................................................................................150
FIGURE 176: PROPORTION OF SECONDARY SCHOOL STUDENTS CONSUMING ALCOHOL EXCEEDING SINGLE OCCASION RISK,
TASMANIA 1984-2011.....................................................................................................................................................................150
FIGURE 177: SELF-REPORTED ALCOHOL CONSUMPTION DURING PREGNANCY, TASMANIA 2005-10 ............................................151
FIGURE 178: SELF-REPORTED ALCOHOL CONSUMPTION DURING PREGNANCY BY AGE GROUP, TASMANIA 2010 ....................... 151
FIGURE 179: PHYSICAL ACTIVITY LEVELS 18 YEARS AND OVER, TASMANIA AND AUSTRALIA 2011-12 ...........................................152
FIGURE 180: INADEQUATE PHYSICAL ACTIVITY, 18 YEARS AND OVER BY JURISDICTION, 2011-12..................................................153
FIGURE 181: ADEQUATE FRUIT CONSUMPTION (>2 SERVES DAILY), 18 YEARS AND OVER BY JURISDICTION, 2011-12 ................ 155
FIGURE 182: ADEQUATE VEGETABLE CONSUMPTION (>5 SERVES DAILY), 18 YEARS AND OVER BY JURISDICTION, 2011-12....... 155
FIGURE 183: ADEQUATE FRUIT AND VEGETABLE CONSUMPTION, TASMANIA, 18 YEARS AND OVER, 2004 - 2011-12 ................ 156
FIGURE 184: BREASTFEEDING INTENTION ON MATERNAL DISCHARGE, TASMANIA 2005-2010* ....................................................157
FIGURE 185: PROPORTION OF INFANTS EXCLUSIVELY BREASTFED BY AGE (PER MONTH), 2010 ......................................................158
FIGURE 186: OVERWEIGHT/OBESE* PREVALENCE, 18 YEARS AND OVER BY JURISDICTION, 2011-12 ..............................................159
FIGURE 187: OVERWEIGHT/OBESE* PREVALENCE, 18 YEARS AND OVER, TASMANIA AND AUSTRALIA, 2007-08 - 2011-12 ....... 160
FIGURE 188: OVERWEIGHT/OBESE* PREVALENCE, 18 YEARS AND OVER BY GENDER, TASMANIA, 2007-08 - 2011-12 ................ 160
FIGURE 189: OVERWEIGHT/OBESE PREVALENCE, AGE 5-17 YEARS, BY JURISDICTION, 2011-12 .......................................................161
FIGURE 190: BMI DISTRIBUTION OF SECONDARY SCHOOL STUDENTS’, AGE 12-17 YEARS BY SEX, TASMANIA 2009-10 ............. 161
FIGURE 191: PROPORTION OF SECONDARY SCHOOL STUDENTS WHO USED ILLICIT SUBSTANCES* IN THEIR LIFETIME, ............... 163
FIGURE 192: RECENT USE OF CANNABIS(A) OR OTHER ILLICIT DRUGS(B) (IN LAST 12 MONTHS), BY JURISDICTION, 2010 ............. 163
FIGURE 193: SELF-ASSESSED HEALTH, 60 YEARS AND OVER AND TOTAL ADULT POPULATION, TASMANIA 2009.......................... 165
FIGURE 194: PREVALENCE OF SELF-REPORTED DIAGNOSED HEALTH CONDITIONS, 60 YEARS AND OVER, TASMANIA 2009 ....... 166
FIGURE 195: HEALTH CHECKS COMPLETED DURING PREVIOUS TWO YEARS, 60 YEARS AND OVER, TASMANIA 2009 .................. 167
FIGURE 196: FINANCIAL INSECURITY AND FOOD INSECURITY, 60 YEARS AND OVER AND TOTAL ADULT POPULATION, TASMANIA
2009 ...................................................................................................................................................................................................168
FIGURE 197: ADEQUATE CONSUMPTION OF FRUIT AND VEGETABLES, 60 YEARS AND OVER AND TOTAL ADULT POPULATION,
TASMANIA 2009 ...............................................................................................................................................................................169
FIGURE 198: ALCOHOL CONSUMPTION EXCEEDING SINGLE OCCASION RISK 2009 GUIDELINES, 60 YEARS AND OVER AND TOTAL
ADULT POPULATION, TASMANIA 2009 .........................................................................................................................................169
FIGURE 199: BMI STATUS, 60 YEARS AND OVER AND TOTAL ADULT POPULATION, TASMANIA 2009 ............................................170
FIGURE 200: LEVEL OF PHYSICAL ACTIVITY, 60 YEARS AND OVER AND TOTAL POPULATION, TASMANIA 2009 ............................ 170
FIGURE 201: NUMBER OF GENERAL PRACTITIONERS (FTES) AND PRACTICE NURSES, TASMANIA 2011 .......................................173
xiii
Key Findings
The health of Tasmanians is generally good and improving with longer life expectancy and
good self-reported health.
•
Life expectancy has steadily improved over the period 1985 to 2011. The life expectancy of
Tasmanian males at 78.3 years is 8.4 years higher than in 1985, compared to an additional 4.9 years
for females with a current life expectancy of 82.5 years, narrowing the life expectancy gender gap by
about two years. However, Tasmania continues to have one of the lowest life expectancy of all states
and territories.
•
Aboriginal and Torres Strait Islander peoples continue to have a lower life expectancy than the
general population. In the period 2005 to 2007 the life expectancy at birth for Indigenous Australians
was estimated to be 67.2 years for males and 72.9 years for females.
•
Self-assessed health status has not changed significantly over the last few years, with almost four out
of five Tasmanians (81.6% ) reporting either good, very good or excellent health. Similarly, the
Tasmanian population aged 60 years and over generally reported very good health, with over three
quarters reporting excellent, very good or good health (75.7%).
•
The health status of Indigenous Tasmanians continues to compare unfavourably with that of nonIndigenous Tasmanians, with only 71.7% reporting excellent, very good or good health in 2008, and a
rate of profound or severe activity limitations (12%) almost three times that of non-Indigenous
Tasmanians (4.7%).
Progress is due to improved prevention, early disease detection and treatment, which is
demonstrated in declining rates of potentially avoidable deaths and potentially preventable
hospitalisations, as well as high levels of participation in cancer screening and primary care
consultations.
•
Over the period 1978 to 2007, there has been a steady decline in potentially avoidable deaths by
approximately 55%. Avoidable mortality refers to deaths before the age of 75 years that could
potentially be avoided through effective interventions against specific diseases.
•
Potentially preventable hospitalisations have not increased over the last decade and compare
favourably with the rates of other jurisdictions. From 2010-2011, only 6.7% of all hospitalisations in
Tasmania were potentially preventable.
•
Across states and territories, Tasmania had one of the highest participation rates in breast cancer
screening (58.4%) and in the National Bowel Cancer Screening Program (42.5%). However, of all
Tasmanians aged 60 years and over, only 38.7% reported to have undergone bowel cancer screening
during the previous two years.
•
In Tasmania, access to primary health care services and satisfaction with health services were
comparable to national experiences. Problems with access mainly involved General Practitioners, and
long waiting times for appointments was the most common barrier reported.
The picture of progress towards healthier lifestyles in Tasmania remains mixed, and
behavioural risk factors continue to contribute to the burden of disease.
•
Tasmania continues to have higher rates of smoking than most other states and territories. Almost
one in four Tasmanian adults (23.2%) is a current smoker, compared to one in five in 2004-05
(25.4%), with almost one-third (30.6%) of young Tasmanians aged 18-24 years smoking daily or
occasionally.
•
Alcohol consumption exceeding single occasion risk was higher in Tasmania (54.6%) than at the
national level (44.7%), and higher for younger age groups and males. Alcohol consumption exceeding
life time risk was broadly similar to the national level except for Tasmanian males, with well 35.9%
exceeding lifetime risk compared to 29.1% of males at the national level.
xiv
•
Physical activity levels remain low with more than two-thirds of Tasmanians reporting inadequate
levels of activity. Similarly, Tasmanian Secondary School students are insufficiently active, with less
than 20% reporting adequate levels of physical activity.
•
Almost two-thirds of Tasmanian adults are overweight or obese (65.6%), slightly more than three
years ago, but similar to the national level. One in seven Tasmanians (13.9%) meet national nutrition
guidelines on vegetable consumption, while breastfeeding initiation rates have been reasonably stable
over time, and iodine status has improved following fortification programs.
•
Some maternal risk behaviours have improved. Smoking during pregnancy is gradually declining, but
with 23% of Tasmanian females continuing to smoke during pregnancy, maternal smoking remains a
health problem. Similarly, consumption of alcohol during pregnancy has declined since 2005, although
maternal alcohol consumption for those aged 35 years and over remains relatively high compared to
younger females. Lastly, with about one in four pregnant females recording an obese Body Mass
Index (BMI), there are considerable implications for Tasmania’s health care system.
Health inequities are evident in a number of health outcomes, with inequalities in behavioural
risk factors continuing to contribute to inequities in health outcomes in Tasmania.
•
Social indicators present a mixed picture of progress, with some improvements in education and
incomes, but higher unemployment since 2006. However, levels of income and education remain, for
the most part, well below most other jurisdictions.
•
The estimated unemployment rate for Tasmania in 2011 was the highest of all jurisdictions at 7.4%,
compared with 5.2% nationally. Additionally, the estimated long-term unemployment rate for
Tasmania (1.5%) was the highest in the country, as was the estimated under-employment rate (9.3%).
•
Tasmania has the highest proportion of people living below the poverty line as a result of very low
median incomes and a high reliance on government income support payments. This has the effect of
lowering the health status of Tasmanians with higher prevalence of behavioural risk factors and
hospitalisations.
•
Smoking and obesity are strongly related to socio-economic status, with smoking and obesity around
twice as common for Tasmanians living in the most disadvantaged areas. Self-assessed health, as well
as potentially preventable hospitalisations and avoidable mortality, also showed significantly better
health of Tasmanians in higher socio-economic areas. Socio-economic disadvantage also adversely
affected participation in cancer screening and cancer survival rates.
•
The health of Indigenous communities continues to be worse, with lower life expectancy, core
activity limitations nearly three times the non-Indigenous rate and much poorer self-assessed health
status compared to non-Indigenous Tasmanians.
The growing prevalence of chronic conditions reflects Tasmania’s ageing population, but
better health care is driving mortality rates down.
•
There has been a downward trend for hospitalisations and mortality for a number of chronic
conditions such as strokes and ischaemic heart disease, while hospitalisations have increased for
diabetes and arthritis/musculoskeletal conditions
•
According to the National Health Survey, more than three in 10 adult Tasmanians are affected by
arthritis or some other musculoskeletal condition, and more than one in seven is diagnosed with
hypertension (13.6%). In those aged 60 years and over, one in two Tasmanians reported being
diagnosed with arthritis.
•
The most commonly diagnosed cancers from 2005 to 2009 (excluding non-melanoma skin cancer)
were prostate cancer for males and breast cancer for females. The incidence rates for both these
cancer types have increased significantly since 1979 and are projected to further increase into the
future.
xv
•
Reflecting the substantial reduction in smoking prevalence among Tasmanian males between 1986
and 2009, the male lung cancer incidence rate (age-standardised) has decreased by about 38% in this
time period. Conversely, the lung cancer incidence rate (age-standardised) for Tasmanian females,
while still lower than for males, has increased by 25% during the same period.
•
In 2010, the most common causes of death in Tasmania were cancer (28.3% of all deaths) and
ischaemic heart disease (15.6% of all deaths). The leading causes of death for Tasmanian children aged
0-14 years were perinatal and congenital diseases, while transport accidents were the leading causes
of death for people aged 15 to 24 years.
•
The Tasmanian age-standardised mortality rates for ischaemic heart disease and cerebrovascular
accident (stroke) have declined by about two-thirds for both males and females between 1978 and
2010.
•
Tasmania’s age-standardised mortality rates are higher than the Australian age-standardised mortality
rates for a number of conditions. These include cancer, diabetes mellitus, ischaemic heart disease,
strokes intentional self-harm.
xvi
Introduction
This is the third Health Indicators Tasmania report, and most of the information provided in this
report is focused on the Tasmanian population, with comparisons to other jurisdictions and
Australia as a whole where appropriate.
The best available information has been used in this report, drawn from a range of data sources
referenced throughout the report. Many data sources, such as mortality data, are national
collections. Other information, such as national census and national population health survey data
are provided by the ABS, with the AIHW providing information on other key health issues, such as
alcohol and drug use and perinatal issues. In addition, the report has included Tasmanian data from
the latest Tasmanian Population Survey (2009).
Each of the data sources used has strengths and limitations that affect how the data can be used.
Although this report is published in 2013, most of the statistics refer to 2011 or earlier. This is
because most population based surveys are collected every three to five years or even less often.
With administrative data, it takes time to process and report on data that have been collected, such
as hospital and perinatal statistics.
This report is divided into seven sections, and provides a demographic and social population profile,
issues of health equity, key health indicators, health outcomes, risk factors, primary care and a health
profile of older populations.
The Population Profile chapter focuses on population demographics and socioeconomics, both
strongly associated with health risk behaviours and health outcomes as well as demand for health
services.
The Health Equity chapter examines the associations between health inequity, health outcomes
and health risk lifestyle behaviours. Specifically, we examine significant factors underlying health
inequity - socio-economic disadvantage, geographical remoteness, Indigeneity and health literacy
differentials.
The Population Health - Key Indicators chapter explores several key health outcome/health
status domains, including hospitalisations, causes of death, disease burden, as well as hospitalisations
and deaths that could potentially have been avoided if timely and adequate primary care had been
provided. In addition we discuss how life expectancy and infant mortality have changed in Tasmania
over time, as well as how Tasmanians perceive their own health.
The Health Outcomes chapter commences with a broad overview of the prevalence of a range of
chronic diseases in Tasmania, and follows with a detailed analysis of the Tasmanian impact of specific
chronic diseases and health outcome areas. Health outcome areas covered in this chapter include
cancer, cardiovascular disease, diabetes, musculoskeletal conditions, mental health, asthma, injury,
chronic kidney disease and notifiable infectious diseases. In addition, we describe the Tasmanian
screening outcomes for three prominent cancer types – colorectal (bowel), breast and cervical
cancer.
The Risk and Protective Factors chapter details prevalence and trends of all the major
behavioural lifestyle risk factors: tobacco smoking, alcohol consumption, nutrition and physical
activity. Additionally, we examine obesity, as well as oral health and the use of illicit drugs.
The Health Profile of Population 60 Years and Over chapter concentrates specifically on
Tasmania’s older population, and incorporates behavioural risk factors, health outcomes and health
status, as well as the impact of socio-economic differentials.
The Primary Health Care chapter illustrates the extent and distribution of primary care
practitioners in Tasmania as well as usage of primary care services, including access and satisfaction
issues with these services.
17
Local Area Data on risk factor prevalence, health screening, hospitalisations and mortality (including
potentially avoidable mortality and hospitalisations), cancer incidence and infectious disease
notifications are provided in the main appendix.
18
Population Profile
This section profiles the demographic characteristics of Tasmania’s current and future population
and presents a range of socio-economic indicators of significance to population health. Demographic
data show the size, composition, distribution and expected growth of the Tasmanian population,
while socio-economic indicators focus on employment, income, and education.
Population Distribution
According to the most recent census conducted in 2011,
Tasmania’s resident population was 495354 people,
representing 2.3% of Australia’s total population of 21 507 719
people.
Tasmania’s population is one of the most regionally dispersed
of any jurisdiction, as well as having the highest proportion of
its population residing outside of the greater capital city (58%)
of all states and territories. Most Tasmanians live in urban
centres, with nearly 90% of the population living in the major
centres of Hobart, Launceston, Burnie and Devonport.
Table 1: Regional population distribution, 2011
Regions
Number
% of Tas
South
247,461
50.0%
North
137,561
27.8%
North West
109,147
22.0%
Unincorporated Tas/No usual address
1,185
0.2%
Tasmania
495,354
100.0%
ABS, Census 2011, Table Builder
The Remoteness Structure of the Australian Standard Geographical Classification (ASGC)
disaggregates Australia into five Remoteness Area (RA) categories based on population size, ranging
from Major Cities to Very Remote. According to this classification, Tasmania has no major cities, but
consists of inner and outer regional, with very small proportions of the population residing in
remote and very remote areas.
Figure 1: Proportion of population by remoteness classification, Tasmania 2011
Outer
regional
33.2%
Inner regional
64.8%
Remote 1.5%
Very remote
0.5%
ABS, Regional Population Growth, Australia 2011
19
Age and Sex Distribution
The population pyramid below shows the distribution of age groups by sex in Tasmania. Age cohorts
from 35 to 64 years are more strongly represented than younger age cohorts of 15-34 years. There
are more females than males in older age cohorts.
Figure 2: Age and sex distribution, Tasmania 2011
85+
75-84
65-74
55-64
45-54
35-44
25-34
15-24
0-14
60000
40000
20000
0
Males
Census 2011
20000
40000
60000
Females
Compared to Australia, Tasmania has a higher proportion of people over the age of 45 years, and a
smaller proportion of younger people than at the national level.
Table 2: Population distribution by age, Australia and Tasmania, 2011
Australia
Tasmania
0-14
19.3%
19.0%
15-24
13.3%
12.6%
25-34
13.8%
11.2%
35-44
14.2%
13.1%
45-54
13.7%
14.4%
55-64
11.6%
13.5%
65-74
7.6%
9.0%
75-84
4.6%
5.2%
85+
1.9%
2.1%
ABS, Census 2011
Tasmania had the highest median age of all states and territories, reflecting Tasmania’s high
proportion of people aged 65 years and over.
Table 3: Median age by jurisdiction, 2011
NSW
Vic
QLD
WA
SA
Tas
ACT
NT
Aus
38
37
36
36
39
40
34
31
37
ABS, Census 2011
20
Aboriginal and Torres Strait Islander Population
In 2011, 19 626 residents or four per cent of Tasmania’s population identified as being of Aboriginal,
Torres Strait Islander, or both Aboriginal and Torres Strait Islander origin, well above the Australian
proportion of 2.5%.
Of all Indigenous Tasmanians, 17 741 people or 90% identified as Aboriginals, 1 172 identified as
Torres Strait Islanders, and 715 Tasmanians identified as both Aboriginal and Torres Strait Islanders.
More than 19 000 Tasmanians did not report their Indigenous status in the 2011 Census, which
means that the number of Aboriginal and Torres Strait Islanders may be significantly under-reported.
Table 4: Indigenous identification, Tasmania 2011
Aboriginals
Torres Strait Islanders
Aboriginal and Torres Strait
Islanders
Indigenous status not
stated
17 741
1 172
715
19 379
Abs, Census 2011
There has been an increase in the Indigenous populations in all jurisdictions with the exception of
the Australian Capital Territory and the Northern Territory. Since 2006, Tasmania’s Indigenous
population increased by half a per cent. This was the second highest proportional increase nationally
after the Northern Territory.
Table 5: Indigenous populations by jurisdiction, 2011 and 2006
NSW
VIC
QLD
SA
WA
TAS
NT
ACT
AUS
2011
172 621
37 990
155 825
30 431
69 664
19 626
56 776
5 155
548 369
2011 (%)
2.5%
0.7%
3.6%
1.9%
3.1%
4.0%
26.8%
1.4%
2.5%
2006 (%)
2.1%
0.6%
3.3%
1.7%
3.0%
3.5%
27.8%
1.5%
2.3%
ABS, Census 2011 and 2006
The age distribution for the Tasmanian Indigenous and non-Indigenous populations is shown in the
table below. Although there appears to be a significant difference in the age structure between
Indigenous and non-Indigenous Tasmanians, about 19 380 Tasmanians, almost equal to the number
of Aboriginal and Torres Strait Islanders peoples, did not disclose their Indigenous status.
Table 6: Age distribution by Indigenous status, Tasmania 2011
Indigenous
Non-Indigenous
Indigenous status not stated
Number
%
Number
%
Number
%
0-4 years
2 405
12.3%
27 480
6.0%
1 296
6.7%
5-14 years
4 530
23.1%
55 676
12.2%
2 485
12.8%
15-24 years
3 745
19.1%
56 146
12.3%
2 369
12.2%
25-44 years
4 720
24.0%
111 205
24.4%
4 208
21.7%
45-64 years
3 338
17.0%
130 032
28.5%
5 013
25.9%
65 years and over
889
4.5%
75 807
16.6%
4 008
20.7%
ABS, Census 2011
21
Fertility Rates
Generally, a fertility rate of 2.1 children per woman is defined as a population replacement level
Total Fertility Rate (TFR).
Total fertility rates vary substantially between states and territories, but since 2001, the TFR has
increased in each jurisdiction with the exception of the Northern Territory. In 2001, the Tasmanian
TFR was 2.07 children per woman compared to 1.72 for Australia as a whole. By 2011, Tasmania’s
TFR had increased to 2.16 children per woman, with the Australian TFR increasing to 1.88 children
per woman. (Australian Bureau of Statistics 2012)
For Tasmania, the 2011 TFR rate of 2.16 is slightly lower than the rate recorded in 2009 at 2.18 and
below the 2008 TFR rate of 2.28 children per woman.
Figure 3: Total fertility rate by jurisdiction, 2001 and 2011
NSW
Vic
QLD
SA
WA
Tas
NT
ACT
Aus
2001
1.76
1.61
1.79
1.67
1.72
2.07
2.29
1.51
1.72
2011
1.9
1.74
1.96
1.84
1.95
2.16
2.13
1.76
1.88
ABS, Births Australia, 2011, October 2012 *TFR=the average number of children that
would be born to a woman over her lifetime if she were to experience the current age
specific fertility rates through her lifetime
22
Population Growth
The Tasmanian population has increased by almost 11% since 1986, from 446 473 people to 495 354
in 2011. Since the previous Census in 2006, Tasmania’s population has grown by four per cent, the
lowest proportionate population increase of all jurisdictions, and significantly below the 8.3%
population increase at the national level since 2006.
The number of Tasmanians identifying as Aboriginal and Torres Strait Islanders increased from 6 716
in 1986 to 19 628 in 2011. By 2011 the Tasmanian Aboriginal and Torres Strait Islander community
represented four per cent of the total Tasmanian population.
Census data also show that the local government area with the biggest growth in Tasmania is
Kingborough, with Latrobe being the local government area with the highest proportionate increase
in Tasmania, growing by 13.9% to 9 833 people from 8 630 in 2006.
Table 7: Population growth, Tasmania 1986-2011
1986
1991
1996
2001
2006
2011
Total population
446 473
452 837
464 546
460 672
476 481
495,354
Non-indigenous population
439 757
443 952
450 673
444 899
459 714
475 726
Indigenous population
6 716
8 885
13 873
15 773
16 767
19 628
Indigenous population %
1.5%
2.0%
3.1%
3.6%
3.7%
4.0%
ABS, Census data 1986-2011
Tasmania's population is projected to increase slowly over the next few decades before levelling out
by around 2040. A small population decline is expected to occur from 2051 onwards. The age
composition is projected to change considerably as a result of population ageing, with a much
greater proportion of Tasmanians aged 55 years and over by 2056.
Figure 4: Projected total population* by age, Tasmania 2011-2056
85+
75-84
2056
2011
65-74
55-64
45-54
35-44
25-34
15-24
0-14
150000
100000
50000
0
50000
100000
150000
3222.0 - Population Projections, Australia, 2006 to 2101 . 2008 *Series B projections
As the graph below shows, the proportion of younger people in Tasmania is predicted to decline,
while the proportion of older Tasmanians aged 65 years and over is projected to grow over the next
45 years, from around 16% in 2011 to 27.2% by 2056.
23
Figure 5: Actual and projected population aged 65 years and over as a proportion of the total population
(Series B), Tasmania, 2006-2056
23.1%
18.5%
14.6%
2006
24.8% 25.8%
26.3% 26.3% 26.7% 27.2%
20.8%
16.1%
2011
2016
2021
2026
2031
2036
2041
2046
2051
2056
ABS, Population Projections Australia 2006-2101, cat. no. 3222.0
The growth of older populations will increase the median population age. Tasmania’s median age is
expected to continue to be the highest of all jurisdictions, with a median age of over 44.4 years by
2050. The table below shows that the gap in median age between Tasmania and Australia is also
expected to increase over this period, from 2.6 years in 2011 to 3.1 years in 2050.
Table 8: Actual and projected median age, Tasmania and Australia, 2006-2050
2006
2011
2020
2030
2040
2050
Tasmania
38.0
40.0
40.8
42.2
43.7
44.4
Australia
37.0
37.4
37.9
39.3
40.6
41.3
3222.0 - Population Projections, Australia, 2006 to 2101, 2008, Tables 1 and 17 for years 2020-2050; Census data for 2006 and 2011
Family Characteristics
In the 2011 ABS Census of Population and Housing, there were 134 196 families in Tasmania. Of
these, 39.7% were couple families with children, 42.1% were couple families without children, 17%
were one parent families and 1.3% consisted of another family type.
Compared to Australia, Tasmania has a higher proportion of couple families without children, a
smaller proportion of families with children, and a slightly higher proportion of one parent families.
Table 9: Family composition*, Tasmania and Australia, 2011
Tasmania
Australia
Couple family with no children
42.1%
37.8%
Couple family with children
39.7%
44.6%
One parent family
17.0%
15.9%
Other family type
1.3%
1.7%
ABS, Census 2011, *Includes same-sex couples families
24
In 2011, Tasmania had one of the highest proportions of single parent families (17%) of all
jurisdictions, second only to the Northern Territory, and higher than the national average. This high
proportion of sole parent families contributes to Tasmania’s high poverty rates and poorer health
outcomes (refer to Health Equity).
Figure 6: Proportion of one parent families by jurisdiction, 2011
16.3%
NSW
15.5%
Vic
16.1%
17.0%
16.3%
17.9%
14.6%
14.5%
QLD
SA
WA
Tas
NT
ACT
15.9%
Aust
ABS, Census 2011
Tasmania’s high proportion of sole parent families has remained almost unchanged since 2001.
Table 10: One parent families, Tasmania, 2001-2011
Census year
Number
%
2001
20 476
16.5%
2006
21 471
16.7%
2011
22 824
17.0%
ABS, Census 2011, 2006, 2001
Education
Education levels can affect a wide range of health behaviours and outcomes in their impact on socioeconomic status. Even though education levels have progressively increased in Tasmania, from 31.3%
of Tasmanians aged 15 years and over completing year 12 in 2006 to 36.5% in 2011, Tasmania
significantly lags behind other jurisdictions and Australia in attaining higher levels of education. The
figure below shows the total proportion of people 15 years and over who had completed year 12,
not year 12 retention rates.
25
Figure 7: Completed year 12, by jurisdiction, aged 15 years and over, 2011
69.1%
49.2%
51.7%
48.0%
44.8%
49.2%
49.1%
36.5%
NSW
Vic
Qld
SA
WA
Tas
39.9%
NT
ACT Australia
ABS, Census 2011
Of all Tasmanians aged 15 years and over reporting on their highest level of schooling in 2011, 36.5%
of Tasmanians aged 15 years and over reported to have year 12 as their highest level of schooling,
with 32.6% reporting completion of year 10, and 8.4% reporting completing year 11.
Figure 8: Highest level of schooling completed, 15 years and over, Tasmania 2011
Year 10
32.6%
Year 9
8.5%
Year <8
5.8%
Not stated
7.8%
Year 11
8.4%
ABS, Census 2011
Year 12
36.5%
Employment
For physical and mental health, generally employment is good and unemployment is bad. Long-term
unemployment in particular may not only cause poverty, but may also lead to related social
consequences which include health problems, a loss of self confidence, together with stress on
families, children and relationships.
The size of the labour force is determined by the total number of people 15 years and over who are
willing and able to work. It includes everyone who is working or actively looking for work. In
December 2012, Tasmania had a total labour force of about 250 500 people.
The proportion of the total population who are actually in the labour force is known as the
participation rate. For December 2012, Tasmania had a workforce participation rate of 60.2%, well
below that of other jurisdictions and lower than the national rate of 65.1%, but similar to the
participation rate for 2011. A significant contributing factor to Tasmania’s low labour force
participation rates is Tasmania’s ageing population.
26
Table 11: Workforce participation rates by jurisdiction, 2011 and December 2012
NSW
Vic
Qld
SA
WA
Tas
NT
ACT
Aus
2011
63.6%
65.4%
67.3%
63.3%
67.9%
60.9%
75.2%
72.1%
65.6%
2012
63.3%
65.2%
66.0%
63.1
69.3%
60.2%
74.7%
72.5%
65.1%
ABS, Labour Force Australia, 2011; http://www.deewr.gov.au/lmip/default.aspx?LMIP/LFR_LFR_LM_byLFR_ParticipationRate
27
As defined by the ABS, the unemployed are those aged 15 years or more who are not employed,
but are actively seeking work and are available to start work within four weeks.
In December 2012, Tasmania had the highest rate of unemployment (7.3%) of all jurisdictions, almost
twice the rate of the Northern Territory.
Figure 9: Unemployment rates by jurisdiction, December 2012
4.3
WA
4.2
ACT
3.8
NT
5.1
NSW
6.2
Qld
5.6
Vic
5.8
SA
7.3
Tas
5.8
Aus
http://www.deewr.gov.au/lmip/default.aspx?LMIP/LFR_LFR_LM_byLFR_ParticipationRate
Socio-demographic characteristics most likely to be associated with protracted periods of long-term
unemployment are low levels of education, low-skilled employment experience, having some
disability, and coming from an indigenous background. 1
The ABS defines the long-term unemployed as people who have been unemployed continuously for
52 weeks or more. As a percentage of the labour force, Tasmania recorded the highest long-term
unemployment rate (1.7% or 4 200 people) of all jurisdictions in the year to December 2012. The
average duration of unemployment by December 2012 was 47.4 weeks.
Table 12: Long-term unemployment rates* by jurisdiction, December 2012
NSW
Vic
Qld
SA
WA
Tas
NT
ACT
Aust
1.1%
0.9%
1.0%
1.2%
0.5%
1.7%
0.4%
0.4%
1.0%
Department of Treasury and Finance Tasmania, Long Term Unemployment, December 2012
*as a % of the labour force and year average estimate
The under-employment rate is a useful companion to the unemployment rate, as under-employment
also has social and economic implications. Under-employment rates refer to the proportion of
employees in the labour force who work part-time but would prefer to work more hours.
The national Household, Income and Labour Dynamics (HILDA) longitudinal survey that commenced
in 2001 found that part-time under-employment is much higher among females, young people, sole
parents and single people, and among those with low educational attainment. The survey found that
for both males and females, underemployment among part-time workers is associated with a
significantly higher likelihood of receiving income support payments. 2
1
Department of Treasury and Finance, Long Term Unemployment in Tasmania: A Statistical Analysis, June 2005
Wilkins R., Unemployment in Australia: Evidence from the HILDA Survey, Melbourne Institute of Applied Economic and Social Research,
2004
2
28
Tasmania had the highest rate (9.3%) of under-employment of all jurisdictions in 2011. The rate is
based on the number of Tasmanians who were employed part-time but wanted to work more hours
(22 000), as a proportion of all employed Tasmanians (237 500).
Figure 10: Under-employment rates by jurisdiction, 2011
NT
3.4%
ACT
5.5%
WA
5.6%
Qld
6.3%
Vic
7.4%
NSW
7.7%
SA
8.0%
Tas
9.3%
Tasmania Together, Progress Report 2012, p.152; ABS, Underemployed Workers Australia, 2012
Although rates of under-employment have risen nationally, Tasmania’s rates over the last 10 years
have been generally higher than Australian rates.
Figure 11: Under-employment rates, Tasmania and Australia, 2001-11
9.3%
10%
8%
6%
7.1%
7.1%
6.5%
5.2%
4%
Tasmania
2%
Australia
0%
2001 2002 2003 2004 2005 2006 2007 2008 2009 2010 2011
Tasmania Together, Progress Report 2012, p.152
There were some employment differences across regions in 2011. The North West region had the
lowest employment participation rates at 56.8%, and the highest unemployment rates.
29
Table 13: Employment characteristics by region, 2011
South
North
North West
Tasmania
Working age population (15-64)
162 100
95 400
73 400
330 900
Participation rate 15+
60.8%
62.4%
56.8%
60.3%
Unemployment rate 15+
5.8%
7.1%
9.4%
7.4%
Youth unemployment rate (15-24)
13.4%
13.2%
17.4%
14.2
Teenage unemployment rate (1519)
26.0%
24.0%
26.8%
25.6%
http://www.deewr.gov.au/lmip/default.aspx?LMIP/LFR/Tas
30
Income
Having a sufficient income to lead a healthy lifestyle is protective of health, with low incomes
contributing to more lifestyle risk factors and ill-health.
The 2011 Census collected personal income for all people aged 15 years and over. People were
asked to report the total of their wages or salaries, government benefits and any other income they
usually receive. Tasmanians reported the lowest individual income of all jurisdictions at $499 a week
and significantly below the national level, similar to 2001 and 2006.
Table 14: Median weekly gross individual income by jurisdiction, 2001-2011
NSW
Vic
Qld
SA
WA
Tas
NT
ACT
Aust
2011
$561
$561
$587
$534
$662
$499
$745
$918
$577
2006
$461
$456
$476
$433
$500
$398
$549
$722
$466
2001
$386
$380
$359
$345
$374
$314
$442
$543
$375
ABS, Census 2011, 2006, 2001
Similarly, the Census shows that Tasmania’s household median income is the lowest of all
jurisdictions at $948 a week, and well below the Australian median of $1 234 a week.
Figure 12: Median weekly gross household income* by jurisdiction, 2011
$1,920
$1,674
$1,415
$1,237 $1,216 $1,235
NSW
Vic
Qld
$1,234
$1,044
SA
$948
WA
Tas
NT
ACT
Aust
ABS, Census 2011; *15 years and over
Median incomes in Tasmania are low compared to other jurisdictions because incomes in Tasmania
derived from salaries and businesses are lower than in other jurisdictions. The table below sets out
household incomes by income source, with Tasmania showing the lowest incomes from business and
wages/salaries of all states and territories.
Table 15: Median weekly gross household income by income source and jurisdiction, 2011
NSW
Vic
Qld
SA
WA
Tas
ACT/NT
Aust
Wages/Salaries
$926
$916
$894
$903
$931
$815
1 021
$916
Business
$598
$607
$678
$718
$637
$590
$690
$637
NATSEM, Cost of Living Indicators for Tasmania, June 2011 (National Centre for Social and Economic Modelling June 2011)
31
The total proportion of Tasmanian households relying on income support payments is 31%, the
highest proportion of any jurisdiction. Of these households, 23% are recipients of either an age
pension or a disability pension.
Figure 13: Income support payments as a proportion of all households by jurisdiction, 2011
Other
Age/Disability
7.9
7.9
5.9
17.7
6.9
5.8
16.5
17.3
6.2
5.0
23.1
21.6
4.8
15.5
17.2
6.1
NSW
Vic
Qld
SA
WA
Tas
ACT/NT
Aust
NATSEM, Cost of Living Indicators for Tasmania, June 2011
Private Health Insurance
Private health insurance provides the insured with access to a broader range of health services than
available in the public system alone, and generally provides more timely access to health services
when required. (Private Health Insurance Administrative Council December 2011)
The relationship between household income and private health insurance is affected by income. In
2005, only 24% of Australians in households with incomes below $25 000 a year were covered by
private health insurance compared to 69% of those in households with incomes over $ 100 000 per
year. 3
In 2011, 43.9% of Tasmanians had private health insurance, slightly below the national average of
45.7%, but higher than for 2006 (42.5%). This increase is in line with the other jurisdictions which all
demonstrated higher levels of private health insurance coverage. 4
Figure 14: Private health insurance participation by State and Territory, 2011
56.4%
52.6%
46.3%
43.7% 43.5% 45.1%
45.7%
43.9%
37.3%
NSW
VIC
QLD
SA
WA
TAS
NT
ACT
AUST
Private Health Insurance Administrative Council, Annual Coverage Survey, Dec 2011
3
4
Denniss R., Who benefits from private health insurance in Australia?, Australia Institute, 2005
Ibid.
32
Health Expenditure
Health is an expensive business, with an estimated national total of $121.4 billion spent on health in
2009-10, or the equivalent of 9.4% of gross domestic product (GDP). In 1999-00, the total national
health spending on health was $72.2 billion or 7.9% of GDP. The Australian government funds about
two-thirds of all health expenditure, with the balance provided by state and territory governments.
A measure commonly used to describe the relative size of the health system and to monitor changes
over time is the health to GDP spending ratio, which estimates health expenditures as a percentage
of spending on all types of goods and services. The graph below shows that from 1999-00 to 200910, Australia’s health to GDP spending ratio increased from 7.9% to 9.4%.
Figure 15: Health to GDP spending ratio, Australia 1999-00 – 2009-10
9.4%
8.3%
8.5%
8.7%
8.7%
2005-06
2007-08
7.9%
1999-00
2001-02
2003-04
2009-10
AIHW, Australia's Health 2012, p.469
Australia is not alone in facing growing health expenditures. Throughout OECD countries, spending
on health services has increased at a faster rate than total spending on goods and services. In 1999,
the median rate of health spending in OECD countries was 7.8% of GDP compared to 9.6% in 2009,
with the highest proportion in the United States at 17.4% and the lowest in South Korea with 6.9%. 5
While the health to GDP spending ratio allows for comparisons at a broad level, population figures
can be used to derive estimates of total health expenditure per person. The graph below shows the
increase in per person health expenditures for Tasmania from $3 893 per person in 2000-01 to
$5 276 by 2009-10 (Productivity Commission 2012).
Figure 16: Total health expenditure per person, Tasmania and Australia 2000-01 – 2009-10
$5,479
$4,905
$5,276
$4,427
$4,011
$3,893
$4,689
$4,151
Tas
2000-01
2003-04
Aus
2006-07
2009-10
Report on Government Services 2012, Health Sector Summary, Table EA.5
5
AIHW, Australia’s health 2012, Canberra 2012
33
Health Equity
Health equity is the removal of avoidable barriers and circumstances that prevent equitable access
and opportunity to improved health and wellbeing outcomes. An equitable approach to health means
that people’s needs guide the distribution of opportunities for wellbeing. Equity in health is not about
eliminating all health differences so that everyone has the same level of health but rather it is
concerned with creating equal opportunities for health and actively seeking to reduce the differences
in health status between different groups and communities. 6
Inequities are evident in many health outcomes, such as mortality, morbidity, life expectancy and
self-assessed health. Inequities are also evident in risk and protective factors associated with health,
and in the use of some health and preventative services. These inequities cover a range of social and
economic indicators, including Aboriginality, income, education, occupation, and employment status,
as well as disadvantages caused by geographic location, such as distance from health services.
Some summary measures are available to estimate health inequities, but there are gaps in the data
and measures used to estimate the extent of health inequities.
Socio-economic Disadvantage
Health inequities may arise from a number of socio-economic conditions, with the most important
ones including income, employment status, level of education, and occupation. Of specific relevance
to health inequity is poverty, which describes the inability to afford essential goods and services,
such as adequate health and dental care, food, housing, education, as well as reduced employment
opportunities,
Poverty can be measured using ‘poverty lines’, which indicate minimum levels of income necessary to
achieve an acceptable standard of living. A commonly used poverty line refers to the disposable
income of households (the amount of income available for spending) and defines a household as
being below the poverty line if it has no more than half of the median (midpoint average) disposable
income of all households. 7
The National Centre for Social and Economic Modelling (NATSEM) calculated jurisdictional poverty
rates by using the half of median equivalised disposable income of jurisdictions as the poverty line. At
10.5%, Tasmania had the highest poverty rate of all jurisdictions. NATSEM concluded that Tasmania's
high poverty rate is the result of Tasmania’s very low median income and very high reliance on
government income support payments (see income and employment in Chapter 1).
Figure 17: -Estimated poverty rates for states and territories, 2011
10.5%
8.4%
6.7%
6.7%
Qld
NSW
7.4%
5.6%
4.4%
ACT/NT
WA
Vic
SA
NATSEM, Cost of Living Indicators for Tasmania: Final Report, June 2011.
6
7
DHHS, Working in Health Promoting Ways – Background Paper 2010
NATSEM, Cost of Living Indicators for Tasmania: Final Report, June 2011
34
Tas
Income affects how people rate their health status, with marked differences in self-assessed health
between the highest and lowest income households. Tasmanians in the lowest income households
reported statistically significantly less excellent/very good health and statistically significantly more
fair/poor health than Tasmanians in the highest income household.
Figure 18: Self-assessed health by household income quintiles, population 18 years and over,
Tasmania 2009
Excellent/Very Good
Fair/Poor
51.7%
47.3%
44%
38.4%
31%
31.7%
26.2%
16.6%
Lowest income
2
3
15.9%
4
12.1%
Highest income
Tasmanian Population Health Survey, 2009
The measures of socio-economic status that take into account local environments are the Socioeconomic Indexes for Areas (SEIFA). Of the four different indices available, the most commonly used
index is the Index of Relative Disadvantage. This index is a general socio-economic index that
summarises socio-economic information, such as household income, education and employment
levels.
The graph below shows the proportion of the population located in the most disadvantaged quintile
in each jurisdiction according to a methodology used by the ABS. Of all jurisdictions, Tasmania had
the greatest proportion of the population (31.7%) in the most disadvantaged quintile of this SEIFA
index in 2007-08.
Figure 19: Proportion of population in the lowest quintile of the SEIFA Index of Relative Disadvantage by
jurisdiction, 2007-08
31.7%
29.7%
24.3%
20.9%
13.7%
16.2%
17.2%
Vic
Qld
1.8%
ACT
WA
NSW
SA
Tas
ABS, SEIFA 2006; National Healthcare Agreement Performance Report 2009-10, Table 1.2
35
NT
Potentially preventable hospitalisations are conditions where hospitalisation is believed to be
avoidable through timely and adequate primary care interventions.
Potentially preventable hospitalisations are significantly affected by socio-economic disadvantage.
Separation rates for the most disadvantaged SEIFA quintile (26.2 per 1 000 population) were almost
30% higher than separation rates for the least disadvantaged quintiles at 19.3 per 1 000 population,
with a clear gradient across quintiles. See the chapter on Population Health - Key Indicators for
additional information.
Figure 20: Potentially preventable hospitalisations by socio-economic status (SEIFA), Tasmania 2009-11
Rate per 1 000 population
30.0
26.2
24.4
25.0
21.4
21.3
3
4
19.3
20.0
15.0
10.0
5.0
0.0
Most
disadvantaged
2
Least
disadvantaged
Notes: 1. Rates are age standardised to the Australian 2001 population. 2. The error
bars represent the 95% confidence intervals of the rate.
Similarly, avoidable mortality rates, defined as deaths amenable to screening and other primary care
prevention such as immunisations, are a good measure of health inequities when combined with
socio-economic status.
The graph below, using three-year rolling averages, shows the avoidable death rate in 2005-07 as
155.7 for the least disadvantaged quintile and 232.6 per 100 000 population for the most
disadvantaged quintile. The gap between these two rates in 1998-2000 was 59.9 per 100 000
population compared to 76.9 per 100 000 population in 2005-07. See Population Health-Key Indicators
for further details on avoidable mortality.
Figure 21: Avoidable mortality by socio-economic status (SEIFA), age 0-74 years, agestandardised rates per 100 000 population, Tasmania 1998-00 – 2005-07
258.6
256.1
255.3
259.2
254.4
243.8
235.9
232.6
198.7
194.6
186.8
174.8
Avoidable mortality gap
between least and most
disadvantaged rate over time
84.4
59.9 61.5
68.5
96.1
85.9
158.3
157.9
156.8
155.7
Least disadvantaged
quintile
79.1 76.9
Most disadvantaged
quintile
1998-00 1999-01 2000-02 2001-03 2002-04 2003-05 2004-06 2005-07
DHHS, Epidemiology Unit ; Rates age standardised to the 2001 Australian population;
36
Inequities caused by socio-economic status affect some chronic conditions as well, including diabetes
and hypertension. Results from the Tasmanian Population Health Survey 2009 in the graph below show
higher prevalence rates of self-reported diagnosed diabetes and hypertension for Tasmanians living in
areas experiencing the greatest disadvantage compared to Tasmanians living in areas of least socioeconomic disadvantage. For hypertension, the difference in the proportions between quintiles one
and five, which represent the most and least disadvantaged areas, is statistically significant.
Figure 22: Self-reported diagnosed diabetes and hypertension prevalence* by socio-economic
status (SEIFA), population 18 years and over, Tasmania 2009
Hypertension
Diabetes
34.0%
30.0%
29.9%
29.3%
24.7%
8.5%
Most
disadvantaged
7.3%
6.5%
2
3
Tasmanian Population Health Survey 2009,
5.2%
5.3%
4
Least
disadvantaged
* Conditions are self-reported
Prevalences are age-standardised to the 2009 Tasmanian adult population
The estimated five-year survival rate for Tasmanians diagnosed with cancer in 2003-07 was 64%,
with a slightly higher survival for males and Tasmanians aged less than 65 years at the time of
diagnosis. Tasmanians living in areas of least socio-economic disadvantage at the time of diagnosis
had higher cancer survival rates than those living in areas experiencing the most disadvantage. This
difference is statistically significant between the lowest and highest quintiles. Poor survival outcomes
of Tasmanians in areas of greater socio-economic disadvantage may be due to a higher proportion of
cases diagnosed at an advanced stage of cancer.
Figure 23: Five-year cancer survival rates* by socio-economic status (SEIFA), Tasmania 20032007
66.7%
67.1%
4
Least
disadvantaged
63.5%
61.5%
60.9%
Most
disadvantaged
2
3
Menzies Research Institute, 2010 (unpublished data)
*using survival estimates
37
Socio-economic inequalities are important drivers of some behavioural risk factors, particularly
smoking and obesity. People who live in areas of greater socio-economic disadvantage are more
likely to take part in risky health behaviours, including combinations of several risk factor behaviours.
Smoking prevalence shows a very strong inverse linear relationship with socio-economic status. The
figure below shows smoking is about twice as prevalent within the most disadvantaged communities
(20.6%) compared to the least disadvantaged areas (10.9%), which is a statistically significant
difference.
Figure 24: Daily smoking prevalence by socio-economic status (SEIFA), population 18 years
and over, Tasmania 2009
20.6%
18.7%
16.4%
14.2%
10.9%
Most
disadvantaged
2
3
4
Least
disadvantaged
Tasmanian Population Health Survey, 2009
According to the World Health Organization, obesity is indicated with a body mass index (BMI) of
more than 30. There are differences across most socio-economic indicators between those who are
obese and those of normal weight, although these differences also reflect differences in age and
gender.
The proportion of Tasmanian adults living in areas with the greatest disadvantage who were obese
(25.8%) was almost twice that of adults living in areas with the least disadvantage and reporting to be
obese (13.2%). This difference is statistically significant.
Figure 25: Obese BMI by socio-economic disadvantage (SEIFA), population 18 years and over,
Tasmania 2009
25.8%
24.4%
19.4%
19.8%
13.2%
Most
disadvantaged
2
3
4
Least
disadvantaged
Tasmanian Population Health Survey, 2009
Fruit and vegetable consumption appear to be less influenced by socio-economics. The NHMRC
recommends a minimum daily intake of five serves or more vegetables and two or more serves of
fruit daily. Insufficient fruit consumption is reflected in socio-economic status, with Tasmanians in
disadvantaged communities more likely to report inadequate consumption than Tasmanians living in
the least disadvantaged areas. However, this difference is not statistically significant.
38
Vegetable consumption was not influenced by socio-economic factors in this survey, with less than
five serves consumed by almost 90% Tasmanians irrespective of socio-economic status.
Figure 26: Insufficient consumption of fruit and vegetables by socio-economic status (SEIFA), population 18
years and over, Tasmania 2009
fruit <2 serves daily
vegetables <5 serves daily
89.2%
89.1%
88.9%
53.3%
Most
disadvantaged
52.2%
2
89.2%
88.7%
50.5%
3
48.7%
46.0%
Least
disadvantaged
4
Tasmanian Population Health Survey, 2009
Food security, namely the ability to buy adequate food, is significantly affected by socioeconomics. In
2009, data showed a sizeable gap in food security between ‘rich’ and ‘poor’ households. Overall, five
per cent of Tasmanian adults reported to have run out of food in the last 12 months and were
unable to buy more.
The following figure shows that financial insecurity is mainly experienced by Tasmanian adults in the
least affluent households (10%), compared to less than 1% of adults in the most affluent households.
Figure 27: Proportion of adults who experienced food insecurity by household income quintiles, Tasmania,
2009
10.0%
6.2%
5.0%
2.6%
0.6%
Least affluent
2nd
3rd
4th
Most affluent
Tasmanian Population Health Survey 2009
Allied with running out of food is the inability to buy an adequate variety of nutritional foods such as
fruit and vegetables. The Tasmanian Population Health Survey 2009 showed that this was not only
due to the cost of these foods, but also a lack of access to appropriate shops.
People residing in low income households are more likely to rely on the public transport network,
the quality of which will affect access to shops and essential services. In 2009, data suggested that
low income Tasmanians were over five times more likely not to buy nutritionally adequate food due
to unreliable or inadequate public transport than high income Tasmanians. The cost of these foods,
while still significant, was not as important a factor as access.
39
Aboriginal and Torres Strait Islanders
Reliable health data for the reporting of Aboriginal and Torres Strait Islanders’ health status are
limited to information collected by national Aboriginal and Torres Strait Islander Surveys. As
Aboriginal and Torres Strait Islander status is significantly under-reported in Tasmanian
administrative datasets, deaths and hospital data are of insufficient quality to monitor and report on
Aboriginal health issues.
There are significant health inequities between the Indigenous and non-Indigenous populations.
Aboriginal and Torres Strait Islander people have higher prevalence rates of many health conditions,
particularly circulatory diseases (including heart disease), diabetes, respiratory diseases and kidney
disease. They also have a lower life expectancy and more disability. Some of these inequities may be
due to greater socio-economic disadvantage like lower income, education and higher unemployment
or/and be related to higher rates of lifestyle risk factors mirroring socio-economic disadvantage.
Reliable estimates of Aboriginal and Torres Strait Islander life expectancy are confounded by
identification issues, such as uncertainty regarding Indigenous identification in deaths data and selfidentification issues in Census data collections, but some broad national estimates are available.
The table below shows that for the period 2005-07, Indigenous life expectancy nationally was 11.5
years lower for males and 9.7 years lower for females than that of the non-Indigenous population.
Tasmanian life expectancy data for Indigenous people are not available.
Table 16: Life expectancy at birth by Indigenous status, Australia 2005-07
Indigenous
Non-Indigenous
Males
67.2
78.7
Females
72.9
82.6
Australian Health Ministers Advisory Council, Aboriginal and Torres Strait Islander Health Performance Framework Report 2010, 2011, p.51
There are differences in the prevalence of disabilities among Indigenous and non-Indigenous people.
The proportion of Indigenous Tasmanians who reported a profound or severe core activity
limitation in 2008 was 2.5 times that reported by non-Indigenous Tasmanians, which is a statistically
significant difference.
Table 17: Profound/severe core activity limitation by Indigenous status, 18 years and over, 2008
Indigenous
Non-Indigenous
Tasmania
12.0%*
4.7%*
Australia
10.3%
4.7%
AIHW, Aboriginal and Torres Strait Islander Health Performance Framework Report, Tasmania, 2010
* Statistically significant difference at the 95%CI
Similarly, Census data shows 6.6% of all Aboriginal and Torres Strait Islander people in Tasmania
needed help with core activities due to disabilities, compared to 5.8% of non-Indigenous Tasmanians.
Table 18: Need for assistance with core activities* by Indigenous status, Australia 2011
Indigenous
Non-Indigenous
Tasmania
6.6%
5.8%
Australia
7.7%
4.3%
* Refers to self-care, mobility and communications and age-standardised to the Australian population 2001
ABS, Census 2011
40
Tasmanian Aboriginal and Torres Strait Islander people were nearly twice as likely as non-Indigenous
Tasmanians to rate their health as fair or poor. Differences in age-standardised proportions of
excellent, fair, and poor health were statistically significant. Poorer perceived health status may be
associated with lower income and education, higher unemployment, and a higher prevalence of
chronic conditions among Indigenous populations. Please note that the age-standardised rates used
below differ from the estimates of self-assessed health status cited in other sections this report.
Figure 28: Self-assessed health by Indigenous status (ASR), Tasmania 2008
35.1%
Indigenous
30.9%
Non-Indigenous
26.4%
23.3%
22.4%
17.9%*
17.5%*
11.7%
10.4%*
4.4%
excellent
very good
good
fair
poor
Aboriginal and Torres Strait Islander Health Performance Framework 2010: detailed analyses, Sept
2011 - Table 1.15.4;
*statistically dignificant difference at the 95%CI
Geographic Remoteness
Health outcomes are also affected by geographic remoteness of residence, with a strong gradient of
worse health outcomes and increased risk factor prevalence in remote/very remote areas compared
to urban areas. Reasons for poorer health outcomes in remote areas include problems with access
to primary health care services, greater Indigenous representation, and greater socio-economic
disadvantage impacting on education, employment and income.
As of 2011, 68.8% of Australia’s population reside in major cities and 2.2% of the population live in
remote or very remote areas as defined in the Remoteness Structure of the Australian Standard
Geographical Classification. Areas categorised as regional are divided into inner regional and outer
regional areas, with the former showing greater population density and frequently better health
outcomes than the latter.
Tasmania does not have major cities or very remote areas. Most of Tasmania is classified as regional,
with almost two-thirds of Tasmanians living in inner regional areas, and most of the remainder
residing in outer regional areas. A relatively small proportion of Tasmanians (2%) live in the remote
areas of King Island and Flinders Island.
Table 19: Population distribution by remoteness category, 2011
NSW
Vic
Qld
WA
SA
Tas
ACT
NT
Aust
Major cities
73.1%
75.3%
59.8%
71.2%
72.8%
0.0%
99.8%
0.0%
68.8%
Inner regional
20.2%
20.0%
22.0%
13.6%
12.3%
64.8%
0.2%
0.0%
19.7%
Outer regional
6.2%
4.6%
15.2%
8.9%
11.2%
33.1%
0.0%
56.1%
9.3%
Remote/very remote
0.5%
0.1%
3.0%
6.3%
3.7%
2.0%
0.0%
43.9%
2.2%
ABS, Regional Population Growth Australia, March 2012
41
Outer regional areas are more affected by low socio-economics and hence health inequities than
inner regional areas. Outer regional areas are therefore more disadvantaged communities, but not as
disadvantaged as remote/very remote communities.
If outer regional areas are combined with remote areas to quantify disadvantage, it can be shown
Tasmania has more than a third (35.1%) of the population living in disadvantaged areas. Compared
with other states and territories, this makes Tasmania the second most geographically disadvantaged
jurisdiction after the Northern Territory.
Figure 29: Population residing in outer regional, remote and very remote areas by jurisdiction, 2011
100.0%
35.1%
18.2%
NT
Tas
Qld
15.3%
WA
14.8%
SA
6.7%
4.7%
NSW
Vic
0.0%
ACT
ABS, Regional Population Growth, Australia, March 2012
As primary health care accessibility and effectiveness are reduced in rural and remote areas, rates of
potentially preventable hospitalisations (PPH) increase with geographic remoteness. The table below
highlights that separation rates are higher for more remote areas with total avoidable hospitalisation
rates twice as high for very remote areas (63.2) compared to outer regional areas (31.6).
Tasmania’s PPH rates for acute (10.2) and chronic conditions (9.7) in 2010-11 were lower than the
acute and chronic PPH rates recorded for inner and outer regional areas within Australia. These
lower than expected rates for Tasmania are mainly due to coding changes for diabetes complications
that occurred in 2008-09.
Table 20: Potentially preventable hospitalisations* by remoteness classification, 2010-11
Major
cities
Inner
regional
Outer
regional
Remote
Very
remote
Australia
Tasmania
Total acute conditions
13.2
15.2
16.3
23.6
28.9
14.2
10.2
Total chronic conditions
12.0
13.1
14.6
32.4
32.0
12.9
9.7
Total vaccine preventable
0.7
0.7
0.8
1.6
3.0
0.8
0.4
Total potentially preventable
hospitalisations
25.8
28.9
31.6
57.3
63.2
27.7
20.2
* Rates per 1 000 population age-standardised to the Australian population 2001
AIHW, Australian Hospital Statistics 2010-11, Table A5.2
42
Death rates are a useful indicator of the underlying health status of a population. Given Australia’s
geographic diversity, it is useful to look at how mortality rates differ across urban, regional and
remote regions, and how Tasmania fits in.
The graph below shows that Australians who live in regional and remote areas have higher death
rates than people who live in major cities, with rates ranging from 5.6 deaths per 1 000 population in
major cities to 9.2 deaths per 1 000 population in very remote areas. Higher death rates in more
remote and outer regional areas reflect a higher proportion of Indigenous people in these areas,
reduced service accessibility, as well as a higher prevalence of behaviours associated with poorer
health outcomes, such as smoking.
Tasmania’s three year averaged mortality rate of 6.7 per 1 000 population is slightly higher than the
national inner and outer regional rates, which would indicate a poorer health status than expected
on the basis of Tasmania’s predominantly inner regional status.
Figure 30: Standardised mortality rates* (all-cause) per 1 000 population by remoteness classification, 2011
8.2
5.6
Major
cities
6.2
6.5
Inner
regional
Outer
regional
7.0
6.7
5.8
Remote
Very
remote
Australia Tasmania
ABS, Deaths Australia 2011 Table 7.1; * 3-year averaged standardised rate per 1,000
population
Potentially avoidable mortality rates are deaths that could have been prevented with health
screening and primary prevention, such as immunisation. Tasmania’s annual average avoidable
mortality rate for 2003-07 at 198.6 per 100 000 population was higher than the national avoidable
mortality rates for both inner regional (176.4 per 100 000 population) and outer regional (195.3 per
100 000 population) areas.
Figure 31: Potentially avoidable mortality rates (all-cause) per 100 000 population by remoteness
classification, 2003-07
414.5
251.3
155.8
Major
cities
176.4
Inner
regional
195.3
Outer
regional
167.6
Remote
Very
remote
Australia Tasmania
University of Adelaide, Public Health Information Development Unit
43
198.6
Disability rates also increase by level of remoteness, with lower rates in major cities compared to
inner and outer regional/remote areas. Tasmania’s disability rate of 22.7% in 2009 was higher than
the disability rate for both inner (21.8%) and outer/remote (20.1%) regions. As these rates are not
age-standardised, Tasmania’s higher than (regionally) expected disability rate may be partly explained
by Tasmania’s older population and therefore higher rate of disability.
Figure 32: Disability rates by remoteness classification, 2009
21.8%
22.7%
20.1%
18.5%
17.3%
Major cities
Inner regional Outer regional
and remote
Australia
Tasmania
ABS, Disability Australia 2009, 2011
On average, people who live in regional and remote areas are more likely to engage in behaviours
associated with poorer health outcomes, such as smoking and physical inactivity.
Tasmania's daily smoking rate of 21.8% in 2011-12 is closer to the outer regional rate of 22.8% than
the inner regional rate of 18.5%. The same applies to risky alcohol consumption exceeding life time
risk rate of 22.7%, which came close to the outer regional/remote rate of 23.7%
Tasmania's overweight/obesity rate of 65.6% is lower than the rates for inner regional (68%) and
outer regional/remote areas (70.1%). Similarly, Tasmania’s rate for sedentary/low level exercise at
66.9% is slightly better than inner and outer regional rates of around 71%.
Figure 33: Selected behavioural risk factors by remoteness classification, 2011-12
Daily smoker
Alcohol - exceed
Sedentary/low
Overweight/obese
lifetime risk
level exercise
Inner regional
18.5%
20.7%
68.0%
Outer regional/remote*
22.8%
23.7%
70.1%
71.2%
Australia
16.3%
19.5%
63.4%
66.9%
Tasmania
21.8%
22.7%
65.6%
68.2%
71.6%
Australian Health Survey: First Results 2011-12, Table 5.3; * Outer regional and remote areas combined,
excludes very remote areas
44
Health Literacy
Health literacy includes the knowledge and skills required for people to manage their health and
wellbeing and achieve good health outcomes. The proportion of people who are not health literate
is high in Australia, and an even higher proportion of Tasmanians do not have sufficient health
literacy. Low levels of health literacy are particularly concerning considering the prevalence of
chronic conditions is rising, and health literacy is a fundamental skill necessary for citizens to
successfully manage their own conditions. Health literacy also has a significant impact on the quality,
safety and efficiency of health services because patients with low health literacy have a limited ability
to interact with services and follow instructions. 8 Increasing health literacy levels and improving
communication by services are essential in responding to the rise in chronic conditions.
Health literacy is strongly related to a person’s general level of literacy and numeracy (in fact, when
health literacy was measured by the Australian Bureau of Statistics (ABS), this was done in the
context of a person’s overall level of literacy). While literacy is generally taken to mean the ability to
read or write, it also has the broader meaning as the ability to grasp meaning and to develop critical
judgement as well as be more self-aware. 9 Poor literacy can affect people’s health in a number of
ways, including hindering the development of health literacy. 10
The term literacy may also be used to describe a person’s knowledge and ability to make decisions
within a particular subject or field, for example, the notion of nutritional literacy. 11 Similarly, to make
appropriate decisions in the field of health, a person needs to have a certain level of health literacy.
Inadequate health literacy is also understood to be an issue which may affect a person’s access to
health care, health equity and good health in general. A good level of health literacy is important for
the health-related decisions that people make in everyday life in relation to keeping healthy and well.
By improving access to health information and ability to use it effectively, health literacy is critical to
everyone’s empowerment. 12
Health literacy is increasingly recognised as an important life skill needed to navigate modern society
and the choices in everyday life, influencing health and wellbeing. 13 Because health literacy so
extensively influences wellbeing, this makes it equally relevant to other sectors of community, such
as social and human services, housing and family services.
Health Literacy and Health Outcomes
Since the concept of health literacy was argued to be a composite of functional and critical health
literacy, functional health literacy, i.e. the capacity to understand and act on oral and written
information in health care settings, has been evaluated in research.
While the broader concept of overall health literacy has not been researched thoroughly, we still
know a good level of health literacy in general provides a valuable tool for enabling people to stay
well and access health care effectively when needed, because it includes the motivation and the
ability to promote and maintain good health.
As the research and evidence base for the importance of health literacy has grown, we know there
is a relationship between health literacy and health outcomes, and lower health literacy is associated
with “poorer self-reported health, inappropriate medication use and non-compliance with physician
orders, poorer glycaemic control and increased prevalence of self-reported complications that result
Auburn University School of Pharmacy, and the University of North Carolina School of Pharmacy, Health Literacy: A
review: Consequences of Inadequate Health Literacy, 2002
9 United Nations Educational, Scientific and Cultural Organization. Background paper prepared for the Education for All
Global Monitoring Report 2006
10 World Health Organization Health Promotion Glossary, 1998, WHO, Geneva
8
11
Diamond, J. J. Development of a Reliable and Construct Valid Measure of Nutritional Literacy in Adults. Nutrition Journal, 2007,
Vol 6, p5
12 World Health Organization Health Promotion Glossary
13 Peerson A. and, Saunders M., Health literacy revisited: what do we mean and why does it matter?, Health Promotion
International, 2009, Vol 24 No 3, pp. 285-296
45
from this poor control, less health knowledge, less sharing in decision-making about treatment, less
expression of health concerns and worse communication with practitioners”. 14
Other links show those with poor health literacy skills are “less knowledgeable about health, receive
less preventive care, have worse chronic illness control, poorer physical and mental health function,
and higher emergency department and hospital utilization”. 15 Low health literacy is thought to be a
better predictor of health status than education, socio-economic status, employment, race or
gender.
Conversely, it has been shown that a higher level of health literacy in the population can improve on
preventive health choices and to reduce pressures on health systems.
How Tasmania is Performing
The Australian Bureau of Statistics (ABS) undertook the Adult Literacy and Life Skills Survey (ALLS)
in 2006. The survey identified five skill levels, where skill level 3 was “the minimum required for
individuals to meet the complex demands of everyday life”, and when applied to health literacy
specifically meant the person assessed at this level could assess product safety using information on
its label, and locate information on a medicine package about how long a medicine can be taken.
The results of ALLS showed that nationally:
•
59% of Australians do not have adequate health literacy
•
30% of Australians with a Bachelor degree qualification have inadequate health literacy
Within Tasmania, the survey showed:
•
63% of Tasmanians do not have adequate health literacy
Health inequity is created within the population because particular population groups are more likely
to have low health literacy levels. These include people with low literacy, from low socio-economic
circumstances, elderly and young people and those with chronic mental illness (Refs 10, 11). These
population groups are likely to be disadvantaged for a number of reasons and are also at a high risk
of developing chronic conditions.
In 2010 the Tasmanian Department of Health and Human Services Communication and Health
Literacy Working Group conducted face-to-face and online consultation with staff and people who
had used health and/or human services in Tasmania in the previous six months. The consultation
indicated that clients had experienced difficulty using services and understanding information and
staff felt they needed more communication training and support to respond to low health literacy.
Conclusions
Most Tasmanians have inadequate health literacy. Health literacy is a fundamental skill for
Tasmanians because it allows everyone to live the best possible healthy life and to thrive.
Health literacy is important to every Tasmanian’s overall health and quality of life. More attention
needs to be given to measuring and analysing health literacy and its complexities. The ABS ALLS
results in 2006 indicate Tasmanians’ health literacy is lower than overall Australia, but more research
and data is needed in this area. (Hibbard 2007)
14
Rootman, I. Health literacy: Where are the Canadian doctors? Canadian Medical Association Journal, 2006, No 175, pp606–
607
15 Hibbard, J. H., Peters, W. E., Dixon, A. and Tusler, M. Consumer competencies and the use of comparative quality
information: It isn’t just about literacy. Patient Care Research and Review, 2007 No 64, pp379–394
46
Population Health - Key Indicators
Health status may be measured using a wide range of indicators. This section details the more
traditional measures of health such as headline or leading indicators of health and wellbeing. It
includes self-assessed health, burden of disease rates, life expectancy, infant mortality, morbidity and
mortality, as well as avoidable morbidity and mortality. These indicators are important when
monitoring overall improvements in health or comparing improvements across regions, jurisdictions
or with Australia as a whole.
Self-Assessed Health Status
Self-assessed health status is among the most frequently assessed health perceptions in
epidemiological research. A large number of empirical studies have demonstrated how a person’s
appraisal of his or her general health is a powerful predictor of future chronic disease and mortality.
16, 17 Self-assessed health status is believed to principally reflect physical health problems (acute and
chronic conditions and physical function) and, to a lesser extent, health behaviours and mental health
problems. Although self-assessed health status is a reasonably good predictor of morbidity and
mortality at the population level, some response instability has been reported in the literature. 18
The ABS National Health Survey has consistently collected data on self-assessed health status, with
the latest iteration being run under the umbrella of the 2011-12 Australian Health Survey. In 201112, the proportion of Tasmanians aged 15 years and over who reported their health was good or
very good/excellent was 81.6%, slightly lower than the Australian proportion of 85.6%, and not
significantly different from 2007-08.
Conversely, statistically significantly more Tasmanians aged 15 years and over in 2011-12 reported
their health as fair/poor (18.4%) than for Australia in general (14.4%). (Eriksson 2001) (N and Jay
1994) (Centre for Economic Policy Research 2000)
Figure 34: Self-assessed health status, 15 years and over, Tasmania and Australia, 2011-12
53.5% 55.6%
Tas
28.1%
Aust
30.0%
18.4%*
14.4%
Excellent/Very Good
Good
Fair/Poor
Australian Health Survey First Results, 2011-12, cat. No. 4364.0
* Statistically significantly different
16 Eriksson I et al. Self-rated health, Comparisons between three different measures, International Journal of Epidemiology
2001; 30: 326-333.
17 Krause N and Jay G. What do global self-rated health items measure, Journal of Medical Care 1994; 32: 930-942.
18 Crossley T.F. and Kennedy S., The Stability of Self Assessed Health Status, Centre for Economic Policy Research, ANU,
2000
47
In 2011-12, the proportion of Tasmanians aged 15 years and over who rated their health status as
fair/poor (18.4%) was statistically significantly higher than for any other jurisdiction except for the
Northern Territory, and for Australia as a whole...
Figure 35: Self-assessed fair/poor health status, 15 years and over, by jurisdiction, 2011-12
18.4%*
14.4%
13.7%
15.2%
14.7%
13.9%
13.9%
14.4%
11.4%
NSW
Vic
QLD
SA
WA
Tas
NT
ACT
Aust
Australian Health Survey First Results, 2011-12, cat. No. 4364.0
* Statistically significantly different from all jurisdictions except the NT
Over the period 2004 to 2011-12, the proportion of Tasmanians rating their health as excellent/very
good has decreased, although the decrease was not statistically significant. This has been largely
matched by a sustained, but not statistically significant, increase in the proportion who rate their
health as good, with the proportion rating their health as fair/poor changing little over this period.
Figure 36: Self assessed health status, aged 15 years and over, Tasmania 2004-2011-12
56.5% 55.0%
53.5%
2004/5
24.8%
Excellent/Very Good
27.1%
2007/8
2011/12
28.1%
18.8%
Good
18.0% 18.4%
Fair/Poor
Australian Health Survey First Results, 2011-12, cat. No. 4364.0
National Health Survey: Summary of Results; Tasmania, 2007-2008 (Reissue), cat. No. 4362.0
National Health Survey 2004-5: Summary of Results, State Tables Tasmania , cat. no 4362.6
48
Life Expectancy
Life expectancy at birth refers to the average number of years a newborn baby could expect to live if
the current mortality rates remain the same. Life expectancy has increased significantly over the past
century, reflecting the considerable decline in mortality rates, initially from infectious diseases and, in
later years, from cardiovascular disease. Reductions in deaths from cardiovascular disease have been
linked to medical advances, improvements in diet, and less smoking.
Tasmania has the second lowest life expectancy at birth of all jurisdictions, for both males and
females. The national life expectancy at birth in 2011 was 79.7 years for males and 84.2 years for
females.
Table 21: Life expectancy at birth by jurisdiction, 2011
NSW
Vic
Qld
WA
SA
Tas
ACT
NT
Males
79.8
80.3
79.5
80.1
79.7
78.3
81.0
74.9
Female
s
84.2
84.4
84.1
84.6
84.0
82.5
84.8
80.5
ABS, Deaths Australia 2011, November 2012
The past 25 years have seen further increases in life expectancy. Life expectancy for Tasmanian
males has increased by over seven years and for females by about five years since 1985.
Figure 37: Life expectancy at birth, Tasmania and Australia 1985-2011
90
85
Age
80
75
70
65
1985
1990
1995
2000
2005
2010
2011
Tas Males
70.9
72.4
73.9
75.7
77.2
78.0
78.3
Tas Females
77.6
79.1
79.9
81.2
82.1
82.3
82.5
Aus Males
72.4
73.9
75
76.6
78.5
79.5
79.7
Aus Females
78.8
80.1
80.8
82
83.3
84.0
84.2
ABS, Deaths Australia 2011, November 2012
Reliable estimates of Indigenous life expectancy are confounded by identification issues such as
uncertainty about Indigenous identification in deaths data and self-identification issues in Census data
collections. Certain chronic diseases and conditions make much larger contributions to Indigenous
mortality than is the case for non‑Indigenous Australians, resulting in much higher death rates and
hence shorter estimated life expectancies.
Estimates of life expectancies at birth for Indigenous Australians for the period 2005-07 are 67.2
years for males and 72.9 years for females, significantly below the respective life expectancies of the
non-Indigenous population.
Table 22: Life expectancy at birth for Indigenous people, Australia 2005-07
Australia
Males
Females
67.2
72.9
AIHW, The Health and Welfare of Australia's Aboriginal and Torres Strait Islander People, an Overview, 2011
49
Infant Mortality
The Infant Mortality Rate (IMR) refers to the number of deaths of infants (≤ 1 year old) in a given
year per 1 000 live births in the same year. Infant mortality (i.e. deaths under one year of age) is an
important indicator of the general health and wellbeing of a population, and has a large influence on
life expectancy at birth. A high infant mortality rate lowers life expectancy, while a low infant
mortality rate contributes to increased life expectancy.
Infant mortality rates for Tasmania and Australia have continued to decline over the last 100 years,
reflecting the continuing improvement of sanitation, nutrition and living standards in the community
over the last century. In addition, further decreases in infant mortality can be attributed to public
health programs such as mass immunisation and health education. Infant mortality rates are
associated with socio-economic status; high infant mortality is one of the biggest health issues
affecting Australia's Aboriginal and Torres Strait Islander population.
Tasmania’s infant mortality rate of 4.5 per 1 000 live births in 2011 was the second highest of all
jurisdictions, and slightly higher than the Australian rate of 3.8 per 1 000 live births, but this is not
statistically significant.
Table 23: Infant mortality rate per 1 000 live births by jurisdiction, 2011
NSW
Vic
Qld
WA
SA
Tas
ACT
NT
Aus
3.8
3.5
4.6
3.0
2.6
4.5
2.9
7.6
3.8
ABS, Deaths Australia 2011, 2012
The Tasmanian infant mortality rate varies from year to year, as shown below, but the annual
variations are small and statistically insignificant, as the number of infants reflected in each annual
rate is very small.
Figure 38: Infant mortality rates, Tasmania and Australia, 2000-2011
5.8
6.2
4.5
3.6
3.9
3.8
2006
2008
4.1
Tasmania
Australia
2000
2002
2004
2010
ABS, Deaths Australia 2011, November 2012
50
2011
Hospitalisations
Hospitalisations data are an important health status indicator but should be interpreted with caution.
Hospitalisations refer to hospital separations or episodes of care in a hospital. A person can have
more than one separation per hospital visit and more than one separation a year.
In 2011 there were about 191 449 hospital admissions to Tasmanian hospitals. The number of
patients being treated in both public and private hospitals each year continues to rise. From 2002 to
2011, hospitalisations due to all causes have increased by 25 766 separations (40%) for males, and by
26 036 separations (34%) for females. Hospitalisation rates in females were higher than in males
between 2002 and 2011.
Figure 39: All-cause hospitalisations by sex, Tasmania, 2002-11
120,000
Number
100,000
80,000
60,000
40,000
20,000
0
2002
63,788
2003
65,704
2004
63,684
2005
64,798
2006
70,556
2007
74,346
2008
73,762
2009
79,948
2010
81,444
Females 75,859
77,479
74,093
79,345
83,906
87,881
86,659
93,724
93,697 101,895
Males
2011
89,554
Statewide Morbidity Database, Tasmania.
A significant number of hospitalisations occur in people aged 65 years and over. In this age group, allcause hospitalisations have increased by a total of 13 946 hospitalisations in males (59%) and 9 770
hospitalisations (42%) in females between 2002 and 2011.
Figure 40: All-cause hospitalisations by sex, 65 years and over, Tasmania, 2002-11
40,000
35,000
Number
30,000
25,000
20,000
15,000
10,000
5,000
0
2004
24,193
2005
25,024
2006
27,368
2007
28,896
2008
28,618
2009
30,885
2010
33,277
2011
37,686
Females 23,379 23,359 22,565
Statewide Morbidity Database, Tasmania.
24,378
26,007
27,699
27,046
29,826
30,599
33,149
Males
2002
23,740
2003
24,947
The increases in hospitalisations over this period are significantly higher than the percentage
increases in the Tasmanian population overall during this time. The likely impact of Tasmania’s ageing
population on hospitalisations is demand for hospitalisation in Tasmania will continue to increase.
51
Potentially Preventable Hospitalisations
Potentially preventable hospitalisations (PPHs) are defined as a group of medical conditions where
hospitalisation is believed to be avoidable if timely and adequate non-hospital (primary) care had
been provided. Therefore, separation rates for PPHs are used as indicators for monitoring the
quality or effectiveness of non-hospital (primary) care in the community.
However, care should be taken in interpreting the results. Time and geographical variations in PPHs
may reflect coding changes over the time and differences in admission and clinical practices in
different areas, and do not necessarily indicate an increased prevalence of the conditions in the
community or poorer functioning of the primary health care system.
Between 2001-02 and 2002-03, separation rates for PPHs in Tasmania were statistically significantly
higher than those in Australia as a whole. There were no significant differences found in
hospitalisations rates from 2005-06 to 2007-08 between Tasmania and Australia. However, Tasmania
has experienced a marked fall in separation rates for PPHs since 2008-09, which was mainly due to
the coding changes for diabetes complications.
Figure 41: Potentially preventable hospitalisations by jurisdiction, 2001-02 - 2010-11
60.0
Rate per 1000 population
50.0
40.0
30.0
20.0
10.0
0.0
2007-08
2008-09
2009-10
2010-11
NSW
2001–02 2002–03 2003–04 2004–05 2005–06 2006-07
27.8
26.8
27.4
27.2
27.8
28.4
28.0
27.0
27.1
24.5
Vic
31.6
30.7
31.7
32.9
31.7
32.2
33.2
30.3
30.0
28.5
Qld
32.4
30.7
31.8
32.2
32.1
32.5
33.9
33.3
34.0
29.6
WA
32.4
31.7
36.0
44.9
46.8
47.7
50.1
39.8
37.5
33.0
SA
31.4
30.3
31.5
31.0
32.7
32.3
32.8
30.4
29.7
28.3
Tas
32.9
31.9
29.6
27.4
31.2
31.9
32.2
23.3
23.4
20.2
ACT
21.2
17.1
20.2
19.4
21.9
22.2
22.3
23.6
20.7
20.0
NT
42.8
46.8
47.9
45.4
47.3
47.9
45.0
48.7
49.0
46.9
Australia
30.5
29.4
30.6
31.6
32.0
32.5
33.1
30.6
30.4
27.7
Note: Rates are age-standardised to the Australian 2001 population.
52
Source: AIHW, Australian hospital statistics.
Over the period 2010-11, Tasmania’s rate for total potentially preventable hospitalisations was the
second lowest of all states and territories. Tasmania’s rate of 20.2 per 1 000 population was just
above the Australian Capital Territory’s rate of 20.0 per 1 000 population. Low separation rates for
PPHs in Tasmania are mainly due to the coding change for diabetes complications, and partially a
result of low Tasmanian resident hospital admissions.
Figure 42: Potentially preventable hospitalisations by jurisdiction, 2010-11
50.0
Total potentially preventable hospitalisations
Total chronic conditions
Total acute conditions
Total vaccine-preventable conditions
46.9
45.0
Rate per 1,000 population
40.0
33.0
35.0
29.6
30.0
25.0
20.0
28.5
28.3
27.7
24.5
24.3
20.3
20.2
17.4
15.1
15.0
14.1 14.8
13.0
14.9
12.5
14.9
11.0
13.0
10.0
3.0
5.0
0.8
0.6
1.0
0.8
20.0
12.9 14.2
9.7 10.2
0.6
0.4
9.1 10.4
0.8
0.5
0.0
NT
WA
Qld
Vic
SA
NSW
Tas
ACT
Australia
Note: Rates are age-standardised to the Australian 2001 population.
To reflect the objectives of primary care, potentially preventable hospitalisation are grouped into
three broad categories that include vaccine preventable, acute, and chronic conditions. Of all
potentially preventable hospitalisations (N=11,399) in Tasmania in 2010-11, vaccine preventable
conditions accounted for 1.6%, chronic conditions 50.9% and acute conditions 47.6%.
Figure 43: Potentially preventable hospitalisations by category in Tasmania, 2010-11
Vaccine
preventable
1.6%
N=180
Chronic
conditions
50.9%
N=5,800
Acute
conditions
47.6%
N=5,423
Australian Hospital Statistics
2010-11 (Table A5.1).
The graph below shows from 2001-02 to 2010-11, hospitalisation rates for vaccine preventable
conditions decreased significantly from 0.8 to 0.4 hospitalisations per 1 000 people in Tasmania. This
represented an average annual decrease of 3.2% a year. The hospitalisation rates for chronic
conditions were relatively stable between 2001-02 and 2007-08. However, a marked decrease
occurred in 2008-09 as a result of the change in coding practice for diabetes complications as an
additional diagnosis.
53
Figure 44: Potentially preventable hospitalisations by category in Tasmania, 2001-02-2010-11
40.0
35.0
Rate per 1000 population
30.0
25.0
20.0
15.0
10.0
5.0
0.0
Vaccine-preventable
2001–02 2002–03 2003–04 2004–05 2005–06 2006-07 2007-08 2008-09 2009-10 2010-11
0.8
0.7
0.6
0.4
0.5
0.5
0.4
0.6
0.7
0.4
Acute conditions
10.8
10.8
9.7
9.0
10.0
10.4
11.0
10.1
10.7
10.2
Chronic conditions
21.8
22.7
19.4
18.0
20.8
21.2
20.9
12.6
12.1
9.7
Total
32.9
33.8
29.5
27.3
31.2
31.9
32.2
23.3
23.4
20.2
Note: Rates are age-standardised to the Australian 2001 population.
Source: AIHW, Australian hospital statistics.
Over the period 2010-11, there were 11 399 potentially preventable hospitalisations in Tasmania,
representing 6.7% of all hospitalisations (all causes combined). The most common conditions for
potentially preventable hospitalisations were chronic obstructive pulmonary disease, diabetes
complications, dehydration and gastroenteritis, dental conditions and congestive cardiac failure in
Tasmania. Those conditions accounted for over half (53%) of all potentially preventable
hospitalisations.
Figure 45: Potentially preventable hospitalisations by type of condition, Tasmania, 2010-11
Chronic obstructive…
Diabetes complications
Dehydration and gastroenteritis
Dental conditions
Congestive cardiac failure
Pyelonephritis
Iron deficiency anaemia
Cellulitis
Angina
Ear, nose and throat infections
Convulsions and epilepsy
Asthma
Influenza and pneumonia
Gangrene
Perforated/bleeding ulcer
Hypertension
Pelvic inflammatory disease
Rheumatic heart disease
Other vaccine-preventable…
Appendicitis with generalised…
Nutritional deficiencies
1575
1357
1164
1099
969
914
838
726
580
560
554
499
180
154
124
104
103
35
33
29
5
0
500
1000
1500
Number of PPHs
Australian hospital statistics 2010-11 (Table A5.1).
54
2000
The South had the lowest (statistically significant) PPH rate (21.6 per 1 000 population) of all regions
over the period 2007-11, and the North West region had the highest rate (23.9 per 1 000
population). For potentially preventable hospitalisation for local government areas please refer to
the appendix.
Figure 46: Potentially preventable hospitalisations by region in Tasmania, 2007-11
Rate per 1,000 population
30.0
25.0
21.6
22.1
South
North
23.9
22.2
20.0
15.0
10.0
5.0
0.0
North West
Tasmania
Notes: 1. Rates are age-standardised to the Australian 2001 population. 2. The error
bars represent the 95% confidence intervals of the rate. 3. PPHs were estimated using
NSW codes (include diabetes as a principal diagnosis only).
55
Mortality and Causes of Mortality
Tasmania’s age-standardised mortality rate for 2003-07 was 694.9 deaths per 100 000 population.
The small regional differences in age-standardised mortality rates within Tasmania are not statistically
significant, but there is a significant difference between Tasmania and Australia as a whole –
consistent with a range of other population health data and Tasmania's overall risk factor profile.
Figure 47: Age-Standardised Mortality Rate, Tasmania and Australia, 2003-07
Rate per 100,000 population
800
700
600
500
400
300
695.1
705.5
680.4
694.9
South
North
North West
Tasmania
608.9
200
100
0
Australia
Notes: 1. Rates are age-standaridsed to the Australian 2001 population. 2. The error
bars represent the 95% confidence intervals of the rate. 3. ABS Mortality Database.
There were 9 866 male deaths and 9 776 female deaths in Tasmania for the period 2003 to 2007.
This equates to an average of 3 928 deaths a year in Tasmania over this time.
Leading Causes of Mortality
The latest ABS mortality publication (Deaths Australia, 2010) has been used to identify the most
common causes of death in Tasmania. In 2010, the most common causes of death were cancer
(28.3%), ischaemic heart disease (15.6%) and cerebrovascular diseases (7.3%).
Table 24: Top 10 Causes of Death in Tasmania, 2010
Rank
Disease (ICD-10*)
Number of
deaths
% of all deaths
1
Cancer (all types) (C00-C97)
1,209
28.3%
2
Ischaemic heart diseases (I20-I25)
666
15.6%
3
Cerebrovascular diseases (I60-I69)
310
7.3%
4
Other forms of heart disease (I30-I52)
266
6.2%
5
Organic, including symptomatic, mental disorders (F00-F09)
234
5.5%
6
Chronic lower respiratory diseases (J40-J47)
227
5.3%
7
Injury & poisoning (V01-Y98)
218
5.1%
8
Diabetes mellitus (E10-E14)
161
3.8%
9
Diseases of arteries, arterioles and capillaries (I70-I79)
76
1.8%
10
Hypertensive diseases (I10-I15)
70
1.6%
All other causes of death
832
19.5%
ABS, Deaths Australia 2010
56
The leading causes of death for children in Tasmania were perinatal and congenital diseases, while
transport accidents and suicide were the leading causes of death in males and females aged 15 to 24
years. Breast cancer was the leading cause of death for females aged 25 to 64 years. Ischaemic heart
disease was the leading cause of death for males aged 25 to 64 years and for males and females aged
65 years and over.
Table 25: Leading Causes of Death by Age and Sex, Tasmania, 2003-07
Males
Females
Average
number
of deaths
per year
% of all
deaths
Disease (ICD-10*)
Average
number
of deaths
per year
% of all
deaths
Age
Disease (ICD-10*)
0-14
Perinatal (P00-P96)
8
31.9%
Perinatal (P00-P96)
5
29.9%
Congenital malformations
(Q00-Q99)
<5
12.6%
Congenital malformations
(Q00-Q99)
<5
21.8%
Ill-defined R95-R99
<5
10.9%
Transport accidents (V01V99)
<5
12.6%
Transport accidents (V01V99)
13
42.0%
Transport accidents (V01V99)
<5
30.6%
Suicide X6O-X84
6
18.5%
Suicide X6O-X84
<5
10.2%
Poisoning by noxious
substances X40-X49
<5
5.1%
Cystic fibrosis (E84)
<5
8.2%
Ischaemic heart diseases (I20I25)
68
15.5%
Breast cancer (C50)
30
11.0%
Suicide (X6O-X84)
42
9.7%
Lung cancer (C33-C34)
25
9.3%
Lung cancer (C33-C34)
33
7.5%
Ischaemic heart diseases
(I20-I25)
15
5.7%
Ischaemic heart diseases (I20I25)
290
19.5%
Ischaemic heart diseases
(I20-I25)
312
18.8%
Lung cancer (C33-C34)
113
7.6%
Stroke (I60-I69)
153
9.2%
Stroke (I60-I69)
98
6.6%
Other forms of heart
disease (I30-I52)
120
7.2%
15-24
25-64
65+
*International Classification of Diseases, 10th Revision; ABS Mortality Database
57
The table below demonstrates that Tasmania’s age-standardised mortality rates are significantly
higher than the Australian mortality rates for a number of conditions. These include cancer, diabetes
mellitus, chronic lower respiratory diseases, injury and poisoning conditions and other forms of
heart disease.
Table 26: Top 10 causes of death, Tasmania and Australia, 2010
Rank
Disease (ICD-101)
Age-Standardised
Mortality Rate2
(Tasmania)
Age-Standardised
Mortality Rate
(Australia)
1
Malignant neoplasms (C00-C97)
192.7
172.3
2
Ischaemic heart diseases (I20-I25)
101.1
83.4
3
Cerebrovascular diseases (I60-I69)
47.3
42.5
4
Other forms of heart disease (I30-I52)
39.8
29.2
5
Organic, including symptomatic, mental disorders (F00-F09)
34.1
23.6
6
Chronic lower respiratory diseases (J40-J47)
35.4
24.3
7
Injury & poisoning (V01-Y98)
40.6
37.8
8
Diabetes mellitus (E10-E14)
24.7
15.6
9
Diseases of arteries, arterioles and capillaries (I70-I79)
11.8
7.8
10
Hypertensive diseases (I10-I15)
10.6
6.4
Notes:
1. International Classification of Diseases, 10th Revision.
2. Rates are age-standardised to the Australian 2001 population and expressed per 100 000 population.
3. Results in bold represent a significant difference between Tasmanian and Australian in rates (P<0.05).
4. ABS Cat. No. 3303.0, Deaths Australia 2010
58
Avoidable Mortality
Avoidable mortality refers to deaths that could potentially be avoided through effective interventions
against specific diseases in a population. Avoidable mortality is a population-based method of
determining unnecessary deaths from diseases for which effective medical interventions are available.
Avoidable mortality is classified into potentially preventable deaths and potentially treatable
(amenable) deaths. Potentially preventable deaths are those amenable to screening and primary
prevention, such as immunisation or tobacco control measures, and reflect the effectiveness of the
preventive health activities of the health sector. Deaths from potentially treatable conditions are
those amenable to therapeutic interventions, and reflect the safety and quality of the current
treatment system.
Tasmania as a whole experiences higher avoidable mortality rates than all other jurisdictions, except
the Northern Territory.
Rate per 100,000 population
Figure 48: Potentially avoidable mortality from all-causes, under 75 years, Australia, 2009
350
284.5
300
250
200
150
139.6 138.9 151.5 143.9 149.2
182.4
144.9
118.0
100
50
0
NSW
Vic
Qld
WA
SA
Tas
ACT
NT
Aust
Notes: 1. Rates are age-standardised to the Australian 2001 population. 2. The error bars
represent the 95% confidence intervals of the rate.. 3. COAG Reform Council 2012,
However, avoidable mortality is improving in Tasmania. Between 1978 and 2007, total avoidable
death rates for all people fell by around 54%. As the figure below shows, Tasmania has experienced
an average annual percentage decline in potentially avoidable mortality of 3.3% for males and 2.6 for
females from 1978 to 2007. The decline in potentially avoidable mortality rates may reflect
improvements in the health care system as well as changes in environmental and socio-economic
conditions, in addition to known effective preventive measures such as reduced smoking rates.
Rate per 100,000 population
Figure 49: Potentially avoidable mortality, population 0-74 years, Tasmania, 1978-2007
700
600
500
400
300
200
100
0
Males
1978-80 1981-83 1984-86 1987-89 1990-92 1993-95 1996-98 1999-01 2002-04 2005-07
575.9
555.6
509.1
462.3
395.9
373.8
330.6
290.2
273.3
241.4
Females
280.4
263.6
258.2
244.3
207.5
204.8
179.4
165.6
155.0
141.8
Persons
423.6
402.7
378.3
348.5
297.6
286.5
252.7
226.5
213.2
190.8
Notes: 1. Rates are age-standaridsed to the Australian 2001 population. 2. Avoidable deaths were estimated using disease
codes developed by the New South Wales Department of Health (2010). 3. Average annual percentage change for males:
-3.3% (P<0.01); for females: -2.6% (P<0.01); for persons: -3.0% (P<0.01).
59
Potentially avoidable mortality rates across the Tasmanian regions were similar over the period
2005-07.
Rate per 100,000 population
Figure 50: Potentially Avoidable Mortality, Population 0-74 Years, by Region, Tasmania, 2005-07
250
200
150
100
196.8
186.7
183.8
190.9
South
North
North West
Tasmania
50
0
Notes: 1. Rates are age-standaridsed to the Australian 2001 population. 2. The error bars
represent the 95% confidence intervals of the rate. 3. Avoidable deaths were estimated
using disease codes developed by the New South Wales Department of Health (2010).
There was a similar relative reduction in potentially avoidable mortality for preventable and
amenable deaths in Tasmania.
Rate per 100,000 population
Figure 51: Potentially Avoidable (preventable and amenable) Mortality, Population 0-74 years, Tasmania,
1978-2007
250
200
150
100
50
0
1978-80
1981-83
1984-86
1987-89
1990-92
1993-95
1996-98
1999-01
2002-04
2005-07
Preventable
235.3
233.0
215.3
204.0
179.1
166.8
152.1
138.1
131.3
123.2
Amenable
188.3
169.7
163.0
144.5
118.5
119.7
100.6
88.4
81.9
67.7
Notes: 1. Rates are age-standaridsed to the Australian 2001 population. 2. Avoidable deaths were estimated using disease
codes developed by the New South Wales Department of Health (2010). 3. Average annual percentage change for
preventable deaths: -2.6% (P<0.01); for amendable deaths: -3.6% (P<0.01).
60
Burden of Disease
Burden of disease is a measure of the gap between the current health status in a population and an
ideal situation where everyone lives into old age free from illness and disability. It is commonly
assessed using the disability adjusted life year (DALY), a measure of healthy years of life lost due to a
disability. 19 The table below lists the 10 leading causes of burden of disease for Australia and
summarises for Tasmania these causes in rank order and percentage of total burden using the latest
national Burden of Disease study, which has not been updated since 2003.
The burden of disease in Tasmania is similar to the rest of Australia for the 10 leading causes of
disease, with the exception of chronic obstructive pulmonary disease (COPD), which is greater in
Tasmania than the rest of Australia. Tobacco smoking is the key significant risk factor, with indoor
and outdoor air pollution and occupational exposure to dust and chemicals also being significant risk
factors for COPD. Some areas are known to experience poor ambient air quality, in particular
Launceston and some southern communities, which may have contributed to Tasmania’s excess
burden of disease from COPD. 20
Table 27: Differentials in burden (DALYs) in Tasmania and Australia for the 10 leading specific causes, 2003
Rank*
% of total burden
Tasmania
Australia
Tasmania
Ischaemic heart disease
1
1
10.7%
Anxiety and depression
2
2
7.3%
Type 2 diabetes
3
3
5.0%
Cerebrovascular accident
4
4
4.4%
Dementia
8
5
2.5%
Lung cancer
6
6
3.8%
Chronic obstructive pulmonary disease (COPD)
5
7
4.0%
Adult-onset hearing loss
9
8
2.4%
Colorectal cancer
7
9
2.7%
Asthma
10
10
2.4%
* Sorted according to the leading specific causes for Australia, 2003 21
The table below illustrates the national disease burden proportion and relative ranking of selected
major disease groups.
Cancers (all types combined) are predicted to become the largest contributor to disease burden
(second largest in 1993) from 2003 to 2023. Cardiovascular diseases (all types combined) are
predicted to decline to the fourth largest contributor to disease burden by 2023 (13.1%), significantly
lower than in 1993 when cardiovascular disease was the leading cause of disease burden (22.3%),
primarily because of better diagnosis and treatment.
19
Australian Institute of Health and Welfare. Australia’s Health 2006. AIHW cat. no. AUS73. Canberra: AIHW
Department of Tourism, Arts and the Environment (DTAE). Tasmanian Air Quality Strategy. 2006
21
Begg S, et al, The burden of disease and injury in Australia, Australian Centre for Burden of Disease and Cost-Effectiveness. 2006
20
61
The effects of population ageing underlie the predicted small declines in the relative disease burden
due to mental disorders, which are largely experienced in early to middle adulthood, although
mental disorders will remain the leading cause of overall prevalent disability. 22.
Conversely, the opposite trend was predicted for neurological and sense organ disorders, as these
conditions are experienced later in life. The burden due to diabetes mellitus is predicted to more
than double from 1993 to 2023 from 4.1% to 8.7%, largely due to the increasing prevalence of type II
diabetes. Type II diabetes is strongly associated with behavioural risk factors, particularly obesity
which has become significantly more prevalent since 1993.
Table 28: Past and projected future changes in health loss (DALYs), by selected broad cause group,
Australia, 1993-2023 23
Rank*
Proportion of total (%)
1993
2003
2013
2023
1993
2003
2013
2023
Cancers
2
1
1
1
18.8%
19.0%
18.9%
18.2%
Cardiovascular
diseases
1
2
2
4
22.3%
18.0%
15.4%
13.1%
Mental
disorders
4
4
5
5
13.2%
13.3%
12.9%
11.9%
Neurological
and sense
organ
5
5
4
2
9.6%
11.9%
13.9%
16.4%
Chronic
respiratory
diseases
7
6
7
7
7.1%
7.1%
6.8%
6.9%
Injuries
6
7
8
8
7.7%
7.0%
6.3%
5.4%
Diabetes
mellitus
8
8
6
6
4.1%
5.5%
7.0%
8.7%
Musculoskeleta
l diseases
9
9
9
9
3.4%
4.0%
4.5%
4.9%
Other
3
3
3
3
13.8%
14.2%
14.1%
14.4%
100.0%
100.0%
100.0%
100.0%
Total
Begg S, et al, Burden of disease 2003, 2006
22
Begg S, et al, 2006, op.cit.
Begg S et al, Burden of disease and injury in Australia in the new millennium: measuring health loss from diseases, injuries and risk
factors, MJA, 188(1) p36-40, 2008
23
62
Healthy Life Expectancy
Allied to burden of disease is the concept of healthy adjusted life expectancy (HALE), commonly
referred to as ‘healthy life expectancy’, which refers to the number of years a person born in a
particular year (often stated as from birth) can expect on average to live free of disability or disease
based on current trends in deaths and disease patterns. 24 The issue with longer life expectancy is
whether people are spending their extra years in poor health. What is important is that people live
longer lives in good health.
In 2009, it was estimated Australian males born in 2009 could expect to live to an average of 79.3
years, of which 61.6 years (or 77.7%) are healthy years, as defined above. The remaining 12.3 years
of life carry some form of disability, 5.5 years of which (30.9%) where the disability is classed as a
severe/profound physical or mental limitation. 25
By comparison, Australian females born in 2009 are expected to live 83.9 years; with about three
more years than males on average lived without disability (64.3 years). The expected period of
disability for females without a severe or profound limitation was similar to males, but the expected
number of years lived with a severe or profound limitation was two years higher for females than for
males, attributed to longer life expectancy.
Figure 52: Life expectancy and expected years of life with and without disability for Australians born in
2009
90
80
70
5.5
12.3
7.5
12.1
60
Years lived with a severe
or profound limitation
50
40
30
61.6
64.3
Years lived with disability
but without a severe or
profound limitation
Years lived without
disability
20
10
0
Males
Females
AIHW 2012, Changes in life expectancy and disability in Australia, 1998 to 2009
Australians born in 2009 can expect to live, on average, at least two years longer than those born
eleven years earlier in 1998. The biggest increase was for males (3.4 years), with the life expectancy
gender gap narrowed by one year over this period. Most of the improvement in life expectancy, for
both males and females, was in the years lived without disability, for example 3.6 extra years for
males and 2.2 years for females. However, when examining the latter years lived with some form of
disability, males born in 2009 can expect to live one fifth of a year longer with a severe or profound
limitation, compared to females who can expect to live a slightly shorter period with such a
limitation, relative to those born in 1998.
24
25
http://www.aihw.gov.au/healthy-life-expectancy/
AIHW 2012. Changes in life expectancy and disability in Australia, 1998 to 2009
63
Table 29: Life expectancy and expected years with disability at birth, by sex, 1998 and 2009
Born in 1998
Born in 2009
Males
Females
Males
Females
Years lived without disability
58.0
62.1
61.6
64.3
Years lived with disability (not severe/profound)
12.7
11.8
12.3
12.1
Years lived with a severe or profound limitation
5.3
7.6
5.5
7.5
Total life expectancy at birth
76.0
81.5
79.4
83.9
AIHW 2012. Changes in life expectancy and disability in Australia, 1998 to 2009
64
A useful measure for monitoring healthy ageing and the need for long-term care, and an adjunct to
healthy life expectancy at birth is health expectancy at age 65 years.
It was estimated 26 Australian males aged 65 years in 2009 could on average expect to live a further
18.7 years (compared to 21.8 for females), of which only around 40% (8.2 years) were without
disability (compared to 9.7 years for females).
Figure 53: Life expectancy and expected years of life with/without disability for Australians age 65 years in
2009
25
20
Years lived with a severe
or profound limitation
5.6
3.5
15
10
5
Years lived with disability
but without a severe or
profound limitation
6.5
7
Years lived without
disability
9.7
8.2
0
Males
Females
AIHW, Changes in life expectancy and disability in Australia, 1998 to 2009, 2012
Compared to 11 years ago, males aged 65 years in 2009 can expect to live on average 2.6 years
longer (compared to 1.9 years for females). Most of this increase was in healthy life expectancy (1.1
years for males compared to 1 year for females) and years lived with disability, but without a severe
or profound limitation (1 year for males compared to 0.8 years for females).
On the downside, both males and females aged 65 in 2009 can expect on average to live an extra
one half and one tenth of a year respectively with a severe or profound limitation compared with
those aged 65 years 11 years earlier.
Table 30: Life expectancy and expected years with disability at age 65, by sex, 1998 and 2009
Aged 65 in 1998
Aged 65 in 2009
Males
Females
Males
Females
Years lived without disability
7.1
8.7
8.2
9.7
Years lived with disability but without a severe
or profound limitation
6
5.6
7
6.4
Years lived with a severe or profound
limitation
3
5.5
3.5
5.6
Total life expectancy at birth
16.1
19.8
18.7
21.7
Changes in life expectancy and disability in Australia, 1998 to 2009, 2012
Overall, the Institute of Health and Welfare study found no consistent evidence of compression or
expansion of disability among older Australians. Increases in the disability-free life expectancy were
not greater than gains in the overall life expectancy at age 65 years. 27 If these trends continue, it may
be the case that despite increases in life expectancy, there may be no significant increases in the
burden of disease and disability among older Australians.
26
AIHW 2012. Changes in life expectancy and disability in Australia, 1998 to 2009
27
Ibid
65
Health Screening
Cancer Screening and Detection
Population-based screening involves the systematic use of tests to identify individuals not showing
any symptoms of the diseases for which they are being screened. The aim of population-based
screening is to reduce the burden of disease, which may include a reduction in the incidence,
morbidity and mortality of the disease, through detection at an early stage. Population-based
screening currently covers breast cancer, bowel cancer, and cervical cancers.
Breast Cancer
BreastScreen Australia is a program that aims to reduce morbidity and mortality from breast cancer
through organised screening in asymptomatic females to enable early intervention. The priority
target group for breast cancer screening is females aged between 50 and 69 years.
In Tasmania, 58.4% (37 529) of the eligible target group of females aged 50-69 years participated in
breast screening for the two years from 2009-10, higher than in 2007-08 and 2006-07 with rates of
54.5% and 54.2% respectively.
Figure 54: Breast screening participation rates* for females 50-69 years by jurisdiction, 2009-10
52.8%
54.2%
57.6%
58.1%
56.4%
58.4%
55.0%
52.8%
41.2%
NSW
Vic
Qld
WA
SA
Tas
ACT
NT
Australia
* Refers to % of women screened as a % of the eligible female population and age standardised
to the Australian population 2001;
AIHW, BreastScreen Australia monitoring report 2009-10, 2012
Participation increases with improved socio-economic status, ranging between 53.3% and 55.6% for
the lowest to highest SEIFA score. This represents a small, but statistically significant, higher
participation rate in breast cancer screening for females living in less disadvantaged areas.
Table 31: Breast cancer screening rates by socio-economic status, Australia 2009-10
SEIFA Quintiles
1 (lowest)
2
3
4
5 (highest)
53.3%
54.6%
55.0%
55.2%
55.6%
* Refers to % of females screened as a % of the eligible female population and age-standardised to the Australian population 2001
AIHW, BreastScreen Australia monitoring report 2009-10, 2012
Breast cancer screening aims to maximise the detection of invasive breast cancers to reduce the
morbidity and mortality from breast cancer. Females are more likely to be identified with a breast
cancer on their first screening visit than at subsequent screens.
66
Invasive breast cancer detection rates in Tasmania were not statistically significantly different from
Australia. Rates are age-standardised to the population of females attending a BreastScreen service in
2008 and refer to the number of females with invasive breast cancer detected per 10 000 females
screened.
For Tasmanian females aged 50-69 years, 136 per 10 000 females screened were diagnosed with
invasive breast cancer in the first screening round, and 43.9 per 10 000 females screened were
diagnosed with invasive breast cancer in subsequent screening rounds. For all screening rounds
combined in Tasmania, 28.4 per 10 000 females screened were diagnosed with small invasive breast
cancers. Breast cancer incidence rates are discussed in the next chapter on cancer incidence.
Table 32: All-size and small (<15 mm) invasive breast cancer detection rates* in females
aged 50-69 years, Tasmania and Australia 2010
Tasmania
Australia
ASR
136.0
97.0
95% CI
74.2 – 222.3
84.2 – 110.8
ASR
43.9
45.6
95% CI
34.8 – 54.7
43.6 – 47.6
ASR
28.4
29.9
95% CI
21.5 – 36.8
28.4 – 31.5
All size, first screening round
All size, subsequent screening round
Small, all screening rounds
* Refers to the number of females with invasive breast cancer detected per 10 000 females screened and
age-standardised to the population of females attending a screening service in 2008
AIHW, BreastScreen Australia monitoring report 2009-10
Bowel Cancer
Participation rates in the National Bowel Cancer Screening Program vary by state and territory, and
refer to the proportion of the eligible population aged 50-65 years invited to participate in bowel
cancer screening and who returned a completed Faecal Occult Blood Test (FOBT). A FOBT is a
simple take home test requiring collection of a number of faecal samples that are analysed by
pathology.
The bowel cancer screening participation rate in Tasmania was 42.5% (22 769 participants) for 200811 and statistically significantly higher than the national rate of 38.4%.
67
Figure 55: Bowel cancer screening participation rate* by jurisdiction, 2008-11
42.5%
36.4%
38.9%
42.7%
42.5%
40.8%
38.4%
37.4%
27.7%
NSW
Vic
Qld
WA
SA
Tas
ACT
NT
Australia
* Crude rate referring to % of people screened as a % of the eligible population aged 50-65
years
AIHW, National Bowel Cancer Screening Program monitoring report, 2008-2011
68
People living in areas with the lowest socio-economic status had a statistically significantly lower
participation rate for bowel cancer screening than those living in the highest socio-economic areas.
Table 33: Bowel cancer screening participation* by socio-economic status, Australia 2008-11
SEIFA Quintile
1 (lowest)
2
3
4
5 (highest)
53.3%
54.6%
55.0%
55.2%
55.6%
* Refers to % of people screened as a % of the eligible population aged 50-65 years
AIHW, National Bowel Cancer Screening Program monitoring report, 2008-2011
A FOBT cannot diagnose bowel cancer, but will help decide if a person needs further tests. Positive
FOBT results are followed up with GP visits and a colonoscopy if required. Positivity rates refer to
the proportion of the eligible population who were invited to participate and subsequently returned
a positive result from a correctly completed FOBT kit.
Of the total number of Tasmanian participants with valid FOBT results, 8.9% (2 011 participants) had
a positive result. Tasmanian males had a positivity rate of 9.7% and females had a rate of 8.3%.
Tasmania’s positivity rate was statistically significantly higher than the Australian rate as well as the
positivity rate of most other jurisdictions, except for the Northern Territory. Bowel cancer
incidence rates are covered in the chapter on cancer incidence.
Figure 56: Faecal occult blood test (FOBT) positivity rates*, Tasmania and Australia 2008-11
7.7%
8.0%
NSW
Vic
7.5%
7.7%
Qld
WA
8.1%
SA
9.0%
8.9%
7.8%
7.5
Tas
ACT
NT
Australia
* Refers to % of total number of participants positive FOBT results as a % of the total number
of participants with valid results;
AIHW, National Bowel Cancer Screening Program Monitoring report, 2008-2011
Nationally, positivity rates were lower for screening participants living in areas with higher levels of
socio-economic advantage, from 6.7% in the highest socio-economic quintile to 9.1% in the lowest
socio-economic quintile, representing a statistically significant negative socio-economic trend.
Table 34: FOBT positivity rates* by socio-economic status, Australia 2008-11
SEIFA Quintile
1 (lowest)
2
3
4
5 (highest)
9.1%
8.2%
7.9%
7.4%
6.7%
* Refers to % of total number of participants positive FOBT results as a % of the total number of participants with valid results;
AIHW, National Bowel Cancer Screening Program Monitoring report, 2008-2011
69
Cervical Cancer
Cervical cancer is one of the most preventable of all cancers if cell changes are detected and treated
early. Participation in regular cervical cancer screening can reduce the incidence and mortality
attributable to cervical cancer through the early detection of abnormal cells.
Following the recognition that infection with the Human Papilloma Virus (HPV) is necessary for the
development of most cervical cancers, the HPV vaccine was introduced in Australia in April 2007.
Although the introduction of the HPV vaccine has the potential to reduce the incidence of cervical
cancers, the HPV vaccine does not protect against all cancer causing types of HPV. Females, whether
vaccinated or not, should be screened for cervical cancer by having Pap smears every two years.
Regular cervical screening is recommended for all females aged 20-69 years.
In 2009-10, participation of females aged 20-69 years across all states and territories ranged from
54.5% in the Northern Territory to 60.8% in Victoria. The Tasmanian participation rate of 57.4% is
the same as the Australian rate.
Figure 57: Participation rate* in cervical screening, age 20-69 years, by jurisdiction, 2009-10
60.8%
59.5%
57.4%
57.5%
55.6%
NSW
58.8%
57.4%
55.3%
Vic
54.5%
Qld
WA
SA
Tas
ACT
NT
Australia
* Number of women screened as a % of the total resident population of women aged
20-69 years and age-standardised to the Australian population 2001
AIHW, Cervical screening in Australia 2009-2010, 2012
Participation in cervical screening showed a clear trend of increased participation with higher levels
of socio-economic status, from 52.1% of females living in the lowest socio-economic areas to 63.3%
of females living in the highest socio-economic areas.
Table 35: Participation rates* in cervical screening, age 20-69 years, by socio-economic status, Australia
2009-10
SEIFA Quintile
1 (lowest)
2
3
4
5 (highest)
52.1%
53.9%
56.4%
58.7%
63.3%
* Refers to % of females screened as a % of the total resident population of females aged 20-69 years
AIHW, Cervical cancer screening in Australia 2009-2010, 2012
70
Negative cytology is defined as a cervical cytology test in which no abnormalities are detected in the
sample. In Tasmania, 91.7% of cytology test results were negative compared to the Australian
proportion of 92.6%. Tasmania’s proportion was not statistically significantly different from the
Australian rate, but statistically significantly lower than the proportions of negative test results in
New South Wales (93.7%) and Queensland (93.1%). Incidence rates of cervical cancer are provided
in the next chapter on cancer incidence.
Table 36: Negative cytology test results in females aged 20-69 years, Tasmania and Australia, 2010
Tasmania
Australia
Age-standardised Rate
91.7%
92.6%
95% CI
90.8 – 92.6
92.5 – 92.7
* Number of negative cytology tests as a % of the total number of cytology tests, age-standardised for the Australian population 2001
AIHW, Cervical cancer screening in Australia 2009-2010, 2012
71
Priority Health Conditions
Chronic health conditions refer to long-term conditions (lasting more than six months) that can have
a significant impact on a person’s life. The chronic conditions data presented in this section follow
Australia’s seven National Health Priority Areas (NHPA), as they significantly impact on the burden
of disease. They include cardiovascular disease, cancers, injuries, mental health disorders, diabetes,
asthma, and arthritis and other musculoskeletal conditions. Taken together, these priority areas
account for almost 80% of the total burden of disease and injury in Australia.
Chronic Conditions
The National Health Survey (NHS) collects data on self-reported long term health conditions,
including most of the national health priority areas, with injury being the sole exception.
In 2011-12, musculoskeletal diseases, including arthritis, were the most prevalent of the NHPA
conditions, with 31.7% of Tasmanians and 65% of Tasmanians aged 65 years and over, diagnosed
with a musculoskeletal disease. The most common musculoskeletal disease was arthritis, affecting
19.2% of Tasmanians and 52.1% of all Tasmanians aged 65 years and over.
Cardiovascular diseases were the second most prevalent, affecting more 22.8% and 62.9% of
Tasmanians aged 65 years and over. (The most common cardiovascular disease in 2011-12 was
hypertension, affecting 13.6% of Tasmanians overall and 45.1% of Tasmanians aged 65 years and
over.
With the exception of injury – only the sequelae of an injury event, such as chronic back pain, are
regarded as chronic conditions – each of the remaining NHPA affected less than 12% of the
Tasmanian population. However, the prevalence of each of these conditions is associated with age,
generally being significantly higher for Tasmanians aged 65 years and over. Ischaemic heart disease,
which only affected 2% of Tasmanians overall, afflicted 9.4% of Tasmanians aged 65 years and over.
Diabetes mellitus was also significantly more prevalent among Tasmanians aged 65 years and over
(14.1%) than among the general population (4.6%), which is almost exclusively due to type 2 diabetes
affecting 12.3% of Tasmanians aged 65 years and over compared to 4% overall.
Table 37: Prevalence (Australian Bureau of Statistics 2011) of self-reported selected chronic conditions,
Tasmania, 2011-12
Chronic condition
Total Persons (%)
Persons aged 65+ (%)
Total musculoskeletal/ connective tissue diseases
31.7
65.0
Total cardiovascular diseases
22.8
62.9
Arthritis
19.2
52.1
Hypertension
13.6
45.1
Asthma
11.6
10.1
Mental and behavioural problems
15.0
17.6
High cholesterol
7.5
25.1
Diabetes mellitus
4.6
14.1
Ischaemic heart disease
2.0
9.4
Cerebrovascular disease
2.0
7.6
Cancers (malignant neoplasms)
2.0
*5.4
Australian Health Survey First Results, 2011-12, cat. No. 4364.0
72
Disability Prevalence
More than one in five Tasmanians (22.7%) reported having a disability in 2009, slightly less than in
2003 when 23.5% of Tasmanians reported a disability. The prevalence of disability has fallen not only
in Tasmania, but in most other jurisdictions since 2003, along with the Australian rate, which fell
from 20% in 2003 to 18.5% in 2009.
There is some variability in the distribution of disability reported across jurisdictions, with the
disability prevalence rate being the highest in Tasmania and the lowest in the Northern Territory. As
the data are not age-standardised, this pattern reflects the differing age structures of states and
territories.
Figure 58: Disability rates by jurisdiction, 2009
22.7%
20.9%
18.6% 18.4% 17.9%
18.5%
17.4%
15.2%
NSW
Vic
Qld
SA
WA
Tas
NT
16.1%
ACT
Aus
ABS, Disability Australia 2009, 2011
Disability rates vary by gender and age, with rates being higher for males and older people. A strong
relationship is evident between age and disability, with younger people far less likely to report a
disability than older people. Of those aged 15-24 years, 6.6% reported a disability compared with
40% of those aged 65-69 years and 88.3% of those aged 90 years and over.
Figure 59: Disability rates by age, Australia 2009
100
Percentage
80
60
40
20
0
ABS, Disability Australia 2009, 2011
People living with a disability usually have a specific limitation or restriction, such as an impairment
restricting their mobility, ability to communicate or undertake self-care activities or a restriction
associated with schooling or employment. The 2011 Census reported that 5.8% of all Tasmanians
have a need for help with core activities.
73
Oral Health
This section describes the oral health of children who attended a school dental service in 2002 and
2006. The findings are based on analyses of data from the Child Dental Surveys, which monitor the
dental health of children enrolled in school dental services operated by health departments.
Dental decay (caries) remains relatively prevalent among Australian children. Factors known to be
associated with poor oral health include low socio-economic status, living in a rural or remote area
and indigenous status. Access to fluoridated drinking water and dental services have a strong direct
impact on oral health.
Children aged five to six years are an important age group for reporting on oral health status of
deciduous teeth of children new to school dental services. More than half of all children aged five to
six years experienced dental caries nationally (54.6%), with Tasmania showing the fourth highest
proportion of children (48%) with caries in deciduous teeth in 2006. Caries is indicated by decayed,
missing and filled teeth (dmft).
Figure 60: Proportion of children aged 5-6 years with dmft >0 in deciduous teeth by jurisdiction, 2006
62.6%
44.8%
41.4%
Qld
55.9%
54.6%
NT
Aus
48.0%
38.4%
WA
SA
Tas
ACT
AIHW, The Child Dental Health Surveys Australia, 2006
The amount of accumulated dental disease (mean dmft) in children aged five to six years was variable
across jurisdictions. The graph below shows the mean dmft for the deciduous teeth of Tasmanian
children aged five to six years was lower than the respective national values in 2002 and 2006
(Kasper 2005).
Figure 61: Oral health (mean dmft*) of children aged 5-6 years by jurisdiction, 2002 and 2006
3
*dmft = decayed, missing, filled teeth
2
1
0
Vic
Qld
WA
SA
Tas
ACT
NT
Aus
2002
1.85
2.28
1.58
1.62
1.76
1.84
2.3
1.89
2006
0
2.53
1.65
1.83
1.83
1.5
2.49
2.21
AIHW, The Child Dental Health Surveys Australia, 2002 and 2006
74
Less than half of 12-year-old children surveyed nationally had a dental caries experience (47.6%).
Tasmania was among the states with the highest prevalence of dental caries among 12-year-old
children (43.5%).
Figure 62: Proportion of children aged 12 years with dmft >0 in permanent teeth by jurisdiction, 2006
52.1%
42.2%
43.5%
SA
Tas
47.6%
37.6%
Qld
WA
40.0%
41.0%
ACT
NT
Aus
AIHW, The Child Dental Health Surveys Australia, 2006
The extent of dental caries among 12-year-old children varied across jurisdictions. Tasmania’s mean
dmft in 2006 (1.13) was lower than the national score, but the second highest of all jurisdictions.
Figure 63: Oral health (dmft*) of children aged 12 years by jurisdiction, 2002 and 2006
1.5
*dmft = decayed, missing, filled teeth
1
0.5
0
Qld
WA
SA
Tas
ACT
NT
Aus
2002
1.26
0.92
0.84
1.21
1.27
0.84
1.02
2006
1.44
0.82
0.94
1.13
0.89
1.05
1.24
AIHW, The Child Dental Health Surveys Australia, 2002 and 2006
The table below shows the jurisdictional proportions of children aged five to 12 years with no
experience of caries for the combined deciduous and permanent teeth. The table shows the
prevalence of good oral health (dmft = 0) for children aged five to 12 years in Tasmania was 42.9% in
2006.
Table 38: Absence of caries (dmft = 0) experience for children aged 5-12 years by jurisdiction, 2006
Qld
WA
SA
Tas
ACT
NT
Australia
36.0%
48.3%
43.9%
42.9%
46.7%
38.2%
40.6%
AIHW, Child Dental Health Surveys Australia, 2005 and 2006, 2011
75
Key Chronic Conditions
Cancer Incidence and Mortality
Cancer is a complex set of diseases characterised by the abnormal proliferation of cells that do not
respond to normal growth controls. 28 Cancer, known medically as malignant neoplasm, is a disease
involving unregulated cell growth. In cancer, cells divide and grow uncontrollably, forming malignant
tumours, and invade nearby parts of the body. Cancer may also spread to more distant parts of the
body through the lymphatic system or bloodstream. Not all tumours are cancerous. Benign tumours
do not grow uncontrollably, do not invade neighbouring tissues and do not spread throughout the
body.
Cancer can develop from almost any type of cell in the body. There are more than 200 different
types of cancer and it can develop in any body organ. There are over 60 different organs in the body
where a cancer can develop. 29
There are eight priority cancers identified in the national health priority areas: lung cancer,
colorectal (bowel) cancer, melanoma, non-melanocytic skin cancer, prostate cancer, breast cancer,
cervical cancer and non-Hodgkin's lymphoma. These cancers account for about 54% of all cancer
deaths in Australia. 30
Cancer is a notifiable disease. In accordance with the Public Health Act (1997), the Director of Public
Health requires any person or class of person, agency or public authority to notify the Director of
the presence or occurrence of cancer diagnoses. In reality, most notifications for cancer are made
by pathology laboratories once a tissue diagnosis of cancer is made from a specimen.
Cancer is primarily a disease of older people, with incidence rates increasing with age for most
cancers. Two kinds of mechanisms have been suggested to explain the increase in cancer risk with
age. The first refers to simple dose-duration effects of carcinogenic exposures, which means age
equals the duration of exposure to carcinogens. Another explanation implies individual vulnerability
to cancer increases with age and ageing-related processes may be responsible for this increase. 31
The graph below shows of all cancers cases from 2005 to 2009 in Tasmania, 58% occurred in people
aged 65 years and over.
Figure 64: All causes cancer* incident cases by age, Tasmania, 2005-09
0% 1%
6%
0-14 years
15-24 years
35%
25-44 years
45-64 years
58%
65+ years
*Excluding non melanocytic skin cancer.
Kasper, Dennis. Harrison’s Principles of Internal Medicine, 16th Edition. McGraw-Hill. 2005.
Cancer Research UK, http://www.cancerresearchuk.org/cancer-help/about-cancer/cancer-questions/how-many-differenttypes-of-cancer-are-there
30 AIHW, http://www.aihw.gov.au/nhpa/cancer/index.cfm
31 Demographic Research, Individual ageing and cancer risk: how are they related?
28
29
http://www.demographic-research.org/Volumes/Vol9/8/
76
Although cancer is primarily a disease that affects older people, it can occur at all ages. Between
2005 and 2009, the mean diagnosis age was 67 years (median=68 years) for Tasmanian males and 65
years (median=66 years) for Tasmanian females.
As shown in the figure below the incidence rates for all cancers combined generally increased with
age. Female rates were significantly higher than male rates for Tasmanians aged 35 to 49 years, while
significantly higher rates were found for males than for females in those aged 55 years and over in
2005-09. Breast cancer accounted for the high incidence rates in females between the ages of 35 and
49 years. The high incidence rates observed in males aged 55 years and over were largely due to the
incidence of prostate cancer, colorectal cancer, lung cancer and melanoma of skin in these age
groups.
Figure 65: Age-specific incidence rates for all cancers combined*, Tasmania 2005-09
4500.0
4000.0
Rate per 100,000 population
3500.0
3000.0
2500.0
2000.0
1500.0
1000.0
500.0
0.0
0-4
Males
5-9
1014
1519
2024
2529
3034
3539
4044
4549
5054
5559
6064
6569
7074
7579
8085+
84
28.5 16.1 8.0 19.3 32.5 79.8 76.6 106.4 204.3 321.2 607.5 1039. 1781. 2540. 3117. 3356. 3913. 3957.
Females 11.9 6.5
7.3 21.6 37.9 48.7 94.7 174.6 306.0 475.5 565.7 722.3 974.7 1369. 1362. 1869. 1912. 2001.
Persons 20.5 11.4 7.6 20.4 35.1 64.2 86.0 141.4 256.2 399.6 586.4 879.8 1378. 1952. 2206. 2553. 2737. 2626.
*Excluding non melanocytic skin cancer.
The number of cases of cancer expected to be diagnosed in Australia is projected to rise over the
next decade for both males and females by almost 40% from 2007. For males, prostate cancer is
expected to remain the most common cancer diagnosed in 2020, followed by bowel cancer,
melanoma and lung cancer. For females, breast cancer is projected to continue to be the most
common cancer diagnosed in 2020, followed by bowel cancer, melanoma and lung cancer (6 100). 32
Cancer incidence projections show that nationally, age-standardised rates for liver cancer are
expected to increase by 38% from 2007 to 2020 in males and 78% in females, while thyroid cancer
rates are projected to increase by 33% in males and 62% in females. Increases are also expected in
rates for melanoma (30% males; 18% females), testicular cancer (25%) and lung cancer in females
(16%). Conversely, age-standardised rates of stomach cancer are expected to fall by 25% from 2007
to 2020 for males and 20% for females. Additionally, bladder (19%), lung (15%) and pancreatic (14%)
cancer rates for males are also projected to fall.33
Increases in the number of cancer cases expected to be diagnosed over the next decade are due
primarily to the ageing and increasing population, and are expected to be most evident in older
populations. Because the average age of the population in Tasmania is increasing at a faster rate than
nationally, the rate of increase in cancer incidence may be greater in Tasmania than for Australia as a
whole.
32
33
AIHW, Cancer Incidence Projections, Australia 2011-2020, 2012
ibid
77
The graph below shows the projected increase in all-cause cancers for Tasmania’s population aged
65 years and over. The number of cancer cases is expected to increase to over 3 000 cases by 2051.
Figure 66: All causes cancer incident case projections, population 65 years and over, Tasmania, 1996-2051
3,500
Number of cases
3,000
2,500
2,000
1,500
1,000
500
0
1996 2001 2006 2011 2016 2021 2026 2031 2036 2041 2045 2051
Cases 1,337 1,443 1,562 1,789 2,135 2,459 2,775 2,995 3,116 3,137 3,089 3,059
* Exclude non-melanocytic cancer; projections use 2004 incident rates derived from the Tasmanian
The most common cancer (excluding non-melanoma skin cancer) diagnosed in males in Tasmania
between 2005 and 2009 was prostate cancer (34.2% of all cases). Colorectal cancer (13.6%) and lung
cancer (9.6%) were the second and third most commonly diagnosed cancers in males.
Figure 67: Most common cancers diagnosed in Tasmanian males, 2005-09
Prostate
34.2%
Colorectal
13.6%
Lung
9.6%
Melanoma of skin
All lymphomas
0.0%
8.4%
4.0%
10.0%
20.0%
30.0%
40.0%
1. % of all new cases.
2. There were 8,614 new cases diagnosed during 2005-09 (annual average = 707.1 cases per
100 000).
The most common cancer (excluding non-melanoma skin cancer) diagnosed in females in Tasmania
between 2005 and 2009 was breast cancer (25.8% of all cases). Colorectal cancer (16.8%) and
melanoma of the skin (9.8%) were the second and third most commonly diagnosed cancers in
females.
Figure 68: Most common cancers diagnosed in Tasmanian females, 2005-09
Breast
25.8%
Colorectal
16.8%
Melanoma of skin
9.8%
Lung
All lymphomas
0.0%
9.4%
4.1%
5.0%
10.0%
15.0%
20.0%
25.0%
30.0%
1. % of all new cases.
2. There were 6,137 new cases diagnosed in 2005-09 (annual average=490.6 cases per 100,000
78
From 2005 to 2009, the most commonly diagnosed forms of cancer for Australia as a whole were
prostate cancer (average annual=18 878 cases), colon (bowel) cancer (average annual=13 983 cases),
female breast cancer (average annual=12 991 cases), melanoma of skin (average annual=10 871
cases) and lung cancer (average annual=9 860 cases). These five types of cancer accounted for 61%
of all cancers diagnosed in this period.
For prostate cancer and lung cancer, the incidence rates were statistically higher in the South and
North, as well as Tasmania as a whole, than the national averages between 2005 and 2009, as shown
in the figure below.
The incidence rate of colon (bowel) cancer in the South, North West and Tasmania as a whole was
significantly higher compared to the national rate.
There were significantly lower incidence rates from breast cancer in females in the North West
region and melanoma of skin in the North compared to the national averages.
Significant difference in the incidence rate of all cancer combined was found between Tasmania and
Australia as a whole except for the North.
Figure 69: Age-standardised incidence rates for the top five cancers in Tasmania and Australia, 2005-09
600
Rate per 100,000 population
500
400
300
200
100
0
Prostate cancer
Colon cancer
Breast cancer
Melanoma of
skin
Lung cancer
All cancers
combined
South
229.4
72.6
115.8
49.1
49.4
537.6
North
195.2
66.8
106.6
42.3
49.4
488.3
North West
190.1
83.3
91.9
54.6
43.1
507.3
Tasmania
210.5
73.4
108.0
48.4
48.0
516.5
Australia
177.8
62.3
112.9
49.2
44.0
488.6
Notes: 1. Rates are age-standardised to the Australian 2001 population. 2. The error bars represent the 95% confidence
intervals of the rate. 3. All cancers combined includes cancer coded in ICD-10 as C00-C43, C45-C97, D45-D46, D47.1 and
D47.3 . Sources: Tasmanian Cancer Registry and AIHW: Australian Cancer Incidence and Mortality.
79
The age-standardised mortality rates for prostate cancer, breast cancer (female) and melanoma of
skin were not statistically different between Tasmanian regions and Australia as a whole (see figure
below) between 2007 and 2010. In contrast, the highest mortality rates from colorectal cancer were
observed in the South (25.2 deaths per 100 000) and Tasmania as a whole (21.7 deaths per 100 000),
with both of these rates significantly higher than the national rate (17.4 deaths per 100 000). For lung
cancer deaths, the rate in Tasmanian regions was significantly higher than the national average,
except for the North West region. However, there was significant difference in the mortality rate
for all cancer combined for all regions and Tasmania as whole compared to the national rate.
Figure 70: Age-standardised mortality rates for selected cancers, Tasmania and Australia, 2007-10
Rate per 100,000 population
250.0
200.0
150.0
100.0
50.0
0.0
Prostate cancer
Colorectal
cancer
Breast cancer
Melanoma of
skin
Lung cancer
All cancers
combined
South
30.9
25.2
22.5
5.0
38.7
192.9
North
32.6
17.2
23.9
4.4
40.2
192.4
North West
29.4
19.5
22.5
5.6
36.5
206.4
Tasmania
31.2
21.7
22.9
5.0
38.7
196.4
Australia
31.0
17.4
21.9
5.9
33.7
173.8
Notes: 1. Rates are age-standardised to the Australian 2001 population. 2. The error bars represent the 95% confidence
intervals of the rate. 3. All cancers combined includes cancer coded in ICD-10 as C00-C97 . Sources: ABS Causese of Death
Cat. No. 3303.0 and AIHW personal communication.
The age-standardised death rate for all cancers in 2010 was higher in Tasmania (192.7 deaths per
100 000 population) than for Australia as a whole (172.3 deaths per 100 000 population).
In 2009 the age-standardised mortality rate for Australia for all-cause cancers at 184 per 100 000 for
males was well below the OECD average of 208 per 100 000 population. For females, the all-cause
cancer death rate in Australia was 115 per 100 000 population compared to the OECD average of
124 per 100 000 population.
80
Prostate Cancer
The age-standardised incidence rate for prostate cancer between 2005 and 2009 was 210.5 cases
per 100 000 males in Tasmania. There were significant regional differences in the age-standardised
incidence rates for prostate cancer in Tasmania. The highest rate was recorded in males from the
Southern region (229.4 per 100 000) and the lowest rate occurred in those from the North West
region (190 per 100 000).
Rate per 100,000 population
Figure 71: Age-standardised incidence rate for prostate cancer (ICD-10 C61) by region, Tasmania, 2005-09
300.0
250.0
200.0
150.0
100.0
229.4
195.2
190.1
210.5
North
North West
Tasmania
50.0
0.0
South
Notes: 1. Rates are age-standardised to the Australian 2001 population. 2. The error
bars represent the 95% confidence intervals of the rate.
The age-standardised incidence rate for prostate cancer in Tasmania has more than doubled since
1986-87.
The average annual percentage change has been 3.6% a year. The increased incidence of prostate
cancer has been largely attributed to increased testing and earlier detection of asymptomatic cases.
Figure 72: Age-standardised incidence rate for prostate cancer (ICD-9 185, ICD-10 C61), Tasmania, 19862009
Rate per 100,000 population
250.0
200.0
150.0
100.0
50.0
0.0
1986-87 1988-89 1990-91 1992-93 1994-95 1996-97 1998-99 2000-01 2002-03 2004-05 2006-07 2008-09
Males 73.5
81.6
103.2
160.2
216.0
150.3
128.2
132.9
153.2
177.7
208.9
222.9
Notes: 1. Rates are age-standardised to the Australian 2001 population. 2. Average annual percentage change: 3.6% (P<0.01).
81
The mortality rates for prostate cancer have decreased since 1993-95. This trend in mortality may
be due improvements in treatment and an effect of prostate specific antigen screening leading to
more diagnoses in males who, in many cases, would not have died from their prostate cancer even if
not detected and treated.
Figure 73: Age-standardised mortality rate for prostate cancer (ICD-9 195, ICD-10 C61), Tasmania, 19782010
Rate per 100,000 population
60.0
50.0
40.0
30.0
20.0
10.0
0.0
Males
1978-80 1981-83 1984-86 1987-89 1990-92 1993-95 1996-98 1999-01 2002-04 2005-07 2008-10
31.3
29.4
31.1
41.8
43.6
49.3
44.9
39.5
43.5
32.8
31.3
Notes: 1. Rates are age-standardised to the Australian 2001 population. 2. Average annual percentage change: -1.5% (P<0.01). Sources: 1.
ABS Mortality Database. 2. ABS Cat. No. 3303.0_7.
Breast Cancer
The age-standardised incidence rate for breast cancer between 2005 and 2009 was 108.0 cases per
100 000 females in Tasmania. The rate for the Southern region (115.8 per 100 000) was higher than
rate for the Northern region (106.6 per 100 000) and the North West region (91.9 per 100 000).
Rate per 100,000 population
Figure 74: Age-standardised incidence rate for breast cancer (ICD-10 C50) by region, Tasmania, 2005-09
140
120
100
80
60
115.8
106.6
South
North
40
91.9
108.0
20
0
North West
Tasmania
Notes: 1. Rates are age-standardised to the Australian 2001 population. 2. The error
bars represent the 95% confidence intervals of the rate.
82
Incidence rates for breast cancer have increased since 1986-87 by 1.5% a year. This increase has in
part resulted from the improved detection of breast cancer through the introduction of the
BreastScreen Tasmania program that started in 1993.
Figure 75: Age-standardised incidence rate for breast cancer (ICD-9 174, ICD-10 C50), Tasmania, 19862009
Rate per 100,000 population
140.0
120.0
100.0
80.0
60.0
40.0
20.0
0.0
Females
1986-87 1988-89 1990-91 1992-93 1994-95 1996-97 1998-99 2000-01 2002-03 2004-05 2006-07 2008-09
78.7
74.0
84.7
100.3 116.7
96.1
106.1 107.6 120.1 114.7 102.1 110.2
Notes: 1. Rates are age-standardised to the Australian 2001 population. 2. Average annual percentage change: 1.5% (P<0.01).
Although the incidence rate for breast cancer has increased, the age-standardised mortality rates
have decreased since 1993-95 in Tasmania. This is largely attributed to earlier detection of cancers
through screening and advances in breast cancer treatment resulting in improved survival.
Figure 76: Age-standardised mortality rate for breast cancer (ICD-9 174, ICD-10 C50), Tasmania, 19782010
Rate per 100,000 population
40.0
35.0
30.0
25.0
20.0
15.0
10.0
5.0
0.0
Females
1978-80 1981-83 1984-86 1987-89 1990-92 1993-95 1996-98 1999-01 2002-04 2005-07 2008-10
27.3
32.6
33.6
31.5
28.7
29.8
23.5
29.0
24.4
22.0
Notes: 1. Rates are age-standardised to the Australian 2001 population. 2. Average annual percentage change: -1.4% (P<0.01).
83
24.9
Colorectal Cancer
Colorectal cancer (bowel) incidence rates are higher in males than in females. Age-standardised
colorectal cancer incidence rates between 2005 and 2009 were 87.2 cases per 100 000 males and
65.5 cases per 100 000 females in Tasmania. Rates in both sexes were higher than 2007 Australian
rates (males-75.2/ 100 000; females-53.4/ 100 000).
Rate per 100,000 population
Figure 77: Age-standardised incidence rate for colorectal cancer (ICD-10 C18-C21) by region, Tasmania,
2005-09
120.0
100.0
80.0
60.0
40.0
20.0
0.0
South
North
North West
Tasmania
Males
86.2
77.4
101.0
87.2
Females
64.8
61.4
72.4
65.5
Notes: 1. Rates are age-standardised to the Australian 2001 population. 2. The error
bars represent the 95% confidence intervals of the rate.
In Tasmania, the age-standardised incidence rates for colorectal cancer in males increased from 65.3
per 100 000 in 1986-87 to 90.3 per 100 000 in 2008-09. In contrast, the incidence rate of colorectal
cancer in females remained relatively stable during this period, varying between 50.0 and 67.8 cases
per 100 000.
Figure 78: Age-standardised incidence rate for colorectal cancer (ICD-9 153-154, ICD-10 C18-C21),
Tasmania, 1986-2009
Rate per 100,000 population
100.0
80.0
60.0
40.0
20.0
0.0
Males
Females
198687
65.3
198889
67.7
199091
72.5
199293
77.9
199495
74.8
199697
75.0
199899
73.4
200001
80.8
200203
74.8
200405
72.4
200607
87.8
200809
90.3
53.4
53.6
54.9
53.9
58.5
59.1
57.8
67.1
50.0
55.6
67.8
65.4
Notes: 1. Rates are age-standardised to the Australian 2001 population. 2. Average annual percentage change for males: 1.1%
(P<0.01) for females: 08% (P<0.01).
84
Age-standardised mortality rates for colorectal cancer have significantly decreased between 1978
and 2010, from 44.8 to 25.0 deaths per 100 000 males and from 29.3 to 18.5 deaths per 100 000
females.
Figure 79: Age-standardised mortality rate for colorectal cancer (ICD-9 153-154, ICD-10 C18-C21),
Tasmania, 1978-2010
Rate per 100,000 population
50.0
40.0
30.0
20.0
10.0
0.0
1978-80 1981-83 1984-86 1987-89 1990-92 1993-95 1996-98 1999-01 2002-04 2005-07 2008-10
Males
44.8
39.5
40.5
40.9
34.4
40.3
36.8
31.4
31.6
23.9
25.0
Females
29.3
29.1
34.0
31.5
23.6
27.4
29.0
28.1
21.6
19.7
18.5
Notes: 1. Rates are age-standardised to the Australian 2001 population. 2. Average annual percentage change: for males: -2.8% (P<0.01);
for females: -2.9% (P<0.01). Sources: 1. ABS mortality database. 2. ABS Cat. No. 3303.0_7.
Lung Cancer
Lung cancers comprise cancers of the trachea, bronchus and lung. The primary causes of lung cancer
are tobacco smoking and passive exposure to tobacco smoke. Lung cancer was the third most
common cancer in males (61.5 cases per 100 000 males) and the fourth most common cancer
diagnosis in females (37.2 cases per 100 000 females) in Tasmania (excluding non-melanoma skin
cancers) between 2005 and 2009. There was no significant regional difference in incidence rates for
lung cancer in Tasmania.
Figure 80: Age-standardised incidence rate for lung cancer (ICD-10 C33-C34) by region, Tasmania, 2005-09
Rate per 100,000 population
80
70
60
50
40
30
20
10
0
South
North
North West
Tasmania
Males
63.2
64.3
54.6
61.5
Females
38.6
37.9
33.5
37.2
Notes: 1. Rates are age-standardised to the Australian 2001 population. 2. The error
bars represent the 95% confidence intervals of the rate.
85
The incidence of lung cancer in males is almost twice the rate for females, but the gap is closing, with
the incidence declining for males but increasing for females. From 1986-87 to 2008-09, the incidence
rate of lung cancer decreased by an average of 1.4% a year in males and rose by 1.9% a year in
females. A similar pattern has been observed nationally.
Figure 81: Age-standardised incidence rate for lung cancer (ICD-9 162, ICD-10 C33-C34), Tasmania, 19862009
Rate per 100,000 population
100.0
80.0
60.0
40.0
20.0
0.0
Males
Females
1986-87 1988-89 1990-91 1992-93 1994-95 1996-97 1998-99 2000-01 2002-03 2004-05 2006-07 2008-09
83.7
83.2
77.6
71.6
77.5
78.7
72.0
65.3
75.2
66.4
70.0
52.2
27.6
26.3
28.4
24.4
27.6
29.8
27.3
36.0
37.5
34.4
39.6
34.5
Notes: 1. Rates are age-standardised to the Australian 2001 population. 2. Average annual percentage change: for males -1.4% (P<0.01) for females: 1.9%
(P<0.01).
The age-standardised mortality rate for lung cancer in Tasmania decreased significantly between
1978 and 2010 in males but increased for females. In spite of this, the mortality rate for lung cancer
remains higher in males than in females, reflecting historically higher smoking rates in males
compared with females. There were between 49.7 and 84.2 deaths per 100 000 persons in males
and between 16.1 and 29.9 deaths per 100 000 persons in females in Tasmania from 1978 to 2010.
Figure 82: Age-standardised mortality rate for lung cancer (ICD-9 162, ICD-10 C34), Tasmania, 1978-2010
Rate per 100,000 population
100.0
80.0
60.0
40.0
20.0
0.0
1978-80 1981-83 1984-86 1987-89 1990-92 1993-95 1996-98 1999-01 2002-04 2005-07 2008-10
Males
74.8
84.2
76.2
78.4
65.4
67.3
70.4
58.7
57.4
59.8
49.7
Females
16.1
16.1
16.8
22.6
24.9
23.9
23.5
26.1
29.9
29.9
27.4
Notes: 1. Rates are age-standardised to the Australian 2001 population. 2. Average annual percentage change: for males: -1.8% (P<0.01);
for females: 1.2% (P<0.01).
Sources: 1. ABS mortality database. 2. ABS Cat. No. 3303.0_7.
86
Melanoma of Skin
Between 2005 and 2009, melanoma of the skin was the third most common cancer in Tasmanian
females (42.9 cases per 100 000 population) and the fourth most common cancer for males (55.6
cases per 100 000 population). Between 2005 and 2009, the Tasmanian rates in both sexes were
very similar to the 2008 Australian rates (males - 60.5 per 100 000 persons; females - 39.3 per
100 000 persons). There were no significant regional differences in incidence rates for melanoma in
Tasmania between 2005 and 2009.
Rate per 100,000 population
Figure 83: Age-standardised incidence rate for melanoma of skin (ICD-10 C43) by region, Tasmania, 200509
80.0
70.0
60.0
50.0
40.0
30.0
20.0
10.0
0.0
South
North
North West
Tasmania
Males
55.7
50.0
62.3
55.6
Females
44.4
36.4
48.1
42.9
Notes: 1. Rates are age-standardised to the Australian 2001 population. 2. The error
bars represent the 95% confidence intervals of the rate.
The incidence rate for melanoma has increased an average of 3.6% per annum for males and by 1.8%
per annum for females since 1986-87. This increase may be in part explained by improvements in the
registration of this type of cancer.
Figure 84: Age-standardised incidence rate for melanoma of skin (ICD-9 172, ICD-10 C43), Tasmania, 19862009
Rate per 100,000 population
80.0
60.0
40.0
20.0
0.0
Males
Females
1986-87 1988-89 1990-91 1992-93 1994-95 1996-97 1998-99 2000-01 2002-03 2004-05 2006-07 2008-09
19.0
30.1
35.3
32.3
40.5
42.9
38.7
47.2
49.2
52.6
49.1
60.2
29.9
29.3
34.4
27.9
34.4
40.1
38.7
45.2
40.1
44.5
41.8
Notes: 1. Rates are age-standardised to the Australian 2001 population. 2. Average annual percentage change for males: 3.6%
(P<0.01) for females: 1.8% (P<0.01).
87
40.0
The age-standardised mortality rate for melanoma has varied between 4.0 and 9.7 deaths per
100 000 persons in males and between 2.3 and 5.0 deaths per 100 000 persons in females for the
period 1978-2010.
Rate per 100,000 population
Figure 85: Age-standardised mortality rate for melanoma of skin (ICD-9 172, ICD-10 C43), Tasmania, 19782010
12.0
10.0
8.0
6.0
4.0
2.0
0.0
1978-80 1981-83 1984-86 1987-89 1990-92 1993-95 1996-98 1999-01 2002-04 2005-07 2008-10
Males
4.0
5.5
5.5
5.7
5.9
5.1
4.2
5.6
9.7
6.6
7.8
Females
3.4
3.7
5.0
3.2
3.9
2.3
2.9
3.6
2.3
3.2
4.0
Notes: 1. Rates are age-standardised to the Australian 2001 population. 2. Average annual percentage change: for males: 1.6%
(P<0.05); for females: -2.4% (P<0.05). 4. ABS did not release female rate for 2010. Sources: 1. ABS Mortlaity Database. 2. ABS
Lymphoma
Lymphoma refers to a type of cancer that produces solid tumours of the immune system. There are
many different types of lymphoma. The statistics reported here are for the main categories of
lymphoma: Hodgkin’s’ disease, non-Hodgkin’s lymphomas, including peripheral and cutaneous T-cell
lymphomas.
Hodgkin’s disease is less common than non-Hodgkin’s lymphoma. The incidence of Hodgkin’s disease
appears stable. A bimodal distribution of age at diagnosis has been observed with one peak in
incidence occurring in patients in their twenties and the other in those in their eighties.
The non-Hodgkin’s lymphomas are a highly variable group of lymphoma types. They are more
common than Hodgkin’s disease and their prevalence is increasing nationally. The reasons for this
increase are largely unknown, however, similar increases have been observed in a number of
countries worldwide. Non-Hodgkin’s lymphomas are more frequent in the elderly and more
frequent in males.
In Tasmania, the incidence rate for lymphomas is higher in males than females. There are no
significant differences in lymphoma incidence by region.
Figure 86: Age-standardised incidence rate for lymphomas (ICD-10 C81-C85) by region, Tasmania, 2005-09
Rate per 100,000 population
35.0
30.0
25.0
20.0
15.0
10.0
5.0
0.0
South
North
North West
Tasmania
Males
28.2
25.9
22.0
26.1
Females
18.8
15.7
14.6
16.9
Notes: 1. Rates are age-standardised to the Australian 2001 population. 2. The error
bars represent the 95% confidence intervals of the rate.
88
The incidence rate for lymphomas in Tasmania has increased by 1.6% per annum for males and by
0.4% for females between 1986-87 and 2008-09.
Figure 87: Age-standardised incidence rate for lymphoma (ICD-9 200-202, ICD-10 C81-C85), Tasmania,
1986-2009
Rate per 100,000 population
35.0
30.0
25.0
20.0
15.0
10.0
5.0
0.0
Males
Females
198687
17.1
198889
18.6
199091
22.1
199293
23.0
199495
19.4
199697
24.3
199899
26.1
200001
25.0
200203
24.1
200405
19.2
200607
30.1
200809
26.1
17.2
11.8
17.3
14.7
16.7
19.7
17.6
16.9
16.0
17.6
17.0
15.7
Notes: 1. Rates are age-standardised to the Australian 2001 population. 2. Average annual percentage change: for males 1.6%%
(P<0.01) for females: 0.4% (P=0.4).
The age-standardised mortality rate for lymphoma fluctuated over time in both sexes. Between 1978
and 2007 mortality rates in males have varied from 7.4 to 12.4 deaths per 100 000 persons and in
females rates have ranged from 3.3 to 9.4 deaths per 100 000 persons.
Rate per 100,000 population
Figure 88: Age-standardised mortality rate for lymphomas (ICD-9 200-202, ICD-10 C81-C85), Tasmania,
1978-2007
14.0
12.0
10.0
8.0
6.0
4.0
2.0
0.0
1978-80
1981-83
1984-86
1987-89
1990-92
1993-95
1996-98
1999-01
2002-04
2005-07
Males
9.3
7.4
8.2
8.1
12.4
11.0
11.0
12.0
11.8
7.9
Females
3.3
6.3
7.0
6.7
6.0
7.4
9.4
6.7
7.8
6.5
Notes: 1. Rates are age-standardised to the Australian 2001 population. 2. Average annual percentage change: for males: 0.1% (P=0.9);
for females: 0.7% (P=0.5). 3. ABS did not release the data for the years 2008-10.
Sources: 1. ABS mortality database. 2. ABS Cat. No. 3303.0_7.
89
Cervical Cancer
From 2005 to 2009 (with these years being combined due to low case numbers) the agestandardised incidence rate for cervical cancer was seven cases per 100 000 females in Tasmania,
which was the same as the 2008 national rate of 7.0 per 100 000 females. There was no significant
regional variation in incidence rates.
Figure 89: Age-standardised incidence rate for cervical cancer (ICD-10 C53) by region, Tasmania, 2005-09
Rate per 100,000 population
12.0
10.0
8.0
6.0
4.0
2.0
0.0
Females
South
North
North West
Tasmania
7.9
5.8
6.4
7.0
Notes: 1. Rates are age-standardised to the Australian 2001 population. 2. The error
bars represent the 95% confidence intervals of the rate.
The incidence of cervical cancer in Tasmanian females is decreasing by about 4.2% a year.
Figure 90: Age-standardised incidence rate for cervical cancer (ICD-9 180, ICD-10 C53), Tasmania, 19862009
Rate per 100,000 population
20.0
15.0
10.0
5.0
0.0
Females
1986-87 1988-89 1990-91 1992-93 1994-95 1996-97 1998-99 2000-01 2002-03 2004-05 2006-07 2008-09
15.7
14.1
15.3
12.7
12.2
10.0
9.9
7.2
8.2
9.0
6.7
6.4
Notes: 1. Rates are age-standardised to the Australian 2001 population. 2. Average annual percentage change for females: -4.2%
(P<0.01).
90
Cervical cancer was once the most common cause of cancer death in females, but over the past 30
years the mortality rate has decreased significantly (by about 4.6% a year) due to widespread
screening of the sexually active female population with the Papanicolau (Pap) smear.
Figure 91: Age-standardised mortality rate for cervical cancer (ICD-9 180, ICD-10 C53), Tasmania, 19782010
Rate per 100,000 population
10.0
8.0
6.0
4.0
2.0
0.0
Females
1978-80 1981-83 1984-86 1987-89 1990-92 1993-95 1996-98 1999-01 2002-04 2005-07 2008-10
7.8
6.2
5.6
5.4
5.7
5.9
4.8
2.1
3.9
2.9
Notes: 1. Rates are age-standardised to the Australian 2001 population. 2. Average annual percentage change:: -4.6% (P<0.01). 3.
ABS did not release the data for the years 2009-10.
Sources: 1. ABS Mortality Database. 2. ABS Cat. No. 3303.0_7.
91
2.0
Cardiovascular Disease
Cardiovascular disease (CVD) is a leading cause of mortality and a significant cause of morbidity and
disability in the Tasmanian community. CVD includes diseases affecting the blood vessels of the
heart, brain and peripheral blood vessels. The major modifiable risk factors for CVD are tobacco
smoking, physical inactivity, a high-fat and energy rich diet, obesity, high blood glucose, high
cholesterol and hypertension (high blood pressure). A high dietary salt intake may also influence risk
of CVD in some individuals. 34 In addition, research indicates a consistent socio-economic gradient in
mortality and hospitalisation rates for cardiovascular diseases, with the most disadvantaged people
experiencing the highest rates of CVD. 35
Hypertension and High Blood Cholesterol
Hypertension is a condition of elevated arterial pressure. It is a considerable public health problem
as it is a significant contributor to cardiovascular mortality. The risk of disease increases as the level
of blood pressure increases. High blood pressure is also associated with other risk factors. The
major causes of high blood pressure include overweight, alcohol consumption, physical inactivity,
dietary salt, low intake of fruit and vegetables and a high intake of saturated fat.
High blood cholesterol is a major risk factor for coronary heart disease and possibly some types of
stroke. It is one of the main causes of the process by which the blood vessels that supply the heart
and other parts of the body become clogged. For most people, saturated fat in the diet is regarded
as the main factor that raises blood cholesterol levels. Cholesterol in foods can also raise blood
cholesterol levels, but less than saturated fat does. Genetic factors can also affect blood cholesterol.
According to the 2011-12 Australian Health Survey, 13.6% of Tasmanians have been diagnosed with
hypertension, a statistically significantly higher (p<0.01) proportion than for Australia overall (10.2%).
Conversely, the proportion of Tasmanians estimated to have been diagnosed with high blood
cholesterol (7.5%) was similar to Australia as a whole (6.8%). However, these data have not been
age-adjusted.
Figure 92: Prevalence of hypertension and high blood cholesterol*, Tasmania and Australia, 2011-12
13.6%
Tas
Aust
10.2%
7.5%
Hypertension
6.8%
High cholesterol
Australian Health Survey First Results, 2011-12, cat. No. 4364.0; *condition which has lasted or is expected to last for 6 months or more
Kasper, Dennis. Harrison’s Principles of Internal Medicine, 16th Edition. McGraw-Hill. 2005
AIHW, Socio-economic Inequalities in Cardiovascular Disease in Australia: Current Picture and Trends Since 1992,
Bulletin, Issue 37, 2006, pp. 10-12
34
35
92
The risk of being diagnosed with hypertension or high blood cholesterol, like most chronic
conditions, increases with age and Tasmania has the highest proportion of people aged 65 years and
over (16.3%) of all jurisdictions. For example, while only 5.1% of Tasmanians aged 25-44 years
reported hypertension in 2011-12, about 45% of those aged 65 years and over reported it.
The prevalence of hypertension among Tasmanians in 2011-12 (13.6%) has not increased significantly
since 1995 (12.2%), but the prevalence of self-reported high blood cholesterol has increased by 3%
since 1995, a statistically significant increase (p<0.01). This increase is not linked to increased
screening. Medicare pathology services in Tasmania for Lipid Studies measuring cholesterol and
triglycerides (Item 66503) were 2 351 services per 100 000 population in 2001-02, 2 438 services in
2006-07, and 2 079 services per 100 000 population in 2011-12.
Figure 93: Prevalence of hypertensive disease and high cholesterol*, Tasmania 1995-2011-12
13.3%
13.1%
12.6%
12.2%
13.6%
7.4%
6.6%
6.2%
7.5%
4.5%
Hypertensive disease
High cholesterol
1995
2001
2004/5
2007/8
2011/12
* Condition lasted/expected to last for 6 months ior more ;Australian Health Survey First Results, 2011-12, cat.no. 4364.0;
ABS, National Health Survey Summary of Results Australia 2007-08, cat. no. 4362.0
ABS, National Health Survey Summary of Results Australia 2004-05, cat. no. 4364.0
ABS, National Health Survey 2001 cat. no. 4364.0 - Companion Data;
ABS, National Health Survey Summary of Results Australian States and Territories 1995, cat. no. 4368..0
Ischaemic Heart Disease
Ischaemic heart disease refers to a condition of inadequate oxygen supply to the muscle of the heart,
most commonly due to obstruction of the coronary arteries. 36 The hospitalisation rate for ischaemic
heart disease in Tasmania from 2007 to 2011 was higher in males (7.5 cases per 1 000 persons) than
females (3 cases per 1 000 persons). Hospitalisation rates were significantly higher in the North
West of the state.
Rate per 1000 population
Figure 94: Age-standardised hospital separation rate for ischaemic heart disease (ICD-10 I20-I25),
Tasmania 2007-11
12.0
10.0
8.0
6.0
4.0
2.0
0.0
South
North
North West
Tasmania
Males
7.2
6.1
9.6
7.5
Females
3.1
2.4
3.6
3.0
Notes: 1. Rates are age-standardised to the Australian 2001 population. 2. The error
bars represent the 95% confidence intervals of the rate.
Source: Statewide Morbidity Database, Tasmania.
36
Kasper, Dennis. Harrison’s Principles of Internal Medicine, 16th Edition. McGraw-Hill. 2005.
93
Age-standardised hospitalisation rates for ischaemic heart disease have decreased in both males
(4.0% per annum) and females (5.5% a year) in Tasmania between 2000 and 2011. This fall may
reflect better community health care for ischaemic heart disease (such as angina as a condition of
potentially preventable hospitalisation) and lifestyle changes. The total number of hospitalisations for
ischaemic heart disease in Tasmania has remained relatively constant with 3 210 and 3 011
hospitalisations per year between 2007 and 2011.
Figure 95: Age-standardised hospital separation rate for ischaemic heart disease (ICD-10 I20-I25),
Tasmania 2007-11
Rate per 1000 population
12.0
10.0
8.0
6.0
4.0
2.0
0.0
Males
2000 2001 2002 2003 2004 2005 2006 2007 2008 2009 2010 2011
10.7 10.6 10.5
Females 4.4
5.0
5.0
9.4
8.4
8.4
8.1
7.7
7.9
7.3
7.3
7.1
4.5
4.1
4.0
3.5
3.5
3.3
2.9
2.8
2.7
Notes: 1. Rates are age-standardised to the Australian 2001 population. 2. Average annual
percentage change:for males: -4.0% (P<0.01); for females: -5.5% (P<0.01).
Source:: Statewide Morbidity Database, Tasmania.
Tasmania’s age-standardised mortality rate for ischaemic heart disease (105.3 deaths per 100 000
persons) was significantly higher than the Australian rate (90.7 deaths per 100 000 persons) over the
period 2007-10. The age standardised mortality rate for ischaemic heart disease was significantly
higher for males than females for each region, and for Tasmania as a whole between 2007 and 2010.
Rate per 100,000 population
Figure 96: Age-standardised mortality rate for ischaemic heart disease (ICD-10 I20-I25) by region,
Tasmania 2007-10
200.0
150.0
100.0
50.0
0.0
South
North
Males
143.0
133.4
North
West
128.0
Females
81.6
74.2
76.2
Tasmania
137.4
79.0
Notes: 1. Rates are age-standardised to the Australian 2001 population. 2. The error
bars represent the 95% confidence intervals of the rate. Source:: AIHW.
94
The age-standardised mortality rate for ischaemic heart disease has decreased significantly in
Tasmania between 1978 and 2010 for both males and females. This has been attributed to
improvements in medical treatment and follow-up care, rather than a reduction in the prevalence of
ischaemic heart disease. The mortality rate continues to be higher in males than females; however,
the differential in ischaemic heart disease mortality between males and females has narrowed
considerably over this period.
Figure 97: Age-standardised mortality rate for ischaemic heart disease (ICD-9 410-414, ICD-10 I20-I25)
Tasmania, 1978-2010
Rate per 100,000 population
500.0
400.0
300.0
200.0
100.0
0.0
1978-80 1981-83 1984-86 1987-89 1990-92 1993-95 1996-98 1999-01 2002-04 2005-07 2008-10
Males
434.5
418.9
390.8
348.5
302.2
270.3
242.1
197.2
173.4
142.9
139.7
Females
210.7
204.1
205.3
194.1
170.0
149.3
128.6
116.4
101.0
86.8
75.5
Notes: 1. Rates are age-standardised to the Australian 2001 population. 2. Average annual percentage change: for males: -4.0% (P<0.01); for
females: -3.4% (P<0.01).
Across OECD countries, ischaemic heart disease is significantly more prevalent among males than
females. Rates for males in 2009 ranged from 37.4 per 100 000 persons in Korea to over 200 per
100 000 people in the Czech Republic. Australia’s rates for males (98.9) and females (52.3) were
below the OECD averages of 117 and 60 per 100 000 people respectively.
95
Stroke (Cerebrovascular Accident)
Stroke or cerebrovascular accident refers to a condition of abrupt onset of a neurologic deficit
attributable to either a focal interruption to the blood flow of the brain, or from haemorrhage into
the brain. The incidence of stroke increases with age. Major modifiable risk factors for stroke are
the same as for other cardiovascular diseases. 37 Strokes are an important contributor to hospital
costs, and the average length of hospital stay for people who experience a stroke is around twice
that for other cardiovascular diseases. 38 This is in part due to the disability and the need for
rehabilitation stroke entails.
In Tasmania, the age-standardised hospitalisation rate for strokes between 2007 and 2011 was 2.4
hospitalisations per 1 000 persons in males and 1.8 hospitalisations per 1 000 persons in females.
There has been a downward trend in hospitalisation rates for stroke over the last 10 years. The
hospitalisation rate has decreased on average by 2.1% annually for males and 1.2% for females. The
gap in the rate of hospitalisations between males and females appears to be narrowing.
Figure 98: Age-standardised hospital separation rate for strokes (ICD-10 I60-I69, G45-G46) by region,
Tasmania, 2007-11
Rate per 1000 population
3.5
3.0
2.5
2.0
1.5
1.0
0.5
0.0
South
North
North West
Tasmania
Males
2.2
2.5
2.8
2.4
Females
1.7
1.8
2.2
1.8
Notes: 1. Rates are age-standardised to the Australian 2001 population. 2. The error
bars represent the 95% confidence intervals of the rate.
Source: Statewide Morbidity Database., Tasmania.
There has been a downward trend in hospitalisation rates for strokes over the last 12 years. The
hospitalisation rate has decreased on average by 2.1% annually for males and 1.6% for females. The
gap in the rate of hospitalisations between males and females appears to be narrowing. Comparisons
cannot be made between Tasmanian and Australian hospitalisation rates as data are not comparable.
37
38
Kasper, Dennis. Harrison’s Principles of Internal Medicine, 16th Edition. McGraw-Hill. 2005
AIHW, Australia’s Health 2004, Canberra, 2004, p.61
96
Rate per 1000 population
Figure 99: Age-standardised hospital separation rate for strokes (ICD-10 I60-I69, G45-G46), Tasmania,
2000-11
3.5
3.0
2.5
2.0
1.5
1.0
0.5
0.0
2000
2001
2002
2003
2004
2005
2006
2007
2008
2009
2010
Males
2.8
3.0
2.8
2.9
2.6
2.7
2.8
2.6
2.5
2.3
2.3
2011
2.4
Females
2.0
2.2
2.2
2.1
2.0
2.2
2.0
2.0
1.9
1.9
1.8
1.8
Notes: 1. Rates are age-standardised to the Australian 2001 population. 2. Average annual percentage
change: for males: -2.1% (P<0.01); for females: -1.6% (P<0.01). Source:: Statewide Morbidity Database,
97
Stroke is a major cause of mortality among adults. The Tasmanian age-standardised mortality rate
for stroke in 2010 was 47.3 deaths per 100 000 persons, higher than the Australian rate of 42.5
deaths per 100 000 persons.
Over the period 2007 to 2010, the age-standardised mortality rates for strokes in Tasmania were
45.3 deaths per 100 000 persons in males and 49.8 deaths per 100 000 persons in females. Rates did
not vary significantly by region.
Rate per 100,000 population
Figure 100: Age-standardised mortality rate for strokes (ICD-10 I60-I69, G45-G46) by region, Tasmania
2007-10
70.0
60.0
50.0
40.0
30.0
20.0
10.0
0.0
South
North
Males
44.1
41.0
North
West
52.5
Females
49.1
47.9
52.2
Tasmania
45.3
49.8
Notes: 1. Rates are age-standardised to the Australian 2001 population. 2. The error
bars represent the 95% confidence intervals of the rate. Source: AIHW.
There has been a downward trend in the age-standardised mortality rates for strokes in Tasmania
for both males and females over the period 1978 to 2010.
Rate per 100,000 population
Figure 101: Age-standardised mortality rate for strokes (ICD-9 430-438, ICD-10 I60-I69),
Tasmania, 1978-80 – 2008-10
160.0
140.0
120.0
100.0
80.0
60.0
40.0
20.0
0.0
1978-80 1981-83 1984-86 1987-89 1990-92 1993-95 1996-98 1999-01 2002-04 2005-07 2008-10
Males
141.4
113.0
107.7
106.6
90.0
93.9
89.1
77.8
57.2
46.8
44.5
Females
139.2
120.5
123.6
108.1
81.8
86.6
76.3
64.6
53.5
43.0
48.0
Notes: 1. Rates are age-standardised to the Australian 2001 population. 2. Average annual percentage change: for males: -3.3% (P<0.01);
for females: -3.8% (P<0.01).
Sources: ABS mortlaity database. . ABS Cat. No. 3303.0_7.
98
Diabetes Mellitus
Diabetes mellitus is a metabolic condition of insufficient insulin production to meet the body’s needs.
Several distinct types of diabetes mellitus exist and are caused by a complex interaction of genetics,
environmental factors and lifestyle factors. The metabolic consequences of diabetes mellitus on the
body include damage to blood vessels, kidneys, nervous system and retina. Diabetes mellitus is a
leading cause of end-stage renal disease, non-traumatic lower limb amputations and adult blindness.
About 75% of people with diabetes will die from cardiovascular disease.
Diabetes mellitus is broadly categorised into type 1 and type 2 diabetes based on the mechanism of
insulin deficiency. Most patients with type 1 diabetes develop insulin deficiency as a result of
autoimmune destruction of the pancreatic cells that produce insulin. In type 2 diabetes, insulin
deficiency results from a combination of insulin resistance, impaired insulin secretion and increased
glucose production. This is the type more commonly associated with obesity. Although the
prevalence of both type 1 and 2 diabetes is increasing worldwide, the prevalence of type 2 diabetes
is expected to rise more rapidly in the future because of increasing population levels of obesity,
population ageing and reduced population physical activity levels. 39
High blood sugar levels are associated with diabetes, and elevated high blood sugar levels in nondiabetics are regarded as a precursor to diabetes. In 2011-12, 0.3% of Australians who were not
diabetics reported having been diagnosed with high blood sugar levels. The equivalent Tasmanian
figure has not been published, but is expected to be similar to the national level as it was in 2004
(0.3% for both Tasmania and Australia).
The prevalence of diabetes for Tasmania and Australia is very similar. The Tasmanian self-reported
prevalence of diabetes in 2011-12 was 4.6%, which was not significantly higher than in 2004-05 at
3.1%, or significantly different from the national value. Type 2 diabetes is by far the most common
type of diabetes mellitus at 4%, with the prevalence of type 1 diabetes being 0.5%.
Figure 102: Prevalence of self-reported diabetes mellitus by diabetes type*, Tasmania and Australia, 201112
Tas
Aust
4.0%
3.4%
0.5%
0.5%
Type 1 Diabetes
Type 2 Diabetes
Australian Health Survey First Results, 2011-12, cat. No. 4364.0;
* condition which has lasted or is expected to last for 6 months or more
Consistent with worldwide trends, the prevalence of self-reported diabetes mellitus in Tasmania has
increased since 1995 (p<0.01). Within Tasmania, the prevalence has more than doubled over this
period. However, a limitation of self-reported diabetes data is many people affected by diabetes are
unaware they have the condition. According to the Australian Diabetes, Obesity and Lifestyle Study
(AusDIAB) 2000 data, the prevalence of diabetes mellitus in the Tasmanian population was 8.75% in
2000.
39
Kasper, Dennis. Harrison’s Principles of Internal Medicine, 16th Edition. McGraw-Hill. 2005.
99
As only 4.6% of Tasmanians self-reported they had diabetes in 2011-12, this implies around half of
diabetics in Tasmania remain unaware that they have the condition. 40 Therefore, it is not possible to
interpret the self-reported prevalence as a positive change (i.e. due to improved detection of
diabetes by clinicians) or a negative change (i.e. due to the increasing prevalence of the condition).
Figure 103: Prevalence of self-reported diabetes mellitus*, Tasmania 1995-2011-12
4.6%
3.1%
1.8%
1995
3.5
2.3%
2001
2004/5
2007/8
2011/12
* Condition lasted/expected to last for 6 months or more ;Australian Health Survey First Results, 2011-12,
cat..no. 4364.0; National Health Survey Summary of Results Australia 2007-08, cat. no. 4362.0
National Health Survey Summary of Results Australia 2004-05, cat. no. 4364.0
National Health Survey 2001 cat. no. 4364.0 - Companion Data;
National Health Survey Summary of Results Australian States and Territories 1995, cat. no. 4368..0
In 2011, the incidence rate of diabetes mellitus was 4.9% for the Tasmanian population, rising to 14%
for Tasmanians aged 60 years and over. Males were generally more likely to be diagnosed with
diabetes than females (5.2% compared to 4.7%). Of the cases notified to the National Diabetes
Register, type 1diabetes made up less than 1%. While the rate of type 1 diabetes increases for
Tasmanians aged 60 years and over, type 2diabetes remains by far the dominant type.
Table 39: Diabetes incidence rate by gender and type, Tasmania 2011
Total Population
60 years and over
Female
%
95% CI
%
95% CI
Type 1
0.6%
[0.5%,0.6%]
0.9%
[0.8%,1%]
Type 2
3.9%
[3.8%,4%]
11.3%
[11%,11.6%]
4.7%
[4.6%,4.7%]
12.3%
[12%,12.6%]
Type 1
0.7%
[0.6%,0.7%]
1.2%
[1.1%,1.3%]
Type 2
4.5%
[4.4%,4.6%]
14.7%
[14.4%,15%]
5.2%
[5.1%,5.3%]
16.0%
[15.7%,16.3%]
Type 1
0.6%
[0.6%,0.6%]
1.1%
[1%,1.1%]
Type 2
4.2%
[4.2%,4.3%]
12.9%
[12.7%,13.1%]
Total Diabetes
4.9%
[4.9%,5%]
14.0%
[13.8%,14.2%]
Total Diabetes
Male
Total Diabetes
Persons
* Source: National Diabetes Register, Australia (unpublished data)
40
AIHW, Costs of Diabetes in Australia 2000-01, Bulletin, Issue 26, April 2005, p.1
100
The incidence of diabetes varies regionally within Tasmania. In 2011, the diabetes incidence rate in
the North West was statistically significantly higher than in the other two regions and Tasmania as a
whole, regardless of gender.
Table 40: Diabetes incidence rate, Tasmanian regions, 2011
Male
95% CI
Female
95% CI
Persons
95% CI
Southern region
5.0%
[4.9%,5.1%]
4.4%
[4.3%,4.5%]
4.7%
[4.6%,4.8%]
Northern region
5.0%
[4.8%,5.1%]
4.5%
[4.3%,4.6%]
4.7%
[4.6%,4.8%]
North West region
5.7%
[5.5%,5.9%]
5.2%
[5%,5.4%]
5.4%
[5.3%,5.6%]
Tasmania
5.2%
[5.1%,5.3%]
4.7%
[4.6%,4.7%]
4.9%
[4.9%,5%]
* National Diabetes Register, Australia (unpublished data)
It is imperative that diabetes be managed correctly, as untreated diabetes can result in lifethreatening complications and even death. A major Australian Government initiative to support
Australians with diabetes is the National Diabetes Services Scheme inaugurated in 1987. Under this
scheme, diabetics can access a range of subsidised Government approved products for the
management of diabetes. In 2012, 5.3% of the Tasmanian population registered with the NDSS,
identical to the rate of registration nationally.
People with diabetes, particularly those with complications, are likely to experience episodes of
hospitalisation. Indeed, hospital services account for the largest proportion of direct health care
expenditure on diabetes in Australia. 41
The age-standardised hospital separations rate for diabetes in Tasmania between 2007 and 2011 was
3.2 hospitalisations per 1 000 population (3.6 per 1 000 population for males and 2.8 per 1 000
population for females).
There is significant regional and gender variation in the age-standardised hospital separation rate for
diabetes in Tasmania, with a significantly higher rate reported for males than for females in the
Southern and Northern regions, and for Tasmania as a whole.
Rate per 1000 population
Figure 104: Age-standardised hospital separation rate for diabetes (ICD-10 E10-E14) by region, Tasmania
2007-11
4.5
4.0
3.5
3.0
2.5
2.0
1.5
1.0
0.5
0.0
South
North
North West
Tasmania
Males
3.7
3.6
3.4
3.6
Females
2.6
2.7
3.5
2.8
Notes: 1. Rates are age-standardised to the Australian 2001 population. 2. The error
bars represent the 95% confidence intervals of the rate.
Source: Statewide Morbidity Database., Tasmania.
41
AIHW, Cost of Diabetes in Australia 2000-01, Bulletin, Issue 26, April 2005, p.8
101
Hospital separation rates for diabetes in Tasmania increased between 2000 and 2009 by an average
of 6.2% a year for males and 6.1% a year for females. However in 2010 there was a substantial
decrease in the numbers, and rate of, hospitalisations due to diabetes was recorded nationally as a
result of a major change in the coding practices recording diabetes as a principal or an additional
diagnosis in the hospital data.
Figure 105: Age-standardised hospital separation rate for diabetes (ICD-10 E10-E14), Tasmania 2000-2011
Rate per 1000 population
6.0
5.0
4.0
3.0
2.0
1.0
0.0
Males
Females
2000 2001 2002 2003 2004 2005 2006 2007 2008 2009 2010 2011
2.7
2.7
3.7
3.6
3.6
3.8
4.4
4.5
4.9
4.5
2.6
1.9
2.0
2.5
2.7
3.1
2.7
2.5
3.2
3.1
3.3
4.3
2.1
1.3
Note: Rates are age-standardised to the Australian 2001 population.
Source: Statewide Morbidity Database, Tasmania.
The age-standardised mortality rate for diabetes between 2007 and 2010 in Tasmania was 28.5
deaths per 100 000 persons in males and 20 deaths per 100 000 persons in females annually. This
rate is significantly higher in males than females in the South and for Tasmania as a whole. The
Tasmanian age-standardised death rate for diabetes in 2010 was 24.7 deaths per 100 000 persons,
significantly higher than the Australian rate of 15.6 deaths per 100 000 persons.
Figure 106: Age-standardised mortality rate for diabetes (ICD-10 E10-E14) by region, Tasmania, 2007-10
Rate per 100,000 population
50.0
40.0
30.0
20.0
10.0
0.0
South
North
Males
26.6
30.4
North
West
29.9
Females
16.7
21.9
23.2
Tasmania
28.5
20.0
Notes: 1. Rates are age-standardised to the Australian 2001 population. 2. The error
bars represent the 95% confidence intervals of the rate. Source: AIHW.
102
In general, the age-standardised diabetes mortality rates showed an increasing trend between 1978
and 2010 for both males and females, increasing from 11.0 to 28.9 deaths per 100 000 persons in
males and from 14.1 to 20.5 deaths per 100 000 persons in females.
Rate per 100,000 population
Figure 107: Age-standardised mortality rate for diabetes (ICD-9 250, ICD-10 E10-E14), 1978-80 – 2008-10
40.0
30.0
20.0
10.0
0.0
1978-80 1981-83 1984-86 1987-89 1990-92 1993-95 1996-98 1999-01 2002-04 2005-07 2008-10
Males
11.0
14.6
19.0
16.9
14.6
22.4
19.1
21.0
32.6
31.1
28.9
Females
14.1
13.3
13.9
12.2
11.5
12.8
12.9
14.1
18.2
23.1
20.5
Notes: 1. Rates are age-standardised to the Australian 2001 population. 2. Average annual percentage change: for
males: 3.1% (P<0.01); for females: 1.9% (P<0.01).
Sources: ABS mortality database. ABS Cat. No. 3303.0_7.
103
Injury
Injury is defined as damage inflicted upon oneself or by an external agent, which may be either
accidental or intentional in nature. Injury can occur as a result of many types of environmental
exposures, including physical, chemical, mechanical, thermal or electrical forces. 42
Two major preventable causes of injury, transport injuries and accidental falls, will be considered in
detail below. Data on suicide and self-inflicted injury are discussed in the section on mental health.
Transport Injuries
Transport injuries are the second most common cause of injury deaths, after suicide and selfinflicted injury, and the third most common reason for hospitalised community injuries, after falls and
other unintentional injuries in Tasmania. The age-standardised hospitalisation rates for transport
injuries in Tasmania were 3.3 hospitalisations per 1 000 persons in males and 1.3 hospitalisations per
1 000 persons in females between 2007 and 2011. Rates for both males and females are similar
across all three regions.
Rate per 1000 population
Figure 108: Age-standardised hospital separation rate for transport injuries (ICD-10 V01-V99) by region,
Tasmania 2007-2011
4.0
3.5
3.0
2.5
2.0
1.5
1.0
0.5
0.0
South
North
North West
Tasmania
Males
3.3
3.2
3.5
3.3
Females
1.3
1.2
1.3
1.3
Notes: 1. Rates are age-standardised to the Australian 2001 population. 2. The error
bars represent the 95% confidence intervals of the rate.
Source: Statewide Morbidity Database, Tasmania.
The age-standardised hospitalisation rates for transport injuries vary significantly according to
gender. Males experienced significantly higher rates of transport-related hospitalisations than females
in 2000-11.
42
Kasper, Dennis. Harrison’s Principles of Internal Medicine, 16th Edition. McGraw-Hill. 2005.
104
Figure 109: Age-standardised hospital separation rate for transport injuries (ICD-10 V01-V99), Tasmania
2000-11
Rate per 1000 population
5.0
4.0
3.0
2.0
1.0
0.0
2000 2001 2002 2003 2004 2005 2006 2007 2008 2009 2010 2011
Males
2.9
3.1
3.4
2.9
3.2
3.6
4.0
3.7
3.9
3.3
2.8
2.6
Females
1.4
1.4
1.3
1.4
1.4
1.6
1.6
1.5
1.6
1.2
1.0
1.1
Notes: 1. Rates are age-standardised to the Australian 2001 population. 2. Average annual percentage
change:for males: -0.01% (P>0.05); for females: -1.7% (P<0.01).
Source:: Statewide Morbidity Database, Tasmania.
105
Between 2007 and 2010, transport injury mortality rates varied according to gender and region. The
mortality rate for transport injury was significantly higher in males than in females. Although there
were no statistically significant differences in mortality rates according to region, there was a trend
towards a higher transport injury-related mortality rate for both males and females in the North
West region.
Rate per 100,000 population
Figure 110: Age-standardised mortality rate for transport injuries (ICD-10 V01-V99) by region, Tasmania
2007-10
40.0
30.0
20.0
10.0
0.0
South
North
North West
Tasmania
Males
12.1
15.6
24.4
16.0
Females
3.1
3.9
5.6
4.0
Notes: 1. Rates are age-standardised to the Australian 2001 population. 2. The error
bars represent the 95% confidence intervals of the rate. Source: AIHW.
Between 1978 and 2010, there have been significant decreases in the age-standardised mortality
rates for transport injury in both males and females. The decrease was relatively greater in females
than in males. However, the male transport injury mortality rates remained around three to six
times the female rates between 1978 and 2010.
Figure 111: Age-standardised mortality rate for transport injuries (ICD-9 E800-E848, ICD-10 V01-V99),
Tasmania, 1978-80 – 2008-10
Rate per 100,000 population
50.0
40.0
30.0
20.0
10.0
0.0
1978-80 1981-83 1984-86 1987-89 1990-92 1993-95 1996-98 1999-01 2002-04 2005-07 2008-10
Males
43.5
36.0
31.8
26.8
29.7
20.0
13.5
18.7
17.7
16.9
15.6
Females
12.8
12.4
11.7
12.8
10.1
7.5
5.9
6.1
5.4
5.1
2.6
Notes: 1. Rates are age-standardised to the Australian 2001 population. 2. Average annual percentage change: for males: -3.6%
(P<0.01); for females: -4.3% (P<0.01).
Sources: ABS mortaity database. ABS Cat. No. 3303.0_7.
106
Land Transport and Farm Injuries
During the five-year period from 2007 to 2011, land transport-related hospitalisation accounted for
97% (n=5 311) of all transport injures in Tasmania. The rate of transport injuries was highest for car
occupants with an age-standardised rate of 70.8 hospitalisations per 100 000 population, followed by
motorcyclists and cyclists.
Table 41: Hospitalisations for transport injuries by mode of transport, Tasmania 2007-11
Mode of transport
Number of
hospitalisations
%
Rate per 100 000 *
Car occupant
1739
31.8
70.8
Motorcyclist
1455
26.6
62.7
Pedal cyclist
937
17.1
39.1
Pedestrian
353
6.5
14.1
Animal rider or occupant of animal-drawn vehicle
266
4.9
11.2
Occupant of special all-terrain or off-road vehicle
209
3.8
8.7
Water transport
140
2.6
5.6
Occupant of special agricultural vehicle
52
1.0
1.9
Other and unspecified
319
5.8
12.8
Total (all transport injuries)
5470
100.0
226.9
* Rates are age-standardised to the Australian 2001 population and expressed per 100 000 population
Statewide Morbidity Database, Tasmania
Injuries caused by all-terrain or off-road vehicles, especially quad bikes, are becoming an important
public health issue and account for the second leading cause of on-farm injury and death in Australia.
Over the eight-year period from 2000 to 2007, which is the latest available deaths unit record files,
there were a total of 11 deaths caused by quad bike injuries in Tasmania, representing an average of
1.4 deaths a year.
The age-standardised hospitalisation rates for quad bike injuries increased from 3.5 per 100 000
population in 2002-03 to 9.8 per 100 000 in 2008-09, followed by a decrease to 5.2 per 100 000
population in 2010-11.
Rate per 100,000 population
Figure 112: Age-standardised hospital separation rate for quad bike injuries (ICD-10-AM V86.2),
Tasmania 2002-11
12
10
8
6
4
2
0
Rate
2002-03
2004-05
2006-07
2008-09
2010-11
3.5
6
6.6
9.8
5.2
Note: 1. Rates are age-standardised to the Australian 2001 population
Statewide Morbidity Database, Tasmania
107
Agriculture is one of Tasmania’s leading industries but farming is often considered to be a dangerous
occupation with heightened risk of injury. Hospital separations data have been used to examine the
burden of agricultural related injuries admitted to Tasmania’s public and private hospitals for the tenyear period from 2002 to 2011.
Hospitalisations of farm-related injuries are cases where the principal diagnosis is injury and the
place of occurrence is on a farm. This includes farm buildings, cultivated land and farms devoted to
the raising of livestock. Farm houses are excluded, as are home garages, gardens or yards, and
private swimming pools or tennis courts.
There were 372 identified cases of farm-related injury hospitalisations for the five year period from
2007 to 2011 in Tasmania. As shown in the table below, hospitalised farm injuries were more
common among males (11.3 per 1 000) than females (7.7 per 1 000). The most common cause of
hospitalised farm injury in all persons (males and females combined) aged 15 years and over was
transportation, followed by other unintentional injuries; being bitten or struck by horses, cattle or
other mammals; and falls and accidents involving contact with agricultural machinery.
Table 42: Top five causes of hospitalised farm injury, 15 years and over, Tasmania 2007-11
Males
Females
Persons
Number
of cases
Crude
rate/ 1 000
Number
of cases
Crude
rate/ 1 000
Number
of cases
Crude
rate/ 1 000
Transportation
91
3.6
20
1.8
111
3.1
Other unintentional injuries*
63
2.5
14
1.3
77
2.1
Bitten or struck by horse, cattle or
other mammals
38
1.5
22
2.0
60
1.6
Falls
31
1.2
22
2.0
53
1.5
Contact with agricultural machinery
26
1.0
<5
0.1
27
0.7
Other and unspecified*
37
1.5
7
0.6
44
1.2
Total
286
11.3
85
7.7
372
10.2
Note: Rates are expressed per 1 000 agricultural population
Statewide Morbidity Database, Tasmania
* Include the following conditions:
striking against or struck by other objects
contact with lifting and transmission devices, not elsewhere classified
contact with other powered hand tools and household machinery
discharge from other and unspecified firearms
foreign body or object entering through skin
bitten or crushed by other reptiles
exposure to high and low air pressure and changes in air pressure
contact with venomous snake
overexertion and strenuous or repetitive movements
exposure to unspecified factor
sequelae of other and unspecified transport accidents.
108
As shown in the graph below, hospitalised farm injuries were more common among males than
females across all age groups, except in the 15-24 age group (18.5 per 1 000 males and 20.8 per
1 000 females). However, statistically significant differences between the hospitalisation rates for
males and females were only found in the 45-64 age group.
Rate per 1,000 agricultural population
Figure 113: Crude hospitalisation rates of farm-related injuries (all-cause) by age and sex, Tasmania 200711
25.0
20.0
15.0
10.0
5.0
0.0
15-24
25-44
45-64
65+
Males
18.5
7.7
11.6
14.0
Females
20.8
6.3
6.3
11.8
Statewide Morbidity Database, Tasmania
As shown below, crude hospitalisation rates of farm-related injuries (all-cause) increased from 6.5
per 1 000 agricultural population in 2002 to 13.7 per 1 000 agricultural population in 2006, then
decreased to 9.5 per 1 000 agricultural population in 2011.
Rate per 1,000 agricultural population
Figure 114: Crude hospitalisation rates of farm-related injuries (all-cause), Tasmania 2002-11
16.0
14.0
12.0
10.0
8.0
6.0
4.0
2.0
0.0
Persons
2002 2003 2004 2005 2006 2007 2008 2009 2010 2011
6.5
8.8
8.0
11.0 13.7 11.1 10.0 10.4 10.0
Statewide Morbidity Database, Tasmania
109
9.5
Accidental Falls
Accidental falls are the most common injury resulting in hospitalisations in Tasmania, and the third
most common cause of injury-related deaths, after suicide and self-inflicted injury, and transport
accidents. Most hospitalisations and deaths associated with accidental falls occur in persons aged 65
years and over.
Between 2007 and 2011, the age-standardised hospitalisation rates for accidental falls were 13.2
hospitalisations per 1 000 persons in males aged 65 years and over and 23.2 hospitalisations per
100 000 persons in females aged 65 years and over. Rates were significantly higher in females
compared with males. This is partly due to the more frequent occurrence of fractures associated
with falls in females, as females have higher rates of osteoporosis. The female prevalence of
osteoporosis – a condition of progressive loss of bone density and decrease in the strength of the
skeleton with a resultant risk of fracture, is about four times higher than for males aged 65 years and
over.
Both males and females in the Southern region were significantly more likely to be hospitalised as a
result of accidental falls than males and females in the North West region.
Figure 115: Age-standardised hospital separation rate for accidental falls (ICD-10 W00-W19) by region,
Tasmania 2007-11
Rate per 1000 population
30.0
25.0
20.0
15.0
10.0
5.0
0.0
South
North
North West
Tasmania
Males
14.3
13.1
11.2
13.2
Females
24.3
22.4
21.8
23.2
Notes: 1. Rates are age-standardised to the Australian 2001 population. 2. The error
bars represent the 95% confidence intervals of the rate.
Source: Statewide Morbidity Database., Tasmania.
Age-standardised hospitalisation rates for accidental falls in persons 65 years and over have
remained relatively stable in males and significantly increased in females between 2000 and 2011.
Figure 116: Age-standardised hospital separation rate for accidental falls ( ICD-10 W00-W19), age 65 years
and over, Tasmania, 2000-11
Rate per 1000 population
30
25
20
15
10
5
0
Males
2000
2001
2002
2003
2004
2005
2006
2007
2008
2009
2010
2011
11.5
11.9
13.5
13.2
13.3
13.2
13.8
12.7
15.3
14.6
11.7
12.5
Females 19.9
21.9
22.4
21.7
21.8
22.3
24.5
24.1
23.6
23.7
22.6
23.0
Notes: 1. Rates are age-standardised to the Australian 2001 population. 2. Average annual percentage change:
for males: 0.6% (P>0.05); for females: 1.0% (P<0.01).
Source:: Statewide Morbidity Database
110
There is no consistent regional or gender variation in the age-standardised mortality rates for
accidental falls across Tasmania.
Rate per 100,000 population
Figure 117: Age-standardised mortality rate for accidental falls (ICD-10 W00-W19), age 65 years and over
by region, Tasmania, 2007-10
70.0
60.0
50.0
40.0
30.0
20.0
10.0
0.0
South
North
North West
Tasmania
Males
48.1
38.6
28.9
40.9
Females
34.1
40.1
26.7
34.2
Notes: 1. Rates are age-standardised to the Australian 2001 population. 2. The error
bars represent the 95% confidence intervals of the rate. Source:: AIHW.
There has been a downward trend in the age-standardised mortality rates for accidental falls in
persons aged 65 years and over between 1978 and 2007. In spite of higher hospitalisation rates for
accidental falls in females, mortality rates for falls in males and females are not statistically different.
Figure 118: Age-standardised mortality rate for accidental falls (ICD-9 E880-E888, ICD-10 W00-W19), age
65 years and over, Tasmania, 1978-80-2005-07
Rate per 100,000 population
90
80
70
60
50
40
30
20
10
0
1978-80 1981-83 1984-86 1987-89 1990-92 1993-95 1996-98 1999-01 2002-04 2005-07
Males
58.9
72.6
55.6
58.1
61
40.3
60.4
32.6
42.1
32.9
Females
72.7
62.6
65.1
67.3
80.6
52.2
47.1
28.6
44.1
45.6
Notes: 1. Rates are age-standardised to the Australian 2001 population. 2. Average annual percentage change:
for males: -2.4% (P<0.01); for females: -2.3% (P<0.01). Sources: ABS mortality database. ABS Cat. No.
3303.0_7.
111
Mental Health
Mental health problems are a group of health conditions that include a wide range of behavioural and
psychological conditions. The most commonly diagnosed mental health problems are anxiety and
depression. The high prevalence of mental health problems, combined with the significant disability
associated with them, results in a substantial disease burden. It is estimated that mental health
problems caused about one eighth of the total Australian disease burden in 2003, exceeded only by
cancer and cardiovascular disease. 43
Based on prevalence data derived from the 1997 National Mental Health Survey, it was estimated
that in 2003, mental health disorders resulted in the loss of 350 000 years of healthy life (DALYs)
among the Australian population, just over 13% of the total due to all causes 44. Of this total, 93%
were years of healthy life lost due to disability, while only 7% were years lost because of premature
death. The burden was almost equally divided between males and females (52.7% compared to
47.3%). Per-capita, there were almost twice as many DALYs due to mental disorders among those
aged 15-24 years than for any other age group.
The National Health Survey, run under the umbrella of the Australian Health Survey in 2011-12,
collects data on self-reported long term conditions, including mental health disorders. A long term
condition is defined in this survey as one lasting, or expected to last, six months or longer, and has
been diagnosed by a doctor.
Prevalence
In 2011-12, the proportion of Tasmanian adults estimated to have been diagnosed with mental and
behavioural problems at some time in the past (15%) was higher than for any other jurisdiction, and
Australia as a whole, except the Australian Capital Territory (15.5%). The differences generally were
not, however, statistically significant, except the Northern Territory where only 10.6% of adults
were estimated to have been diagnosed with one or more mental and behavioural problems.
Age-standardising to the 2001 Australian population, which adjusts for differential jurisdictional age
distributions, did not alter these conclusions. The Tasmanian age-standardised prevalence for mental
and behavioural problems barely altered from the crude value at 14.8%.
Figure 119: Prevalence of diagnosed mental and behavioural problems by jurisdiction, 2011-12
13.1%
NSW
14.4%
14.8%
12.7%
Vic
15.0%
15.5%
14.0%
13.6%
10.6%
QLD
SA
WA
Tas
NT
ACT
Aust
Australian Health Survey First Results, 2011-12, cat. No. 4364.0
Begg S, et al. The burden of disease and injury in Australia 2003. Australian Centre for Burden of Disease and CostEffectiveness, 2007
44 Ibid.
43
112
The prevalence of mental and behavioural problems generally increases with age. In 2011-12, 10.6%
of Tasmanians aged 24 years and under had been diagnosed with a mental or behavioural problem,
compared with 17.6% of Tasmanians aged 65 years and over. The difference in these prevalence
rates was, however, not statistically significant. Further, while these data exhibit a positive age trend,
this trend was not statistically significant.
Figure 120: Prevalence of mental and behavioural problems by age, Tasmania, 2011-12
17.6%
17.6%
16.2%
15.0%
10.6%
0–24
25–44
45–64
65+
Tasmania
Australian Health Survey First Results, 2011-12, cat. No. 4364.0
The National Health Survey also collects data on the prevalence of high/very high levels of
psychological distress. This is a composite measure based on individual responses to a 10-item scale
called the Kessler 10 (K10). These responses are then aggregated and grouped into a psychological
distress scale. High and very high levels of psychological distress represent the highest levels of this
scale.
Despite a relatively high prevalence of mental and behavioural problems in Tasmania, the proportion
of Tasmanian adults who reported to have experienced high to very high levels of psychological
distress in the four weeks before interview (8.9% ) was lower than for the other jurisdictions and
Australia as a whole. These differences were not statistically significant.
Figure 121: Prevalence of high/very high psychological distress by jurisdiction, 18 years and over, Tasmania
2011-12
10.5%
11.4%
10.7%
11.3%
10.6%
8.9%
NSW
Vic
QLD
SA
WA
Tas
9.0%
NT
9.2%
ACT
10.8%
Aust
Australian Health Survey First Results, 2011-12, cat. No. 4364.0
It is important to note psychological distress is often transient, and related to more than just
underlying chronic health conditions. Consequently, the ranking of a jurisdiction according to the
prevalence of high/very high levels of psychological distress cannot be directly related to the
jurisdictional ranking on the prevalence of mental and behavioural problems.
113
There was little variation in psychological distress levels by age for Tasmanians. High levels of
psychological distress ranged from a low of 7.3% for those aged 45-54 years to 11.1% of Tasmanians
aged 25-34 years. None of these differences were statistically significant.
Figure 122: Prevalence of high/very high psychological distress by age group, 18 years and over, Tasmania
2011-12
11.1%
9.2%
9.9%
8.9%
7.3%
18-24
25-34
35-44
45-54
55-64
8.0%
65+
8.9%
Tasmania
ABS, Australian Health Survey First Results, 2011-12, cat. No. 4364.0
Mortality
Suicide is a complex issue, with suicide deaths often resulting from an accumulation of risk factors
that includes mental health problems, but also drug and alcohol abuse, family issues, unemployment,
cultural identity, law enforcement and criminal justice issues, low educational attainment and
poverty.
The age-standardised mortality rates for suicides in Tasmania were 22.2 deaths per 100 000 for
males and 6.8 deaths per 100 000 persons for females from 2007-2010. Rates for males were
statistically significantly higher than for females. Rates for males and females were higher than
Tasmania in the North, but these differences were not significant.
Rate per 100,000 population
Figure 123: Age-standardised mortality rates for suicide (ICD-10 X60-X84) by region, Tasmania 2007-10
40.0
30.0
20.0
10.0
0.0
South
North
Males
21.1
25.4
North
West
19.9
Females
7.7
7.1
4.6
Tasmania
22.2
6.8
Notes: 1. Rates are age-standardised to the Australian 2001 population. 2. The error
bars represent the 95% confidence intervals of the rate. Source: AIHW.
114
Suicide and self-inflicted injury were registered as the underlying cause of death for 64 persons in
Tasmania in 2010. The Tasmanian age-standardised mortality rate for deaths due to suicide in 2010
was 13.1 deaths per 100 000 persons, higher than the Australian rate of 10.5 deaths per 100 000
persons. Between 1978 and 2010, the age-standardised mortality rates for suicide appeared relatively
stable in both sexes.
Figure 124: Age-standardised mortality rate for suicide (ICD-9 E950-E959, ICD-10 X60-X84), Tasmania,
1978-2011
Rate per 100,000 population
30.0
25.0
20.0
15.0
10.0
5.0
0.0
1978-80 1981-83 1984-86 1987-89 1990-92 1993-95 1996-98 1999-01 2002-04 2005-07 2008-10
Males
18.7
25.9
24.1
25.1
28.4
26.3
21.5
23.9
26.1
21.4
23.5
Females
6.7
6.9
6.1
5.9
5.9
5.7
4.3
4.7
6.8
7.9
7.1
Notes: 1. Rates are age-standardised to the Australian 2001 population. 2. Average annual percentage change: for males: 0.0% (P>0.05); for females: 0.2% (P>0.05).
Sources: ABS mortality database. ABS Cat. No. 3303.0_7.
115
Asthma
Asthma is a common chronic condition affecting people of all ages. It is characterised by reversible
narrowing of the airways in the lungs resulting in symptoms including wheezing, coughing, tightness
of the chest, breathing difficulty and shortness of breath. 45
Asthma prevalence estimates from the National Health Survey are based on participants’ self-reports
of having been diagnosed with asthma by a doctor. In 2011-12, 11.6% (about 58 100) of Tasmanians
reported being diagnosed with asthma.
The graph below shows Tasmania had a higher proportion of people with asthma (11.6%) than
Australia as a whole (10.2%), but the difference was not statistically significant. This was contrary to
2004, when the Tasmanian self-reported asthma rate was statically significantly higher than for
Australia as a whole (13.2% compared to 10.2%).
Figure 125: Prevalence of self-reported current asthma*, Tasmania and Australia, 2011-12
Tas
11.6%
Aust
10.2%
Asthma
Australian Health Survey First Results, 2011-12, cat. No. 4364.0;
* condition which has lasted or is expected to last for 6 months or more
Between 1995 and 2011-12 the prevalence of self-reported asthma in Tasmania increased by 1.3%, a
difference that was not statistically significant and was almost exactly the same in magnitude as the,
again not statistically significant, fall from 2004 when the asthma prevalence was 13.2%.
Figure 126: Prevalence of self-reported current asthma*, Tasmania, 1995-2011-12
11.6%
13.2%
11.8%
10.3%
1995
2001
2004/5
2007/8
11.6%
2011/12
* Condition lasted/expected to last for 6 months ior more ;Australian Health Survey First
Results, 2011-12, cat..no. 4364.0; National Health Survey Summary of Results Australia 200708, cat. no. 4362.0
National Health Survey Summary of Results Australia 2004-05, cat. no. 4364.0
45
Kasper, Dennis. Harrison’s Principles of Internal Medicine, 16th Edition. McGraw-Hill. 2005.
116
There was regional variation in asthma hospitalisation rates in Tasmanian males between 2007 and
2011. The lowest hospitalisation rates were in the Southern region and the highest rates in the
North for males. In the Southern region, females had higher asthma hospitalisation rates than males.
For females, there were no significant regional differences in hospitalisation rates for asthma in
Tasmania between 2007 and 2011.
Figure 127: Age-standardised hospital separation rate for asthma (ICD-10 J45-J46) by region, Tasmania,
2007-11
Rate per 1000 population
1.8
1.6
1.4
1.2
1.0
0.8
0.6
0.4
0.2
0.0
South
North
North West
Tasmania
Males
0.9
1.5
1.2
1.2
Females
1.3
1.1
1.2
1.2
Notes: 1. Rates are age-standardised to the Australian 2001 population. 2. The error
bars represent the 95% confidence intervals of the rate.
Source: Statewide Morbidity Database., Tasmania.
Asthma hospitalisation rates in Tasmania have continued to decrease since 2007. This may be in part
due to better outpatient management of the condition. The use of asthma management plans has
increased in this time. In 2007, the AIHW reported the national proportion of those with asthma
issued with a written asthma action plan grew from 17% in 2001 to 23% in 2004-05. 46
Figure 128: Age-standardised hospital separation rate for asthma (ICD-10 J45-J46) by sex, Tasmania, 200011
Rate per 1000 population
1.8
1.6
1.4
1.2
1.0
0.8
0.6
0.4
0.2
0.0
Males
Females
2000 2001 2002 2003 2004 2005 2006 2007 2008 2009 2010 2011
1.0
1.3
1.1
0.9
0.7
1.2
1.3
1.5
1.2
1.1
1.0
1.0
1.3
1.4
1.3
1.2
0.9
1.3
1.2
1.6
1.4
1.2
1.0
0.9
Notes: 1. Rates are age-standardised to the Australian 2001 population. 2. Average annual percentage change:for
males: 0.3% (P=0.47); for females: -1.7% (P<0.01).
Source:: Statewide Morbidity Database, Tasmania.
46
AIHW, Australian Centre for Asthma Monitoring 2008. Asthma in Australia 2008.
117
Arthritis and Musculoskeletal Conditions
Arthritis and musculoskeletal conditions are defined as conditions of the bones, muscles and their
attachments, and include joint problems such as arthritis. Although there are more than 100
musculoskeletal conditions, the most common are osteoarthritis, rheumatoid arthritis, gout,
osteoporosis, and back pain. Arthritis is characterised by inflammation of the joints, often resulting in
pain, stiffness, disability and deformity.
The two most common types of arthritis are osteoarthritis and rheumatoid arthritis. Osteoarthritis
is a degenerative joint condition predominantly affecting the weight-bearing joints such as the hips,
knees and ankles as well as the hands and spine. Rheumatoid arthritis is an auto-immune disease
causing chronic inflammation of the joints and often leading to deformity. Osteoporosis is a
condition of progressive loss of bone density and a reduction in the strength of the skeleton with a
risk of fracture. 47
The development of arthritis and other musculoskeletal conditions has many causes including genetic
and environmental conditions. Several risk factors may be involved in the development of arthritis
and other musculoskeletal conditions. Levels of (high intensity) physical activity, hormonal factors
and obesity potentially contribute to osteoarthritis, with hormonal factors and smoking thought to
contribute to rheumatoid arthritis and alcohol consumption and diet held to contribute to gout. 48
In 2007, the total cost of arthritis (excluding other musculoskeletal conditions) to the Australian
economy was estimated as $23.9 billion. Access Economics calculated the total cost of arthritis for
each jurisdiction based on prevalence share across Australia. For Tasmania, the total cost of arthritis
was estimated as $597.1 million for 2007. 49
Arthritis and musculoskeletal conditions are highly prevalent. In 2011-12 in Tasmania, arthritis and
musculoskeletal conditions affected 31.7% of the population, a figure that was statistically significantly
lower than in 2004 (36.1%).
In Tasmania, 95 800 people (19.2%) reported being diagnosed with arthritis, and 19 600 (3.9%)
reported the diagnosis of osteoporosis in 2011-12. However, as both of these conditions are underdiagnosed, the true prevalence of each is likely to be greater.
The prevalence of musculoskeletal conditions is statistically significantly higher in Tasmania (31.7%)
than for Australia as a whole (27.7%). This is most likely because the prevalence of musculoskeletal
conditions as a whole increases with age and Tasmania has an older population than Australia as a
whole.
Figure 129: Musculoskeletal conditions(a)(b) prevalence, Tasmania and Australia, 2011-12
31.7%
27.7%
Tas
Aust
Musculoskeletal conditions
Australian Health Survey First Results, 2011-12, cat. No. 4364.0;
(a) Crude rates provided - age standardised rates for 2011/12 currently not available
Kasper, Dennis, Harrison’s Principles of Internal Medicine, 16th Edition, McGraw-Hill. 2005.
Access Economics, Painful Realities: the economic impact of arthritis in Australia in 2007, 2007
49 Ibid., p.57
47
48
118
There has been a slight, but not statistically significant, increase in the prevalence of musculoskeletal
conditions in Tasmanians between 1995 and 2011-12. Since 2007-08, the prevalence has fallen from
35% to 31.7%, reversing exactly half of the increase observed over the period 1995 to 2007-08. The
decrease since 2007-08 was, however, not statistically significant.
Figure 130: Musculoskeletal conditions prevalence, crude rates, Tasmania 1995-2011-12
35.5%
35%
36.1%
28.4%
1995
31.7%
2001
2004/5
2007/8
2011/12
* Condition lasted/expected to last for six months ior more
Australian Health Survey First Results, 2011-12, cat..no. 4364.0; 4368..0
NHS survey data 1995-2007/8
In males, hospitalisation rates were highest in the North of the state. However, in females
hospitalisation rates were highest in the Southern region.
Figure 131: Age-standardised hospital separation rate for arthritis and musculoskeletal conditions (ICD-10
M05-M06, M15-M19, M80-M82) by region, Tasmania, 2007-11
Rate per 1000 population
7.0
6.0
5.0
4.0
3.0
2.0
1.0
0.0
South
North
North West
Tasmania
Males
4.5
5.2
4.7
4.7
Females
6.4
6.1
4.8
6.0
Notes: 1. Rates are age-standardised to the Australian 2001 population. 2. The error
bars represent the 95% confidence intervals of the rate.
Source: Statewide Morbidity Database., Tasmania.
The graph below shows between 2000 and 2011, there were between 2 114 and 3 926
hospitalisations for arthritis and musculoskeletal conditions in Tasmania each year. Age-standardised
hospitalisation rates for arthritis and musculoskeletal conditions in Tasmania have increased in both
males and females since 2000. High hospital separation rates observed in 2010 and 2011 may be due
to increased admissions for joint replacement surgery.
119
Figure 132: Age-standardised hospital separation rate for arthritis and musculoskeletal conditions (ICD-10
M05-M06, M15-M19, M80-M82), Tasmania, 2000-11
Rate per 1000 population
8.0
6.0
4.0
2.0
0.0
2000
2001
2002
2003
2004
2005
2006
2007
2008
2009
2010
2011
Males
3.5
3.3
3.8
3.6
3.3
3.9
4.0
4.0
3.9
4.9
5.2
5.6
Females
5.0
5.3
5.3
5.2
4.5
5.0
4.9
5.0
5.1
5.9
6.6
7.2
Notes: 1. Rates are age-standardised to the Australian 2001 population. 2. Average annual percentage change:for
males: 4.6% (P<0.01); for females: 2.7% (P<0.01).
Source:: Statewide Morbidity Database, Tasmania.
Rheumatoid Arthritis
Rheumatoid arthritis is an auto-immune disease causing chronic inflammation of the joints and often
leading to deformity. According to international studies, the prevalence of rheumatoid arthritis is
between 0.3% and 2.1% of the population. Females are affected about three times more often than
males. About 80% of all patients develop the disease between the age of 35 and 50 years.
Hospitalisation rates were significantly higher in the South of the state. The reasons for this are
largely unknown. The presence of more widely available specialist rheumatology services in the
South of the state compared with the North and North West may be a contributing factor.
Figure 133: Age-standardised hospital separation rate for rheumatoid arthritis (ICD-10 M05-M06) by
region, Tasmania, 2007-11
Rate per 1000 population
1.4
1.2
1.0
0.8
0.6
0.4
0.2
0.0
South
North
North West
Tasmania
Males
0.6
0.4
0.2
0.4
Females
1.2
0.7
0.3
0.9
Notes: 1. Rates are age-standardised to the Australian 2001 population. 2. The error
bars represent the 95% confidence intervals of the rate.
Source: Statewide Morbidity Database., Tasmania.
120
Between 2000 and 2011 the age-standardised hospitalisation rates for rheumatoid arthritis fluctuated
widely in Tasmania and have increased since 2009 for both males and females.
Figure 134: Age-standardised hospital separation rate for rheumatoid arthritis (ICD-10M05-M06),
Tasmania, 2000-11
Rate per 1000 population
2
1.6
1.2
0.8
0.4
0
2000
2001
2002
2003
2004
2005
2006
2007
2008
2009
2010
2011
Males
0.3
0.3
0.5
0.4
0.4
0.3
0.3
0.2
0.3
0.3
0.5
0.8
Females
0.7
0.6
1.0
1.0
0.8
0.4
0.4
0.4
0.5
0.7
0.9
1.8
Notes: 1. Rates are age-standardised to the Australian 2001 population. 2. Average annual percentage change:for
males: 4.7% (P<0.01); for females: 4.4% (P<0.01).
Source:: Statewide Morbidity Database, Tasmania.
Osteoarthritis
Osteoarthritis is a degenerative joint condition affecting the weight-bearing joints such as the hips,
knees and ankles as well as the hands and spine. Osteoarthritis is the most common joint disease of
humans. Among older adults, knee osteoarthritis is the leading cause of chronic disability in
developed countries. Age is the most significant risk factor for osteoarthritis with the prevalence
increasing rapidly from about 2% of people aged under 45 years to 68% of people aged over 65
years. 50
In both males and females, hospitalisation rates over the period 2007-11 were highest in the North
and the North-West.
Rate per 1000 population
Figure 135: Age-standardised hospital separation rate for osteoarthritis (ICD-10 M15-M19) by region,
Tasmania, 2007-11
6.0
5.0
4.0
3.0
2.0
1.0
0.0
South
North
North West
Tasmania
Males
3.7
4.6
4.3
4.1
Females
4.4
4.6
4.4
4.4
Notes: 1. Rates are age-standardised to the Australian 2001 population. 2. The error
bars represent the 95% confidence intervals of the rate.
Source: Statewide Morbidity Database., Tasmania.
50
Kasper, Dennis, Harrison’s Principles of Internal Medicine, 16th Edition, McGraw-Hill, 2005
121
Between 2000 and 2011, the age-standardised hospitalisation rate for osteoarthritis was between 2.3
and 4.6 hospitalisations per 1 000 persons in males and between 2.1 and 5.0 hospitalisations per
100 000 persons in females.
Figure 136: Age-standardised hospital separation rate for osteoarthritis (ICD-10 M15-M19), Tasmania,
2000-11
Rate per 1000 population
6
5
4
3
2
1
0
2000
2001
2002
2003
2004
2005
2006
2007
2008
2009
2010
Males
2.4
2.3
2.8
2.8
2.7
3.3
3.4
3.6
3.4
4.3
4.6
2011
4.6
Females
2.1
2.5
2.8
3.1
2.6
3.6
3.7
3.8
3.9
4.6
5.0
4.8
Notes: 1. Rates are age-standardised to the Australian 2001 population. 2. Average annual percentage change:for
males: 6.7% (P<0.01); for females: 7.5% (P<0.01).
Source:: Statewide Morbidity Database, Tasmania.
Osteoporosis
Osteoporosis is a condition of progressive loss of bone density and a reduction in the strength of
the skeleton, with a resultant risk of fracture.
In both males and females, hospitalisation rates were highest in the South of the state. This is in part
due to the higher risk of fracture associated with osteoporosis for people living in urban compared
with rural settings.
Figure 137: Age-standardised hospital separation rate for Osteoporosis (ICD-10 M80-M82) by region,
Tasmania, 2007-11
Rate per 1000 population
1.0
0.8
0.6
0.4
0.2
0.0
South
North
North West
Males
0.2
0.2
0.1
Tasmania
0.2
Females
0.8
0.7
0.2
0.7
Notes: 1. Rates are age-standardised to the Australian 2001 population. 2. The error
bars represent the 95% confidence intervals of the rate.
Source: Statewide Morbidity Database., Tasmania.
122
Between 2000 and 2011, the age-standardised hospitalisation rates for osteoporosis were between
0.2 and 0.8 hospitalisations per 1 000 persons a year in males and between 0.6 and 2.3
hospitalisations per 1 000 persons a year in females.
Figure 138: Age-standardised hospital separation rate for osteoporosis (ICD-10 M80-M82), Tasmania, 200011
Rate per 1000 population
2.5
2.0
1.5
1.0
0.5
0.0
2000
2001
2002
2003
2004
2005
2006
2007
2008
2009
2010
2011
Males
0.8
0.6
0.5
0.4
0.3
0.2
0.3
0.2
0.2
0.2
0.2
0.2
Females
2.1
2.3
1.5
1.1
1.2
1.0
0.8
0.7
0.7
0.7
0.7
0.6
Notes: 1. Rates are age-standardised to the Australian 2001 population. 2. Average annual percentage change:for
males: -13.4% (P<0.01); for females: -12.2% (P<0.01).
Source:: Statewide Morbidity Database, Tasmania.
123
Chronic Kidney Disease
Although not a national health priority area, chronic kidney disease (CKD) is a significant public
health problem associated with the national health priority areas of diabetes mellitus and
cardiovascular disease. In Australia, the major causes of CKD are glomerulonephritis (inflammation
within the filter units of the kidney) and diabetes. The prevalence of both of these conditions is
increasing.
The major risk factors for CKD overall include hypertension, diabetes mellitus, hyperlipidaemia,
smoking and obesity. Early detection and management of CKD improves outcomes for those
affected and reduces the health care system costs of managing CKD.
Tasmanian chronic kidney disease data are collected by the Renal Impairment Database (RID)
project. The RID project is a retrospective database collection of all results of serum creatinine
tested by Hobart Pathology (and associated laboratories) between 1993 and 2006 and captures
between 20 and 25% of the Tasmanian population in any one year. According to the results of this
study, there are a significant number of people with severely reduced CKD undiagnosed and/or
untreated.
End-stage kidney disease (ESKD) is the complete or almost complete failure of the kidneys to
remove waste and excess water from the body. ESKD is almost always the outcome of years of
chronic kidney disease. Dialysis or kidney transplantation are the only treatments for this condition.
Incidence rates for treated ESKD, derived from the Australia and New Zealand Dialysis and
Transplant (ANZDATA) Registry, have grown from 4.8 per 100 000 population in 1989 to 10.1 per
100 000 people in 2009. The bulk of the increase is in people with diabetic nephropathy and kidney
disease related to hypertension and renovascular disease. 51 Rates are higher for males, Indigenous
people, and older populations. It should be noted that not everyone with ESKD had treatment and
that these people are omitted in the ANZDATA. 52
The graph below shows Tasmania’s rate of treated ESKD of 9.4 per 100 000 population to be slightly
below the Australian rate of 10.1 per 100 000 in 2009.
Figure 139: Age-standardised incidence rate of treated ESKD per 100 000 population* by jurisdiction, 2009
49.3
9.5
9.4
10.8
10.3
10.4
9.4
NSW/ACT
Vic
Qld
WA
SA
Tas
10.1
NT
Aus
AIHW, Projections of the incidence of treated end-stage kidney disease in Australia, 2010-2020,
Table 1.1 *Age-standardised to the 2001 Australian population
The incidence rate of treated ESKD is projected to be 19 per 100 000 population in 2020. According
to the AIHW, this increase is expected to be mainly in patients 70 years and over, with the
proportion of ESKD with diabetes as a co-morbidity also increasing over this time. Diabetes has
been one of the most common causes of treated ESKD and is expected to contribute considerably
to the increase in ESKD.
51
52
ANZDATA Registry 2007 Report, http://www.anzdata.org.au/v1/updates_incidence.html
AIHW, Projections of the incidence of treated end-stage kidney disease in Australia, 2010-2020, 2011
124
Nationally, about 45% of new cases of treated ESKD in 2009 had diabetes as a co-morbidity and this
proportion is expected to rise to 64% in 2020. 53
For Tasmania, crude rates for treated ESKD have increased over time from 4.8 per 100 000
population in 1989 to 10.5 in 2009. Rates are expected to increase to 19 per 100 000 people by
2020.
Figure 140: Crude incidence rates and projections of treated ESKD per 100 000 population, Tasmania 1989
- 2020
19
16
13
11.2
9.1
4.8
6
6.4
7.2
8.3
9
17
14
10.5
7.8
5.9
1989 1991 1993 1995 1997 1999 2001 2003 2005 2007 2009 2012 2014 2016 2018 2020
AIHW, Projections of the incidence of treated end-stage kidney disease in Australia, 2010-2020, Table 1.13 and
53
IBID., p.12
125
Communicable Diseases
Prompt notification of infectious diseases is an integral component of responsive public health action.
This section of the report details the results of the communicable disease surveillance and
investigations conducted by the Communicable Diseases Prevention Unit, Department of Health and
Human Services, in collaboration with health professionals throughout Tasmania, regional public
health officers, local government environmental health officers, Tasmanian public and private
pathology laboratories, the Melbourne Diagnostic Unit and the Victorian Infectious Diseases
Reference Laboratory.
In accordance with the Public Health Act (1997) the Director of Public Health may require any person
or class of person, agency or public authority to notify the Director of the presence or occurrence
of any notifiable disease. Notifiable communicable diseases in Tasmania are listed in the Appendix,
Table 77.
The data presented below generally relate to the reporting period 2007– 011. Between 2007 and
2011 there were notifications received for 21 156 confirmed or probable cases of notifiable
infectious disease in Tasmania. The top 10 notifiable infectious diseases in Tasmania between 2007
and 2011 were as follows:
Figure 141: Top ten notified infectious diseases in Tasmania, 2007-11
Chlamydia
37.1%
Campylobacteriosis
16.2%
Influenza
12.1%
Pertussis
6.8%
Hepatitis C-Unspecified
6.0%
Salmonellosis
Varicella zoster infection
Giardia
4.8%
3.4%
2.6%
Varicella Infection
(unspecified)
1.5%
Cryptosporidiosis
1.3%
0.0%
10.0%
20.0%
30.0%
40.0%
Notes 1. Include Tasmanian residents only. 2. Unspecified menas duration of infection unknown. 3.
There were 21,156 notified cases for the years 2007-11 (average annual 843 notified cases per
100,000); Tas Notifiable Diseases Surveillance Database.
126
Sexually Transmissible Infections
Notifications due to sexually transmissible infections accounted for about 38% of all disease
notifications in Tasmania between 2007 and 2011. Notifiable sexually transmissible infections include
chlamydia, gonorrhoea, syphilis, lymphogranuloma venereum, chancroid and donovanosis
(Granuloma inguinale). Hepatitis B and HIV, also sexually transmissible infections, are described in
the blood borne viruses section. There have been no notifications for donovanosis or chancroid
between 2007 and 2011. A number of common sexually transmissible infections, including genital
herpes and human papillomavirus, are not notifiable diseases; therefore, there are no notifications
data available to inform trends in these infections.
Chlamydia Infection
Between 2007 and 2011 the annual number of disease notifications due to chlamydia infection has
increased from 1 121 to 1 760 cases. Disease notifications due to chlamydia infection accounted for
37.1% of all communicable disease notifications between 2007 and 2011, and 96.9% of all sexually
transmissible infection disease notifications in the same period.
Cases of chlamydia infection are more commonly notified for females than for males, as females are
more likely to be opportunistically screened when presenting to primary health care providers. The
lowest notification rates were recorded in males in the North-West region and females in the
Northern region.
Rate per 100,000 population
Figure 142: Notification rate for chlamydia, Tasmania, 2007-11
500
400
300
200
100
0
South
North
North West
Tasmania
Males
235.9
218.4
195.7
221.9
Females
410.8
389.7
391.3
400.6
Note:s 1. The error bars represent the 95% confidence intervals of the rate.
2. Tas. Notifiable Diseases Surveillance Database.
The notification rate for chlamydia in Tasmania has risen significantly during the last 15 years,
following the national trend, with rates increasing from 51.3 per 100 000 population in 1997 to 349.5
per 100 000 people in 2011. During the five year period 2007 to 2011, the male rate of disease
notification due to chlamydia infection increased significantly (p < 0.01). The average annual
percentage change in the rate was 11.9%. For females the rate of disease notification due to
chlamydia (genital infection) also increased significantly (p < 0.01). The average annual percentage
change in the rate was 11.6%.
Tasmania’s notification rate for chlamydia has been consistently lower than the Australian
notification rate since 1997 except for the years 2008-10 as shown in the graph below.
127
Figure 143: Notification rate for chlamydia, Tasmania and Australia, 1997-2011
Rate per 100,000 population
400.0
300.0
200.0
100.0
0.0
1997 1998 1999 2000 2001 2002 2003 2004 2005 2006 2007 2008 2009 2010 2011
Tasmania 51.3 42.2 53.5 68.7 78.4 99.8 126.9 128.0 178.9 213.9 228.9 297.2 290.5 395.6 349.5
Australia 82.4
95.8
74.3
88.4 104.5 124.0 152.8 179.7 202.5 229.2 246.7 271.8 285.6 332.4 361.6
National Notifiable Diseases Surveillance System.
Average annual percentage change: 17.1% for Tasmania (P<0.01); 12.3% for Australia (P<0.01).
Chlamydia occurs more frequently among females than males, and the age group most affected is the
15 to 24-year-olds.
Figure 144: Notification rate for chlamydia by age and sex, Tasmania, 2007-11
Rate per 100,000 population
3000
2500
2000
1500
1000
500
0
0-4
5-9
9.5
0.0
Females 13.9
0.0
Males
10-14 15-19 20-24 25-29 30-34 35-39 40-44 45-49 50-54 55-59 60-64
7.0
845.1 1360.1 674.6 270.5 110.3
104.2 2818.3 2236.7 768.1 275.9
89.6
65+
59.1
30.7
30.5
13.2
11.7
5.2
42.8
14.7
11.0
8.2
7.7
0.0
Tas. Notifiable Diseases Surveillance Database.
Gonococcal Infection
Disease notifications due to gonorrhoea accounted for 1.5% of all sexually transmissible infections
notified in Tasmania between 2007 and 2011. There have been between 15 and 31 notifications a
year in males and between two and five notifications a year in females. The age group most affected
by gonorrhoea is 15 to 24 year old persons.
Table 43: Number of disease notification due to gonorrhoea by sex, Tasmania 2007-11
Males
Females
Total
101
19
120
128
Syphilis
Disease notifications due to syphilis accounted for 1.6% of all sexually transmissible infections
notified in Tasmania between 2007 and 2011. There have been between 15 and 27 notifications a
year in males and between four and nine notifications a year in females.
Table 44: Number of disease notification due to syphilis by sex, Tasmania 2007-11
Males
Females
Total
96
33
129
The age group most affected by syphilis are 25 to 44 year-old persons. Syphilis notifications occur
more commonly in homosexually active males than in non-homosexually active males. There has
been a national increase in syphilis notifications since 2002, predominantly in males who have sex
with males.
Some of the syphilis notifications in Tasmania in recent years have resulted from screening migrants
to Tasmania from high risk overseas countries. In these people, syphilis infection is likely to have
been longstanding, and is usually detected through routine screening; as it is then treated on
detection it is not considered of public health significance to the wider community.
Blood Borne Viruses
Notifications due to blood borne viruses accounted for about 8% of all disease notifications in
Tasmania between 2007 and 2011. Notifiable blood borne viruses include HIV, hepatitis B, hepatitis
C and hepatitis D infection. Most notifications in this group are for hepatitis C infection.
Human Immunodeficiency Virus (HIV)
There have been 104 notifications of HIV in Tasmania between 2000 and 2012. Within Tasmania,
rates of HIV diagnoses were stable between 2001 and 2007 with fewer than 10 notifications a year.
From 2008 there have been 11 to 14 notifications a year.
There were 84 notifications in males and 20 notifications in females.
About two-thirds of all notifications of HIV occur in males who have sex with males.
Of the notifications in males, 63 were in males born in Australia (75% of all male notifications), 11
notifications were in males born in high prevalence countries and 10 were in males born in low
prevalence countries.
In comparison, there were eight notifications in females born in Australia (40% of all female
notifications), 10 notifications were in females born in high prevalence countries and two were in
females born in low prevalence countries.
The interpretation of these data is problematic as people born in Australia may have acquired HIV
while overseas and people born overseas may have acquired HIV in Australia.
Hepatitis B
When a hepatitis B notification is known to be the result of a recent infection it is classified as an
incident case. All other cases are regarded as unspecified hepatitis B. For Tasmania, disease
notifications due to hepatitis B (unspecified) accounted for 1.2% of all disease notifications between
2007 and 2011. The age group most affected by hepatitis B (unspecified) is 25 to 44-year-olds.
Notification rates for hepatitis B unspecified are higher for males than females in the South and
North West regions and much higher in the South of the state compared with other areas of the
state.
129
Rate per100,000 population
Figure 145: Notification rate for hepatitis B unspecified, Tasmania, 2007-11
25
20
15
10
5
0
South
North
North West
Tasmania
Males
17.8
7.2
4.3
11.8
Females
12.3
7.6
3.6
9.0
Note:s 1. The error bars represent the 95% confidence intervals of the rate.
2. Tas. Notifiable Diseases Surveillance Database.
130
As shown in the graph below, Tasmania’s notification rate for hepatitis B (unspecified) has been
consistently and significantly below the national rate since 1997.
Figure 146: Notification rate for hepatitis B-unspecified, Tasmania and Australia, 1997-2011
Rate per 100,000 population
45.0
40.0
35.0
30.0
25.0
20.0
15.0
10.0
5.0
0.0
1997 1998 1999 2000 2001 2002 2003 2004 2005 2006 2007 2008 2009 2010 2011
Tasmania 4.6
5.9
5.7
8.1
4.2
7.2
14.9 12.4 10.7
9.4
7.3
11.8 15.1 10.0
8.3
Australia 40.3 34.7 35.2 39.5 38.1 33.3 28.9 28.3 30.6 30.0 32.4 30.2 32.0 31.4 29.8
National Notifiable Diseases Surveillance System.
Average annual percentage change: 4.9% for Tasmania (P<0.01); -1.8% for Australia (P<0.01).
Hepatitis C
When a hepatitis notification is known to be the result of a recent infection it is classified as an
incident case, all other cases are regarded as unspecified. For Tasmania, disease notifications due to
hepatitis C (unspecified) accounted for 6.0% of all disease notifications between 2007 and 2011.
The South had the highest notification rate of all regions. Notification rates for males in the North
and North West regions are significantly below the Tasmanian rate. The age group most affected by
hepatitis C (unspecified) are 25 to 44-year-olds, with more males than females acquiring this
infection. Nationally, 80% of hepatitis C infections are associated with injecting drug use.
Rate per 100,000 population
Figure 147: Notification rate for hepatitis C-unspecified, Tasmania, 2007-11
100
90
80
70
60
50
40
30
20
10
0
South
North
North West
Tasmania
Males
84.2
48.2
48.3
66.0
Females
39.5
27.5
38.0
35.8
Note:s 1. The error bars represent the 95% confidence intervals of the rate.
2. Tas. Notifiable Diseases Surveillance Database.
131
Except for 2003, 2008 and 2009, Tasmania’s notification rate for hepatitis C (unspecified) has been
lower than the national rate. However, the gap between the Tasmanian and Australian rate has
steadily closed over the last few years as a result of falling hepatitis C notification rates nationally.
Figure 148: Notification rate for hepatitis C-unspecified, Tasmania and Australia, 1999-2011
Rate per 100,000 population
120.0
100.0
80.0
60.0
40.0
20.0
0.0
1997 1998 1999 2000 2001 2002 2003 2004 2005 2006 2007 2008 2009 2010 2011
Tasmania 41.2 54.0 59.4 63.2 67.0 67.7 72.2 59.0 43.8 52.9 51.5 65.7 51.7 47.3 40.0
Australia 107.4 93.3 101.5 97.8 90.3 76.5 66.5 61.2 58.2 57.1 56.0 51.4 49.6 49.4 44.7
National Notifiable Diseases Surveillance System.
Average annual percentage change: 4.9% for Tasmania (P<0.01); -1.8% for Australia (P<0.01).
Enteric Diseases
Notifications of enteric diseases account for about 26% of all disease notifications. Notifiable enteric
diseases include, but are not limited to, infections due to species of cholera, campylobacter,
salmonella, shigella, giardia, cryptosporidium, listeria, hepatitis A and E, typhoid, paratyphoid and
yersinia. The most frequent of these are discussed below.
Campylobacteriosis
For Tasmania, disease notifications of campylobacter were 16.2% of all communicable disease
notifications between 2007 and 2011. The age group most affected by campylobacter are 45 to 64year-olds. More notifications of campylobacter were received for males than females during 20072011. The South had the highest notification rate for this period, with the lowest rate of notifications
from the North West of the state.
Figure 149: Notification Rate for campylobacteriosis, Tasmania, 2007-11
Rate per 100,000 population
200.0
160.0
120.0
80.0
40.0
0.0
South
North
North West
Tasmania
Males
150.0
155.1
120.0
144.7
Females
140.9
125.2
102.6
128.0
Note:s 1. The error bars represent the 95% confidence intervals of the rate.
2. Tas. Notifiable Diseases Surveillance Database.
132
The notification rate for campylobacteriosis has increased since 1997 and for the last three years has
been consistently above a rate of 100 per 100 000 persons. Since 2000, Tasmania’s notification rate
for campylobacteriosis has frequently been higher than the national rate, except for 2008.
Figure 150: Notification rate for campylobacteriosis, Tasmania and Australia, 1997-2011
Rate per 100,000 population
200.0
160.0
120.0
80.0
40.0
0.0
1997 1998 1999 2000 2001 2002 2003 2004 2005 2006 2007 2008 2009 2010 2011
Tasmania 70.5 75.0 87.4 109.0 143.5 128.0 131.9 126.8 156.7 122.3 144.6 97.4 124.6 143.0 169.2
Australia 95.8 102.3 98.9 108.0 125.6 113.0 116.2 116.2 121.0 111.1 119.9 107.3 73.2 76.0 79.3
Tas. Notifiable Diseases Surveillance Database; National Notifiable Diseases Surveillance System.
Average annual percentage change: 3.7% for Tasmania (P<0.01); -1.9% for Australia (P<0.01).
Salmonellosis
Notifications of salmonella accounted for 4.8% of all disease notifications between 2007 and 2011.
The notification rate for salmonellosis was the highest in the North of the state from 2007 to 2011,
although this was not statistically significant. The age group most commonly notified with salmonella
was 45 to 64-year-olds.
Figure 151: Notification rate for salmonellosis, Tasmania, 2007-11
Rate per 100,000 population
60.0
50.0
40.0
30.0
20.0
10.0
0.0
South
North
North West
Tasmania
Males
39.7
42.4
33.9
39.2
Females
40.7
44.6
39.8
41.6
Notes: 1. The error bars represent the 95% confidence intervals of the rate.
2. Tas. Notifiable Diseases Surveillance Database.
Salmonella notifications have increased since 1997, with a particular increase occurring in 2005 due
to a number of significant outbreaks of salmonella infection. The average annual percentage increase
has been 3.7% in Tasmania (p<0.01) and 2.6% for Australia as a whole in that period (p<0.01), but
Tasmania’s rates are currently lower than Australia’s rates.
133
Figure 152: Notification rate for salmonellosis, Tasmania and Australia, 1997-2011
Rate per 100,000 population
70.0
60.0
50.0
40.0
30.0
20.0
10.0
0.0
1997 1998 1999 2000 2001 2002 2003 2004 2005 2006 2007 2008 2009 2010 2011
Tasmania 23.0 24.8 31.8 27.8 34.5 35.1 30.8 24.9 62.1 39.0 45.6 41.4 33.0 46.5 38.2
Australia 38.0 40.2 37.0 32.3 36.3 40.0 35.2 38.9 41.2 39.8 45.1 38.7 43.4 53.4 54.9
National Notifiable Diseases Surveillance System.
Average annual percentage change: 3.7% for Tasmania (P<0.01); 2.6% for Australia (P<0.01).
Giardiasis
Giardiasis is a form of gastroenteritis caused by the giardia lamblia parasite. For Tasmania, disease
notifications of giardiasis accounted for 2.6% of all disease notifications between 2007 and 2011. The
North West had the lowest notification rate for giardiasis between 2007 and 2011. The notification
rate for females was particularly high in the South. The age group most notified is 25 to 44-year-olds.
Figure 153: Notification rate for giardiasis, Tasmania, 2007-11
Rate per 100,000 population
35.0
30.0
25.0
20.0
15.0
10.0
5.0
0.0
South
North
North West
Tasmania
Males
24.2
25.8
12.6
22.1
Females
24.6
23.8
14.9
22.3
Notes: 1. The error bars represent the 95% confidence intervals of the rate.
2. Tas. Notifiable Diseases Surveillance Database.
134
The notification rate for giardiasis has been relatively constant between 1997 and 2007. Giardiasis is
not a notifiable disease in all states and territories, so comparative jurisdictional and Australian rates
are unavailable.
Figure 154: Notification rate for giardiasis, Tasmania, 1997-2011
Rate per 100,000 population
30.0
25.0
20.0
15.0
10.0
5.0
0.0
1997 1998 1999 2000 2001 2002 2003 2004 2005 2006 2007 2008 2009 2010 2011
Tasmania 19.0 16.7 16.4 13.2 15.5 12.5 15.9 15.6 16.1 16.9 19.9 23.7 20.9 25.2 21.1
National Notifiable Diseases Surveillance System.
Average annual percentage change: 3.1% for Tasmania (P<0.01).
Cryptosporidiosis
Cryptosporidiosis is a type of gastroenteritis caused by the parasite cryptosporidium parvum. In
Tasmania, disease notifications of cryptosporidiosis accounted for 1.3% of all notifications between
2007 and 2011.
The North had the highest notification rates for cryptosporidiosis from 2007 to 2011, with the
lowest rate in the South.
Rate per 100,000 population
Figure 155: Notification rate for cryptosporidiosis, Tasmania, 2007-11
35.0
30.0
25.0
20.0
15.0
10.0
5.0
0.0
South
North
North West
Tasmania
Males
3.6
20.1
14.1
10.6
Females
3.5
24.4
14.6
11.8
Notes: 1. The error bars represent the 95% confidence intervals of the rate.
2. Tas. Notifiable Diseases Surveillance Database.
135
The Tasmanian notification rate for cryptosporidiosis has been below the Australian rate between
2002 and 2009.
Figure 156: Notification rate for cryptosporidiosis, Tasmania and Australia, 2001-11
Rate per 100,000 population
25.0
20.0
15.0
10.0
5.0
0.0
2001
2002
2003
2004
2005
2006
2007
2008
2009
2010
2011
Tasmania
16.5
9.7
5.4
3.7
4.5
5.7
7.5
7.2
13.3
19.7
8.1
Australia
8.4
16.6
6.1
8.3
15.8
15.5
13.3
9.3
21.1
6.6
8.1
National Notifiable Diseases Surveillance System.
Average annual percentage change: 3.4% for Tasmania (P<0.01); 0.05% for Australia (P=0.8).
Vaccine Preventable Diseases
Notifications of vaccine preventable diseases accounted for about 25.3% of all disease notifications in
Tasmania between 2007 and 2011. Notifiable vaccine preventable diseases include measles, mumps,
rubella, diphtheria, tetanus, pertussis, Haemophilus influenzae type B, influenza, meningococcal
infection, invasive pneumococcal disease and poliomyelitis. Hepatitis B, also a vaccine preventable
disease, is described in the blood borne viruses section.
Tasmania has consistently high immunisation coverage rates for childhood immunisations across
target age groups. As a consequence, relatively few notifications for diseases covered by childhood
immunisations are recorded in Tasmania and there were no notifications for diphtheria or
poliomyelitis, and only one notification for tetanus in Tasmania between 2007 and 2011.
Table 45: Australian childhood immunisation register - % of children* fully immunised
Age
12-<15 months
24-<27 months
60-<63 months
Tasmania
92.8%
93.4%
91.1%
Australia
91.8%
92.6%
89.9%
*Age group calculated as at 30 September 2011
Varicella infection was made a notifiable disease in 2006. Laboratory confirmed cases of varicella
infection (chickenpox and shingles) are notified to public health. A national varicella vaccination
program started in November 2005 for children at 18 months of age. A catch-up program for
children aged 13 years was also begun. No cases of varicella notified since 2006 have had a history of
varicella vaccination.
Haemophilus influenzae type B infection is notified on laboratory confirmation of diagnosis. The last
paediatric case notified was in 2008.
136
Pertussis (Whooping Cough)
Disease notifications in Tasmania of pertussis accounted for 6.8% of all disease notifications between
2007 and 2011. Notifications were higher for females than males. The highest notification rate for
pertussis came from the Southern region. Between 2007 and 2011, pertussis has been notified in all
age groups.
Figure 157: Notification rate for pertussis, Tasmania, 2007-11
80.0
Rate per 100,000 population
70.0
60.0
50.0
40.0
30.0
20.0
10.0
0.0
South
North
North West
Tasmania
Males
61.0
51.0
32.4
51.8
Females
69.2
61.6
46.2
62.0
Notes: 1. The error bars represent the 95% confidence intervals of the rate.
2. Tas. Notifiable Diseases Surveillance Database.
Large outbreaks of pertussis have occurred in 1999, 2009 and again in 2012 (see graph below).
There have been no pertussis deaths in infants since 2002 but some infants have needed
hospitalisation for significant illness.
Rate per 100,000 population
Figure 158: Notification rate for pertussis, Tasmania and Australia, 1997-2011
200.0
150.0
100.0
50.0
0.0
1997 1998 1999 2000 2001 2002 2003 2004 2005 2006 2007 2008 2009 2010 2011
Tasmania 23.6 11.7 134.7 30.3 22.0 7.8 27.8 7.7
6.8
8.4
5.1 40.0 123.0 55.4 67.4
Australia 66.1
30.3
23.0
31.3
49.1
28.3
25.6
43.5
54.7
47.2
23.1
66.5 135.6 155.8 172.7
National Notifiable Diseases Surveillance System.
Average annual percentage change: 4.9% for Tasmania (P<0.01); 14.7% for Australia (P<0.01).
Measles
There was only one notification due to measles between 2007 and 2011 in Tasmania. An outbreak of
measles occurred nationally in mid-2006 affecting 11 Tasmanians. The outbreak originated within an
organisation where measles vaccine coverage was lower than in the general community. The index
case was a visitor to the community from India. As a result of the outbreak within this organisation,
measles subsequently spread into the wider Tasmanian community, affecting unvaccinated people.
137
Mumps and Rubella
Disease notifications of mumps were 0.04% of all disease notifications between 2007 and 2011. The
average number of mumps related disease notifications in the state was only two persons a year
between 2007 and 2011 inclusive.
There was no case of rubella notified between 2007 and 2011 in Tasmania.
Pneumococcal Disease (Invasive)
Invasive pneumococcal disease is an important cause of death in infants, the elderly and the immune
compromised. In Tasmania, disease notifications due to pneumococcal infection (invasive) accounted
for 0.9% of all disease notifications between 2007 and 2011. The age group most affected by
pneumococcal infection (invasive) are people aged 65 years and over.
Between 2007 and 2011, the male notification rate continued to be slightly higher than the female
rate. The notification rates for both males and females in the Southern region were lower than for
the other two regions.
Figure 159: Notification rate for pneumococcal disease (invasive), Tasmania, 2007-11
Rate per 100,000 population
16
14
12
10
8
6
4
2
0
South
North
North West
Tasmania
Males
6.1
10.9
10.4
8.4
Females
5.5
9.2
9.9
7.5
Notes: 1. The error bars represent the 95% confidence intervals of the rate.
2. Tas. Notifiable Diseases Surveillance Database.
Invasive pneumococcal disease became a nationally notifiable disease in 2001. Tasmanian notification
rates for invasive pneumococcal disease from 2001 to 2011 are comparable to the Australian rates.
Tasmania’s rate has declined since 2001.
Figure 160: Notification rate for pneumococcal disease (invasive), Tasmania and Australia, 2001-11
Rate per 100,000 population
14.0
12.0
10.0
8.0
6.0
4.0
2.0
0.0
2001
2002
2003
2004
2005
2006
2007
2008
2009
2010
2011
Tasmania
13.1
13.3
10.9
11.6
9.3
8.4
6.3
7.8
7.7
9.1
9.3
Australia
9.1
12.3
11.2
11.7
8.3
7.0
7.0
7.6
7.1
7.3
8.4
National Notifiable Diseases Surveillance System.
Average annual percentage change: -5.1% for Tasmania (P<0.01); -4.5% for Australia (P<0.0).
138
Meningococcal Infection
Disease notifications of meningococcal infection accounted for 0.1% of all notifications between 2007
and 2011 in Tasmania. There were between one and 10 notifications a year for meningococcal
infection in this time. Meningococcal infection was more commonly notified in females than in males
between 2007 and 2011 in Tasmania. The age group most affected are 0 to four-year-olds. The
recent increase in cases has predominantly been caused by Group B meningococcal infections, which
are not prevented by vaccination.
Figure 161: Meningococcal case notifications, Tasmania, 2001-11
30
26
25
Number of cases
20
20
18
15
10
10
10
5
5
6
5
1
3
0
2002 2003 2004 2005 2006 2007 2008 2009 2010 2011
Tas. Notifiable Diseases Surveillance Database
An increase in notifications of meningococcal infection was seen in 2002 to 2003 because of a hyper
endemic state of invasive group C serogroup meningococcal disease in Tasmania. Increased disease
activity was across the state; however, a disproportionate number of cases were in Southern
Tasmania. In response to the increased disease activity, the Tasmanian Government funded a
polysaccharide meningococcal vaccination program. This was superseded by a national conjugate
meningococcal vaccination program that started in January 2003. As a result, notifications for group
C meningococcal disease have decreased significantly.
Vector Borne Diseases
Notifiable vector borne diseases are most commonly those infections transmitted by mosquitoes.
Notifications due to vector borne diseases account for approximately 1.1% of all disease
notifications in Tasmania between 2007 and 2011. Notifiable vector borne diseases include
arboviruses (Ross River virus, Barmah Forest virus, Dengue, Japanese encephalitis, Murray Valley
encephalitis, Kunjin virus), malaria, viral haemorrhagic fever and yellow fever. There have been no
notifications for Japanese encephalitis, Murray Valley encephalitis, Kunjin virus, viral haemorrhagic
fever or yellow fever in that period. There were eight notifications for Barmah Forest Virus in
Tasmania between 2007 and 2011.
Ross River Virus
Ross River virus is a viral disease transmitted by some species of mosquitoes occurring in Tasmania.
In Tasmania, disease notifications due to Ross River virus accounted for 0.7% of all disease
notifications between 2007 and 2011.
The Northern region had the highest notification rate for the Ross River virus due to increased
mosquito activity in the climate of the Northern coast of Tasmania.
139
Figure 162: Notification rate for Ross River virus infection, Tasmania, 2007-11
Rate per 100,000 population
20
18
16
14
12
10
8
6
4
2
0
South
North
North West
Tasmania
Males
4.6
12.0
2.2
6.1
Females
5.4
12.9
0.7
6.4
Notes: 1. The error bars represent the 95% confidence intervals of the rate.
2. Tas. Notifiable Diseases Surveillance Database.
The age group most affected by Ross River Virus infection is 45 to 64-year-olds. Tasmania’s
notification rate for the Ross River virus infection has been consistently lower than the national
notification rate since 1997, except for 2002, with an average annual percentage change of -0.6%.
Ross River virus notifications increase periodically due to increased activity of the mosquito vector.
Increases in notifications were observed in 1999, 2002 and 2008. In years where there was no
increased activity, the average number of Ross River virus-related disease notifications in the state
was less than 10 persons per year.
Rate per 100,000 population
Figure 163: Notification rate for Ross River virus infection, Tasmania and Australia, 1997-2011
40.0
35.0
30.0
25.0
20.0
15.0
10.0
5.0
0.0
1997 1998 1999 2000 2001 2002 2003 2004 2005 2006 2007 2008 2009 2010 2011
Tasmania 2.5 1.9 14.2 1.7 2.8 24.7 0.8 4.1 1.0 2.9 1.4 15.5 5.8 7.7 1.2
Australia 35.6 16.9 23.1 22.1 16.6
7.4
19.3 20.9 12.4 26.7 19.8 26.3 21.8 23.0 23.1
National Notifiable Diseases Surveillance System.
Average annual percentage change: -0.6% for Tasmania (P=0.6); 0.2% for Australia (P<0.05).
Malaria
Tasmanian disease notifications of malaria accounted for 0.2% of all disease notifications between
2007 and 2011. Since 2000, the number of disease notifications due to malaria has been increasing
because of increased detection of Plasmodium falciparum malaria due to increased screening of
migrants to Tasmania from high risk overseas countries in recent years. The age group most
commonly notified with malaria in Tasmania is five to 14-year-olds. As the vectors for malaria
transmission are not endemic in Tasmania this does not pose a public health risk to the wider
community.
140
Zoonoses
Zoonoses are infectious diseases acquired from animals. Notifications due to zoonotic diseases
account for approximately 0.2% of all disease notifications. Many zoonotic diseases are also
gastrointestinal infections (e.g. campylobacter) or vector-borne diseases (e.g. rickettsial infections).
Notifiable zoonotic diseases not discussed above include Q fever, anthrax, brucellosis, hydatid
infection, leptospirosis, lyssavirus, psittacosis, plague, rabies, tularaemia and typhus. There have been
no notifications of anthrax, lyssavirus, plague, or rabies between 2007 and 2011. There have been
two notifications for leptospirosis between 2007 and 2011. All cases of leptospirosis were acquired
within Tasmania.
Two cases of tularaemia (type B) were notified in 2011 following possum bites in an area on the
West coast of Tasmania. These cases were extensively investigated and at this stage appear to have
been unusual sporadic cases.
Other Communicable Diseases
Other notifiable infectious diseases include tuberculosis, legionellosis, typhoid, non TB mycobacteria,
rickettsial infection, taeniasis, vancomycin-resistant enterococcus and vibrio infection. For the state,
disease notifications due to other notifiable diseases accounted for 0.8% of all disease notifications
between 2007 and 2011.
Tuberculosis
Disease notifications of tuberculosis accounted for 0.2% of all disease notifications between 2007
and 2011. Between five and 15 cases a year are notified in Tasmania in that period. Tuberculosis is
more commonly notified in males. The age group most affected by tuberculosis are 25 to 44-yearolds. The total number of tuberculosis notifications fluctuates over time.
Table 46: Number of disease notifications due to tuberculosis by Sex, 2007-11
Males
Females
Total
33
16
49
Legionellosis
Disease notifications of legionellosis (N=17) accounted for 0.1% of all disease notifications between
2007 and 2011. The average number of legionellosis related disease notifications in the state was
three people a year between 2007 and 2011 inclusive. The age group most affected by legionellosis is
those aged 65 years and over), with males more commonly notified.
141
Risk and Protective Factors
Health risk factors are health characteristics associated with an increased risk of developing a
particular disease or condition. In this section, the major preventable behavioural risk factors for
disease are discussed. These are smoking, inadequate physical activity, poor diet and nutrition,
excess alcohol intake and overweight and obesity.
Smoking
Tobacco smoking is the leading cause of preventable disease and death in Australia. Tobacco was
responsible for 7.8% of the total burden of disease in Australia in 2003, with lung cancer, chronic
obstructive pulmonary disease and ischaemic heart disease accounting for more than three-quarters
of this disease burden. 54 While the relationships between smoking and diseases such as chronic
obstructive pulmonary disease, lung cancer, and cardiovascular disease have long been established,
many other diseases are now thought to be associated with smoking. These include cancers of the
stomach, bladder, cervix, uterus, oesophagus, mouth, larynx, pancreas and kidney; leukaemia;
respiratory effects in utero and infancy, childhood, adolescence and adulthood; foetal death and
stillbirths; fertility problems; low birth weight; pregnancy complications; cataract; hip fractures and
low bone density; peptic ulcers in people with Helicobacter pylori; and periodontitis. 55
Exposure to environmental tobacco smoke (passive smoking) is a significant cause of preventable
mortality and morbidity in Tasmania. Passive smoking is linked to lung, nasal and sinus cancer;
cerebrovascular accident and ischaemic heart disease; lower respiratory infections; onset and
worsening of asthma, middle ear disease, reduced birth weight and sudden infant death syndrome. 56
Tasmania has traditionally had a higher rate of tobacco smoking than most of the other jurisdictions,
except for the Northern Territory, and Australia as a whole. This has remained the case for 201112, with all jurisdictions except the Northern Territory reporting statistically significantly lower daily
adult smoking rates than Tasmania.
Figure 164: Daily smokers 18 years and over by Jurisdiction, 2011-12
23.9%
21.8%
14.6%
NSW
16.7%
17.4%
16.6%
17.0%
16.3%
13.4%
Vic
Qld
SA
WA
Tas
NT
ACT
Australia
ABS, Australian Health Survey First Results, 2011-12, cat. No. 4364.0
54 Begg S, Vos T, Goss J, Barker B, Stevenson C, Stanley L, Lopez A. The burden of disease and injury in Australia.
Australian Centre for Burden of Disease and Cost-Effectiveness. 2006
55 United States Department of Health and Human Services. The Health Consequences of Smoking: A report of the
Surgeon General. Atlanta: CDC, 2004
56 Department of Health and Ageing and the National Drug Strategy. Environmental Tobacco Smoke in Australia.
Canberra: Commonwealth Department of Health and Ageing, 2002
142
Daily and occasional smokers combined (current smokers) show the same trend as daily smokers,
with Tasmanian rates being the second highest in Australia at 23.2%, well above the national level of
18.1%, a statistically significant difference.
Figure 165: Current smokers* 18 years and over by jurisdiction, 2011-12
25.0%
23.2%
16.4%
18.7%
19.0%
18.5%
18.9%
15.0%
NSW
Vic
Qld
SA
WA
Tas
NT
18.1%
ACT
Aus
* Daily and occasional smokers combined;
ABS, Australian Health Survey First Results, 2011-12, cat. No. 4364.0
Since 2001, the Tasmanian adult current (daily and occasional) smoking rate has declined by 1.1%,
but this decrease is not statistically significant.
Figure 166: Current smokers* 18 years and over, Tasmania, 2001-2011-12
24.3%
2001
25.4%
24.9%
2004/5
2007/8
23.2%
2011/12
* Daily and occasional smokers; Australian Health Survey First Results, 2011-12, cat. No. 4364.0
Tasmanians are less likely to smoke as they age, a statistically significant trend, and similar to the
pattern at the national level. In 2011-12, over 30% of young Tasmanians aged 18-24 years were
current tobacco smokers, compared to about 7% of Tasmanians aged 65 years and over. It is worth
noting the tobacco smoking rate among young Tasmanians aged 18-24 has fallen since 2007-08, when
37.3% were tobacco smokers; this decrease, however, is not statistically significant.
143
Figure 167: Current smokers* by age, Tasmania and Australia, 2011-12
Tasmania
34.6%
Australia
29.5%
30.6%
24.5%
27.6%
25.1%
23.1%
23.0% 19.9%
16.8%
6.8% 7.6%
18-24
25-34
35-44
45-54
55-64
65+
Australian Health Survey First Results, 2011-12, cat. No. 4364.0: * Includes daily and occasional smokers
The rate of tobacco smoking among young Australians aged 18-24 years has steadily decreased since
2004 to about two-thirds of the 2004 rate. In Tasmania, the smoking rate for this age-group
increased between 2004 and 2007-08, before decreasing to its current level of 30.6%, almost 3%
lower than seven years ago.
Table 47: Current smokers*, 18-24 years, Tasmania and Australia, 2004-2007-08
Tasmania
Australia
Year
%
95%CI**
%
95%CI**
2011-12
30.6%
19.4%
41.8%
19.5%
16.6%
22.4%
2007-08
37.3%
27.2%
47.8%
23.1%
20.3%
26.0%
2004
33.5%
25.5%
41.5%
30.0%
29.8%
30.2%
ABS, Australian Health Survey First Results, 2011-12, cat. No. 4364.0; ABS National Health Survey 2004/5 & 2007/08, State Tables, cat. no.
4362.0
* Includes daily and occasional smokers
Traditionally, more males than females smoke. This remains the case for 2011-12 with 28% of
Tasmanian males aged 18 years and over estimated to be current smokers compared with 18.6% of
Tasmanian females. This differential was particularly pronounced in the 25-34 year and 35-44 year
age groups, with over 40% of Tasmanian males in each of these age groups (45.8% and 40.1%,
respectively) estimated to be current smokers compared to less than 24% of female smokers (23.9%
and 19.6%, respectively).
The gender discrepancy was also apparent at the national level, but not to the same extent.
Nationally, around 25% of males aged 25-44 (26.7% aged 25-34 and 24.1% aged 35-44) were
estimated to be current smokers, compared to less than 22% of females (21.1% aged 25-34 and
16.8% aged 35-44).
144
Table 48: Current smokers by specific age groups and gender, Tasmania and Australia 2011-12
18 Years and over
25-34
35-44
Tasmania
Australia
Tasmania
Australia
Tasmania
Australia
Males
28.0%
20.3%
45.8%
26.7%
40.1%
24.1%
Females
18.6%
16.0%
23.9%
21.1%
19.6%
16.8%
* Includes daily and occasional smokers; ABS, Australian Health Survey First Results, 2011-12, cat. No. 4364.0
145
Smoking rates for secondary students aged 12-15 years have declined from 22% in 1984 to 6% in
2011 and rates for students aged 16-17 years fell from 31% in 1984 to 16% in 2011, both statistically
significant. Students aged 16-17 years were significantly more likely to have smoked than were 12 to
15-year-olds. No gender differences were observed in either age group.
Figure 168: Proportion of secondary school students who are current smokers*, Tasmania 1984-2011
40%
Percent
30%
20%
10%
0%
1984 1987 1990 1993 1996 1999 2002 2005 2008 2011
12-15 Years 22% 21% 17% 21% 24% 21% 15% 11% 5% 6%
16-17 Years 31% 26% 27% 34% 29% 30% 24% 14% 17% 16%
* Smoked within 7 days preceding the survey; Cancer Council, Australian Secondary Students'
Alcohol and Drug Survey (ASSAD), 1984-2011 Tasmanian sample size in 2011 was 1,779 students
Smoking during pregnancy remains a significant health problem in Tasmania. Overall, 23% of all
Tasmanian pregnant females in 2010 reported they had smoked while pregnant, almost 5% lower
than in 2005 (statistically significant), reflecting a gradual decline in the proportion of females who
report maternal smoking.
Of all pregnant public patients in 2010, 30.5% reported they had smoked. In contrast, 5.4% of private
patients pregnant in 2010 reported they had smoked while pregnant. However, these rates are
statistically significantly lower than the corresponding rates from five years earlier in 2005, when
35.7% and 8.3% of public and private patients, respectively, reported smoking while pregnant, an
overall average of 24.6%.
The considerably higher rate of maternal smoking for public patients, when compared to private
patients, reflects to a degree the different demographic profiles of these two groups of patients.
Pregnant females accessing public hospital services are likely to be younger and of lower socioeconomic status than those accessing private hospital services. Both of these factors are associated
with an increased risk of smoking.
Figure 169: Self-reported smoking status during pregnancy for public and private patients, Tasmania, 2010
Did not smoke
93.5%
Smoked
68.9%
30.5%
5.4%
Public patients
Private patients
Council of Obstetric & Paediatric Mortality and Morbidity, Annual Report 2010
146
Alcohol
Excess alcohol consumption is associated with a variety of short term adverse health consequences,
including road injuries, suicide and violence, as well as long term adverse health consequences, such
like liver cirrhosis, mental health problems, pancreatitis, foetal growth retardation and several types
of cancer. In 2003, alcohol-related harm was responsible for 3.2% of Australia’s burden of disease. 57
The National Health Survey quantifies alcohol consumption levels associated with short and long
term harm using alcohol guidelines issued by the National Health Medical Research Council
(NHMRC). The 2001 NHMRC guidelines for harmful alcohol consumption were modified in 2009
guidelines.
In 2011-12 the National Health Survey was run under the umbrella of the Australian Health Survey,
where alcohol-related harm was defined based on the 2009 guidelines for the first time. Under the
2009 guidelines, adults, regardless of gender, are at risk of long-term harm if consuming more than
two standard drinks a day on average, and are at risk of short-term alcohol related harm if
consuming more than four standard drinks on a single occasion. Changes in the guidelines are
documented in the table below.
Table 49: NHMRC Alcohol Guidelines 2001 and 2009
2001 NHMRC Guidelines
Males
Females
Long term risk
>4 daily
>2 daily
Short term risk
>6 single occasion
>4 single occasion
2009 NHMRC Guidelines
Males
Females
Lifetime risk
>2 daily
>2 daily
Single occasion risk
>4 single occasion
>4 single occasion
NHMRC, Australian guidelines to reduce health risks from drinking alcohol, 2009
Lifetime Risk
In 2011-12, using the 2009 guidelines, the proportion of Tasmanian adults at risk of long term
alcohol related harm (22.7%) was higher than for Australia as a whole (19.5%), but the difference
was not statistically significant. The Tasmanian figure was statistically higher than New South Wales
(18.5%), Victoria (17.6%) and South Australia (18.1%).
Figure 170: Alcohol consumption exceeding lifetime risk 2009 guidelines, 18 years and over, Tasmania and
Australia, 2011-12
NHMRC 2009 Guidelines
18.5%
NSW
20.2%
17.6%
Vic
QLD
25.4%
22.7%
24.7%
21.0%
18.1%
SA
WA
Tas
NT
ABS, Australian Health Survey First Results, 2011-12, cat. No. 4364.0
57
Begg S, et al, op.cit.
147
ACT
19.5%
Aus
Trend analysis of alcohol consumption exceeding lifetime risk or causing long term harm, requires
the application of the 2001 guidelines to the 2011-12 survey data. Applying the 2001 guidelines to
2011-12 survey results shows that the proportion of Tasmanian adults consuming alcohol at long
term risky levels has seen steady, but not statistically significant, increases since 2001, with a very
small, and not statistically significant, decrease since 2007-08.
Figure 171: Risky alcohol consumption for long term harm (2001 guidelines), 18 years and over, Tasmania,
2001-2011-12
NHMRC 2001 Guidelines
13.3%
13.7%
11.5%
10.8%
2001
2004/5
2007/8
2011/12
ABS, Australian Health Survey First Results, 2011-12, cat. No. 4364.0
Applying the 2009 guidelines, alcohol consumption exceeding lifetime risk among males in
2011-12 was around three times as high as for females at both the state and national levels.
For Tasmanian males (35.9%) this lifetime risk was statistically significantly higher than for
males at the national level (29.1%). For Tasmanian females, the risk was almost identical to
the national level.
Figure 172: Alcohol consumption exceeding lifetime risk 2009 guidelines, 18 years and over, by gender,
Tasmania and Australia, 2011-12
35.9%
NHMRC 2009 Guidelines
Tasmania
Australia
29.1%
22.7%
19.5%
10.2%
Males
10.1%
Females
Persons
ABS, Australian Health Survey First Results, 2011-12, cat. No. 4364.0
148
Single Occasion Risk
The 2009 guidelines specify that people drinking more than four standard alcoholic drinks on a single
occasion are at risk of short term alcohol-related harm. Almost half of Tasmanian adults (48.9%)
consumed alcohol at short term risky levels in 2011-12, the third highest proportion of all
jurisdictions and statistically significantly higher than Australia as a whole (44.7%).
Figure 173: Alcohol consumption exceeding single occasion risk 2009 guidelines, 18 years and over by
jurisdiction, 2011-12
NHMRC 2009 Guidelines
42.5%
43.3%
NSW
Vic
46.8%
44.1%
QLD
SA
54.6%
49.3%
48.9%
WA
Tas
48.0%
NT
44.7%
ACT
Aus
ABS, Australian Health Survey First Results, 2011-12, cat. No. 4364.0
Alcohol consumption exceeding the 2009 guidelines for single occasion risk is significantly more
prevalent among younger people, with a discernable downward trend for older age groups. In 201112, 82.3% of Tasmanians aged 18-24 were estimated to have been at risk of short term alcoholrelated harm, compared to 67.1% at the national level. This risk diminished significantly at the state
and national level by age 45, with 47.8% of Tasmanians estimated to be at risk compared to 42% at
the national level. After age 65 years, the risk decreased to 15.7% for Tasmania, slightly higher than
at the national level (14.7%).
Figure 174: Alcohol consumption exceeding single occasion risk 2009 guidelines, 18 years and over, by age,
Tasmania and Australia, 2011-12
NHMRC 2009 Guidelines
82.3%
67.1% 69.1%
59.9%
61.3%
47.8%
51.4%
Tasmania
Australia
48.9%
37.8%
42.0%
33.9%
44.7%
15.7%14.7%
18-24
25-34
35-44
45-54
55-64
65+
18+
ABS, Australian Health Survey First Results, 2011-12, cat. No. 4364.0
As with alcohol consumption exceeding lifetime risk, males are significantly more likely to drink
alcohol at levels exceeding single occasion risk levels. Of Tasmanian males aged 18 years and over,
65.4% were estimated to exceed single occasion risk levels compared to 33% of females. A similar
gender difference is seen at the national level, with 57.9% of male adults drinking alcohol exceeding
single occasion risk compared to 31.9% of females. As with long term alcohol related harm,
Tasmanian adult males were significantly more likely to exceed single occasion risk than for Australia
as a whole. This was not the case for females, with similar proportions observed at both the state
and national levels.
149
Figure 175: Alcohol consumption exceeding single occasion risk 2009 guidelines, 18 years and over, by
gender, Tasmania and Australia, 2011-12
65.4%
NHMRC 2009 Guidelines
Tasmania
57.8%
Australia
48.9%
44.7%
33.0%
Males
31.9%
Females
Persons
ABS, Australian Health Survey First Results, 2011-12, cat. No. 4364.0
During adolescence, the prevalence of risk taking behaviours increases and the likelihood of injury
increases when alcohol is implicated. According to the 2001 guidelines, the proportion of Tasmanian
students at risk of short term harm from alcohol consumption has slightly increased since 1987 for
students aged 16-17 years, but has remained relatively unchanged for 12 to15-year-old students.
In 2011, the 2009 Alcohol Guidelines were applied to the survey data. This has resulted in a small,
but statistically insignificant, increase in the prevalence of risky alcohol consumption for both age
groups. This increased prevalence is a result of lowering the threshold of alcoholic drinks thought to
cause short term harm from >6 standard drinks for males and >4 for females (2001 guidelines) to >4
standard drinks for both males and females (2009 guidelines).
Figure 176: Proportion of secondary school students consuming alcohol exceeding single occasion risk,
Tasmania 1984-2011
60%
50%
Percent
40%
Changed Guidelines*
30%
20%
10%
0%
1984 1987 1990 1993 1996 1999 2002 2005 2008 2011
12-15 Years 15% 15% 15% 17% 13% 20% 20% 23% 16% 23%
16-17 Years 46% 36% 33% 41% 37% 47% 53% 45% 48% 54%
1984-2008 data used 2001 Guidelines ;
Cancer Council, Australian Secondary Students' Alcohol and Drug Survey (ASSAD), 1984-2011
Drinking alcohol during pregnancy is linkedto increased risk of miscarriage, stillbirth, premature birth
and Foetal Alcohol Syndrome(FAS). Since 2005, the prevalence of alcohol consumption during
pregnancy has halved, from 18.3% to 9.2% in 2010, reflecting a statistically significant decline. Of all
females reporting drinking alcohol during pregnancy in 2010 (9.2%), most (87%) reported havingless
than one alcoholic drink a day.
150
Figure 177: Self-reported alcohol consumption during pregnancy, Tasmania 2005-10
18.3%
15.9%
2005
2006
14.6%
2007
12.6%
11.2%
2008
2009
9.2%
2010
DHHS, Council of Obstetric & Paediatric Mortality & Morbidity, Annual report 2010
Drinking alcohol during pregnancy continues to be more prevalent among females 35 years and over,
although the proportion of females consuming alcohol during pregnancy in this age group has fallen
significantly over the five year period from 2005 to 2010.
Figure 178: Self-reported alcohol consumption during pregnancy by age group, Tasmania 2010
2005
2010
24.1%
21.4%
20.3%
17.7%
13.5%
16.5%
13.5%
8.7%
<20
8.8%
20-24
11.6%
8.0%
25-29
8.5%
30-34
35-39
40+
DHHS, Council of Obstetric & Paediatric Mortality & Morbidity, Annual Report 2010
151
Physical Activity
A physically inactive lifestyle is increasingly recognised as detrimental to health, as it can contribute
to many chronic diseases as well as an increased risk of mortality. Insufficient levels of physical
activity have been linked to cardiovascular disease, mental health problems, type 2 diabetes and
some cancers. Physical inactivity was responsible for 6.6% of Australia’s total burden of disease in
2003, with ischaemic heart disease, type 2 diabetes and strokes accounting for more than 80%. 58
Nationally, physically inactive adults are costing the health care system $1.5 billion a year in direct
health expenditure, of which the greatest proportion is spent on falls ($468.7m), coronary heart
disease ($371.5m) and type 2 diabetes ($210.7m).59
The National Physical Activity Guidelines for Adults recommends at least 30 minutes of moderate
intensity physical activity on most, preferably all, days of the weeks. 60 Those aged 12-18 should
engage in at least 60 minutes of moderate to vigorous activity daily. 61 This level of physical activity is
deemed sufficient to achieve health benefits.
In accordance with the National Physical Activity Guidelines, physical activity levels are classified into
sedentary (no activity), low, moderate, and high levels of activity. Sedentary and low level activity
combined are classified as inadequate, as they are below the recommended minimum level of
physical activity for health benefits.
The Australian Health Survey (AHS) only counts physical activity carried out in the form of
‘exercise’, with household chores, gardening, employment activities or walking for the purpose of
transport not counted. Survey questions focus on activities undertaken for the purpose of improving
physical fitness or while undertaking recreational or sporting activities. As a result, the data should
not be interpreted as necessarily indicative of the overall activity levels of people, or of their fitness.
The graph below shows most Tasmanian adults (69.4%) have inadequate levels of physical activity as
defined by the AHS, by reporting to be sedentary or engaged in low levels of activity. Only 21.4%
report moderate levels of physical activity and 9.1% report high levels of activity. Physical activity
levels in Tasmania are comparable to the national level, with no statistically significant differences.
Figure 179: Physical activity levels 18 years and over, Tasmania and Australia 2011-12
35.3%
36.0%
34.1%
Tas
31.5%
Aust
21.4% 21.0%
9.1% 11.4%
Sedentary
Low
Moderate
High
ABS, Australian Health Survey First Results, 2011-12, cat. No. 4364.0
58 Begg S et al., The burden of disease and injury in Australia, Australian Centre for Burden of Disease and CostEffectiveness. 2006
59 Medibank Private, The cost of physical inactivity, August 2007
60 Department of Health and Ageing. National Physical Activity Guidelines for Australians. Canberra, 2005
61 Department of Health and Ageing, Australia’s Physical Activity Recommendations for 12-18 year olds, Canberra, 2004
152
The graph below shows that across jurisdictions, Tasmania (69.4%), along with Queensland (69.3%),
New South Wales (68.9%) and the ACT (68.9%), has the highest proportions of inadequate physical
activity levels among people aged 18 years and over.
Figure 180: Inadequate physical activity, 18 years and over by jurisdiction, 2011-12
69.3%
68.9%
69.4%
67.9%
66.7%
68.9%
66.1%
67.5%
64.7%
NSW
Vic
Qld
SA
WA
Tas
NT
ACT
Aus
ABS, Australian Health Survey First Results, 2011-12, cat. No. 4364.0
Over the last 10 years, the prevalence of inadequate physical activity among Tasmanians aged 15
years and over has remained essentially unchanged.
Physical activity levels are affected by age, with older age groups reporting more sedentariness or
low levels of physical activity than younger people. Of those Tasmanians aged 65 years and over,
75.7% did not undertake sufficient physical activity levels for health benefits in 2011-12. However,
chronic conditions such as arthritis are likely to impact on levels of physical activity.
Table 50: Inadequate physical activity levels by age, Tasmania 2001-2011-12
2001
2004-05
2007-08
2011-12
15-24
57.1%
59.9%
64.0%
51.2%
25-44
69.7%
68.4%
73.1%
72.9%
45-54
80.4%
65.0%
68.9%
64.3%
55-64
70.4%
74.7%
70.9%
71.9%
65 +
74.0%
78.3%
77.7%
75.7%
Total (15+)
70.4%
69.0%
71.4%
68.2%
ABS, Australian Health Survey First Results, 2011-12, cat. No. 4364.0
ABS, National Health Survey state tables, 2001, 2004, 2007; ABS, National Health Survey confidentialised unit record file, 2007/8
153
Australia’s physical activity recommendation for children and adolescents up to the age of 18 years is
to engage for at least 60 minutes in moderate to vigorous activity every day. 62
Results from the 2011 Australian Secondary Students’ Alcohol and Drug (ASSAD) Survey show that
although levels of physical activity generally increased since 2005, most Tasmanian secondary school
students are insufficiently active. Being insufficiently active and spending much time watching
television or using computers for recreation were both independently associated with overweight
and obesity in Australian adolescents, but dietary factors such as low vegetable and fruit intake were
not associated with being overweight or obese. 63
In 2011, only 18% of students aged 12-15 years and 17% of students aged 16-17 years met the
recommendations of the Physical Activity Guidelines. Compared to female students, males were much
more likely to report adequate levels of physical activity.
Table 51: Proportion of secondary school students reporting adequate levels* of physical activity, Tasmania
2005 to 2011
12-15 years
16-17 years
2005
2008
2011
2005
2008
2011
Males
15%
20%
20%
18%
17%
23%
Females
9%
12%
15%
9%
10%
10%
Total
12%
16%
18%
13%
13%
17%
* Vigorous or moderate level activity for at least one hour every day
Cancer Council, Australian Secondary Students' Alcohol and Drug Survey (ASSAD), 2005-2011
Similar to the findings of the ASSAD survey, the National Secondary Students’ Diet and Activity
survey (NaSSDA) 2009-10, found only 13% of all Tasmanian students aged 12-17 years met the
physical activity recommendations of 60 minutes of moderate to vigorous physical activity every day,
compared to 15% of students nationally. In Tasmania, male students were over twice as likely to
meet the guidelines (18.4%) than female students (7.9%); at the national level this gender discrepancy
was even more pronounced, with 21.8% of male students and 8.3% of female students meeting the
guidelines. 64
Tasmanian children aged five to12 years are also not sufficiently active. Results from the 2009
Tasmanian Child Health and Wellbeing Survey show many children aged five to 12 years have
insufficient levels of physical activity, with only 62% meeting the recommended amount of 60 minutes
every day. 65
Department of Health and Ageing, Australia’s Physical Activity Recommendations for 5-12 year olds and 12-18 year olds,
2004
63 Morley B.C. et al, What factors are associated with excess body weight in Australian secondary school students? MJA
2012; 196 (3): 189-192
64 Cancer Council, National Secondary Students’ Diet and Activity Survey (NaSSDA) 2009-10, Tasmania Summary Report,
2011
65 Social Research Centre, Tasmanian Child Health and Wellbeing Survey, Report of Survey Findings, 2009
62
154
Nutrition
Fruit and Vegetable Consumption
Dietary factors, such as the consumption of fruit, vegetables, salt, saturated fats, sugar and other
foods are linked to health and disease, either as protective influences or risk factors. Some of the
diseases and conditions to which diet contributes substantially include cardiovascular disease, some
cancers, type 2 diabetes, overweight and obesity, osteoporosis, dental caries, gall bladder disease and
diverticular disease. In 2003, low fruit and vegetable consumption was responsible for 2.1% of
Australia’s total disease burden. 66
The National Health and Medical Research Council (NHMRC) recommends eating five or more
serves of vegetables and two or more serves of fruit each day for adults as part of a healthy diet. For
adolescents, the Dietary Guidelines for Children and Adolescents in Australia recommends a daily
minimum of four serves of vegetables and three serves of fruit. 67
In 2011-12, 43.1% of Tasmanians aged 18 years and over ate the recommended daily serves of fruit.
This proportion is statistically significantly lower than for Australia as a whole (48.3%) as well as
some other jurisdictions.
Figure 181: Adequate fruit consumption (>2 serves daily), 18 years and over by jurisdiction, 2011-12
53.2%
50.6%
48.3%
47.9% 46.1% 49.4%
46.1%
42.4%
43.1%
NSW
Vic
Qld
SA
WA
Tas
NT**
ACT
Aus
ABS, Australian Health Survey First Results, 2011-12, cat. No. 4364.0
The proportion of Tasmanian adults eating the recommended daily serves of vegetables (13.9%) was
statistically significantly higher than for all but one jurisdiction, and for Australia as a whole.
Figure 182: Adequate vegetable consumption (>5 serves daily), 18 years and over by jurisdiction, 2011-12
13.9%
10.0%
8.2%
NSW
8.4%
Vic
8.7%
7.0%
Qld
SA
WA
Tas
6.3%
7.5%
8.3%
NT**
ACT
Aus
ABS, Australian Health Survey First Results, 2011-12, cat. No. 4364.0
66
67
Begg S et al, The Burden of Disease and Injury in Australia 2003, PHE 82, Canberra 2007
NHMRC, Dietary Guidelines for Children and Adolescents in Australia, 2003
155
Fruit consumption has dropped significantly since 2004, when the Tasmanian and Australian adult
proportions were similar at 53.7% and 54%, respectively. The decrease in reported fruit
consumption by Tasmanian adults over this seven year period from 53.7% to 43.1% in 2011-12, is
statistically significant.
Vegetable consumption has also fallen significantly over this period. The proportion of Tasmanian
adults eating the daily recommended serves of vegetables in 2011-12 (13.9%) was statistically
significantly lower than in 2004, when the Tasmanian and Australian figures were 20.6% and 14.4%,
respectively. A limitation of the AHS survey data is that potatoes, including potato chips, are taken
into account when calculating the number of serves of vegetables consumed.
Figure 183: Adequate fruit and vegetable consumption, Tasmania, 18 years and over, 2004 - 2011-12
53.7%
48.4%
2004
2007
2011
43.1%
20.6%
21.2%
13.9%
Fruit
Veg
ABS, Australian Health Survey First Results, 2011-12, cat. No. 4364.0
Good nutrition is essential for healthy growth and development during childhood and adolescence.
Results from the ASSAD survey show adolescents’ fruit and vegetable intake remains well below
Australian guidelines. In addition, dietary habits of secondary students, particularly eating fruit,
appear to move further from healthy eating guidelines with advancing grade level.
Vegetable consumption has increased for all students since 2002, but fruit consumption slightly
decreased for students aged 16-17 years. Note: in adolescence three rather than two serves of fruit
should be eaten daily.
Table 52: Proportion of secondary school students consuming recommended levels of fruit and vegetables,
Tasmania 2002-08
12-15 years
16-17 years
2002
2005
2008
2002
2005
2008
> 4 serves of vegetables daily
17.8%
22.9%
23.0%
17.5%
22.0%
22.0%
> 3 serves of fruit daily
61.1%
69.4%
71.0%
63.7%
60.2%
62.0%
Cancer Council, Australian Secondary Students' Alcohol and Drug Survey (ASSAD), 2008; 2,100 Tasmanian students participated in 2008
The National Secondary Students’ Diet and Activity Survey (NaSSDA) 2009-10 found that 22% of
Tasmanian students aged 12-17 years reported meeting the recommended daily requirement for
vegetable consumption compared to 24% nationally. About 39% of Tasmanian students met the daily
fruit consumption guidelines, compared to 41% nationally. Overall, male and female students had
similar patterns of consumption, with females slightly more likely to consume sufficient serves of
vegetables than males, and males more likely to consume the recommended serves of fruit. 68
68 Cancer Council, National Secondary Students’ Diet and Activity Survey NaSSDA) 2009-10, Tasmania Summary Report,
2011
156
Breastfeeding
Breastfeeding is considered the best way to provide ideal food for the healthy growth and
development of infants. 69 A recent review of the evidence by National Health and Medical Research
Council confirmed breastfeeding has short-term and long-term health benefits for infants. 70 Among
these are increased protection against infection, asthma, certain allergic reactions, sudden infant
death and some chronic diseases and conditions, including obesity. Both the National Health and
Medical Research Council (NHMRC) and the World Health Organization (WHO) recommend
infants be exclusively breastfed to about six months of age. 71 Breastfeeding initiation rates are
reasonably high and stable over time. However, the early cessation of breastfeeding is a major
concern, particularly among low socio-economic groups and young mothers.
In Tasmania, intention to breastfeed at maternal discharge data is routinely collected and reported in
the Council of Obstetric and Paediatric Mortality and Morbidity (COPMM) annual reports. 72 Around
80 per cent of females report intent to breastfeed at maternal discharge (see figure below).
Figure 184: Breastfeeding intention on maternal discharge, Tasmania 2005-2010*
81.9
82.7
81.9
79.4
79.8
78.2
2005
2006
2007
2008
2009
2010
Council of Obstetrics and Paediadric Mortality and Morbidity, Annual Reports *prior to
2005 collected as breastfeeding yes/no, 2005 collected as 'intending to breastfeed' yes/no/unsure
In 2010 the Australian Institute of Health and Welfare undertook an Australian National Infant
Feeding Survey 73. This was a mail out survey to parents of 52 000 infants aged 0-24 months. The
national response rate for this survey was 56.4%. Percentage ever breastfed 74* was estimated at
95.6% nationally with similar findings for Tasmanian infants at 96.1% (see table below)
Some infants receive breast milk (especially colostrum) in hospital and then breastfeeding ceases by
the time of maternal discharge. Hence it is to be expected that ever breastfed rates would exceed
intention to breastfeed on maternal discharge. However, the significant disparity between the 2010
COPMM Tasmanian intention to breastfeed on maternal discharge data (78.2%) and the Tasmanian ever
breastfed rates obtained from the Australian National Infant Feeding Survey (96.1%) are unlikely to
be explained by this alone and are more likely to reflect a bias towards breast feeders among the
Australian National Infant Feeding Survey respondents.
Despite apparent biases in the Australian National Infant Feeding Survey, the data provides a useful
comparison between groups. Nationally, mothers who were young, low income, low education (year
11 or less) or daily smokers were less likely to have ever breastfed than other mothers, as shown
below.
69
World Health Organization, 2012, Exclusive breastfeeding, World Health Organization, Geneva, viewed 19 July 2012.
<http://www.who.int/nutrition/topics/exclusive_breastfeeding/en/>
70
National Health and Medical Research Council, 2011, A review of the evidence to address targeted questions to inform the revision of the
Australian Dietary Guidelines, Commonwealth of Australia, Canberra, pp. 833–4.
71
Australian Institute of Health and Welfare 2011, Headline indicators for children’s health, development and wellbeing 2011, Cat. no. PHE 144,
AIHW, Canberra, p. 33.
72
.http://www.dhhs.tas.gov.au/about_the_department/partnerships/registration_boards/copmm/document_list3
http://www.aihw.gov.au/publication-detail/?id=10737420927
74
*infant has been breastfed or received expressed breast milk or colostrum at least once
73
157
Table 53: Proportion of infants ever breastfed, 2010
% ever breastfed
Australia
young (<24 years)
95.9
93.6
low income (<$26,000 pa)
92.7
low education (year 11 or less)
88.4
daily smokers
88.2
Tasmania
96.1
AIHW, 2010 Australian National Infant Feeding Survey: indicator results. Canberra, 2011
The 2010 Australian National Infant Feeding Survey determined exclusive breastfeeding to each
month of age. Tasmanian rates of exclusive breastfeeding appear higher than the national rates with
47.2% still being exclusive breastfed at to four months while nationally only 39.2% are still exclusively
breastfed (see graph below).
Figure 185: Proportion of infants exclusively breastfed by age (per month), 2010
72.6
69.9
61.4
National
62.5
55.8
Tasmania
47.2
48.0
39.2
37.7
27.0
25.7
15.4
1
2
3
4
5
6
Age of infant
2010 Australian National Infant Feeding Survey
In Tasmania, breastfeeding practices recorded during routine four-month child health assessments
from 2009-10 to 2010-11, show exclusive breastfeeding is significantly more common among higher
socio-economic groups and among older mothers.
Iodine Status
Globally, iodine deficiency is considered the greatest single cause of preventable brain damage and
mental retardation. Tasmania has a history of iodine deficiency with evidence of cases of severe
deficiency before the 1950s. In the 1960s and 70s public health interventions protected the
population from iodine deficiency. In the 1980s, iodine, present in milk as residues from sanitisation
practices in the dairy industry, was thought to have provided protection. Results from urinary iodine
surveys of Tasmanian school children in the late 1990s suggested a re-emergence of mild iodine
deficiency.
Population iodine status, based on surveys of Tasmanian school children, has been monitored
routinely since 2001. Before 2001 Tasmanians were considered iodine deficient. Iodine status
improved following a Tasmanian voluntary fortification program implemented in 2001. Iodine status
further improved following a national mandatory fortification program implemented in 2009. Iodine
status in Tasmania is now well within the optimal range. 75 However, concerns remain about the
iodine status of pregnant and lactating females as requirements are greatly increased at these times.
Further work on the iodine nutrition in pregnant and lactating females is warranted.
75
DePaoli et al, unpublished data
158
Body Mass Index
Throughout Australia and most OECD countries, the prevalence of overweight and obesity is
increasing. Being overweight or obese increases the risk of a wide range of health problems,
including cardiovascular disease, type 2 diabetes, some cancers, degenerative joint disease,
obstructive sleep apnoea and impaired psychosocial functioning.
Obesity in Australia accounted for an estimated 7.5% of the total burden of disease in 2003. 76 The
total costs of obesity and obesity related illnesses in 2008-09 were estimated at $37.7 billion, which
included the indirect cost of the loss in productivity due to obesity, estimated as $6.4 billion. 77
The World Health Organization defines weight status according to the Body Mass Index (BMI) which
is the ratio of weight (in kilograms) divided by height (in metres squared). A BMI of between 25 and
30 indicates overweight and a BMI greater than 30 indicates obesity. 78
The National Health Survey has traditionally provided estimates of BMI based on participants’ selfreported height and weight. However, self-reported height and weight are not reliable because
people tend to overestimate their height and underestimate their weight. 79
In recognition of the limitations of self-reported height and weight, the ABS commenced collection
of measured height and weight in the 2007-08 National Health Survey and continued this for the next
iteration, run under the umbrella of the 2011-12 Australian Health Survey. While self-reported BMI
was not reported for the 2011-12 survey, in 2007-08, the prevalence of overweight/obesity in
Tasmanian adults was underestimated by >5% when using self-reported height and weight as
opposed to the measured values (58.9% compared to 64%). A similar discrepancy was seen at the
national level (56% compared to 61.2%). Only the national difference was statistically significant.
In 2011-12, about two-thirds (65.6%) of Tasmanian adults were estimated to be overweight or obese
based on measured height and weight, slightly higher than for Australia as a whole (63.4%) and also
slightly higher than the Tasmanian value for 2007-08 (64%). Neither difference, however, was
statistically significant. Further, compared with the other jurisdictions in 2011-12, there were no
statistically significant differences.
Age-standardising the jurisdictional rates using the 2001 Australian population standard to adjust for
differential jurisdictional age distributions does not alter these conclusions. The Tasmanian adult agestandardised overweight/obesity prevalence was only slightly lower than the crude rate at 64.1%.
Figure 186: Overweight/obese* prevalence, 18 years and over by jurisdiction, 2011-12
65.8%
61.2%
NSW
67.1%
65.9%
65.6%
62.4%
63.0%
NT**
ACT
63.4%
62.0%
Vic
Qld
SA
WA
Tas
Aus
ABS, Australian Health Survey First Results, 2011-12, cat. No. 4364.0
* Based on measured height and weight
Begg S et al, The burden of disease and injury in Australia, 2003, Canberra 2007
Medibank Health Solutions, Obesity in Australia: financial impacts and cost benefits of intervention, March 2010
78 WHO. Obesity: preventing and managing the global epidemic. Report of a WHO consultation. WHO Technical Report
894, 2004.
79 Flood V et al., Use of self-report to monitor overweight and obesity in populations: some issues for consideration, Aust
NZJ Public Health, 2000; 24: 96-99.
76
77
159
Results from national surveys show the prevalence of overweight/obesity in adults has been steadily
increasing over time, rising nationally from 38% in 1989-90 to 63.4% in 2011-12. Even more
pronounced, the prevalence of obesity in adults aged 18 years and over in Australia has tripled in just
over 20 years, from 9% in 1989-90 to 28% in 2011-12. Future projections estimate that 75% of the
Australian population will be overweight or obese by 2020. 80
Since 2007-08, the prevalence of measured overweight/obesity of adults aged 18 years and over has
increased by about 2% for Tasmania and Australia as a whole. These increases were not statistically
significant.
Figure 187: Overweight/obese* prevalence, 18 years and over, Tasmania and Australia, 2007-08 - 2011-12
Tas
Aust
65.6%
64.0%
63.4%
61.3%
2007/8
2011/12
ABS, Australian Health Survey First Results, 2011-12, cat. No. 4364.0
The prevalence of overweight/obesity among Tasmanian adult males has been traditionally higher
than for females, a pattern also been demonstrated at the national level. Further, the gender gap
appears to be increasing. In 2007-08, 65.6% of Tasmanian male adults were overweight or obese,
compared to 62.4% of females, a gap of 3.2%. In 2011-12, this gap has widened to 8.3%, a statistically
significant difference. Nationally, the overweight/obesity gender gap also widened, from 12.8% in
2007-08 to 14.1% in 2011-12.
Figure 188: Overweight/obese* prevalence, 18 years and over by gender, Tasmania, 2007-08 - 2011-12
Males
65.6%
62.4%
2007/8
64.0%
Females
Persons
69.8%
61.5%
65.6%
2011/12
ABS, Australian Health Survey First Results, 2011-12, cat. No. 4364.0; National Health
Survey: Summary of Results; Tasmania, 2007-2008 (Reissue 29th March 2011)
*based on measured height and weight
80
DHHS, Working in health promoting ways, 2010, p.58
160
Data for childhood obesity is provided by national population health surveys for children aged five to
17 years. There was a statistically significant increase in the prevalence of measured childhood
overweight and obesity from 2007-08 (18.6%) to 2011-12 (28.8%).
Tasmanian children were more likely to be overweight/obese than children nationally. In 2011-12,
more than one in four of all Tasmanian children aged five to 17 years (28.8%) were either
overweight (18.3%) or obese (10.5%). The Tasmanian prevalence of overweight/obesity combined
was the second highest of all jurisdictions, but this was not statistically significant.
Figure 189: Overweight/obese prevalence, age 5-17 years, by jurisdiction, 2011-12
28.4%
25.0%
NSW
24.1%
28.8%
25.0%
29.4%
26.3%
23.1%
Vic
25.3%
QLD
SA
Tas
WA
NT
ACT
Aus
ABS, Australian Health Survey First Results, 2011-12, cat. No. 4364.0
* Based on measured height and weight
The 2009-10 National Secondary Students’ Diet and Activity survey collected measured height and
weight data from over 800 students in 15 secondary schools in Tasmania. Overall, around 70% of
students aged 12-17 years had a healthy weight, with just over a quarter of all students (27.7% of
males and 24.2% of females) with a BMI of overweight or obese, and a small proportion with an
underweight BMI.
Nationally, 71.1% of male secondary students and 72% of female secondary students had a healthy
weight, with 24.6% of males and 22.6% of females being overweight or obese, slightly below the
Tasmanian rates for overweight and obese BMI. Research has suggested excess body weight is linked
to a lack of physical activity rather than dietary factors in this age group. 81
Figure 190: BMI distribution of secondary school students’, age 12-17 years by sex, Tasmania 2009-10
68.6%
72.4%
Males
Females
23.9%
20.5%
3.8% 3.7%
3.7% 3.4%
Underweight
Healthy weight
Overweight
Obese
Cancer Council, National Secondary Students' Diet and Activity Survey (NaSSDA), 2009-10
81 Morley, B.C. et al, What factors are associated with excess body weight in Australian secondary school students?, MJA,
Vol. 196, 2012, pp.189-192
161
Carrying too much weight during pregnancy can place both mother and baby at risk. Guidelines state
that a BMI of 30 or more at the first antenatal consultation constitutes obesity in pregnancy, and that
obesity in pregnancy increases the risk of complications such as gestational diabetes, miscarriage,
pre-eclampsia, wound infections and caesarean section, among others. 82
Research has shown the burden of adverse pregnancy outcomes, including serious neonatal
complications, is clearly linked to maternal obesity. While there has been a significant increase in
maternal obesity in Australia over the last 20-30 years, reflecting increases in the general population,
one study observed a lack of a marked trend towards increasing maternal obesity in Australia during
recent years. 83
The table below shows maternal self-reported BMI in 2010, and measured BMI for all females aged
18-34 years in 2011-12. Of all pregnant females who reported their height and weight (1 247), 24.6%
were obese, compared to 26.5% of Tasmanian females aged 18-34 years. With self-reported BMI
being typically lower than measured BMI, these proportions are very comparable. This means the
population wide obesity problem has ramifications for pregnancies and pregnancy outcomes as well
as considerable implications for health care systems and the cost of services.
Table 54: Females who gave birth by self-reported BMI status and measured BMI for females 18-34 years,
Tasmania 2010 and 2011-12
BMI kg/m2
Self-reported BMI (2010)*
Measured BMI (2011-12)
<18.5-24.9
50.0%
49.2%
25.0-29.9
25.3%
24.3%
>30.0
24.6%
26.5%
AIHW, Australian mothers and babies 2010, Canberra 2012; *self-reported at time of conception
82
83
CMACE and RCOG, Joint guidelines on the management of females with obesity in pregnancy, 2010
McIntyre D.M., Overweight and obesity in Australian mothers: epidemic or endemic, MJA, Vol.196, pp.184-188
162
Illicit Drugs
Illicit drug use is a significant public health problem associated with increased risk of chronic health
conditions, including blood borne viruses, chronic liver disease, cardiovascular disease, mental health
problems, and premature death. Illicit drug use includes use of cannabis, amphetamines, opiates,
hallucinogens as well as the non-prescribed use of prescription drugs such as benzodiazepines and
opioid analgesics. In addition to being a direct cause of death and chronic disease, illicit drug use is a
risk factor for conditions such as poisoning, suicide, injury, crime, and family breakdown.
In 2003, an estimated 2% of Australia’s total disease burden was attributed to the use of illicit drugs.
Almost three-quarters of the burden from illicit drugs is experienced by males because males are
more likely to both use illicit drugs, and to adopt drug habits that place them at risk of dying from
illicit drug use. 84, 85 The use of illicit drugs by Tasmania’s secondary students has declined significantly
since 1996.
Figure 191: Proportion of secondary school students who used illicit substances* in their lifetime,
Tasmania 1996 - 2011
60%
50%
Percent
40%
30%
20%
10%
0%
1996
1999
2002
2005
2008
2011
12-15 Years
34%
31%
26%
18%
14%
14%
16-17 Years
54%
48%
45%
31%
28%
30%
*includes cannabis, amphetamines, cocaine, opiates, ecstasy, hallucinogens
Cancer Council, Australian Secondary Students' Alcohol and Drug Survey (ASSAD),
1996-2011
The National Drug Strategy Household survey collects data on illicit drug use among Australians. In
2010, it estimated 8.3% of Tasmanians aged 12 years and over had used cannabis in the last year. The
use of other illicit drugs (out of a list of 14) over the same timeframe was slightly lower at 6.4% of
Tasmanians aged 14 years and over. These proportions were similar to most jurisdictions, except
Western Australia and the Northern Territory. (Australian Institute of Health and Welfare 2006)
Figure 192: Recent use of cannabis(a) or other illicit drugs(b) (in last 12 months), by jurisdiction, 2010
Cannabis
Illicit drugs other than cannabis
15.9%
13.0%
9.1%
9.1%
8.1% 8.5%
NSW
Vic
10.6%
10.9%
7.7%
QLD
10.0%
8.3%
6.4%
8.0%
SA
10.0%
10.0%
9.2%
8.3%
7.3%
WA
Tas
NT
AIHW 2011. Drugs in Australia 2010 : tobacco, alcohol and other drugs
84
85
Begg S et al, The burden of disease and injury in Australia. 2006
AIHW, Statistics on Drug Use in Australia 2006, p.37
163
ACT
Aus
Health Profile of Population 60 Years and Over
This is the third Health Indicators Tasmania report and the first time the health status of Tasmania’s
older population group has been highlighted to reflect its significant impact on the general health and
health care use of the total population.
Much of the data for this chapter has been derived from analysis of results of the 2009 Tasmanian
Population Health Survey. This survey considered the physical, mental and social components
impacting on the health status of the whole Tasmanian population.
Tasmania’s population is the oldest of all states and territories, and the state has the most rapidly
increasing number of people aged 65 years and over. In 2011, 16.1% (over 80 000 people) were aged
65 years and over, compared with 14.9% (71 161 people) in 2008, 13.8% in 2001 and 12.8% in 1996.
Of this older population in 2011, 10 300 were aged 85 years and over compared to 8 535 in 2008
(see demographic chapter).
The Australian Bureau of Statistics predicts by 2057, the 65 years and over cohort will represent
around 30 per cent of the Tasmanian population, which is a substantial increase from the 8% of the
early 1970s.
The size of the seniors’ group, which in Tasmania is calculated from 60 years of age, covers a period
of potentially 30+ years – the largest size of all age related cohorts. It effectively covers a generation
– the same period as the childhood, adolescence and young adulthood periods combined.
As such, the seniors’ cohort is heterogeneous in age; interests; abilities; (physical, mental, cognitive,
emotional, and functional); health and wellbeing; and health service needs – for disease prevention,
illness management and to end of life requirements.
Community Integration
Most older people in Tasmania report being active members of society with large numbers
volunteering and regularly participating in community events.
Survey data show older Tasmanians can rely on help from friends, family and neighbours when
needed, with friends reported as the most reliable help. For the most part, access to community
services did not appear to be a problem for most, but there was some uncertainty about feeling
valued by society.
Table 55: Social capital, 60 years and over, Tasmania 2009
Response
no, not at all
not often
sometimes
yes, definitely
Help from friends when needed
4.1%
2.4%
12.3%
80.4%
Help from family when needed
7.8%
3.0%
9.6%
78.8%
Help from neighbours when needed
12.1%
4.2%
14.5%
67.0%
Access to community services
4.3%
1.6%
7.6%
83.5%
Feel valued by society
9.8%
5.4%
26.2%
52.0%
Tasmanian Population Health Survey, 2009
164
Workforce participation declines after the age of 60 years. According to Tasmania’s Demographic
Change Advisory Council, the level of non-participation begins to increase significantly after age 55
and reaches almost 100% for those aged 70 years and over. 86
Of all Tasmanians aged between 60 and 70 years in 2009, 58.1% reported they were retired and 29%
were employed or self-employed. A further 5.7% were unable to work (e.g. core disability) and 4%
report home duties (e.g. caring/domestic responsibilities).
Table 56: Employment status, age 60-70 years, Tasmania 2009
Employment Status
Retired
58.1%
Employed or self-employed
29.0%
Unable to work
5.7%
Home duties
4.0%
Other
3.2%
Total
100.0%
Tasmanian Population Health Survey, 2009
Further, the Tasmanian Population Health Survey showed that of all employed and self-employed
Tasmanians aged 60-70 years, 82.2% had two or less chronic conditions, with only 17.8% reporting
three or more chronic conditions. Of those who had retired, almost twice as many reported three
or more chronic conditions. This shows health plays an important part in retirement decisions, and
that older Tasmanians with several chronic conditions appear to be limited in their ability to stay in
the workforce.
Self-assessed Physical and Mental Health
Self-assessed health status, as a measure of a person’s perception of their health, declines with
advancing age and is affected by socio-economic status.
Tasmanians 60 years and over generally reported very good health, with 75.7% reporting either
excellent, very good or good health and 23.8% reporting fair or poor health.(Health perceptions of
those over 60 years were similar to Tasmania’s total adult population, except for fair and poor
health, which was statistically significantly higher for this popualtion.
Figure 193: Self-assessed health, 60 years and over and total adult population, Tasmania 2009
41.3%
42.6%
Age 60+
34.4%
Age 18+
37.3%
23.8%
19.9%
Excellent/VeryGood
Good
Fair/Poor
Tasmanian Population Health Survey, 2009; * statistically significantly different
86
Demographic Change Advisory Council, Who is not participating in Tasmania’s labour force?, Summary Paper, July 2007
165
Psychological distress is an indicator of mental health and wellbeing. In the 2009 Tasmanian Health
Survey psychological distress was measured with the Kessler 10. In the analysis of the results,
various cut off scores define the level of psychological distress, which range from no distress or low
level distress to high and very high levels of distress.
High and very high level of psychological distress was reported by 9.0% of older Tasmanians
compared to 10.6% of all adult Tasmanians. Of those 9.0 per cent, 69.5% also reported being
diagnosed with arthritis.
Table 57: Psychological distress levels, 60 years and over, Tasmania 2009
>60 years
>18 years
No distress/low level
91.0%
89.4%
High distress/very high
9.0%
10.6%
Tasmanian Population Health Survey 2009
Chronic Conditions
Arthritis was the most frequently reported diagnosed chronic health condition by Tasmanians aged
60 years, with more than one in two Tasmanians reporting being diagnosed with arthritis. The
second most common condition was cataracts (28.6%) followed by depression/anxiety (19.1%).
Asthma was reported by 17.1% and 13.8% reported being diagnosed with diabetes.
Figure 194: Prevalence of self-reported diagnosed health conditions, 60 years and over, Tasmania 2009
Arthritis * 52.8%
Cataracts, 28.6%
Depression/anxiety,
19.1%
Heart disease, 18.6%
Cancer, 17.2%
Asthma, 17.1%
Osteoporosis, 16.3%
Diabetes** , 13.8%
Stroke, 8.2%
*includes all types of arthritis
** includes diabetes types 1 and 2
Glaucoma, 6.7%
Macular
degeneration, 5.7%
Tasmanian Population Health Survey, 2009
Arthritis is a chronic musculoskeletal condition that can have a significantly adverse impact on the
general health and wellbeing of people, particularly in the older age groups. The pain and suffering
endured by those with arthritis can reduce their quality of life.
For those with arthritis, the table below shows about one-third reported fair/poor health and only
one- third reported excellent/very good health. There was a significantly greater percentage of
people who reported excellent/good health among the group without arthritis. The impact of
arthritis can also vary depending on the availability and effectiveness of management.
166
Table 58: Self-assessed health by arthritis diagnosis, 60 years and over, Tasmania 2009
>60 years with arthritis
total >60 years
excellent/very good
33.5%
41.3%
good
36.4%
34.4%
fair/poor
29.6%
23.8%
Tasmanian Population Health Survey, 2009; * statistically significantly different from total 60+ at the 95%CI
Within this group of older people with arthritis, a significantly greater percentage of females than
males report having a diagnosis of both arthritis and osteoporosis. Similarly, there is a gender
difference in the significantly greater prevalence of depression/anxiety in females than males of
similar age.
Table 59: Prevalence of selected chronic conditions by gender, 60 years and over, Tasmania 2009
Arthritis and/or osteoporosis
Depression/anxiety
Males
44.6%
15.2%
Females
66.3%*
22.5%*
Total
56.1%
19.1%
Tasmanian Population Health Survey, 2009; * statistically significantly higher than males
Timely health checks are important in preventing or minimising the impact of chronic conditions.
Almost all Tasmanians aged 60 years and over had their blood pressure checked (96.1%) during the
preceding two years, but only 76.5% reported a diabetes test, Only just over a third of older
Tasmanians reported bowel cancer screening (see chapter on cancer screening and diagnosis).
Figure 195: Health checks completed during previous two years, 60 years and over, Tasmania 2009
96.1%
82.3%
76.5%
38.7%
Blood pressure
check
Cholesterol check
Diabetes test
Tasmanian Population Health Survey, 2009
167
Bowel cancer
screening
Impact of Socio-economic Factors
In the 2009, Tasmanian Health Survey most Tasmanians aged 60 years and over reported being
financially secure, with one in 10 older Tasmanians unable to raise $2 000 in an emergency, which is
a key measure for financial insecurity.
Food insecurity was experienced by very few older Tasmanians (1.5%). For those reporting food
insecurity, this situation occured less than once a month (69.9%).
Figure 196: Financial insecurity and food insecurity, 60 years and over and total adult population, Tasmania
2009
11.1%
Age 60+
9.6%
Age 18+
4.9%
1.5%
Financial insecurity
Food insecurity
Tasmanian Population Health Survey, 2009
* Financial insecurity: unable to raise $2 000 in an emergency; food insecurity : ran out of
food during the preceding 12 months and had no money to buy more
There is a strong statistical association between the number of chronic conditions, financial status
and self- assessed health. Of those 60 years and over who were financially insecure, 53.8% reported
having three or more chronic conditions, compared to only 34.8% of those reporting financial
security. Similarly, 41.4% of those who are financially insecure reported fair/poor health, compared
to 21.8% of those who are financially secure. These differences were statistically significant.
Table 60: Financial security status by health status, 60 years and over, Tasmania 2009
Financially insecure
Financially secure
>3 chronic conditions
53.8%
34.8%
Fair/poor health
41.4%
21.8%
Tasmanian Population Health Survey 2009; * statistically significantly different at the 95%CI
Chronic conditions and/or low socio-economic status are known to result in reduced physical
activity levels. Both chronic conditions and low socio-economic status are much more common in
the 60 years and over group, particularly affecting those on aged pensions. The link between low
socio-economic status and insufficient physical activity to achieve a health benefit is highlighted in the
results of those aged 60 years and over, with significantly higher levels of insufficient activity in the
lowest quintiles.
Table 61: Insufficient physical activity by household income quintiles, 60 years and over, Tasmania 2009
Household Income Quintiles
1 (lowest)
2
3
4
5 (highest)
43.4%*
40.5%*
29.0%
26.8%
21.0%
Tasmanian Population Health Survey 2009; * statistically significant at the 95%CI
168
Risk Factors
Health risk factors are behavioural characteristics associated with an increased risk of developing a
chronic condition. The major behavioural risk factors included here are nutrition (fruit and vegetable
consumption), excess/high Body Mass Index (BMI), insufficient physical activity to gain a health
benefit, smoking and alcohol consumption causing short term harm.
The NHMRC recommends a minimum daily intake of five serves of vegetables and two serves of
fruit. The graph below shows older people were more likely to report adequate fruit and vegetable
consumption, with 54.4% and 14.9% reporting adequate fruit and vegetable consumption respectively
compared to 49.8% and 11% for Tasmanians aged 18 years and over. These differences were
statistically significant with the older age group doing significantly better than the population as a
whole.
Figure 197: Adequate consumption of fruit and vegetables, 60 years and over and total adult population,
Tasmania 2009
54.4%
49.8%
Age 60+
Age 18+
14.9%
Adequate fruit consumption
11.0%
Adequate vegetable consumption
Tasmanian Population Health Survey, 2009; * statistically significantly different
There is a statistically significantly lower rate of daily smokers among Tasmania’s population aged 60
years and over at 8.5% compared to the rate of daily smokers in the general adult population
(16.2%).
According to the 2009 Alcohol Guidelines, drinking more than five standard alcoholic drinks on a
single occasion increases the risk of short term harm.
Figure 198: Alcohol consumption exceeding single occasion risk 2009 guidelines, 60 years and over and
total adult population, Tasmania 2009
Age 60+
Age 18+
61.3%
54.7%
2009 Guidelines
26.9%
26.7%
16.1%
8.8%
Higher risk
Low risk
Abstainers
Tasmanian Population Health Survey, 2009; harm caused by consuming 5 or more
standard drinks on any single occasion
169
As people age, their balance reactions are significantly slower and this physiological change is
worsened by excessive alcohol.
Falls and other accidents, as well as the risks of adverse interaction with medications, are of
particular concern for older people, who are more vulnerable to the effects of alcohol and may have
complex medication needs.
Although there are fewer older people at higher risk of short term harm from excessive alcohol, the
outcome and recovery from accidents/injury is prolonged and costly, both personally and for health
services.
Body mass index values, based on self-reported height and weight, show no significant differences
between those aged 60 years and over and 18 years and over. Overweight and obesity combined
were 54% for Tasmanian’s older population, compared to 51.9% for the total adult population. In
fact, the total population BMI results from the 2009 Tasmanian Health Survey indicate the adverse
impact of excessive weight on limiting physical activity across the lifespan.
Figure 199: BMI status, 60 years and over and total adult population, Tasmania 2009
35.9%
37.7%
35.9%
33.2%
Age 60+
Age 18+
18.1%
18.7%
2.1% 1.8%
Underweight
Normal
Overweight
Obese
Tasmanian Population Health Survey, 2009
Compared to the total population, people aged 60 years and over engage in less physical activity,
with 39% engaged in inadequate physical activity compared to 27.5% of the population aged 18 years
and over. This difference is statistically significant.
Figure 200: Level of physical activity, 60 years and over and total population, Tasmania 2009
Age 60+
68.2%
Age 18+
53.3%
39.0%
27.5%
Inadequate
Adequate
Tasmanian Population Health Survey, 2009; *statistically significant difference
Walking is the dominant activity those aged 60 years and over use to remain active, with vigorous
activities less commonly used to achieve sufficient activity.
170
It is important for older people to note sufficient physical activity can be achieved by regular daily
walking for at least 30 minutes, which can be taken in 10 minute intervals if needed. Vigorous
activities are not essential and if taken should be carefully monitored.
Table 62: Type of physical activity, 60 years and over and total adult population, Tasmania 2009
Activity type to achieve a health benefit
>60 years
>18 years
Walking
56.5%
50.0%
Vigorous household activities
9.1%
10.1%
Vigorous other activities
9.6%
13.3%
Tasmanian Population Health Survey 2009; * statistically significantly different from 18 years and over
Sufficient physical activity is correlated with better physical and psychological health, e.g. more
excellent/very good and less fair/poor health and less psychological distress. This trend applies to
everyone irrespective of age. However, the direction of this correlation is unclear – people who
exercise are healthier or healthier people exercise more.
Table 63: Self-assessed health by physical activity levels, 60 years and over, Tasmania 2009
Health status
Insufficient physical activity
Sufficient physical activity
Excellent/Very Good
35.4
48.9
Good
34.8
33.5
Fair/Poor
29
17.4
Total
100
100
Tasmanian Population Health Survey 2009
Risk Factor Interactions and Effects on Chronic Conditions
At a total population level across the lifespan, those with excess body weight report significantly less
physical activity than their normal weight counterparts. This adverse outcome impacts on a greater
percentage of people in the older age group, with close to 40% reporting being sedentary or
insufficiently active to achieve a health benefit.
Table 64: BMI status by physical activity levels, 60 years and over and total adult population, Tasmania
2009
>60 years
>18 years
Insufficient
physical
activity
Sufficient
physical
activity
Total
Insufficient
physical
activity
Sufficient
physical
activity
Total
Healthy weight
36.6%*
59.0%*
100%
22.9%
74.2%
100%
Overweight/obese
39.4%*
52.1%*
100%
30.0%
65.4%
100%
Tasmanian Population Health Survey 2009; * statistically significantly different from 18 years and over
171
While excess weight in older adults does not appear to differentiate between those with or without
arthritis, it clearly significantly differentiates those with or without diabetes and/or hypertension (see
table below).
Moreover, excess body weight has an adverse impact on the management of all these chronic
conditions and limits the ability of older people to achieve sufficient physical activity to gain a health
benefit and improve their quality of life. As shown below, a significant proportion of people aged 60
years and over reporting diabetes or hypertension are overweight or obese.
Table 65: Selected chronic conditions by BMI status, 60 years and over, Tasmania 2009
Overweight/obese
Healthy weight
Total >60 years
Arthritis
55.8%
44.2%
100%
Diabetes
78.8%*
21.2%
100%
Hypertension
65.8%*
34.2%
100%
Tasmanian Population Health Survey 2009; * statistically significant difference
A chronic health condition does not preclude achieving an active and healthy lifestyle into older age
but the presence of a chronic condition, particularly combined with overweight/obesity, can make it
more difficult to achieve sufficient activity to gain a health benefit.
There is a significant co-morbidity between diabetes and arthritis with 57.6% of those diagnosed with
diabetes also being diagnosed with arthritis. Symptoms associated with diabetes and arthritis are
known to increase the risk of falls in older people.
Physical activity, particularly muscle strength, balance and coordination are essential falls prevention
strategies to reduce falls and harm from falls in older people, particularly those at high risk.
It would appear that a large number of older people with chronic health conditions that increase
their risk of falls and harm from falls, are not accessing or able to access, physical activities sufficient
to gain a health benefit that would help reduce their risk of falling and improve their health and
wellbeing.
172
Primary Health Care
As part of the national health reforms, the Australian Government is aiming to shift health services
from hospitals to primary care. Primary care is the first level care provided outside of hospitals and
includes the services of general practitioners, practice nurses, physiotherapists and community health
workers supported by an integrated referral system.
There are two key elements underlying primary health care. One is preventive health care, which
has been identified as a significant factor in improving health outcomes and in reducing the burden of
disease. The second element is the focus on greater equity in health and better coordination in the
delivery of health services. It is anticipated future demand for primary health care services will
increase pressure on general practice as Tasmania's population ages and labour supply tightens.
Primary Health Care Workforce
The graph below shows the number of full-time equivalent (FTE) GPs and practice nurses in each of
the Tasmanian regions. There were 365.1 FTE GPs in Tasmania in 2011 and 320 practice nurses
employed by 112 of Tasmania's general practices. In line with the regional population distribution,
53.5% of these GPs (and 45.3% of Tasmania’s practice nurses, practiced in the Southern region, with
over a quarter of GPs and practice nurses in the North and about one in five in the North West
region.
Figure 201: Number of General Practitioners (FTEs) and Practice Nurses, Tasmania 2011
365.1
320
GPs
Practice Nurses
195.5
145
98.4
South
98
North
71.2
77
North West
Tasmania
Tasmania Medicare Local, 2011 Census of Tasmanian General Practices, 2012
During GP Census week 2011, the Southern region had the highest per capita FTE GP workforce at
78.7 GPs per 100 000 population, but the lowest number of practice nurses at 58.5 per 100 000
population.
Table 66: Tasmanian primary health care workforce per 100 000 population by region, 2011
FTE GPs per 100 000
population
Practice nurses per 100 000
population (est)
South
78.7
58.5
North
68.3
68.6
North West
64.2
68.5
Tasmania
72.5
63.6
Tasmania Medicare Local, Primary Health Indicators Tasmania Report, 2012
173
Use of Primary Care Services
Data from the 2009 ABS Health Services: Patient Experiences in Australia survey indicate the proportion
of Tasmanians consulting health professionals is similar to Australia as a whole, with 82.2% of
Tasmanians aged 15 years and over reporting seeing a general practitioner in the preceding 12
months compared to 80.8% of Australians.
Primary health care refers to a broad range of health services most often delivered in communitybased settings and include Community Health Centres and child health services as part of a broad
platform of community services. In 2009, about a fifth of Tasmanian adults were estimated to have
used a Tasmanian Community Health Centre or Child Health Parenting Service.
Table 67: Primary health services accessed in the last 12 months, Tasmanians aged 18 years and over, 2009
%
95% CI
Community Health Centre
20.5
19.3
21.8
Child Health Parenting Service
15.8
14.7
17
Tasmanian Population Health Survey, 2009
Because of the increasing focus on primary care as a way to ensure greater equity in health and
better coordination in the delivery of services, ease of access to primary care services, barriers to
access as well as satisfaction levels with these services are important factors.
Access and Satisfaction Issues
Data from the 2010 ABS General Social Survey show 15.9% of Tasmanian adults experienced problems
accessing general practitioners and 9.1% had difficulties accessing dentists. A very small proportion of
Tasmanians experienced problems accessing disability or mental health services.
Table 68: Difficulty accessing health service by type of service, 18 years and over, Tasmania 2010
%
95% CI
Disability services
1.7
0.8
2.6
Dentists
9.1
6.9
11.3
Doctors
15.9
12.9
18.9
Mental health services
1.1
0.6
1.6
ABS, General Social Survey, Tasmania 2010, Cat. No. 4159.0, Table 42.1
Of the top five barriers to accessing services, almost a quarter of Tasmanian adults in 2010 cited
waiting times and lack of timely appointments, whereas less than 10% cited a problem with service
proximity, lack of services, or cost as barriers to access.
Table 69: Top 5 barriers to accessing services, 18 years and over, Tasmania 2010
Barriers
%
95% CI
Waiting too long/appointment not available at time required
23.5
20.0
27.0
Poor customer service
13.5
11.0
16.0
Inadequate services in area where resides
9.6
7.5
11.7
No services in area
6.5
4.8
8.2
Cost of service
5.9
4.3
7.5
ABS, General Social Survey, Tasmania 2010, Cat. No. 4159.0, Table 42.1
174
The table below shows just under18% of Tasmanians found the waiting time to see a GP was a key
barrier to seeing a GP, but this was also the case for Australians in general. The survey found the
cost of primary care services and travel time were not significant barriers to accessing primary care
services. In 2009, only 4.8% of Tasmanians aged were unable to access, or delayed their access to
care because of financial constraints.
Table 70: GP service barriers, 15 years and over, Tasmania 2009
Tasmania
Australia
Type of barrier
%
95% CI
%
95% CI
Financial barriers
4.8
2.2
7.4
6.3
5.6
7.0
Unacceptable waiting times
17.9
14.2
21.6
17.6
16.2
19.0
Travelled longer than 1 hour
2.2
0.2
4.2
3.0
2.5
3.5
ABS, Health Services: Patient Experiences in Australia, 2009, 4839.0.55.001, Table 2.3
In 2009, most Tasmanian adults who had accessed a Community Health Centre or Child Health
Parenting Service were satisfied with the services provided.
Table 71: Satisfaction with health services used in the last 12 months, 18 years and over, Tasmania 2009
Type of service
Very Satisfied/Satisfied
Neither Satisfied nor
Dissatisfied
Dissatisfied/Very Dissatisfied
Community Health Centre
91.1%
3.7%
4.3%
Child Health Parenting Service
90.6%
2.8%
2.8%
Tasmanian Population Health Survey, 2009
The great majority of Tasmanians, who saw a GP in the 12 months before the survey, reported the
GP listened carefully, showed respect and spent enough time with them.
Table 72: Satisfaction with GP services used in the last 12 months, 15 years and over, Tasmania 2010-11
GP actions
%*
95% CI
Always or often listens carefully
88.6%
87.4
89.8
Always or often showed respect
91.2%
81.2
92.2
Always or often spent enough time
85.7%
84.4
87.0
Report on Government Services, 2012 (based on unpublished Patient Satisfaction Survey data)
175
Appendix 1 – Local Area Data
This appendix details the levels of behavioural health risk factors and a broad range of health
outcomes for residents of each of Tasmania’s local government areas (LGAs). The health risk factor
data, presented are derived from the 2009 Tasmanian Population Health Survey, so data
interpretations below should be read as valid to 2009. The mortality, hospitalisation, cancer
incidence and communicable disease data are the latest available, and each are presented as five-year
averages to improve statistical reliability.
In the following data interpretations, LGA values, grouped by region, are compared with those of the
respective region and Tasmania as a whole. In addition to health risk factors, described for each
LGA, the health outcome interpretations here are limited to broad cause health outcomes (all agestandardised rates, with the exception of communicable disease notification rates) for LGAs where
the respective values are in the top 10 of all LGAs.
Note: not all of the comparisons discussed are statistically significant; for the survey data (where
most of the differences were not statistically significant) this is primarily due to low sample sizes at
the LGA level. Statistically significant comparisons are described as “significant”.
Northern Region Summary
Break O’Day
The risk factor levels and health outcomes were mixed for Break O’Day when compared to the
Northern region, and Tasmania as a whole. In particular, Break O’Day has:
•
more adults who smoke daily (18.6%), drink alcohol at lifetime risky levels (6.3%), are
insufficiently physical activity (31.4%) or have an inadequate daily consumption of fruit (51.%)
and vegetables (92.1%)
•
less adults who consume alcohol at short term risky levels (22.6%)
•
more adults screened in the last two years for high blood cholesterol (59.1%) or diabetes/high
blood sugar levels (58.4%)
•
a significantly higher rate of potentially preventable hospitalisations (27.5 per 1 000 – 5th
highest of all LGAs)
•
a significantly higher rate of potentially avoidable deaths (261.4 per 100 000 – 6th highest of all
LGAs)
•
a higher all-cause mortality rate (772.7 per 100 000 – the 6th highest of all LGAs).
Dorset
Generally, the risk factor levels and health outcomes for Dorset were similar to, or better than, the
Northern Region, and Tasmania as a whole. In particular, Dorset has:
•
more adults who are daily smokers (20.5%), drink alcohol at short term risky levels (29.7%)
•
less adults with an inadequate daily consumption of fruit (44%) and vegetables (81.2%) or are
insufficient physically activity (25.3%)
•
more adults screened in the last two years for high blood pressure (84.1%) and diabetes/high
blood sugar levels (60.1%).
176
Flinders
Generally, the risk factor levels for Flinders were better than for the Northern Region and Tasmania
as a whole, particularly with health screening. With health outcomes there are some areas where
Flinders fares relatively badly. In particular, Flinders has:
•
more adults insufficiently physically active (47.9%) – higher than for the other LGAs
•
more adults screened in the last two years for high blood pressure (100%), high blood
cholesterol (80.4%) and diabetes/high blood sugar levels (95.7%). Again, each of these
percentages were higher than for other LGAs
•
a significantly higher rate of potentially avoidable deaths (500.3 per 100 000), over twice as
high as for the Northern Region or Tasmania as a whole – the highest of all LGAs – reflecting
the remote nature of Flinders Island
•
a higher all-cause mortality rate (962.4 per 100 000 – the highest of all LGAs)
•
a higher notification rate for infectious diseases (980.0 per 100 000 – 3rd highest of all LGAs).
George Town
The risk factor levels for the George Town LGA were mixed when compared to the Northern
Region and Tasmania as a whole. Health outcomes were generally worse. In particular, George
Town has:
•
more adults who are daily smokers (19%) or have an inadequate daily fruit consumption
(55.1%)
•
less adults who have an inadequate daily vegetable intake (85.7%)
•
a significantly higher rate of potentially preventable hospitalisations (28.6 per 1 000 – 4th
highest of all LGAs)
•
a significantly higher rate of potentially avoidable deaths (271.8 per 100 000 – 4th highest of all
LGAs)
•
a significantly higher all-cause mortality rate (940.5 per 100 000 – 4th highest of all LGAs)
•
a higher all-cause cancer rate (571.2 per 100 000 – 4th highest of all LGAs).
Launceston
Generally, the risk factor levels and health outcomes for the Launceston LGA were similar to the
Northern Region and Tasmania as a whole. There were two main exceptions. In particular, the
Launceston LGA has:
•
higher proportions of adults insufficiently physically active (29.2%) or drinking alcohol at short
term risky levels (29.2%)
•
a higher mortality rate (729.9 per 100 000 – 10th highest of all LGAs)
•
a significantly higher all-cause hospitalisation rate (331.8 per 100 000 – 7th highest of all LGAs)
•
a significantly higher notification rate for infectious diseases (949.4 per 100 000 – 6th highest
of all LGAs).
Meander Valley
The risk factor levels and health outcomes for the Meander Valley were generally similar to, or
better than, the Northern Region and Tasmania as a whole. In particular, Meander Valley has:
•
less adults likely to be insufficiently physically inactive (24.2%) or to drink alcohol at short
term (20.1%) or lifetime (3.8%) risky levels.
177
Northern Midlands
The risk factor levels for the Northern Midlands were mixed when compared to the Northern
Region and Tasmania as a whole. Health outcomes were similar or better. In particular, the
Northern Midlands has:
•
more adults insufficiently physically inactive (31.7%) or who drink alcohol at short term
(30.4%) or lifetime (7.8%) risky levels
•
less adults with an inadequate daily vegetable consumption (85.2%)
•
more adults screened for diabetes/high blood sugar levels in the last two years (59.2%)
•
less adults screened for high blood pressure (84.9%) or high blood cholesterol (49.3%) in the
last two years.
West Tamar
The risk factor levels for West Tamar were mixed when compared to the Northern Region and
Tasmania as a whole. Health outcomes were similar or better. In particular, West Tamar has:
•
more adults who drink alcohol at short term risky levels (31.3%)
•
less adults insufficiently physically active (24.3%) or are daily smokers (11.4%).
Southern Region Summary
Brighton
Generally, the risk factor levels and health outcomes for the Brighton LGA were worse when
compared to the Southern Region and Tasmania as a whole. In particular, the Brighton LGA has:
•
more adults who are daily smokers (20.3%), insufficiently physically active (30.5%) or who
drink alcohol at short term risky levels (35.1%)
•
less adults with an inadequate daily vegetable intake (85.2%)
•
less adults screened for high blood cholesterol in the last two years (43.2%)
•
a significantly higher rate of potentially avoidable mortality (272.7 per 100 000 – 3rd highest of
all LGAs)
•
a significantly higher all-cause mortality rate (952.2 per 100 000 – 3rd highest of all LGAs)
•
a significantly higher rate of potentially preventable hospitalisations (27.3 per 1 000 – 6th
highest of all LGAs)
•
a significantly higher all-cause hospitalisation rate (349.0 per 100 000 – 3rd highest of all LGAs)
•
a higher all-cause cancer incidence rate (567.8 per 100 000 – 5th highest of all LGAs)
•
a higher notification rate for infectious diseases (881 per 100 000 – 8th highest of all LGAs).
Higher than the Tasmanian rate, but not the respective rate for the Southern region.
178
Central Highlands
The risk factor levels and health outcomes for the Central Highlands were mixed when compared to
the Southern Region and Tasmania as a whole. In particular, the Central Highlands has:
•
less adults who drink alcohol at short term risky levels (21.8%)
•
more adults with an inadequate daily fruit (88.8%) or vegetable (100%) intake
•
less adults screened for high blood pressure (47.8%) or diabetes/high blood sugar levels
(37.4%) in the last two years
•
a higher all-cause cancer rate (571.7 per 100 000 – 3rd highest of all LGAs).
Clarence
Generally, the risk factor levels for the Clarence LGA were similar to, or better than the Southern
Region and Tasmania as a whole. Health outcomes were mixed. In particular, the Clarence LGA has:
•
less adults who are daily smokers (13.8%), drink alcohol at lifetime risky levels (3.4%) or with
an inadequate daily consumption of fruit (44.2%)
•
a significantly higher all-cause hospitalisation rate (353.3 per 1 000 – 2nd highest of all LGAs)
•
a higher all-cause cancer incidence rate (536.4 per 100 000 – 9th highest of all LGAs)
•
a higher all-cause notifiable disease notification rate (960.2 per 100 000 – 5th highest of all
LGAs).
Derwent Valley
Generally, the risk factor levels and health outcomes for the Derwent Valley were worse than for
the Southern Region and Tasmania as a whole. In particular, the Derwent Valley has:
•
more adults who are daily smokers (19.8%), drink alcohol at lifetime risky levels (10.2%) are
insufficiently physically active (31.3%) or have an inadequate daily intake of fruit (62.8%) and
vegetables (92.5%)
•
less adults who drink alcohol at short term risky levels (22.2%)
•
more adults screened for high blood pressure (88%) or diabetes/high blood sugar levels
(66.5%) in the last two years
•
a significantly higher rate of potentially avoidable mortality (257.2 per 100 000 – 7th highest of
all LGAs)
•
a significantly higher all-cause mortality rate (845.4 per 100 000 – 5th highest of all LGAs)
•
a significantly higher rate of potentially preventable hospitalisations (26 per 1 000 – 8th highest
of all LGAs)
•
a higher all-cause notifiable disease notification rate (898.8 per 100 000 – 7th highest LGA).
Glamorgan/Spring Bay
The risk factor levels for Glamorgan/Spring Bay were mixed when compared to the Southern Region
and Tasmania as a whole. Health outcomes were similar or better. In particular, the
Glamorgan/Spring Bay LGA has:
•
less adults who drink alcohol at short term risky levels (24.2%) or with an inadequate daily
vegetable intake (85.9%)
•
more adults insufficiently physically active (30.7%) or with an inadequate daily fruit intake
(56.4%)
•
more adults screened for high blood pressure in the last two years (85%)
•
significantly higher proportions of adults screened for high blood cholesterol (76.3%) or
diabetes/high blood sugar levels (72.7%) in the last two years.
179
Glenorchy
Generally, despite the lower socio-economic status of the Glenorchy LGA, the risk factor levels
were mixed when compared to the Southern Region and Tasmania as a whole. The health
outcomes, however, were generally worse. In particular, the Glenorchy LGA has:
•
more adults who are daily smokers (21.2%) or who drink alcohol at lifetime risky levels (7.5%)
•
more adults screened for high blood pressure in the last two years (83.2%), but less screened
for high blood cholesterol (48.6%)
•
a significantly higher potentially avoidable mortality rate (248.2 per 100 000 – 9th highest of all
LGAs)
•
a significantly higher all-cause mortality rate (755.2 per 100 000 – 7th highest of all LGAs)
•
a significantly higher potentially preventable hospitalisation rate (26.6 per 1 000 – 7th highest
of all LGAs)
•
a significantly higher all-cause hospitalisation rate (366.7 per 1 000 – the highest of all LGAs)
•
a higher all-cause cancer incidence rate (546.8 per 100 000 – 7th highest of all LGAs)
•
a higher all-cause notifiable disease notification rate (973.5 per 100 000 – 4th highest of all
LGAs).
Hobart
The risk factor levels and health outcomes for the Hobart LGA were mixed when compared to the
Southern Region and Tasmania as a whole. In particular, the Hobart LGA has:
•
less adults who are daily smokers (11.7%), insufficiently physically inactive (23.7%) or with an
inadequate daily fruit consumption (45.6%)
•
less adults screened for high blood pressure (75.5%) or high blood cholesterol (48.6%) in the
last two years
•
much less adults screened for diabetes/high blood sugar levels (41.1%) in the last two years
•
a significantly higher all-cause hospitalisation rate (337.6 per 1 000 – the 5th highest of all
LGAs). (Only significant when compared to the Tasmanian rate
•
a higher all-cause notifiable disease notification rate (1 105.3 per 100 000 – the highest LGA).
Huon Valley
The risk factor levels for the Huon Valley were mixed when compared to the Southern Region and
Tasmania as a whole. Health outcomes were similar or better. In particular, the Huon Valley has:
•
less adults who drink alcohol at short term risky levels (21.8%) or inadequately physically
active (23.9%)
•
more adults who drink alcohol at lifetime risky levels (8.2%)
•
more adults screened for high blood pressure (86%), high blood cholesterol (55.4%) or
diabetes/high blood sugar levels (53.4%) in the last two years.
Kingborough
Generally, the risk factor levels for Kingborough were similar to, or better than, the Southern
Region and Tasmania as a whole. Health outcomes were mixed. In particular, Kingborough has:
•
less adults who are daily smokers (9.9%), who drink alcohol at short term risky levels (24.5%)
or have an inadequate daily fruit intake (44.4%)
•
a significantly higher all-cause hospitalisation rate (329.7 per 1 000 – 8th highest of all LGAs).
Only significant when compared to the Tasmanian rate
•
a higher all-cause cancer incidence rate (537.8 per 100 000 – 8th highest of all LGAs).
180
Sorell
The risk factor levels were generally worse for the Sorell LGA when compared to the Southern
region and Tasmania as a whole. Health outcomes were more mixed. In particular, the Sorell LGA
has:
•
less adults who are daily smokers (14.5%)
•
more adults who drink alcohol at short term (28%) and lifetime risky levels (8.2%), are
insufficiently physically active (35.4% – 2nd highest of all LGAs) or with an inadequate daily
fruit intake (65.5% - 2nd highest of all LGAs)
•
more adults screened for high blood cholesterol (56.5%) in the last two years
•
a higher all-cause cancer incidence rate (579.2 per 100 000 – 2nd highest of all LGAs)
•
a higher all-cause hospitalisation rate (342.7 per 1 000 – 4th highest of all LGAs).
Southern Midlands
The risk factor profile and health outcomes of adults in the Southern Midlands were mixed when
compared to the Southern Region and Tasmania as a whole. In particular, the Southern Midlands has:
•
more adults who are daily smokers (29.7% - highest of all LGAs) and who eat inadequate daily
amounts of fruit (64.2%) and vegetables (94.2%)
•
less adults who drink alcohol at short term risky levels (18.2%)
•
more adults screened for high blood cholesterol (86.8%), high blood cholesterol (65.9%) or
diabetes/high blood sugar levels (64.9%) in the last two years
•
a higher rate of potentially avoidable deaths (248.8 per 100 000 – 8th highest of all LGAs)
•
a higher all-cause mortality rate (739.9 per 100,00 – 9th highest of all LGAs)
•
a higher cancer incidence rate (619.6 per 100 000 – the highest of all LGAs).
Tasman
The risk factor levels and health outcomes for the Tasman LGA were mixed when compared to the
Southern Region and Tasmania as a whole. In particular, the Tasman LGA has:
•
less adults who drink alcohol at short term risky levels (19.5%) or with an inadequate daily
vegetable intake (81.8%)
•
more adults with an inadequate daily fruit intake (53.6%) or who are daily smokers (20.5%)
•
more adults screened for high blood pressure in the last two years (67.9%)
•
a higher rate of potentially avoidable deaths (268 per 100 000 – 5th highest of all LGAs).
North West Region Summary
Burnie
The risk factor levels and health outcomes for the Burnie LGA were mixed when compared to the
North West Region and Tasmania as a whole. In particular, the Burnie LGA has:
•
more adults who are daily smokers (21.3%) or who drink alcohol at short term (29.8%) and
lifetime (9% – second highest of all LGAs) risky levels
•
more adults screened for high blood cholesterol in the last two years (55.1%)
•
a significantly higher rate of potentially preventable hospitalisations (24.5 per 1 000 – 10th
highest of all LGAs). Significant only when compared to the Tasmanian rate
•
a significantly higher all-cause hospitalisation rate (335.9 per 1 000 – 6th highest of all LGAs).
181
Central Coast
The risk factor levels for the Central Coast were mixed when compared to the North West Region
and Tasmania as a whole. Health outcomes were similar or better. In particular, the Central Coast
has:
•
more adults who drink alcohol at lifetime (27.9%) risky levels or are insufficiently physically
active (28.5%)
•
less adults who are daily smokers (14.1%) or have inadequate daily intakes of fruit (47.1%) and
vegetables (88.2%)
•
more adults screened for high blood pressure in the last two years (84.2%).
Circular Head
The risk factor levels and health outcomes for Circular Head were mixed when compared to the
North West Region and Tasmania as a whole. In particular, the Circular Head LGA has:
•
more adults who are daily smokers (20.3%)
•
less adults with an inadequate daily vegetable intake (85.5%)
•
less adults screened for high blood cholesterol (44.9%) or diabetes/high blood sugar levels
(43.9%) in the last two years
•
a significantly higher rate of potentially preventable hospitalisations (29.1 per 1 000 – 3rd
highest of all LGAs)
•
a higher rate of potentially avoidable deaths (238.2 per 100 000 – 10th highest of all LGAs)
•
a higher notifiable disease notification rate (847.7 per 100 000 – 9th highest of all LGAs).
Devonport
In general, with the sole exception of physical activity, the levels of health risk factors were generally
higher for Devonport residents than for the North West region or Tasmania as a whole. Health
outcomes were more mixed. In particular, the Devonport LGA has:
•
more adults who are daily smokers (18%), who drink alcohol at short term risky levels
(28.9%) or with inadequate daily intakes of fruit (54.9%) and vegetables (91.9%)
•
less adults insufficiently physically active (25.4%)
•
a higher rate of potentially preventable hospitalisations (25 per 1 000 – 9th highest of all
LGAs).
Kentish
Generally, the health risk factor levels were lower for the Kentish LGA when compared to the
North West Region or Tasmania as a whole. Health outcomes were mixed. In particular, the
Kentish LGA has:
•
less adults insufficiently physically active (26%), daily smokers (12.7%), or who drink alcohol at
short term risky levels (20.2%)
•
more adults with an inadequate daily intake of vegetables (94.5%)
•
more adults screened for high blood cholesterol (58.5%) or diabetes/high blood sugar levels
(54.6%) in the last two years
•
a higher all-cause mortality rate (754.7 per 100 000 – 8th highest of all LGAs).
182
King Island
Generally, the health risk factor levels were lower for King Island, when compared to the North
West Region and Tasmania as a whole. Health outcomes were mixed. In particular, King Island has:
•
less adults insufficiently physically active (21.6%), have an inadequate daily vegetable intake
(79.2%) or drink alcohol at short term risky levels (15.7%)
•
more adults with an inadequate daily intake of fruit (55.1%)
•
more adults screened for high blood pressure (91.9%), high blood cholesterol (68.7%) or
diabetes/high blood sugar levels (68.6%) in the last two years
•
a significantly higher rate of potentially preventable hospitalisations (32.2 per 1 000 – 2nd
highest of all LGAs)
•
a higher all-cause cancer incidence rate (536.4 per 100 000 – 10th highest of all LGAs)
•
a higher all-cause notifiable disease notification rate (1 010.5 per 100 000 – 2nd highest of all
LGAs).
Latrobe
Generally, the health risk factor levels were lower for the Latrobe LGA, when compared to the
North West Region and Tasmania as a whole. Health outcomes were similar or better. In particular,
the Latrobe LGA has:
•
more adults insufficiently physically active (29.3%) or with an inadequate daily fruit intake
(55.6%)
•
less adults with an inadequate daily vegetable intake (87.8%), are daily smokers (16.2%) or
drink alcohol at short term (21.5%) or lifetime (4.8%) risky levels
•
more adults screened for high blood pressure (83.1%), high blood cholesterol (63.5%) or
diabetes/high blood sugar levels (59.9%) in the last two years.
Waratah/Wynyard
Generally, the health risk factor levels for Waratah/Wynyard were mixed when compared to the
North West Region and Tasmania as a whole. Health outcomes were generally similar or better. In
particular, the Waratah/Wynyard LGA has:
•
less adults who drink alcohol at short term (23.8%) and lifetime (5%) risky levels
•
more adults insufficiently physically active (32.1%)
•
more adults screened for high blood cholesterol (60.4%) or diabetes/high blood sugar levels
(55%) in the last two years.
West Coast
Generally, the risk factor levels and health outcomes were worse for the West Coast than for the
North West Region and Tasmania as a whole. In particular, the West Coast has:
•
more adults who drink alcohol at short term risky levels (34.7%), are daily smokers (22.3%) or
have inadequate daily intakes of fruit (62.6%) and vegetables (95.8%)
•
more adults screened for high blood cholesterol (65.1%) or diabetes/high blood sugar levels
(52.1%) in the last two years
•
Significantly higher rates of potentially preventable hospitalisations (33.2 per 1 000 - highest of
all the LGAs) and potentially avoidable deaths (298.1 per 100 000 - second only to Flinders),
reflecting the remoteness of the West Coast
•
a higher all-cause cancer rate (562.3 per 100 000 – 6th highest of all LGAs)
•
a significantly higher all-cause mortality rate (952.5 per 100 000 – 2nd highest of all LGAs).
183
Risk Factor Prevalence
Table 73: Risk Factor Prevalence 2009
LGA
Daily
smoker %
95% CI
Exceeding single
occasion alcohol
risk (2009
95% CI
guidelines) %
Exceeding
lifetime alcohol
risk 2009
95% CI
guidelines %
Break O'Day
18.6
[11.8,27.9]
22.6
[14.8,32.9]
6.3
[3.2,12.1]
Dorset
20.5
[12.9,31.1]
29.7
[19.7,42.2]
n/a
---
Flinders
n/a
---
n/a
---
n/a
---
George Town
19.0
[11.8,29.0]
27.4
[18.0,39.4]
n/a
---
Launceston
17.2
[14.4,20.4]
29.2
[25.6,33.1]
5.5
[3.9,7.5]
Meander Valley
17.2
[12.5,23.2]
20.1
[14.7,26.8]
3.8
[1.9,7.5]
Northern Midlands
16.7
[11.5,23.6]
30.4
[22.4,39.7]
7.8
[4.4,13.4]
West Tamar
11.4
[7.9,16.1]
31.3
[25.6,37.5]
5.6
[3.3,9.1]
Brighton
20.3
[12.9,30.3]
35.1
[24.0,48.0]
n/a
---
Central Highlands
n/a
---
21.8
---
n/a
---
Clarence
13.8
[10.4,18.2]
26.7
[21.7,32.4]
3.4
[2.0,5.6]
Derwent Valley
19.8
[10.2,34.9]
22.2
[11.8,37.8]
10.2
[3.7,24.8]
Glamorgan/Spring Bay
17.1
[8.0,32.8]
24.2
[13.6,39.3]
n/a
---
Glenorchy
21.2
[16.1,27.4]
25.6
[19.8,32.3]
7.5
[4.4,12.4]
Hobart
11.7
[7.6,17.6]
26.2
[20.6,32.6]
5.7
[3.8,8.5]
Huon Valley
16.6
[10.8,24.6]
21.8
[15.0,30.6]
8.2
[4.4,14.6]
Kingborough
9.9
[6.7,14.3]
24.5
[18.8,31.2]
5.5
[3.2,9.3]
Sorell
14.5
[8.1,24.5]
28.0
[17.8,41.2]
8.2
[3.3,18.8]
Southern Midlands
29.7
[18.8,43.5]
18.2
[9.9,31.1]
n/a
---
Tasman
20.5
[7.2,46.1]
19.5
[7.7,41.5]
n/a
---
Burnie
21.3
[16.4,27.1]
29.8
[24.1,36.2]
9.0
[5.4,14.7]
Central Coast
14.1
[10.4,19.0]
27.9
[22.2,34.4]
4.7
[3.0,7.4]
Circular Head
20.3
[13.5,29.3]
27.8
[18.9,38.9]
n/a
---
Devonport
18.0
[13.9,23.1]
28.9
[23.9,34.6]
6.4
[3.7,10.7]
Kentish
12.7
[5.8,25.6]
20.2
[10.2,36.0]
6.3
[2.7,14.2]
King Island
n/a
---
15.7
[6.0,35.2]
0.0
---
Latrobe
16.2
[10.7,23.8]
21.5
[14.3,30.9]
4.8
[2.2,10.2]
Waratah/Wynyard
16.8
[12.0,23.1]
23.8
[18.0,30.7]
5.0
[2.7,9.3]
West Coast
22.3
[13.8,34.1]
34.7
[22.9,48.8]
n/a
---
Southern region
15.5
[13.6,17.5]
25.6
[23.4,28]
6
[4.9,7.3]
Northern region
16.4
[14.5,18.3]
28.1
[25.8,30.4]
5.5
[4.5,6.8]
North-West region
17.4
[15.4,19.5]
27.2
[24.8,29.6]
6
[4.8,7.6]
Tasmania
16.2
[15.0,17.4]
26.7
[25.3,28.2]
5.8
[5.1,6.6]
Source: Tasmanian Population Health Survey 2009
Relative standard error higher than 25%, use with caution
n/a = data not available, relative standard error higher than 50%
* 2009 NHMRC Alcohol Guidelines: short term harm = >4 drinks on any occasion, long term harm = >2 drinks daily
184
Risk Factor Prevalence 2009
LGA
Insufficient
physical
activity % 95% CI
Inadequate fruit
consumption <2
serves daily % 95% CI
Inadequate
vegetable
consumption <5
serves daily %
95% CI
Break O'Day
31.4
[22.9,41.4]
51.7
[41.2,62.1]
92.1
[85.5,95.9]
Dorset
25.3
[17.7,34.8]
44.0
[33.5,55.1]
81.2
[72.4,87.6]
Flinders
47.9
[15.7,81.9]
n/a
---
100.0
---
George Town
28.0
[19.9,37.9]
55.1
[44.2,65.4]
85.7
[76.0,91.8]
Launceston
29.2
[26.0,32.7]
49.5
[45.6,53.4]
90.0
[87.7,91.9]
Meander Valley
24.2
[19.2,30.0]
49.7
[42.9,56.5]
90.4
[86.6,93.2]
Northern Midlands
31.7
[24.6,39.7]
52.5
[44.1,60.8]
85.2
[79.0,89.9]
West Tamar
24.3
[19.7,29.5]
51.5
[45.5,57.5]
88.9
[85.0,91.9]
Brighton
30.5
[21.4,41.3]
51.4
[39.5,63.1]
85.2
[74.4,92.0]
Central Highlands
n/a
---
88.8
[59.0,97.8]
100.0
---
Clarence
28.3
[23.6,33.6]
44.2
[38.8,49.7]
88.8
[85.0,91.8]
Derwent Valley
31.3
[19.4,46.3]
62.8
[47.9,75.5]
92.5
[82.5,97.0]
Glamorgan/Spring Bay
30.7
[19.2,45.2]
56.4
[42.4,69.5]
85.9
[71.3,93.8]
Glenorchy
27.5
[22.2,33.6]
50.1
[43.6,56.6]
88.2
[83.6,91.7]
Hobart
23.7
[18.3,30.1]
45.6
[39.2,52.1]
90.7
[87.0,93.4]
Huon Valley
23.9
[17.4,31.7]
49.6
[40.7,58.6]
87.7
[81.9,91.8]
Kingborough
27.7
[22.5,33.7]
44.4
[38.0,51.0]
87.8
[83.3,91.2]
Sorell
35.4
[24.9,47.4]
65.5
[53.5,75.8]
88.1
[80.5,93.0]
Southern Midlands
28.0
[18.4,40.1]
64.2
[50.7,75.8]
94.2
[85.4,97.8]
Tasman
n/a
---
53.6
[30.9,74.9]
81.8
[60.0,93.1]
Burnie
27.2
[22.5,32.4]
52.4
[46.4,58.4]
89.2
[85.5,92.0]
Central Coast
28.5
[23.8,33.7]
47.1
[41.2,53.2]
88.2
[84.3,91.2]
Circular Head
27.7
[19.5,37.7]
52.7
[42.6,62.6]
85.5
[77.2,91.1]
Devonport
25.4
[21.0,30.3]
54.9
[49.5,60.2]
91.9
[88.9,94.2]
Kentish
26.0
[16.3,38.9]
51.6
[39.0,64.0]
94.5
[87.3,97.7]
King Island
21.6
[10.7,38.7]
55.1
[37.9,71.2]
79.2
[60.6,90.4]
Latrobe
29.3
[21.8,38.1]
55.6
[46.7,64.1]
87.8
[80.5,92.6]
Waratah/Wynyard
32.1
[26.0,38.8]
49.9
[43.2,56.6]
90.0
[85.9,93.0]
West Coast
27.3
[17.9,39.5]
62.6
[49.7,74.0]
95.8
[89.9,98.3]
Southern region
27.2
[25,29.6]
49.2
[46.6,51.8]
88.9
[87.3,90.3]
Northern region
27.8
[25.7,29.0]`
50.3
[47.7,52.8]
88.8
[87.3,90.1]
North-West region
27.7
[25.6,30]
52.3
[49.7,54.8]
89.8
[88.3,91.1]
Tasmania
27.5
[26.1,28.9]
50.2
[48.6,51.7]
89.0
[88.1,89.9]
Source: Tasmanian Population Health Survey 2009
Relative standard error higher than 25%, use with caution
n/a = data not available, relative standard error higher than 50%
185
Health Screening Prevalence
Table 74: Health Screening Prevalence 2009
LGA
Blood
pressure
check last 2
years %
95% CI
Break O'Day
81.4
[68.6,89.8]
Dorset
84.1
[72.8,91.3]
Flinders
100
George Town
79.4
Launceston
Blood
cholesterol
check last 2
years %
95% CI
Diabetes/high
blood sugar
levels check last
2 years %
95% CI
59.1
[47.8,69.5]
58.4
[47.9,68.2]
56.1
[44.8,66.8]
60.1
[48.4,70.7]
80.4
[32.4,97.2]
95.7
[72.5,99.5]
[68.1,87.4]
58.5
[47.1,69.0]
48.5
[37.9,59.2]
78.8
[75.1,82.1]
49.9
[46.2,53.5]
48.5
[44.7,52.2]
Meander Valley
79.4
[72.5,84.9]
57
[50.1,63.6]
52.3
[45.5,59.0]
Northern Midlands
84.9
[77.5,90.2]
49.3
[41.0,57.6]
59.2
[50.8,67.1]
West Tamar
83.1
[77.9,87.2]
52.4
[46.4,58.3]
50.7
[44.7,56.7]
Brighton
76.6
[64.6,85.4]
43.2
[32.4,54.7]
50.8
[39.0,62.6]
Central Highlands
47.8
[16.6,80.9]
n-a
-----
37.4
[11.5,73.4]
Clarence
83.8
[78.6,87.9]
55.3
[49.8,60.7]
50.4
[45.0,55.8]
Derwent Valley
88
[74.5,94.8]
55.6
[40.3,69.9]
66.5
[51.3,79.0]
Glamorgan-Spring Bay
85
[72.7,92.3]
76.3
[61.9,86.5]
72.7
[58.2,83.5]
Glenorchy
83.2
[76.8,88.2]
48.6
[42.4,54.9]
51.2
[44.7,57.6]
Hobart
75.5
[68.4,81.4]
48.6
[42.4,54.8]
41.1
[35.4,47.2]
Huon Valley
81
[72.9,87.1]
44.7
[36.2,53.5]
43.4
[34.9,52.3]
Kingborough
86
[80.2,90.3]
55.4
[48.8,61.8]
53.4
[46.8,59.8]
Sorell
82.2
[68.9,90.5]
56.5
[44.4,67.9]
49.6
[38.1,61.1]
Southern Midlands
86.8
[75.4,93.4]
65.9
[52.4,77.3]
64.9
[51.4,76.3]
Tasman
67.9
[40.3,86.9]
55.2
[31.7,76.6]
49.9
[28.0,71.8]
Burnie
82.2
[76.3,87.0]
55.1
[49.1,61.0]
49.1
[43.3,55.0]
Central Coast
84.2
[78.4,88.7]
54.5
[48.5,60.4]
48.9
[43.1,54.7]
Circular Head
81.1
[71.6,88.0]
44.9
[35.3,54.9]
43.9
[34.3,53.9]
Devonport
82.2
[76.8,86.6]
55.9
[50.4,61.2]
51.3
[46.0,56.5]
Kentish
78.8
[63.0,89.0]
58.5
[45.2,70.7]
54.6
[41.5,67.0]
King Island
91.9
[71.9,98.1]
68.7
[49.7,83.0]
68.6
[50.1,82.6]
Latrobe
83.1
[74.4,89.2]
63.5
[54.0,72.0]
59.9
[50.6,68.5]
Waratah/Wynyard
81.9
[74.7,87.4]
60.4
[53.5,67.0]
55
[48.2,61.6]
West Coast
81.4
[67.0,90.5]
65.1
[50.5,77.3]
52.1
[38.9,65.0]
Southern region
80.8
[78.7,82.8]
52.6
[50.4,54.8]
51.8
[49.4,54.1]
Northern region
82.5
[80.3,84.6]
56.5
(54.2,58.8)
50.7
[49,53.7]
North-West region
81.5
[79.2,83.6]
52
[49.7,54.3]
49.8
[47.5,52.2]
Tasmania
81.5
[80.2,82.8]
53.2
[51.8,54.6]
50.7
[49.3,52.2]
Source: Tasmanian Population Health Survey 2009
Relative standard error higher than 25%, use with caution
n/a = data not available, relative standard error higher than 50%,
186
Disability Prevalence
Table 53: Core Activity Restrictions Requiring Assistance 2011
LGA
People with core
activity restrictions
requiring assistance %
Number
Break O'Day
8.2%
505
Dorset
5.9%
407
Flinders
4.5%
35
George Town
7.0%
462
Launceston
5.9%
1 108
Meander Valley
5.6%
680
Northern Midlands
4.9%
1 077
West Tamar
8.2%
505
Brighton
6.2%
987
Central Highlands
7.2%
162
Clarence
5.3%
2 750
Derwent Valley
6.8%
661
Glamorgan/Spring Bay
6.5%
273
Glenorchy
6.9%
3 095
Hobart
4.4%
2 138
Huon Valley
6.3%
955
Kingborough
4.3%
1 444
Sorell
5.9%
778
Southern Midlands
7.1%
431
Tasman
9.1%
214
Burnie
6.1%
1 182
Central Coast
5.8%
1 248
Circular Head
4.4%
350
Devonport
6.8%
1 686
Kentish
5.7%
347
King Island
3.8%
60
Latrobe
7.0%
298
Waratah/Wynyard
7.2%
991
West Coast
5.4%
254
5.8%
28 726
Southern region
Northern region
North-West region
Tasmania
Source: ABS, Census 2011
187
Mortality Rates
Table 54: Age-Standardised Mortality Rates (ASR) by LGA, 2003-07
All-cause
Cancer (all types)
Ischaemic heart
disease
Stroke
LGA
ASR
95% CI
ASR
95% CI
ASR
95% CI
ASR
95% CI
Break O’Day (M)
772.7
686.9-858.5
197.9
155.0-240.8
146.3
109.3-183.3
68.3
41.8-94.7
Brighton (M)
952.2
859.5-1,044.9
297.6
244.6-350.6
179.6
136.5-222.8
48.3
25.8-70.8
Burnie (C)
721.9
671.9-771.9
204.2
177.2-231.2
119.5
98.5-140.5
45.8
32.7-58.8
Central Coast (M)
654.5
612.9-696.1
191.3
168.1-214.4
106.9
90.0-123.8
63.7
50.8-76.7
Central Highlands (M)
705.3
553.0-857.6
163.6
94.5-232.6
128.2
61.5-194.9
*
*
Circular Head (M)
685.1
605.4-764.7
210.2
165.2-255.1
110.2
77.3-143.1
27.4
11.2-43.5
Clarence (C)
647.5
620.0-675.1
203.8
187.9-219.6
112.4
100.9-124.0
42.4
35.4-49.4
Derwent Valley (M)
845.4
763.8-927.0
205.3
164.7-245.9
139.2
104.8-173.5
74.8
49.5-100.1
Devonport (C)
631.1
593.2-669.0
196.4
174.8-218.1
99.8
84.7-114.9
45.8
35.8-55.7
Dorset (M)
709.8
634.8-784.7
168.0
131.3-204.6
126.5
94.7-158.4
37.5
20.2-54.7
Flinders (M)
962.4
699.7-1,225.0
234.9
108.0-361.8
137.6
43.4-231.7
115.9
23.8-208.1
George Town (M)
940.5
836.2-1,044.8
273.2
216.9-329.5
184.3
135.1-233.6
52.5
25.0-79.9
Glamorgan/Spring Bay (M)
602.9
517.4-688.3
166.2
121.2-211.2
70.3
42.7-97.9
47.5
24.2-70.9
Glenorchy (C)
755.2
724.1-786.3
218.7
201.5-236.0
134.7
121.6-147.7
51.1
43.0-59.2
Hobart
671.5
642.7-700.3
184.9
168.8-201.0
116.7
104.7-128.6
52.0
44.1-60.0
Huon Valley (M)
696.6
636.0-757.3
199.6
166.9-232.3
129.1
102.0-156.2
39.7
24.6-54.7
Kentish (M)
754.7
648.6-860.8
235.6
177.5-293.8
123.0
79.1-166.8
44.9
16.6-73.1
King Island (M)
694.0
531.4-856.6
222.5
130.2-314.8
87.2
26.1-148.3
*
*
Kingborough (M)
650.8
613.3-688.4
212.2
190.1-234.3
105.2
89.8-120.6
42.3
32.4-52.2
Latrobe (M)
596.4
530.8-662.0
199.6
161.7-237.5
124.4
94.3-154.5
27.6
13.2-42.0
Launceston (C)
729.9
703.7-756.0
214.4
199.5-229.3
125.2
114.3-136.0
47.3
40.8-53.8
Meander Valley (M)
611.6
565.2-658.0
188.7
162.5-214.9
112.8
92.6-133.0
39.8
27.7-51.9
Northern Midlands (M)
704.8
642.4-767.2
216.5
181.7-251.3
109.7
84.6-134.7
44.2
28.1-60.3
Sorell (M)
634.9
571.6-698.1
217.2
180.4-254.1
84.3
60.6-108.0
32.7
17.5-47.8
Southern Midlands (M)
739.9
637.3-842.4
267.2
204.9-329.5
114.3
73.3-155.3
27.1
6.8-47.5
Tasman (M)
700.5
562.9-838.2
185.7
117.8-253.7
153.4
88.5-218.3
50.5
13.4-87.6
Waratah/Wynyard (M)
726.8
669.9-783.7
238.1
205.1-271.2
102.2
80.6-123.8
46.0
31.6-60.3
West Coast (M)
952.5
817.7-1,087.3
269.4
195.4-343.4
172.4
113.5-231.2
36.6
10.3-63.0
West Tamar (M)
638.7
594.3-683.1
182.0
158.1-206.0
104.5
86.2-122.9
42.1
30.3-53.9
Southern region
695.1
681.5-708.6
207.3
199.7-214.9
119.6
114.0-125.3
47.0
43.4-50.6
Northern region
705.5
687.7-723.2
204.2
194.3-214.1
122.9
115.4-130.4
46.7
42.1-51.3
North-West region
680.4
660.6-700.2
207.0
195.9-218.1
110.2
102.2-118.3
46.9
41.7-52.2
Tasmania
694.9
685.4-704.4
206.4
201.1-211.7
118.6
114.6-122.5
46.9
44.4-49.4
Note: ASR are standardised with the Australian 2001 population and expressed per 100 000 population
* denotes less than 5 cases. Exact numbers withheld for confidentiality purposes
Source: ABS Mortality Database.
188
Potentially Avoidable Mortality
Table 75: Age-Standardised Rates for Potentially Avoidable Mortality by LGA, Tas
2003-07
LGA
ASR
95% CI
Break O’Day
261.4
206.7-316.0
Brighton
272.7
226.2-319.1
Burnie
199.0
171.3-226.7
Central Coast
170.0
146.1-193.7
Central Highlands
160.8
93.56-227.9
Circular Head
238.2
188.8-287.5
Clarence
184.4
167.9-200.8
Derwent Valley
257.2
211.7-302.5
Devonport
192.6
168.9-216.2
Dorset
199.2
153.9-244.4
Flinders
500.3
288.4-712.1
George Town
271.8
216.5-327.1
Glamorgan/Spring Bay
177.5
125.5-229.4
Glenorchy
248.2
227.8-268.6
Hobart
161.7
145.0-178.4
Huon Valley
175.9
145.5-206.3
Kentish
229.0
171.3-286.6
King Island
223.4
120.4-326.3
Kingborough
156.2
136.2-176.2
Latrobe
176.3
138.6-213.9
Launceston
204.4
188.5-220.3
Meander Valley
148.5
124.0-172.8
North Midlands
187.6
153.7-221.5
Sorell
225.9
187.5-264.1
Southern Midlands
248.8
190.1-307.4
Tasman
268.0
175.0-360.9
Waratah/Wynyard
198.9
165.9-231.8
West Coast
298.1
231.0-365.1
West Tamar
151.8
128.4-175.0
Southern Region
198.5
190.5-206.5
Northern region
193.2
182.8-203.4
North-West region
198.9
187.3-210.5
Tasmania
197.1
191.5-202.6
189
Hospitalisations
Table 56: Age-Standardised Hospitalisation Rates (ASR) by LGA, 2007-11
All-cause
Cancer (all types)
Cardiovascular dis
Injury & poisoning
LGA
ASR
95% CI
ASR
95% CI
ASR
95% CI
ASR
95% CI
Break O’Day (M)
311.2
306.1-316.3
17.1
15.8-18.3
20.2
18.9-21.5
28.6
26.6-30.7
Brighton (M)
349.0
346.1-351.9
23.2
21.9-24.4
21.8
20.6-23.0
23.2
22.1-24.4
Burnie (C)
335.9
333.1-338.6
18.8
18.0-19.6
19.1
18.3-19.9
19.5
18.6-20.4
Central Coast (M)
288.3
285.8-290.8
17.8
17.0-18.5
18.7
18.0-19.4
16.2
15.5-17.0
Central Highlands (M)
259.6
251.9-267.3
15.0
12.9-17.0
16.9
14.6-19.1
18.6
16.0-21.2
Circular Head (M)
300.5
296.5-304.5
19.6
18.3-20.9
22.2
20.9-23.6
18.8
17.5-20.1
Clarence (C)
353.3
351.7-355.0
22.8
22.3-23.4
17.1
16.7-17.6
22.2
21.6-22.7
Derwent Valley (M)
320.4
316.7-324.2
20.8
19.6-22.0
18.6
17.5-19.7
23.1
21.8-24.5
Devonport (C)
313.6
311.2-316.0
18.4
17.7-19.1
17.6
16.9-18.2
19.5
18.8-20.3
Dorset (M)
280.8
276.6-285.0
17.0
15.8-18.2
16.7
15.6-17.8
19.2
17.8-20.6
Flinders (M)
262.1
249.7-274.5
15.2
12.1-18.2
18.5
15.2-21.8
28.0
22.6-33.5
George Town (M)
320.2
315.8-324.6
21.2
19.7-22.6
16.5
15.2-17.8
18.7
17.2-20.2
Glamorgan/Spring Bay (M)
268.6
262.7-274.5
21.2
19.6-22.8
14.6
13.4-15.9
22.2
20.0-24.4
Glenorchy (C)
366.7
365.0-368.5
23.2
22.6-23.8
19.5
19.0-20.0
23.1
22.5-23.7
Hobart
337.6
336.0-339.1
22.4
21.8-22.9
16.5
16.0-16.9
20.1
19.5-20.6
Huon Valley (M)
293.1
290.0-296.1
21.4
20.4-22.4
15.8
15.0-16.6
24.1
23.0-25.3
Kentish (M)
248.0
243.6-252.5
17.3
15.8-18.7
15.8
14.4-17.2
18.4
16.8-20.0
King Island (M)
260.6
252.0-269.2
13.7
11.4-16.0
22.5
19.6-25.4
38.4
34.0-42.7
Kingborough (M)
329.7
327.7-331.7
23.3
22.6-24.0
16.1
15.6-16.7
20.2
19.5-20.9
Latrobe (M)
278.1
274.6-281.7
16.7
15.7-17.8
18.2
17.2-19.3
15.7
14.6-16.9
Launceston (C)
331.8
330.4-333.2
18.1
17.7-18.6
14.6
14.2-14.9
19.1
18.6-19.5
Meander Valley (M)
284.5
282.1-286.9
15.1
14.4-15.8
14.3
13.7-15.0
17.0
16.2-17.8
Northern Midlands (M)
275.8
272.5-279.1
19.1
18.1-20.1
16.0
15.1-16.9
18.3
17.2-19.4
Sorell (M)
342.7
339.5-346.0
25.7
24.6-26.9
18.1
17.2-19.1
24.8
23.6-26.0
Southern Midlands (M)
320.5
315.6-325.3
22.9
21.3-24.5
21.7
20.1-23.3
21.3
19.6-23.0
Tasman (M)
310.4
301.9-319.0
22.5
20.2-24.7
15.9
14.0-17.8
27.2
23.7-30.7
Waratah/Wynyard (M)
305.2
301.9-308.6
19.0
18.1-19.9
19.1
18.2-20.0
18.4
17.3-19.4
West Coast (M)
283.8
278.7-288.9
17.4
15.8-18.9
26.2
24.3-28.1
22.9
21.1-24.8
West Tamar (M)
303.0
300.6-305.5
20.7
19.9-21.4
14.1
13.5-14.7
17.4
16.7-18.2
Southern region
336.9
336.2-337.7
22.7
22.5-23.0
17.5
17.3-17.7
21.8
21.5-22.1
Northern region
309.1
308.1-310.0
18.2
17.9-18.5
15.1
14.9-15.4
18.8
18.5-19.1
North-West region
Tasmania
300.1
320.5
299.0-301.2
320.0-321.0
18.1
20.4
17.8-18.4
20.2-20.5
18.8
17.1
18.5-19.2
17.0-17.3
18.7
20.3
18.4-19.1
20.1-20.4
Note: ASR are standardised with the Australian 2001 population and expressed per 1 000 population.
Source: Statewide Morbidity database, Tasmania
190
Potentially Preventable Hospitalisations
Table 76: Age-Standardised Rates (ASR) for Potentially Preventable Hospitalisations by LGA, Tasmania,
2007-11
LGA
ASR
95% CI
Break O’Day (M)
27.5
25.7-29.3
Brighton (M)
27.3
25.9-28.7
Burnie (C)
24.5
23.5-25.4
Central Coast (M)
20.5
19.7-21.3
Central Highlands (M)
18.5
16.0-21.0
Circular Head (M)
29.1
27.4-30.7
Clarence (C)
22.0
21.4-22.5
Derwent Valley (M)
26.0
24.6-27.4
Devonport (C)
25.0
24.1-25.8
Dorset (M)
23.8
22.2-25.3
Flinders (M)
23.2
18.8-27.5
George Town (M)
28.6
26.7-30.3
Glamorgan/Spring Bay (M)
20.9
19.0-22.7
Glenorchy (C)
26.6
25.9-27.2
Hobart
18.5
17.9-19.0
Huon Valley (M)
17.4
16.4-18.3
Kentish (M)
19.8
18.1-21.5
King Island (M)
32.2
28.2-36.0
Kingborough (M)
17.9
17.2-18.5
Latrobe (M)
21.4
20.1-22.6
Launceston (C)
23.2
22.6-23.6
Meander Valley (M)
20.9
20.0-21.7
Northern Midlands (M)
21.5
20.3-22.6
Sorell (M)
20.3
19.2-21.4
Southern Midlands (M)
22.7
20.8-24.4
Tasman (M)
23.6
20.6-26.4
Waratah/Wynyard (M)
23.4
22.3-24.5
West Coast (M)
West Tamar (M)
33.2
17.1
30.8-35.4
16.3-17.8
Southern region
21.6
21.3-21.8
Northern region
22.1
21.8-22.4
North-West region
23.9
23.4-24.2
Tasmania
22.2
22.0-22.4
Note: ASR are standardised with the Australian 2001 population and expressed per 1 000 population.
Source: Statewide Morbidity database, Tasmania.
191
Communicable Diseases
Table 77: Notifiable Diseases in Tasmania
Anthrax
Lyssavirus [including Australian Bat Lyssavirus and others
(details to be specified)]
Arbovirus – Ross River virus
Malaria
Arbovirus – Barmah Forest virus
Measles
Arbovirus - Chikungunya virus
Meningococcal infection
Arbovirus – Dengue
Mumps
Arbovirus – Japanese encephalitis
Ornithosis (psittacosis)
Arbovirus – Murray Valley encephalitis
Paratyphoidosis
Arbovirus – Kunjin virus
Pertussis
Arbovirus Other (details to be specified)
Plague
Botulism
Pneumococcal infection (invasive disease)
Brucellosis
Poliomyelitis
Campylobacteriosis
Q Fever
Chancroid
Rabies
Chlamydia trachomatis infection
Rickettsial infection [including Flinders Island spotted fever
and others (details to be specified)]
Cholera
Rotavirus infection
Creutzfeldt-Jakob Disease (all variants)
Rubella (including congenital rubella)
Cryptosporidiosis
Salmonellosis
Diphtheria
Severe Acute Respiratory Syndrome (SARS)
Donovanosis
Shiga toxin producing E.coli (both VTEC and STEC)
Gastroenteritis in an institution (residential, educational or
child care facility)
Shigellosis
Giardia infection
Smallpox
Gonococcal infection
Staphylococcus aureus bacteraemia
Haemolytic uraemic syndrome (HUS)
Suspected cases of food or water borne illness
Haemophilus influenzae type B infection (invasive)
Syphilis (including congenital syphilis)
Hepatitis A, B, C, D, E and other
Tetanus
HIV infection
Tuberculosis
Diagnosis of an AIDS defining illness (as per CDNA case
definition)
Tularaemia
Hydatid infection
Typhoid
Influenza infection
Typhus
Influenza infection (Avian influenza)
Vancomycin resistant enterococci (VRE)
Lead [Demonstration of blood level in excess of 10 µg/dL/
(0.48 µmol/L) in any person not known to be occupationally
exposed to lead.
Varicella
Legionellosis
Vibrio infection
Leprosy
Viral haemorrhagic fever
Leptospirosis
Yellow fever
Listeriosis
Yersinia infection
Lymphogranuloma venereum
192
Communicable Disease Notifications
Table 78: Crude Notification Rates for Infectious Diseases by LGA, 2007-11
LGA
All-cause
Rate
Chlamydia
Rate
95% CI
Campylobacteriosis
Rate
95% CI
Influenza
Rate
95% CI
Break O’Day (M)
656.0
570.5-750.6
112.5
78.8-155.7
143.7
105.2-191.6
28.1
12.9-53.4
Brighton (M)
881.0
816.8-948.8
337.4
298-380.5
100.6
79.6-125.3
166.8
139.5-197.9
Burnie (C)
739.4
687-794.7
334.3
299.3-372.3
99.0
80.4-120.6
59.6
45.4-76.9
Central Coast (M)
591.0
546.1-638.5
259.9
230.4-292.1
90.6
73.6-110.4
37.9
27.2-51.4
Central Highlands (M)
619.4
485-779.4
180.7
111.9-276
103.2
53.4-180.3
120.4
65.9-202
Circular Head (M)
847.7
761.5-940.9
341.5
287.5-402.6
142.9
108.8-184.3
99.3
71.3-134.7
Clarence (C)
960.2
923.1-998.4
329.9
308.3-352.7
148.5
134-164
123.1
110-137.4
Derwent Valley (M)
898.8
817.9-985.5
250.2
208.3-298.1
126.1
96.9-161.3
154.1
121.7-192.6
Devonport (C)
782.9
735.1-833
342.5
311.1-376.3
127.9
108.9-149.1
66.3
52.9-82.1
Dorset (M)
751.6
665.7-845.5
210.5
166.1-263
98.4
68.9-136.2
65.6
42-97.6
Flinders (M)
980.0
712.9-1313.3
*
*
245.0
122.4-437.9
133.6
49.1-290.6
George Town (M)
786.8
695.8-886.5
305.3
249.6-369.9
158.5
119.1-206.8
70.5
45.2-104.8
Glamorgan/Spring Bay (M)
777.3
666.5-901.2
245.7
185.1-319.7
156.4
108.9-217.4
107.2
68.7-159.5
Glenorchy (C)
973.5
933.2-1015.1
364.4
339.9-390.4
115.3
101.7-130.3
160.7
144.5-178.2
Hobart
1105.3
1064.7-1147.1
458.6
432.4-485.9
176.5
160.4-193.8
134.0
120-149.2
Huon Valley (M)
730.9
671.3-794.3
164.5
136.8-196.1
135.3
110.3-164.2
139.3
113.9-168.6
Kentish (M)
499.8
424.4-584.8
177.4
133.6-230.8
77.4
49.6-115.1
29.0
13.3-55.1
King Island (M)
1010.5
809-1246.4
199.7
116.4-319.6
199.7
116.4-319.6
152.7
81.4-261.1
Kingborough (M)
807.1
764.7-851.2
227.3
205-251.3
166.1
147.1-186.8
135.5
118.4-154.4
Latrobe (M)
629.9
561.1-704.7
249.5
206.9-298.2
110.2
82.5-144.1
70.7
49-98.8
Launceston (C)
949.4
916.4-983.2
420.2
398.3-442.9
128.3
116.4-141.2
81.3
71.8-91.7
Meander Valley (M)
808.9
753.6-867.1
276.1
244.1-311.1
165.3
140.7-192.8
76.0
59.6-95.3
Northern Midlands (M)
685.0
622-752.6
189.1
156.7-226.3
193.9
161-231.5
55.6
38.7-77.4
Sorell (M)
837.5
769-910.5
256.2
218.8-298
165.7
135.9-200
154.9
126.2-188.2
Southern Midlands (M)
610.4
525.6-704.9
218.9
169.4-278.5
126.1
89.2-173
73.0
45.7-110.5
Tasman (M)
710.8
567.4-879.3
220.0
143.8-322.2
93.1
46.5-166.5
76.2
34.8-144.5
Waratah/Wynyard (M)
652.0
593.9-714.4
273.3
236.1-314.8
112.5
89.1-140.2
61.2
44.3-82.5
West Coast (M)
726.6
627.2-837.1
283.0
222.3-355.1
122.4
83.7-172.7
61.2
35-99.3
West Tamar (M)
543.0
500.7-588
153.1
131-177.9
124.3
104.4-146.8
51.3
38.9-66.5
Southern region
926.0
909.3-943
173.0
165.8-180.5
145.4
138.7-152.2
138.4
131.9-145.1
Northern region
811.3
790.5-832.5
233.1
222-244.6
140.0
131.4-149
70.1
64.1-76.6
North-West region
Tasmania
698.4
843.0
676.7-720.6
831.8-854.4
723.1
312.5
701-745.6
305.6-319.4
111.2
136.2
102.7-120.3
131.7-140.9
60.8
101.9
54.5-67.6
98-105.9
95% CI
Note: Crude rates are expressed per 100 000 population.
* Denotes less than 5 cases. Exact numbers withheld for confidentiality purposes
Source: Communicable Disease Prevention Unit database.
193
Cancer Incidence
Table 79: Age-Standardised Incidence Rates for Cancers (ASR) by LGA, 2005-09
All-cause
LGA
ASR
Prostate cancer
Breast cancer
Colon cancer
99% CI
ASR
99% CI
ASR
99% CI
ASR
99% CI
Break O’Day (M)
483.8
400.9-566.6
214.3
139.0-289.5
106.9
48.0-165.7
37.5
14.0-60.9
Brighton (M)
567.8
486.1-649.4
138.7
82.8-194.5
100.8
54.8-146.7
53.0
26.6-79.3
Burnie (C)
526.9
470.7-583.0
222.8
170.3-275.2
90.7
57.9-123.4
62.6
43.4-81.7
Central Coast (M)
497.8
448.6-546.9
185.7
143.5-227.8
95.7
65.7-125.6
49.3
34.0-64.5
Central Highlands (M)
571.7
409.7-733.6
217.8
88.8-346.7
121.0
10.6-231.3
*
*
Circular Head (M)
530.1
438.5-621.6
203.6
123.4-283.7
91.1
37.1-145.0
55.6
25.6-85.5
Clarence (C)
536.4
502.7-570.0
249.6
216.3-282.8
113.1
91.2-134.9
44.4
34.8-53.9
Derwent Valley (M)
485.0
407.5-562.4
122.6
68.35-176.8
67.9
27.7-108.0
54.8
28.0-81.5
Devonport (C)
483.3
438.3-528.2
183.6
143.2-223.9
87.8
60.7-114.8
44.1
30.9-57.2
Dorset (M)
460.1
378.7-541.4
245.1
160.5-329.6
70.7
26.4-114.9
35.1
12.4-57.7
Flinders (M)
494.5
272.4-716.5
205.4
5.104-405.6
217.4
5.40-429.3
*
*
George Town (M)
571.2
470.6-671.7
196.4
115.2-277.5
135.0
65.3-204.6
45.1
16.8-73.3
Glamorgan/Spring Bay (M)
509.4
411.1-607.6
214.9
132.2-297.5
142.5
68.9-216.0
34.7
10.7-58.6
Glenorchy (C)
546.8
510.3-583.2
236.6
200.9-272.2
115.8
92.1-139.4
54.6
43.3-65.8
Hobart
514.7
479.1-550.2
243.8
207.6-279.9
129.4
104.7-154.0
46.5
36.0-56.9
Huon Valley (M)
472.5
411.0-533.9
164.3
113.9-214.6
80.4
44.2-116.5
43.4
24.4-62.3
Kentish (M)
428.7
332.7-524.6
154.2
76.1-232.2
62.9
8.80-116.9
30.9
4.32-57.4
King Island (M)
536.4
351.4-721.3
176.7
39.24-314.1
*
*
95.9
13.4-178.3
Kingborough (M)
537.8
493.1-582.4
260.0
214.9-305.0
125.3
96.0-154.5
47.4
34.1-60.6
Latrobe (M)
504.0
427.6-580.3
218.9
148.3-289.4
86.2
41.7-130.6
56.3
31.0-81.5
Launceston (C)
473.4
444.0-502.7
188.5
161.1-215.8
101.7
82.6-120.7
42.6
34.0-51.1
Meander Valley (M)
480.6
427.1-534.0
184.8
136.1-233.4
104.7
69.8-139.5
48.2
31.2-65.1
Northern Midlands (M)
480.9
414.9-546.8
203.2
142.6-263.7
101.4
58.3-144.4
36.4
18.3-54.4
Sorell (M)
579.2
504.4-653.9
242.1
173.9-310.2
126.4
77.7-175.0
50.8
28.6-72.9
Southern Midlands (M)
619.6
504.5-734.6
217.2
121.0-313.3
154.2
72.9-235.4
48.3
17.1-79.4
Tasman (M)
456.7
325.7-587.6
218.6
101.0-336.1
*
*
*
*
Waratah/Wynyard (M)
503.7
441.6-565.7
158.6
108.9-208.2
118.7
75.3-162.0
68.8
46.2-91.3
West Coast (M)
562.3
441.4-683.1
190.3
97.5-283.0
82.3
15.1-149.4
63.1
21.0-105.1
West Tamar (M)
491.8
441.9-541.6
195.4
151.1-239.6
125.4
90.5-160.2
42.0
27.5-56.4
Southern region
532.9
516.9-548.8
229.4
214.3-244.4
115.8
105.-126.1
47.6
42.8-52.3
Northern region
482.7
462.9-502.4
195.2
177.0-213.3
106.6
93.5-119.6
42.0
36.2-47.7
North-West region
Tasmania
501.4
511.3
478.9-523.8
500.4-522.1
190.1
210.5
170.5-209.6
200.4-220.5
91.9
108.0
78.3-105.4
100.-115.0
54.3
47.6
46.9-61.6
44.3-50.8
Note: ASR are standardised with the Australian 2001 population and expressed per 100 000 population.
* Denotes less than 5 cases. Exact numbers withheld for confidentiality purposes
Source: Tasmanian Cancer Registry database.
194
Appendix 2 – Data Sources
Key Data Sources by Type of Data
Population Data
The estimated resident population data of Tasmania was obtained from the ABS. These population
estimates comprise the basic information on sex and five-year age groupings. Estimated resident
populations of Tasmania and Australia are used as denominators for calculating age-specific
morbidity and mortality rates in this Report.
Tasmanian population data has an additional field of statistical division that may be used to classify
Tasmania into three regions, such as South, North and North West. The South includes Greater
Hobart and Southern statistical divisions, the North region is equivalent to the Northern statistical
division and the North West region is equivalent to Mersey-Lyell statistical division.
Population data to document population distribution by age, sex, indigenous status, as well as socioeconomic characteristics, such as income and education were obtained from the latest Census 2011
data, which is published on the ABS website.
Notifiable Infectious Diseases
In Tasmania, medical practitioners and people in charge of hospitals and laboratories are required by
law to report certain specified diseases to the Director of Public Health. This surveillance system
allows for the detection of infectious diseases, and for the Public and Environmental Health Service
to monitor their trends and to evaluate the effectiveness of intervention programs.
The notifications of infectious diseases in Tasmania from 1990-2001 were extracted from the
surveillance database managed by the Public and Environmental Health Service.
Infectious disease surveillance relies on reporting by medical practitioners, hospitals and pathology
laboratories. The reliability of the routine reporting system includes the accurate diagnosis and
completeness of notification forms of infectious diseases. Sometimes people with infections which
are notifiable do not seek medical attention for their condition, and so are not captured in the data
collections.
Cancer Incidence
Cancer is a notifiable disease in Tasmania as it is elsewhere in Australia. New cases of cancer
diagnosed in Tasmania are reported to the Tasmanian Cancer Registry, located at the Menzies
Research Institute, University of Tasmania.
The cancer incidence data were obtained from the Tasmanian Cancer Registry. Incident cancers are
classified using the International Classification of Diseases.
Hospital Admissions
The Tasmanian Statewide Morbidity Database is a collection of the inpatient information for those
who were admitted to the public and private hospitals as a result of acute or chronic medical
condition. The hospital data consist of details of demographic information of the patient, diagnoses,
procedures and separations (discharge, transfer, death or absconding).
In Tasmania, the diagnoses of hospital admissions were coded according to the International
Classification of Diseases, 9th Revision, Clinical modification (ICD-9-CM) before June 1999. Since July
1999, the International Classification of Diseases, 10th Revision, Australian modification (ICD-10-AM)
has been introduced. The hospital database has been coordinated and managed by the Hospital and
Ambulance Division, Department of Health and Human Services, Tasmania.
This Report used available computerized hospital data to estimate morbidity for selected diseases in
Tasmanian residents. This estimate was made according to principal diagnosis of the hospital
admission, that is, the medical condition chiefly responsible for patient’s episode of care in hospital.
195
However, the hospital morbidity for injury and poisoning caused by external causes was estimated
using any additional diagnosis in the external cause field, where the principal diagnosis code was in
the range ICD-CM-9 800-999 (Chapter 17 ‘Injury and Poisoning’) and ICD-10-AM S00-T98. The
selection criteria for injury cases caused by external causes are consistent with national injury
publications.
The data analysis of hospital morbidity was based on the patient’s place of usual residence. People
from interstate or overseas were excluded from hospital morbidity statistics.
The reliability of the Statewide Morbidity Database managed by the Hospital and Ambulance Division
mainly depends on the discharge summary supplied by the doctor in charge of the patient. This
information is the key for accurately coding and determining the principal diagnosis.
Mortality Data
In all states and territories of Australia, a medical practitioner or a coroner must certify the causes
and date for all deaths. The causes of death were coded by the ABS based on the International
Classification of Diseases 9th Revision or 10th Revision.
The mortality unit record file for Tasmania and Australia as a whole was provided by the ABS, which
contains sex, date of birth, date of death, place of usual residence, country of birth, cause of death,
etc. For an estimate of the mortality rates for Tasmanians in this report, people whose place of usual
residence was interstate or overseas were excluded.
The reliability of the mortality data is affected by the primary diagnosis of the underlying cause of
death if there are multiple causes contributing to the death.
Key Data Sources by Type of Survey
Tasmanian Population Health Survey
The Tasmanian Population Health Survey was a one-off population health survey undertaken in 2009.
The survey was based on Computer Assisted Telephone Interviews (CATI) and used the ‘list
assisted’ form of Random Digit Dialling (RDD) as the sample frame. The target population was
defined as all non-institutionalised Tasmanian residents aged 18 years and over with access to a
landline telephone.
The Human Research Ethics Committee (Tasmania) Network approved the survey method and
questionnaire content, both of which were based on the Victorian Population Health Survey. The
survey process was managed by the Menzies Research Institute on behalf of the Department of
Health and Human Services. The fieldwork data collection was outsourced to the Social Research
Centre in Victoria.
The survey sample included a total of 6 300 respondents stratified into sub-samples of 2 100 in each
of the three regions; North, North West and South. This sample allocation allowed for an
oversampling of the North West region to obtain higher data reliability.
Percentages and the corresponding confidence intervals in this document were weighted to the
Tasmanian population, based on the stratified sampling design of the survey.
Note: Tasmanians without access to a landline telephone, such as sole mobile phone users, are not included
in this survey, which may have resulted in an under-estimate of smoking prevalence in particular.
National Health Surveys (NHS) and Australian Health Survey (AHS)
The ABS conducts three-yearly national health surveys that aim to provide benchmark information
on a range of health issues, including chronic diseases, injury and health risk factors and to enable
trends in health to be monitored over time. The latest health survey (2011-12) was conducted as the
Australian Health Survey.
196
This series of health surveys is based on self-reported data collected in face to face interviews. The
results may reflect the respondents’ knowledge about health and understanding of the diagnosis
made by health professionals. Therefore, care should be taken in interpreting the results.
National Drug Strategy Household Surveys
These surveys are national triennial surveys providing cross sectional data on alcohol and other drug
use in Australia. The surveys provide estimates and trends of licit and illicit drug use, including
tobacco and alcohol, and measure community attitudes to drug use and support for various drugrelated policies. Survey data are available for 1998, 2001, 2004, 2007 and 2010.
Australian Secondary Schools Alcohol and Drug Survey
The Australian Secondary School Alcohol and Drug (ASSAD) survey has been conducted every
three years since 1984 throughout Australia. The survey collects data on smoking, alcohol and other
drug use, nutrition, exercise and sun protection behaviours of students aged 12-17 years. The
sampling procedure is a two-stage probability design, with schools randomly selected at the first
stage of sampling and classes selected within schools at the second stage. In Tasmania, the survey is
administered by the Tasmanian Cancer Council.
National Secondary Students’ Diet and Activity Survey
This survey is administered by the Tasmanian Cancer Council and monitors body weight, dietary and
physical activity behaviour at both a state and national level of students aged 12-17 years of age. The
first survey was conducted in 2010-11. The sampling procedure is a two-stage probability design,
with schools randomly selected at the first stage of sampling and classes selected within schools at
the second stage. Students completed a web-based questionnaire and had their height and weight
measured.
Survey of Disability, Ageing and Carers
The ABS has conducted regular surveys for data collection of people with a disability since 1981. It is
important to note that the information gathered from the survey was based on self-reported
questionnaires. The reliability of the results from the survey may be related to the respondents’
knowledge about a disability and particularly to people with intellectual disability.
197
Appendix 3 – Methods
Age-specific Rate
The age-specific rate is calculated by dividing the number of cases by the number of estimated
population in a specific age group. The rate is expressed as “per 100 000 population”.
Age-standardised Rates
Age-standardised rates are estimated by the direct standardisation method (Boyle and Parkin 1991).
This method applies the age-specific rates from the study population to the standard population in
order to calculate the number of events that would be expected in the standard population, thus
removing the effect of differential age distributions. The expected events are then summed and
divided by the size of the standard population. For this report, the 2001 Australian population was
used as a standard population. Age-standardised rate is expressed as “per 100 000 population”.
The aim of age standardisation is to identify whether the compared rates (e.g. between Tasmania and
Australia) are statistically significantly different after adjusting for age differences.
Avoidable Mortality
Avoidable mortality refers to deaths that could potentially be avoided through effective interventions
against specific diseases in a population. Avoidable mortality is thus a population-based method of
determining unnecessary deaths from diseases for which effective public health and medical
interventions are available.
Modelling of Trends
The Poisson regression model was used to model age-standardised cancer incidence rates and agestandardised mortality rates for Tasmania and Australia as a whole from 1979-80 to 1999-2000 on
the assumption that the number of expected events have a Poisson distribution. In the Poisson
regression model, the data were modelled with a log link function and the natural log of population
treated as an “offset”.
The methods in modelling data, calculating annual rate of change and testing of trends for statistical
significance are described in detail in the publication titled “Mortality Surveillance, Australia, 19811992” (Bennett et al. 1994).
Notification Rate
The notification rate for infectious diseases is calculated by dividing the number of notified cases by
the estimated population at a specified year. The rate is expressed as “per 100 000 population”.
Relative Standard Error
The relative standard error (RSE) was calculated for the estimates obtained from the Healthy
Communities Survey, Tasmania, 1998. The relative standard error is a measure of the reliability or
precision of a survey statistic on a percentage scale (ABS 1999b). The RSE is defined as the standard
error of a survey estimate, divided by the survey estimate, and then multiplied by 100.
The 95% or 99% confidence intervals were estimated using the standard errors of survey estimates.
If the confidence intervals for two proportions do not overlap, the proportions are considered to be
significantly different at the 95% level or 99% level in this Report.
198
Standardised Mortality Ratio
The indirect method of age standardisation has been used for comparing the mortality by local
government area (LGA) to the mortality in Tasmania as a whole. This method is relatively reliable
for the small number of deaths involved when the mortality data are aggregated into a small area
(Armitage 1971).
The Standardised Mortality Ratio (SMR) was calculated by the indirect method of age standardisation
(Boyle and Parkin 1991). SMR is the ratio of the number of observed deaths in a study population
(LGA) to the number of expected deaths that are calculated according to the age-specific rates in
the reference population (Tasmania as a whole). SMR is usually expressed as a percentage (multiples
by 100).
Exact Poisson confidence intervals were calculated for each estimated SMR as described in Breslow
and Day 1987. Confidence intervals for the SMR were set at 99% in this Report. The statistical
significance of a SMR was determined based on confidence intervals. If the SMR for a local
government area is above 100 and its lower confidence interval is also above 100, the SMR is
considered to be significantly high at the 1% level, compared to the reference population (Tasmania
as a whole).
Standardised incidence Ratio
The calculation of the Standardised Incidence Ratio is the same as for the SMR.
Socio-economic Status
The socio-economic status methodology applied to avoidable mortality and selected risk factors is
the Socio Economic Indexes for Areas (SEIFA), developed by the ABS. The specific index used in this
report is the Index of Relative Socio-Economic Disadvantage. The index represents a single measure
of socio-economic status derived from Census data, and includes variables such as education,
income, occupation and housing in calculating the index score. Index scores are applied to
geographic areas. Areas with a low index score have high proportions of low income families, high
unemployment and low educational qualifications, while the least disadvantaged areas have high
proportions of high income earners and high index scores. This means areas with a low index score
are more disadvantaged than areas with a high index score.
Statistical Significance
In this report, 95% confidence intervals have been used to determine if a statistically significant
difference exists between compared values. A statistically significant difference exists where the
confidence intervals do not overlap and the difference between rates is greater than that which
could be explained by chance. Overlapping confidence intervals do not imply that the difference
between two values is definitely merely due to chance, but rather that no statistically significant
difference was found. Judgment should always be exercised in deciding whether or not the difference
is of practical or clinical value.
Graphically, the 95% confidence intervals are represented as error bars (an “I” with top and bottom
bars). Overlapping error bars imply that the compared values are not statistically significant.
199
Appendix 4 – Working in Health Promoting Ways
Health promotion is about enabling people to increase control over, and to improve their health. It
is about improving quality of life by acting on the causes of illness and by addressing the determinants
of health. ‘Working in Health Promoting Ways (WiHPW): A Strategic Framework for DHHS 87’ was
established under the Tasmanian Health Plan to set the health promotion direction for DHHS. This
was in response to an increasing incidence of chronic disease in the community, the ageing
population, increasing healthcare costs and difficulties sustaining the workforce.
Health promotion, illness prevention and health literacy are critical concepts within primary health
care as both a policy model and a service sector and central to national health reforms and the
development of Medicare Locals and agencies such as the Australian National Preventive Agency.
Eight principles have been identified as essential for working in health promoting ways. They have
their foundation in landmark documents such as the Ottawa Charter for Health Promotion and the
Bangkok Charter for Health Promotion in a Globalised World.
•
Evidence informed practice
•
Determinants of health
•
Equity
•
Partnerships
•
Action across the continuum
•
Cultural change
•
Supportive environments
•
Community participation
Seven priorities for action over the next few years have been
determined. The criteria used to select them were based on the
format used in ‘Health promotion priorities for Victoria: A
discussion paper 88’. These initial priorities are:
•
promoting physical activity and active communities
•
Improving access to nutritious, safe and affordable food
•
promoting mental health and wellbeing
•
reducing use and minimising harm from tobacco, alcohol and other drugs
•
preventing injury
•
promoting sexual health and wellbeing
•
improving the prevention and management of chronic conditions.
Successful implementation of the Working in Health Promoting Ways Framework will require health
and human services to reorientate towards a health promotion approach in sustainable and effective
ways. This includes supporting service providers with training and resources to continually improve
their practice and for managers to provide leadership and allocate resources. It also means ensuring
our systems support health promotion approaches, including strengthening methods of tracking
health status, risk factors and social determinants of health to support planning and evaluation.
The following health and wellbeing indicators have been chosen to monitor how Tasmania is faring
with respect to each of the Priority areas. The most recent Tasmanian and Australian data, as of
May 2013, is reported for each indicator. Further data relevant to each priority area is included in
this Health Indicators Tasmania report.
87 DHHS, 2010. Working in Health Promoting Ways: A strategic framework for DHHS 2009-2012. Background Paper.
Tasmanian Government: Hobart.
88 Victorian Department of Human Services (DHS), 2006. Health Promotion Priorities for Victoria: A discussion paper.
Victorian Government: Melbourne.
200
Health and Wellbeing Indicators*
WiHPW Vision:
All Tasmanians are born and remain well
• Proportion of population aged 15-74 with adequate health literacy levels
• Proportion of adults with poor or fair self-assessed health status
• Proportion of babies born of low birth weight
• Life expectancy at birth
• Infant mortality rate
Improving the prevention &
management of chronic conditions:
Improving access to nutritious,
safe & affordable food:
• Proportion
daily
• Selected potentially preventable hospitalisations
• Proportion of adults who are overweight or obese
• Proportion of adults with multiple chronic conditions
of adults who eat 5+ serves of vegetables
• Proportion of adults who eat 2+ serves of fruit daily
• Proportion of mothers exclusively breastfeeding at
months
4
• Proportion of adults that ran out of food and could not
Promoting sexual health & wellbeing:
afford to buy more.
• Chlamydia notifications
• Teenage fertility rate
Promoting mental health & wellbeing:
• Proportion
of adults with high or very high levels of
psychological distress
• Hospitalisations for mental and behavioural disorders
• Deaths due to mental and behavioural disorders
Preventing injury:
• Hospitalisations for injury and poisoning
• Deaths due to injury and poisoning
Reducing use and minimising harm
from tobacco, alcohol & other drugs:
• Proportion of adults who are daily smokers
• Proportion of adults at risk of long term harm from
alcohol
• Proportion of population aged over 14 who use illicit
drugs
• Self-reported tobacco smoking during pregnancy
Promoting physical activity
& active communities:
• Proportion of adults who are physically inactive
• Proportion of adults who are sedentary
* Purpose of these Indicators
The Working in Health Promoting Ways Framework includes seven priority areas. The indicators listed in the coloured
boxes are used to report population health outcomes for adults in each priority area. Recent data for each indicator is
reported below. Refer to the 2013 Kids Come First Update for data on children.
201
Working in Health Promoting Ways Data Summary May 2013
Indicator
Health Status
Proportion of Tasmanians aged 15-74 with adequate
health literacy levels
Tasmanian
most recent
data
Tasmania
2006
37%
Australian
most recent
data
Australia
2006
41%
Proportion of adults 18 years and over with poor/fair selfassessed health status
2011/12
2011/12
18.4%
14.4%
Proportion of babies born of low birth weight <2500
grams
2010
2009
7.9%
7.2%
Life expectancy at birth (years)
2011
2011
males
78.3
79.7
females
82.5
84.2
Infant (<1 year) mortality rate per 1,000 live births
2011
2011
4.5
3.8
Physical Activity
Proportion of population 18 years and over with
inadequate physical activity
Tasmania
2011/12
Australia
2011/12
69.4%
67.5%
2011/12
2011/12
35.3%
36.0%
Tasmania
2010/11
Australia
2010/11
Proportion of population 18 years and over classified as
sedentary
Chronic Conditions
Potentially preventable hospitalisations per 1,000
population
Prevalence of overweight and obesity, 18 years and over
Proportion of adults with 3 or more chronic conditions
Sexual Health
Chlamydia notification rate per 100,000 population
27.7
2011/12
2011/12
65.6%
63.4%
2007/08
2007/08
44.9%
38.8%
Tasmania
2007-2011
Fertility rate per 1,000 females aged <19 years
Preventing Injury
Number of hospitalisations for injury and poisoning per
1000 person years
20.2
349.5
361.6
2010
2010
21.6
15.5
Tasmanian
2010
Deaths due to injury and poisoning per 100,000
population
202
Australia
2011
Australia
2009-2010
18.9
NA
2011
2011
45.8
37.5
Data Source
Data Source
ABS Adult Literacy and
Life skills Survey 2006
ABS Australian Health
Survey 2011/12
COPMM Annual Report
2010
DHHS, Health Indicators
Tasmania 2013
DHHS, Health Indicators
Tasmania 2013
Data Source
ABS Australian Health
Survey 2011/12
ABS Australian Health
Survey 2011/12
Data Source
DHHS, Health Indicators
Tasmania 2013
ABS Australian Health
Survey 2011/12
ABS National Health
Survey 2007/08
Data Source
DHHS, Health Indicators
Tasmania, 2013
DHHS, Kids Come First
Update, 2013
Data Source
Tas: DHHS hospital data
2012
ABS Causes of death data
2011
Tobacco, Alcohol &
Other Drugs
Proportion of adults 18 years and over who are daily
smokers
Tasmania
Australia
2011/12
2011/12
21.8%
16.3%
Proportion of adults 18 years and over at risk of long
term harm from alcohol
2011/12
2011/12
22.7%
19.5%
Proportion of persons 14 years and over who used illicit
drugs during the previous 12 months, excluding
pharmaceuticals
2010
2010
9.6%
12.0%
Self-reported tobacco smoking during pregnancy:
Public hospital patients
Private hospital patients
2009
Mental Health
Proportion of adults with high/very high levels of
psychological distress, 18 years and over
NA
30.5%
Data Source
ABS Australian Health
Survey 2011/12
ABS Australian Health
Survey 2011/12
AIHW National Drug
Strategy Household
Survey 2011
COPPM Annual Report
2010
5.4%
Tasmania
2011/12
Australia
2011/12
8.9%
10.8%
Number of hospitalisations for mental and behavioral
disorders per 1000 person years
2011
Deaths due to mental and behavioral disorders per
100,000 population
Data Source
ABS Australian Health
Survey 2011/12
NA
DHHS hospital data
2011
2011
40.8
27
ABS Causes of death data
2011
19.4
Nutrition
Proportion of population 18 years and over who eat at
least 5 serves of vegetables daily
Tasmania
2011/12
Australia
2011/12
Data Source
ABS Australian Health
Survey 2011/12
13.9%
8.3%
Proportion of population 18 years and over who eat at
least 2 serves of fruit daily
2011/12
2011/12
43.1%
48.3%
Proportion of mothers attending CHAPS Child Health
Assessments exclusively breastfeeding at 4 months
2009/102010/11
NA
DHHS , Kids Come First
Update 2013
2009
1995
4.9%
5.0%
Tasmanian Population
Health Survey 2009
ABS National Nutrition
Survey 1995
ABS Australian Health
Survey 2011/12
39.0%
Proportion of population 18 years and over that ran out
of food and couldn’t afford to buy more (food security)
203
Appendix 5 - Glossary
Additional Diagnosis
A condition or complaint either coexisting with the principal
diagnosis or arising during the episode of care or attendance at a
health care facility (AIHW 1998).
Age/Sex-Specific
Incidence Rate
(Number of new cases in a specific age and sex group in a year) x
(100 000 /mid-year population of the same age and sex group).
Age-Standardisation
A statistical procedure for adjusting rates, e.g. death rates,
designed to minimize the effects of differences in age composition
when comparing rates for different populations (Last 1988).
Average Length of Stay
For a group of patients by dividing the total number of bed days
accumulated by patients separating during the study period by the
number of separations occurring during that period (AIHW 1996).
Disability
Restriction or lack (resulting from an impairment) of ability to
perform an activity in the manner or within the range considered
normal for a human being (Lwanga et al. 1999).
Fertility Rate
The fertility rate is the total number of children that would be
born to each woman if she were to live to the end of her
childbearing years (from 15 to 49) and give birth to children over
that period at the prevailing age-specific fertility rates.
A fertility rate of 2.1 children per woman ensures broad stability of
the population on the assumption of no net migration flows and no
change in mortality rates.
Hospital Admission
An admission is the process by which an admitted patient
commences an episode of care (AIHW 1998). In this report, the
number of separation has been taken as the number of admission.
Hospital Separation
The formal process by which a hospital records the completion of
treatment/care for an admitted patient. This occurs when an
admitted patient leaves hospital to return home, transfers to
another institution, or dies (AIHW 1997).
Illicit Drugs
The following drugs when used for non-medical purposes: speed,
cocaine, sleeping pills/tranquillisers, marijuana, analgesics, heroin,
petrol sniffing, other inhalants, hallucinogens, designer drugs, and
injecting of any illegal drugs (ABS 1999c).
Impairment
Any loss or abnormality of psychological or anatomical structure
or function (Lwanga et al. 1999).
Incidence
Occurrence of new cases of a specified disease in a specified
community during a specified period of time (Lwanga et al. 1999).
Indigenous population
People who identify as Aboriginal or Torres Strait Islander origin
or both (ABS, Australian Social Trends, 2007, p.6)
Infant Mortality Rate
(Number of deaths under one year of age in a year x 1 000)/total
number of live births in the same year (Lwanga et al. 1999).
204
Life Expectancy
Refers to the average number of additional years a person of a
given age and sex might expect to live if the age-specific death
rates of the given period continued throughout his or her lifetime
(ABS 2001).
Long-Term Conditions
Refers to medical conditions (illness, injury or disability) which are
chronic by having lasted at least six months, or which the
respondent expects to last for six months (ABS 1997b).
Natural Increase
The excess of births over deaths (ABS 2002c).
Morbidity
Any departure, subjective or objective, from a state of
physiological or mental well-being, whether due to disease, injury
or impairment (WHO 1959).
P Value
The probability of obtaining a given statistical result by chance
alone (Morton et al. 1996).
Potentially preventable
mortality
Deaths amenable to screening and primary prevention such as
immunisation. (National Health Care Agreement)
Potentially preventable
hospitalisations
Health conditions or cases where hospitalisation is believed to be
avoidable through timely and adequate primary (non-hospital) care.
Prevalence
A measure of the level of the disease or characteristic in a
population at a specific point in time. (AIHW, 2012)
Principal Diagnosis
The diagnosis established after study to be chiefly responsible for
the patient’s episode of care in hospital (or attendance at the
health care facility (AIHW 1998).
Recent Condition
Medical conditions (illness, injury or disability) experienced in the
two weeks prior to interview
May include long-term conditions experienced in the period (ABS
1997b).
Remoteness (ASGC RA)
A classification of areas across Australia based on the distance
from different services. Main categories are Major cities, Inner
regional, Outer regional, Remote and Very remote. (AIHW, 2012)
Self-Assessed Health
Status
Refers to a respondent’s perception of his or her general health
status. In the National Health Survey and the National Aboriginal
and Torres Strait Islander Survey, respondents were asked to rate
their health as excellent, very good, good, fair or poor (ABS
1997b).
Hospital separation
The formal process by which a hospital records the completion of
treatment/care for an admitted patient. This occurs when an
admitted patient leaves hospital to return home, transfers to
another institution, or dies (AIHW 1997).
Standardised Mortality
(Incidence) Ratio
The ratio of the number of events observed in the study group or
population to the number that would be expected if the study
population had the same specific rates as the standard population,
multiplied by 100 (Last 1988).
205
Unemployed
People aged 15 and over who were not employed during the
reference week (ABS 2002e).
206
Bibliography
Australian Bureau of Statistics. Labour force Australia 2011. Canberra: ABS, 2011.
Access Economics. Painful realities: the economic impact of arthritis in Australia in 2007.
Canberra: Access Economics, 2007.
Australian Bureau of Statistics. Australian Health Survey: first results 2011-12. Canberra: ABS,
2012.
Australian Bureau of Statistics. Australian hospital statistics 2010-11. Canberra: AIHW, 2012.
Australian Bureau of Statistics. Births Australia 2011. Canberra: ABS, 2012.
Australian Bureau of Statistics. Census 2011. Canberra: ABS, 2011.
Australian Bureau of Statistics. Deaths Australia 2011. Canberra: ABS, 2011.
Australian Bureau of Statistics. Disability Australia 2009. Canberra: ABS, 2011.
Australian Bureau of Statistics. General Social Survey, Tasmania 2010. Canberra: ABS, 2010.
Australian Bureau of Statistics. Labour force Australia. Canberra: ABS, July 2012.
Australian Bureau of Statistics. Population projections Australia, 2006-2101. Canberra: ABS, 2008.
Australian Bureau of Statistics. Regional population growth. Canberra: ABS, 2011.
Australian Bureau of Statistics. Regional Population Growth Australia. Canberra: ABS, March
2012.
Australian Bureau of Statistics. Underemployed workers, Australia 2012. ABS, 2012.
Australian Health Ministers Advisory Council. Aboriginal and Torres Strait Islander Health
performance Framework Report 2010. Canberra: AHMAC, 2011.
Australian Institute of Health and Welfare. Australian hospital statistics 2010-11. Canberra: AIHW,
2012.
Australian Institute of Health and Welfare. Australian mothers and babies 2010. Canberra: AIHW,
2012.
Australian Institute of Health and Welfare. Australian National Infant Feeding Survey: indicator
results. Canberra: AIHW, 2011.
Australian Institute of Health and Welfare. Australia's health 2006. Canberra: AIHW, 2006.
Australian Institute of Health and Welfare. Australia's health 2012. Canberra: AIHW, 2012.
Australian Institute of Health and Welfare. BreastScreen Australia monitoring report 2009-10.
Canberra: AIHW, 2012.
Australian Institute of Health and Welfare. Cancer incidence projections, Australia 2011-20.
Canberra: AIHW, 2012.
Australian Institute of Health and Welfare. Cervical screening in Australia 2009-12. Canberra:
AIHW, 2012.
Australian Institute of Health and Welfare. Changes in life expectancy and disability in Australia
1998-2009. Canberra: AIHW, 2012.
Australian Institute of Health and Welfare. Costs of diabetes in Australia 2000-01. Bulletin 26,
Canberra: AIHW, 2005.
Australian Institute of Health and Welfare. Headline indicators for children's health, development
and wellbeing. Canberra: AIHW, 2011.
207
Australian Institute of Health and Welfare. National Bowel Cancer Screening Program monitoring
report, 2008-11. Canberra: AIHW, 2012.
Australian Institute of Health and Welfare. Projections of the incidence of treated end-stage kidney
disease in Australia 2010-20. Canberra: AIHW, 2011.
Australian Institute of Health and Welfare. Socio-economic inequalities in cardiovascular disease
in Australia: current picture and trends since 1992. Bulletin 37, Canberra: AIHW, 2006.
Australian Institute of Health and Welfare. Statistics on drug use in Australia. Canberra: AIHW,
2006.
Australian Institute of Health and Welfare. The child dental health survey Australia. Canberra:
AIHW, 2006.
Begg, S, et al. “Burden of disease and injury in Australia in the new millenium: measuring health
loss from diseases, injuries and risk factors.” Medical Journal of Australia, 188 (1) 2008: 36-40.
Begg, S. et al. The burden of disease and injury in Australia. Canberra: Centre for Burden of
Disease and Cost Effectiveness, 2006.
Cancer Council. Australiian Secondary Students' Alcohol and Drug Survey, Tasmania. Melbourne:
Cancer Council, 2011.
Cancer Council. National Secondary Students' Diet and Activity Survey 2009-10, Tasmania
summary report. Melbourne: Cancer Council, 2011.
Centre for Economic Policy Research. The stability of self-assessed health status. Canberra: ANU,
2000.
CMACE and RCOG. Joint guidelines on the management of females with obesity in pregnancy.
Canberra: RCOG, 2010.
COAG Reform Council. Healthcare 2010-11: Comparing performance across Australia. Sydney:
COAG Reform Council, 2012.
Demographic Change Advisory Council. “Who is not participating in Tasmania's labour force.”
Summary Paper, Hobart, 2007.
Denniss, R. Who benefits from private health insurance in Australia? Canberra: Australia Institute,
2005.
Department of Health and Ageing. Environmental tobacco smoke in Australia. Canberra: DoHA,
2002.
Department of Health and Human Services. Council of Obstetric & Paediatric Mortality &
Morbidity, Annual Report 2010. Hobart: DHHS, Care Reform, 2012.
Department of Health and Human Services. Statewide Morbidity Database Tasmania.
Department of Health and Human Services. Tasmanian Population Health Survey. Hobart: DHHS,
2009.
Department of Health and Human Services. Working in health promoting ways - background paper.
Hobart: DHHS, 2012.
Department of Tourism, Arts and the Environment. Tasmanian air quality strategy. Hobart: DTAE,
2006.
Department of Treasury and Finance Tasmania. Long Term Unemployment. Hobart: Treasury,
2012.
Department of Treasury and Finance Tasmania. Long term unemployment in Tasmania: a statistical
analysis. Hobart: Treasury, 2005.
208
Diamond, J.J. “Development of reliable and construct valid measures of nutritional literacy in
adults.” Nutrition Journal, Vol.6, 2007: p.5.
Eriksson, I. et al. “Self-rated health, comparisons between three different measures.” International
Journal of Epidemiology, 2001: 326-33.
Flood, V, et al. “Use of self-report to monitor overweight and obesity in populations.” Australian
and New Zealand Journal of Public Health, 2000; 24;: 96-99.
Hibbard, J.H. et al. “Consumer competencies and the use of comparative quality information.”
Patient Care Research and Review, 2007: 379-94.
Kasper, Dennis. Harrison's principles of internal medicine, 16th edition. McGraw Hill, 2005.
McIntyre D.H., et al. “Overweight and obesity in Australian mothers: epidemic or endemic?”
Medical Journal of Australia, 2012: Vol.136, 184-188.
McIntyre, D.M. “Overweight and obesity in Australian mothers: epidemic or endemic.” Medical
Journal of Australia, 196: 184-88.
Medibank Health Solutions. Obesity in Australia:financial impacts and cost benefits of intervention.
Medibank, 2010.
Morley, B.C, et al. “What factors are associated with excess body weight in Australian secondary
school students?” Medical Journal of Australia, 2012, 196(3): 189-92.
Morley, B.C. et al. What factors are associated with excess body weight in Australian secondary
school students? MJA 196 (3) 189-192, 2012.
Krause,N. and Jay, G. “What do global self-rated health items measure.” Journal of Medical Care,
1994: 930-42.
National Centre for Social and Economic Modelling. Cost of living indicators for Tasmania.
Canberra: NARSEM, June 2011.
National Health and Medical Research Council. A review of the evidence to address targeted
questions to inform the revision of the Australian Dietary Guidelines. Canberra: NHMRC, 2011.
National Health and Medical Research Council. Australian guidelines to reduce health risks from
drinking alcohol. Canberra: NHMRC, 2009.
Peerson, M, and Saunders, A. “Health literacy revisited: what do we mean and why does it matter.”
Health Promotion International, 2009: 285-96.
Private Health Insurance Administration Council. Annual coverage survey. Canberra: PHIAC,
December 2011.
Productivity Commission. National healthcare agreement performance report. Canberra:
Productivity Commission, 2009-10.
Productivity Commission. Report on government services: health secor summary. Canberra:
Productivity Commission, 2012.
RCOG, CMACE and. Joint guidelines on management of females with obesity in pregnancy.
London: Centre for Maternal and Child Enquiries and the Royal College of Obstetricians and, 2010.
Rootman, I. “Health literacy: where are the Canadian doctors.” Canadian Medical Association
Journal, 2006: 606-7.
Social Reserach Centre. Tasmanian Child Health and Wellbeing Survey: Report of Survey Findings
2009. Hobart: DHHS, 2009.
Tasmania Medicare Local. 2011 census of Tasmanian general practice. Hobart: Medicare Local,
2012.
209
Tasmania Medicare Local. Primary health indicators, Tasmania report. Hobart: Medicare Local,
2012.
Tasmania, Department of Treasury and Finance. Long-term unemployment. Department of Treasury
and Finance, December 2012.
Tasmania Together. Progress report 2012. Tasmania Together, 2012.
UNESCO. Background paper for the education for all global monitoring report. UNESCO, 2006.
United States Department of Health and Human Services. Health consequences of smoking: a
report of the Surgeon General. Atlanta: DHHS, 2004.
Wilkins, R. Unemployment in Australia: evidence from the HILDA survey. Melbourne: Melbourne
Institute of Applied Economic and Social Research, 2004.
World Health Organization. Exclusive breastfeeding. Geneva: WHO, 2012.
World Health Organization. Health promotion glossary. Geneva: WHO, 1998.
World Health Organization. Obesity: preventing and managing the global epidemic. Technical
Report 894, Geneva: WHO, 2004.
210
211
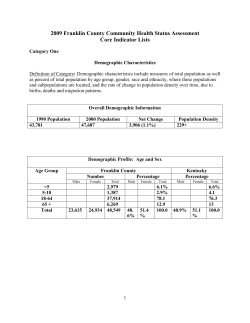


© Copyright 2026