
FOR RELEASE MAY 12, 2015 FOR FURTHER
NUMBERS, FACTS AND TRENDS SHAPING THE WORLD FOR RELEASE MAY 12, 2015 FOR FURTHER INFORMATION ON THIS REPORT: Alan Cooperman, Director of Religion Research Gregory Smith, Associate Director, Research Katherine Ritchey, Communications Manager 202.419.4372 www.pewresearch.org RECOMMENDED CITATION: Pew Research Center, May 12, 2015, “America’s Changing Religious Landscape” 1 PEW RESEARCH CENTER About This Report This is the first in a series of reports highlighting findings from the 2014 U.S. Religious Landscape Study, the centerpiece of which is a nationally representative telephone survey of 35,071 adults. This is the second time the Pew Research Center has conducted a Religious Landscape Study. The first was conducted in 2007, also with a telephone survey of more than 35,000 Americans. Pew Research Center is a nonpartisan “fact tank” that informs the public about the issues, attitudes and trends shaping America and the world. It does not take policy positions. It conducts public opinion polling, demographic research, media content analysis and other empirical social science research. The center studies U.S. politics and policy views; media and journalism; internet and technology; religion and public life; Hispanic trends; global attitudes; and U.S. social and demographic trends. The center is a subsidiary of The Pew Charitable Trusts, its primary funder. This report was made possible by The Pew Charitable Trusts, which received support for the project from the Lilly Endowment. All of the center’s reports are available at www.pewresearch.org. This report is a collaborative effort based on the input and analysis of the following individuals: Primary Researcher Gregory Smith, Associate Director, Research Research Team Alan Cooperman, Director of Religion Research Jessica Martinez, Research Associate Elizabeth Sciupac, Research Analyst Conrad Hackett, Demographer Besheer Mohamed, Research Associate Becka Alper, Research Associate Claire Gecewicz, Research Assistant Juan Carlos Esparza Ochoa, Data Manager Editorial and Graphic Design Sandra Stencel, Associate Director, Editorial Michael Lipka, Editor Bill Webster, Information Graphics Designer Caryle Murphy, Senior Writer/Editor Aleksandra Sandstrom, Copy Editor Diana Yoo, Art Director Communications and Web Publishing Stacy Rosenberg, Digital Project Manager Katherine Ritchey, Communications Manager Ben Wormald, Associate Web Producer Russell Heimlich, Web Developer © Pew Research Center 2015 www.pewresearch.org 2 PEW RESEARCH CENTER Table of Contents Overview 3 Chapter 1: The Changing Religious Composition of the U.S. 20 Chapter 2: Religious Switching and Intermarriage 33 Chapter 3: Demographic Profiles of Religious Groups 48 Chapter 4: The Shifting Religious Identity of Demographic Groups 68 Appendix A: Methodology 88 Appendix B: Classification of Protestant Denominations 100 Appendix C: Putting Findings From the Religious Landscape Study Into Context 112 Appendix D: Detailed Tables 118 Appendix E: Topline 148 www.pewresearch.org 3 PEW RESEARCH CENTER Overview The Christian share of the U.S. population is declining, while the number of U.S. adults who do not identify with any organized religion is growing, according to an extensive new survey by the Pew Research Center. Moreover, these changes are taking place across the religious landscape, affecting all regions of the country and many demographic groups. While the drop in Christian affiliation is particularly pronounced among young adults, it is occurring among Americans of all ages. The same trends are seen among whites, blacks and Latinos; among both college graduates and adults with only a high school education; and among women as well as men. To be sure, the United States remains home to more Christians than any other country in the world, and a large majority of Americans – roughly seven-in-ten – continue to identify with some branch of the Christian faith.1 But the major new survey of more than 35,000 Americans by the Pew Research Center finds that the percentage of adults (ages 18 and older) who describe themselves as Christians has dropped by nearly eight percentage points in just seven years, from 78.4% in an equally massive Pew Research survey in 2007 to 70.6% in 2014. Over the same period, the percentage of Americans who are religiously unaffiliated – describing themselves as atheist, agnostic or “nothing in particular” – has jumped more than six points, from 16.1% to 22.8%. And the share of Americans who identify with non-Christian faiths also has inched up, rising 1.2 percentage points, from 4.7% in 2007 to 5.9% in 2014. Growth has been especially great among Muslims and Hindus, albeit from a very low base. For estimates of the size of Christian populations in more than 200 countries and territories, see the Pew Research Center’s April 2015 report "The Future of World Religions: Population Growth Projections, 2010-2050." 1 www.pewresearch.org 4 PEW RESEARCH CENTER The drop in the Christian share of the population has been driven mainly by declines among mainline Protestants and Catholics. Each of those large religious traditions has shrunk by approximately three percentage points since 2007. The evangelical Protestant share of the U.S. population also has dipped, but at a slower rate, falling by about one percentage point since 2007.2 Christians Decline as Share of U.S. Population; Other Faiths and the Unaffiliated Are Growing 2007 % 2014 % Change* % 78.4 70.6 -7.8 51.3 46.5 -4.8 Evangelical 26.3 25.4 -0.9 Mainline 18.1 14.7 -3.4 Christian Protestant 6.9 6.5 -- Catholic Historically black 23.9 20.8 -3.1 Orthodox Christian 0.6 0.5 -- Mormon 1.7 1.6 -- Jehovah's Witness 0.7 0.8 -- Other Christian 0.3 0.4 -- Non-Christian faiths 4.7 5.9 +1.2 Jewish 1.7 1.9 -- Muslim 0.4 0.9 +0.5 Buddhist 0.7 0.7 -- Hindu 0.4 0.7 +0.3 Other world religions** <0.3 0.3 -- Other faiths** 1.2 1.5 +0.3 16.1 22.8 +6.7 1.6 3.1 +1.5 Unaffiliated Atheist Agnostic 2.4 4.0 +1.6 Nothing in particular 12.1 15.8 +3.7 0.8 0.6 -0.2 100.0 100.0 Don't know/refused *The “change” column displays only statistically significant changes; blank cells indicate that the difference between 2007 and 2014 is within the margin of error. **The “other world religions” category includes Sikhs, Baha’is, Taoists, Jains and a variety of other world religions. The “other faiths” category includes Unitarians, New Age religions, Native American religions and a number of other non-Christian faiths. Source: 2014 Religious Landscape Study, conducted June 4-Sept. 30, 2014. Figures may not add to 100% and nested figures may not add to subtotals indicated due to rounding. PEW RESEARCH CENTER For more details on long-term trends in the religious composition of the U.S. and for analysis of how the Religious Landscape Study's findings compare with other surveys, see Appendix C. 2 www.pewresearch.org 5 PEW RESEARCH CENTER Increasing Racial and Ethnic Diversity Within Christianity Source: 2014 Religious Landscape Study, conducted June 4-Sept. 30, 2014. Whites include only those who are not Hispanic; the non-white category includes African Americans, Asian Americans, those of other races, those of mixed race and Hispanics. Results recalculated to exclude nonresponse. 1The demographic characteristics of the 2014 Religious Landscape Study’s overall sample were weighted to known parameters from the Census Bureau's 2012 American Community Survey (ACS), which helps to ensure that the demographic characteristics of the sample closely match those of the U.S. adult population. See Appendix A for details. PEW RESEARCH CENTER Even as their numbers decline, American Christians – like the U.S. population as a whole – are becoming more racially and ethnically diverse. Non-Hispanic whites now account for smaller shares of evangelical Protestants, mainline Protestants and Catholics than they did seven years earlier, while Hispanics have grown as a share of all three religious groups. Racial and ethnic minorities now make up 41% of Catholics (up from 35% in 2007), 24% of evangelical Protestants (up from 19%) and 14% of mainline Protestants (up from 9%). Religious intermarriage also appears to be on the rise: Among Americans who have gotten married since 2010, nearly four-in-ten (39%) report that they are in religiously mixed marriages, compared with 19% among those who got married before 1960.3 The rise in intermarriage appears to be linked with the growth of the religiously unaffiliated population. Nearly one-in-five people surveyed who got married since 2010 are either religiously unaffiliated respondents who married a Christian spouse or Christians who married an unaffiliated spouse. By contrast, just 5% of people who got married before 1960 fit this profile. While many U.S. religious groups are aging, the unaffiliated are comparatively young – and getting younger, on average, over time. As a rising cohort of highly unaffiliated Millennials reaches adulthood, the median age of unaffiliated adults has dropped to 36, down from 38 in 2007 and far This analysis is based on current, intact marriages. It does not count marriages between spouses with different religions if those marriages ended in divorce (and thus are no longer intact). It also does not include those who may have been in a religiously mixed marriage at the time they got married if one or both spouses later switched religions and now share the same faith. If it were possible to examine religiously mixed marriages that ended in divorce, or religious switching that resulted in both spouses sharing the same faith, then the percentage of intermarriages in previous decades may have been higher than it appears from looking only at marriages that are intact today. 3 www.pewresearch.org 6 PEW RESEARCH CENTER lower than the general (adult) population’s median age of 46.4 By contrast, the median age of mainline Protestant adults in the new survey is 52 (up from 50 in 2007), and the median age of Catholic adults is 49 (up from 45 seven years earlier). These are among the key findings of the Pew Research Center’s second U.S. Religious Landscape Study, a follow-up to its first comprehensive study of religion in America, conducted in 2007. Because the U.S. census does not ask Americans about their religion, there are no official government statistics on the religious composition of the U.S. public.5 Some Christian denominations and other religious bodies keep their own rolls, but they use widely differing criteria for membership and sometimes do not remove members who have fallen away.6 Surveys of the general public frequently include a few questions about religious affiliation, but they typically do not interview enough people, or ask sufficiently detailed questions, to be able to describe the country’s full religious landscape. The Religious Landscape Studies were designed to fill the gap. Comparing two virtually identical surveys, conducted seven years apart, can bring important trends into sharp relief. In addition, the very large samples in both 2007 and 2014 included hundreds of interviews with people from small religious groups that account for just 1% or 2% of the U.S. population, such as Mormons, Episcopalians and Seventh-day Adventists. This makes it possible to paint demographic and religious profiles of numerous denominations that cannot be described by smaller surveys. The most recent Religious Landscape Study also was designed to obtain a minimum of 300 interviews with respondents in each state and the District of Columbia as well as to represent the country’s largest metropolitan areas, enabling an assessment of the religious composition not just of the nation as a whole, but also of individual states and localities. (See Appendix D.) The latest survey was conducted in English and Spanish among a nationally representative sample of 35,071 adults interviewed by telephone, on both cellphones and landlines, from June 4-Sept. 30, 2014. Findings based on the full sample have a margin of sampling error of plus or minus 0.6 percentage points. The survey is estimated to cover 97% of the non-institutionalized U.S. adult population; 3% of U.S. adults are not reachable by telephone or do not speak English or Spanish well enough to participate in the survey. (See Appendix A for more information on how the survey was conducted, margins of error for subgroups analyzed in this report and additional details.) The adult Millennials surveyed in the Religious Landscape Study are people born between 1981 and 1996. For more information on religion and the U.S. Census, see Appendix 3 in the 2007 Religious Landscape Study, "A Brief History of Religion and the U.S. Census." 6 For a compilation of membership figures reported by various denominations, see the 2010 Religious Congregations & Membership Study, which was conducted by the Association of Statisticians of American Religious Bodies. 4 5 www.pewresearch.org 7 PEW RESEARCH CENTER Even a very small margin of error, when applied to the hundreds of millions of people living in the United States, can yield a wide range of estimates for the size of particular faiths. Nevertheless, the results of the second Religious Landscape Study indicate that Christians probably have lost ground, not only in their relative share of the U.S. population, but also in absolute numbers. In 2007, there were 227 million adults in the United States, and a little more than 78% of them – or roughly 178 million – identified as Christians. Between 2007 and 2014, the overall size of the U.S. adult population grew by about 18 million people, to nearly 245 million.7 But the share of adults who identify as Christians fell to just under 71%, or approximately 173 million Americans, a net decline of about 5 million. This decline is larger than the combined margins of sampling error in the twin surveys conducted seven years apart. Using the margins of error to calculate a probable range of estimates, it appears that the number of Christian adults in the U.S. has shrunk by somewhere between 2.8 million and 7.8 million.8 The estimate that there were 227 million adults in the U.S. in 2007 comes from the U.S. Census Bureau's National Intercensal Estimates (2000-2010). The estimate that there were nearly 245 million adults in the U.S. in 2014 comes from Pew Research Center extrapolations of the U.S. Census Bureau's estimates of the monthly postcensal resident population. 8 This report describes the results of the Religious Landscape Study mainly in percentage terms, and it does not include estimates of the number of people who identify with every religious group. Estimates of the size of a few of the largest groups are presented both as point estimates and with accompanying ranges that take into account each survey’s margin of error. For example, the 2014 survey finds that Christians account for 70.6% of the U.S. adult population, with a margin of error of +/- 0.6 percentage points. That is, when measured using the approach employed by this study, Christians probably account for between 70.0% of adults (70.6% minus 0.6) and 71.2% of adults (70.6% plus 0.6). Multiplying the low and high ends of this range of percentages by the number of adults in the U.S. yields an estimate that there are between 171.4 million (0.700*244.8 million) and 174.3 million (0.712*244.8 million) Christian adults in the United States as of 2014. 7 www.pewresearch.org 8 PEW RESEARCH CENTER Of the major subgroups within American Christianity, mainline Protestantism – a tradition that includes the United Methodist Church, the American Baptist Churches USA, the Evangelical Lutheran Church in America, the Presbyterian Church (U.S.A.) and the Episcopal Church, among others – appears to have experienced the greatest drop in absolute numbers. In 2007, there were an estimated 41 million mainline Protestant adults in the United States. As of 2014, there are roughly 36 million, a decline of 5 million – although, taking into account the surveys’ combined margins of error, the number of mainline Protestants may have fallen by as few as 3 million or as many as 7.3 million between 2007 and 2014.9 By contrast, the size of the historically black Protestant tradition – which includes the National Baptist Convention, the Church of God in Christ, the African Methodist Episcopal Church, the Progressive Baptist Convention and others – has remained relatively stable in recent years, at nearly 16 million adults. And evangelical Protestants, while declining slightly as a percentage of the U.S. public, probably have grown in absolute numbers as the overall U.S. population has continued to expand. The estimate that the number of mainline Protestants may have declined by as few as 3 million comes from subtracting the low end of the 2007 estimate (40.1 million) from the high end of the 2014 range (37.1 million). The estimate that the number of mainline Protestants may have declined by as many as 7.3 million comes from subtracting the high end of the 2007 range (42.1 million) from the low end of the 2014 range (34.9 million). 9 www.pewresearch.org 9 PEW RESEARCH CENTER The new survey indicates that churches in the evangelical Protestant tradition – including the Southern Baptist Convention, the Assemblies of God, Churches of Christ, the Lutheran Church-Missouri Synod, the Presbyterian Church in America, 0ther evangelical denominations and many nondenominational congregations – now have a total of about 62 million adult adherents. That is an increase of roughly 2 million since 2007, though once the margins of error are taken into account, it is possible that the number of evangelicals may have risen by as many as 5 million or remained essentially unchanged.10 Like mainline Protestants, Catholics appear to be declining both as a percentage of the population and in absolute numbers. The new survey indicates there are about 51 million Catholic adults in the U.S. today, roughly 3 million fewer than in 2007. But taking margins of error into account, the decline in the number of Catholic adults could be as modest as 1 million.11 And, unlike Protestants, who have been decreasing as a share of the U.S. public for several decades, the Catholic share of the population has been relatively stable over the long term, according to a variety of other surveys (see Appendix C). The estimate that the number of evangelical Protestants may have grown by as many as 5 million comes from subtracting the low end of the 2007 estimate (58.6 million) from the high end of the 2014 range (63.6 million). The estimate that the number of evangelical Protestants may have remained essentially unchanged comes from subtracting the high end of the 2007 range (60.9 million) from the low end of the 2014 range (60.8 million). 11 The estimate that the number of Catholics may have declined by as little as 1 million comes from subtracting the low end of the 2007 estimate (53.2 million) from the high end of the 2014 range (52.2 million). 10 www.pewresearch.org 10 PEW RESEARCH CENTER Meanwhile, the number of religiously unaffiliated adults has increased by roughly 19 million since 2007. There are now approximately 56 million religiously unaffiliated adults in the U.S., and this group – sometimes called religious “nones” – is more numerous than either Catholics or mainline Protestants, according to the new survey. Indeed, the unaffiliated are now second in size only to evangelical Protestants among major religious groups in the U.S. A Note on Defining Religious Affiliation and the Study’s Terminology In this study, respondents’ religious affiliation (also sometimes referred to as “religious identity”) is based on self-reports. Catholics, for instance, are defined as all respondents who say they are Catholic, regardless of their specific beliefs and whether or not they attend Mass regularly. The terms “unaffiliated” and “religious ‘nones’” are used interchangeably throughout this report. This group includes self-identified atheists and agnostics as well as those who describe their religion as “nothing in particular.” The unaffiliated are generally less religiously observant than people who identify with a religion. But not all religious “nones” are nonbelievers. In fact, many people who are unaffiliated with a religion believe in God, pray at least occasionally and think of themselves as spiritual people. Forthcoming reports will describe the Religious Landscape Study’s findings about the religious beliefs and practices of “nones” and other groups. For more details on the exact questions used to measure religious identity, see the survey topline. For more on how Protestant respondents were grouped into particular religious traditions, see Appendix B. www.pewresearch.org 11 PEW RESEARCH CENTER One of the most important factors in the declining share of Christians and the growth of the “nones” is generational replacement. As the Millennial generation enters adulthood, its members display much lower levels of religious affiliation, including less connection with Christian churches, than older generations. Fully 36% of young Millennials (those between the ages of 18 and 24) are religiously unaffiliated, as are 34% of older Millennials (ages 25-33). And fewer than six-in-ten Millennials identify with any branch of Christianity, compared with seven-in-ten or more among older generations, including Baby Boomers and Gen-Xers. Just 16% of Millennials are Catholic, and only 11% identify with mainline Protestantism. Roughly one-in-five are evangelical Protestants. Generational Replacement Helping Drive Growth of Unaffiliated, Decline of Mainline Protestantism and Catholicism Older Millennials Silent generation Baby Boomers Generation X (born 1981(born 1928-1945) (born 1946-1964) (born 1965-1980) 1989) % % % % Christian Younger Millennials (born 19901996) % 85 78 70 57 56 57 52 45 38 36 Evangelical 30 28 25 22 19 Mainline 22 17 13 10 11 Historically black 5 7 7 6 6 Catholic 24 23 21 16 16 Other Christian groups 3 3 4 3 3 Protestant Other faiths 4 5 6 8 8 Unaffiliated 11 17 23 34 36 Don't know/refused * 1 1 1 1 100 100 100 100 100 2014 Religious Landscape Study, conducted June 4-Sept. 30, 2014. Figures may not add to 100%, and nested figures may not add to subtotals indicated, due to rounding. The "other Christian groups" category includes Mormons, Orthodox Christians, Jehovah's Witnesses and a number of smaller Christian groups. PEW RESEARCH CENTER www.pewresearch.org 12 PEW RESEARCH CENTER However, generational replacement is by no means the only reason that religious “nones” are growing and Christians are declining. In addition, people in older generations are increasingly disavowing association with organized religion. About a third of older Millennials (adults currently in their late 20s and early 30s) now say they have no religion, up nine percentage points Unaffiliated Make Up Growing Share among this cohort since 2007, when the same Across Generations group was between ages 18 and 26. Nearly a % of each generation that identifies current religion as quarter of Generation Xers now say they have atheist, agnostic or nothing in particular no particular religion or describe themselves as 2007 2014 Change atheists or agnostics, up four points in seven Silent generation (b. 1928-1945) 9 11 +2 years. Baby Boomers also have become slightly Baby Boomers (b.1946-1964) 14 17 +3 but noticeably more likely to identify as Generation X (b. 1965-1980) 19 23 +4 religious “nones” in recent years. Older Millennials (b. 1981-1989) 25 34 +9 Younger Millennials (b. 1990-1996) n/a 36 n/a As the shifting religious profiles of these 2014 Religious Landscape Study, conducted June 4-Sept. 30, 2014. All changes are statistically significant. generational cohorts suggest, switching religion PEW RESEARCH CENTER is a common occurrence in the United States. If all Protestants were treated as a single religious group, then fully 34% of American adults currently have a religious identity different from the one in which they were raised. This is up six points since 2007, when 28% of adults identified with a religion different from their childhood faith. If switching among the three Protestant traditions (e.g., from mainline Protestantism to the evangelical tradition, or from evangelicalism to a historically black Protestant denomination) is added to the total, then the share of Americans who currently have a different religion than they did in childhood rises to 42%. By a wide margin, religious “nones” have experienced larger gains through religious switching than any other group. Nearly one-in-five U.S. adults (18%) were raised in a religious faith and now identify with no religion. Some switching also has occurred in the other direction: 9% of American adults say they were raised with no religious affiliation, and almost half of them (4.3% of all U.S. adults) now identify with some religion. But for every person who has joined a religion after having been raised unaffiliated, there are more than four people who have become religious “nones” after having been raised in some religion. This 1:4 ratio is an important factor in the growth of the unaffiliated population. www.pewresearch.org 13 PEW RESEARCH CENTER By contrast, Christianity – and especially Catholicism – has been losing more adherents through religious switching than it has been gaining. More than 85% of American adults were raised Christian, but nearly a quarter of those who were raised Christian no longer identify with Christianity. Former Christians represent 19.2% of U.S. adults overall. Unaffiliated Make Big Gains Through Religious Switching; Catholics and Mainline Protestants Suffer Large Losses Share of U.S. adults … Raised in Left group group % % Christian Protestant Entered Currently NET group in group change % % 85.6 -19.2 +4.2 70.6 -15.0 50.2 -13.0 +9.4 46.5 -3.7 Evangelical 23.9 -8.4 +9.8 25.4 +1.5 Mainline 19.0 -10.4 +6.1 14.7 -4.3 Historically black 7.3 -2.2 +1.4 6.5 -0.8 Catholic 31.7 -12.9 +2.0 20.8 -10.9 Unaffiliated 9.2 -4.3 +18.0 22.8 +13.6 2014 Religious Landscape Study, conducted June 4-Sept. 30, 2014. Both the mainline and PEW RESEARCH CENTER historically black Protestant traditions have lost more members than they have gained through religious switching, but within Christianity the greatest net losses, by far, have been experienced by Catholics. Nearly one-third of American adults (31.7%) say they were raised Catholic. Among that group, fully 41% no longer identify with Catholicism. This means that 12.9% of American adults are former Catholics, while just 2% of U.S. adults have converted to Catholicism from another religious tradition. No other religious group in the survey has such a lopsided ratio of losses to gains. The evangelical Protestant tradition is the only major Christian group in the survey that has gained more members than it has lost through religious switching. Roughly 10% of U.S. adults now identify with evangelical Protestantism after having been raised in another tradition, which more than offsets the roughly 8% of adults who were raised as evangelicals but have left for another religious tradition or who no longer identify with any organized faith. Other highlights in this report include: The Christian share of the population is declining and the religiously unaffiliated share is growing in all four major geographic regions of the country. Religious “nones” now constitute 19% of the adult population in the South (up from 13% in 2007), 22% of the population in the Midwest (up from 16%), 25% of the population in the Northeast (up from 16%) and 28% of the population in the West (up from 21%). In the West, the religiously unaffiliated are more numerous than Catholics (23%), evangelicals (22%) and every other religious group. www.pewresearch.org 14 PEW RESEARCH CENTER Whites continue to be more likely than both blacks and Hispanics to identify as religiously unaffiliated; 24% of whites say they have no religion, compared with 20% of Hispanics and 18% of blacks. But the religiously unaffiliated have grown (and Christians have declined) as a share of the population within all three of these racial and ethnic groups. The percentage of college graduates who identify with Christianity has declined by nine percentage points since 2007 (from 73% to 64%). The Christian share of the population has declined by a similar amount among those with less than a college education (from 81% to 73%). Religious “nones” now constitute 24% of all college graduates (up from 17%) and 22% of those with less than a college degree (up from 16%). More than a quarter of men (27%) now describe themselves as religiously unaffiliated, up from 20% in 2007. Fewer women are religious “nones,” but the religiously unaffiliated are growing among women at about the same rate as among men. Nearly one-in-five women (19%) now describe themselves as religiously unaffiliated, up from 13% in 2007. Although it is low relative to other religious groups, the retention rate of the unaffiliated has increased. In the current survey, 53% of those raised as religiously unaffiliated still identify as “nones” in adulthood, up seven points since 2007. And among Millennials, “nones” actually have one of the highest retention rates of all the religious categories that are large enough to analyze in the survey. As the ranks of the religiously unaffiliated continue to grow, they also describe themselves in increasingly secular terms. In 2007, 25% of the “nones” called themselves atheists or agnostics; 39% identified their religion as “nothing in particular” and also said that religion is “not too” or “not at all” important in their lives; and 36% identified their religion as “nothing in particular” while nevertheless saying that religion is either “very important” or “somewhat important” in their lives. The new survey finds that the atheist and agnostic share of the “nones” has grown to 31%. Those identifying as “nothing in particular” and describing religion as unimportant in their lives continue to account for 39% of all “nones.” But the share identifying as “nothing in particular” while also affirming that religion is either “very” or “somewhat” important to them has fallen to 30% of all “nones.” While the mainline Protestant share of the population is significantly smaller today than it was in 2007, the evangelical Protestant share of the population has remained comparatively stable (ticking downward slightly from 26.3% to 25.4% of the population). As a result, evangelicals now constitute a clear majority (55%) of all U.S. Protestants. In 2007, roughly half of Protestants (51%) identified with evangelical churches. www.pewresearch.org 15 PEW RESEARCH CENTER Since 2007, the share of evangelical Protestants who identify with Baptist denominations has shrunk from 41% to 36%. Meanwhile, the share of evangelicals identifying with nondenominational churches has grown from 13% to 19%. The United Methodist Church (UMC) continues to be the largest denomination within the mainline Protestant tradition. Currently, 25% of mainline Protestants identify with the UMC, down slightly from 28% in 2007. More than six-in-ten people in the historically black Protestant tradition identify with Baptist denominations, including 22% who identify with the National Baptist Convention, the largest denomination within the historically black Protestant tradition. The share of the public identifying with religions other than Christianity has grown from 4.7% in 2007 to 5.9% in 2014. Gains were most pronounced among Muslims (who accounted for 0.4% of respondents in the 2007 Religious Landscape Study and 0.9% in 2014) and Hindus (0.4% in 2007 vs. 0.7% in 2014).12 Roughly one-in-seven participants in the new survey (15%) were born outside the U.S., and two-thirds of those immigrants are Christians, including 39% who are Catholic. More than one-in-ten immigrants identify with a non-Christian faith, such as Islam or Hinduism. Hindus and Jews continue to be the most highly educated religious traditions. Fully 77% of Hindus are college graduates, as are 59% of Jews (compared with 27% of all U.S. adults). These groups also have above-average household incomes. Fully 44% of Jews and 36% of Hindus say their annual family income exceeds $100,000, compared with 19% of the public overall. In 2007 and 2011, the Pew Research Center conducted national surveys of Muslim Americans. Those surveys were conducted in Arabic, Farsi and Urdu, as well as in English, so as to better represent the views of Muslim immigrants. Previously released population estimates based on those surveys indicated that 0.6% of adults identified as Muslims in 2007 and 0.8% of adults identified as Muslims in 2011. Surveys like the Religious Landscape Study, conducted in English and Spanish, tend to produce lower estimates of the size of certain immigrant populations than surveys conducted in more languages. In any case, both sets of estimates – those based on Muslim-specific surveys and those based on the 2007 and 2014 Religious Landscape Studies – suggest that the Muslim population in the U.S. is growing. 12 www.pewresearch.org 16 PEW RESEARCH CENTER This is the first report on findings from the 2014 U.S. Religious Landscape Study, the centerpiece of which is a nationally representative telephone survey of 35,071 adults. This is the second time the Pew Research Center has conducted a Religious Landscape Study. The first was conducted in 2007, also with a telephone survey of more than 35,000 Americans. The new study is designed to serve three main purposes: To provide a detailed account of the size of the religious groups that populate the U.S. landscape; To describe the demographic characteristics, religious beliefs and practices, and social and political values of those religious groups; and To document how the religious profile of the U.S. has changed since the first study was conducted in 2007. With more than 35,000 interviews each, both the 2007 and 2014 studies have margins of error of less than one percentage point, making it possible to identify even relatively small changes in religious groups’ share of the U.S. population. The results of the 2014 Religious Landscape Study will be published in a series of reports over the coming year. This first report focuses on the changing religious composition of the U.S. and describes the demographic characteristics of U.S. religious groups, including their median age, racial and ethnic makeup, nativity data, education and income levels, gender ratios, family composition (including religious intermarriage rates) and geographic distribution. It also summarizes patterns in religious switching. In addition, this report includes an appendix that compares the findings of the 2007 and 2014 Religious Landscape Studies with several other surveys and assesses how recent developments in American religion fit into longer-term trends. Data from a variety of national surveys, including the long-running General Social Survey and Gallup polls, confirm that Protestants have been declining as a share of the U.S. population and that the unaffiliated have been growing. But there is less of a consensus about trends in American Catholicism. Some surveys, including the one featured in this report, indicate that the Catholic share of the population is declining, while others suggest it is relatively stable or may have declined and then ticked back up in recent years. (See Appendix C.) www.pewresearch.org 17 PEW RESEARCH CENTER Other findings from the 2014 Religious Landscape Study will be released later this year. In addition to the written reports, the Religious Landscape Study’s findings will be available through a new interactive tool. The online presentation allows users to delve more deeply into the survey’s findings, build interactive maps or charts and explore the data most interesting to them. Many individuals from the Pew Research Center contributed to this report. Alan Cooperman, director of religion research, oversaw the effort and served as the primary editor. Gregory Smith, associate director for religion research, served as the primary researcher and wrote the Overview and Methodology. Smith also wrote the chapter on the changing religious composition of the U.S., the appendix on the classification of Protestant denominations and the appendix on putting the findings from the Religious Landscape Study into context. The chapter on religious switching and intermarriage was written by Research Associate Becka Alper. Research Associate Jessica Martinez and Research Assistant Claire Gecewicz wrote the chapter on the demographic profiles of religious groups, and Research Analyst Elizabeth Sciupac wrote the chapter on the shifting religious identity of demographic groups. Gecewicz prepared the detailed tables. The report was number checked by Alper, Gecewicz, Martinez, Sciupac and Research Associate Besheer Mohamed. The report was edited by Sandra Stencel, Michael Lipka, Caryle Murphy and Aleksandra Sandstrom. Bill Webster created the graphics. Stacy Rosenberg, Russell Heimlich, Diana Yoo, Besheer Mohamed, Ben Wormald and Juan Carlos Esparza Ochoa developed the interactive tool. Others at the Pew Research Center who provided research guidance include Michael Dimock, Claudia Deane, Scott Keeter, Andy Kohut and Conrad Hackett. Communications support was provided by Katherine Ritchey, Stefan Cornibert, Russ Oates and Robyn Tomlin. John C. Green, director of the Ray C. Bliss Institute of Applied Politics at the University of Akron, served as a senior adviser on the Religious Landscape Studies, providing valuable advice on the survey questionnaires, categorization of respondents and drafts of the reports. Additionally, we received helpful comments on portions of the 2014 study from David E. Campbell, director, Rooney Center for the Study of American Democracy, University of Notre Dame; William D’Antonio, senior fellow, Institute for Policy Research and Catholic Studies, The Catholic University of America; Mike Hout, professor of sociology, New York University; and Barry Kosmin, director, Institute for the Study of Secularism in Society and Culture, Trinity College. We also received valuable advice from Luis Lugo, former director of the Pew Research Center’s Religion & Public Life project, and Paul Taylor, former executive vice president of the Pew Research Center. www.pewresearch.org 18 PEW RESEARCH CENTER Funding for the 2014 Religious Landscape Study comes from The Pew Charitable Trusts, which received generous support for the project from the Lilly Endowment. While the analysis was guided by our consultations with the advisers, the Pew Research Center is solely responsible for the interpretation and reporting of the data. www.pewresearch.org 19 PEW RESEARCH CENTER The remainder of this report explores in greater depth many of the key findings summarized in this Overview. Chapter 1 offers a detailed look at the religious composition of the United States and how it has changed in recent years. Chapter 2 examines patterns in religious switching and intermarriage. Chapter 3 provides a demographic profile of the major religious traditions in the United States. Chapter 4 then flips the lens, looking at the religious profile of Americans in various demographic groups. Appendix A describes the methodology used to conduct the study. Appendix B provides details on how Protestants were categorized into one of three major Protestant traditions (the evangelical tradition, the mainline tradition and the historically black Protestant tradition) based on the specific denomination with which they identify. Appendix C compares findings from the Religious Landscape Studies with other major religion surveys and puts the current results into the context of longer-term trends. www.pewresearch.org 20 PEW RESEARCH CENTER Chapter 1: The Changing Religious Composition of the U.S. Christians remain by far the largest religious group in the United States, but the Christian share of the population has declined markedly. In the past seven years, the percentage of adults who describe themselves as Christians has dropped from 78.4% to 70.6%. Once an overwhelmingly Protestant nation, the U.S. no longer has a Protestant majority. In 2007, when the Pew Research Center conducted its first Religious Landscape Study, more than half of adults (51.3%) identified as Protestants. Today, by comparison, 46.5% of adults describe themselves as Protestants. While there have been declines across a variety of Protestant denominations, the most pronounced changes have occurred in churches in the mainline Protestant tradition, such as the United Methodist Church and the Evangelical Lutheran Church in America. The share of adults belonging to mainline churches dropped from 18.1% in 2007 to 14.7% in 2014. This is similar to the drop seen among U.S. Catholics, whose share of the population declined from 23.9% to 20.8% during the same seven-year period. In contrast with mainline Protestantism, there has been less change in recent years in the proportion of the population that belongs to churches in the evangelical or historically black Protestant traditions. Evangelicals now make up a clear majority (55%) of all U.S. Protestants. In 2007, 51% of U.S. Protestants identified with evangelical churches. While the overall Christian share of the population has dropped in recent years, the number of Americans who do not identify with any religion has soared. Nearly 23% of all U.S. adults now say they are religiously unaffiliated, up from about 16% in 2007. While most of the unaffiliated describe themselves as having “no particular religion,” a growing share say they are atheists or agnostics. This chapter takes a close look at the current religious composition of the United States and how it has changed since 2007. A full-page table summarizes the religious affiliation of U.S. adults in a way that captures small groups that make up less than 1% of the population. The chapter also explains how Protestant respondents were sorted into the three distinct Protestant traditions – the evangelical Protestant tradition, the mainline Protestant tradition and the historically black Protestant tradition – and it documents which Protestant denominations are shrinking, and which are growing. Finally, the chapter examines the growth of non-Christian religions in the U.S. and takes a closer look at the composition of the religiously unaffiliated population. www.pewresearch.org 21 PEW RESEARCH CENTER Summary Table: Religious Composition of U.S. Adults % of U.S. adult pop. 2007 2014 Evangelical Protestant churches Baptist in the evangelical tradition Southern Baptist Convention Independent Baptist in the evangelical tradition Conservative Baptist Association of America Free Will Baptist General Association of Regular Baptists Missionary Baptist in the evangelical tradition Other Baptist in the evangelical tradition Methodist in the evangelical tradition Nondenominational in the evangelical tradition Nondenominational evangelical Nondenominational charismatic Interdenominational in the evangelical tradition Nondenominational fundamentalist Community Church in the evangelical tradition “Nondenominational Christian” in the evangelical tradition Other nondenominational in the evangelical tradition Lutheran in the evangelical tradition Lutheran Church-Missouri Synod Lutheran Church-Wisconsin Synod Other Lutheran in the evangelical tradition Presbyterian in the evangelical tradition Presbyterian Church in America Other Presbyterian in the evangelical tradition Pentecostal in the evangelical tradition Assemblies of God Church of God (Cleveland, Tenn.) Apostolic Pentecostal in the evangelical tradition Calvary Chapel Church of God of the Apostolic Faith Foursquare Church Nondenominational Pentecostal in the evangelical tradition Pentecostal Church of God Pentecostal Holiness Church Other Pentecostal in the evangelical tradition Episcopalian/Anglican in the evangelical tradition Restorationist in the evangelical tradition Churches of Christ Christian Churches and Churches of Christ Other Restorationist in the evangelical tradition Congregationalist in the evangelical tradition Conservative Congregational Christian Conference Other Congregationalist in the evangelical tradition Holiness in the evangelical tradition Church of the Nazarene Free Methodist Church Christian and Missionary Alliance Church of God (Anderson, Ind.) Wesleyan Church Other Holiness in the evangelical tradition Reformed in the evangelical tradition Christian Reformed Church Other Reformed in the evangelical tradition Adventist in the evangelical tradition Seventh-day Adventist Other Adventist group in the evangelical tradition Anabaptist in the evangelical tradition Pietist in the evangelical tradition Other evangelical/fundamentalist Protestant non-specific in the evangelical tradition 26.3 10.8 6.7 2.5 <0.3 <0.3 <0.3 <0.3 1.1 <0.3 3.4 1.2 0.5 0.5 0.3 <0.3 <0.3 0.8 1.8 1.4 <0.3 <0.3 0.8 0.4 0.4 3.4 1.4 0.4 <0.3 <0.3 <0.3 <0.3 <0.3 <0.3 <0.3 0.9 <0.3 1.7 1.5 <0.3 <0.3 <0.3 <0.3 <0.3 1.0 0.3 0.3 <0.3 <0.3 <0.3 <0.3 <0.3 <0.3 <0.3 0.5 0.4 <0.3 <0.3 <0.3 0.3 1.9 25.4 9.2 5.3 2.5 <0.3 <0.3 <0.3 <0.3 1.0 <0.3 4.9 2.0 0.6 0.6 0.3 <0.3 <0.3 1.2 1.5 1.1 <0.3 0.3 0.8 0.4 0.4 3.6 1.4 0.4 <0.3 <0.3 <0.3 <0.3 <0.3 <0.3 <0.3 1.1 <0.3 1.6 1.5 <0.3 <0.3 <0.3 <0.3 <0.3 0.7 0.3 <0.3 <0.3 <0.3 <0.3 <0.3 <0.3 <0.3 <0.3 0.6 0.5 <0.3 0.3 <0.3 0.3 1.5 % of U.S. adult pop. 2007 2014 Mainline Protestant churches Baptist in the mainline tradition American Baptist Churches USA Other Baptist in the mainline tradition Methodist in the mainline tradition United Methodist Church Other Methodist in the mainline tradition Nondenominational in the mainline tradition Interdenominational in the mainline tradition Other nondenominational in the mainline tradition Lutheran in the mainline tradition Evangelical Lutheran Church in America (ELCA) Other Lutheran in the mainline tradition Presbyterian in the mainline tradition Presbyterian Church USA Other Presbyterian in the mainline tradition Episcopalian/Anglican in the mainline tradition Episcopal Church Anglican Church (Church of England) Other Episcopalian/Anglican in the mainline tradition Restorationist in the mainline tradition Disciples of Christ Other Restorationist in the mainline tradition Congregationalist in the mainline tradition United Church of Christ Other Congregationalist in the mainline tradition Reformed in the mainline tradition Reformed Church in America Other Reformed in the mainline tradition Anabaptist in the mainline tradition Friends in the mainline tradition Other/Protestant non-specific in the mainline tradition 18.1 1.9 1.2 0.7 5.4 5.1 0.4 0.9 0.3 0.6 2.8 2.0 0.9 1.9 1.1 0.7 1.4 1.0 0.3 <0.3 0.4 0.3 <0.3 0.7 0.5 <0.3 <0.3 <0.3 <0.3 <0.3 <0.3 2.5 14.7 2.1 1.5 0.6 3.9 3.6 0.3 1.0 0.3 0.7 2.1 1.4 0.7 1.4 0.9 0.5 1.2 0.9 <0.3 <0.3 0.3 <0.3 <0.3 0.5 0.4 <0.3 <0.3 <0.3 <0.3 <0.3 <0.3 1.9 Historically black churches Baptist in the historically black Protestant tradition National Baptist Convention Progressive Baptist Convention Independent Baptist in historically black Prot. tradition Missionary Baptist in historically black Prot. tradition Other Baptist in the historically black Prot. tradition Methodist in the historically black Protestant tradition African Methodist Episcopal African Methodist Episcopal Zion Church Christian Methodist Episcopal Church Other Methodist in the historically black Prot. tradition Nondenominational in the historically black Prot. tradition Pentecostal in the historically black Protestant tradition Church of God in Christ Apostolic Pentecostal in the historically black Prot. tradition United Pentecostal Church International Other Pentecostal in the historically black Prot. tradition Holiness in the historically black Prot. tradition Protestant non-specific in the historically black Prot. tradition 6.9 4.4 1.8 0.3 0.5 <0.3 1.8 0.6 0.4 <0.3 <0.3 <0.3 <0.3 0.9 0.6 <0.3 <0.3 <0.3 <0.3 0.5 6.5 4.0 1.4 0.3 <0.3 0.3 1.8 0.5 0.3 <0.3 <0.3 <0.3 0.3 1.0 0.6 <0.3 <0.3 0.3 <0.3 0.4 Catholic % of U.S. adult pop. 2007 2014 23.920.8 Mormon 1.71.6 Jehovah’s Witness 0.7 0.8 Orthodox Christian Greek Orthodox Russian Orthodox Orthodox Church in America Other Orthodox Christian 0.6 <0.3 <0.3 <0.3 <0.3 0.5 <0.3 <0.3 <0.3 <0.3 Other Christian Metaphysical Spiritualist Unity Church Other Metaphysical Other in the “other Christian” tradition 0.3 0.4 <0.3<0.3 <0.3<0.3 <0.3 <0.3 <0.3 <0.3 <0.3 <0.3 Jewish 1.71.9 Buddhist 0.70.7 Muslim 0.40.9 Hindu 0.40.7 Other world religions <0.3 Other faiths Unitarians and other liberal faiths Unitarian (Universalist) Spiritual but not religious Deist Humanist Bit of everything, “own beliefs” Other liberal faith groups New Age Pagan/Wiccan Other New Age Native American Religions 1.2 1.5 0.7 1.0 0.3 0.3 <0.3 0.3 <0.3<0.3 <0.3<0.3 <0.3 <0.3 <0.3 <0.3 0.4 0.4 0.30.3 <0.3 <0.3 <0.3 <0.3 Unaffiliated Atheist Agnostic Nothing in particular 16.1 22.8 1.63.1 2.44.0 12.1 15.8 Don’t know/refused 0.8 0.3 0.6 22 PEW RESEARCH CENTER American Protestantism is diverse, encompassing more than a dozen major denominational families – such as Baptists, Methodists, Lutherans and Pentecostals – all with unique beliefs, practices and histories. These denominational families, in turn, are made up of a host of different denominations, such as the Southern Baptist Convention, the American Baptist Churches USA and the National Baptist Convention. Because of this great diversity, American Protestantism is best understood not as a single religious tradition but rather as three distinct traditions – the evangelical Protestant tradition, the mainline Protestant tradition and the historically black Protestant tradition. Each of these traditions is made up of numerous denominations and congregations that share similar beliefs, practices and histories. For instance, churches within the evangelical tradition tend to share religious beliefs (including the conviction that personal acceptance of Jesus Christ is the only way to salvation), practices (like an emphasis on bringing other people to the faith) and origins (including separatist movements against established religious institutions). Churches in the mainline tradition, by contrast, share other doctrines (such as a less exclusionary view of salvation), practices (such as a strong emphasis on social reform) and origins. Churches in the historically black Protestant tradition have been shaped uniquely by the experiences of slavery and segregation, which put their religious beliefs and practices in a special context. www.pewresearch.org The Terminology of Religious Identity Denominations: The term “denomination” refers to a set of congregations that belong to a single administrative structure characterized by particular doctrines and practices. Examples of denominations include the Southern Baptist Convention, the American Baptist Churches USA and the National Baptist Convention. Families: A denominational family is a set of religious denominations and related congregations with a common historical origin. Examples of families include Baptists, Methodists and Lutherans. Most denominational families consist of denominations that are associated with more than one of the three Protestant traditions. The Baptist family, for instance, consists of some denominations that fall into the evangelical tradition, others that belong to the mainline tradition and still others that are part of the historically black Protestant tradition. Traditions: A religious tradition is a set of denominations and congregations with similar beliefs, practices and origins. In this report, Protestant denominations are grouped into three traditions: the evangelical tradition, the mainline tradition and the historically black Protestant tradition. 23 PEW RESEARCH CENTER As much as possible, Protestant respondents were categorized into one of the three Protestant traditions based not on their denominational family, but rather on the specific denomination with which they identify. Most Protestant denominational families include denominations that are associated with different Protestant traditions. For example, some Baptist denominations (like the Southern Baptist Convention) are part of the evangelical tradition; others (such as the American Baptist Churches USA) are part of the mainline tradition; and still others (such as the National Baptist Convention) are part of the historically black Protestant Denominational Families Include Protestant tradition. Denominations Associated With Different Traditions Overall, 60% of Baptists in the survey identify with denominations in the evangelical tradition; 14% associate with denominations in the mainline Protestant tradition, and 26% identify with denominations that are part of the historically black Protestant tradition. (While the Baptist family of denominations includes churches in all three Protestant traditions, this is not the case for all denominational families, some of which have members in just one or two of the Protestant traditions.) Evangelical Protestant tradition % Mainline Protestant tradition % Historically black Protestant tradition % Baptist 60 14 26=100 Nondenominational 78 16 6 Pentecostal 77 0 23 Restorationist 87 13 0 Holiness 88 0 12 Adventist 100 0 0 Anabaptist 84 16 0 Largely evangelical denominational families Largely mainline denominational families Methodist 4 85 11 Lutheran 41 59 0 Presbyterian 36 64 0 Episcopalian/Anglican 2 98 0 Congregationalist 15 85 0 Protestant non-specific 39 50 11 2014 Religious Landscape Study, conducted June 4-Sept. 30, 2014. Figures may not add to 100% due to rounding. PEW RESEARCH CENTER Despite the detailed denominational measures used in the Religious Landscape Study, many respondents (more than a quarter of all Protestants) were either unable or unwilling to describe their specific denominational affiliation. For instance, some respondents describe themselves as www.pewresearch.org 24 PEW RESEARCH CENTER “just a Baptist” or “just a Methodist.” Respondents with this type of vague denominational affiliation were sorted into one of the three Protestant traditions in two ways.13 First, blacks who gave vague denominational affiliations (e.g., “just a Methodist”) but who said they belong to a Protestant family with a sizable number of historically black churches (including the Baptist, Methodist, nondenominational, Pentecostal and Holiness families) were coded as members of the historically black Protestant tradition. Black respondents in denominational families without a sizable number of churches in the historically black Protestant tradition were coded as members of the evangelical or mainline Protestant traditions depending on their response to a separate question asking whether they would identify as a born-again or evangelical Christian. Second, non-black respondents who gave vague denominational identities and who described themselves as born-again or evangelical Christians were coded as members of the evangelical tradition; otherwise, they were coded as members of the mainline tradition.14 Overall, 38% of Protestants offered a vague denominational identity and thus were classified on the basis of their race and/or their answer to the question about whether they identify as a bornagain or evangelical Christian. This includes 36% of those in the evangelical tradition, 35% of those in the mainline tradition and 53% of those in the historically black Protestant tradition. The same approach described here for categorizing a respondent’s current religious tradition was used to define the traditions in which respondents were raised (see Q.J1-Q.J3v and CHBORN) and the tradition with which the respondent’s spouse or partner identifies (see Q.K1Q.K3v, SPBORN, SPHISP and SPRACE). 14 Full details on the sorting of respondents into Protestant traditions are provided in Appendix B. Of course, some denominations are difficult to classify, and other researchers may prefer to employ alternative strategies for categorizing denominations into religious traditions or use different criteria for sorting respondents who offer a vague religious identity. As with all Pew Research Center surveys, the raw dataset from the Religious Landscape Study will be made freely available to scholars and others wishing to conduct secondary analysis, providing the opportunity to explore new and innovative approaches to categorizing religion and yielding new insights in this important area. 13 www.pewresearch.org 25 PEW RESEARCH CENTER Recent years have brought a dramatic decline in the share of Americans who identify with mainline Protestant denominations. Today, just 15% of all U.S. adults identify with mainline Protestant churches, down from 18% in 2007. By comparison, evangelical Protestantism and the historically black Protestant tradition have been more stable. Today, 25% of U.S. adults identify with evangelical denominations, down less than one percentage point since 2007. And roughly 7% of American adults identify with the historically black Protestant tradition, little changed since 2007. The mainline tradition’s share of the Protestant population has declined along with its share of the overall population. Today, 32% of Protestants identify with denominations in the mainline tradition, down from 35% in 2007. Evangelicals now constitute a clear majority of all Protestants in the U.S., with their share of the Protestant population having risen from 51% in 2007 to 55% in 2014. Biggest Declines Seen Among Mainline Protestants Among all U.S. adults Among Protestants 2007 % 2014 % Change 2007 % 2014 % Change Evangelical tradition 26.3 25.4 -0.9 51 55 +4 Mainline tradition 18.1 14.7 -3.4 35 32 -3 Historically black Protestant tradition 6.9 6.5 -0.4 13 14 +1 =51.3% =46.5% -4.7 100 100 NET Protestants 2014 Religious Landscape Study, conducted June 4-Sept. 30, 2014. Figures may not add to 100% due to rounding. PEW RESEARCH CENTER www.pewresearch.org 26 PEW RESEARCH CENTER Many Protestant denominational families have seen their share of the U.S. population fall since 2007. Baptists now account for approximately 15% of the adult population, down from 17% in 2007. Methodists and Lutherans also have declined by more than a full percentage point in recent years. The family that shows the most significant growth is the nondenominational family; today, 6.2% of all adults (and 13% of Protestants) identify with nondenominational churches, up from 4.5% of all adults (and 9% of all Protestants) in 2007. Nondenominational Share of the Protestant Population Grows Among all U.S. adults Largely evangelical denominational families 2007 % 2014 % Baptist 17.2 Nondenominational 4.5 Pentecostal Restorationist Holiness Among Protestants Change 2007 % 2014 % Change 15.4 -1.8 33 33 0 6.2 +1.7 9 13 +4 4.4 4.6 +0.2 9 10 +1 2.1 1.9 -0.2 4 4 0 1.2 0.8 -0.4 2 2 0 Adventist 0.5 0.6 +0.1 1 1 0 Anabaptist <0.3 0.3 n/a * 1 +1 Reformed 0.3 <0.3 n/a 1 * -1 Pietist <0.3 <0.3 n/a * * 0 Other evangelical/fundamentalist 0.3 0.3 0.0 1 1 0 Methodist 6.2 4.6 -1.6 12 10 -2 Lutheran 4.6 3.5 -1.1 9 8 -1 Presbyterian 2.7 2.2 -0.5 5 5 0 Episcopalian/Anglican 1.5 1.3 -0.2 3 3 0 Congregationalist 0.8 0.6 -0.2 1 1 0 Friends <0.3 <0.3 n/a * * 0 4.9 3.8 -1.1 9 8 -1 =51.3% =46.5% -4.7 100 100 Largely mainline denominational families Protestant non-specific NET Protestants 2014 Religious Landscape Study, conducted June 4-Sept. 30, 2014. Figures may not add to 100% due to rounding. PEW RESEARCH CENTER www.pewresearch.org 27 PEW RESEARCH CENTER The Southern Baptist Convention (an evangelical denomination) and the United Methodist Church (a mainline denomination) continue to be the two largest Protestant denominations in the U.S.; 11% of Protestants identify with the Southern Baptist Convention and 8% identify with the United Methodist Church. Both denominations, however, have experienced declines in their relative share of the population. In the 2014 Religious Landscape Study, 5.3% of all U.S. adults identify with the Southern Baptist Convention (down from 6.7% in 2007) and 3.6% identify with the United Methodist Church (down from 5.1% in 2007). Fifteen Largest Protestant Denominations Among all U.S. adults 2007 2014 % % Southern Baptist Convention (evangelical tradition) 6.7 5.3 United Methodist Church (mainline tradition) 5.1 American Baptist Churches USA (mainline) 1.2 Church of Christ (evangelical) 1.5 Evangelical Lutheran Church in America (mainline) 2.0 National Baptist Convention (historically black tradition) Change Among Protestants 2007 2014 % % -1.4 13 11 3.6 -1.5 10 8 -2 1.5 +0.3 2 3 +1 1.5 0.0 3 3 0 1.4 -0.6 4 3 -1 1.8 1.4 -0.4 3 3 0 Assemblies of God (evangelical) 1.4 1.4 0.0 3 3 0 Lutheran Church-Missouri Synod (evangelical) 1.4 1.1 -0.3 3 2 -1 Presbyterian Church (U.S.A.) (mainline) 1.1 0.9 -0.2 2 2 0 Episcopal Church (mainline) 1.0 0.9 -0.1 2 2 0 Church of God in Christ (historically black) 0.6 0.6 0.0 1 1 0 Seventh-day Adventist (evangelical) 0.4 0.5 +0.1 1 1 0 United Church of Christ (mainline) 0.5 0.4 -0.1 1 1 0 Presbyterian Church in America (evangelical) 0.4 0.4 0.0 1 1 0 Church of God (Cleveland, Tenn.) (evangelical) 0.4 0.4 0.0 1 1 0 2014 Religious Landscape Study, conducted June 4-Sept. 30, 2014. Figures may not add to 100% due to rounding. PEW RESEARCH CENTER www.pewresearch.org Change -2 28 PEW RESEARCH CENTER The 2014 Religious Landscape Study finds that 5.9% of U.S. adults identify with faiths other than Christianity, up slightly, but significantly, from 4.7% in 2007. The largest of these faiths is Judaism, with 1.9% of respondents identifying Growing Minority Identifies With Faiths Other Than themselves as Jewish when Christianity asked about their religion. Change 2007 2014 Among Jews surveyed, 44% % % identify with Reform Judaism, Jewish 1.7 1.9 +0.2 22% with Conservative Muslim 0.4 0.9 +0.5 Judaism, 14% with Orthodox Buddhist 0.7 0.7 0.0 Hindu 0.4 0.7 +0.3 Judaism, 5% with other Other world religions <0.3 0.3 n/a Jewish movements and 16% Other faiths 1.2 1.5 +0.3 with no particular Jewish NET Identify with non-Christian faith 4.7 5.9 +1.2 denomination. These findings 2014 Religious Landscape Study, conducted June 4-Sept. 30, 2014. Figures may not add to are broadly similar to results totals indicated due to rounding. from the Pew Research PEW RESEARCH CENTER Center’s 2013 survey of Jewish Americans.15 Muslims (0.9%), Buddhists (0.7%) and Hindus (0.7%) each make up slightly less than 1% of respondents in the 2014 Religious Landscape Study. The Muslim and Hindu shares of the population have risen significantly since 2007. And it is possible, even despite this growth, that the Religious Landscape Study may underestimate the size of these groups. The study was conducted in English and Spanish, which means that groups with above-average numbers of people who do not speak English or Spanish (such as immigrants from Asia, Africa and other parts of the world) may be underrepresented. For instance, an analysis of the Pew Research Center’s 2012 survey of Asian Americans (conducted in English, Cantonese, Hindi, Japanese, Korean, Mandarin, Tagalog and Vietnamese) estimated that Buddhists account for between 1.0% and 1.3% of the U.S. adult population, and that Hindus account for between 0.5% and 0.8% of the population. The Pew Research Center’s 2007 and 2011 surveys of Muslim Americans (conducted in English, Arabic, Pew Research Center’s 2013 report “A Portrait of Jewish Americans” includes detailed information on the size and characteristics of the Jewish population in the United States, including an estimate of the number of adults who identify with the Jewish faith (“Jews by religion”) as well as those who identify as culturally or ethnically Jewish but not religiously Jewish (“Jews of no religion”). The 2014 Religious Landscape Study analyzes only “Jews by religion.” The center’s 2013 survey of Jews and the 2014 Landscape Study produce similar estimates of the size of the “Jews by religion” population (1.8% in the survey of Jews, 1.9% in the Landscape Study). The studies also find similar results regarding the denominational identity of “Jews by religion”; in the 2013 survey of U.S. Jews, 40% of “Jews by religion” identified with Reform Judaism, 22% with Conservative Judaism, 12% with Orthodox Judaism, 5% with other Jewish denominational movements and 19% with no denomination. 15 www.pewresearch.org 29 PEW RESEARCH CENTER Farsi and Urdu) estimated that Muslims accounted for 0.6% of the adult population in 2007 and 0.8% in 2011. The 2014 Religious Landscape Study finds that 0.3% of American adults identify with a wide variety of other world religions, including Sikhs, Baha’is, Taoists, Jains, Rastafarians, Zoroastrians, Confucians and Druze. An additional 1.5% identify with other faiths, including Unitarians, those who identify with Native American religions, Pagans, Wiccans, New Agers, deists, Scientologists, pantheists, polytheists, Satanists and Druids, to name just a few. www.pewresearch.org 30 PEW RESEARCH CENTER The religiously unaffiliated population – including all of its constituent subgroups – has grown rapidly as a share of the overall U.S. population. The share of self-identified atheists has nearly doubled in size since 2007, from 1.6% to 3.1%. Agnostics have grown from 2.4% to 4.0%. And those who describe their religion as “nothing in particular” have swelled from 12.1% to 15.8% of the adult population since 2007. Overall, the religious “nones” have grown from 16.1% to 22.8% of the population in the past seven years. Composition of the Religious “Nones” As the unaffiliated have grown, the internal composition of the religious “nones” has changed. Most unaffiliated people continue to describe themselves as having no particular religion (rather than as being atheists or agnostics), but the “nones” appear to be growing more secular. Atheists and agnostics now account for 31% of all religious “nones,” up from 25% in 2007. Among all U.S. adults Atheist/agnostic Atheist Agnostic Nothing in particular Religion not Religion important1 important1 NET Unaffiliated Among the religiously unaffiliated 2007 % 2014 % Change 2007 % 2014 % Change 4.0 7.0 +3.0 25 31 +6 1.6 3.1 +1.5 10 13 +3 2.4 4.0 +1.6 15 17 +2 12.1 15.8 +3.7 75 69 -6 6.3 8.8 +2.5 39 39 0 5.8 6.9 +1.1 36 30 -6 16.1 22.8 +6.7 100 100 2014 Religious Landscape Study, conducted June 4-Sept. 30, 2014. Figures may not add to totals indicated due to rounding. 1Those who describe their religion as “nothing in particular” are subdivided into two groups. The “religion not important” group includes those who say (in Q.F2) religion is “not too” or “not at all” important in their lives as well as those who decline to answer the question about religion’s importance. The “religion important” category includes those who say religion is “very” or “somewhat” important in their lives. Meanwhile, the share of the PEW RESEARCH CENTER “nones” describing their religion as “nothing in particular” has declined from 75% in 2007 to 69% in 2014. And this decline is especially notable among those who say religion is “very” or “somewhat” important in their lives despite eschewing any identification with a particular religion. Those who describe their religion as “nothing in particular” and who also say that religion is important in their lives now account for 30% of all religious “nones,” down from 36% in 2007. Those who describe their religion as “nothing in particular” and furthermore state that religion is unimportant in their lives account for 39% of all religious “nones,” the same share as 2007. www.pewresearch.org 31 PEW RESEARCH CENTER A Note on How the Study Defines Evangelicals How many Americans are evangelical Christians? The answer depends on how evangelicalism is being defined. There are a number of ways this can be done. The approach taken in the 2014 Religious Landscape Study, for example, focuses only on Protestants. It looks at the denominations and congregations with which Protestants identify, and determines whether these denominations and congregations are part of the evangelical Protestant tradition, mainline Protestant tradition or historically black Protestant tradition. Those who belong to denominations and churches that are part of the evangelical Protestant tradition (such as the Southern Baptist Convention, the Assemblies of God and many nondenominational churches) are categorized as More Than a Third of U.S. Adults evangelical Protestants in the study; those who belong Describe Themselves as Born-Again or to denominations or churches in the other two Evangelical Christians Protestant traditions are not. Using this approach, the 2007 2014 study finds that 25.4% of U.S. adults are evangelical % of U.S. adults who are … % % Protestants, down from 26.3% in 2007, when the first Christian 78 71 Religious Landscape Study was conducted. Self-identify as born-again or evangelical 34 35 Another way to identify evangelicals is to ask people Not born-again or evangelical 41 33 whether they consider themselves evangelical or bornDon't know/refused 3 3 again Christians. The Religious Landscape Study Not Christian 22 29 includes a question asking Christians: “Would you 100 100 describe yourself as a born-again or evangelical 2014 Religious Landscape Study, conducted June 4-Sept. 30, Christian, or not?” In response to this question, half of 2014. Figures may not add to 100% or to subtotals indicated due to rounding. Christians (35% of all U.S. adults) say yes, they do PEW RESEARCH CENTER consider themselves born-again or evangelical Christians. The share of self-described born-again or evangelical Christians is very similar to what it was in 2007, even though the overall Christian share of the population has declined. www.pewresearch.org 32 PEW RESEARCH CENTER Not surprisingly, most members of the evangelical Protestant tradition (83%) see themselves as bornagain or evangelical Christians, as do most members of the historically black Protestant tradition (72%) and a sizable minority of people in the mainline Protestant tradition (27%). Many Christians who do not identify with Protestantism also consider themselves born-again or evangelical Christians, including 22% of Catholics, 18% of Orthodox Christians, 23% of Mormons and 24% of Jehovah’s Witnesses. Most in Evangelical, Historically Black Protestant Traditions Identify as Born-Again or Evangelical Would you describe yourself as a born-again or evangelical Christian, or not? Yes % No % Don't know/ refused % 50 46 4=100 Evangelical Protestant 83 15 2 Historically black Protestant 72 25 3 Mainline Protestant 27 67 6 Jehovah's Witness 24 67 8 Mormon 23 73 5 Catholic 22 73 5 Orthodox Christian 18 79 3 Among all Christians Among those in the ___ tradition When Catholics, Mormons and 2014 Religious Landscape Study, conducted June 4-Sept. 30, 2014. Figures may not add to 100% due to rounding. other non-Protestants are PEW RESEARCH CENTER excluded, the study finds that three-in-ten U.S. adults are selfdescribed born-again or evangelical Protestants. Although the percentage of Americans Three-in-Ten U.S. Adults Are Born-Again who identify as Protestants has declined in recent or Evangelical Protestants years (from 51% in 2007 to 47% today), the share of 2007 2014 born-again or evangelical Protestants has remained % of U.S. adults who are … % % the same. Protestant White born-again or evangelical Protestants – a group closely watched by political observers – now account for 19% of the adult population, down slightly from 21% in 2007. Over that period of time, the white share of respondents fell from 71% in the 2007 Religious Landscape Study to 66% in 2014. 51 47 30 30 White, non-Hispanic 21 19 Black, non-Hispanic 6 6 Hispanic 2 3 Self-identify as born-again or evangelical Other races Not born-again or evangelical Not Protestant 2 2 21 17 49 53 Another way to define evangelical Protestants is to 100 100 identify a set of religious beliefs or practices that are 2014 Religious Landscape Study, conducted June 4-Sept. 30, central to evangelicalism, and then assess how many 2014. Figures may not add to 100% or to subtotals indicated due to people profess those beliefs or engage in those rounding. practices. When measured this way, the size of the PEW RESEARCH CENTER evangelical population depends on the particular beliefs and practices that are used to define the category. While this type of analysis is beyond the scope of the Religious Landscape Study, a forthcoming report will examine the beliefs and practices of major religious groups and their views on social and political issues. www.pewresearch.org 33 PEW RESEARCH CENTER Chapter 2: Religious Switching and Intermarriage Like the 2007 Religious Landscape Study, the new survey shows a remarkable degree of churn in the U.S. religious landscape. If Protestantism is treated as a single religious group, then fully 34% of American adults currently have a religious identity different from the one in which they were raised, which is up six percentage points since 2007. If the three major Protestant traditions (evangelical Protestantism, mainline Protestantism and historically black Protestantism) are analyzed as separate categories, then the share of Americans who have switched religions rises to 42%.16 And these figures do not include an estimate of the number of “reverts” (people who leave their childhood religion before returning to it later in life). If the survey had measured this category, the estimates of the number of people who have switched religions would be higher still. Along with other sources of change in the religious composition of the U.S. (like immigration and differential fertility or mortality rates), understanding patterns of religious switching is central to making sense of the trends observed in American religion. And perhaps the best way to assess the impact of switching on the composition of the U.S. religious landscape is to consider the ratio of the number of people who have joined each religious group to the number of people who have left. After all, every religious tradition ultimately loses some of the people who were raised within its fold, and every tradition (including the unaffiliated) gains some members who join its ranks after having been raised in a different group. Looked at this way, the data clearly show that part of the reason the religious “nones” have grown rapidly in recent decades is that they continue to be the single biggest destination of movement across religious boundaries. Nearly one-in-five American adults (18%) were raised in a religion and are now unaffiliated, compared with just 4% who have moved in the other direction. In other words, for every person who has left the unaffiliated and now identifies with a religious group more than four people have joined the ranks of the religious “nones.” By contrast, both Catholicism and mainline Protestantism, the two groups whose shares of the overall population have declined most sharply in recent years, have lost more members to religious switching than they have gained. Among U.S. adults, there are now more than six former Catholics (i.e., people who say they were raised Catholic but no longer identify as such) for every There is no direct comparison to this figure in the 2007 Religious Landscape Study since it did not ask detailed questions about the denomination in which respondents were raised. The 2007 survey did, however, ask questions that permitted estimating rates of switching between Protestant denominational families (e.g., from Baptist to Methodist, or from Lutheran to Presbyterian). When movement between denominational families and among subgroups of the religiously unaffiliated (e.g., from atheist to agnostic) was included, the 2007 survey found that 44% of Americans had changed religions between childhood and adulthood. The 2014 study puts the figure defined in that way at 48%. 16 www.pewresearch.org 34 PEW RESEARCH CENTER convert to Catholicism. And there are approximately 1.7 people who have left mainline Protestantism for every person who has joined a mainline denomination. This chapter examines the religious groups that experience net gains and losses from changes in religious affiliation and documents the high degree of turnover among American religious groups. In addition, it analyzes the patterns of membership gain, loss and retention among religious groups. The chapter also details the survey’s findings about interfaith marriage, which suggest that religious intermarriage is becoming more common. In fact, people who have gotten married since 2000 are about twice as likely to be in religious intermarriages as are people who got married before 1960. www.pewresearch.org 35 PEW RESEARCH CENTER No religious group is only losing members or gaining members. Rather, each religious group is simultaneously gaining and losing members. Examining the total number of people entering and leaving each religion provides the most complete picture of the dynamism of the American religious landscape. The group that has experienced the greatest net gains due to religious switching is the religiously unaffiliated. Fewer than one-in-ten adults (9.2%) say they were raised as religious “nones.” And nearly half of those who were raised unaffiliated (4.3% of all U.S. adults) now identify with a religion. But fully 18% of American adults were raised in a religious tradition and now describe themselves as unaffiliated. Currently, 22.8% of American adults identify as unaffiliated, which is nearly 14 percentage points higher than the share who say they were raised as religious “nones.” In contrast with the unaffiliated, Catholicism has experienced the greatest net losses due to religious switching. Nearly a third of all U.S. adults (31.7%) were raised Catholic, and most of them continue to identify as Catholics today. But nearly 13% of all Americans are former Catholics – people who no longer identify with the faith despite having been raised in the Catholic Church. By comparison, there are far fewer converts to Catholicism; 2% of all U.S. adults now identify as Catholics after having been raised in another religion or without a religion. This means that there are more than six former Catholics for every convert to Catholicism. No other religious group analyzed in the survey has experienced anything close to this ratio of losses to gains via religious switching. Mainline Protestantism also has lost more members than it has gained through religious switching. Overall, 10.4% of adults are former mainline Protestants, compared with 6.1% who now identify with mainline Protestantism after having been raised in another faith. www.pewresearch.org 36 PEW RESEARCH CENTER Religious Switching: “Nones” Make Big Gains, Catholics Experience Big Losses Percentage of all U.S. adults who were raised in, left, entered and currently identify with each group Christian Protestant Childhood religion % Leaving group % Entering group % Current religion % 85.6 -19.2 +4.2 =70.6 50.2 -13.0 +9.4 =46.5 Evangelical 23.9 -8.4 +9.8 =25.4 Mainline 19.0 -10.4 +6.1 =14.7 Historically black 7.3 -2.2 +1.4 =6.5 Catholic 31.7 -12.9 +2.0 =20.8 Orthodox 0.7 -0.3 +<0.3 =0.5 Mormon 1.7 -0.6 +0.5 =1.6 Jehovah’s Witness 0.8 -0.6 +0.5 =0.8 Other Christian 0.4 -0.4 +0.3 =0.4 4.7 -1.4 +2.6 =5.9 Non-Christian faiths Jewish 2.1 -0.5 +0.3 =1.9 Muslim 0.9 -<0.3 +<0.3 =0.9 Buddhist 0.6 -0.4 +0.5 =0.7 Hindu 0.7 -<0.3 +<0.3 =0.7 Other world religions <0.3 -<0.3 +<0.3 =0.3 Other faiths 0.3 -<0.3 +1.5 =1.5 9.2 -4.3 +18.0 =22.8 Unaffiliated Don’t know/refused 0.5 0.6 Total 100 100 2014 Religious Landscape Study, conducted June 4-Sept. 30, 2014. Figures may not add to 100% and nested figures may not add to subtotals indicated due to rounding. PEW RESEARCH CENTER Driven primarily by the losses experienced by Catholicism and mainline Protestantism, Christianity as a whole loses more adherents than it gains via religious switching. The vast majority of U.S. adults (85.6%) say they were raised as Christians. But more than a fifth of them (19.2% of all adults) no longer identify with Christianity. Far fewer Americans (4.2% of all adults) have converted to Christianity after having been raised in another faith or with no religious affiliation. Overall, there are more than four former Christians for every convert to Christianity. Within Christianity, the major exception to this pattern is evangelical Protestantism, which gains more adherents through religious switching than it loses. Overall, nearly a quarter of U.S. adults (23.9%) say they were raised as evangelical Protestants. More than a third of them (8.4% of all adults) no longer identify with evangelicalism. But even larger numbers (9.8% of all adults) now identify with evangelical Protestantism after having been raised outside the tradition. www.pewresearch.org 37 PEW RESEARCH CENTER Many Protestant denominational families lose more people through religious switching than they gain. Nearly one-in-five American adults, for example, were raised Baptist (19.2%). But more than four-in-ten of them (8.4% of all U.S. adults) are no longer Baptist. Fewer people (4.5% of all adults) now identify as Baptist after having been raised in another religion, meaning that there are roughly two former Baptists for each person who has become a Baptist after having been raised in another religion or without a religion. The survey finds similar rates of losses to gains (roughly 2to-1) for Methodists, Lutherans, Presbyterians, Episcopalians and Congregationalists. Nondenominational Protestants, by contrast, gain more adherents through religious switching than they lose. Just 2% of Americans say they were raised as nondenominational Protestants, and half of them (1.1% of all adults) no longer identify with nondenominational Protestantism. But 5.3% of adults now identify as nondenominational Protestants after having been raised in another religion or in no religion, meaning that nondenominational Protestantism gains roughly five adherents through religious switching for every adherent it loses. www.pewresearch.org 38 PEW RESEARCH CENTER Many Protestant Denominational Families Lose More Adherents Than They Gain Via Religious Switching Percentage of all U.S. adults who were raised in, left, entered and currently identify with each group Childhood religion % Leaving group % Entering group % Current religion % Baptist 19.2 -8.4 +4.5 =15.4 Methodist 6.5 -3.9 +2.0 =4.6 Nondenominational 2.0 -1.1 +5.3 =6.2 Lutheran 4.9 -2.4 +1.0 =3.5 Presbyterian 3.0 -2.0 +1.1 =2.2 Pentecostal 4.0 -2.0 +2.6 =4.6 Anglican/Episcopalian 1.8 -1.1 +0.6 =1.3 Restorationist 1.9 -1.1 +1.0 =1.9 Congregationalist 0.9 -0.6 +0.3 =0.6 Holiness 1.1 -0.7 +0.5 =0.8 Reformed 0.3 -<0.3 +<0.3 =<0.3 Adventist 0.6 -0.3 +0.3 =0.6 Anabaptist 0.4 -<0.3 +<0.3 =0.3 Pietist <0.3 -<0.3 +<0.3 =<0.3 Friends/Quakers <0.3 -<0.3 +<0.3 =<0.3 Other evangelical/fundamentalist <0.3 -<0.3 +<0.3 =0.3 Protestant, non-specific 3.2 -2.3 +2.9 =3.8 NET Protestant 50.2 -13.0 +9.4 =46.5% 2014 Religious Landscape Study, conducted June 4- Sept. 30, 2014. Nested figures may not add to subtotals indicated due to rounding. The figures for those leaving and entering each Protestant family do not sum to the total leaving and entering Protestantism as a whole because they include people who move from one family to another within Protestantism. PEW RESEARCH CENTER www.pewresearch.org 39 PEW RESEARCH CENTER Hindus, Muslims and Jews are the three religious traditions that retain the largest shares of the adherents raised within their group. Among all U.S. adults who say they were raised as Hindus, fully 80% continue to identify with Hinduism as adults; most of those who no longer identify as Hindus now describe themselves as unaffiliated. Roughly three-quarters of those raised as Muslims (77%) and Jews (75%) also continue to identify with their childhood faiths. Hindus, Muslims and Jews Have Highest Retention Rates % of adults raised in each religious tradition who currently identify with … Among those raised … Still identify Historically NET No longer with Evangelical Mainline black identify with childhood Protestant Protestant Protestant All other childhood religion tradition tradition tradition Catholicism faiths Unaffiliated religion % % % % % % % % Hindu 80 * 1 0 0 * 18 20=100 Muslim 77 2 1 1 1 2 15 23 Jewish 75 1 1 0 * 4 18 25 Historically black Protestant 70 10 2 n/a 2 3 13 30 Evangelical Protestant 65 n/a 12 2 2 3 15 35 Mormon 64 6 3 1 2 3 21 36 Catholic 59 10 5 1 n/a 4 20 41 Orthodox Christian 53 9 6 1 4 3 24 47 Unaffiliated 53 19 9 4 4 10 n/a 47 Mainline Protestant 45 19 n/a 1 4 6 26 55 Buddhist 39 7 6 0 3 6 40 61 Jehovah’s Witness 34 11 7 8 2 3 35 66 2014 Religious Landscape Study, conducted June 4-Sept. 30, 2014. Figures may not add to 100% and nested figures may not add to subtotals indicated due to rounding. The “all other faiths” column includes those who declined to answer the question about their current religious identity. PEW RESEARCH CENTER www.pewresearch.org 40 PEW RESEARCH CENTER Among Christian groups, the historically black Protestant tradition retains the highest percentage of its childhood members, followed by evangelical Protestants and Mormons. Seven-in-ten respondents who were raised within the historically black Protestant tradition continue to identify with it today, while roughly two-thirds of those raised as evangelicals (65%) and Mormons (64%) continue to identify with their childhood faiths. Among those who have left the historically black Protestant and evangelical traditions, there are more people who now identify with other religions than who identify with no religion. By contrast, most former Mormons (21% of all adults who were raised as Mormons) now say they have no religious affiliation. Catholicism’s retention rate has slipped since the first Religious Landscape Study was conducted in 2007. At that time, 68% of respondents who were raised Catholic continued to identify as such as adults. Today, 59% of those raised Catholic still identify with Catholicism as adults, while 41% do not. One-in-five people who were raised Catholic now say they have no religious affiliation, while 10% identify with evangelical denominations, 5% with mainline denominations and smaller numbers with other faiths. Just over half of those who were raised with no religious affiliation (53%) still identify as religious “nones,” one of the lower retention rates among religious traditions. The low retention rate of the religiously unaffiliated may seem paradoxical, since they ultimately obtain bigger gains through religious switching than any other tradition. Despite the fact that nearly half of those raised unaffiliated wind up identifying with a religion as adults, “nones” are able to grow through religious switching because people switching into the unaffiliated category far outnumber those leaving the category. A quarter of those raised as mainline Protestants have become “nones,” along with 20% of those raised Catholic, 15% of those raised in the evangelical Protestant tradition and 13% of those raised in the historically black Protestant tradition. www.pewresearch.org 41 PEW RESEARCH CENTER The data show, furthermore, that the share of those raised as “nones” who remain unaffiliated as adults is growing. Compared with 2007, the retention rate of the religiously unaffiliated has increased by seven percentage points (from 46% to 53%). This is driven, in large part, by generational replacement; young adults who were raised as “nones” are far more likely than their counterparts in previous generations to continue to identify as unaffiliated. Fully two-thirds of Millennials who were raised unaffiliated continue to identify as “nones” as adults. In fact, “nones” have among the highest retention rates among Millennials, significantly higher than the comparable rates for those raised in the evangelical Protestant (61%), historically black Protestant (60%), Catholic (50%) and mainline Protestant (37%) traditions and about equal to the retention rate for Jews (70%). (The survey included too few interviews with people raised in other faiths to permit a similar analysis by generational cohort.) Among Among Millennials Raised as “Nones,” Two-Thirds Still older generations, by contrast, Unaffiliated as Adults far fewer people who were % of adults who remain in the religion in which they were raised, by raised as religious “nones” generational cohort remain religiously unaffiliated Generation Baby Silent as adults. Millennial X Boomers generation Raised … % % % % Jewish 70 77 75 80 Of course, it is possible that Unaffiliated 67 47 42 26 growing numbers of Evangelical Protestant 61 63 68 69 Millennials who were raised Historically black Protestant 60 71 76 77 unaffiliated will begin to Catholic 50 57 63 73 identify with a religion as they Mainline Protestant 37 44 47 53 get older, settle down, get 2014 Religious Landscape Study, conducted June 4-Sept. 30, 2014. Other religious groups married and have children. are not shown due to insufficient sample size. PEW RESEARCH CENTER However, previous research suggests that generational cohorts typically do not become more religiously affiliated as they get older. Indeed, the current study suggests that most generational cohorts are becoming less religiously affiliated as they age. www.pewresearch.org 42 PEW RESEARCH CENTER Retention Rates Among Protestant Denominational Families The 2014 Religious Landscape Study finds that 57% of all adults who were raised as Baptists continue to identify as Baptists. Anabaptists (52%), Lutherans (51%), Adventists (51%) and Pentecostals (50%) retain the allegiance of about half of their childhood adherents. Many other Protestant denominational families have lower retention rates. Four-in-ten or fewer of those raised as Methodists (40%), Episcopalians (39%), Presbyterians (34%), Reformed Protestants (34%), Holiness Protestants (32%) and Congregationalists (31%) continue to identify with those denominational families as adults. Significant minorities of those raised in nearly all Protestant denominational families now say they are unaffiliated, ranging from 15% among those raised Baptist, Pentecostal or Restorationist to 28% of those raised Congregationalist. The only exception to this pattern is the Anabaptist denominational family; just 5% of those raised Anabaptist now identify as religious “nones.” Among Protestant Denominational Families, Nearly Six-in-Ten of Those Raised Baptist Still Identify as Baptists as Adults % of adults raised in each Protestant denominational family who … Among those raised … Still identify with Now identify with Now Now identify Now childhood different Protestant identify as with other identify as denominational family denominational family Catholic faith unaffiliated % % % % % Baptist 57 23 2 4 15=100 Anabaptist 52 39 2 3 5 Lutheran 51 21 4 4 20 Adventist 51 21 1 6 21 Pentecostal 50 31 2 3 15 NET All Protestants 47 27 3 4 19 Nondenominational Protestant 47 23 2 4 25 Restorationist (e.g., Church of Christ) 45 35 1 4 15 Methodist 40 32 4 5 19 Episcopalian/Anglican 39 20 6 8 27 Presbyterian 34 32 3 6 25 Reformed 34 42 4 2 18 Holiness 32 45 2 2 18 Congregationalist 31 33 3 6 28 2014 Religious Landscape Study, conducted June 4-Sept. 30, 2014. Figures may not add to 100% and nested figures may not add to subtotals indicated due to rounding. The “now identify with other faith” column includes those who declined to answer the question about their current religious identity. PEW RESEARCH CENTER www.pewresearch.org 43 PEW RESEARCH CENTER The flip side of examining retention rates (which show the groups that are most successful at holding on to those raised in their ranks) is to consider which groups are most heavily made up of people who have switched into the group. Nearly eight-in-ten adults who currently identify as religious “nones” were raised in a religion, while just 21% were raised religiously unaffiliated. Among adults who currently have no religious affiliation, there are more former Catholics (28%) and about as many former mainline Protestants (21%) as there are people who were raised with no religious affiliation (21%). Most “Nones” Were Raised in a Religion % of adults in each religious tradition who were raised … Among those who currently identify as … Raised in Historically current Evangelical Mainline black religious Protestant Protestant Protestant group tradition tradition tradition % % % % Catholic % NET Raised in religious group different All other from current faiths Unaffiliated group % % % Unaffiliated 21 16 21 4 28 10 n/a 79=100 Buddhist 33 13 15 2 24 5 8 67 Jehovah’s Witness 35 9 11 10 22 1 12 65 Mainline Protestant 58 20 n/a 1 12 3 6 42 Evangelical Protestant 61 n/a 14 3 13 2 7 39 Mormon 69 6 7 * 9 1 8 31 Orthodox Christian 73 11 4 * 6 1 5 27 Muslim 77 1 2 8 4 1 6 23 Historically black Protestant 78 6 2 n/a 5 2 6 22 Jewish 83 2 4 * 3 2 6 17 Hindu 90 1 1 0 3 1 3 10 Catholic 90 3 3 1 n/a 1 2 10 2014 Religious Landscape Study, conducted June 4-Sept. 30, 2014. Figures may not add to 100% and nested figures may not add to subtotals indicated due to rounding. The “all other faiths” column includes those who declined to answer the question about their childhood religious identity. PEW RESEARCH CENTER www.pewresearch.org 44 PEW RESEARCH CENTER Most people who currently identify as Jehovah’s Witnesses (65%) also were raised outside that tradition. And 67% of the Buddhists surveyed indicate that they were raised in a religion other than Buddhism or with no religious affiliation. However, since the survey was conducted only in English and Spanish, Buddhists who speak other languages (e.g., Vietnamese, Japanese or other Asian languages), and who are not comfortable taking a survey in either English or Spanish, are underrepresented. The Pew Research Center’s 2012 survey of Asian Americans indicates that most Asian-American Buddhists were raised as Buddhists. At the other end of the spectrum, fully 90% of adult Catholics are “cradle Catholics” raised in the church. Similarly, 90% of Hindus say they were raised as Hindus. Within Protestantism, roughly six-in-ten evangelical Protestants (61%) and mainline Protestants (58%) say they were raised within their respective traditions. Each group includes substantial minorities, however, who were raised in the other faith; 14% of current evangelical Protestants were raised in the mainline tradition, and 20% of mainline Protestants were raised in the evangelical tradition. Each group also includes sizable numbers of former Catholics, with 13% of current evangelical Protestants and 12% of current mainline Protestants indicating that they were raised Catholic. Compared with evangelicals and mainline Protestants, the historically black Protestant tradition includes fewer people who have switched in from a different religious background. www.pewresearch.org 45 PEW RESEARCH CENTER Interfaith relationships are common among married people and those living with a romantic partner, and interfaith marriage appears to be on the rise. If Protestantism is treated as a single religious group, then 28% of American adults who are married or living with a partner have a spouse or partner with a religion different than their own. When the three major Protestant traditions (evangelical Protestantism, mainline Protestantism and historically black Protestantism) are analyzed as separate categories, the Recently Married Adults More Likely to Be number rises to 33%. Intermarried Based on those who are currently married Interfaith relationships are far Christian married Spouse to spouse from Other NET Spouse more common among same different Christian Christian / mixed different religion tradition unaffiliated1 marriage religion unmarried people who are Married … % % % % % living with a partner (49% of Before 1960 81 11 5 3 19=100 whom have a partner with a 1960-1969 78 10 9 3 22 religion different from their 1970-1979 76 11 10 4 24 own) than among married 1980-1989 70 14 12 5 30 people (31% of whom are in a 1990-1999 70 12 13 4 30 religiously mixed marriage). 2000-2009 65 13 16 6 35 2010-2014 61 15 18 6 39 Even among married people, however, mixed-faith 2014 Religious Landscape Study, conducted June 4-Sept. 30, 2014. Figures may not add to 100% and nested figures may not add to subtotals indicated due to rounding. relationships appear to be 1The “Christian/unaffiliated” column includes Christian respondents who are married to an growing more common. unaffiliated spouse as well as unaffiliated respondents who are married to a Christian spouse. Nearly four-in-ten married PEW RESEARCH CENTER people who were wed since 2010 have a spouse who identifies with a different religious group (including Protestants who are married to a spouse from a different Protestant tradition). By contrast, just 19% of people who got married before 1960 have a spouse with a different religion.17 These patterns strongly suggest that intermarriage has been rising, but it also should be noted that some research indicates that “in-marriages” (marriages between people of the same religion) tend to be more durable than intermarriages.18 The Religious Landscape Study does not measure Due to a change in question wording, it is not possible to directly compare intermarriage rates from the current study with estimates from the 2007 Religious Landscape Study. 18 Sherkat, Darren E. 2004. “Religious Intermarriage in the United States: Trends, Patterns, and Predictors.” Social Science Research, pages 605-625. http://www.sciencedirect.com/science/article/pii/S0049089X0300084X. 17 www.pewresearch.org 46 PEW RESEARCH CENTER whether couples were in religiously mixed marriages at the time they got married; these marriages would no longer be counted as interfaith relationships if one or both spouses switched religions and they now share the same faith. If it were possible to analyze these other types of mixed marriages (i.e., those that ended in divorce and those that now are religiously matched marriages due to religious switching), then the percentage of intermarriages in previous decades may have been higher than it appears because the study only looks at marriages that are intact today. The apparent rise of religious intermarriage is driven in large part by marriages between Christians and religiously unaffiliated spouses. Fully 18% of people surveyed who have gotten married since 2010 are either Christians with a religiously unaffiliated spouse or religious “nones” with a Christian spouse, as are 16% of people who got married between 2000 and 2009. By comparison, just 5% of people surveyed who got married before 1960 fit this profile. The rates of intra-Christian mixed marriage (e.g., between an evangelical Protestant and a mainline Protestant, or between a Catholic and a Mormon) are closer among those who got married recently and those who have been married for a long time. Among those surveyed who are married or living with a partner, Buddhists are more likely than members of most other groups to indicate that they are in a mixed-faith relationship, with fully six-in-ten Buddhists (61%) saying their spouse or partner has a religion other than Buddhism. However, Asian-American Buddhists are underrepresented in the study because the survey was conducted only in English and Spanish and not in Asian languages such as Japanese, Mandarin or Vietnamese. In the current study, just 33% of Buddhists identify their race as Asian American. But the Pew Research Center’s 2012 survey of Asian Americans (conducted in English and seven Asian languages) found that roughly two-thirds of all U.S. Buddhists are Asian Americans, and that most married Asian-American Buddhists are married to a spouse who is also Buddhist. Thus, the 2014 Religious Landscape Study’s estimated intermarriage rate for Buddhists is likely much higher than it would have been had the survey been offered in Asian languages (and included more AsianAmerican Buddhists). Hindus are more likely than any other religious group to have a spouse or partner with the same religion (91%). Roughly eight-in-ten Mormons (82%) and Muslims (79%) who are married or living with a partner have a mate who shares their religion, as do three-quarters of Catholics and evangelical Protestants. www.pewresearch.org 47 PEW RESEARCH CENTER Religious Intermarriage % of those who are married/living with partner whose spouse/partner is … Among those who are … Historically NET Spouse / Evangelical Mainline black Spouse/partner partner has Protestant Protestant Protestant All other has different same religion tradition tradition tradition Catholic faiths Unaffiliated religion % % % % % % % % Hindu 91 0 1 0 2 3 3 9=100 Mormon 82 3 3 * 3 1 7 18 Muslim 79 * 5 6 1 3 6 21 Catholic 75 5 8 1 n/a 3 9 25 Evangelical Protestant 75 n/a 7 2 6 2 7 25 Historically black Protestant 65 10 4 n/a 6 2 12 35 Jewish 65 1 8 1 9 4 11 35 Jehovah’s Witness 64 * 6 * 7 1 21 36 Mainline Protestant 59 12 n/a 1 12 4 13 41 Unaffiliated 56 8 10 2 16 8 n/a 44 Orthodox Christian 53 5 9 0 19 7 7 47 Buddhist 39 * 7 1 13 7 32 61 2014 Religious Landscape Study, conducted June 4-Sept. 30, 2014. Figures may not add to 100% and nested figures may not add to subtotals indicated due to rounding. PEW RESEARCH CENTER www.pewresearch.org 48 PEW RESEARCH CENTER Chapter 3: Demographic Profiles of Religious Groups The U.S. population is undergoing a variety of demographic changes. For example, racial and ethnic diversity has been increasing as non-Hispanic whites have declined as a share of the population. And the share of adults who are married has been declining for decades. These broader changes are reflected within many of the major religious groups in the U.S. Since 2007, most religious groups have exhibited a decline in the non-Hispanic white share of their populations and a rise in the Hispanic share. And marriage rates are down among several religious groups. Nonetheless, there is some variation among religious groups in the direction and magnitude of demographic changes. For instance, while the evangelical and mainline Protestant traditions have become somewhat more racially diverse, the share of Mormons who are non-Hispanic whites has hardly budged. Hispanics constitute a greater share of the Catholic population than of any other religious group; fully one-third of U.S. Catholic adults are Hispanics. The data also show that religious groups that are growing tend to be younger than average and getting younger, while religious groups that are shrinking tend to be relatively old and getting older. This chapter provides a detailed account of the demographic composition of religious groups in the U.S., highlighting both how religious groups are changing demographically and how they are staying the same. The next chapter examines demographics and religion from the opposite direction, describing the religious composition of various social and demographic groups. www.pewresearch.org 49 PEW RESEARCH CENTER The religious groups that are growing tend to be relatively young and getting younger, whereas the religious groups that are shrinking tend to be relatively old and getting older. The median age of religiously unaffiliated adults, for example, now stands at 36, down from 38 in 2007. Among selfidentified atheists and agnostics, the median age is 34, and roughly four-in-ten adults in these categories are between the ages of 18 and 29. Muslims and Hindus also stand out for their comparative youthfulness; the median age of adults in each group is 33. By contrast, the median age of Christian adults is 49, up from 46 in 2007. One-in-five Christians (21%) have reached the traditional retirement age of 65, compared with just 9% of the religiously unaffiliated, 5% of Muslims and 4% of Hindus. Jews have a median age of 50, the same as in 2007 and on par with Catholics and Protestants as a whole. www.pewresearch.org 50 PEW RESEARCH CENTER Age Distribution and Median Age of Religious Groups Percentage in each age category, 2007 18-29 30-49 % % 50-64 % Percentage in each age category, 2014 2007 2014 median 18-29 30-49 50-64 median 65+ 65+ age of age of % % % % % adults adults 16=100 45 22 34 26 18=100 46 Full sample1 20 39 25 Christian 17 39 25 18 46 17 33 29 21 49 Protestant 17 38 26 20 47 17 32 29 21 50 Evangelical 17 39 26 19 47 17 33 29 20 49 Mainline 14 36 28 23 50 16 29 29 26 52 Historically black 24 36 24 15 44 20 36 29 15 46 Catholic 18 41 24 16 45 17 33 29 20 49 Orthodox Christian 18 38 27 17 46 26 40 21 13 40 Mormon 24 42 19 15 41 22 40 22 16 43 Jehovah's Witness 21 39 25 14 45 15 34 29 23 50 Non-Christian faiths 24 37 26 13 43 30 35 21 14 40 Jewish 20 29 29 22 50 22 27 26 26 50 Muslim 33 46 17 3 35 44 37 13 5 33 Buddhist 23 40 30 7 42 34 30 23 14 39 Hindu 18 58 19 5 38 34 56 6 4 33 31 40 20 8 38 35 37 19 9 36 Atheist 37 36 16 12 36 40 37 14 9 34 Agnostic 34 34 22 9 39 39 35 16 9 34 Nothing in particular 29 42 20 8 38 32 38 21 9 38 29 41 21 8 39 34 37 20 10 37 30 43 20 7 38 31 39 23 8 39 Unaffiliated Religion not important2 Religion important2 2014 Religious Landscape Study, conducted June 4-Sept. 30, 2014. Figures may not add to 100% due to rounding. Results recalculated to exclude nonresponse. 1The demographic characteristics of the 2014 Religious Landscape Study’s overall sample were weighted to known parameters from the Census Bureau's 2012 American Community Survey (ACS), which helps to ensure that the demographic characteristics of the sample closely match those of the U.S. adult population. See Methodology for details. 2Those who describe their religion as “nothing in particular” are subdivided into two groups. The “religion not important” group includes those who say (in Q.F2) religion is “not too” or “not at all” important in their lives as well as those who decline to answer the question about religion’s importance. The “religion important” category includes those who say religion is “very” or “somewhat” important in their lives. PEW RESEARCH CENTER www.pewresearch.org 51 PEW RESEARCH CENTER As the United States has become more racially and ethnically diverse in recent years – with fewer whites (as a share of the population) and more Hispanics and other racial and ethnic minorities – so, too, have the racial and ethnic profiles of many religious groups become more diverse. Whites now account for smaller shares of the evangelical, mainline Protestant, Catholic and religiously unaffiliated populations than they did in 2007, while Hispanics have grown as a share of all of these groups. Hispanics make up a larger share of the U.S. Catholic population than they do of almost any other religious group. About one-third of Catholics are Hispanic (34%), up from 29% in 2007. And the data suggest that the Hispanic share of the Catholic population is likely to continue to grow at a rapid pace, since Hispanic Catholics are far younger, on average, than non-Hispanic Catholics. The median age of Hispanic Catholic adults is 42, while the median age of non-Hispanic Catholics is 53. And among Catholic Millennials, there are about as many Hispanics as whites. Among older generations of Catholics, there are more whites than Hispanics.19 Several religious traditions, including the historically black Protestant tradition, Jehovah’s Witnesses, Muslims, Buddhists and Hindus, are composed mostly of racial and ethnic minorities. Two-thirds of religiously unaffiliated adults are white. This includes more than three-quarters of self-identified atheists (78%) and agnostics (79%), as well as 72% of those who say their religion is “nothing in particular” and who further state that religion is unimportant in their lives. By comparison, those who describe their religion as “nothing in particular” but who say religion is at least somewhat important in their lives are much more racially diverse. Among Silent generation Catholics, 80% are white and 16% are Hispanic. Among Catholic Baby Boomers, 67% are white and 26% are Hispanic. Among Generation X Catholics, 49% are white and 43% are Hispanic; this difference is statistically significant at the 90% confidence level, whereas the white share of Catholics in the Silent and Baby Boomer cohorts is significantly greater than the Hispanic share at the 95% confidence level. Among Catholic Millennials, 43% are white and 46% are Hispanic. 19 www.pewresearch.org 52 PEW RESEARCH CENTER Racial and Ethnic Composition of Religious Groups -----2007---------2014----White, Black, Asian, Other, White, Black, Asian, Other, nonnonnonnonnonnonnonnonHispanic Hispanic Hispanic Hispanic Hispanic Hispanic Hispanic Hispanic Hispanic Hispanic % % % % % % % % % % Full sample1 71 11 3 3 12=100 66 12 4 4 15=100 Christian 71 12 1 3 13 66 13 2 3 16 74 16 1 3 5 69 18 1 4 8 Evangelical 81 6 2 4 7 76 6 2 5 11 Mainline 91 2 1 3 3 86 3 1 3 6 Protestant 2 92 * 1 4 2 94 0 1 3 Catholic Historically black 65 2 2 2 29 59 3 3 2 34 Orthodox Christian 87 6 2 3 1 81 8 3 2 6 Mormon 86 3 1 3 7 85 1 1 5 8 Jehovah's Witness 48 22 * 5 24 36 27 * 6 32 Non-Christian faiths 69 5 16 6 4 61 6 21 5 6 Jewish 95 1 * 2 3 90 2 2 2 4 Muslim 33 32 20 7 7 38 28 28 3 4 Buddhist 53 4 32 5 6 44 3 33 8 12 Hindu 5 1 88 4 2 4 2 91 2 1 Unaffiliated 73 8 4 4 11 68 9 5 4 13 Atheist 86 3 4 2 5 78 3 7 2 10 Agnostic 84 2 4 4 6 79 3 4 4 9 Nothing in particular 70 10 3 4 12 64 12 5 5 15 79 5 4 4 8 72 7 6 4 12 60 16 2 5 17 53 18 3 6 19 Religion not important2 Religion important2 2014 Religious Landscape Study, conducted June 4-Sept. 30, 2014. Figures may not add to 100% due to rounding. Results recalculated to exclude nonresponse. The 2007 Religious Landscape Study used slightly different question wording to measure race and ethnicity. See topline for details. 1The demographic characteristics of the 2014 Religious Landscape Study’s overall sample were weighted to known parameters from the Census Bureau's 2012 American Community Survey (ACS), which helps to ensure that the demographic characteristics of the sample closely match those of the U.S. adult population. See Methodology for details. 2Those who describe their religion as “nothing in particular” are subdivided into two groups. The “religion not important” group includes those who say (in Q.F2) religion is “not too” or “not at all” important in their lives as well as those who decline to answer the question about religion’s importance. The “religion important” category includes those who say religion is “very” or “somewhat” important in their lives. PEW RESEARCH CENTER www.pewresearch.org 53 PEW RESEARCH CENTER Fully 96% of Hindus in the U.S. are either immigrants (87%) or the children of immigrants (9%), as are nearly eight-in-ten Muslims (61% immigrants and 17% the children of immigrants). The vast majority of Hindus in the U.S. – 78% – were born in the Asia-Pacific region (India is home to by far the world’s largest Hindu population). Muslim immigrants come from many places around the world, including 27% who were born in the Asia-Pacific region, 12% who were born in the Middle East and North Africa and 12% who were born in sub-Saharan Africa.20 Among Christian groups, the Orthodox tradition is most heavily made up of immigrants and the children of immigrants. Four-in-ten Orthodox Christians were born outside the U.S. (including 20% who were born in Europe, 7% who were born in sub-Saharan Africa and 7% who are from the Asia-Pacific region); 23% of Orthodox Christians are the children of immigrants. More than fourin-ten Catholics are either first-generation (27%) or second-generation (15%) Americans. Most Catholic immigrants were born in the Americas (including Latin America and the Caribbean, as well as Canada). The 2014 Religious Landscape Study was conducted in English and Spanish. Immigrants and others who do not speak one of those languages would have been unable to participate in the study. As a result, the current estimates may undercount the share of immigrants among some religious groups. 20 www.pewresearch.org 54 PEW RESEARCH CENTER Most Orthodox Christians, Muslims and Hindus – and Four-in-Ten Catholics – Are Immigrants or the Children of Immigrants Immigration status Third gen.+ Second gen. First gen. (respondent & (at least one (respondent Don't both parents parent born born know / born in U.S.) abroad) abroad) refused % % % % Birthplace of immigrants Middle NET Americas EastSubBorn (except AsiaNorth Saharan outside U.S.) Pacific Europe Africa Africa U.S. % % % % % % Full sample1 74 10 15 1=100 9 3 2 * 1 =15 Christian 76 9 14 1 10 1 2 * 1 =14 Protestant 85 6 8 1 5 1 1 * 1 =8 Evangelical 83 7 9 1 6 1 1 * * =9 Mainline 86 7 7 1 3 1 2 * * =7 Historically black 88 3 6 2 4 * * 0 2 =6 Catholic 57 15 27 1 22 2 2 * * =27 Orthodox Christian 36 23 40 1 2 7 20 4 7 =40 Mormon 85 7 7 1 5 1 1 0 0 =7 Jehovah's Witness 67 8 25 * 24 * 1 0 1 =25 Non-Christian faiths 54 16 29 2 4 17 3 3 2 =29 Jewish 66 22 12 * 4 1 5 2 * =12 Muslim 18 17 61 4 3 27 7 12 12 =61 Buddhist 52 22 26 1 3 21 * 1 0 =26 Hindu 4 9 87 * 7 78 * 0 2 =87 Unaffiliated 74 12 13 2 6 3 3 * * =13 Atheist 74 13 12 1 3 5 5 * * =12 Agnostic 77 15 8 1 2 2 2 * 1 =8 Nothing in particular 73 11 14 2 8 3 2 * * =14 Religion not impt.2 73 12 12 2 6 4 3 * * =12 74 9 15 2 11 2 2 * * =15 Religion impt.2 2014 Religious Landscape Study, conducted June 4-Sept. 30, 2014. Figures may not sum to 100% or to subtotals indicated due to rounding. 1The demographic characteristics of the 2014 Religious Landscape Study’s overall sample were weighted to known parameters from the Census Bureau's 2012 American Community Survey (ACS), which helps to ensure that the demographic characteristics of the sample closely match those of the U.S. adult population. See Methodology for details. 2Those who describe their religion as “nothing in particular” are subdivided into two groups. The “religion not important” group includes those who say (in Q.F2) religion is “not too” or “not at all” important in their lives as well as those who decline to answer the question about religion’s importance. The “religion important” category includes those who say religion is “very” or “somewhat” important in their lives. PEW RESEARCH CENTER www.pewresearch.org 55 PEW RESEARCH CENTER Hindus and Jews continue to be among the most highly educated religious groups in the U.S., just as they were when the 2007 Religious Landscape Study was conducted. Most adults in each group have at least a bachelor’s degree (77% of Hindus and 59% of Jews). And nearly half of Hindus (48%) and one-third of Jews (31%) have earned a post-graduate degree. U.S. Muslims, Buddhists and Orthodox Christians also have relatively high levels of educational attainment, with roughly four-in-ten or more in each group having completed college. Atheists and agnostics have high levels of education as well, with 43% of self-identified atheists and 42% of agnostics saying they have completed college. Others within the religiously unaffiliated category are not as highly educated; 30% of those who describe their religion as “nothing in particular” and say religion is unimportant in their lives report having attained a bachelor’s degree, along with 16% of those who say their religion is “nothing in particular” and that religion is at least somewhat important to them. A quarter of Catholics have completed college (26%), as have a similar share of Protestants (24%). Mainline Protestants are much more likely than their counterparts in the evangelical and historically black Protestant traditions to have completed college. www.pewresearch.org 56 PEW RESEARCH CENTER Hindus and Jews Continue to Be Among the Most Highly Educated Religious Groups Percentage of each religious group reporting a college degree in… 2014 educational attainment, detailed PostHigh school Some Bachelor’s graduate grad or less college degree degree % % % % 2007 % 2014 % Full sample1 27 27 41 32 17 11=100 Christian 25 25 43 32 16 9 Protestant 24 24 42 34 15 9 Evangelical 20 21 43 35 14 7 Mainline 34 33 37 30 19 14 Historically black 16 15 52 33 9 6 Catholic 26 26 46 27 16 10 Orthodox Christian 46 40 27 34 21 18 Mormon 29 33 27 40 23 10 Jehovah's Witness 8 12 63 25 9 3 Non-Christian faiths 51 50 23 27 25 25 Jewish 59 59 19 22 29 31 Muslim 40 39 36 25 23 17 Buddhist 48 47 20 33 28 20 Hindu 74 77 12 11 29 48 Unaffiliated 29 29 38 32 18 11 Atheist 42 43 26 31 26 16 Agnostic 43 42 23 36 25 16 24 24 45 32 15 9 31 30 37 34 18 12 17 16 55 29 11 5 Nothing in particular Religion not important2 Religion important2 2014 Religious Landscape Study, conducted June 4-Sept. 30, 2014. Figures may not add to 100% due to rounding. Results recalculated to exclude nonresponse. The 2007 Religious Landscape Study used different question wording to measure education. See topline for details. 1The demographic characteristics of the 2014 Religious Landscape Study’s overall sample were weighted to known parameters from the Census Bureau's 2012 American Community Survey (ACS), which helps to ensure that the demographic characteristics of the sample closely match those of the U.S. adult population. See Methodology for details. 2Those who describe their religion as “nothing in particular” are subdivided into two groups. The “religion not important” group includes those who say (in Q.F2) religion is “not too” or “not at all” important in their lives as well as those who decline to answer the question about religion’s importance. The “religion important” category includes those who say religion is “very” or “somewhat” important in their lives. PEW RESEARCH CENTER www.pewresearch.org 57 PEW RESEARCH CENTER Differences in income across religious traditions largely mirror the differences in educational attainment. Jews and Hindus are among the groups most likely to report an annual household income of $100,000 or more (44% of Jews and 36% of Hindus). By contrast, large shares of members of the historically black Protestant tradition (53%), Jehovah’s Witnesses (48%) and people who say their religion is “nothing in particular” but that religion is at least somewhat important in their lives (47%) report household incomes of under $30,000 a year. Catholics and Protestants overall largely mirror the U.S. general public in their income levels, though Protestants in the mainline tradition are somewhat more well-off by this measure than are their counterparts in the evangelical and historically black Protestant traditions. Atheists and agnostics tend to be relatively wealthy, with about six-in-ten in each group making $50,000 or more per year. By contrast, those who describe their religion as “nothing in particular” and who say religion is unimportant to them closely mirror the population as a whole, while those who say their religion is “nothing in particular” but that religion is at least somewhat important to them tend to have below-average family incomes. www.pewresearch.org 58 PEW RESEARCH CENTER Income of Religious Groups % of each religious group with total family income of _____ per year. -----2007---------2014----$30,000 to $50,000 to $100,000 $30,000 to $50,000 to $100,000 <$30,000 $49,999 $99,999 or more <$30,000 $49,999 $99,999 or more % % % % % % % % 31 22 30 18=100 35 20 26 19=100 32 22 30 16 36 21 27 17 32 23 29 15 36 21 27 16 Evangelical 34 24 29 13 35 22 28 14 Mainline 25 21 33 21 29 20 28 23 Historically black Full sample1 Christian Protestant 47 26 19 8 53 22 17 8 Catholic 31 20 30 19 36 19 26 19 Orthodox Christian 20 24 29 28 18 17 36 29 Mormon 26 21 38 16 27 20 33 20 Jehovah's Witness 42 23 26 9 48 25 22 4 Non-Christian faiths 21 17 32 30 28 16 28 28 Jewish 14 11 29 46 16 15 24 44 Muslim 26 18 43 13 34 17 29 20 Buddhist 25 19 34 22 36 18 32 13 Hindu 9 10 38 43 17 13 34 36 Unaffiliated 29 23 29 19 33 20 26 21 Atheist 21 20 31 28 24 18 28 30 Agnostic 18 22 35 25 22 18 30 29 Nothing in particular 32 24 28 16 38 21 24 17 25 24 30 21 30 22 27 21 40 24 25 12 47 21 21 12 Religion not important2 Religion important2 2014 Religious Landscape Study, conducted June 4-Sept. 30, 2014. Figures may not add to 100% due to rounding. Figures reported here have not been adjusted for inflation. Results recalculated to exclude nonresponse. 1The demographic characteristics of the 2014 Religious Landscape Study’s overall sample were weighted to known parameters from the Census Bureau's 2012 American Community Survey (ACS), which helps to ensure that the demographic characteristics of the sample closely match those of the U.S. adult population. See Methodology for details. 2Those who describe their religion as “nothing in particular” are subdivided into two groups. The “religion not important” group includes those who say (in Q.F2) religion is “not too” or “not at all” important in their lives as well as those who decline to answer the question about religion’s importance. The “religion important” category includes those who say religion is “very” or “somewhat” important in their lives. PEW RESEARCH CENTER www.pewresearch.org 59 PEW RESEARCH CENTER As in 2007, women continue to make up more than half of nearly every Christian group. Roughly two-thirds of Jehovah’s Witnesses are women, as are 59% of those who identify with the historically black Protestant tradition, 55% of those in both the evangelical and mainline Protestant traditions and 54% of Catholics and Mormons. Most religiously unaffiliated adults, by contrast, are men. Fully two-thirds of self-identified atheists are men, as are 62% of agnostics and 55% of those who identify religiously as “nothing in particular” and further say that religion is unimportant in their lives. Among those who describe their religion as “nothing in particular” but say that religion is at least somewhat important in their lives, however, there are about as many women as men. www.pewresearch.org 60 PEW RESEARCH CENTER Most Christians Are Women, Most “Nones” Are Men % of each religious group that is male or female -----2007----- -----2014----- Men Women Men Women % % % % 48 52=100 48 52=100 46 54 45 55 46 54 45 55 Evangelical 47 53 45 55 Mainline 46 54 45 55 Historically black 40 60 41 59 Catholic 46 54 46 54 Orthodox Christian 46 54 56 44 Mormon 44 56 46 54 Jehovah's Witness 40 60 35 65 Non-Christian faiths 54 46 54 46 Jewish 52 48 52 48 Muslim 58 42 65* 35 Buddhist 53 47 51 49 Hindu 61 39 62 38 Unaffiliated 59 41 57 43 Atheist 70 30 68 32 Agnostic 64 36 62 38 Nothing in particular 56 44 54 46 Religion not important2 60 40 55 45 52 48 51 49 Full sample1 Christian Protestant Religion important2 2014 Religious Landscape Study, conducted June 4-Sept. 30, 2014. In 2007, respondents’ gender was determined by interviewer assessment; in 2014, gender is based primarily on respondents’ answers to a question about their gender. See topline for details. 1The demographic characteristics of the 2014 Religious Landscape Study’s overall sample were weighted to known parameters from the Census Bureau's 2012 American Community Survey (ACS), which helps to ensure that the demographic characteristics of the sample closely match those of the U.S. adult population. See Methodology for details. 2Those who describe their religion as “nothing in particular” are subdivided into two groups. The “religion not important” group includes those who say (in Q.F2) religion is “not too” or “not at all” important in their lives as well as those who decline to answer the question about religion’s importance. The “religion important” category includes those who say religion is “very” or “somewhat” important in their lives. *The 2014 Religious Landscape Study's estimate that 65% of U.S. Muslims are men differs significantly from the Pew Research Center's 2011 survey of Muslim Americans, which estimated that 55% of Muslims were men. The 2011 survey attempted to match male interviewers with male respondents and female interviewers with female respondents in households reached by landline. This practice is common among survey researchers conducting face-to-face interviews in Muslim-majority nations and probably produced a more accurate estimate of the gender composition of American Muslims than the 2014 Religious Landscape Study, in which there was no attempt to match interviewers with respondents on the basis of gender. PEW RESEARCH CENTER www.pewresearch.org 61 PEW RESEARCH CENTER Since the first Religious Landscape Study was conducted in 2007, the share of Americans who are married has continued to decline, while the share of adults who have never been married has risen sharply. In fact, recent analysis of census data shows that the share of Americans who have never been married now stands at an all-time high. These trends are evident across several religious groups. The share of evangelical Protestants, Catholics and religiously unaffiliated respondents who are married declined noticeably between 2007 and 2014. Mormons continue to be among the groups most likely to be married. Compared with most other religious groups, there are fewer married people in the historically black Protestant tradition and among the religiously unaffiliated. www.pewresearch.org 62 PEW RESEARCH CENTER Marriage Rates Down Among Evangelicals, Catholics and Religious “Nones” ----------------------------2007------------------------------ --------------------------------2014-------------------------- Living Never with a Divorced/ Married partner separated Widowed married Married Living Never with a Divorced/ partner separated Widowed married % % % % % % % % % % 54 6 12 8 19=100 48 7 13 7 25=100 56 6 12 9 17 52 6 14 8 21 55 5 13 10 17 52 5 14 8 20 Evangelical 59 5 13 9 14 55 5 14 8 18 Mainline 57 5 12 11 15 55 6 12 9 18 Historically black 33 6 16 11 34 31 6 19 9 36 Catholic 58 7 10 8 17 52 8 12 7 21 Orthodox Christian 58 3 9 7 22 48 5 9 6 31 Mormon 71 3 9 5 12 66 3 7 5 19 Jehovah's Witness 53 1 14 11 20 53 5 12 8 21 Non-Christian faiths 52 7 11 5 24 46 8 11 3 31 Jewish 57 6 9 8 19 56 6 9 6 23 Muslim 50 6 15 1 28 41 4 8 1 45 Buddhist 45 8 12 4 31 39 11 10 2 37 Hindu 79 * 5 2 14 60 3 5 1 32 Full sample1 Christian Protestant Unaffiliated 46 10 12 4 28 37 11 11 3 37 Atheist 39 11 10 3 37 36 13 9 2 40 Agnostic 41 10 10 3 36 35 11 11 2 41 Nothing in particular 48 10 12 4 26 38 11 12 3 35 49 11 11 3 26 39 10 11 3 37 47 10 13 4 25 37 13 13 4 32 Religion not Religion important2 important2 2014 Religious Landscape Study, conducted June 4-Sept. 30, 2014. Figures may not add to 100% due to rounding. Results recalculated to exclude nonresponse. In theory, the categories presented here are not mutually exclusive. For example, it is possible for someone to be both “living with a partner” and “widowed” or “never married.” In this analysis, however, the categories are mutually exclusive, because respondents were asked to choose the category that represents their current marital status. 1The demographic characteristics of the 2014 Religious Landscape Study’s overall sample were weighted to known parameters from the Census Bureau's 2012 American Community Survey (ACS), which helps to ensure that the demographic characteristics of the sample closely match those of the U.S. adult population. See Methodology for details. 2Those who describe their religion as “nothing in particular” are subdivided into two groups. The “religion not important” group includes those who say (in Q.F2) religion is “not too” or “not at all” important in their lives as well as those who decline to answer the question about religion’s importance. The “religion important” category includes those who say religion is “very” or “somewhat” important in their lives. PEW RESEARCH CENTER www.pewresearch.org 63 PEW RESEARCH CENTER Just as they are more likely than people in most other faiths to be married, Mormons also tend to have larger families than do people in other religious groups. Mormons between the ages of 40 and 59 have had an average of 3.4 children over the course of their lives, significantly above the national average of 2.1 children. Mormons also report that they are currently raising more children than are members of most other religious groups. On average, Mormon adults of all ages report that they are now living with 1.1 children to whom they are parent or guardian.21 By contrast, the unaffiliated tend to have smaller families than other groups. Religious “nones” between the ages of 40 and 59 have had an average of 1.7 children during their lives. Atheists have had an average of 1.6 children, and agnostics have had 1.3 children. Mainline Protestants also have below-average fertility rates. The number of children ever born to adults ages 40-59 is a good measure of what demographers call “completed fertility.” In comparisons of childbearing among younger adults across religious groups that vary significantly in educational attainment, it is difficult to determine the extent to which differences in children ever born may be due to differences in the timing of childbearing. The discussion of the number of children that people are currently raising in their own homes is based on adult respondents of all ages. 21 www.pewresearch.org 64 PEW RESEARCH CENTER Fertility and Child Rearing Completed fertility Children currently (average number of children at home (average ever born to adults ages 40-59) among all adults) 2.1 0.6 Full sample1 Christian Protestant 2.2 0.6 2.2 0.6 Evangelical 2.3 0.6 Mainline 1.9 0.5 Historically black 2.5 0.6 Catholic 2.3 0.6 Orthodox Christian n/a 0.6 Mormon 3.4 1.1 Jehovah's Witness n/a 0.6 Non-Christian faiths 1.8 0.6 Jewish 2.0 0.5 Muslim n/a 0.8 Buddhist n/a 0.4 Hindu n/a 0.6 Unaffiliated 1.7 0.5 Atheist 1.6 0.4 Agnostic 1.3 0.4 Nothing in particular 1.9 0.6 1.7 0.5 2.1 0.7 Religion not important2 Religion important2 2014 Religious Landscape Study, conducted June 4-Sept. 30, 2014. The “completed fertility” column reports the average number of children ever born to people ages 40-59 in each group with a sufficient sample size. Women tend to report slightly higher fertility rates than men, but the patterns here are largely unchanged when analysis is restricted to women. The “children currently at home” column is the average number of children living at home to whom the respondent is parent/guardian; it includes adults of all ages. 1The demographic characteristics of the 2014 Religious Landscape Study’s overall sample were weighted to known parameters from the Census Bureau's 2012 American Community Survey (ACS), which helps to ensure that the demographic characteristics of the sample closely match those of the U.S. adult population. See Methodology for details. 2Those who describe their religion as “nothing in particular” are subdivided into two groups. The “religion not important” group includes those who say (in Q.F2) religion is “not too” or “not at all” important in their lives as well as those who decline to answer the question about religion’s importance. The “religion important” category includes those who say religion is “very” or “somewhat” important in their lives. PEW RESEARCH CENTER www.pewresearch.org 65 PEW RESEARCH CENTER Some religious groups are disproportionately concentrated in certain areas of the country, while others tend to be more evenly distributed across geographic regions. Large shares of Protestants in all three major traditions live in the South, including a majority of those in the historically black Protestant tradition (62%), about half of evangelicals (49%) and a plurality of mainline Protestants (37%). A plurality of Jews live in the Northeast (42%). Mormons are heavily concentrated in the West, though the share of Mormons in the current survey who reside in the West is down somewhat since 2007 (from 76% to 67%). The change, however, does not seem to be the result of large-scale movement of Mormons from the West to other regions. In fact, Mormons are virtually unchanged since 2007 as a share of the population in the Northeast, Midwest and South. Rather, the change is produced by a slight decline in the share of Westerners who identify as Mormons, from just under 6% in 2007 to just under 5% in 2014. Even such a small decline can result in a large change in the geographic distribution of a relatively small religious group, especially one that is heavily concentrated in a single geographic region. Future surveys will determine whether this small decline in the Mormon share of the Western population is the beginning of a trend or merely an outlier. www.pewresearch.org 66 PEW RESEARCH CENTER Evangelical, Historically Black Protestant Traditions Concentrated in Southern U.S. % of each religious group living in ______ region of the United States Northeast -----2007----Midwest South West Northeast -----2014----Midwest South West % % % % % % % 19 23 36 22=100 18 21 37 23=100 18 24 38 20 17 22 40 21 13 25 46 16 13 23 47 17 Evangelical 10 23 50 17 9 22 49 20 Mainline 19 29 34 18 18 28 37 17 Historically black Full sample1 Christian Protestant 13 19 60 8 13 18 62 7 Catholic 29 24 24 23 26 21 27 26 Orthodox Christian 33 19 24 25 33 12 27 28 Mormon 4 7 12 76 6 7 20 67 Jehovah's Witness 16 19 36 29 18 17 36 29 Non-Christian faiths 29 16 27 28 30 15 26 28 Jewish 41 12 26 21 42 11 27 20 Muslim 27 24 31 18 31 23 26 20 Buddhist 17 15 23 45 17 17 23 43 Hindu 29 13 32 26 33 10 18 38 Unaffiliated 19 23 29 29 20 21 31 28 Atheist 21 20 23 35 24 20 26 30 Agnostic 20 20 28 32 21 19 29 31 Nothing in particular 18 24 30 27 19 21 33 27 21 22 25 32 21 21 27 31 15 26 37 22 16 21 40 23 Religion not important2 Religion important2 2014 Religious Landscape Study, conducted June 4-Sept. 30, 2014. Figures may not add to 100% due to rounding. 1The demographic characteristics of the 2014 Religious Landscape Study’s overall sample were weighted to known parameters from the Census Bureau's 2012 American Community Survey (ACS), which helps to ensure that the demographic characteristics of the sample closely match those of the U.S. adult population. See Methodology for details. 2Those who describe their religion as “nothing in particular” are subdivided into two groups. The “religion not important” group includes those who say (in Q.F2) religion is “not too” or “not at all” important in their lives as well as those who decline to answer the question about religion’s importance. The “religion important” category includes those who say religion is “very” or “somewhat” important in their lives. PEW RESEARCH CENTER www.pewresearch.org 67 PEW RESEARCH CENTER Compared with some other religious groups, Catholics are more evenly dispersed throughout Hispanic Catholics Concentrated in the country, with about one-in-five living in the South and West Midwest (21%) and a quarter or more in the Hispanic Non-Hispanic Northeast (26%), South (27%) and West (26%). Catholics Catholics % % The geographic center of Catholicism is shifting Northeast 15 32 gradually from the Northeast and Midwest Midwest 9 28 toward the South and West. In 2007, a slim South 33 24 majority of Catholics (53%) resided in the West 44 16 Northeast or Midwest. Today, a slim majority of 100 100 Catholics live in the South or West (52%). This 2014 Religious Landscape Study, conducted June 4-Sept. 30, shift is being driven by the continuing growth of 2014. Figures may not sum to 100% due to rounding. PEW RESEARCH CENTER Hispanics as a share of the U.S. Catholic population; three-quarters of Hispanic Catholics reside in the South or West, while sixin-ten non-Hispanic Catholics live in the Northeast or Midwest. www.pewresearch.org 68 PEW RESEARCH CENTER Chapter 4: The Shifting Religious Identity of Demographic Groups Previous research has shown clear differences in the religious identity, beliefs and practices of people from different demographic groups. Young adults tend to be less religiously affiliated than older people. Women tend to be more religiously affiliated than men. There are far more Catholics among Latinos than among people from other racial and ethnic backgrounds. Unmarried people are much more likely than those who are married to be unaffiliated with a religion. And the Western region of the U.S. is home to many more unaffiliated people than are other geographic regions. The 2014 Religious Landscape Study finds that all of these demographic differences remain visible in the U.S. today. Older people still identify with religious groups at a higher rate than younger people. Women still are more religiously affiliated than men. And married people are far more likely than single people to identify with a religion. But the new study also finds that the major shifts underway in American religion are occurring across a wide variety of demographic groups. Whether they are nearing retirement or just entering adulthood, married or single, living in the West or the Bible Belt, Americans in virtually all demographic groups are significantly less likely to describe themselves as Christians and more likely to identify as religious “nones,” compared with seven years ago. This chapter takes a detailed look at the religious composition of demographic groups in the U.S., highlighting the differences that continue to exist among people from various backgrounds, as well as the similar changes that are afoot among many demographic groups. The previous chapter assesses the same data from the opposite direction, examining the demographic composition of religious groups. www.pewresearch.org 69 PEW RESEARCH CENTER More than a third of adults in the Millennial generation (35%) now say they have no religion, up 10 points from 2007. Millennials have become more unaffiliated, both because large numbers of younger Millennials are entering adulthood with high levels of religious disaffiliation – 36% of those currently ages 18-24 are unaffiliated – and because older Millennials increasingly identify as religious “nones.” Roughly a third (34%) of older Millennials (now ages 25-33) identify as unaffiliated, up from 25% among this same cohort in 2007 (when they were 18-26). Just 56% of Millennial adults identify themselves as Christians, including 21% who identify with evangelical Protestantism, 16% with Catholicism and 11% with mainline Protestantism. By comparison, people in older generations are far more likely than Millennials to describe themselves as Christians and less likely to identify as religious “nones.” But even older generations are growing less Christian over time. The share of people in Generation X who describe themselves as Christians, for instance, has dropped from 76% in 2007 to 70% today, while the unaffiliated share of Generation X has grown from 19% to 23%. The share of Christians among Baby Boomers and the Silent generation also ticked down slightly but noticeably in recent years, while the share of “nones” in these cohorts grew slightly. www.pewresearch.org 70 PEW RESEARCH CENTER Religious Composition of Generational Cohorts Millennials Greatest generation Silent generation Baby Boomers Generation X (born 1981(born before 1928) (born 1928-1945) (born 1946-1964) (born 1965-1980) 1996) 2007 2014 2007 2014 2007 2014 2007 2014 2007 2014 Christian Protestant % % % % % % % % % % 88 86 87 85 80 78 76 70 68 56 63 57 60 57 54 52 47 45 42 37 Evangelical 28 25 30 30 28 28 25 25 21 21 Mainline 29 26 23 22 19 17 15 13 13 11 Historically black 6 6 7 5 7 7 6 7 8 6 Catholic 22 27 24 24 24 23 26 21 22 16 Orthodox 1 * * * 1 * 1 1 1 1 Mormon 1 1 2 2 1 1 2 2 2 2 Jehovah’s Witness 1 1 1 1 1 1 1 1 1 1 Other Christian 1 * * * * 1 * * * * 4 6 4 4 5 5 5 6 6 8 Jewish 3 5 2 2 2 2 1 2 2 2 Muslim * 0 * * * * 1 1 1 2 Buddhist * 0 1 * 1 1 1 1 1 1 Hindu * * * * * * 1 1 * 1 Other world religions 0 0 * * * * * * * * Other faiths 1 1 1 1 1 1 1 2 2 2 7 8 9 11 14 17 19 23 25 35 Atheist 1 2 1 1 1 2 2 3 3 5 Agnostic 1 1 2 2 2 2 2 4 4 7 Nothing in particular Non-Christian faiths Unaffiliated 5 5 6 7 11 12 15 17 18 23 Religion not important1 3 3 4 4 6 7 7 9 9 13 Religion important1 3 2 3 3 5 6 7 8 9 9 1 1 1 * 1 1 1 1 1 1 100 100 100 100 100 100 100 100 100 100 2,001 585 7,853 5,989 8,092 7,303 3,087 7,419 Don't know/refused Sample size 13,662 13,049 2014 Religious Landscape Study, conducted June 4-Sept. 30, 2014. Figures may not add to 100% and nested figures may not add to subtotals indicated due to rounding. 1Those who describe their religion as “nothing in particular” are subdivided into two groups. The “religion not important” group includes those who say (in Q.F2) religion is “not too” or “not at all” important in their lives as well as those who decline to answer the question about religion’s importance. The “religion important” category includes those who say religion is “very” or “somewhat” important in their lives. PEW RESEARCH CENTER www.pewresearch.org 71 PEW RESEARCH CENTER The unaffiliated have grown and Christians have declined as a share of all racial and ethnic groups. Whites, however, continue to be more likely than both blacks and Hispanics to say they have no religion (24% among whites compared with 20% among Hispanics and 18% among blacks). Blacks stand out for their high levels of identification with Protestantism (71%), especially with denominations in the historically black Protestant tradition (53%). Hispanics continue to identify with Catholicism in larger numbers than other racial and ethnic groups. However, the Catholic share of the Hispanic population has declined dramatically in recent years, from 58% in the 2007 Religious Landscape Study to 48% today. Among people from other racial and ethnic backgrounds (e.g., those who are Asian, Native American or mixed race, but not Hispanic), fully one-infive (21%) identify with non-Christian faiths, including 8% who describe themselves as Hindus, 4% as Buddhists and 3% as Muslims. The Impact of Interview Language on Estimating the Religion of Racial and Ethnic Minorities The 2014 Religious Landscape Study was conducted in English and Spanish, which is important to keep in mind for understanding the estimates of the size of religious groups among racial and ethnic minorities. The current study employed bilingual interviewers to call phone numbers in areas with large numbers of Latinos. In other parts of the country, Spanish-speaking respondents who were originally reached by an English-speaking interviewer were called back by a Spanish speaker to complete the interview. This approach is far superior to surveys conducted only in English in its ability to represent the religious characteristics of Latinos in the U.S., especially since there are many more Catholics among Spanishspeaking Latinos than among Latinos who speak English. However, surveys conducted entirely by bilingual interviewers, such as the Pew Research Center's 2013 Survey of Latinos and Religion, provide an even better representation of the U.S. Latino community. Such surveys tend to produce higher estimates of the Catholic share of the Latino population because they reach a higher share of Spanish-speaking Latinos. The 2013 Pew Research survey, for instance, found that 55% of Latinos identify as Catholic, compared with 48% in the 2014 Religious Landscape Study. Both studies, however, find that the Catholic share of the Latino population has declined rapidly in recent years (from 58% to 48% between the 2007 and 2014 Religious Landscape Studies, and from 67% to 55% in recent fully bilingual surveys of Latinos). Among those in the “other race” category (i.e., those who are not white, black or Latino), about half describe themselves as Asian Americans, with the rest identifying as mixed race or some other race. The Pew Research Center conducted a major survey of Asian Americans in 2012 in English as well as Cantonese, Hindi, Japanese, Korean, Mandarin, Tagalog and Vietnamese. That report includes a detailed summary of the religious composition, beliefs and practices of Asian Americans. www.pewresearch.org 72 PEW RESEARCH CENTER Growing Proportion of Unaffiliated Across Racial and Ethnic Groups White, non-Hispanic 2007 2014 Black, non-Hispanic 2007 2014 Hispanic 2007 2014 Other race, non-Hispanic 2007 2014 % % % % % % % % 78 70 85 79 84 77 58 49 53 48 78 71 23 26 40 33 Evangelical 30 29 15 14 16 19 26 23 Mainline 23 19 4 4 5 5 13 9 Historically black * * 59 53 3 1 1 1 Catholic 22 19 5 5 58 48 15 13 Orthodox 1 1 * * * * 1 * Mormon 2 2 * * 1 1 1 1 Jehovah’s Witness * * 1 2 1 2 1 1 Other Christian * * * 1 * * * 1 5 5 2 3 2 2 18 21 Jewish 2 3 * * * 1 1 1 Muslim * * 1 2 * * 2 3 Buddhist 1 * * * * 1 5 4 Hindu * * * * * * 7 8 Other world religions * * * * * * 1 2 Other faiths 1 2 * 1 * 1 3 2 Christian Protestant Non-Christian faiths Unaffiliated 16 24 12 18 14 20 22 29 Atheist 2 4 * 1 1 2 2 4 Agnostic 3 5 1 1 1 2 3 5 Nothing in particular 12 15 11 16 12 16 16 20 7 10 3 5 4 7 9 11 5 6 8 11 8 9 7 9 Religion not important1 Religion important1 Don't know/refused Sample size 1 1 1 * 1 * 2 1 100 100 100 100 100 100 100 100 27,309 24,900 3,101 3,394 3,151 3,814 1,540 2,441 2014 Religious Landscape Study, conducted June 4-Sept. 30, 2014. Figures may not add to 100% and nested figures may not add to subtotals indicated due to rounding. The "other race, non-Hispanic" category includes Asian Americans, Native Americans, people of mixed race and others. 1Those who describe their religion as “nothing in particular” are subdivided into two groups. The “religion not important” group includes those who say (in Q.F2) religion is “not too” or “not at all” important in their lives as well as those who decline to answer the question about religion’s importance. The “religion important” category includes those who say religion is “very” or “somewhat” important in their lives. PEW RESEARCH CENTER www.pewresearch.org 73 PEW RESEARCH CENTER Roughly seven-in-ten U.S.-born adults identify themselves as Christians (71%), as do 68% of immigrants. The Christian share of each group, however, has slipped in recent years (by eight percentage points among the native born and seven points among immigrants), while the unaffiliated share has grown. Among the native born, most Christians (50% of all native-born adults) continue to identify with Protestantism; most Christian immigrants (39% of all of those born outside the U.S.) identify as Catholics. Compared with immigrants who have been in the United States for decades (i.e., since before 1990), immigrants who have arrived more recently are somewhat less likely to be Christian and more likely to identify with non-Christian faiths or with no religion. Three-quarters of immigrants who arrived in the U.S. before 1990 identify with Christianity, compared with 64% of those who arrived in the 1990s and 63% of those who arrived since 2000. More than one-in-five immigrants who came to the U.S. in 1990 or later are unaffiliated, and 14% identify with non-Christian faiths such as Islam or Hinduism. www.pewresearch.org 74 PEW RESEARCH CENTER Christians Decline, “Nones” Grow as Share of Both Native Born and Immigrants Christian Protestant Evangelical Mainline Historically black Catholic Orthodox Christian Mormon Jehovah’s Witness Other Christian 2007 % 79 55 28 20 8 21 * 2 1 * Among those born in the U.S. 2014 Change % 71 -8 50 -5 27 -16 -4 7 -1 18 -3 * -2 -1 -* -- 2007 % 75 24 15 7 3 47 2 1 1 * Among those born outside the U.S. 2014 Change % 68 -7 25 -15 -7 -3 -39 -8 1 -1 -1 -* -- Non-Christian faiths Jewish Muslim Buddhist Hindu Other world religions Other faiths 4 2 * 1 * * 1 5 2 * 1 * * 2 +1 -----+1 8 1 2 2 3 * 1 12 1 4 1 4 1 1 +4 -+2 ----- Unaffiliated Atheist Agnostic Nothing in particular Religion not important1 Religion important1 16 2 2 12 6 6 23 3 4 16 9 7 +7 +1 +2 +4 +3 +1 16 1 2 13 5 7 20 3 2 15 8 7 +4 +2 -+2 +3 -- Don't know/refused 1 100 1 100 -- 1 100 1 100 -- 32,179 30,922 3,186 3,954 Sample size 2014 Religious Landscape Study, conducted June 4-Sept. 30, 2014. Figures may not add to 100% and nested figures may not add to subtotals indicated due to rounding. The “change” columns display only statistically significant changes; blank cells indicate that the difference between 2007 and 2014 is within the margin of error. For the purposes of this analysis, people born in Puerto Rico are included among those born outside the U.S. 1Those who describe their religion as “nothing in particular” are subdivided into two groups. The “religion not important” group includes those who say (in Q.F2) religion is “not too” or “not at all” important in their lives as well as those who decline to answer the question about religion's importance. The “religion important” category includes those who say religion is “very” or “somewhat” important in their lives. PEW RESEARCH CENTER www.pewresearch.org 75 PEW RESEARCH CENTER Immigrants Arriving in the 1990s and Later More Likely to Identify as “Nones” Among respondents born outside of the U.S. who arrived … Christian Protestant Before 1990 % From 1990-1999 % 2000 or later % 75 64 63 28 24 23 Evangelical 17 15 14 Mainline 8 7 6 Historically black 3 3 3 Catholic 43 37 35 Orthodox 1 1 2 Mormon 1 1 1 Jehovah’s Witness 1 1 1 Other Christian * * * 9 14 14 Jewish 2 1 1 Muslim 2 5 5 Buddhist 2 1 1 Hindu 1 4 7 Other world religions 1 1 * Other faiths 1 1 1 16 22 23 Atheist 2 4 2 Agnostic 2 3 2 12 15 18 7 7 9 5 8 9 1 * * 100 100 100 1,645 822 1,299 Non-Christian faiths Unaffiliated Nothing in particular Religion not important1 Religion important1 Don't know/refused Sample size 2014 Religious Landscape Study, conducted June 4-Sept. 30, 2014. Figures may not add to 100% and nested figures may not add to subtotals indicated due to rounding. 1Those who describe their religion as “nothing in particular” are subdivided into two groups. The “religion not important” group includes those who say (in Q.F2) religion is “not too” or “not at all” important in their lives as well as those who decline to answer the question about religion’s importance. The “religion important” category includes those who say religion is “very” or “somewhat” important in their lives. PEW RESEARCH CENTER www.pewresearch.org 76 PEW RESEARCH CENTER The share of Christians has declined since 2007 among both college graduates (by nine percentage points) and those with less than a college degree (by eight points), while the unaffiliated share has grown among both groups (by seven points among college graduates and six points among those with less education). Roughly a quarter of college graduates describe themselves as religious “nones,” as do 22% of those with less than a college education. College graduates, however, are nearly twice as likely as those with less education to identity as atheist or agnostic (11% vs. 6%). College graduates also are significantly more likely than those with less education to identify with non-Christian faiths such as Judaism or Hinduism (11% vs. 4%). www.pewresearch.org 77 PEW RESEARCH CENTER Both College Graduates and Those With Less Education Becoming More Unaffiliated Among college graduates Christian Protestant Among those with less than a college degree 2007 % 2014 % Change 2007 % 2014 % Change 73 64 -9 81 73 -8 46 41 -5 53 49 -4 Evangelical 20 20 -- 29 28 -1 Mainline 23 18 -5 16 14 -2 Historically black 4 4 -- 8 8 -- Catholic 23 20 -3 24 21 -3 Orthodox Christian 1 1 -- * * -- Mormon 2 2 -- 2 1 -1 Jehovah's Witness * * -- 1 1 -- Other Christian * * -- * * -- 9 11 +2 3 4 +1 Jewish 4 4 -- 1 1 -- Muslim 1 1 -- * 1 +1 Buddhist 1 1 -- 1 1 -- Hindu 1 2 +1 * * -- Other world religions * * -- * * -- Other faiths 2 2 -- 1 1 -- 17 24 +7 16 22 +6 Atheist 2 5 +3 1 2 +1 Agnostic 4 6 +2 2 3 +1 11 14 +3 13 17 +4 7 10 +3 6 9 +3 4 4 -- 7 8 +1 1 1 -- 1 1 -- 100 100 100 100 12,931 14,695 22,367 20,173 Non-Christian faiths Unaffiliated Nothing in particular Religion not important1 Religion important1 Don't know/refused Sample size 2014 Religious Landscape Study, conducted June 4-Sept. 30, 2014. Figures may not add to 100% and nested figures may not add to subtotals indicated due to rounding. The “change” columns display only statistically significant changes; blank cells indicate that the difference between 2007 and 2014 is within the margin of error. 1Those who describe their religion as “nothing in particular” are subdivided into two groups. The “religion not important” group includes those who say (in Q.F2) religion is “not too” or “not at all” important in their lives as well as those who decline to answer the question about religion’s importance. The “religion important” category includes those who say religion is “very” or “somewhat” important in their lives. PEW RESEARCH CENTER www.pewresearch.org 78 PEW RESEARCH CENTER Compared with 2007, there are smaller shares of self-identified Christians and more religious “nones” among Americans in every household income bracket, from those earning less than $30,000 per year to those earning $100,000 or more. As of 2014, the religiously unaffiliated make up a fifth or more of each income bracket, from 22% of those making less than $30,000 each year to 26% of those earning $100,000 or more annually. Compared with those at the low end of the income scale, those at the very top (i.e., people with household incomes of at least $100,000) are somewhat less likely to describe themselves as Christians and more likely to identify with nonChristian faiths or to be unaffiliated. www.pewresearch.org 79 PEW RESEARCH CENTER Growing Proportion of Unaffiliated Adults Across All Income Categories Among respondents whose household income is … Under $30,000 2007 2014 Christian Protestant $30,000-$49,999 $50,000-$74,999 $75,000-$99,999 $100,000+ 2007 2014 2007 2014 2007 2014 2007 2014 % % % % % % % % % % 81 72 79 72 79 71 78 69 74 64 54 48 54 49 52 48 49 45 45 41 Evangelical 29 26 29 28 29 29 24 25 20 20 Mainline 15 12 17 14 19 14 21 17 22 18 Historically black 10 10 8 7 5 5 4 4 3 3 Catholic 24 21 21 19 22 20 25 20 26 21 Orthodox * * 1 * 1 1 1 1 1 1 Mormon 1 1 2 2 2 2 2 2 2 2 Jehovah’s Witness 1 1 1 1 1 1 * 1 * * Other Christian * * * 1 * * * * * 1 3 5 4 5 5 6 5 6 8 9 Jewish 1 1 1 1 2 1 1 2 4 4 Muslim * 1 * 1 1 1 1 1 * 1 Buddhist 1 1 1 1 1 1 1 1 1 1 Hindu * * * * * 1 1 1 1 1 Other world religions * * * * * * * * * * Other faiths 1 2 1 1 1 2 1 2 1 2 15 22 17 23 16 23 16 24 18 26 Atheist 1 2 1 3 2 3 2 3 3 5 Agnostic 2 3 3 4 3 4 3 6 4 7 13 17 13 17 12 15 11 14 11 14 5 8 7 10 6 9 7 10 7 10 8 10 6 7 5 6 5 5 4 4 1 1 * * 1 * 1 1 1 * 100 100 100 100 100 100 100 100 100 100 8,068 8,845 6,387 5,920 5,185 4,701 3,990 4,022 5,805 7,002 Non-Christian faiths Unaffiliated Nothing in particular Religion not important1 Religion important1 Don't know/refused Sample size 2014 Religious Landscape Study, conducted June 4-Sept. 30, 2014. Figures may not add to 100% and nested figures may not add to subtotals indicated due to rounding. 1Those who describe their religion as “nothing in particular” are subdivided into two groups. The “religion not important” group includes those who say (in Q.F2) religion is “not too” or “not at all” important in their lives as well as those who decline to answer the question about religion’s importance. The “religion important” category includes those who say religion is “very” or “somewhat” important in their lives. PEW RESEARCH CENTER www.pewresearch.org 80 PEW RESEARCH CENTER Women are far more likely than men to identify with Christian groups (75% vs. 66%). Men, by contrast, are more likely than women to describe themselves as religious “nones” (27% vs. 19%). But both men and women have become less Christian and more unaffiliated since 2007, by roughly equal amounts. The share of men who identify with Christianity has shrunk by eight percentage points since 2007, and the share of self-identified Christians among women has declined by seven points. Meanwhile, the share of “nones” is up seven points among men and six points among women. www.pewresearch.org 81 PEW RESEARCH CENTER Women More Likely Than Men to Identify as Christians; Men More Likely Than Women to Be Unaffiliated Among men Among women 2007 % 2014 % Change 2007 % 2014 % Change 74 66 -8 82 75 -7 49 43 -6 54 50 -4 Evangelical 26 24 -2 27 27 -- Mainline 17 14 -3 19 16 -3 Historically black 6 5 -- 8 7 -- Catholic 23 20 -3 25 22 -3 Orthodox Christian 1 1 -- 1 * -- Mormon 2 2 -- 2 2 -- Jehovah’s Witness 1 1 -- 1 1 -- Other Christian * * -- * * -- 5 7 +2 4 5 +1 Jewish 2 2 -- 2 2 -- Muslim 1 1 -- * 1 +1 Buddhist 1 1 -- 1 1 -- Hindu 1 1 -- * * -- Other world religions * * -- * * -- Other faiths 1 2 -- 1 1 -- Christian Protestant Non-Christian faiths Unaffiliated 20 27 +7 13 19 +6 Atheist 2 4 +2 1 2 +1 Agnostic 3 5 +2 2 3 +1 Nothing in particular 14 17 +3 10 14 +4 8 10 +2 5 8 +3 6 7 +1 5 7 +2 -- -- Religion not important1 Religion important1 Don't know/refused Sample size 1 1 1 1 100 100 100 100 16,291 17,514 19,265 17,557 2014 Religious Landscape Study, conducted June 4-Sept. 30, 2014. Figures may not add to 100% and nested figures may not add to subtotals indicated due to rounding. The “change” columns display only statistically significant changes; blank cells indicate that the difference between 2007 and 2014 is within the margin of error. 1Those who describe their religion as “nothing in particular” are subdivided into two groups. The “religion not important” group includes those who say (in Q.F2) religion is “not too” or “not at all” important in their lives as well as those who decline to answer the question about religion’s importance. The “religion important” category includes those who say religion is “very” or “somewhat” important in their lives. PEW RESEARCH CENTER www.pewresearch.org 82 PEW RESEARCH CENTER Scholars have long recognized that religion and marriage are linked in important ways, with married people tending to be more religiously active than unmarried people. Princeton University sociologist Robert Wuthnow, for instance, has charted an overall decline in church attendance since the 1970s and attributes it to broader social trends like the postponement of marriage and parenthood by many young adults.22 And the rise of the religious “nones” in recent decades has coincided with a decline in marriage rates, with recent census data showing that the marriage rate in the U.S. now stands at a record low. The 2014 Religious Landscape Study finds that unmarried people are far more likely than those who are married to be unaffiliated. It also shows, however, that both groups – those who are married and those who are not – have grown less religiously affiliated in recent years, though married people have done so more slowly. Among married adults, 18% now describe themselves as religious “nones,” up four points since 2007. More than a quarter of unmarried adults (28%) have no religious affiliation, up nine points in recent years. Within the broader category of unmarried U.S. adults, the growth of the religiously unaffiliated is especially evident among those who are living with a partner (26% were unaffiliated in 2007, compared with 35% today) and those who say they have never been married (24% vs. 34%). Both of these groups consist mostly of young people. Those who are divorced or separated and those who are widowed, two groups that consist mainly of older adults, have seen more modest increases in their shares of religious “nones.”23 Wuthnow, Robert. 2007. “After the Baby Boomers: How Twenty- and Thirty-Somethings Are Shaping the Future of American Religion.” Princeton University Press, pages 51-70. 23 In theory, these subcategories within the unmarried population are not mutually exclusive. For example, it is possible for someone to be both “living with a partner” and “widowed” or “never married.” In this analysis, however, the categories are mutually exclusive, because respondents were asked to choose the category that represents their current marital status. 22 www.pewresearch.org 83 PEW RESEARCH CENTER Fewer Christians Among Both Married, Unmarried Among married Among unmarried 2007 % 2014 % Change 2007 % 2014 % Change 81 76 -5 75 66 -9 52 50 -2 51 43 -8 Evangelical 29 29 -- 24 22 -2 Mainline 19 17 -2 17 13 -4 Historically black 4 4 -- 10 9 -1 Catholic 25 22 -3 22 20 -2 Orthodox Christian 1 * -- 1 * -- Mormon 2 2 -- 1 1 -- Jehovah’s Witness 1 1 -- 1 1 -- Other Christian * * -- * * -- 5 6 +1 5 6 +1 Jewish 2 2 -- 2 2 -- Muslim * 1 +1 * 1 +1 Buddhist 1 1 -- 1 1 -- Hindu 1 1 -- * 1 +1 Other world religions * * -- * * -- Other faiths 1 1 -- 1 2 +1 Christian Protestant Non-Christian faiths Unaffiliated 14 18 +4 19 28 +9 Atheist 1 2 +1 2 4 +2 Agnostic 2 3 +1 3 5 +2 Nothing in particular 11 13 +2 14 19 +5 6 7 +1 7 10 +3 5 5 -- 7 8 +1 -- -- Religion not important1 Religion important1 Don’t know/refused Sample size 1 1 1 1 100 100 100 100 20,430 17,827 14,878 17,064 2014 Religious Landscape Study, conducted June 4-Sept. 30, 2014. Figures may not add to 100% and nested figures may not add to subtotals indicated due to rounding. The “change” columns display only statistically significant changes; blank cells indicate that the difference between 2007 and 2014 is within the margin of error. 1Those who describe their religion as “nothing in particular” are subdivided into two groups. The “religion not important” group includes those who say (in Q.F2) religion is “not too” or “not at all” important in their lives as well as those who decline to answer the question about religion’s importance. The “religion important” category includes those who say religion is “very” or “somewhat” important in their lives. PEW RESEARCH CENTER www.pewresearch.org 84 PEW RESEARCH CENTER Sharpest Growth of Religious “Nones” Among Those Living With a Partner, Never Married Married 2007 2014 --------------------------------------------- Not married--------------------------------------Living with Divorced/ partner separated Widowed Never married 2007 2014 2007 2014 2007 2014 2007 2014 % % % % % % % % % % 81 76 68 57 79 74 89 86 69 58 52 50 40 32 56 52 64 60 45 38 Evangelical 29 29 19 17 28 28 30 31 19 18 Mainline 19 17 14 11 19 14 24 21 14 10 Christian Protestant 4 4 7 5 9 9 10 9 12 9 Catholic Historically black 25 22 26 23 21 19 22 23 21 18 Orthodox 1 * * * * * 1 * 1 1 Mormon 2 2 1 1 1 1 1 1 1 1 Jehovah’s Witness 1 1 * 1 1 1 1 1 1 1 Other Christian * * 1 * 1 1 * * * * Non-Christian faiths 5 6 5 7 4 5 3 3 6 7 Jewish 2 2 2 1 1 1 2 2 2 2 Muslim * 1 * * 1 1 * * 1 2 Buddhist 1 1 1 1 1 1 * * 1 1 Hindu 1 1 * * * * * * * 1 Other world religions * * * * * * * * * * Other faiths 1 1 2 3 2 2 1 1 2 2 14 18 26 35 16 20 7 11 24 34 1 2 3 5 1 2 1 1 3 5 Unaffiliated Atheist Agnostic 2 3 4 6 2 3 1 1 5 6 Nothing in particular 11 13 20 24 12 15 6 8 16 22 6 7 10 12 6 7 3 4 8 13 5 5 9 12 6 7 3 5 8 9 Religion not important1 Religion important1 Don't know/refused Sample size 1 1 1 * 1 * 1 * 1 1 100 100 100 100 100 100 100 100 100 100 1,753 2,128 4,425 4,752 3,705 3,218 4,995 6,966 20,430 17,827 2014 Religious Landscape Study, conducted June 4-Sept. 30, 2014. Figures may not add to 100% and nested figures may not add to subtotals indicated due to rounding. In theory, the categories presented here are not mutually exclusive. For example, it is possible for someone to be both “living with a partner” and “widowed” or “never married.” In this analysis, however, the categories are mutually exclusive, because respondents were asked to choose the category that represents their current marital status. 1Those who describe their religion as “nothing in particular” are subdivided into two groups. The “religion not important” group includes those who say (in Q.F2) religion is “not too” or “not at all” important in their lives as well as those who decline to answer the question about religion’s importance. The “religion important” category includes those who say religion is “very” or “somewhat” important in their lives. PEW RESEARCH CENTER www.pewresearch.org 85 PEW RESEARCH CENTER As in 2007, the South continues to be the most heavily Christian region of the country; threequarters of Southerners describe themselves as Christians, including 34% who identify with evangelical denominations. The Northeast is home to a greater share of Catholics than any other region (30%). And the West continues to have the largest share of people who are unaffiliated with any religion (28%). Those three geographic regions, as well as the Midwest, all have experienced a decline in the share of Christians and a rise in the religiously unaffiliated since 2007. Perhaps the most dramatic changes have taken place in the Northeast, where the share of Christians overall is down 11 points (from 76% in 2007 to 65% today) and the share of Catholics is down seven points, from 37% to 30%. In the West, the unaffiliated now constitute the single largest tradition; 28% of those residing in the West are religiously unaffiliated, compared with 23% who are Catholics, 22% who are evangelical Protestants and 11% who identify with mainline Protestant denominations. Even the South has seen a six-point increase in the share of residents who are unaffiliated, from 13% in 2007 to 19% in 2014. The Religious Landscape Study was designed to paint a religious portrait not just of the four major geographic regions, but also of every state and of the country’s largest metropolitan areas. Estimates of the composition of states and metro areas are available in the detailed tables in Appendix D as well as online through an interactive tool. www.pewresearch.org 86 PEW RESEARCH CENTER All Regions Becoming Less Christian, More Religiously Unaffiliated Among those who live in the … Northeast 2007 2014 Christian Protestant Midwest 2007 2014 South West 2007 2014 2007 2014 % % % % % % % % 76 65 80 73 83 76 71 64 37 32 54 50 65 59 38 34 Evangelical 13 13 26 26 37 34 20 22 Mainline 19 15 22 19 17 14 15 11 Historically black 5 5 6 5 11 11 3 2 Catholic 37 30 24 21 16 15 25 23 Orthodox 1 1 * * * * 1 1 Mormon * 1 1 1 1 1 6 5 Jehovah’s Witness 1 1 1 1 1 1 1 1 Other Christian * * * * * * 1 1 7 10 3 4 3 4 6 7 Jewish 4 4 1 1 1 1 2 2 Muslim 1 1 * 1 * 1 * 1 Buddhist 1 1 * 1 * * 2 1 Hindu 1 1 * * * * * 1 Other world religions * * * * * * * * Other faiths 1 2 1 1 1 1 2 2 16 25 16 22 13 19 21 28 Atheist 2 4 1 3 1 2 3 4 Agnostic 3 5 2 4 2 3 4 5 12 16 12 16 10 14 15 19 7 10 6 9 4 6 9 12 5 6 7 7 6 7 6 7 1 1 1 1 1 * 1 1 100 100 100 100 100 100 100 100 6,556 6,516 9,078 7,491 12,643 12,566 7,279 8,498 Non-Christian faiths Unaffiliated Nothing in particular Religion not important1 Religion important1 Don't know/refused Sample size 2014 Religious Landscape Study, conducted June 4-Sept. 30, 2014. Figures may not add to 100% and nested figures may not add to subtotals indicated due to rounding. 1Those who describe their religion as “nothing in particular” are subdivided into two groups. The “religion not important” group includes those who say (in Q.F2) religion is “not too” or “not at all” important in their lives as well as those who decline to answer the question about religion’s importance. The “religion important” category includes those who say religion is “very” or “somewhat” important in their lives. PEW RESEARCH CENTER www.pewresearch.org 87 PEW RESEARCH CENTER Among respondents who identify themselves as gay, lesbian or bisexual, fully 41% are religiously unaffiliated, and fewer than half (48%) describe themselves as Christians. NonChristian faiths also are represented in the gay community at higher rates than among the general public, with 11% of gay, lesbian and bisexual respondents identifying with faiths other than Christianity. These findings are broadly similar to results from the Pew Research Center’s 2013 survey of LGBT Americans. Different survey modes (the 2013 study was a self-administered survey whereas the 2014 Religious Landscape Study is an interviewer-administered survey) and questions used to identify gay, lesbian or bisexual respondents may explain small differences between the two surveys’ findings. Religious Composition by Self-Reported Sexual Identity Among those who identify as … Gay, lesbian or bisexual % Straight % 48 72 29 48 Evangelical 13 26 Mainline 11 15 Historically black 5 7 Catholic 17 21 Orthodox Christian * * Mormon 1 2 Jehovah’s Witness * 1 Other Christian 1 * 11 6 Jewish 2 2 Muslim 1 1 Buddhist 2 1 Hindu 1 1 Other world religions * * Other faiths 5 1 41 22 Atheist 8 3 Agnostic 9 4 Nothing in particular 24 15 14 9 10 7 1 1 100 100 1,604 32,439 Christian Protestant Non-Christian faiths Unaffiliated Religion not important1 Religion important1 Don't know/refused Sample size 2014 Religious Landscape Study, conducted June 4-Sept. 30, 2014. Figures may not add to 100% and nested figures may not add to subtotals indicated due to rounding. 1Those who describe their religion as “nothing in particular” are subdivided into two groups. The “religion not important” group includes those who say (in Q.F2) religion is “not too” or “not at all” important in their lives as well as those who decline to answer the question about religion’s importance. The “religion important” category includes those who say religion is “very” or “somewhat” important in their lives. PEW RESEARCH CENTER www.pewresearch.org 88 PEW RESEARCH CENTER Appendix A: Methodology The centerpiece of the Pew Research Center’s 2014 Religious Landscape Study is a nationally Key Features of the 2014 Religious representative telephone survey conducted Landscape Study National Telephone June 4-Sept. 30 among a sample of 35,071 U.S. Survey adults. Approximately 60% of the interviews 35,071 adults, including a minimum of Sample size 300 interviews in every state and the were conducted with respondents reached on District of Columbia cellphones (n=21,160) and 40% were completed Interview Dates June 4–Sept. 30, 2014 on landlines (n=13,911). A minimum of 300 interviews were conducted in every state and Mode Telephone, cellphones and landlines the District of Columbia. Interviewing was Languages English & Spanish conducted in English and Spanish. The survey Religious identity, religious upbringing, is estimated to cover 97% of the nonreligious intermarriage, religious beliefs Topics and practices, social and political institutionalized U.S. adult population; 3% of values, demographics U.S. adults are not reachable by telephone or do 2014 Religious Landscape Study, conducted June 4-Sept. 30, 2014 not speak English or Spanish well enough to PEW RESEARCH CENTER participate in the survey. No adjustments have been made to the survey’s estimates of the religious composition of the U.S. population to attempt to account for the small amount of noncoverage. Data collection was divided equally among three research firms – Abt SRBI, Princeton Survey Research Associates International (PSRAI) and Social Science Research Solutions (SSRS). Abt SRBI served as the lead research firm coordinating the data collection, providing the sampling plan and producing the survey weights. Both the landline and cellphone samples were provided by Marketing Systems Group (MSG). The size of the national sample is unusually large for a religion survey. There are two main reasons for this. First, the large sample size makes it possible to estimate the religious composition of the U.S. with a high degree of precision. After taking into account the survey’s design effect (based on the sample design and the survey weights), the margin of error for results based on the full sample is +/- 0.6 percentage points. Second, the large sample size makes it possible to describe the demographic characteristics of a wide variety of religious groups, including relatively small groups that cannot be analyzed using data from smaller surveys. With more than 35,000 respondents in total, the Religious Landscape Study includes interviews with roughly 350 people in religious groups that account for just 1% of www.pewresearch.org 89 PEW RESEARCH CENTER the U.S. population, and with 100 or more people in religious groups that are as small as threetenths of 1% of the overall population. For instance, the study includes interviews with 245 Jehovah’s Witnesses, a group that accounts for less than 1% of the U.S. population and is typically represented by only a few dozen respondents in smaller surveys. The national survey explored a number of topics. The current report summarizes the survey’s findings with respect to religious identity, religious upbringing, religious intermarriage and the demographic characteristics of religious groups. Subsequent reports will describe the survey’s findings about religious beliefs and practices, social and political values, and other topics. The national survey employed a dual-frame (cellphone and landline) random-digit dialing (RDD) approach to yield a nationally representative sample that included a minimum of 300 completed interviews in every state. This was accomplished by first allocating the total expected number of interviews (~35,000) to states in proportion to their respective share of the national adult population. At this stage, 16 states (including the District of Columbia) were identified in which the proportional allocation would result in fewer than 300 interviews. These 16 states were oversampled to obtain at least 300 interviews in each of them, while the remaining 35 states were undersampled proportionately. The weighting of the data (described below) ensures that all states are represented in their proper proportion in the national weighted estimates. The allocation of sample to the landline or cellphone RDD frame was customized for each state to reflect state-level variation in telephone usage. The amount of sample allocated to cellphone numbers ranged from a low of 35% in Rhode Island to a high of 84% in Mississippi. The landline sample was drawn from MSG’s 1+ assignment-assisted RDD sampling frame. The cellphone sample was also drawn by MSG, using their Cell-WINS activity flags. The Cell-WINS service appends activity code information to each sampled record, flagging it as active, inactive or “unknown.” In the initial cell sample, 59% of numbers were flagged as active, 40% were flagged as inactive and 1% were flagged as unknown. The cell sample was managed such that active and “unknown” numbers were oversampled while inactive numbers were undersampled. Oversampling cellphone numbers flagged as active or “unknown” helps to control survey costs by increasing the amount of interviewer time spend dialing eligible numbers. Retaining some numbers flagged as inactive ensures that the survey’s coverage rate was not affected. The weighting of the data corrects for the undersampling of flagged-inactive numbers so that they are represented in their proper proportion in the weighted estimates. www.pewresearch.org 90 PEW RESEARCH CENTER Sampled telephone numbers were called as many as seven times in an effort to obtain a completed interview. Numbers flagged as “callbacks” (i.e., numbers at which a respondent had begun the interview without completing the survey) were called back an additional two times during the final four weeks of the survey period. Refusal conversion was attempted in instances of soft refusals in both the landline and cellphone frames. Calls were staggered over times of day and days of the week to maximize the chance of making contact with potential respondents. Each number received at least one daytime call. In the landline sample, interviewers asked to speak with the youngest adult at home at the time of the call. In the cellphone sample, interviews were conducted with the person who answered the phone provided they were ages 18 or older. Respondents reached on cellphones were offered a reimbursement of $5 for their cellphone minutes used participating in the survey. In an effort to maximize the number of interviews with adults who primarily speak Spanish, the study utilized a special protocol in which sampled telephone numbers that service areas with sizable Hispanic populations were dialed by bilingual Spanish- and English-speaking interviewers. Two flags were created in each frame (landline and cellphone) to identify cases with a relatively high probability of requiring Spanish administration. In the landline RDD sample, the first flag identified telephone exchanges with an estimated Hispanic incidence of 65% or higher. In the cell frame, the first flag identified numbers that belonged to rate centers (i.e., billing centers) with an estimated Hispanic incidence of 70% or higher. These numbers were dialed exclusively by bilingual interviewers capable of conducting the interview in either English or Spanish. There was just one exception to this rule; respondents who completed part of the interview but did not finish the survey and who spoke English were eligible to be called back subsequently by interviewers who spoke only English. Each frame (landline and cellphone) also included a second Hispanic incidence flag. The second flag in the landline sample identified exchanges with an estimated Hispanic incidence of 60% to 64.99%. The second flag in the cell frame identified numbers associated with rate centers with an estimated Hispanic incidence of 65% to 69.99%. In the event that the research firms that conducted the interviewing had bilingual interviewing capacity over and above that needed to dial numbers associated with the first flag, bilingual interviewers were then assigned to numbers identified with the second flag. Ultimately, 3.8% of all interviews were conducted in Spanish, including 4.6% in the cellphone sample and 2.5% in the landline frame. www.pewresearch.org 91 PEW RESEARCH CENTER National- and State-Level Weighting The national- and state-level results included in this report are based on weighted estimates. The weighting was conducted in two stages. The first stage in the weighting produced base weights that account for several factors, including: 1) the probability of selection of the telephone number, computed separately for each of 102 sampling strata defined by the cross-classification of sample frame (landline and cellphone) and state (including the District of Columbia); 2) the oversampling of “active” numbers in the cell frame; 3) the within-household selection of one respondent per household in the landline frame; and 4) the overlap between the cell and landline frames. The second stage of the weighting calibrated the base-weighted data to demographic benchmarks for the population covered by the survey. This was performed via iterative proportional fitting (or “raking”). The raking procedure aligned survey respondents to population benchmarks on the following dimensions within each state: Gender by age Gender by education level Education level by age Race/ethnicity Telephone service Region of state (except for the District of Columbia) Most of the demographic weighting parameters came from the Census Bureau’s 2012 American Community Survey (ACS) one-year estimates, which was the most current data source available at the time the data were weighted. The ACS parameters were calculated for adults ages 18 and older residing in households in each state, excluding those living in institutionalized group quarters. The telephone service parameter for each state was constructed from model-based estimates released by the National Center for Health Statistics (NCHS) National Health Interview Survey (NHIS) for the year 2012. Since the cellphone-only adult population has increased every year since 2012, these state-level estimates were updated using 2013 NCHS data to reflect regional trends. The region parameter was specific to each state and was computed based on the 2012 ACS five-year estimates for adults living in each county in the U.S. The distribution of the raked weights was examined separately for each state, and customized trimming was performed at the state level to prevent individual interviews from having too much influence on the final results and to reduce the variance of the weights at the state level. Finally, the weights for each state were scaled to correct for the oversampling of smaller states and the www.pewresearch.org 92 PEW RESEARCH CENTER corresponding undersampling of larger states. This ensures that all states are represented in their proper proportion in the weighted estimates included in this report. Metropolitan Area Weighting In addition to providing estimates for the nation as a whole and for all 50 states and the District of Columbia, the national survey obtained interviews from more than 300 respondents in the nation’s 17 largest Metropolitan Statistical Areas (MSAs). These include Atlanta, Boston, Chicago, Dallas, Detroit, Houston, Los Angeles, Miami, Minneapolis, New York City, Philadelphia, Phoenix, Riverside (Calif.), San Diego, San Francisco, Seattle and the Washington, D.C., metro area (including the District of Columbia as well as parts of Maryland, Virginia and West Virginia). Some MSAs span multiple states, which necessitated weighting each MSA separately. Like the national- and state-level weights, each MSA weight was calculated in two stages, beginning with the same first-stage (base) weight as in the national- and state-level weights. In the second stage, the base weight was adjusted for each MSA via raking to align survey respondents to population benchmarks on the following dimensions within each MSA: Gender by age Gender by education level Education level by age Race/ethnicity Telephone service The demographic weighting parameters came from an analysis of the Census Bureau’s 2012 ACS five-year estimates, which was the most current data source available at the time the survey data were weighted. The ACS parameters were calculated for adults ages 18 and older residing in households in each MSA, excluding those living in institutionalized group quarters. The telephone service parameter was constructed from sub-state-level estimates released by the NCHS for the year 2012. Since the cellphone-only adult population has increased every year since 2012, these sub-state-level estimates were updated using 2013 NCHS data to reflect national trends. www.pewresearch.org 93 PEW RESEARCH CENTER Weighting and survey design features that depart from simple random sampling (e.g., the oversampling of less populous states) tend to result in a loss of precision in survey estimates. This loss of precision, known as the design effect, is incorporated Sample Sizes and Margins of Error for Religious in all margins of error, Traditions Sample standard errors and tests of size Margin of error statistical significance Full sample 35,071 +/- 0.6 percentage points included in this report. Christian Generally speaking, larger sample sizes are associated with smaller margins of sampling error, and smaller sample sizes are associated with larger margins of error. The margin of error for national estimates from this survey is +/- 0.6 percentage points. The margins of error for subgroups are larger. The accompanying tables present sample sizes and corresponding margins of error for the religious traditions discussed throughout much of this report, as well as for each state and the MSAs analyzed here and online. Sample sizes and margins of error for other groups are available upon request. In addition to sampling error, one should bear in mind that question wording and 25,048 +/- 0.8 percentage points Protestant 16,592 +/- 0.9 percentage points Evangelical 8,593 +/- 1.3 percentage points Mainline 6,083 +/- 1.6 percentage points Historically black 1,916 +/- 2.7 percentage points Catholic 7,202 +/- 1.4 percentage points Orthodox Christian 186 +/- 9.2 percentage points Mormon 664 +/- 4.9 percentage points Jehovah's Witness 245 +/- 7.2 percentage points Other Christian 159 +/- 9.8 percentage points Non-Christian faiths 2,244 +/- 2.6 percentage points Jewish 847 +/- 4.2 percentage points Muslim 237 +/- 7.7 percentage points Buddhist 264 +/- 7.7 percentage points Hindu 199 +/- 8.7 percentage points Other world religions 92 Other faiths 605 +/- 5.0 percentage points Religiously unaffiliated Not reported on 7,556 +/- 1.4 percentage points Atheist 1,098 +/- 3.7 percentage points Agnostic 1,474 +/- 3.1 percentage points Nothing in particular 4,984 +/- 1.7 percentage points Religion not important1 Religion important1 2,969 +/- 2.2 percentage points 2,015 +/- 2.6 percentage points 2014 Religious Landscape Study, conducted June 4-Sept. 30, 2014 1Those who describe their religion as “nothing in particular” are subdivided into two groups. The “religion not important” group includes those who say (in Q.F2) religion is “not too” or “not at all” important in their lives as well as those who decline to answer the question about religion’s importance. The “religion important” category includes those who say religion is “very” or “somewhat” important in their lives. PEW RESEARCH CENTER www.pewresearch.org 94 PEW RESEARCH CENTER practical difficulties in conducting surveys can introduce error or bias into the findings of opinion polls. For example, in surveys like this one that are conducted in English and Spanish, estimates for religious groups with large numbers of people who speak other languages (e.g., Buddhists, Muslims and others) may be biased toward the English- and Spanish-speaking subsets of these populations. www.pewresearch.org 95 PEW RESEARCH CENTER Sample Size and Margin of Error for Each State and Metropolitan Area Sample size 511 Margin of error +/- 5.4 percentage points Ohio Alaska 310 +/- 6.9 percentage points Arizona 653 +/- 4.7 percentage points Arkansas 311 +/- 6.6 percentage points California 3,697 +/- 2.0 percentage points Colorado 504 Connecticut Delaware State Alabama District of Columbia Sample size 1,132 Margin of error +/- 3.4 percentage points Oklahoma 391 +/- 5.9 percentage points Oregon 419 +/- 5.8 percentage points Pennsylvania 1,366 +/- 3.1 percentage points Rhode Island 305 +/- 8.5 percentage points +/- 5.2 percentage points South Carolina 495 +/- 5.1 percentage points 377 +/- 6.1 percentage points South Dakota 305 +/- 7.1 percentage points 301 +/- 7.3 percentage points Tennessee 661 +/- 4.8 percentage points State 303 +/- 7.2 percentage points Texas 2,535 +/- 2.2 percentage points Florida 2,020 +/- 2.5 percentage points Utah 315 +/- 7.1 percentage points Georgia 968 +/- 3.6 percentage points Vermont 306 +/- 6.8 percentage points Hawaii 312 +/- 7.4 percentage points Virginia 882 +/- 4.1 percentage points Idaho 320 +/- 6.6 percentage points Washington 714 +/- 4.3 percentage points Illinois 1,326 +/- 3.1 percentage points West Virginia 309 +/- 6.7 percentage points Indiana 654 +/- 4.6 percentage points Wisconsin 600 +/- 4.7 percentage points Iowa 330 +/- 6.4 percentage points Wyoming 316 +/- 6.9 percentage points Kansas 307 +/- 6.7 percentage points Kentucky 439 +/- 5.7 percentage points Louisiana 465 +/- 5.3 percentage points Metropolitan area Atlanta Sample size 510 Margin of error +/- 5.1 percentage points Maine 303 +/- 7.0 percentage points Boston 498 +/- 6.1 percentage points Maryland 644 +/- 4.9 percentage points Chicago 867 +/- 4.1 percentage points Massachusetts 704 +/- 4.5 percentage points Dallas 659 +/- 4.6 percentage points Michigan 982 +/- 3.6 percentage points Detroit 374 +/- 6.3 percentage points Minnesota 563 +/- 4.9 percentage points Houston Mississippi 309 +/- 6.3 percentage points Los Angeles Missouri 642 +/- 4.4 percentage points Montana 312 +/- 6.9 percentage points Nebraska 312 Nevada New Hampshire 514 +/- 5.3 percentage points 1,076 +/- 3.7 percentage points Miami 483 +/- 5.6 percentage points Minneapolis 342 +/- 6.6 percentage points +/- 6.5 percentage points New York City 1,786 +/- 3.1 percentage points 314 +/- 6.7 percentage points Philadelphia 722 +/- 5.0 percentage points 303 +/- 7.1 percentage points Phoenix 397 +/- 6.5 percentage points New Jersey 886 +/- 4.0 percentage points Riverside, Calif. 373 +/- 6.3 percentage points New Mexico 312 +/- 7.2 percentage points San Diego 321 +/- 7.4 percentage points New York 1,966 +/- 2.6 percentage points San Francisco 485 +/- 5.8 percentage points North Carolina 1,022 +/- 3.7 percentage points Seattle 333 +/- 6.8 percentage points North Dakota 338 +/- 6.6 percentage points Washington, D.C. 913 +/- 4.5 percentage points 2014 Religious Landscape Study, conducted June 4-Sept. 30, 2014 PEW RESEARCH CENTER www.pewresearch.org 96 PEW RESEARCH CENTER In addition to reporting on the characteristics of religious traditions and the religious composition of states and localities, this report and the accompanying interactive tool provide details on many other groups (e.g., men and women, immigrants and those born in the U.S., adherents of specific denominations such as the United Methodist Church and the Church of the Nazarene, etc.). Sample sizes for these groups vary widely; the survey includes interviews with 17,514 men and 17,557 women, but just 101 respondents who identify with the Church of the Nazarene. As an aid to help readers interpret the study’s findings, the accompanying table provides approximate margins of error for groups of varying sizes. The margin of error for results based on men (n=17,514), for example, is +/- 0.9 percentage points. By contrast, the margin of error for results based on those who identify with the Church of the Nazarene (n=101) is much larger (+/- 12 percentage points). Readers should always bear in mind the approximate margin of error for the group they are examining when making comparisons with other groups or assessing the significance of trends over time. 2014 Religious Landscape Study: Approximate Margins of Error by Sample Size For a group with a sample size of… 100 The approximate margin of error is… +/- 12 percentage points 200 +/- 8.5 percentage points 300 +/- 7 percentage points 400 +/- 6 percentage points 500 +/- 5.5 percentage points 750 +/- 4.5 percentage points 1,000 +/- 4 percentage points 1,250 +/- 3.5 percentage points 1,500 +/- 3 percentage points 2,500 +/- 2.5 percentage points 5,000 +/- 1.5 percentage points 15,000 +/- 1 percentage point 35,071 (full sample) +/- 0.6 percentage points This table provides a rough sense of the margin of sampling error for subgroups of survey respondents. Generally speaking, larger sample sizes are associated with smaller margins of error and smaller sample sizes are associated with larger margins of error. Readers should bear the margin of error in mind when making comparisons between groups, across states and over time. The approximated margins of error reported here take into account the survey's design effect (i.e., the loss of precision in a survey’s estimates resulting from weighting and survey design features that depart from simple random sampling). Margins of error are rounded to the nearest .5 (except for the full sample). PEW RESEARCH CENTER www.pewresearch.org 97 PEW RESEARCH CENTER The table below reports the disposition of all sampled telephone numbers dialed for the survey. Overall, the response rate (AAPOR3) was 11.1% for the landline sample and 10.2% for the cell sample. Final Dispositions and Rates, by Sample Interview (Category 1) Complete 1.000 Landline Sample 13,911 Cell Sample 21,161 Eligible, non-interview (Category 2) Refusal and breakoff Refusal Soft refusal - callback Specified appointment - callback Unspecified appointment - callback Spanish interviewer needed - callback Respondent never available Telephone answering device (confirming HH) Physically or mentally unable/incompetent Household-level language problem 2.100 2.110 2.130 2.140 2.150 2.160 2.210 2.220 2.320 2.331 0 14,954 29,504 840 11,721 1,104 93 39,017 1,294 1,209 2,943 0 0 0 7,763 0 0 0 0 0 Unknown eligibility, non-interview (Category 3) Always busy No answer Call blocking No screener completed: Live contact, away for duration No screener completed: Live contact, health/hearing problem No screener completed: Live contact, language problem non-Spanish No screener completed: Live contact, specified appointment - callback No screener completed: Live contact, unspecified appointment - callback No screener completed: Live contact, Spanish interviewer needed - callback No screener completed: Live contact, soft refusal - callback No screener completed: Live contact, refusal No screener completed: No live contact Other: "cellphone" disposition used in error 3.120 3.130 3.150 3.21a 3.21b 3.21c 3.22a 3.22b 3.22c 3.22d 3.230 3.240 3.910 10,111 40,539 228 0 0 0 0 0 0 0 0 0 0 4,613 7,921 0 717 1,001 2,011 2,695 24,354 3,739 54,178 37,263 99,524 142 4.200 4.300 4.420 4.510 4.700 19,451 338,594 160 38,920 102 561,752 13,911 0 57,112 39,017 3,607 50,878 1,539 84,024 0 10,852 10,661 377,101 21,161 0 10,706 0 0 12,534 0 0 397,125 102 561,752 22.3% 99.9% 11.1% 59.7% 18.6% 125,958 99,666 96,415 10,661 377,101 73.6% 74.9% 10.2% 60.7% 16.8% Not eligible (Category 4) Fax/data line Non-working/disconnect Cell phone Business, government, other organization No eligible respondent: Child/teen phone Total phone numbers used Completes (1.0) Partial Interviews (1.2) Eligible non-interview: Refusal (2.1) Eligible non-interview: Non-contact (2.2) Eligible non-interview: Other (2.3) Undetermined if working and residential (3.1) Working and residential but undetermined eligibility (3.2,3.9) Live contact was made Live contact not made Not eligible: Nonworking, nonresidential or ported (4.1-4.5,4.9) Screen out: Working and residential but not eligible (4.7) TOTAL e1=(I+P+R+NC+O+UOC+OUNC+SO)/(I+P+R+NC+O+UOC+OUNC+SO+NWC) e2=(I+P+R)/(I+P+R+SO) AAPOR RR3 = I / (I+P+R+NC+O+[e1*e2*UH]+[e2*(UOC +UONC)]) AAPOR CON2 = (I+P+R+O+[e2*UOC]) / (I+P+R+NC+O+[e1*e2*UH]+[e2*(UOC+UONC)]) AAPOR COOP1 = I / (I+P+R+O+[e2*UOC]) www.pewresearch.org I P R NC O UH UOC UONC NWC SO 98 PEW RESEARCH CENTER One key goal of the 2014 Religious Landscape Study is to make comparisons between the current study and the original Landscape Study conducted in 2007. As such, the 2014 study repeated many of the questions and retained many of the methodological features of the 2007 study. There are, however, a few differences between the two studies worth noting. First, though the two studies employed the same questions to categorize respondents into religious traditions, there are a few small religious groups that are categorized differently in 2014 than in 2007. For example: Jains were counted as Hindus in 2007 but are included in the “other world religions” tradition in 2014. Jains account for less than one-tenth of 1% of 2014 respondents. Those identifying with the Self Realization Fellowship were included in the “other world religions” tradition in 2007 but are counted as Hindus in 2014. They account for less than onetenth of 1% of 2014 respondents. Those identifying with the New Thought movement were included in the New Age family in the “other faiths” tradition in 2007. In 2014, they are included in the Metaphysical family in the “other Christian” tradition. They account for less than one-tenth of 1% of 2014 respondents. These small changes have no substantive impact on the interpretation of trends between the 2007 and 2014 survey. Second, the 2014 study was conducted in all 50 states and the District of Columbia. Though the 2007 study included follow-up surveys in Alaska and Hawaii, the national estimates from the 2007 survey are based on interviews conducted in the 48 continental states and the District of Columbia. Analysis of the data shows that this change has no substantive impact on the interpretation of trends between the 2007 and 2014 survey. Third, the 2007 survey was conducted only on landlines, whereas the 2014 study was conducted on landlines and cellphones. In 2007, roughly 14% of U.S. adults were cellphone-only (i.e., reachable on a cellphone but not by a landline telephone), and landline-only surveys were still a viable means by which to survey a nationally representative sample of the population. By 2014, it was no longer possible to conduct nationally representative surveys using only landlines, as the cellphone-only share of the population had grown to 43%.24 The source for the cellphone-only estimates is the National Health Interview Survey (NHIS) conducted by the National Center for Health Statistics (NCHS). 24 www.pewresearch.org 99 PEW RESEARCH CENTER Though the 2007 survey was conducted only on landlines, it also included an experimental component in which 500 cellphone-only respondents were interviewed, facilitating a comparison of the 2007 estimates both with and without cellphones included. That analysis showed that estimates of the religious composition of the U.S. were the same when cellphones were included and when they were not. As a result, this change in methodology is not expected to have a meaningful impact on the interpretation of trends between the 2007 and 2014 survey. Furthermore, Pew Research Center political polls have been conducted on landlines and cellphones since 2008. Those polls typically include one question about religious identity, and they show a similar pattern in recent years to that observed in the Religious Landscape Study, with more Americans identifying as religious “nones” and fewer identifying as Protestants and Catholics. See Appendix C for more details. Fourth, the 2014 Religious Landscape Study was intended to document the religious composition of each of the 50 states in addition to the nation as a whole. To accomplish this, the sampling plan was designed to achieve a minimum of 300 interviews in every state, and the data for each state were weighted to demographic benchmarks derived from the U.S. Census Bureau and other government sources. The state in which respondents reside is determined by their self-reported ZIP code. By contrast, the 2007 study was not designed to yield a minimum number of interviews in every state and the 2007 data were not weighted to state-level demographic benchmarks. And in the 2007 study (which was conducted only on landlines), the state in which respondents reside was determined by their telephone number. Despite these differences, analysis of the 2007 statelevel data indicates that the 2014 state-level results can safely be compared to the 2007 study.25 Information on the religious composition of each state (and major metropolitan areas) is available in the detailed tables in Appendix D and online through a new interactive tool. The online presentation of the religious composition of states does not include trends from 2007 to 2014 for Delaware, the District of Columbia, North Dakota, Rhode Island, South Dakota, Wyoming or Vermont. This is because fewer than 140 respondents were interviewed in each of these places in 2007. 25 www.pewresearch.org 100 PEW RESEARCH CENTER Appendix B: Classification of Protestant Denominations This section documents the composition of the three major Protestant traditions (evangelical Protestantism, mainline Protestantism and historically black Protestantism) as they have been defined in this report.26 Protestants were grouped into religious traditions based on the specific denomination with which they identify. For instance, all members of the Southern Baptist Convention have been classified as members of the evangelical Protestant tradition, those who belong to the American Baptist Churches USA are classified as members of the mainline Protestant tradition and those who belong to the National Baptist Convention are classified as members of the historically black Protestant tradition. Protestant respondents who gave a vague answer to denominational questions (e.g., “I am just a Baptist” or “I know I am Methodist but don’t know which specific Methodist denomination I belong to”) were placed into one of the three Protestant traditions based on their race and/or their response to a question that asked if they would describe themselves as a “born-again or evangelical Christian.” This means that some groups may appear within more than one tradition. For example, independent Baptists appear in both the evangelical Protestant tradition and the historically black Protestant tradition, and a respondent’s placement into one or the other depends on the race of the respondent. These cases are noted in the detailed summary at the end of this appendix. Overall, 38% of Protestants (including 36% of evangelical Protestants, 35% of mainline Protestants and 53% of those in the historically black Protestant tradition) gave a vague denominational identity, necessitating the use of their race or their born-again status (or sometimes both) to categorize them into one of the three major Protestant traditions. The table below estimates the size of the largest Protestant denominations and identifies the Protestant tradition to which each belongs. Note that many denominational families include denominations that are associated with more than one Protestant tradition. For example, Baptists are found within all three Protestant traditions, Pentecostals belong to either the evangelical or historically black Protestant tradition and Lutherans belong to either the evangelical or mainline tradition. The same approach to categorizing a respondent's current religious tradition was used to define the traditions in which respondents were raised (see Q.J1-Q.J3v and CHBORN) and the tradition with which the respondent's spouse or partner identifies (see Q.K1-Q.K3v, SPBORN, SPHISP and SPRACE). 26 www.pewresearch.org 101 PEW RESEARCH CENTER Large Denominations and Protestant Religious Traditions Among total population Baptist Among all Protestants Among evangelical tradition Among mainline tradition Among historically black Prot. tradition 2007 % 2014 % 2007 % 2014 % 2007 % 2014 % 2007 % 2014 % 2007 % 2014 % 17.2 15.4 33 33 41 36 10 14 64 63 Southern Baptist Convention 6.7 5.3 13 11 26 21 0 0 0 0 Independent Baptist in evang. trad. 2.5 2.5 5 5 10 10 0 0 0 0 American Baptist Churches USA 1.2 1.5 2 3 0 0 7 10 0 0 National Baptist Convention 1.8 1.4 3 3 0 0 0 0 26 22 Progressive Baptist Convention 0.3 0.3 * 1 0 0 0 0 4 4 Missionary Baptist in hist. black trad. <0.3 0.3 * 1 0 0 0 0 2 5 Independent Baptist in hist. black trad. 0.5 <0.3 1 1 0 0 0 0 7 4 Other Baptist (incl. "just Baptist") 4.1 3.8 8 8 6 6 4 4 26 27 4.5 6.2 9 13 13 19 5 7 3 5 Nondenominational evangelical 1.2 2.0 2 4 4 8 0 0 0 0 Nondenominational charismatic 0.5 0.6 1 1 2 2 0 0 0 0 Interdenominational in evangelical trad. 0.5 0.6 1 1 2 2 0 0 0 0 Nondenominational fundamentalist 0.3 0.3 1 1 1 1 0 0 0 0 Interdenominational in mainline trad. 0.3 0.3 1 1 0 0 1 2 0 0 Other nondenominational 1.8 2.5 4 5 4 6 3 5 3 5 6.2 4.6 12 10 1 1 30 27 9 8 United Methodist Church 5.1 3.6 10 8 0 0 28 25 0 0 African Methodist Episcopal 0.4 0.3 1 1 0 0 0 0 6 5 Other Methodist (incl. "just Methodist") 0.8 0.7 1 1 1 1 2 2 3 3 Nondenominational Methodist Pentecostal 4.4 4.6 9 10 13 14 0 0 14 16 Assemblies of God 1.4 1.4 3 3 5 5 0 0 0 0 Church of God in Christ 0.6 0.6 1 1 0 0 0 0 8 9 Church of God (Cleveland, Tenn.) 0.4 0.4 1 1 1 1 0 0 0 0 Other Pentecostal 2.0 2.3 4 5 6 7 0 0 5 7 Lutheran 4.6 3.5 9 8 7 6 16 14 0 0 Evangelical Lutheran Church in America 2.0 1.4 4 3 0 0 11 9 0 0 Lutheran Church-Missouri Synod 1.4 1.1 3 2 5 4 0 0 0 0 Other Lutheran (incl. "just Lutheran") 1.3 1.1 2 2 2 2 5 5 0 0 TABLE CONTINUES ON NEXT PAGE… 2014 Religious Landscape Study, conducted June 4-Sept. 30, 2014. Figures may not add to 100% and nested figures may not add to subtotals indicated due to rounding. PEW RESEARCH CENTER www.pewresearch.org 102 PEW RESEARCH CENTER Large Denominations and Protestant Religious Traditions (continued…) Among total population Among all Protestants Among evangelical tradition Among mainline tradition Among historically black Prot. tradition 2007 % 2014 % 2007 % 2014 % 2007 % 2014 % 2007 % 2014 % 2007 % 2014 % 2.7 2.2 5 5 3 3 10 9 0 0 Presbyterian Church (U.S.A.) 1.1 0.9 2 2 0 0 6 6 0 0 Presbyterian Church in America 0.4 0.4 1 1 2 2 0 0 0 0 Other Presbyterian 1.1 0.9 2 2 1 1 4 4 0 0 2.1 1.9 4 4 6 6 2 2 0 0 1.5 1.5 3 3 6 6 0 0 0 0 Disciples of Christ 0.3 <0.3 1 * 0 0 2 1 0 0 Other Restorationist <0.3 <0.3 * * 1 1 * * 0 0 Episcopalian/Anglican 1.5 1.3 3 3 * * 8 8 0 0 Presbyterian Restorationist Church of Christ Episcopal Church 1.0 0.9 2 2 0 0 6 6 0 0 Anglican 0.3 <0.3 1 1 0 0 2 2 0 0 Other Episcopalian/Anglican <0.3 <0.3 * * * * 1 1 0 0 1.2 0.8 2 2 4 3 0 0 2 1 Church of the Nazarene 0.3 0.3 1 1 1 1 0 0 0 0 Free Methodist 0.3 <0.3 1 * 1 1 0 0 0 0 Other Holiness 0.6 0.4 1 1 2 1 0 0 2 1 Congregationalist Holiness 0.8 0.6 1 1 * * 4 4 0 0 United Church of Christ 0.5 0.4 1 1 0 0 3 3 0 0 Other Congregationalist <0.3 <0.3 * * * * 1 1 0 0 Adventist 0.5 0.6 1 1 2 2 0 0 0 0 Seventh-day Adventist 0.4 0.5 1 1 2 2 0 0 0 0 Other Adventist <0.3 <0.3 * * * * 0 0 0 0 Anabaptist <0.3 0.3 * 1 1 1 * * 0 0 Reformed 0.3 <0.3 1 * 1 1 1 1 0 0 Pietist <0.3 <0.3 * * * * 0 0 0 0 Friends <0.3 <0.3 * * 0 0 1 1 0 0 Other evangelical/fundamentalist 0.3 0.3 1 1 1 1 0 0 0 0 Protestant non-specific 4.9 3.8 9 8 7 6 14 13 8 6 100 100 100 100 100 100 100 100 =51.3 =46.5 2014 Religious Landscape Study, conducted June 4-Sept. 30, 2014. Figures may not add to 100% and nested figures may not add to subtotals indicated due to rounding. PEW RESEARCH CENTER www.pewresearch.org 103 PEW RESEARCH CENTER The denominations listed below represent answers given by survey respondents. Some denominations were offered to respondents as explicit answer categories during the interview, while others were volunteered by respondents. Respondents who gave vague denominational affiliations were assigned to a religious tradition based on their race and/or their response to a question that asked whether they would describe themselves as a “born-again or evangelical Christian,” as noted in italics. Evangelical Protestant Tradition Baptist in the evangelical tradition Southern Baptist Convention Independent Baptist (if non-black) Baptist Missionary Association (if non-black) Baptist General Conference/Swedish Baptist Conservative Baptist Association of America Free Will Baptist General Association of Regular Baptists American Baptist Association Baptist Bible Church, including Baptist Bible Fellowship (if non-black) Primitive Baptist (if non-black) Reformed Baptist (Calvinist) Fundamentalist Baptist (if non-black) Seventh Day Baptist Baptist General Convention of Texas North American Baptist Full Gospel Baptist Association (if non-black) Evangelical Baptist (if non-black) United Baptist Church Evangelical Free Baptist Cowboy Church Baptist Pentecostal Baptist (if non-black) Traditional Baptist (if non-black) Ethnic Baptist (if non-black and born again) Baptist, not further specified (if non-black and born again) Baptist, ambiguous affiliation (if non-black and born again) Methodist in the evangelical tradition Congregational Methodist Evangelical Methodist Independent Methodist (if non-black) Churches of Christ in Christian Union www.pewresearch.org 104 PEW RESEARCH CENTER Southern Methodist Church Other ethnic Methodist (if non-black and born again) Methodist, ambiguous affiliation (if non-black and born again) Methodist, not further specified (if non-black and born again) Nondenominational in the evangelical tradition Nondenominational evangelical Nondenominational fundamentalist Nondenominational charismatic Interdenominational (if born again) Community church (if born again) Nondenominational Protestant Nondenominational Christian Federated or union church (if born again) Association of Bridge Churches Ethnic nondenominational (if non-black and born again) Electronic ministries Nondenominational, ambiguous affiliation (if non-black and born again) Nondenominational, not further specified (if non-black and born again) Lutheran in the evangelical tradition Lutheran Church-Missouri Synod Lutheran Church-Wisconsin Synod Lutheran Brethren Church of the Lutheran Confession Free Lutheran Apostolic Lutheran Church in America Lutheran Congregations in Mission for Christ North American Lutheran Church Lutheran Church of the Reformation Conservative Lutheran Ethnic Lutheran (if born again) Lutheran, ambiguous affiliation (if born again) Lutheran, not further specified (if born again) Presbyterian in the evangelical tradition Presbyterian Church in America Associate Reformed Presbyterian Cumberland Presbyterian Church Orthodox Presbyterian Evangelical Presbyterian Reformed Presbyterian Congregational Presbyterian Bible Presbyterian Church Conservative Presbyterian Church Independent Presbyterian www.pewresearch.org 105 PEW RESEARCH CENTER Covenant Presbyterian Church ECO: A Covenant Order of Evangelical Presbyterians Charismatic Presbyterian Ethnic Presbyterian (if born again) Presbyterian, ambiguous affiliation (if born again) Presbyterian, not further specified (if born again) Pentecostal in the evangelical tradition Assemblies of God Church of God (Cleveland, Tenn.) Four Square Gospel (Four Square) Pentecostal Church of God Pentecostal Holiness Church Church of God of the Apostolic Faith Assembly of Christian Churches Church of God of Prophecy Vineyard Fellowship Open Bible Standard Churches Full Gospel (if non-black) Calvary Chapel Apostolic Pentecostal (if non-black) Nondenominational, independent Pentecostal (if non-black) Missionary Church Elim Fellowship International Pentecostal Church of Christ Evangelical Pentecostal Church of God of Kentucky Charismatic (if non-black) Home church (if non-black) International Communion of the Charismatic Episcopal Church Other ethnic Pentecostal (if non-black) Electronic ministries (if non-black) Pentecostal, ambiguous affiliation (if non-black) Pentecostal, not further specified (if non-black) Anglican/Episcopalian in the evangelical tradition Anglican Orthodox Church Evangelical Anglican/Episcopalian Anglican/Episcopalian, ambiguous affiliation (if born again) Anglican/Episcopalian, not further specified (if born again) Restorationist in the evangelical tradition Church of Christ Christian Churches and Churches of Christ Restorationist, ambiguous affiliation (if born again) Restorationist, not further specified (if born again) www.pewresearch.org 106 PEW RESEARCH CENTER Congregational in the evangelical tradition Conservative Congregational Christian National Association of Congregational Christian Churches Evangelical Congregational Independent Congregational Church Ethnic Congregationalist (if born again) Congregationalist, ambiguous affiliation (if born again) Congregationalist, not further specified (if born again) Holiness in the evangelical tradition Church of the Nazarene Wesleyan Church Free Methodist Church Christian and Missionary Alliance Church of God (Anderson, Ind.) Salvation Army Wesleyan Methodist Church Pilgrim Holiness Church Free Holiness Holiness, ambiguous affiliation (if non-black) Holiness, not further specified (if non-black) Reformed in the evangelical tradition Christian Reformed Church Sovereign Grace Evangelical Reformed Independent Reformed Reformed Church in the United States (German Reformed) Calvinist Protestant Reformed Church Reformed, ambiguous affiliation (if born again) Reformed, not further specified (if born again) Adventist in the evangelical tradition Seventh-day Adventist Advent Christian Worldwide Church of God/Grace Communion International Church of God General Conference Church of God (Seventh-day) United Church of God Living Church of God www.pewresearch.org 107 PEW RESEARCH CENTER Anabaptist in the evangelical tradition Grace Brethren Church Brethren in Christ Mennonite Brethren Amish United Brethren in Christ, United Brethren Social Brethren Brethren, not further specified (if born again) Mennonite, not further specified Anabaptist, not further specified (if born again) Pietist in the evangelical tradition Evangelical Covenant Church (covenant) Evangelical Free Church (free church) Other evangelical/fundamentalist “Evangelical” “Born again,” “Bible believers,” etc. Evangelical Bible Church Plymouth Brethren Bible, Gospel, Missionary Churches Fundamentalist, not further specified “Charismatic,” “spirit filled” Electronic ministries Protestant non-specific in the evangelical tradition Home church (if non-black and born again) Mixed Protestants (if non-black and born again) Other Protestant non-specific (if non-black and born again) Mainline Protestant Tradition Baptist in the mainline tradition American Baptist Churches USA Cooperative Baptist Fellowship; Baptist Alliance Liberal/progressive/moderate Baptist Ethnic Baptist (if non-black and not born again) Baptist, not further specified (if non-black and not born again) Baptist, ambiguous affiliation (if non-black and not born again) Methodist in the mainline tradition United Methodist Church Evangelical United Brethren www.pewresearch.org 108 PEW RESEARCH CENTER Methodist Episcopal Church Methodist Protestant Church Other ethnic Methodist (if non-black and not born again) Methodist, ambiguous affiliation (if non-black and not born again) Methodist, not further specified (if non-black and not born again) Nondenominational in the mainline tradition Interdenominational (if not born again) Community Church (if not born again) Federated or union church (if not born again) Emergent Church Liberal/moderate nondenominational Ethnic nondenominational (if non-black and not born again) Nondenominational, ambiguous affiliation (if non-black and not born again) Nondenominational, not further specified (if non-black and not born again) Lutheran in the mainline tradition Evangelical Lutheran Church in America American Lutheran Church/Lutheran Church in America Ethnic Lutheran (if not born again) Lutheran, ambiguous affiliation (if not born again) Lutheran, not further specified (if not born again) Presbyterian in the mainline tradition Presbyterian Church (U.S.A.) Scotch Presbyterian United Presbyterian Presbyterian Church of Canada Southern Presbyterian; Presbyterian Church in the United States Ethnic Presbyterian (if not born again) Presbyterian, ambiguous affiliation (if not born again) Presbyterian, not further specified (if not born again) Anglican/Episcopalian in the mainline tradition Episcopal Church Anglican Church (Church of England) Church of Ireland Anglican/Episcopalian, ambiguous affiliation (if not born again) Anglican/Episcopalian, not further specified (if not born again) Restorationist in the mainline tradition Disciples of Christ Restorationist, ambiguous affiliation (if not born again) Restorationist, not further specified (if not born again) www.pewresearch.org 109 PEW RESEARCH CENTER Congregational in the mainline tradition United Church of Christ Liberal/progressive Congregational Ethnic Congregationalist (if not born again) Congregationalist, ambiguous affiliation (if not born again) Congregationalist, not further specified (if not born again) Reformed in the mainline tradition Reformed Church in America (Dutch Reformed) Free Hungarian Reformed Church Reformed, ambiguous affiliation (if not born again) Reformed, not further specified (if not born again) Anabaptist in the mainline tradition Church of the Brethren Moravian Church Brethren, not further specified (if not born again) Anabaptist, not further specified (if not born again) Friends in the mainline tradition Society of Friends Friends/Quaker not further specified Other/Protestant non-specific in the mainline tradition Home church (if non-black and not born again) Mixed Protestants (if non-black and not born again) “Ecumenical” United Church of Canada Metropolitan Community Church Other Protestant non-specific (if non-black and not born again) Historically Black Protestant Tradition Baptist in the historically black Protestant tradition National Baptist Convention Progressive Baptist Convention International Baptist Independent Baptist (if black) Missionary Baptist (if black) Baptist Bible Fellowship (if black) Primitive Baptist (if black) Full Gospel Baptist (if black) Evangelical Baptist (if black) www.pewresearch.org 110 PEW RESEARCH CENTER Pentecostal Baptist (if black) Traditional Baptist (if black) Black Baptist Other ethnic Baptist (if black) Electronic Baptist ministries (if black) Baptist, not further specified (if black) Baptist, ambiguous affiliation (if black) Methodist in the historically black Protestant tradition African Methodist Episcopal African Methodist Episcopal Zion Christian Methodist Episcopal Church Independent Methodist (if black) Black Methodist Methodist, ambiguous affiliation (if black) Methodist, not further specified (if black) Nondenominational in the historically black Protestant tradition Black nondenominational Other ethnic nondenominational (if black) Nondenominational, ambiguous affiliation (if black) Nondenominational, not further specified (if black) Pentecostal in the historically black Protestant tradition Church of God in Christ United Pentecostal Church International United House of Prayer for All People Black Pentecostal Apostolic Pentecostal (if black) New Testament Church of God Nondenominational, independent Pentecostal (if black) Full Gospel (if black) Deeper Life Bible Church/Deeper Christian Life Ministry Other ethnic Pentecostal (if black) Electronic ministries (if black) Pentecostal, ambiguous affiliation (if black) Pentecostal, not further specified (if black) Holiness in the historically black Protestant tradition Independent Holiness Apostolic Holiness Church Holiness Baptist Fire Baptized Holiness Church of God Church of the Living God Black Holiness www.pewresearch.org 111 PEW RESEARCH CENTER Holiness, ambiguous affiliation (if black) Holiness, not further specified (if black) Protestant non-specific in the historically black Protestant tradition Home church (if black) Mixed Protestants (if black) Other Protestant non-specific (if black) www.pewresearch.org 112 PEW RESEARCH CENTER Appendix C: Putting Findings From the Religious Landscape Study Into Context The 2014 Religious Landscape Study has several unique strengths. Its large sample size (n=35,071) and detailed, branching set of questions about religious identity make it possible to estimate the size of a wide variety of religious groups with a high degree of precision. The large sample also makes it possible to describe the characteristics of smaller religious groups that account for less than 1% of the U.S. population, something not possible with smaller surveys. In addition, the methodological approach employed by the survey (with a minimum of 300 interviews in every state) allows for estimates of the religious makeup of all 50 states, the District of Columbia and the nation’s largest metropolitan areas. But the Religious Landscape Study is not the only source of long-term data on the changing religious composition of the U.S. The General Social Survey (GSS), a project of the independent research organization NORC at the University of Chicago, has been conducted every year or two since 1972. Sample sizes for GSS surveys range from 1,372 to 4,510 and average about 2,000 per year. The Gallup Organization has been asking about religious identity even longer, and releases aggregated results based on the surveys it conducts each year. The American Religious Identification Surveys (ARIS) are large-scale studies undertaken in 1990 (n=113,713), 2001 (n=50,281) and 2008 (54,461). Media organizations like The Washington Post and ABC News regularly conduct polls about politics and current events that include questions about religious identity. Understanding how the findings of the Religious Landscape Study compare with these sources, and with results from ongoing polls conducted monthly by the Pew Research Center, may help to put the study’s findings into a broader context. All major religion surveys find that the unaffiliated share of the U.S. population (the percentage of religious “nones”) is growing rapidly. In the 2014 GSS, for instance, 21% of adults said they have no religious affiliation, up from just 8% in 1990 and 5% in 1972, when the GSS was first conducted.27 Gallup polls find fewer religious “nones” in recent surveys (16% in 2014), but they, too, find that this population has been growing. The ARIS studies found that the religious “nones” grew from 8% of the adult population in 1990 to 15% in 2008. Polling done in 2012 and early 2013 by Social Science Research Solutions (SSRS) – which is the same research firm that conducted the interviewing for the ARIS studies – suggests that the unaffiliated share of the population continued to grow after the 2008 ARIS survey, and 27 Analysis of the GSS data was conducted using the WTSSALL variable to weight the data. www.pewresearch.org 113 PEW RESEARCH CENTER stood at 20% in 2012. Washington Post-ABC News surveys also show an upward trajectory for the “nones,” though their growth is less pronounced in Post-ABC surveys than in some other sources. The Religious Landscape Study’s finding that 23% of adults are unaffiliated with a religion is very similar to results from Pew Research Center monthly polls, which put the figure at 21% for 2014 (and at 22% in the summer of 2014, when data collection for the Landscape Study was being conducted). Different survey organizations employ different methods and ask differently worded questions about religious identity, which may account for some of the variability in estimates. But all find that the unaffiliated share of the population has been increasing over time.28 Size of the Unaffiliated Population: Long-Term Trends % of U.S. adults identifying with no religion 25.0 GSS ARIS/SSRS 20.0 Pew Research Landscape Studies Pew Research monthly surveys 15.0 Washington Post-ABC News Gallup 10.0 5.0 2014 2012 2010 2008 2006 2004 2002 2000 1998 1996 1994 1992 1990 1988 1986 1984 1982 1980 1978 1976 1974 1972 0.0 For details on the data sources cited here, see the discussion at the end of this appendix. Note: Only those who identify their religion as atheist, agnostic, none, nothing in particular, etc. are categorized here as religiously unaffiliated. Those who say “don't know” or who decline to answer when asked about their religion are not categorized as religiously unaffiliated. PEW RESEARCH CENTER Notwithstanding the rise of the “nones,” some historical studies find that the portion of the U.S. population that is “churched” – i.e., that belongs to a parish or congregation – has increased dramatically over the nation’s history. Roger Finke and Rodney Stark have estimated, for example, that just 17% of Americans belonged to religious congregations in 1776, compared with about 62% in 1980. However, the historical figures pre-date the modern era of polling and are based instead on various kinds of church records; they are estimates of congregational membership, not self-identification or affiliation with a religious group. See Finke, Roger and Rodney Stark. 1992. “The Churching of America, 1776-1990: Winners and Losers in Our Religious Economy.” Rutgers University Press, pages 15-16. 28 www.pewresearch.org 114 PEW RESEARCH CENTER The surveys also show that the Protestant share of the population is declining. The GSS finds that the Protestant share of the population fell from 62% in 1990 to 48% in 2014. The decline of Protestantism has been less steep in Gallup surveys, but they, too, find that Protestants now account for fewer than 50% of U.S. adults. ARIS and SSRS surveys suggest that Protestants declined from 60% of the population in 1990 to roughly 50% in 2012. In Washington Post-ABC News surveys, the Protestant share of the population fell from a high of 61% in 2003 to 54% in 2014. And the trajectory for Protestants in the Religious Landscape Studies closely matches that seen in the Pew Research Center’s monthly polling. Size of the Protestant Population: Long-Term Trends % of U.S. adults identifying as Protestant 70.0 60.0 50.0 GSS ARIS/SSRS 40.0 Pew Research Landscape Studies 30.0 Pew Research monthly surveys Washington Post-ABC News 20.0 Gallup 10.0 2014 2012 2010 2008 2006 2004 2002 2000 1998 1996 1994 1992 1990 1988 1986 1984 1982 1980 1978 1976 1974 1972 0.0 Note: There are some slight differences across data sources in how the “Protestant” category is defined. In Pew Research surveys, for instance, Mormons and Orthodox Christians are not categorized as Protestants. In the ARIS and SSRS surveys, by contrast, the Protestant estimate includes all non-Catholic Christians. These differences in categorization may explain some of the variability in the estimates. For details on the data sources cited here, see the discussion at the end of this appendix. PEW RESEARCH CENTER www.pewresearch.org 115 PEW RESEARCH CENTER There is less consensus about the trend for the Catholic population. The GSS tracked a slight, but not statistically significant, decline in the Catholic share of the population between 2006 (when GSS first conducted interviews in both English and Spanish) and 2012. But this decline was followed by a slight uptick in the Catholic share of the population in the 2014 GSS. The Catholic share of the population declined fairly steadily in aggregated Gallup polls between the late 1990s and 2010. It has inched upward since then, but it has not returned to late-1990s levels. Similarly, Washington Post-ABC News surveys found small declines in the Catholic share of the population between 2001 (24%) and 2010 (20%), before it ticked back up to 21% in 2011 and 2012, then to 22% in 2013 (when interviews were first conducted in both English Size of the Catholic Population: Long-Term Trends and Spanish) and 23% in % of U.S. adults identifying as Catholic 2014. 30.0 2014 2012 2010 2008 2006 2004 2002 2000 1998 1996 1994 1992 1990 1988 1986 1984 1982 1980 1978 1976 1974 1972 The ARIS studies found that 25.0 the Catholic share of the 20.0 population held fairly steady GSS ARIS/SSRS between 1990 (26.2%) and 15.0 Pew Research Landscape Studies 2008 (25.1%). By 2012, Pew Research monthly surveys however, surveys conducted 10.0 Washington Post-ABC News by SSRS using the same Gallup 5.0 question and same basic methodology employed in the 0.0 ARIS studies found 22.0% of adults identifying as Catholic, For details on the data sources cited here, see the discussion at the end of this appendix. a decline of 3.1 percentage 29 PEW RESEARCH CENTER points since the 2008 ARIS. This closely mirrors the trajectory for Catholics observed between the 2007 and 2014 Religious Landscape Studies. The findings of the 2014 Landscape Study also track closely with results from aggregated monthly polls conducted by the Pew Research Center that show a recent decline in the Catholic share of the population. After first asking “What is your religion, if any?” the ARIS studies included a follow-up question that asked those identifying as “Protestant” or “Christian” about the denomination with which they identify. In response, most ARIS respondents named a denomination or described their religion in a way such that they were categorized as Protestants; a small number of respondents indicated they were Catholic. The 2012 SSRS surveys did not include this follow-up question. However, the impact of this difference on the ARIS/SSRS trend in the estimated share of Catholics in the overall population is negligible. 29 www.pewresearch.org 116 PEW RESEARCH CENTER There are a number of factors that might help explain the differing estimates of the size of the Catholic population. Comparison of the GSS and the Landscape Study, for instance, shows that the 2014 GSS sample included a slightly higher share of Hispanics than the 2014 Religious Landscape Study (17% vs. 15%). It also had fewer interviews with young adults between the ages of 18 and 24 (9% in the GSS vs. 14% in the Landscape Study).30 This helps explain part of the difference between the 2014 Landscape findings and the 2014 GSS, since Hispanics identify as Catholic at a higher rate than the rest of the U.S. population, and younger Millennials identify as Catholic at a lower rate than do older adults. Readers should also bear in mind that different methods and different questions can produce different results in surveys. The GSS consists primarily of in-person, face-to-face interviews, while the Landscape Study, other Pew Research surveys, Washington Post-ABC News polls, ARIS/SSRS surveys and recent Gallup polls are all conducted by telephone. And all of the surveys analyzed here ask different questions to measure religious affiliation. The GSS, for example, asks “What is your religious preference? Is it Protestant, Catholic, Jewish, some other religion, or no religion?” Gallup surveys have asked about religious identity in a variety of ways over the years, with its recent surveys asking “What is your religious preference – Protestant, Roman Catholic, Jewish, another religion, or no religion?” The Post-ABC trends are based on an open-ended religion question (“What, if anything, is your religion?”), as are the ARIS/SSRS data (“What is your religion, if any?”). The 2014 Religious Landscape Study (and Pew Research monthly polls) asks a longer question with a more extensive list of options, including three separate chances for respondents to identify with no religion: “What is your present religion, if any? Are you Protestant, Roman Catholic, Mormon, Orthodox such as Greek or Russian Orthodox, Jewish, Muslim, Buddhist, Hindu, atheist, agnostic, something else, or nothing in particular?”31 By explicitly offering respondents the chance to identify as atheist, agnostic or “nothing in particular,” the Religious Landscape Study question may make it easier for marginally religious people who once thought of themselves as Catholics, Protestants or members of another religious group to identify as religious “nones.” This underscores the importance of taking methodology, question wording and other factors into account when comparing results from one survey to another. In the 2014 Religious Landscape Study, the share of Hispanics and the share of adults ages 18-24 closely match estimates from the U.S. Census Bureau’s 2013 American Community Survey (ACS), which estimates that 15% of U.S. adults are Hispanic and 13% are ages 18-24. 31 In addition, the Pew Research Religious Landscape Study includes follow-up questions for Protestants and other religious groups soliciting more detail about respondents’ religious identity. This additional detail can result in slightly different categorizations compared with Pew Research monthly polls. 30 www.pewresearch.org 117 PEW RESEARCH CENTER General Social Surveys were conducted once annually from 1972-1978; in 1980; in 1982; once annually from 1983-1991; in 1993; and once every two years beginning in 1994. Sample sizes for GSS surveys range from 1,372 to 4,510 and average about 2,000. For more information, see: Smith, Tom W, Peter Marsden, Michael Hout, and Jibum Kim. General Social Surveys, 19722014 [machine-readable data file] /Principal Investigator, Tom W. Smith; Co-Principal Investigator, Peter V. Marsden; Co-Principal Investigator, Michael Hout; Sponsored by National Science Foundation. – NORC ed. – Chicago: National Opinion Research Center [producer]; Storrs, CT: The Roper Center for Public Opinion Research, University of Connecticut [distributor], 2013. The American Religious Identification Surveys (ARIS) were conducted in 1990 (n=113,713), 2001 (n=50,281) and 2008 (n=54,461). The principal investigators on the ARIS studies are Barry A. Kosmin and Ariela Keysar of Trinity College, Hartford, Conn. The ARIS results are compared with findings (provided in correspondence) from surveys conducted by Social Science Research Solutions (SSRS) in 2012 and early 2013 (n=61,412). SSRS is the research firm that conducted interviewing for the ARIS studies. Trends from Washington Post-ABC News surveys were graciously provided to the Pew Research Center via correspondence. Data from Post-ABC polls are available for download from the Roper Center for Public Opinion Research. Gallup data were accessed at http://www.gallup.com/poll/1690/religion.aspx. Results from Pew Research Center monthly surveys reflect yearly aggregated data from polls conducted in 2009 (the first year in which most Pew Research Center surveys were conducted in both English and Spanish) through 2014. In total, this analysis draws on more than 50 separate polls and interviews with more than 110,000 respondents. See http://www.pewresearch.org/. www.pewresearch.org 118 PEW RESEARCH CENTER Appendix D: Detailed Tables The following tables contain detailed information about the demographic characteristics of religious traditions, Protestant denominations and denominational families. They also include information about the religious composition of states and geographic regions. www.pewresearch.org 119 PEW RESEARCH CENTER Gender by Religious Tradition Full Sample Protestant Evangelical tradition Mainline tradition Historically black Protestant tradition Catholic Mormon Church of Jesus Christ of Latter-day Saints Jehovah’s Witness Orthodox Christian Other Christian Jewish Muslim Buddhist Hindu Other faiths Unitarian and other liberal faiths New Age Unaffiliated Atheist Agnostic Nothing in particular Religion not important Religion important Male Female Total Sample size 2014 48% 52% 100% 35,071 2007 48 52 100 35,556 2014 45 55 100 16,592 2007 46 54 100 18,937 2014 45 55 100 8,593 2007 47 53 100 9,472 2014 45 55 100 6,083 2007 46 54 100 7,470 2014 41 59 100 1,916 2007 40 60 100 1,995 2014 46 54 100 7,202 2007 46 54 100 8,054 2014 46 54 100 664 2007 44 56 100 581 2014 46 54 100 641 2007 44 56 100 556 2014 35 65 100 245 2007 40 60 100 215 2014 56 44 100 186 2007 46 54 100 363 2014 50 50 100 159 2007 46 54 100 129 2014 52 48 100 847 2007 52 48 100 682 2014 65 35 100 237 2007 58 42 100 116 2014 51 49 100 264 2007 53 47 100 411 2014 62 38 100 199 2007 61 39 100 257 2014 50 50 100 605 2007 54 46 100 449 2014 54 46 100 425 2007 54 46 100 297 2014 39 61 100 141 2007 51 49 100 118 2014 57 43 100 7,556 2007 59 41 100 5,048 2014 68 32 100 1,098 2007 70 30 100 515 2014 62 38 100 1,474 2007 64 36 100 826 2014 54 46 100 4,984 2007 56 44 100 3,707 2014 55 45 100 2,969 2007 60 40 100 2,006 2014 51 49 100 2,015 2007 52 48 100 1,701 Figures may not add to 100% due to rounding. Those who describe their religion as "nothing in particular" are subdivided into two groups. The "religion not important" group includes those who say (in Q.F2) religion is "not too" or "not at all" important in their lives as well as those who decline to answer the question about religion's importance. The "religion important" category includes those who say religion is "very" or "somewhat" important in their lives. The 2014 Religious Landscape Study's estimate that 65% of U.S. Muslims are men differs significantly from the Pew Research Center's 2011 survey of Muslim Americans, which estimated that 55% of Muslims were men. The 2011 survey attempted to match male interviewers with male respondents and female interviewers with female respondents in households reached by landline. This practice is common among survey researchers conducting face-to-face interviews in Muslim-majority nations and probably produced a more accurate estimate of the gender composition of American Muslims than the 2014 Religious Landscape Study, in which there was no attempt to match interviewers with respondents on the basis of gender. Margins of error vary based on sample size. To see approximate margins of error for groups of various sizes, see Appendix B, "Methodology." The demographic characteristics of the 2014 Religious Landscape Study’s overall sample were weighted to known parameters from the Census Bureau's 2012 American Community Survey (ACS), which helps to ensure that the demographic characteristics of the sample closely match those of the U.S. adult population. See Appendix B for details. 120 PEW RESEARCH CENTER Gender by Protestant Family Baptist Baptist in the evangelical tradition Baptist in the mainline tradition Baptist in the historically black Protestant tradition Methodist Methodist in the mainline tradition Methodist in the historically black Protestant tradition Nondenominational Nondenominational in the evangelical tradition Nondenominational in the mainline tradition Nondenominational in the historically black Protestant tradition Lutheran Lutheran in the evangelical tradition Lutheran in the mainline tradition Presbyterian Presbyterian in the evangelical tradition Presbyterian in the mainline tradition Pentecostal Pentecostal in the evangelical tradition Pentecostal in the historically black Protestant tradition Episcopalian/Anglican Episcopalian/Anglican in the mainline tradition Restorationist Restorationist in the evangelical tradition Restorationist in the mainline tradition Congregationalist Congregationalist in the mainline tradition Holiness Holiness in the evangelical tradition Adventist Anabaptist Male Female Total Sample size 2014 45% 55% 100% 4,960 2007 45 55 100 5,914 2014 48 52 100 3,142 2007 48 52 100 4,008 2014 44 56 100 638 2007 44 56 100 628 2014 39 61 100 1,180 2007 40 60 100 1,278 2014 44 56 100 1,991 2007 43 57 100 2,657 2014 44 56 100 1,746 2007 44 56 100 2,393 2014 41 59 100 184 2007 37 63 100 210 2014 45 55 100 2,084 2007 46 54 100 1,550 2014 44 56 100 1,604 2007 48 52 100 1,177 2014 47 53 100 375 2007 44 56 100 306 2014 45 55 100 105 2007 n/a n/a n/a n/a 2014 46 54 100 1,504 2007 47 53 100 1,926 2014 46 54 100 630 2007 49 51 100 740 2014 46 54 100 874 2007 47 53 100 1,186 2014 44 56 100 978 2007 48 52 100 1,164 2014 47 53 100 306 2007 52 48 100 320 2014 43 57 100 672 2007 46 54 100 844 2014 41 59 100 1,388 2007 44 56 100 1,345 2014 40 60 100 1,086 2007 45 55 100 1,089 2014 44 56 100 302 2007 42 58 100 256 2014 46 54 100 652 2007 48 52 100 706 2014 46 54 100 640 2007 49 51 100 672 2014 40 60 100 644 2007 43 57 100 776 2014 40 60 100 541 2007 43 57 100 619 2014 40 60 100 103 2007 39 61 100 157 2014 39 61 100 303 2007 43 57 100 345 2014 37 63 100 267 2007 41 59 100 300 2014 43 57 100 293 2007 46 54 100 411 2014 44 56 100 263 2007 47 53 100 374 2014 44 56 100 182 2007 41 59 100 151 2014 59 41 100 103 2007 n/a n/a n/a n/a Figures may not add to 100% due to rounding. "N/A" indicates insufficient sample size. Margins of error vary based on sample size. To see approximate margins of error for groups of various sizes, see Appendix B, "Methodology." 121 PEW RESEARCH CENTER Gender by Protestant Denomination African Methodist Episcopal Church American Baptist Churches USA Anglican Church Assemblies of God Church of God in Christ Church of God (Cleveland, Tennessee) Church of the Nazarene Churches of Christ Episcopal Church Evangelical Lutheran Church in America (ELCA) Independent Baptist (evangelical tradition) Interdenominational (evangelical tradition) Interdenominational (mainline tradition) Lutheran Church-Missouri Synod National Baptist Convention Nondenominational charismatic Nondenominational evangelical Nondenominational fundamentalist Presbyterian Church in America Presbyterian Church (USA) Seventh-day Adventist Southern Baptist Convention United Church of Christ United Methodist Church Male Female Total Sample size 2014 40% 60% 100% 117 2007 37 63 100 127 2014 40 60 100 467 2007 42 58 100 411 2014 44 56 100 111 2007 51 49 100 134 2014 43 57 100 460 2007 43 57 100 480 2014 44 56 100 165 2007 44 56 100 160 2014 41 59 100 111 2007 47 53 100 124 2014 49 51 100 101 2007 47 53 100 103 2014 40 60 100 498 2007 44 56 100 564 2014 45 55 100 494 2007 48 52 100 474 2014 44 56 100 641 2007 44 56 100 869 2014 48 52 100 825 2007 46 54 100 912 2014 38 62 100 206 2007 41 59 100 186 2014 47 53 100 139 2007 42 58 100 102 2014 47 53 100 459 2007 47 53 100 588 2014 39 61 100 462 2007 39 61 100 549 2014 39 61 100 187 2007 44 56 100 172 2014 47 53 100 684 2007 48 52 100 413 2014 61 39 100 107 2007 63 37 100 103 2014 52 48 100 158 2007 57 43 100 168 2014 45 55 100 428 2007 46 54 100 544 2014 46 54 100 165 2007 40 60 100 135 2014 49 51 100 1,845 2007 49 51 100 2,539 2014 38 62 100 227 2007 39 61 100 248 2014 44 56 100 1,637 2007 43 57 100 2,239 Figures may not add to 100% due to rounding. Margins of error vary based on sample size. To see approximate margins of error for groups of various sizes, see Appendix B, "Methodology." 122 PEW RESEARCH CENTER Race by Religious Tradition ------------------------Non-Latino------------------------ Full Sample Protestant Evangelical tradition Mainline tradition Historically black Protestant tradition Catholic Mormon Church of Jesus Christ of Latter-day Saints Jehovah’s Witness Orthodox Christian Other Christian Jewish Muslim Buddhist Hindu Other faiths Unitarian and other liberal faiths New Age Unaffiliated Atheist Agnostic Nothing in particular Religion not important Religion important White Black Asian Other/mixed Latino Total Sample size 2014 66% 12% 4% 4% 15% 100% 34,549 2007 71 11 3 3 12 100 35,101 2014 69 18 1 4 8 100 16,387 2007 74 16 1 3 5 100 18,753 2014 76 6 2 5 11 100 8,479 2007 81 6 2 4 7 100 9,380 2014 86 3 1 3 6 100 5,995 2007 91 2 1 3 3 100 7,383 2014 2 94 0 1 3 100 1,913 2007 2 92 * 1 4 100 1,990 2014 59 3 3 2 34 100 7,113 2007 65 2 2 2 29 100 7,987 2014 85 1 1 5 8 100 656 2007 86 3 1 3 7 100 571 2014 85 1 1 5 8 100 633 2007 87 2 1 3 7 100 547 2014 36 27 * 6 32 100 242 2007 48 22 * 5 24 100 212 2014 81 8 3 2 6 100 184 2007 87 6 2 3 1 100 358 2014 65 16 * 10 9 100 155 2007 77 11 0 8 4 100 126 2014 90 2 2 2 4 100 838 2007 95 1 * 2 3 100 671 2014 38 28 28 3 4 100 232 2007 33 32 20 7 7 100 115 2014 44 3 33 8 12 100 262 2007 53 4 32 5 6 100 405 2014 4 2 91 2 1 100 197 2007 5 1 88 4 2 100 255 2014 78 4 1 10 8 100 593 2007 80 2 1 13 5 100 436 2014 78 5 1 8 9 100 419 2007 88 2 2 5 4 100 291 2014 85 2 1 7 6 100 136 2007 84 1 0 10 5 100 113 2014 68 9 5 4 13 100 7,427 2007 73 8 4 4 11 100 4,955 2014 78 3 7 2 10 100 1,087 2007 86 3 4 2 5 100 499 2014 79 3 4 4 9 100 1,452 2007 84 2 4 4 6 100 817 2014 64 12 5 5 15 100 4,888 2007 70 10 3 4 12 100 3,639 2014 72 7 6 4 12 100 2,922 2007 79 5 4 4 8 100 1,971 2014 53 18 3 6 19 100 1,966 2007 60 16 2 5 17 100 1,668 Figures may not add to 100% due to rounding. Results repercentaged to exclude nonresponse. Those who describe their religion as "nothing in particular" are subdivided into two groups. The "religion not important" group includes those who say (in Q.F2) religion is "not too" or "not at all" important in their lives as well as those who decline to answer the question about religion's importance. The "religion important" category includes those who say religion is "very" or "somewhat" important in their lives. Margins of error vary based on sample size. To see approximate margins of error for groups of various sizes, see Appendix B, "Methodology." The demographic characteristics of the 2014 Religious Landscape Study’s overall sample were weighted to known parameters from the Census Bureau's 2012 American Community Survey (ACS), which helps to ensure that the demographic characteristics of the sample closely match those of the U.S. adult population. See Appendix B for details. 123 PEW RESEARCH CENTER Race by Protestant Family -----------------------Non-Latino----------------------- Baptist Baptist in the evangelical tradition Baptist in the mainline tradition Baptist in the historically black Protestant tradition Methodist Methodist in the mainline tradition Methodist in the historically black Protestant tradition Nondenominational Nondenominational in the evangelical tradition Nondenominational in the mainline tradition Nondenominational in the historically black Protestant tradition Lutheran Lutheran in the evangelical tradition Lutheran in the mainline tradition Presbyterian Presbyterian in the evangelical tradition Presbyterian in the mainline tradition Pentecostal Pentecostal in the evangelical tradition Pentecostal in the historically black Protestant tradition Episcopalian/Anglican Episcopalian/Anglican in the mainline tradition Restorationist Restorationist in the evangelical tradition Restorationist in the mainline tradition Congregationalist Congregationalist in the mainline tradition Holiness Holiness in the evangelical tradition Adventist Anabaptist White Black Asian Other/mixed Latino Total Sample size 2014 61% 30% 1% 4% 5% 100% 4,917 2007 64 29 1 3 3 100 5,870 2014 85 4 1 5 5 100 3,107 2007 86 5 1 4 3 100 3,973 2014 76 8 1 6 9 100 630 2007 83 3 2 6 6 100 619 2014 0 98 0 * 2 100 1,180 2007 0 97 0 * 3 100 1,278 2014 83 12 1 2 2 100 1,981 2007 84 11 1 2 2 100 2,645 2014 94 1 1 2 2 100 1,736 2007 93 2 1 2 2 100 2,384 2014 2 94 0 2 2 100 184 2007 1 95 0 3 2 100 207 2014 69 13 2 6 11 100 2,057 2007 72 13 3 4 7 100 1,529 2014 71 9 3 6 11 100 1,583 2007 75 9 3 4 8 100 1,162 2014 79 4 1 6 11 100 369 2007 78 6 4 5 7 100 300 2014 0 94 0 0 6 100 105 2007 n/a n/a n/a n/a n/a n/a n/a 2014 94 2 1 2 1 100 1,486 2007 96 1 * 1 1 100 1,916 2014 92 2 1 2 2 100 625 2007 95 1 1 2 1 100 734 2014 95 1 1 2 1 100 861 2007 96 1 * 1 2 100 1,182 2014 86 5 3 2 3 100 968 2007 90 3 2 1 3 100 1,160 2014 81 6 5 4 4 100 300 2007 88 4 3 1 4 100 319 2014 88 5 3 1 3 100 668 2007 91 3 2 2 2 100 841 2014 48 22 1 5 23 100 1,374 2007 56 20 1 5 18 100 1,333 2014 59 5 1 6 28 100 1,074 2007 67 7 1 6 19 100 1,079 2014 11 79 0 3 7 100 300 2007 14 68 1 3 13 100 254 2014 88 6 1 3 3 100 646 2007 90 6 1 1 1 100 695 2014 89 5 1 3 3 100 634 2007 92 5 1 1 1 100 661 2014 70 14 1 4 12 100 637 2007 76 13 2 3 6 100 772 2014 69 15 1 4 12 100 535 2007 75 14 2 3 6 100 615 2014 78 6 0 4 12 100 102 2007 79 9 0 3 9 100 157 2014 88 7 1 2 2 100 301 2007 93 3 0 3 1 100 343 2014 90 7 1 1 1 100 265 2007 93 3 0 3 1 100 298 2014 78 13 1 3 5 100 289 2007 78 15 1 6 1 100 410 2014 88 2 1 3 6 100 260 2007 87 5 1 5 1 100 373 2014 41 30 7 8 15 100 177 2007 45 21 4 4 26 100 150 2014 97 1 * 1 0 100 101 2007 n/a n/a n/a n/a n/a n/a n/a Figures may not add to 100% due to rounding. Results repercentaged to exclude nonresponse. "N/A" indicates insufficient sample size. Margins of error vary based on sample size. To see approximate margins of error for groups of various sizes, see Appendix B, "Methodology." 124 PEW RESEARCH CENTER Race by Protestant Denomination -----------------------Non-Latino----------------------- African Methodist Episcopal Church American Baptist Churches USA Anglican Church Assemblies of God Church of God in Christ Church of God (Cleveland, Tennessee) Church of the Nazarene Churches of Christ Episcopal Church Evangelical Lutheran Church in America (ELCA) Independent Baptist (evangelical tradition) Interdenominational (evangelical tradition) Interdenominational (mainline tradition) Lutheran Church-Missouri Synod National Baptist Convention Nondenominational charismatic Nondenominational evangelical Nondenominational fundamentalist Presbyterian Church in America Presbyterian Church (USA) Seventh-day Adventist Southern Baptist Convention United Church of Christ United Methodist Church White Black Asian Other/mixed Latino Total Sample size 2014 2% 94% 0% 3% 0% 100% 117 2007 1 93 0 5 1 100 125 2014 73 10 1 5 11 100 463 2007 81 4 2 6 7 100 406 2014 83 12 0 1 4 100 109 2007 92 6 2 0 * 100 130 2014 66 3 * 5 25 100 458 2007 72 2 2 6 19 100 477 2014 5 84 0 4 8 100 163 2007 11 71 1 4 13 100 158 2014 65 3 1 3 28 100 110 2007 83 2 1 3 11 100 124 2014 88 2 1 3 7 100 100 2007 95 2 0 1 2 100 103 2014 69 16 1 4 10 100 493 2007 76 13 2 3 6 100 561 2014 90 4 1 3 2 100 491 2007 92 4 1 1 2 100 468 2014 96 2 1 1 1 100 635 2007 97 1 1 1 1 100 867 2014 88 0 1 5 6 100 817 2007 91 0 1 4 3 100 905 2014 60 25 4 4 8 100 205 2007 71 17 2 6 3 100 184 2014 73 12 1 5 8 100 136 2007 67 17 4 7 5 100 102 2014 95 2 * 2 1 100 456 2007 95 2 1 1 1 100 583 2014 0 99 0 0 1 100 462 2007 0 98 0 * 2 100 549 2014 68 14 1 7 11 100 185 2007 75 14 2 1 9 100 170 2014 74 7 2 4 13 100 677 2007 73 10 4 4 9 100 412 2014 75 9 2 9 5 100 106 2007 79 7 3 1 9 100 103 2014 80 6 3 5 6 100 155 2007 86 5 4 1 4 100 168 2014 88 5 3 1 4 100 426 2007 91 4 2 1 2 100 542 2014 37 32 8 8 15 100 160 2007 43 21 5 4 27 100 134 2014 85 6 * 5 3 100 1,829 2007 85 8 1 3 2 100 2,520 2014 89 8 * 2 1 100 225 2007 91 4 0 4 1 100 246 2014 94 1 1 2 2 100 1,630 2007 93 2 1 2 2 100 2,232 Figures may not add to 100% due to rounding. Results repercentaged to exclude nonresponse. Margins of error vary based on sample size. To see approximate margins of error for groups of various sizes, see Appendix B, "Methodology." 125 PEW RESEARCH CENTER Age by Religious Tradition Full Sample Protestant Evangelical tradition Mainline tradition Historically black Protestant tradition Catholic Mormon Church of Jesus Christ of Latter-day Saints Jehovah’s Witness Orthodox Christian Other Christian Jewish Muslim Buddhist Hindu Other faiths Unitarian and other liberal faiths New Age Unaffiliated Atheist Agnostic Nothing in particular Religion not important Religion important 18-29 30-49 50-64 65+ Total 2014 22% 34% 26% 18% 100% Median age Sample size 46 34,345 2007 20 39 25 16 100 45 34,695 2014 17 32 29 21 100 50 16,236 2007 17 38 26 20 100 47 18,494 2014 17 33 29 20 100 49 8,417 2007 17 39 26 19 100 47 9,281 2014 16 29 29 26 100 52 5,946 2007 14 36 28 23 100 50 7,271 2014 20 36 29 15 100 46 1,873 2007 24 36 24 15 100 44 1,942 2014 17 33 29 20 100 49 7,061 2007 18 41 24 16 100 45 7,856 2014 22 40 22 16 100 43 651 2007 24 42 19 15 100 41 565 2014 22 40 22 16 100 44 629 2007 25 42 18 15 100 40 543 2014 15 34 29 23 100 50 238 2007 21 39 25 14 100 45 207 2014 26 40 21 13 100 40 177 2007 18 38 27 17 100 46 358 2014 15 28 37 20 100 51 157 2007 16 35 27 22 100 49 127 2014 22 27 26 26 100 50 825 2007 20 29 29 22 100 50 664 2014 44 37 13 5 100 33 234 2007 33 46 17 3 100 35 114 2014 34 30 23 14 100 39 259 2007 23 40 30 7 100 42 410 2014 34 56 6 4 100 33 194 2007 18 58 19 5 100 38 250 2014 28 37 25 9 100 41 600 2007 26 37 27 10 100 43 437 2014 27 35 26 12 100 43 421 2007 18 33 33 16 100 49 288 2014 33 43 20 5 100 35 141 2007 43 43 12 2 100 31 116 2014 35 37 19 9 100 36 7,437 2007 31 40 20 8 100 38 4,947 2014 40 37 14 9 100 34 1,082 2007 37 36 16 12 100 36 502 2014 39 35 16 9 100 34 1,452 2007 34 34 22 9 100 39 818 2014 32 38 21 9 100 38 4,903 2007 29 42 20 8 100 38 3,627 2014 34 37 20 10 100 37 2,925 2007 29 41 21 8 100 39 1,965 2014 31 39 23 8 100 39 1,978 2007 30 43 20 7 100 38 1,662 Figures may not add to 100% due to rounding. Results repercentaged to exclude nonresponse. Those who describe their religion as "nothing in particular" are subdivided into two groups. The "religion not important" group includes those who say (in Q.F2) religion is "not too" or "not at all" important in their lives as well as those who decline to answer the question about religion's importance. The "religion important" category includes those who say religion is "very" or "somewhat" important in their lives. Margins of error vary based on sample size. To see approximate margins of error for groups of various sizes, see Appendix B, "Methodology." The demographic characteristics of the 2014 Religious Landscape Study’s overall sample were weighted to known parameters from the Census Bureau's 2012 American Community Survey (ACS), which helps to ensure that the demographic characteristics of the sample closely match those of the U.S. adult population. See Appendix B for details. 126 PEW RESEARCH CENTER Age by Protestant Family Baptist Baptist in the evangelical tradition Baptist in the mainline tradition Baptist in the historically black Protestant tradition Methodist Methodist in the mainline tradition Methodist in the historically black Protestant tradition Nondenominational Nondenominational in the evangelical tradition Nondenominational in the mainline tradition Nondenominational in the historically black Protestant tradition Lutheran Lutheran in the evangelical tradition Lutheran in the mainline tradition Presbyterian Presbyterian in the evangelical tradition Presbyterian in the mainline tradition Pentecostal Pentecostal in the evangelical tradition Pentecostal in the historically black Protestant tradition Episcopalian/Anglican Episcopalian/Anglican in the mainline tradition Restorationist Restorationist in the evangelical tradition Restorationist in the mainline tradition Congregationalist Congregationalist in the mainline tradition Holiness Holiness in the evangelical tradition Adventist Anabaptist 18-29 30-49 50-64 65+ Total 2014 17% 31% 31% 21% 100% Median age Sample size 50 4,866 2007 17 38 25 20 100 47 5,798 2014 15 30 31 24 100 52 3,083 2007 14 38 26 21 100 48 3,933 2014 24 29 29 19 100 48 625 2007 20 38 22 20 100 45 613 2014 18 33 32 16 100 48 1,158 2007 22 36 25 17 100 45 1,252 2014 10 29 29 32 100 56 1,960 2007 11 33 29 26 100 52 2,594 2014 9 28 30 33 100 57 1,721 2007 11 34 29 26 100 52 2,344 2014 16 34 27 24 100 50 179 2007 15 28 32 25 100 53 198 2014 23 42 27 9 100 43 2,044 2007 22 49 22 8 100 42 1,511 2014 21 41 28 10 100 44 1,571 2007 21 48 22 8 100 42 1,142 2014 27 41 24 8 100 41 372 2007 22 50 21 6 100 41 303 2014 26 53 16 4 100 38 101 2007 n/a n/a n/a n/a n/a n/a n/a 2014 12 30 29 28 100 54 1,469 2007 11 36 29 24 100 51 1,894 2014 11 30 29 30 100 56 617 2007 12 34 29 25 100 51 731 2014 13 31 29 27 100 52 852 2007 10 37 28 24 100 50 1,163 2014 11 23 33 34 100 57 949 2007 11 32 29 29 100 53 1,143 2014 12 23 35 31 100 54 298 2007 13 29 29 29 100 52 316 2014 10 23 32 35 100 58 651 2007 10 33 29 29 100 53 827 2014 19 34 30 17 100 48 1,358 2007 19 42 25 14 100 44 1,314 2014 18 33 31 19 100 49 1,062 2007 16 44 26 14 100 45 1,065 2014 22 39 26 13 100 44 296 2007 29 34 25 12 100 41 249 2014 10 27 30 33 100 56 641 2007 10 30 34 27 100 53 679 2014 9 26 31 33 100 56 629 2007 10 30 33 27 100 54 647 2014 20 31 27 22 100 49 637 2007 21 31 24 24 100 48 760 2014 21 31 27 21 100 48 535 2007 23 31 24 22 100 47 606 2014 17 26 29 29 100 52 102 2007 12 32 22 34 100 52 154 2014 9 26 31 34 100 58 297 2007 10 30 35 25 100 53 335 2014 9 25 34 32 100 58 263 2007 12 27 36 25 100 52 292 2014 13 31 36 21 100 53 290 2007 15 32 27 26 100 51 403 2014 13 31 34 22 100 53 261 2007 16 31 27 27 100 50 368 2014 28 35 17 20 100 45 174 2007 18 43 24 15 100 47 150 2014 17 38 22 23 100 47 102 2007 n/a n/a n/a n/a n/a n/a n/a Figures may not add to 100% due to rounding. Results repercentaged to exclude nonresponse. "N/A" indicates insufficient sample size. Margins of error vary based on sample size. To see approximate margins of error for groups of various sizes, see Appendix B, "Methodology." 127 PEW RESEARCH CENTER Age by Protestant Denomination African Methodist Episcopal Church American Baptist Churches USA Anglican Church Assemblies of God Church of God in Christ Church of God (Cleveland, Tennessee) Church of the Nazarene Churches of Christ Episcopal Church Evangelical Lutheran Church in America (ELCA) Independent Baptist (evangelical tradition) Interdenominational (evangelical tradition) Interdenominational (mainline tradition) Lutheran Church-Missouri Synod National Baptist Convention Nondenominational charismatic Nondenominational evangelical Nondenominational fundamentalist Presbyterian Church in America Presbyterian Church (USA) Seventh-day Adventist Southern Baptist Convention United Church of Christ United Methodist Church 18-29 30-49 50-64 65+ Total 2014 16% 33% 23% 27% 100% Median age Sample size 50 113 2007 14 31 30 25 100 52 120 2014 21 28 32 19 100 50 457 2007 18 36 23 23 100 47 404 2014 8 30 28 33 100 57 110 2007 7 26 33 35 100 57 130 2014 14 32 31 23 100 52 452 2007 14 41 33 12 100 47 473 2014 23 35 29 13 100 47 161 2007 29 33 28 10 100 43 153 2014 12 32 40 16 100 53 111 2007 18 30 24 28 100 51 120 2014 14 29 38 19 100 53 101 2007 16 31 25 28 100 51 102 2014 20 32 27 21 100 48 493 2007 22 32 24 22 100 47 552 2014 9 26 31 35 100 56 487 2007 11 29 34 25 100 53 455 2014 12 27 30 31 100 55 626 2007 8 36 29 27 100 53 855 2014 16 33 32 19 100 50 808 2007 15 39 27 19 100 47 897 2014 17 42 33 8 100 47 203 2007 19 47 24 10 100 44 182 2014 15 45 27 13 100 45 138 2007 18 48 29 5 100 44 102 2014 10 32 28 30 100 56 448 2007 11 32 31 26 100 52 582 2014 11 30 36 23 100 53 454 2007 14 35 29 21 100 50 538 2014 25 31 34 10 100 46 182 2007 18 54 22 6 100 40 166 2014 22 39 29 10 100 44 677 2007 19 51 22 8 100 43 406 2014 14 33 38 16 100 50 103 2007 12 43 33 12 100 48 102 2014 11 18 32 39 100 59 156 2007 12 29 32 27 100 52 165 2014 8 24 30 38 100 59 413 2007 8 31 30 32 100 55 534 2014 28 35 17 20 100 45 157 2007 20 44 21 15 100 44 134 2014 13 28 33 27 100 54 1,815 2007 13 37 27 22 100 49 2,492 2014 10 23 36 31 100 59 224 2007 11 27 34 28 100 54 241 2014 9 29 30 32 100 57 1,616 2007 11 34 29 26 100 52 2,195 Figures may not add to 100% due to rounding. Results repercentaged to exclude nonresponse. Margins of error vary based on sample size. To see approximate margins of error for groups of various sizes, see Appendix B, "Methodology." 128 PEW RESEARCH CENTER Education by Religious Tradition, 2014 High school grad Some college College grad/some postgrad Postgrad degree Total Sample size 10% 31% 32% 17% 11% 100% 34,868 9 33 34 15 9 100 16,495 10 34 35 14 7 100 8,545 Mainline tradition 6 30 30 19 14 100 6,045 Historically black Protestant tradition 14 38 33 9 6 100 1,905 Catholic 16 31 27 16 10 100 7,157 Mormon 5 22 40 23 10 100 662 4 22 40 23 10 100 639 Jehovah’s Witness 19 44 25 9 3 100 241 Orthodox Christian 5 21 34 21 18 100 185 Other Christian 8 18 43 19 12 100 158 Jewish 3 16 22 29 31 100 843 Muslim 6 30 25 23 17 100 237 Buddhist 2 18 33 28 20 100 262 Hindu 2 10 11 29 48 100 197 Other faiths 6 22 38 19 15 100 601 Unitarian and other liberal faiths 6 23 32 22 18 100 421 New Age Full sample Protestant Evangelical tradition Church of Jesus Christ of Latter-day Saints Less than high school 6 21 50 14 10 100 141 Unaffiliated 8 30 32 18 11 100 7,532 Atheist 4 22 31 26 16 100 1,096 Agnostic 1 21 36 25 16 100 1,474 Nothing in particular 10 34 32 15 9 100 4,962 Religion not important 7 30 34 18 12 100 2,955 Religion important 14 40 29 11 5 100 2,007 Figures may not add to 100% due to rounding. Results repercentaged to exclude nonresponse. Those who describe their religion as "nothing in particular" are subdivided into two groups. The "religion not important" group includes those who say (in Q.F2) religion is "not too" or "not at all" important in their lives as well as those who decline to answer the question about religion's importance. The "religion important" category includes those who say religion is "very" or "somewhat" important in their lives. Margins of error vary based on sample size. To see approximate margins of error for groups of various sizes, see Appendix B, "Methodology." The demographic characteristics of the 2014 Religious Landscape Study’s overall sample were weighted to known parameters from the Census Bureau's 2012 American Community Survey (ACS), which helps to ensure that the demographic characteristics of the sample closely match those of the U.S. adult population. See Appendix B for details. 129 PEW RESEARCH CENTER Education by Protestant Family, 2014 Some college College grad/some postgrad Postgrad degree Total Sample size 39% 32% 11% 5% 100% 4,936 10 38 34 12 6 100 3,125 Baptist in the mainline tradition 16 43 28 9 4 100 637 Baptist in the historically black Protestant tradition 15 41 30 9 5 100 1,174 Less than high school High school grad 12% Baptist in the evangelical tradition Baptist Methodist 5 31 31 20 13 100 1,984 Methodist in the mainline tradition 4 30 31 22 14 100 1,739 Methodist in the historically black Protestant tradition 8 38 33 13 9 100 184 4 26 40 20 10 100 2,078 Nondenominational in the evangelical tradition 4 26 40 20 10 100 1,599 Nondenominational in the mainline tradition 2 26 39 23 11 100 375 Nondenominational in the historically black Protestant tradition 10 24 49 14 3 100 104 4 32 32 19 13 100 1,495 Lutheran in the evangelical tradition 4 32 35 18 12 100 627 Lutheran in the mainline tradition 4 33 30 19 13 100 868 3 25 30 25 18 100 970 Presbyterian in the evangelical tradition 4 26 35 23 13 100 302 Presbyterian in the mainline tradition 3 24 27 25 21 100 668 17 35 36 9 4 100 1,377 Pentecostal in the evangelical tradition 18 35 35 9 3 100 1,077 Pentecostal in the historically black Protestant tradition 12 32 40 8 8 100 300 1 15 28 31 25 100 646 1 14 29 31 25 100 634 9 36 36 10 8 100 641 Restorationist in the evangelical tradition 10 37 36 10 7 100 538 Restorationist in the mainline tradition 6 28 41 10 15 100 103 5 30 22 20 22 100 303 6 29 20 22 24 100 267 9 38 35 9 9 100 291 7 36 36 10 10 100 261 Adventist 8 29 36 18 9 100 181 Anabaptist 31 32 17 11 9 100 103 Nondenominational Lutheran Presbyterian Pentecostal Episcopalian/Anglican Episcopalian/Anglican in the mainline tradition Restorationist Congregationalist Congregationalist in the mainline tradition Holiness Holiness in the evangelical tradition Figures may not add to 100% due to rounding. Results repercentaged to exclude nonresponse. Margins of error vary based on sample size. To see approximate margins of error for groups of various sizes, see Appendix B, "Methodology." 130 PEW RESEARCH CENTER Education by Protestant Denomination, 2014 Some college College grad/some postgrad Postgrad degree Total Sample size 28% 44% 11% 10% 100% 117 43 27 8 5 100 466 Less than high school High school grad African Methodist Episcopal Church 7% American Baptist Churches USA 17 Anglican Church 1 8 32 39 21 100 110 Assemblies of God 15 38 32 11 4 100 456 Church of God in Christ 17 33 37 7 5 100 164 Church of God (Cleveland, Tennessee) 17 47 25 8 3 100 111 Church of the Nazarene 5 38 37 11 9 100 101 Churches of Christ 10 36 37 11 7 100 496 Episcopal Church 2 14 28 29 27 100 489 Evangelical Lutheran Church in America (ELCA) 3 28 33 21 15 100 636 Independent Baptist (evangelical tradition) 12 37 34 12 5 100 822 Interdenominational (evangelical tradition) 4 20 46 16 14 100 206 Interdenominational (mainline tradition) 0 14 42 25 18 100 139 Lutheran Church-Missouri Synod 3 32 34 20 12 100 457 National Baptist Convention 14 40 27 12 7 100 459 Nondenominational charismatic 3 33 38 16 10 100 187 Nondenominational evangelical 3 26 37 22 12 100 682 Nondenominational fundamentalist 5 33 37 20 5 100 107 Presbyterian Church in America 3 27 37 21 12 100 156 Presbyterian Church (USA) 3 24 25 24 23 100 424 Seventh-day Adventist 6 28 38 18 10 100 164 Southern Baptist Convention 8 38 35 13 6 100 1,833 United Church of Christ 7 26 21 22 24 100 227 United Methodist Church 4 29 31 23 14 100 1,631 Figures may not add to 100% due to rounding. Results repercentaged to exclude nonresponse. Margins of error vary based on sample size. To see approximate margins of error for groups of various sizes, see Appendix B, "Methodology." 131 PEW RESEARCH CENTER Education by Religious Tradition, 2007 and 2014 Full Sample Protestant Evangelical tradition Mainline tradition Historically black Protestant tradition Catholic Mormon Church of Jesus Christ of Latter-day Saints Jehovah’s Witness Orthodox Christian Other Christian Jewish Muslim Buddhist Hindu Other faiths Unitarian and other liberal faiths New Age Unaffiliated Atheist Agnostic Nothing in particular Religion not important Religion important Less than college College graduate Total Sample size 2014 73% 27% 100% 34,868 2007 73 27 100 35,298 2014 76 24 100 16,495 2007 76 24 100 18,825 2014 79 21 100 8,545 2007 80 20 100 9,411 2014 67 33 100 6,045 2007 66 34 100 7,429 2014 85 15 100 1,905 2007 84 16 100 1,985 2014 74 26 100 7,157 2007 74 26 100 7,990 2014 67 33 100 662 2007 71 29 100 578 2014 66 34 100 639 2007 72 28 100 555 2014 88 12 100 241 2007 92 8 100 211 2014 60 40 100 185 2007 54 46 100 362 2014 69 31 100 158 2007 60 40 100 129 2014 41 59 100 843 2007 41 59 100 676 2014 61 39 100 237 2007 60 40 100 115 2014 53 47 100 262 2007 52 48 100 408 2014 23 77 100 197 2007 26 74 100 253 2014 66 34 100 601 2007 61 39 100 448 2014 61 39 100 421 2007 49 51 100 296 2014 76 24 100 141 2007 75 25 100 118 2014 71 29 100 7,532 2007 71 29 100 5,009 2014 57 43 100 1,096 2007 58 42 100 509 2014 58 42 100 1,474 2007 57 43 100 825 2014 76 24 100 4,962 2007 76 24 100 3,675 2014 70 30 100 2,955 2007 69 31 100 1,995 2014 84 16 100 2007 2007 83 17 100 1,680 Figures may not add to 100% due to rounding. Results repercentaged to exclude nonresponse. Those who describe their religion as "nothing in particular" are subdivided into two groups. The "religion not important" group includes those who say (in Q.F2) religion is "not too" or "not at all" important in their lives as well as those who decline to answer the question about religion's importance. The "religion important" category includes those who say religion is "very" or "somewhat" important in their lives. Margins of error vary based on sample size. To see approximate margins of error for groups of various sizes, see Appendix B, "Methodology." The demographic characteristics of the 2014 Religious Landscape Study’s overall sample were weighted to known parameters from the Census Bureau's 2012 American Community Survey (ACS), which helps to ensure that the demographic characteristics of the sample closely match those of the U.S. adult population. See Appendix B for details. 132 PEW RESEARCH CENTER Education by Protestant Family, 2007 and 2014 Baptist Baptist in the evangelical tradition Baptist in the mainline tradition Baptist in the historically black Protestant tradition Methodist Methodist in the mainline tradition Methodist in the historically black Protestant tradition Nondenominational Nondenominational in the evangelical tradition Nondenominational in the mainline tradition Nondenominational in the historically black Protestant tradition Lutheran Lutheran in the evangelical tradition Lutheran in the mainline tradition Presbyterian Presbyterian in the evangelical tradition Presbyterian in the mainline tradition Pentecostal Pentecostal in the evangelical tradition Pentecostal in the historically black Protestant tradition Episcopalian/Anglican Episcopalian/Anglican in the mainline tradition Restorationist Restorationist in the evangelical tradition Restorationist in the mainline tradition Congregationalist Congregationalist in the mainline tradition Holiness Holiness in the evangelical tradition Adventist Anabaptist Less than college College graduate Total Sample size 2014 84% 16% 100% 4,936 2007 83 17 100 5,881 2014 82 18 100 3,125 2007 81 19 100 3,987 2014 87 13 100 637 2007 86 14 100 625 2014 86 14 100 1,174 2007 85 15 100 1,269 2014 67 33 100 1,984 2007 67 33 100 2,645 2014 65 35 100 1,739 2007 65 35 100 2,383 2014 78 22 100 184 2007 76 24 100 210 2014 70 30 100 2,078 2007 71 29 100 1,539 2014 70 30 100 1,599 2007 72 28 100 1,166 2014 66 34 100 375 2007 65 35 100 306 2014 83 17 100 104 2007 n/a n/a n/a n/a 2014 69 31 100 1,495 2007 72 28 100 1,916 2014 71 29 100 627 2007 74 26 100 733 2014 67 33 100 868 2007 71 29 100 1,183 2014 58 42 100 970 2007 60 40 100 1,158 2014 64 36 100 302 2007 69 31 100 318 2014 54 46 100 668 2007 56 44 100 840 2014 87 13 100 1,377 2007 89 11 100 1,336 2014 88 12 100 1,077 2007 89 11 100 1,080 2014 84 16 100 300 2007 88 12 100 256 2014 44 56 100 646 2007 47 53 100 702 2014 45 55 100 634 2007 46 54 100 668 2014 81 19 100 641 2007 78 22 100 773 2014 82 18 100 538 2007 80 20 100 617 2014 74 26 100 103 2007 66 34 100 156 2014 57 43 100 303 2007 60 40 100 345 2014 54 46 100 267 2007 57 43 100 300 2014 82 18 100 291 2007 86 14 100 409 2014 80 20 100 261 2007 85 15 100 372 2014 73 27 100 181 2007 81 19 100 150 2014 80 20 100 103 2007 n/a n/a n/a n/a Figures may not add to 100% due to rounding. Results repercentaged to exclude nonresponse. "N/A" indicates insufficient sample size. Margins of error vary based on sample size. To see approximate margins of error for groups of various sizes, see Appendix B, "Methodology." 133 PEW RESEARCH CENTER Education by Protestant Denomination, 2007 and 2014 African Methodist Episcopal Church American Baptist Churches USA Anglican Church Assemblies of God Church of God in Christ Church of God (Cleveland, Tennessee) Church of the Nazarene Churches of Christ Episcopal Church Evangelical Lutheran Church in America (ELCA) Independent Baptist (evangelical tradition) Interdenominational (evangelical tradition) Interdenominational (mainline tradition) Lutheran Church-Missouri Synod National Baptist Convention Nondenominational charismatic Nondenominational evangelical Nondenominational fundamentalist Presbyterian Church in America Presbyterian Church (USA) Seventh-day Adventist Southern Baptist Convention United Church of Christ United Methodist Church Less than college College graduate Total Sample size 2014 79% 21% 100% 117 2007 74 26 100 127 2014 88 12 100 466 2007 87 13 100 410 2014 41 59 100 110 2007 51 49 100 132 2014 85 15 100 456 2007 88 12 100 478 2014 87 13 100 164 2007 89 11 100 160 2014 89 11 100 111 2007 92 8 100 122 2014 80 20 100 101 2007 84 16 100 103 2014 82 18 100 496 2007 80 20 100 562 2014 44 56 100 489 2007 43 57 100 473 2014 64 36 100 636 2007 71 29 100 867 2014 83 17 100 822 2007 85 15 100 908 2014 70 30 100 206 2007 73 27 100 186 2014 56 44 100 139 2007 50 50 100 102 2014 68 32 100 457 2007 72 28 100 584 2014 81 19 100 459 2007 83 17 100 546 2014 74 26 100 187 2007 76 24 100 171 2014 65 35 100 682 2007 68 32 100 408 2014 75 25 100 107 2007 70 30 100 103 2014 67 33 100 156 2007 68 32 100 167 2014 53 47 100 424 2007 53 47 100 542 2014 72 28 100 164 2007 80 20 100 134 2014 81 19 100 1,833 2007 79 21 100 2,525 2014 54 46 100 227 2007 58 42 100 248 2014 63 37 100 1,631 2007 64 36 100 2,229 Figures may not add to 100% due to rounding. Results repercentaged to exclude nonresponse. Margins of error vary based on sample size. To see approximate margins of error for groups of various sizes, see Appendix B, "Methodology." 134 PEW RESEARCH CENTER Region by Religious Tradition Full Sample Protestant Evangelical tradition Mainline tradition Historically black Protestant tradition Catholic Mormon Church of Jesus Christ of Latter-day Saints Jehovah’s Witness Orthodox Christian Other Christian Jewish Muslim Buddhist Hindu Other faiths Unitarian and other liberal faiths New Age Unaffiliated Atheist Agnostic Nothing in particular Religion not important Religion important Sample size Northeast Midwest South West Total 2014 18% 21% 37% 23% 100% 35,071 2007 19 23 36 22 100 35,556 2014 13 23 47 17 100 16,592 2007 13 25 46 16 100 18,937 2014 9 22 49 20 100 8,593 2007 10 23 50 17 100 9,472 2014 18 28 37 17 100 6,083 2007 19 29 34 18 100 7,470 2014 13 18 62 7 100 1,916 2007 13 19 60 8 100 1,995 2014 26 21 27 26 100 7,202 2007 29 24 24 23 100 8,054 2014 6 7 20 67 100 664 2007 4 7 12 76 100 581 2014 5 7 20 67 100 641 2007 4 6 12 77 100 556 2014 18 17 36 29 100 245 2007 16 19 36 29 100 215 2014 33 12 27 28 100 186 2007 33 19 24 25 100 363 2014 10 17 35 38 100 159 2007 14 23 22 41 100 129 2014 42 11 27 20 100 847 2007 41 12 26 21 100 682 2014 31 23 26 20 100 237 2007 27 24 31 18 100 116 2014 17 17 23 43 100 264 2007 17 15 23 45 100 411 2014 33 10 18 38 100 199 2007 29 13 32 26 100 257 2014 22 18 30 30 100 605 2007 23 20 26 31 100 449 2014 22 18 31 30 100 425 2007 23 19 26 32 100 297 2014 20 18 31 31 100 141 2007 25 21 28 26 100 118 2014 20 21 31 28 100 7,556 2007 19 23 29 29 100 5,048 2014 24 20 26 30 100 1,098 2007 21 20 23 35 100 515 2014 21 19 29 31 100 1,474 2007 20 20 28 32 100 826 2014 19 21 33 27 100 4,984 2007 18 24 30 27 100 3,707 2014 21 21 27 31 100 2,969 2007 21 22 25 32 100 2,006 2014 16 21 40 23 100 2,015 2007 15 26 37 22 100 1,701 Figures may not add to 100% due to rounding. Those who describe their religion as "nothing in particular" are subdivided into two groups. The "religion not important" group includes those who say (in Q.F2) religion is "not too" or "not at all" important in their lives as well as those who decline to answer the question about religion's importance. The "religion important" category includes those who say religion is "very" or "somewhat" important in their lives. Margins of error vary based on sample size. To see approximate margins of error for groups of various sizes, see Appendix B, "Methodology." The demographic characteristics of the 2014 Religious Landscape Study’s overall sample were weighted to known parameters from the Census Bureau's 2012 American Community Survey (ACS), which helps to ensure that the demographic characteristics of the sample closely match those of the U.S. adult population. See Appendix B for details. 135 PEW RESEARCH CENTER Region by Protestant Family Baptist Baptist in the evangelical tradition Baptist in the mainline tradition Baptist in the historically black Protestant tradition Methodist Methodist in the mainline tradition Methodist in the historically black Protestant tradition Nondenominational Nondenominational in the evangelical tradition Nondenominational in the mainline tradition Nondenominational in the historically black Protestant tradition Lutheran Lutheran in the evangelical tradition Lutheran in the mainline tradition Presbyterian Presbyterian in the evangelical tradition Presbyterian in the mainline tradition Pentecostal Pentecostal in the evangelical tradition Pentecostal in the historically black Protestant tradition Episcopalian/Anglican Episcopalian/Anglican in the mainline tradition Restorationist Restorationist in the evangelical tradition Restorationist in the mainline tradition Congregationalist Congregationalist in the mainline tradition Holiness Holiness in the evangelical tradition Adventist Anabaptist Sample size Northeast Midwest South West Total 2014 8% 17% 65% 10% 100% 4,960 2007 8 18 65 9 100 5,914 2014 6 14 70 10 100 3,142 2007 6 16 69 9 100 4,008 2014 14 25 45 16 100 638 2007 14 24 46 16 100 628 2014 11 19 64 5 100 1,180 2007 11 19 63 7 100 1,278 2014 16 26 49 9 100 1,991 2007 17 28 46 9 100 2,657 2014 17 27 46 9 100 1,746 2007 17 29 45 9 100 2,393 2014 15 14 68 2 100 184 2007 16 22 58 5 100 210 2014 9 22 42 27 100 2,084 2007 11 23 37 30 100 1,550 2014 9 23 40 28 100 1,604 2007 11 23 36 30 100 1,177 2014 10 20 44 26 100 375 2007 11 23 32 34 100 306 2014 11 17 58 14 100 105 2007 n/a n/a n/a n/a n/a n/a 2014 13 54 16 17 100 1,504 2007 15 53 16 15 100 1,926 2014 7 57 15 20 100 630 2007 8 61 16 15 100 740 2014 17 52 16 15 100 874 2007 19 48 16 16 100 1,186 2014 18 22 36 24 100 978 2007 22 21 35 22 100 1,164 2014 16 20 38 25 100 306 2007 17 20 41 22 100 320 2014 20 24 34 23 100 672 2007 23 22 32 22 100 844 2014 14 19 46 21 100 1,388 2007 12 19 52 17 100 1,345 2014 13 19 44 24 100 1,086 2007 10 18 52 19 100 1,089 2014 17 17 55 11 100 302 2007 18 20 52 10 100 256 2014 25 14 41 20 100 652 2007 26 14 42 19 100 706 2014 25 14 41 20 100 640 2007 25 14 41 20 100 672 2014 6 27 47 20 100 644 2007 13 28 44 15 100 776 2014 6 27 47 20 100 541 2007 12 27 47 14 100 619 2014 6 28 46 20 100 103 2007 13 37 33 17 100 157 2014 40 28 20 12 100 303 2007 42 28 15 15 100 345 2014 41 26 22 11 100 267 2007 43 28 13 16 100 300 2014 13 35 36 16 100 293 2007 14 35 36 14 100 411 2014 14 38 31 18 100 263 2007 16 39 30 15 100 374 2014 18 10 43 28 100 182 2007 19 18 37 25 100 151 2014 29 35 25 11 100 103 2007 n/a n/a n/a n/a n/a n/a Figures may not add to 100% due to rounding. "N/A" indicates insufficient sample size. Margins of error vary based on sample size. To see approximate margins of error for groups of various sizes, see Appendix B, "Methodology." 136 PEW RESEARCH CENTER Region by Protestant Denomination African Methodist Episcopal Church American Baptist Churches USA Anglican Church Assemblies of God Church of God in Christ Church of God (Cleveland, Tennessee) Church of the Nazarene Churches of Christ Episcopal Church Evangelical Lutheran Church in America (ELCA) Independent Baptist (evangelical tradition) Interdenominational (evangelical tradition) Interdenominational (mainline tradition) Lutheran Church-Missouri Synod National Baptist Convention Nondenominational charismatic Nondenominational evangelical Nondenominational fundamentalist Presbyterian Church in America Presbyterian Church (USA) Seventh-day Adventist Southern Baptist Convention United Church of Christ United Methodist Church Sample size Northeast Midwest South West Total 2014 15% 9% 73% 3% 100% 117 2007 12 26 57 5 100 127 2014 16 24 43 16 100 467 2007 19 26 39 16 100 411 2014 24 12 49 15 100 111 2007 27 17 41 15 100 134 2014 14 24 37 25 100 460 2007 10 19 46 24 100 480 2014 18 17 55 10 100 165 2007 15 20 53 12 100 160 2014 11 17 61 11 100 111 2007 9 21 66 4 100 124 2014 10 35 29 26 100 101 2007 4 49 19 28 100 103 2014 5 26 49 20 100 498 2007 12 26 47 14 100 564 2014 26 14 40 21 100 494 2007 26 13 40 21 100 474 2014 16 54 17 13 100 641 2007 19 51 16 14 100 869 2014 12 19 54 15 100 825 2007 10 23 55 12 100 912 2014 9 15 49 27 100 206 2007 9 23 46 22 100 186 2014 9 18 55 17 100 139 2007 14 23 32 31 100 102 2014 7 61 16 17 100 459 2007 7 64 16 13 100 588 2014 10 19 67 4 100 462 2007 9 18 66 8 100 549 2014 8 26 46 19 100 187 2007 15 20 41 24 100 172 2014 9 25 35 30 100 684 2007 13 23 28 36 100 413 2014 12 18 43 27 100 107 2007 12 31 32 25 100 103 2014 18 15 42 25 100 158 2007 18 17 45 20 100 168 2014 17 24 38 21 100 428 2007 22 22 37 18 100 544 2014 19 10 40 31 100 165 2007 19 17 38 26 100 135 2014 2 11 80 7 100 1,845 2007 4 13 76 7 100 2,539 2014 38 28 25 9 100 227 2007 41 32 14 14 100 248 2014 16 27 47 9 100 1,637 2007 16 29 46 8 100 2,239 Figures may not add to 100% due to rounding. Margins of error vary based on sample size. To see approximate margins of error for groups of various sizes, see Appendix B, "Methodology." 137 PEW RESEARCH CENTER Family Income by Religious Tradition Full Sample Protestant Evangelical tradition Mainline tradition Historically black Protestant tradition Catholic Mormon Church of Jesus Christ of Latter-day Saints Jehovah’s Witness Orthodox Christian Other Christian Jewish Muslim Buddhist Hindu Other faiths Unitarian and other liberal faiths New Age Unaffiliated Atheist Agnostic Nothing in Particular Religion not important Religion important 2014 Less than $30,000 35% $30,000$49,999 20% $50,000$74,999 15% $75,000$99,000 12% 2007 31 22 17 13 2014 36 21 15 2007 32 23 2014 35 2007 $100,000+ Total Sample size 19% 100% 30,490 18 100 29,435 12 16 100 14,374 17 12 15 100 15,741 22 16 12 14 100 7,462 34 24 18 11 13 100 7,943 2014 29 20 14 14 23 100 5,208 2007 25 21 18 15 21 100 6,142 2014 53 22 11 7 8 100 1,704 2007 47 26 12 7 8 100 1,656 2014 36 19 14 12 19 100 6,137 2007 31 20 16 14 19 100 6,565 2014 27 20 18 16 20 100 594 2007 26 21 22 16 16 100 512 2014 27 19 18 16 20 100 574 2007 26 21 22 16 15 100 493 2014 48 25 14 8 4 100 208 2007 42 23 17 9 9 100 178 2014 18 17 19 18 29 100 155 2007 20 24 16 13 28 100 290 2014 28 25 14 11 22 100 148 2007 29 21 13 13 23 100 111 2014 16 15 11 14 44 100 708 2007 14 11 17 12 46 100 520 2014 34 17 20 9 20 100 205 2007 n/a n/a n/a n/a n/a n/a n/a 2014 36 18 19 13 13 100 233 2007 25 19 17 17 22 100 357 2014 17 13 14 20 36 100 172 2007 9 10 15 22 43 100 220 2014 38 16 15 12 19 100 542 2007 28 25 16 13 18 100 378 2014 30 17 16 14 23 100 379 2007 19 25 16 13 26 100 243 2014 54 15 12 8 11 100 128 2007 39 23 17 12 9 100 106 2014 33 20 14 12 21 100 6,790 2007 29 23 16 13 19 100 4,279 2014 24 18 16 13 30 100 1,009 2007 21 20 16 15 28 100 439 2014 22 18 15 16 29 100 1,366 2007 18 22 19 16 25 100 730 2014 38 21 13 11 17 100 4,415 2007 32 24 16 12 16 100 3,110 2014 30 22 14 13 21 100 2,650 2007 25 24 17 13 21 100 1,686 2014 47 21 12 8 12 100 1,765 2007 40 24 15 10 12 100 1,424 Figures may not add to 100% due to rounding. Results repercentaged to exclude nonresponse. "N/A" indicates insufficient sample size. Those who describe their religion as "nothing in particular" are subdivided into two groups. The "religion not important" group includes those who say (in Q.F2) religion is "not too" or "not at all" important in their lives as well as those who decline to answer the question about religion's importance. The "religion important" category includes those who say religion is "very" or "somewhat" important in their lives. Margins of error vary based on sample size. To see approximate margins of error for groups of various sizes, see Appendix B, "Methodology." The demographic characteristics of the 2014 Religious Landscape Study’s overall sample were weighted to known parameters from the Census Bureau's 2012 American Community Survey (ACS), which helps to ensure that the demographic characteristics of the sample closely match those of the U.S. adult population. See Appendix B for details. 138 PEW RESEARCH CENTER Family Income by Protestant Family Baptist Baptist in the evangelical tradition Baptist in the mainline tradition Baptist in the historically black Protestant tradition Methodist Methodist in the mainline tradition Methodist in the historically black Protestant tradition Nondenominational Nondenominational in the evangelical tradition Nondenominational in the mainline tradition Nondenominational in the historically black Protestant tradition Lutheran Lutheran in the evangelical tradition Lutheran in the mainline tradition Presbyterian Presbyterian in the evangelical tradition Presbyterian in the mainline tradition Pentecostal Pentecostal in the evangelical tradition Pentecostal in the historically black Protestant tradition Episcopalian/Anglican Episcopalian/Anglican in the mainline tradition Restorationist Restorationist in the evangelical tradition Restorationist in the mainline tradition Congregationalist Congregationalist in the mainline tradition Holiness Holiness in the evangelical tradition Adventist Anabaptist Less than $30,000 $30,000$49,999 $50,000$74,999 $75,000$99,000 $100,000+ Total Sample size 2014 42% 22% 14% 10% 12% 100% 4,342 2007 39 25 16 9 11 100 4,961 2014 35 22 17 12 14 100 2,744 2007 34 25 18 10 13 100 3,356 2014 50 21 11 9 9 100 543 2007 44 22 14 9 10 100 528 2014 56 21 9 7 7 100 1,055 2007 50 25 11 6 8 100 1,077 2014 26 21 16 14 22 100 1,714 2007 25 22 18 15 20 100 2,215 2014 24 20 16 15 25 100 1,514 2007 23 21 19 15 21 100 1,998 2014 42 24 14 12 7 100 156 2007 41 24 14 9 12 100 173 2014 27 22 18 14 19 100 1,846 2007 24 21 21 15 18 100 1,354 2014 26 22 19 14 19 100 1,433 2007 25 21 22 15 18 100 1,021 2014 22 21 16 15 26 100 322 2007 23 20 18 16 23 100 277 2014 n/a n/a n/a n/a n/a n/a n/a 2007 n/a n/a n/a n/a n/a n/a n/a 2014 24 21 16 16 23 100 1,283 2007 23 22 21 17 16 100 1,571 2014 26 21 17 16 20 100 533 2007 24 22 21 17 17 100 597 2014 23 21 15 16 25 100 750 2007 23 23 21 17 16 100 974 2014 24 16 20 13 27 100 835 2007 21 19 18 16 26 100 961 2014 28 18 19 14 21 100 259 2007 30 21 16 13 20 100 278 2014 21 16 20 13 31 100 576 2007 17 18 19 18 29 100 683 2014 49 23 12 8 8 100 1,209 2007 45 25 14 8 7 100 1,135 2014 51 22 12 8 7 100 940 2007 45 25 15 8 7 100 919 2014 45 25 11 6 13 100 269 2007 48 25 12 8 7 100 216 2014 19 14 12 19 36 100 574 2007 18 19 11 17 35 100 580 2014 19 14 13 19 36 100 564 2007 17 19 12 17 35 100 556 2014 37 23 14 9 16 100 560 2007 38 22 17 11 12 100 650 2014 38 23 15 8 16 100 468 2007 39 23 17 11 11 100 529 2014 n/a n/a n/a n/a n/a n/a n/a 2007 33 15 18 14 21 100 121 2014 30 14 14 14 29 100 264 2007 26 19 20 15 21 100 280 2014 28 16 14 11 31 100 236 2007 24 19 20 15 23 100 239 2014 43 21 14 15 7 100 260 2007 41 26 18 8 7 100 331 2014 38 22 15 18 8 100 231 2007 40 25 18 10 7 100 304 2014 37 24 14 10 15 100 156 2007 47 25 11 7 10 100 129 2014 n/a n/a n/a n/a n/a n/a n/a 2007 n/a n/a n/a n/a n/a n/a n/a Figures may not add to 100% due to rounding. Results repercentaged to exclude nonresponse. "N/A" indicates insufficient sample size. Margins of error vary based on sample size. To see approximate margins of error for groups of various sizes, see Appendix B, "Methodology." 139 PEW RESEARCH CENTER Family Income by Protestant Denomination African Methodist Episcopal Church American Baptist Churches USA Anglican Church Assemblies of God Church of God in Christ Church of God (Cleveland, Tennessee) Church of the Nazarene Churches of Christ Episcopal Church Evangelical Lutheran Church in America (ELCA) Independent Baptist (evangelical tradition) Interdenominational (evangelical tradition) Interdenominational (mainline tradition) Lutheran Church-Missouri Synod National Baptist Convention Nondenominational charismatic Nondenominational evangelical Nondenominational fundamentalist Presbyterian Church in America Presbyterian Church (USA) Seventh-day Adventist Southern Baptist Convention United Church of Christ United Methodist Church Less than $30,000 $30,000$49,999 $50,000$74,999 $75,000$99,000 $100,000+ Total % % % % % % 2014 n/a n/a n/a n/a n/a n/a n/a 2007 40 24 13 9 14 100 108 2014 53 18 12 9 9 100 400 2007 46 22 16 9 8 100 354 2014 n/a n/a n/a n/a n/a n/a n/a 2007 17 16 12 15 39 100 113 2014 43 23 13 11 10 100 398 2007 41 26 15 11 8 100 415 2014 46 26 12 7 9 100 148 2007 46 27 10 8 9 100 134 2014 n/a n/a n/a n/a n/a n/a n/a 2007 41 27 19 6 8 100 100 2014 n/a n/a n/a n/a n/a n/a n/a 2007 n/a n/a n/a n/a n/a n/a n/a 2014 37 23 15 8 16 100 434 2007 37 24 17 11 11 100 483 2014 19 13 14 20 35 100 435 2007 16 19 11 18 35 100 394 2014 19 22 15 17 26 100 547 2007 24 24 21 15 17 100 713 2014 39 22 16 11 12 100 724 2007 37 25 17 11 11 100 798 2014 23 27 20 14 16 100 181 2007 31 18 19 15 17 100 167 2014 23 21 12 19 26 100 123 2007 n/a n/a n/a n/a n/a n/a n/a 2014 22 21 17 17 22 100 390 2007 24 20 20 18 17 100 478 2014 49 21 12 9 9 100 417 2007 46 29 12 6 7 100 474 2014 31 19 11 17 22 100 171 2007 22 23 26 17 11 100 153 2014 23 21 18 16 21 100 622 2007 15 22 21 18 25 100 360 2014 n/a n/a n/a n/a n/a n/a n/a 2007 n/a n/a n/a n/a n/a n/a n/a 2014 27 17 16 15 25 100 132 2007 34 20 16 12 18 100 147 2014 24 15 17 12 32 100 371 2007 16 19 19 18 28 100 452 2014 37 24 14 10 15 100 142 2007 46 26 10 7 11 100 115 2014 32 22 17 13 16 100 1,613 2007 30 25 19 11 15 100 2,107 2014 31 16 13 10 29 100 202 2007 27 20 21 14 18 100 197 2014 23 20 16 15 26 100 1,427 2007 23 21 19 16 22 100 1,876 Sample size Figures may not add to 100% due to rounding. Results repercentaged to exclude nonresponse. "N/A" indicates insufficient sample size. Margins of error vary based on sample size. To see approximate margins of error for groups of various sizes, see Appendix B, "Methodology." 140 PEW RESEARCH CENTER Marital Status by Religious Tradition Full sample Protestant Evangelical tradition Mainline tradition Historically black Protestant tradition Catholic Mormon Church of Jesus Christ of Latter-day Saints Orthodox Christian Jehovah’s Witness Other Christian Jewish Muslim Buddhist Hindu Other faiths Unitarian and other liberal faiths New Age Unaffiliated Atheist Agnostic Nothing in particular Religion not important Religion important Married Living with a partner Divorced/separated Widowed Never been married Total Sample size 2014 48% 7% 13% 7% 25% 100% 34,891 2007 54 6 12 8 19 100 35,308 2014 52 5 14 8 20 100 16,517 2007 55 5 13 10 17 100 18,822 2014 55 5 14 8 18 100 8,562 2007 59 5 13 9 14 100 9,419 2014 55 6 12 9 18 100 6,048 2007 57 5 12 11 15 100 7,421 2014 31 6 19 9 36 100 1,907 2007 33 6 16 11 34 100 1,982 2014 52 8 12 7 21 100 7,176 2007 58 7 10 8 17 100 8,013 2014 66 3 7 5 19 100 661 2007 71 3 9 5 12 100 576 2014 66 3 7 5 18 100 638 2007 71 3 9 5 12 100 552 2014 48 5 9 6 31 100 182 2007 58 3 9 7 22 100 360 2014 53 5 12 8 21 100 244 2007 53 1 14 11 20 100 213 2014 41 7 30 5 16 100 158 2007 49 10 19 6 15 100 129 2014 56 6 9 6 23 100 843 2007 57 6 9 8 19 100 676 2014 41 4 8 1 45 100 234 2007 50 6 15 1 28 100 116 2014 39 11 10 2 37 100 263 2007 45 8 12 4 31 100 410 2014 60 3 5 1 32 100 198 2007 79 0 5 2 14 100 256 2014 33 16 19 3 29 100 604 2007 44 9 15 5 26 100 447 2014 34 15 18 4 29 100 424 2007 48 10 14 7 22 100 296 2014 29 20 19 2 30 100 141 2007 38 8 19 1 34 100 117 2014 37 11 11 3 37 100 7,523 2007 46 10 12 4 28 100 5,005 2014 36 13 9 2 40 100 1,093 2007 39 11 10 3 37 100 504 2014 35 11 11 2 41 100 1,470 2007 41 10 10 3 36 100 824 2014 38 11 12 3 35 100 4,960 2007 48 10 12 4 26 100 3,677 2014 39 10 11 3 37 100 2,957 2007 49 11 11 3 26 100 1,989 2014 37 13 13 4 32 100 2,003 2007 47 10 13 4 25 100 1,688 Figures may not add to 100% due to rounding. Results repercentaged to exclude nonresponse. Those who describe their religion as "nothing in particular" are subdivided into two groups. The "religion not important" group includes those who say (in Q.F2) religion is "not too" or "not at all" important in their lives as well as those who decline to answer the question about religion's importance. The "religion important" category includes those who say religion is "very" or "somewhat" important in their lives. Margins of error vary based on sample size. To see approximate margins of error for groups of various sizes, see Appendix B, "Methodology." The demographic characteristics of the 2014 Religious Landscape Study’s overall sample were weighted to known parameters from the Census Bureau's 2012 American Community Survey (ACS), which helps to ensure that the demographic characteristics of the sample closely match those of the U.S. adult population. See Appendix B for details. 141 PEW RESEARCH CENTER Marital Status by Protestant Family Baptist Baptist in the evangelical tradition Baptist in the mainline tradition Baptist in the historically black Protestant tradition Methodist Methodist in the mainline tradition Methodist in the historically black Protestant tradition Nondenominational Nondenominational in the evangelical tradition Nondenominational in the mainline tradition Nondenominational in the historically black Protestant tradition Lutheran Lutheran in the evangelical tradition Lutheran in the mainline tradition Presbyterian Presbyterian in the evangelical tradition Presbyterian in the mainline tradition Pentecostal Pentecostal in the evangelical tradition Pentecostal in the historically black Protestant tradition Episcopalian/Anglican Episcopalian/Anglican in the mainline tradition Restorationist Restorationist in the evangelical tradition Restorationist in the mainline tradition Congregationalist Congregationalist in the mainline tradition Holiness Holiness in the evangelical tradition Adventist Anabaptist Married Living with a partner Divorced/separated Widowed Never been married Total Sample size 2014 48% 5% 16% 10% 21% 100% 4,942 2007 51 5 14 11 18 100 5,885 2014 58 5 14 10 14 100 3,133 2007 60 4 13 10 12 100 3,987 2014 43 7 15 11 24 100 634 2007 49 8 16 12 16 100 626 2014 28 6 19 10 36 100 1,175 2007 30 7 16 13 34 100 1,272 2014 57 5 13 12 13 100 1,985 2007 58 4 12 12 13 100 2,646 2014 60 5 13 12 11 100 1,740 2007 61 4 11 11 12 100 2,385 2014 31 7 21 10 31 100 184 2007 34 7 15 17 26 100 207 2014 53 5 14 4 24 100 2,080 2007 60 6 13 4 17 100 1,537 2014 55 4 14 4 22 100 1,601 2007 63 5 12 4 16 100 1,166 2014 51 8 12 3 26 100 375 2007 53 9 15 3 20 100 305 2014 29 4 17 3 47 100 104 2007 n/a n/a n/a n/a n/a n/a n/a 2014 59 5 10 9 16 100 1,497 2007 60 4 11 12 13 100 1,918 2014 59 5 9 11 16 100 627 2007 60 5 11 13 12 100 736 2014 59 5 11 9 17 100 870 2007 60 3 11 12 13 100 1,182 2014 61 4 12 10 13 100 975 2007 58 3 11 15 14 100 1,152 2014 59 4 12 8 17 100 303 2007 55 2 10 17 17 100 318 2014 62 3 12 12 11 100 672 2007 60 3 12 14 12 100 834 2014 48 5 19 7 21 100 1,382 2007 54 4 16 8 17 100 1,338 2014 49 6 18 8 19 100 1,082 2007 58 4 15 8 14 100 1,084 2014 42 2 20 6 31 100 300 2007 39 4 19 7 30 100 254 2014 58 4 12 8 18 100 649 2007 55 4 12 11 17 100 706 2014 58 4 11 8 18 100 637 2007 55 4 12 11 18 100 672 2014 55 4 13 9 20 100 644 2007 52 6 13 12 18 100 773 2014 53 4 13 9 21 100 541 2007 51 6 12 11 19 100 616 2014 67 1 11 10 12 100 103 2007 56 3 13 14 14 100 157 2014 61 6 13 9 12 100 303 2007 55 6 11 15 13 100 342 2014 64 5 11 9 12 100 267 2007 56 6 11 14 13 100 298 2014 53 5 14 11 17 100 293 2007 56 5 13 12 16 100 410 2014 56 6 14 10 14 100 263 2007 57 5 12 12 14 100 373 2014 53 5 14 7 21 100 180 2007 50 10 11 6 23 100 151 2014 77 2 5 4 13 100 103 2007 n/a n/a n/a n/a n/a n/a n/a Figures may not add to 100% due to rounding. Results repercentaged to exclude nonresponse. "N/A" indicates insufficient sample size. Margins of error vary based on sample size. To see approximate margins of error for groups of various sizes, see Appendix B, "Methodology." 142 PEW RESEARCH CENTER Marital Status by Protestant Denomination Married African Methodist Episcopal Church American Baptist Churches USA Anglican Church Assemblies of God Church of God in Christ Church of God (Cleveland, Tennessee) Church of the Nazarene Churches of Christ Episcopal Church Evangelical Lutheran Church in America (ELCA) Independent Baptist (evangelical tradition) Interdenominational (evangelical tradition) Interdenominational (mainline tradition) Lutheran Church-Missouri Synod National Baptist Convention Nondenominational charismatic Nondenominational evangelical Nondenominational fundamentalist Presbyterian Church in America Presbyterian Church (USA) Seventh-day Adventist Southern Baptist Convention United Church of Christ United Methodist Church Living with a partner Divorced/separated Widowed Never been married Total Sample size 2014 32% 6% 22% 9% 30% 100% 117 2007 39 2 16 16 27 100 125 2014 43 6 16 12 23 100 465 2007 49 9 16 12 14 100 411 2014 61 1 10 8 19 100 110 2007 55 3 15 14 13 100 134 2014 57 5 16 9 13 100 457 2007 64 5 12 8 10 100 478 2014 42 2 20 4 33 100 164 2007 39 6 19 6 30 100 158 2014 59 7 14 8 12 100 111 2007 60 0 13 13 13 100 124 2014 57 8 14 7 14 100 101 2007 65 6 14 12 3 100 102 2014 53 4 12 9 21 100 498 2007 52 6 13 11 18 100 561 2014 59 5 12 8 16 100 492 2007 55 5 11 10 18 100 474 2014 62 4 9 9 16 100 639 2007 63 3 10 13 11 100 865 2014 58 7 15 7 13 100 822 2007 62 5 12 9 12 100 910 2014 50 3 22 5 20 100 206 2007 57 6 18 7 13 100 185 2014 55 5 17 5 18 100 139 2007 53 4 14 5 25 100 102 2014 59 4 9 12 15 100 457 2007 60 5 11 13 11 100 586 2014 35 2 22 13 26 100 460 2007 35 7 16 15 26 100 547 2014 51 4 15 3 26 100 186 2007 66 6 10 5 13 100 169 2014 64 4 10 3 19 100 684 2007 68 4 9 4 16 100 412 2014 60 2 17 4 17 100 107 2007 61 4 18 7 10 100 103 2014 57 6 13 11 14 100 157 2007 57 2 10 16 16 100 166 2014 64 1 11 12 12 100 428 2007 62 3 10 14 10 100 539 2014 51 5 13 8 23 100 164 2007 48 10 11 7 25 100 135 2014 60 3 13 10 13 100 1,843 2007 61 4 13 10 13 100 2,525 2014 64 5 8 9 14 100 227 2007 55 6 11 15 13 100 246 2014 61 5 12 12 10 100 1,632 2007 62 4 11 12 12 100 2,231 Figures may not add to 100% due to rounding. Results repercentaged to exclude nonresponse. Margins of error vary based on sample size. To see approximate margins of error for groups of various sizes, see Appendix B, "Methodology." 143 PEW RESEARCH CENTER Religious Affiliation by State in the Northeast Evangelical tradition Total United States Northeast Connecticut Maine Massachusetts New Hampshire New Jersey New York Pennsylvania Rhode Island Vermont Mainline tradition Historically black Protestant tradition Catholic Mormon Orthodox Christian Jehovah's Witness Other Christian Jewish Muslim Buddhist Hindu Other world religions Other faiths Unaffiliated DK/Ref. Total Sample size % % % % % % % % % % % % % % % % % 2014 25 15 6 21 2 * 1 * 2 1 1 1 * 2 23 1 100 35,071 2007 26 18 7 24 2 1 1 * 2 * 1 * * 1 16 1 100 35,556 2014 13 15 5 30 1 1 1 * 4 1 1 1 * 2 25 1 100 6,516 2007 13 19 5 37 * 1 1 * 4 1 1 1 * 1 16 1 100 6,556 2014 13 17 5 33 1 1 * 1 3 1 1 1 * 2 23 1 100 377 2007 9 13 4 43 1 1 1 * 1 * * * * 2 22 1 100 369 2014 14 21 2 21 2 * * 1 2 * 1 * * 5 31 2 100 303 2007 15 26 * 29 1 * 1 * * * 1 * * 2 25 * 100 245 2014 9 10 2 34 1 1 * * 3 1 1 1 * 2 32 1 100 704 2007 11 15 2 43 * 1 * * 3 * 1 1 * 2 17 1 100 748 2014 13 16 1 26 1 * 2 * 2 * * * * 3 36 * 100 303 2007 14 19 * 29 1 * * * 2 * 1 * * 6 27 * 100 189 2014 13 12 6 34 1 1 1 * 6 3 * 3 1 1 18 1 100 886 2007 12 13 5 42 * 1 * * 6 1 1 2 * 1 12 2 100 932 2014 10 11 5 31 * 1 1 * 7 2 1 1 * 2 27 1 100 1,966 2007 11 16 5 39 * 1 1 * 6 1 1 1 * 1 17 1 100 1,933 2014 19 23 5 24 * * 1 * 1 1 * 1 * 2 21 1 100 1,366 2007 18 25 7 29 * 1 1 * 2 * * * * 1 13 1 100 1,896 2014 14 14 2 42 1 * 2 * 1 * * 1 1 1 20 1 100 305 2007 n/a n/a n/a n/a n/a n/a n/a n/a n/a n/a n/a n/a n/a n/a n/a n/a n/a n/a 2014 11 19 * 22 * 1 * * 2 * 1 1 1 3 37 2 100 306 2007 n/a n/a n/a n/a n/a n/a n/a n/a n/a n/a n/a n/a n/a n/a n/a n/a n/a n/a Figures may not add to 100% due to rounding. "N/A" indicates insufficient sample size. Margins of error vary based on sample size. To see approximate margins of error for groups of various sizes, see Appendix B, "Methodology." 144 PEW RESEARCH CENTER Religious Affiliation by State in the Midwest Evangelical tradition Total United States Midwest Illinois Indiana Iowa Kansas Michigan Minnesota Missouri Nebraska North Dakota Ohio South Dakota Wisconsin Mainline tradition Historically black Protestant tradition Catholic Mormon Orthodox Christian Jehovah's Witness Other Christian Jewish Muslim Buddhist Hindu Other world religions Other faiths Unaffiliated DK/Ref. Total Sample size % % % % % % % % % % % % % % % % % 2014 25 15 6 21 2 * 1 * 2 1 1 1 * 2 23 1 100 35,071 2007 26 18 7 24 2 1 1 * 2 * 1 * * 1 16 1 100 35,556 2014 26 19 5 21 1 * 1 * 1 1 1 * * 1 22 1 100 7,491 2007 26 22 6 24 1 * 1 * 1 * * * * 1 16 1 100 9,078 2014 20 16 7 28 * 1 1 * 2 1 1 1 * 1 22 1 100 1,326 2007 19 17 9 32 * 1 1 * 2 * 1 1 * 1 15 1 100 1,340 2014 31 16 5 18 1 * * * 1 * * * * 1 26 * 100 654 2007 34 22 6 18 1 * 1 * 1 * * * * * 16 * 100 924 2014 28 30 2 18 * * * * * 1 * * * * 21 1 100 330 2007 24 30 1 25 1 * * * 1 * * * * 1 15 1 100 487 2014 31 24 2 18 1 * 1 * * 1 1 * * 2 20 * 100 307 2007 29 27 3 23 1 * * * * * * * * 1 14 1 100 421 2014 25 18 8 18 * * 1 1 1 1 1 * * 1 24 1 100 982 2007 26 19 8 23 1 * 1 * 1 1 1 * * 1 17 1 100 1,275 2014 19 29 2 22 1 * * * 1 1 * * 1 1 20 2 100 563 2007 21 32 1 28 * * * * 1 1 1 * * 1 13 * 100 789 2014 36 16 6 16 1 * * * * * 1 * * 1 20 * 100 642 2007 37 18 6 18 1 * 1 * 1 * * * * 1 16 * 100 879 2014 25 24 2 23 1 * * * * * 1 1 * 1 20 1 100 312 2007 21 27 3 31 * * * * * * * * * 1 16 * 100 247 2014 22 28 1 26 * * * * * 1 * * * 2 20 * 100 338 2007 n/a n/a n/a n/a n/a n/a n/a n/a n/a n/a n/a n/a n/a n/a n/a n/a n/a n/a 2014 29 17 7 18 1 * 1 * 1 1 1 * * 2 22 * 100 1,132 2007 26 22 7 21 * 1 1 * 1 1 * * * 1 17 1 100 1,654 2014 25 32 * 22 * * * * * * 1 * * 2 18 * 100 305 2007 n/a n/a n/a n/a n/a n/a n/a n/a n/a n/a n/a n/a n/a n/a n/a n/a n/a n/a 2014 22 18 4 25 * 1 1 * 1 1 * * * 1 25 * 100 600 2007 24 23 3 29 * 1 * 1 * * * * * 1 16 1 100 824 Figures may not add to 100% due to rounding. "N/A" indicates insufficient sample size. Margins of error vary based on sample size. To see approximate margins of error for groups of various sizes, see Appendix B, "Methodology." 145 PEW RESEARCH CENTER Religious Affiliation by State in the West Total United States West Alaska Arizona California Colorado Hawaii Idaho Montana Nevada New Mexico Oregon Utah Washington Wyoming Evangelical tradition Mainline tradition Historically black Protestant tradition 2014 % 25 % 15 % 6 % 21 % 2 % * % 1 % * % 2 % 1 % 1 % 1 % * % 2 % 23 % 1 % 100 35,071 2007 26 18 7 24 2 1 1 * 2 * 1 * * 1 16 1 100 35,556 2014 22 11 2 23 5 1 1 1 2 1 1 1 * 2 28 1 100 8,498 2007 20 15 3 25 6 1 1 1 2 * 2 * * 2 21 1 100 7,279 2014 22 12 3 16 5 5 * * * * 1 * 1 4 31 1 100 310 2007 26 19 2 14 4 3 * 1 * 1 * * * 2 27 1 100 200 2014 26 12 1 21 5 * 1 * 2 1 1 1 * 2 27 * 100 653 2007 23 15 2 25 4 * 1 * 1 * 1 * * 2 22 2 100 578 2014 20 10 2 28 1 1 1 1 2 1 2 2 1 2 27 1 100 3,697 2007 18 14 4 31 2 1 1 1 2 * 2 1 * 2 21 1 100 3,574 2014 26 15 2 16 2 1 * 1 1 * 1 * * 2 29 2 100 504 2007 23 19 2 19 2 1 * 1 2 * 1 * 1 2 25 2 100 590 2014 25 11 2 20 3 * 1 1 * * 8 * * 1 26 1 100 312 2007 26 18 * 22 5 * 2 * * * 6 1 * 2 17 * 100 201 2014 21 16 * 10 19 1 * * * 1 * * * 2 27 1 100 320 2007 22 16 * 18 23 * 1 * * * * * * 2 18 * 100 196 2014 28 14 * 17 4 1 1 * * * 1 * * 4 30 * 100 312 2007 23 24 * 23 4 * 2 * * * * * * 2 22 * 100 190 2014 20 10 5 25 4 1 1 * 2 * * * * 3 28 1 100 314 2007 13 11 2 27 11 2 * 1 1 2 * 1 1 3 21 2 100 252 2014 23 14 1 34 2 * 1 * * * 1 * * 2 21 * 100 312 2007 25 15 2 26 2 * 2 * 2 * 2 * * 1 21 1 100 228 2014 29 13 1 12 4 1 * 1 2 1 * * 1 3 31 1 100 419 2007 30 16 1 14 5 * * 1 1 * 2 * * 2 27 * 100 521 2014 7 6 * 5 55 * * * * 1 1 * * 2 22 1 100 315 2007 7 6 1 10 58 * * * * * * * * 1 16 1 100 323 2014 25 13 2 17 3 * 2 1 1 * 1 1 * 3 32 1 100 714 2007 25 23 1 16 2 * 1 1 1 * 1 * * 1 23 2 100 745 2014 27 16 * 14 9 * 3 1 * * 1 * * 3 26 * 100 316 2007 n/a n/a n/a n/a n/a n/a n/a n/a n/a n/a n/a n/a n/a n/a n/a n/a n/a n/a Catholic Mormon Orthodox Christian Jehovah's Witness Other Christian Jewish Muslim Buddhist Hindu Other world religions Other faiths Unaffiliated DK/Ref. Total Sample size Figures may not add to 100% due to rounding. "N/A" indicates insufficient sample size. Margins of error vary based on sample size. To see approximate margins of error for groups of various sizes, see Appendix B, "Methodology." 146 PEW RESEARCH CENTER Religious Affiliation by State in the South Evangelical tradition Mainline tradition Historically black Protestant tradition Unaffiliated DK/Ref. Total % % % % % % % % % % % % % % % % % 2014 25 15 6 21 2 * 1 * 2 1 1 1 * 2 23 1 100 35,071 2007 26 18 7 24 2 1 1 * 2 * 1 * * 1 16 1 100 35,556 2014 34 14 11 15 1 * 1 * 1 1 * * * 1 19 * 100 12,566 2007 37 17 11 16 1 * 1 * 1 * * * * 1 13 1 100 12,643 2014 49 13 16 7 1 * * * * * * * * 1 12 1 100 511 2007 49 15 18 6 * * 1 * * * * * * 1 8 1 100 681 2014 46 16 8 8 1 * * * * 2 * * * 1 18 * 100 311 2007 53 16 10 5 * * 1 1 * * * * * * 13 * 100 378 2014 15 21 10 22 * 1 * * 3 1 * 2 * 1 23 1 100 301 2007 n/a n/a n/a n/a n/a n/a n/a n/a n/a n/a n/a n/a n/a n/a n/a n/a n/a n/a 2014 8 10 23 20 2 1 * * 5 2 * 1 * 1 25 1 100 303 2007 n/a n/a n/a n/a n/a n/a n/a n/a n/a n/a n/a n/a n/a n/a n/a n/a n/a n/a 2014 24 14 8 21 1 * 1 1 3 * * * * 2 24 * 100 2,020 2007 25 15 8 26 * 1 1 * 3 1 * * * 1 16 1 100 1,694 2014 38 12 17 9 1 * 2 * 1 * * * * 2 18 1 100 968 2007 38 16 16 12 1 * 1 * 1 * * * * * 13 * 100 967 2014 49 11 5 10 * * * * * * * * * 2 22 * 100 439 2007 49 17 5 14 * * * * * * * * * 1 12 1 100 599 2014 27 8 22 26 * * 1 1 * * 1 * * 1 13 * 100 465 2007 31 9 20 28 * * 1 * * 1 1 * * * 8 * 100 528 2014 18 18 16 15 1 1 * 1 3 1 1 1 * 2 23 * 100 644 2007 15 22 17 19 * * 1 * 5 1 1 1 * 1 17 1 100 677 Mississippi 2014 41 12 24 4 1 * * * * * * * * 1 14 1 100 309 North Carolina 2007 2014 47 35 11 19 23 12 9 9 1 1 * 1 1 1 * * * 1 * * * * * * * * 1 1 6 20 1 * 100 100 333 1,022 Total United States South Alabama Arkansas Delware District of Columbia Florida Georgia Kentucky Louisiana Maryland Catholic Mormon Orthodox Christian Jehovah's Witness Other Christian Jewish Muslim Buddhist Hindu Other world religions Other faiths Sample size 2007 41 21 13 9 * * * * * * 1 * * 1 12 1 100 1,166 Oklahoma 2014 47 18 4 8 1 * * * * * * * * 1 18 1 100 391 South Carolina 2007 2014 53 35 16 16 3 15 12 10 * 1 * 1 * 1 * * * 1 * * 1 * * * * * 1 1 12 19 1 1 100 100 465 495 2007 45 18 15 8 * 1 1 * 1 * * * * 1 10 * 100 570 2014 52 13 8 6 1 * 1 * 1 1 1 * * 1 14 1 100 661 2007 51 18 8 7 1 * * * * 1 * * * 1 12 1 100 837 2014 31 13 6 23 1 * 1 1 1 1 1 * * 1 18 * 100 2,535 2007 34 15 8 24 1 * 1 * 1 * 1 1 * 1 12 * 100 2,266 2014 30 16 12 12 2 1 * * 1 1 1 * * 1 20 * 100 882 2007 31 20 10 14 1 1 * * 1 * 1 1 * 1 18 1 100 997 2014 39 29 2 6 2 * * * 1 1 * * * 1 18 1 100 309 2007 36 32 2 7 * * * * 1 * * 1 0 0 19 1 100 296 Tennessee Texas Virginia West Virginia Figures may not add to 100% due to rounding. "N/A" indicates insufficient sample size. Margins of error vary based on sample size. To see approximate margins of error for groups of various sizes, see Appendix B, "Methodology." 147 PEW RESEARCH CENTER Religious Affiliation by Metro Area Evangelical tradition Mainline tradition Historically black Protestant tradition Unaffiliated DK/Ref. Total % % % % % % % % % % % % % % % % % Catholic Mormon Orthodox Christian Jehovah's Witness Other Christian Jewish Muslim Buddhist Hindu Other world religions Other faiths Sample size 25 15 6 21 2 * 1 * 2 1 1 1 * 2 23 1 100 35,071 Atlanta 33 12 18 11 1 * 1 * 1 * * * * 1 20 1 100 510 Boston 9 13 3 29 * 2 * 1 4 1 1 1 * 2 33 1 100 498 Chicago 16 11 8 34 * 1 1 1 3 2 1 1 1 1 22 1 100 867 Dallas 38 14 7 15 1 * 1 1 1 1 * * * 2 18 * 100 659 Detroit 20 14 15 16 * * 1 * 2 3 1 * * 2 24 1 100 374 Houston 30 11 9 19 1 1 1 1 2 1 1 1 * 1 20 * 100 514 Los Angeles 18 9 3 32 * 1 1 1 3 2 2 1 * 1 25 1 100 1,076 Miami 20 11 8 27 * * 1 1 9 * * * * * 21 * 100 483 Minneapolis 15 27 4 21 1 1 1 * 1 * 1 * 1 1 23 2 100 342 New York City 9 8 6 33 * 1 1 * 8 3 1 3 1 1 24 1 100 1,786 Philadelphia 13 17 11 26 * * 1 * 3 1 1 1 * 1 24 1 100 722 Phoenix 25 11 1 21 6 * 1 1 1 1 1 2 * 2 26 * 100 397 Riverside 30 10 3 22 3 1 2 * * * * * 1 2 25 1 100 373 San Diego 14 16 2 32 2 * 3 * 2 * 1 1 * 1 27 * 100 321 San Francisco 10 6 4 25 1 1 * 1 3 1 2 5 1 3 35 2 100 485 Seattle 23 10 1 15 1 * 1 1 1 * 2 2 * 4 37 1 100 333 Washington, D.C. 14 15 12 19 1 2 * 1 4 2 2 1 * 2 24 1 100 913 Total United States Figures may not add to 100% due to rounding. Margins of error vary based on sample size. To see approximate margins of error for groups of various sizes, see Appendix B, "Methodology." 148 PEW RESEARCH CENTER PEW RESEARCH CENTER 2014 RELIGIOUS LANDSCAPE STUDY (RLS-II) FINAL TOPLINE June 4-September 30, 2014 N=35,071 Note: figures may not sum to 100, and nested figures may not sum to subtotals indicated, due to rounding. Some questions held for future release. Now I have some background questions… ASK ALL: MARITAL Are you currently married, living with a partner, divorced, separated, widowed, or have you never been married? [IF R SAYS “SINGLE,” PROBE TO DETERMINE WHICH CATEGORY IS APPROPRIATE] Living Never Divorced/ with a been Sample size Married partner separated Widowed married Total 48 7 13 7 25 100 34,891 Total Answering 2014 54 6 12 8 19 100 35,308 2007 Evangelical tradition 2014 55 5 14 8 18 100 8,562 59 5 13 9 14 100 9,419 2007 55 6 12 9 18 100 6,048 Mainline tradition 2014 2007 57 5 12 11 15 100 7,421 31 6 19 9 36 100 1,907 Historically black Protestant trad. 2014 33 6 16 11 34 100 1,982 2007 52 8 12 7 21 100 7,176 Catholic 2014 2007 58 7 10 8 17 100 8,013 66 3 7 5 19 100 661 Mormon 2014 71 3 9 5 12 100 576 2007 48 5 9 6 31 100 182 Orthodox Christian 2014 58 3 9 7 22 100 360 2007 53 5 12 8 21 100 244 Jehovah’s Witness 2014 53 1 14 11 20 100 213 2007 41 7 30 5 16 100 158 Other Christian 2014 49 10 19 6 15 100 129 2007 56 6 9 6 23 100 843 Jewish 2014 57 6 9 8 19 100 676 2007 41 4 8 1 45 100 234 Muslim 2014 50 6 15 1 28 100 116 2007 39 11 10 2 37 100 263 Buddhist 2014 45 8 12 4 31 100 410 2007 60 3 5 1 32 100 198 Hindu 2014 79 0 5 2 14 100 256 2007 33 16 19 3 29 100 604 Other faiths 2014 44 9 15 5 26 100 447 2007 37 11 11 3 37 100 7,523 Unaffiliated 2014 46 10 12 4 28 100 5,005 2007 Based on total answering. Results recalculated to exclude non-response. In 2007 interviewers were not instructed to probe “single” responses. www.pewresearch.org 149 PEW RESEARCH CENTER ASK ALL: HISP Are you of Hispanic, Latino, or Spanish origin, such as Mexican, Puerto Rican or Cuban? ASK ALL: RACE Which of the following describes your race? You can select as many as apply. White, Black or African American, Asian or Asian American or some other race. [RECORD UP TO FOUR IN ORDER MENTIONED BUT DO NOT PROBE FOR ADDITIONAL; NAME FIRST MENTION RACE_1, SECOND MENTION RACE_2, THIRD MENTION RACE_3, FOURTH MENTION RACE_4] [IF R VOLS MIXED BIRACIAL, PROBE ONCE: What race or races is that?] Total Answering Evangelical tradition Mainline tradition Historically black Protestant trad. Catholic Mormon Orthodox Christian Jehovah’s Witness Other Christian Jewish Muslim Buddhist Hindu Other faiths Unaffiliated 2014 2007 2014 2007 2014 2007 2014 2007 2014 2007 2014 2007 2014 2007 2014 2007 2014 2007 2014 2007 2014 2007 2014 2007 2014 2007 2014 2007 2014 2007 ------------------------Non-Latino------------------Black or Asian or Mixed race/ AfricanAsianor some White American American other race 66 12 4 4 71 11 3 3 76 6 2 5 81 6 2 4 86 3 1 3 91 2 1 3 2 94 0 1 2 92 * 1 59 3 3 2 65 2 2 2 85 1 1 5 86 3 1 3 81 8 3 2 87 6 2 3 36 27 * 6 48 22 * 5 65 16 * 10 77 11 0 8 90 2 2 2 95 1 * 2 38 28 28 3 33 32 20 7 44 3 33 8 53 4 32 5 4 2 91 2 5 1 88 4 78 4 1 10 80 2 1 13 68 9 5 4 73 8 4 4 Latino 15 12 11 7 6 3 3 4 34 29 8 7 6 1 32 24 9 4 4 3 4 7 12 6 1 2 8 5 13 11 Total 100 100 100 100 100 100 100 100 100 100 100 100 100 100 100 100 100 100 100 100 100 100 100 100 100 100 100 100 100 100 Sample size 34,549 35,101 8,479 9,380 5,995 7,383 1,913 1,990 7,113 7,987 656 571 184 358 242 212 155 126 838 671 232 115 262 405 197 255 593 436 7,427 4,955 Based on total answering. Results recalculated to exclude non-response. In 2007 the race and ethnicity questions read: “Are you, yourself, of Hispanic origin or descent, such as Mexican, Puerto Rican, Cuban, or some other Spanish background?” If respondents answered “yes” they were then asked “Are you white Hispanic, black Hispanic, or some other race?” Respondents who answered “no” or “don’t know” were then asked: “What is your race? Are you white, black, Asian, or some other?” www.pewresearch.org 150 PEW RESEARCH CENTER ASK ALL: Q.E1 What is your present religion, if any? Are you Protestant, Roman Catholic, Mormon, Orthodox such as Greek or Russian Orthodox, Jewish, Muslim, Buddhist, Hindu, atheist, agnostic, something else, or nothing in particular? INTERVIEWER: IF R VOLUNTEERS “nothing in particular, none, no religion, etc.” BEFORE REACHING END OF LIST, PROMPT WITH: and would you say that’s atheist, agnostic, or just nothing in particular?] ASK IF SOMETHING ELSE OR DK/REF: CHR Do you think of yourself as a Christian or not? [IF R NAMED A NON-CHRISTIAN RELIGION IN PREVIOUS QUESTION (e.g. Native American, Wiccan, Pagan, etc.), DO NOT READ (ENTER "NO" CODE 2)] ASK IF PROTESTANT OR CHRISTIAN UNSPECIFIED OR SOMETHING ELSE/CHRISTIAN: Q.E2 As far as your present religion, what denomination or church, if any, do you identify with most closely? Just stop me when I get to the right one. Are you [READ IN ORDER, BUT DO NOT READ MATERIAL IN PARENTHESES] INTERVIEWER: DO NOT READ QUESTION IF R VOLUNTEERED DENOMINATION IN PREVIOUS QUESTION. RECORD RESPONSE IN APPROPRIATE CATEGORY. Baptist Methodist Lutheran Presbyterian Pentecostal (Assemblies of God, Four-Square Gospel) Episcopalian (uh-pisk-uh-PALE-yun) or Anglican Church of Christ, or Disciples of Christ (Christian Church) Congregational or United Church of Christ Holiness (Nazarenes, Wesleyan Church, Salvation Army) Reformed (include Reformed Church in America; Christian Reformed) Church of God Nondenominational or Independent Church Something else (SPECIFY) Or none in particular [VOL. – DO NOT READ] Jehovah’s Witness [VOL. – DO NOT READ] Just a Protestant [VOL. – DO NOT READ] Just a Christian [VOL. – DO NOT READ] Seventh-day Adventist [VOL. – DO NOT READ] Don’t know/Refused www.pewresearch.org 151 PEW RESEARCH CENTER ASK IF BAPTIST AND NON-BLACK: Q.E3a Which of the following Baptist churches, if any, do you identify with most closely? The Southern Baptist Convention, the American Baptist Churches in the U.S.A., an independent Baptist church, or some other Baptist church? Southern Baptist Convention American Baptist Churches in USA Independent Baptist Baptist General Conference (VOL.) Baptist Missionary Association (VOL.) Conservative Baptist Association of America (VOL.) Free Will Baptist (VOL.) General Association of Regular Baptists (VOL.) Other Baptist (SPECIFY) Baptist not further specified (just a Baptist) (VOL.) Don’t know/Refused (VOL.) ASK IF BAPTIST AND BLACK: Q.E3b Which of the following Baptist churches, if any, do you identify with most closely? The National Baptist Convention, the Progressive Baptist Convention, or some other Baptist church? National Baptist Convention Progressive Baptist Convention Independent Baptist (VOL.) Southern Baptist Convention (VOL.) American Baptist Churches in USA (VOL.) Other Baptist (SPECIFY) Baptist not further specified (just a Baptist) (VOL.) Don’t know/Refused (VOL.) ASK IF METHODIST AND NON-BLACK: Q.E3c Which of the following Methodist churches, if any, do you identify with most closely? The United Methodist Church, Free Methodist Church, or some other Methodist church? United Methodist Church Free Methodist Church African Methodist Episcopal (AME) (VOL.) Other Methodist Church (SPECIFY) Methodist not further specified (just a Methodist) (VOL.) Don’t know/Refused (VOL.) www.pewresearch.org 152 PEW RESEARCH CENTER ASK IF METHODIST AND BLACK: Q.E3d Which of the following Methodist churches, if any, do you identify with most closely? The African Methodist Episcopal (PRONOUNCE: uh-PISK-uh-pull) Church, the African Methodist Episcopal Church Zion, the Christian Methodist Episcopal Church, or some other Methodist church? African Methodist Episcopal (AME) African Methodist Episcopal Zion (AME Zion) Christian Methodist Episcopal Church United Methodist Church (VOL.) Other Methodist (SPECIFY) Methodist not further specified (just a Methodist) (VOL.) Don’t know/Refused (VOL.) ASK IF NONDENOMINATIONAL OR INDEPENDENT CHURCH: Q.E3e Which of the following kinds of nondenominational churches, if any, do you identify with most closely? An evangelical church, fundamentalist church, charismatic church, Inter-denominational church, or some other kind of church? Nondenominational evangelical Nondenominational fundamentalist Nondenominational charismatic Interdenominational Community church (VOL.) Other (SPECIFY) Nondenominational not further specified (just nondenominational/independent) (VOL.) Don’t know/Refused (VOL.) ASK IF LUTHERAN: Q.E3f Which of the following Lutheran churches, if any, do you identify with most closely? The Evangelical Lutheran Church in America, the Lutheran Church Missouri Synod (PRONOUNCE: SIN-id), or some other Lutheran church? Evangelical Lutheran Church in America (ELCA) Lutheran Church, Missouri Synod Lutheran Church, Wisconsin Synod (VOL.) Other Lutheran Church (SPECIFY) Lutheran not further specified (just a Lutheran) (VOL.) Don’t know/Refused (VOL.) www.pewresearch.org 153 PEW RESEARCH CENTER ASK IF PRESBYTERIAN: Q.E3g Which of the following Presbyterian churches, if any, do you identify with most closely? The Presbyterian Church U.S.A., Presbyterian Church in America, or some other Presbyterian church? Presbyterian Church USA Presbyterian Church in America Associate Reformed Presbyterian (VOL.) Cumberland Presbyterian Church (VOL.) Orthodox Presbyterian (VOL.) Other Presbyterian Church (SPECIFY) Presbyterian not further specified (just a Presbyterian) (VOL.) Don’t know/Refused (VOL.) ASK IF PENTECOSTAL AND NON-BLACK: Q.E3h Which of the following Pentecostal churches, if any, do you identify with most closely? The Assemblies of God, Church of God Cleveland Tennessee, or some other church? Assemblies of God Church of God Cleveland Tennessee Four Square Gospel (or Four Square) (VOL.) Pentecostal Church of God (VOL.) Pentecostal Holiness Church (VOL.) Church of God in Christ (VOL.) Church of God of the Apostolic Faith (VOL.) Assembly of Christian Churches (VOL.) Other Pentecostal Church (SPECIFY) Pentecostal not further specified (just a Pentecostal) (VOL.) Don’t know/Refused (VOL.) ASK IF PENTECOSTAL AND BLACK: Q.E3i Which of the following Pentecostal churches, if any, do you identify with most closely? The Church of God in Christ, Church of God of the Apostolic (PRONOUNCE: Ah-puhSTOL-ik) Faith, or some other church? Church of God in Christ Church of God of the Apostolic Faith Assemblies of God (VOL.) Church of God (Cleveland Tennessee) (VOL.) Four Square Gospel (or Four Square) (VOL.) Pentecostal Church of God (VOL.) Pentecostal Holiness Church (VOL.) Other Pentecostal Church (SPECIFY) Pentecostal not further specified (just a Pentecostal) (VOL.) Don’t know/Refused (VOL.) www.pewresearch.org 154 PEW RESEARCH CENTER ASK IF EPISCOPALIAN OR ANGLICAN: Q.E3j Which of the following Episcopalian (PRONOUNCE: uh-pisk-uh-PALE-yun) or Anglican Churches, if any, do you identify with most closely? The Episcopal (PRONOUNCE: uh-PISK-uh-pull) Church in the USA, the Anglican Church, or some other church? Episcopal Church in the USA Anglican Church (Church of England) Anglican Orthodox Church (VOL.) Reformed Episcopal Church (VOL.) Other Episcopalian or Anglican Church (SPECIFY) Episcopalian not further specified (just Episcopalian) (VOL.) Anglican not further specified (just Anglican) (VOL.) Don’t know/Refused (VOL.) ASK IF CHRISTIAN CHURCH, CHURCH OF CHRIST, DISCIPLES OF CHRIST: Q.E3k Which of the following Christian churches, if any, do you identify with most closely? The Church of Christ, Disciples of Christ, or some other church? Church of Christ Disciples of Christ Christian Churches and Churches of Christ (VOL.) United Church of Christ (VOL.) Nondenominational Christian Church (VOL.) Other (SPECIFY) Christian Church not further specified (VOL.) “I am just a Christian” (VOL.) Don’t know/Refused (VOL.) ASK IF CONGREGATIONAL OR UNITED CHURCH OF CHRIST: Q.E3l Which of the following congregational churches, if any, do you identify with most closely? The United Church of Christ, Conservative Congregational Christian, or some other church? United Church of Christ Conservative Congregational Christian Other Congregational (SPECIFY) Congregational not further specified (just Congregationalist/Church of Christ) (VOL.) Don’t know/Refused (VOL.) www.pewresearch.org 155 PEW RESEARCH CENTER ASK IF HOLINESS: Q.E3m Which of the following Holiness churches, if any, do you identify with most closely? The Church of the Nazarene (PRONOUNCE: na-zuh-REEN), the Wesleyan (PRONOUNCE: WES-lee-un) Church, the Free Methodist Church, or something else? Church of the Nazarene Wesleyan Church Free Methodist Church Christian and Missionary Alliance – alliance (VOL.) Church of God (Anderson, Indiana) (VOL.) Salvation Army, American Rescue workers (VOL.) Other Holiness (SPECIFY) Holiness not further specified (just Holiness) (VOL.) Don’t know/Refused (VOL.) ASK IF REFORMED: Q.E3n Which of the following Reformed churches, if any, do you identify with most closely? The Reformed Church in America, the Christian Reformed Church, or some other church? Reformed Church in America Christian Reformed Church Other Reformed (SPECIFY) Reformed not further specified (just Reformed) (VOL.) Don’t know/Refused (VOL.) ASK IF CHURCH OF GOD AND NON-BLACK: Q.E3o Which of the following Churches of God, if any, do you identify with most closely? The Church of God Anderson Indiana, Church of God Cleveland Tennessee, or some other church? Church of God Anderson, Indiana Church of God Cleveland, Tennessee Church of God of the Apostolic Faith (VOL.) Worldwide Church of God (VOL.) Church of God in Christ (VOL.) Other Church of God (SPECIFY) Church of God not further specified (just Church of God) (VOL.) Don’t know/Refused (VOL.) www.pewresearch.org 156 PEW RESEARCH CENTER ASK IF CHURCH OF GOD AND BLACK: Q.E3p Which of the following Churches of God, if any, do you identify with most closely? The Church of God in Christ, the Church of God of the Apostolic (PRONOUNCE: Ah-puhSTOL-ik) Faith, or some other church? Church of God in Christ Church of God of the Apostolic (PRONOUNCE: Ah-puh-STOL-ik) Faith Church of God Anderson, Indiana (VOL) Church of God Cleveland, Tennessee (VOL.) Worldwide Church of God (VOL.) Other Church of God (SPECIFY) Church of God not further specified (just Church of God) (VOL.) Don’t know/Refused (VOL.) ASK IF MORMON OR LATTER-DAY SAINTS: Q.E3q Which of the following Mormon churches, if any, do you identify with most closely? The Church of Jesus Christ of Latter-day Saints, the Community of Christ, or some other church? Church of Jesus Christ of Latter Day Saints (LDS) Community of Christ Other Mormon (SPECIFY) Mormon not further specified (just a Mormon) (VOL.) Don’t know/Refused (VOL.) ASK IF ORTHODOX: Q.E3r Which of the following Orthodox churches, if any, do you identify with most closely? The Greek Orthodox Church, Russian Orthodox, Orthodox Church in America, or some other church? Greek Orthodox Russian Orthodox Orthodox Church in America Armenian Orthodox (VOL.) Eastern Orthodox (VOL.) Serbian Orthodox (VOL.) Other Orthodox (SPECIFY) Orthodox not further specified (just Orthodox) (VOL.) Don’t know/Refused (VOL.) www.pewresearch.org 157 PEW RESEARCH CENTER ASK IF JEWISH: Q.E3s Thinking about Jewish religious denominations, do you consider yourself to be (READ LIST; RANDOMIZE ORDER OF OPTIONS 1-3, THEN READ 4-5 IN ORDER)? [PERMIT MULTIPLE RESPONSES, BUT DO NOT PROBE FOR ADDITIONAL RESPONSES; RECORD UP TO THREE IN ORDER OF MENTION; IF RESPONDENT GIVES ANY INDICATION OF BEING A MESSIANIC JEW OR PART OF THE “JEWS FOR JESUS” MOVEMENT OR A “COMPLETED JEW” CODE AS 4 AND BE SURE TO RECORD THIS AS THEIR VERBATIM SPECIFIED RESPONSE] Conservative Orthodox Reform Something else (SPECIFY) Or no particular denomination [VOL. DO NOT READ] Don’t know/Refused ASK IF MUSLIM: Q.E3t Are you Shi’a [PRONOUNCED SHE-uh], Sunni [PRONOUNCED SUE-knee], or another tradition? Shi’a Sunni Other (SPECIFY) Muslim, non-specific (VOL) Don’t know/Refused (VOL.) ASK IF BUDDHIST: Q.E3u Which of the following Buddhist groups, if any, do you identify with most closely? Theravada (PRONOUNCE: tare-ah-VAH-dah) Buddhism, Vipassana (PRONOUNCE: vi-PAH-sah-nah) Buddhism, Mahayana (PRONOUNCE: mah-hahYAH-nah) Buddhism (such as Zen, Son or Cha’n), Vajrayana (PRONOUNCE: vi-rahYAH-nah) Buddhism (such as Tibetan), or something else? Theravada Buddhism Vipassana Buddhism Mahayana (Zen, Son, or Cha’n) Buddhism Vajrayana (Tibetan) Buddhism Jodo Shinshu (Higashi Honganji, Nishi Honganji) Buddhism (VOL.) Other Buddhist (SPECIFY) Buddhist not further specified (just a Buddhist) (VOL.) Don’t know/Refused (VOL.) www.pewresearch.org 158 PEW RESEARCH CENTER ASK IF HINDU: Q.E3v Which of the following Hindu groups, if any, do you identify with most closely? Vaishnava (PRONOUNCE: VAISH-nuh-vuh) Hinduism or Shaivite (PRONOUNCE: SHAI-vite) Hinduism, or is it something else? Vaishnava Hinduism Shaivite Hinduism Shaktism (PRONOUNCED: SHUCK-tism or SHOCK-tism) Hinduism (VOL.) ISKCON/Hare Krishna (VOL.) Vedanta (PRONOUNCED: vi-DAHN-tuh or vay-DAHN-tuh) (VOL.) Other Hindu (SPECIFY) Hindu not further specified (just Hindu) (VOL.) Don’t know/Refused (VOL. www.pewresearch.org 159 PEW RESEARCH CENTER Summary Table: Religious Composition of U.S. Adults % of U.S. adult pop. Evangelical Protestant churches Baptist in the evangelical tradition Southern Baptist Convention Independent Baptist in the evangelical tradition Conservative Baptist Association of America Free Will Baptist General Association of Regular Baptists Missionary Baptist in the evangelical tradition Other Baptist in the evangelical tradition Methodist in the evangelical tradition Nondenominational in the evangelical tradition Nondenominational evangelical Nondenominational charismatic Interdenominational in the evangelical tradition Nondenominational fundamentalist Community Church in the evangelical tradition "Nondenominational Christian" in the evangelical tradition Other nondenominational in the evangelical tradition Lutheran in the evangelical tradition Lutheran Church-Missouri Synod Lutheran Church, Wisconsin Synod Other Lutheran in the evangelical tradition Presbyterian in the evangelical tradition Presbyterian Church in America Other Presbyterian in the evangelical tradition Pentecostal in the evangelical tradition Assemblies of God Church of God (Cleveland, Tenn.) Apostolic Pentecostal in the evangelical tradition Calvary Chapel Church of God of the Apostolic Faith Foursquare Church Nondenominational Pentecostal in the evangelical tradition Pentecostal Church of God Pentecostal Holiness Church Other Pentecostal in the evangelical tradition Episcopalian/Anglican in the evangelical tradition Restorationist in the evangelical tradition Churches of Christ Christian Churches and Churches of Christ Other Restorationist in the evangelical tradition Congregationalist in the evangelical tradition Conservative Congregational Christian Conference Other Congregationalist in the evangelical tradition Holiness in the evangelical tradition Church of the Nazarene Free Methodist Church Christian and Missionary Alliance Church of God (Anderson, Ind.) Wesleyan Church Other Holiness in the evangelical tradition Reformed in the evangelical tradition Christian Reformed Church Other Reformed in the evangelical tradition Adventist in the evangelical tradition Seventh-day Adventist Other Adventist in the evangelical tradition Anabaptist in the evangelical tradition Pietist in the evangelical tradition Other evangelical/fundamentalist Protestant non-specific in the evangelical tradition 2007 2014 26.3 10.8 6.7 2.5 <0.3 <0.3 <0.3 <0.3 1.1 25.4 9.2 5.3 <0.3 <0.3 2.5 <0.3 <0.3 <0.3 <0.3 1.0 4.9 3.4 1.2 2.0 0.5 0.5 0.3 <0.3 <0.3 0.6 0.6 0.3 <0.3 <0.3 0.8 1.8 1.2 1.5 1.4 1.1 <0.3 <0.3 <0.3 0.8 0.3 0.8 0.4 0.4 0.4 0.4 3.4 3.6 1.4 1.4 0.4 0.4 <0.3 <0.3 <0.3 <0.3 <0.3 <0.3 <0.3 <0.3 <0.3 <0.3 <0.3 <0.3 <0.3 <0.3 0.9 1.1 <0.3 <0.3 1.7 1.6 1.5 <0.3 <0.3 1.5 <0.3 <0.3 <0.3 <0.3 <0.3 1.0 <0.3 <0.3 <0.3 0.7 0.3 0.3 0.3 <0.3 <0.3 <0.3 <0.3 <0.3 <0.3 <0.3 <0.3 <0.3 <0.3 <0.3 <0.3 <0.3 <0.3 <0.3 0.5 0.6 0.4 0.5 <0.3 <0.3 <0.3 0.3 <0.3 0.3 <0.3 0.3 1.9 1.5 % of U.S. adult pop. Mainline Protestant churches Baptist in the mainline tradition American Baptist Churches USA Other Baptist in the mainline tradition Methodist in the mainline tradition United Methodist Church Other Methodist in the mainline tradition Nondenominational in the mainline tradition Interdenominational in the mainline tradition Other nondenominational in the mainline tradition Lutheran in the mainline tradition Evangelical Lutheran Church in America (ELCA) Other Lutheran in the mainline tradition Presbyterian in the mainline tradition Presbyterian Church USA Other Presbyterian in the mainline tradition Episcopalian/Anglican in the mainline tradition Episcopal Church Anglican Church (Church of England) Other Episcopalian/Anglican in the mainline tradition Restorationist in the mainline tradition Disciples of Christ Other Restorationist in the mainline tradition Congregationalist in the mainline tradition United Church of Christ Other Congregationalist in the mainline tradition Reformed in the mainline tradition Reformed Church in America Other Reformed in the mainline tradition Anabaptist in the mainline tradition Friends in the mainline tradition Other/Protestant nonspecific in the mainline tradition 2014 2007 2014 18.1 1.9 14.7 2.1 Catholic 23.9 20.8 1.2 1.5 Mormon 1.7 1.6 0.7 0.6 Jehovah's Witness 0.7 0.8 5.4 3.9 5.1 3.6 0.4 0.9 0.3 1.0 0.3 0.3 0.6 0.7 2.8 2.1 2.0 0.7 1.4 1.1 0.9 0.7 0.5 1.4 Orthodox Christian Greek Orthodox Russian Orthodox Orthodox Church in America Other Orthodox Christian 0.6 0.5 <0.3 <0.3 <0.3 <0.3 <0.3 <0.3 <0.3 <0.3 1.4 0.9 1.9 1.2 1.0 0.9 0.3 <0.3 <0.3 <0.3 Other Christian Metaphysical Spiritualist Unity Church Other Metaphysical Other in the "other Christian" tradition 0.3 <0.3 0.4 <0.3 <0.3 <0.3 <0.3 <0.3 <0.3 <0.3 <0.3 <0.3 Jewish 1.7 1.9 0.3 0.3 <0.3 Buddhist 0.7 0.7 <0.3 0.7 <0.3 0.5 Muslim 0.4 0.9 0.5 0.4 Hindu 0.4 0.7 <0.3 0.3 0.4 <0.3 <0.3 <0.3 <0.3 <0.3 <0.3 <0.3 <0.3 <0.3 <0.3 <0.3 <0.3 2.5 1.9 Historically black churches Baptist in the historically black Protestant tradition National Baptist Convention Progressive Baptist Convention Independent Baptist in historically black Protestant tradition Missionary Baptist in historically black Protestant tradition Other Baptist in the historically black Protestant tradition Methodist in the historically black Protestant tradition African Methodist Episcopal African Methodist Episcopal Zion Church Christian Methodist Episcopal Church Other Methodist in the historically black Protestant tradition Nondenominational in the historically black Protestant tradition Pentecostal in the historically black Protestant tradition Church of God in Christ Apostolic Pentecostal in the historically black Protestant tradition United Pentecostal Church International Other Pentecostal in the historically black Protestant tradition Holiness in the historically black Protestant tradition Protestant non-specific in the historically black Protestant tradition % of U.S. adult pop. 2007 6.9 4.4 6.5 4.0 1.8 1.4 0.3 0.3 0.5 <0.3 <0.3 1.8 0.6 0.3 1.8 0.4 <0.3 <0.3 <0.3 <0.3 0.9 0.5 0.3 <0.3 <0.3 <0.3 0.3 1.0 0.6 <0.3 0.6 <0.3 <0.3 <0.3 <0.3 0.3 <0.3 0.5 <0.3 0.4 Other world religions Other faiths Unitarians and other liberal faiths Unitarian (Universalist) Spiritual but not religious Deist Humanist Bit of everything, "own beliefs" Other liberal faith groups New Age Pagan/Wiccan Other New Age Native American religions Unaffiliated Atheist Agnostic Nothing in particular Don't know/refused 1.2 0.7 1.5 1.0 0.3 <0.3 <0.3 0.3 0.3 <0.3 <0.3 <0.3 <0.3 <0.3 0.4 0.3 <0.3 <0.3 <0.3 <0.3 0.4 0.3 <0.3 <0.3 16.1 1.6 2.4 22.8 3.1 4.0 12.1 15.8 0.8 0.6 160 PEW RESEARCH CENTER ASK IF CHRISTIAN: BORN Would you describe yourself as a "born-again" or evangelical Christian, or not? Total Christian Evangelical tradition Mainline tradition Historically black Protestant trad. Catholic Mormon Orthodox Christian Jehovah’s Witness Other Christian 2014 2007 2014 2007 2014 2007 2014 2007 2014 2007 2014 2007 2014 2007 2014 2007 2014 2007 Yes, would No, would not Don't Know/ Refused (VOL) 50 44 83 79 27 25 72 67 22 16 23 21 18 16 24 17 24 15 46 52 15 18 67 69 25 29 73 79 73 73 79 77 67 73 38 52 4 4 2 2 6 6 3 3 5 5 5 6 3 7 8 10 38 33 www.pewresearch.org Total Sample size 100 100 100 100 100 100 100 100 100 100 100 100 100 100 100 100 100 100 25,048 28,279 8,593 9,472 6,083 7,470 1,916 1,995 7,202 8,054 664 581 186 363 245 215 159 129 161 PEW RESEARCH CENTER ASK ALL: Q.F2 How important is religion in your life – very important, somewhat important, not too important, or not at all important? Total 2014 2007 Very important Somewhat important Not too important Not at all important Don’t know/ Refused (VOL) 53 56 24 26 11 9 11 7 1 1 www.pewresearch.org Total 100 100 162 PEW RESEARCH CENTER ASK ALL: On another subject… Q.J1 Thinking about when you were a child, in what religion were you raised, if any? Were you Protestant, Roman Catholic, Mormon, Orthodox such as Greek or Russian Orthodox, Jewish, Muslim, Buddhist, Hindu, atheist, agnostic, something else, or nothing in particular? [INTERVIEWER: IF R VOLUNTEERS “nothing in particular, none, no religion, etc.” BEFORE REACHING END OF LIST, PROMPT WITH: and would you say that was atheist, agnostic, or just nothing in particular?] ASK IF RAISED SOMETHING ELSE OR DK: CHCHR And was that a Christian religion, or not? ASK IF RAISED PROTESTANT OR CHRISTIAN UNSPECIFIED OR SOMETHING ELSE/CHRISTIAN: Q.J2 What denomination or church, if any, was that? Just stop me when I get to the right one. Were you (READ IN ORDER; DO NOT READ MATERIAL IN PARENTHESES) INTERVIEWER: DO NOT READ QUESTION IF R VOLUNTEERED DENOMINATION IN PREVIOUS QUESTION. RECORD RESPONSE IN APPROPRIATE CATEGORY. 2007 2014 53.9 50.2 Protestant 20.9 19.2 Baptist Family 8.3 6.5 Methodist Family 1.5 2.0 Nondenominational Family 5.5 4.9 Lutheran Family 3.4 3.0 Presbyterian Family 3.9 4.0 Pentecostal Family 1.8 1.8 Episcopalian/Anglican Family 2.3 1.9 Restorationist Family 0.8 0.9 Congregationalist Family Holiness Family 0.8 1.1 0.3 0.3 Reformed Family 0.4 0.6 Adventist Family 0.3 0.4 Anabaptist <0.3 <0.3 Pietist Family <0.3 <0.3 Friends Family <0.3 <0.3 Other Evangelical/Fund. Family 3.4 3.2 Non-Specific 31.4 31.7 Catholic 1.8 1.7 Mormon 0.6 0.7 Orthodox Christian Jehovah’s Witness 0.6 0.8 <0.3 0.4 Other Christian 1.9 2.1 Jewish 0.3 0.9 Muslim 0.4 0.6 Buddhist 0.4 0.7 Hindu <0.3 <0.3 Other world religions 0.3 0.3 Other faiths 7.3 9.2 Unaffiliated 0.7 0.5 DK/Ref (VOL) 100.0 100.0 Total For full list of response options provided in Q.J2, see list provided in Q.E2. www.pewresearch.org 163 PEW RESEARCH CENTER ASK IF RAISED BAPTIST AND NON-BLACK: Q.J3a And still thinking about how you were raised as a child, which of the following Baptist churches, if any, did you identify with most closely? The Southern Baptist Convention, the American Baptist Churches in the U.S.A., an independent Baptist church, or some other Baptist church? Southern Baptist Convention American Baptist Churches in USA Independent Baptist Baptist General Conference (VOL.) Baptist Missionary Association (VOL.) Conservative Baptist Association of America (VOL.) Free Will Baptist (VOL.) General Association of Regular Baptists (VOL.) Other Baptist (SPECIFY) Baptist not further specified (just a Baptist) (VOL.) Don’t know/Refused (VOL.) ASK IF RAISED BAPTIST AND BLACK: Q.J3b And still thinking about how you were raised as a child, which of the following Baptist churches, if any, did you identify with most closely? The National Baptist Convention, the Progressive Baptist Convention, or some other Baptist church? National Baptist Convention Progressive Baptist Convention Independent Baptist (VOL) Southern Baptist Convention (VOL.) American Baptist Churches in USA (VOL.) Other Baptist (SPECIFY) Baptist not further specified (just a Baptist) (VOL.) Don’t know/Refused (VOL.) ASK IF RAISED METHODIST AND NON-BLACK: Q.J3c And still thinking about how you were raised as a child, which of the following Methodist churches, if any, did you identify with most closely? The United Methodist Church, Free Methodist Church, or some other Methodist church? United Methodist Church Free Methodist Church African Methodist Episcopal (AME) (VOL.) Other Methodist Church (SPECIFY) Methodist not further specified (just a Methodist) (VOL.) Don’t know/Refused (VOL.) www.pewresearch.org 164 PEW RESEARCH CENTER ASK IF RAISED METHODIST AND BLACK: Q.J3d And still thinking about how you were raised as a child, which of the following Methodist churches, if any, did you identify with most closely? The African Methodist Episcopal (PRONOUNCE: uh-PISK-uh-pull) Church, the African Methodist Episcopal Church Zion, the Christian Methodist Episcopal Church, or some other Methodist church? African Methodist Episcopal (AME) African Methodist Episcopal Zion (AME Zion) Christian Methodist Episcopal Church United Methodist Church (VOL.) Other Methodist (SPECIFY) Methodist not further specified (just a Methodist) (VOL.) Don’t know/Refused (VOL.) ASK IF RAISED NONDENOMINATIONAL OR INDEPENDENT CHURCH: Q.J3e And still thinking about how you were raised as a child, which of the following kinds of nondenominational churches, if any, did you identify with most closely? An evangelical church, fundamentalist church, charismatic church, Inter-denominational church, or some other kind of church? Nondenominational evangelical Nondenominational fundamentalist Nondenominational charismatic Interdenominational Community church (VOL.) Other (SPECIFY) Nondenominational not further specified (just nondenominational/independent) (VOL.) Don’t know/Refused (VOL.) ASK IF RAISED LUTHERAN: Q.J3f And still thinking about how you were raised as a child, which of the following Lutheran churches, if any, did you identify with most closely? The Evangelical Lutheran Church in America, the Lutheran Church Missouri Synod (PRONOUNCE: SIN-id), or some other Lutheran church? Evangelical Lutheran Church in America (ELCA) Lutheran Church, Missouri Synod Lutheran Church, Wisconsin Synod (VOL.) Other Lutheran Church (SPECIFY) Lutheran not further specified (just a Lutheran) (VOL.) Don’t know/Refused (VOL.) www.pewresearch.org 165 PEW RESEARCH CENTER ASK IF RAISED PRESBYTERIAN: Q.J3g And still thinking about how you were raised as a child, which of the following Presbyterian churches, if any, did you identify with most closely? The Presbyterian Church U.S.A., Presbyterian Church in America, or some other Presbyterian church? Presbyterian Church USA Presbyterian Church in America Associate Reformed Presbyterian (VOL.) Cumberland Presbyterian Church (VOL.) Orthodox Presbyterian (VOL.) Other Presbyterian Church (SPECIFY) Presbyterian not further specified (just a Presbyterian) (VOL.) Don’t know/Refused (VOL.) ASK IF RAISED PENTECOSTAL AND NON-BLACK: Q.J3h And still thinking about how you were raised as a child, which of the following Pentecostal churches, if any, did you identify with most closely? The Assemblies of God, Church of God Cleveland Tennessee, or some other church? Assemblies of God Church of God Cleveland Tennessee Four Square Gospel (or Four Square) (VOL.) Pentecostal Church of God (VOL.) Pentecostal Holiness Church (VOL.) Church of God in Christ (VOL.) Church of God of the Apostolic Faith (VOL.) Assembly of Christian Churches (VOL.) Other Pentecostal Church (SPECIFY) Pentecostal not further specified (just a Pentecostal) (VOL.) Don’t know/Refused (VOL.) www.pewresearch.org 166 PEW RESEARCH CENTER ASK IF RAISED PENTECOSTAL AND BLACK: Q.J3i And still thinking about how you were raised as a child, which of the following Pentecostal churches, if any, did you identify with most closely? The Church of God in Christ, Church of God of the Apostolic (PRONOUNCE: Ah-puh-STOL-ik) Faith, or some other church? Church of God in Christ Church of God of the Apostolic Faith Assemblies of God (VOL.) Church of God (Cleveland Tennessee) (VOL.) Four Square Gospel (or Four Square) (VOL.) Pentecostal Church of God (VOL.) Pentecostal Holiness Church (VOL.) Other Pentecostal Church (SPECIFY) Pentecostal not further specified (just a Pentecostal) (VOL.) Don’t know/Refused (VOL.) ASK IF RAISED EPISCOPALIAN OR ANGLICAN: Q.J3j And still thinking about how you were raised as a child, which of the following Episcopalian (PRONOUNCE: uh-pisk-uh-PALE-yun) or Anglican Churches, if any, did you identify with most closely? The Episcopal (PRONOUNCE: uh-PISK-uh-pull) Church in the USA, the Anglican Church, or some other church? Episcopal Church in the USA Anglican Church (Church of England) Anglican Orthodox Church (VOL.) Reformed Episcopal Church (VOL.) Other Episcopalian or Anglican Church (SPECIFY) Episcopalian not further specified (just Episcopalian) (VOL.) Anglican not further specified (just Anglican) (VOL.) Don’t know/Refused (VOL.) ASK IF RAISED CHRISTIAN CHURCH, CHURCH OF CHRIST, DISCIPLES OF CHRIST: Q.J3k And still thinking about how you were raised as a child, which of the following Christian churches, if any, did you identify with most closely? The Church of Christ, Disciples of Christ, or some other church? Church of Christ Disciples of Christ Christian Churches and Churches of Christ (VOL.) United Church of Christ (VOL.) Nondenominational Christian Church (VOL.) Other (SPECIFY) Christian Church not further specified (VOL.) “I am just a Christian” (VOL.) Don’t know/Refused (VOL.) www.pewresearch.org 167 PEW RESEARCH CENTER ASK IF RAISED CONGREGATIONAL OR UNITED CHURCH OF CHRIST: Q.J3l And still thinking about how you were raised as a child, which of the following congregational churches, if any, did you identify with most closely? The United Church of Christ, Conservative Congregational Christian, or some other church? United Church of Christ Conservative Congregational Christian Other Congregational (SPECIFY) Congregational not further specified (just Congregationalist/Church of Christ) (VOL.) Don’t know/Refused (VOL.) ASK IF RAISED HOLINESS: Q.J3m And still thinking about how you were raised as a child, which of the following Holiness churches, if any, did you identify with most closely? The Church of the Nazarene (PRONOUNCE: na-zuh-REEN), the Wesleyan (PRONOUNCE: WES-lee-un) Church, the Free Methodist Church, or something else? Church of the Nazarene Wesleyan Church Free Methodist Church Christian and Missionary Alliance – alliance (VOL.) Church of God (Anderson, Indiana) (VOL.) Salvation Army, American Rescue workers (VOL.) Other Holiness (SPECIFY) Holiness not further specified (just Holiness) (VOL.) Don’t know/Refused (VOL.) ASK IF RAISED REFORMED: Q.J3n And still thinking about how you were raised as a child, which of the following Reformed churches, if any, did you identify with most closely? The Reformed Church in America, the Christian Reformed Church, or some other church? Reformed Church in America Christian Reformed Church Other Reformed (SPECIFY) Reformed not further specified (just Reformed) (VOL.) Don’t know/Refused (VOL.) www.pewresearch.org 168 PEW RESEARCH CENTER ASK IF RAISED CHURCH OF GOD AND NON-BLACK: Q.J3o And still thinking about how you were raised as a child, which of the following Churches of God, if any, did you identify with most closely? The Church of God Anderson Indiana, Church of God Cleveland Tennessee, or some other church? Church of God Anderson, Indiana Church of God Cleveland, Tennessee Church of God of the Apostolic Faith (VOL.) Worldwide Church of God (VOL.) Church of God in Christ (VOL.) Other Church of God (SPECIFY) Church of God not further specified (just Church of God) (VOL.) Don’t know/Refused (VOL.) ASK IF RAISED CHURCH OF GOD AND BLACK: Q.J3p And still thinking about how you were raised as a child, which of the following Churches of God, if any, did you identify with most closely? The Church of God in Christ, the Church of God of the Apostolic (PRONOUNCE: Ah-puh-STOL-ik) Faith, or some other church? Church of God in Christ Church of God of the Apostolic (PRONOUNCE: Ah-puh-STOL-ik) Faith Church of God Anderson, Indiana (VOL) Church of God Cleveland, Tennessee (VOL.) Worldwide Church of God (VOL.) Other Church of God (SPECIFY) Church of God not further specified (just Church of God) (VOL.) Don’t know/Refused (VOL.) ASK IF RAISED MORMON OR LATTER-DAY SAINTS: Q.J3q And still thinking about how you were raised as a child, which of the following Mormon churches, if any, did you identify with most closely? The Church of Jesus Christ of Latter-day Saints, the Community of Christ, or some other church? Church of Jesus Christ of Latter Day Saints (LDS) Community of Christ Other Mormon (SPECIFY) Mormon not further specified (just a Mormon) (VOL.) Don’t know/Refused (VOL.) www.pewresearch.org 169 PEW RESEARCH CENTER ASK IF RAISED ORTHODOX: Q.J3r And still thinking about how you were raised as a child, which of the following Orthodox churches, if any, did you identify with most closely? The Greek Orthodox Church, Russian Orthodox, Orthodox Church in America, or some other church? Greek Orthodox Russian Orthodox Orthodox Church in America Armenian Orthodox (VOL.) Eastern Orthodox (VOL.) Serbian Orthodox (VOL.) Other Orthodox (SPECIFY) Orthodox not further specified (just Orthodox) (VOL.) Don’t know/Refused (VOL.) ASK IF RAISED JEWISH: Q.J3s Now thinking about Jewish religious denominations, were you raised [READ LIST IN SAME ORDER AS Q.E3s IF RESPONDENT RECEIVED Q.E3s, OTHERWISE RANDOMIZE ORDER OF OPTIONS 1-3, THEN READ 4-5 IN ORDER)? [PERMIT MULTIPLE RESPONSES, BUT DO NOT PROBE FOR ADDITIONAL RESPONSES; RECORD UP TO THREE IN ORDER OF MENTION; IF RESPONDENT GIVES ANY INDICATION OF HAVING BEEN RAISED A MESSIANIC JEW OR PART OF THE “JEWS FOR JESUS” MOVEMENT OR A “COMPLETED JEW” CODE AS 4 AND BE SURE TO RECORD THIS AS THEIR VERBATIM SPECIFIED RESPONSE] Conservative Orthodox Reform Something else (SPECIFY) Or no particular denomination [VOL. DO NOT READ] Don’t know/Refused ASK IF RAISED MUSLIM: Q.J3t And still thinking about how you were raised as a child, were you raised Shi’a [PRONOUNCED SHE-uh], Sunni [PRONOUNCED SUE-knee], or another tradition? Shi’a Sunni Other (SPECIFY) Muslim, non-specific (VOL) Don’t know/Refused (VOL.) www.pewresearch.org 170 PEW RESEARCH CENTER ASK IF RAISED BUDDHIST: Q.J3u And still thinking about how you were raised as a child, which of the following Buddhist groups, if any, did you identify with most closely? Theravada (PRONOUNCE: tare-ahVAH-dah) Buddhism, Vipassana (PRONOUNCE: vi-PAH-sah-nah) Buddhism, Mahayana (PRONOUNCE: mah-hah-YAH-nah) Buddhism (such as Zen, Son or Cha’n), Vajrayana (PRONOUNCE: vi-rah-YAH-nah) Buddhism (such as Tibetan), or something else? Theravada Buddhism Vipassana Buddhism Mahayana (Zen, Son, or Cha’n) Buddhism Vajrayana (Tibetan) Buddhism Jodo Shinshu (Higashi Honganji, Nishi Honganji) Buddhism (VOL.) Other Buddhist (SPECIFY) Buddhist not further specified (just a Buddhist) (VOL.) Don’t know/Refused (VOL.) ASK IF RAISED HINDU: Q.J 3v And still thinking about how you were raised as a child, which of the following Hindu groups, if any, did you identify with most closely? Vaishnava (PRONOUNCE: VAISHnuh-vuh) Hinduism or Shaivite (PRONOUNCE: SHAI-vite) Hinduism, or something else? Vaishnava Hinduism Shaivite Hinduism Shaktism (PRONOUNCED: SHUCK-tism or SHOCK-tism) Hinduism (VOL.) ISKCON/Hare Krishna (VOL.) Vedanta (PRONOUNCED: vi-DAHN-tuh or vay-DAHN-tuh) (VOL.) Other Hindu (SPECIFY) Hindu not further specified (just Hindu) (VOL.) Don’t know/Refused (VOL.) www.pewresearch.org 171 PEW RESEARCH CENTER Summary Table: Religion in Which U.S. Adults were Raised % of U.S. Adult Pop % of U.S. Adult Pop 2014 2014 Evangelical Protestant Churches Baptist in the Evangelical Tradition Southern Baptist Convention Independent Baptist in the Evangelical Tradition Conservative Baptist Association of America Free Will Baptist General Association of Regular Baptists Missionary Baptist in the Evangelical Tradition Other Baptist in the Evangelical Tradition Methodist in the Evangelical Tradition Nondenominational in the Evangelical Tradition Nondenominational evangelical Nondenominational charismatic Interdenominational in the Evangelical Tradition Nondenominational fundamentalist Community Church in the Evangelical Tradition "Nondenominational Christian" in the Evangelical Tradition Other nondenominational in the Evangelical Tradition Lutheran in the Evangelical Tradition Lutheran Church-Missouri Synod Lutheran Church-W isconsin Synod Other Lutheran in the Evangelical Tradition Presbyterian in the Evangelical Tradition Presbyterian Church in America Other Presbyterian in the Evangelical Tradition Pentecostal in the Evangelical Tradition Assemblies of God Church of God Cleveland TN Apostolic Pentecostal in the Evangelical Tradition Calvary Chapel Church of God of the Apostolic Faith Foursquare Church Nondenominational Pentecostal in the Evangelical Tradition Pentecostal Church of God Pentecostal Holiness Church Other Pentecostal in the Evangelical Tradition Episcopalian/Anglican in the Evangelical Tradition Restorationist in the Evangelical Tradition Churches of Christ Christian Churches and Churches of Christ Other Restorationist in the Evangelical Protestant Tradition Congregationalist in the Evangelical Tradition Conservative Congregational Christian Conference Other Congregationalist in the Evangelical Tradition Holiness in the Evangelical Tradition Church of the Nazarene Free Methodist Church Christian and Missionary Alliance Church of God (Anderson, Indiana) Wesleyan Church Other Holiness in the Evangelical Tradition Reformed in the Evangelical Tradition Christian Reformed Church Other Reformed in the Evangelical Tradition Adventist in the Evangelical Tradition Seventh-day Adventist Other Adventist group in the Evangelical Tradition Anabaptist in the Evangelical Tradition Pietist in the Evangelical Tradition Other Evangelical/Fundamentalist Protestant non-specific in the Evangelical Tradition 23.9 Mainline Protestant Churches Baptist in the Mainline Tradition American Baptist Churches USA Other Baptist in the Mainline Tradition Methodist in the Mainline Tradition United Methodist Church Other Methodist in the Mainline Tradition Nondenominational in the Mainline Tradition Interdenominational in the Mainline Tradition Other nondenominational in the Mainline Tradition Lutheran in the Mainline Tradition Evangelical Lutheran Church in America (ELCA) Other Lutheran in the Mainline Tradition Presbyterian in the Mainline Tradition Presbyterian Church USA Other Presbyterian in the Mainline Tradition Episcopalian/Anglican in the Mainline Tradition Episcopal Church Anglican Church (Church of England) Other Episcopalian/Anglican in the Mainline Tradition Restorationist in the mainline Tradition Disciples of Christ Other Restorationist in the Mainline Tradition Congregationalist in the Mainline Tradition United Church of Christ Other Congregationalist in the Mainline Tradition Reformed in the Mainline Tradition Reformed Church in America Other Reformed in the Mainline Tradition Anabaptist in the Mainline Tradition Friends in the Mainline Tradition Other/Protestant nonspecific in the Mainline Tradition 11.3 7.1 2.6 <0.3 <0.3 <0.3 <0.3 1.2 0.3 1.4 0.6 <0.3 <0.3 <0.3 <0.3 <0.3 0.4 1.9 1.4 <0.3 0.3 0.8 0.3 0.5 3.2 1.3 0.3 <0.3 <0.3 <0.3 <0.3 % of U.S. Adult Pop 2014 19.0 Historically Black Churches <0.3 1.0 <0.3 1.6 1.5 <0.3 <0.3 <0.3 <0.3 <0.3 0.9 0.3 0.3 <0.3 <0.3 <0.3 <0.3 <0.3 <0.3 <0.3 0.6 0.6 <0.3 0.3 <0.3 <0.3 0.9 Baptist in the Historically Black Protestant Tradition National Baptist Convention Progressive Baptist Convention Independent Baptist in Historically Black Protestant Tradition Missionary Baptist in Historically Black Protestant Tradition Other Baptist in the Historically Black Protestant Tradition Methodist in the Historically Black Protestant Tradition African Methodist Episcopal African Methodist Episcopal Zion Church Christian Methodist Episcopal Church Other Methodist in the Historically Black Protestant Tradition Nondenominational in the Historically Black Protestant Tradition Pentecostal in the Historically Black Protestant Tradition Church of God in Christ Apostolic Pentecostal in the Historically Black Protestant Tradition United Pentecostal Church International Other Pentecostal in the Historically Black Protestant Tradition Holiness in the Historically Black Protestant Tradition Protestant non-specific in the Historically Black Protestant Tradition 31.7 Mormon 1.7 Jehovah's Witness 0.8 Orthodox Christian 0.7 2.7 1.5 1.1 5.5 4.8 0.8 0.5 <0.3 0.4 3.0 1.6 1.4 Greek Orthodox Russian Orthodox Orthodox Church in America Other Orthodox Christian Other Christian Metaphysical Spiritualist Unity Church Other Metaphysical Other in the "Other Christian" tradition 2.2 0.8 1.4 1.8 1.2 0.3 <0.3 0.3 <0.3 <0.3 <0.3 0.4 <0.3 <0.3 <0.3 <0.3 0.3 Jewish 2.1 Buddhist 0.6 Muslim 0.9 Hindu 0.7 0.3 <0.3 <0.3 0.7 0.5 0.3 <0.3 <0.3 Other world religions <0.3 <0.3 Other faiths <0.3 <0.3 1.9 <0.3 <0.3 Catholic 7.3 5.2 1.7 0.3 <0.3 <0.3 2.8 0.7 Unitarians and other liberal faiths Unitarian (Universalist) Spiritual but not religious Deist Humanist Bit of everything, "own beliefs" Other Liberal Faith Groups New Age Pagan/Wiccan Other New Age Native American Religions 0.3 <0.3 <0.3 <0.3 <0.3 <0.3 <0.3 <0.3 <0.3 <0.3 <0.3 <0.3 0.4 <0.3 <0.3 <0.3 <0.3 0.8 0.5 <0.3 <0.3 <0.3 <0.3 0.4 Unaffiliated Atheist Agnostic Nothing in particular Don't know/refused 9.2 0.5 0.4 8.2 0.5 172 PEW RESEARCH CENTER ASK IF RAISED CHRISTIAN: CHBORN As a child, would you say you were raised as a born-again or evangelical Christian, or not? Total Raised Christian Yes, would No, would not 39 56 Don’t know/ Refused Sample (VOL) Total size 6 www.pewresearch.org 100 30,329 173 PEW RESEARCH CENTER ASK IF MARRIED OR LIVING WITH A PARTNER: Q.K 1 And what is your [IF MARRIED: spouse’s; IF LIVING WITH A PARTNER: partner’s] present religion, if any? Are they Protestant, Roman Catholic, Mormon, Orthodox such as Greek or Russian Orthodox, Jewish, Muslim, Buddhist, Hindu, atheist, agnostic, something else, or nothing in particular?1 [INTERVIEWER: IF R VOLUNTEERS “nothing in particular, none, no religion, etc.” BEFORE REACHING END OF LIST, PROMPT WITH: and would you say they are atheist, agnostic, or just nothing in particular?] ASK IF SOMETHING ELSE OR DK: SPCHR And is that a Christian religion, or not? ASK IF SPOUSE/PARTNER PROTESTANT OR UNSPECIFIED CHRISTIAN OR SOMETHING ELSE/CHRISTIAN: Q.K2 What denomination or church, if any, is that? Just stop me when I get to the right one. Is your [IF MARRIED: spouse; IF LIVING WITH A PARTNER: partner] (READ IN ORDER; DO NOT READ MATERIAL IN PARENTHESES) INTERVIEWER: DO NOT READ QUESTION IF R VOLUNTEERED DENOMINATION IN PREVIOUS QUESTION. RECORD RESPONSE IN APPROPRIATE CATEGORY. Baptist Methodist Lutheran Presbyterian Pentecostal (Assemblies of God, Four-Square Gospel) Episcopalian (uh-pisk-uh-PALE-yun) or Anglican Church of Christ, or Disciples of Christ (Christian Church) Congregational or United Church of Christ Holiness (Nazarenes, Wesleyan Church, Salvation Army) Reformed (include Reformed Church in America; Christian Reformed) Church of God Nondenominational or Independent Church Something else (SPECIFY) Or none in particular [VOL. – DO NOT READ] Jehovah’s Witness [VOL. – DO NOT READ] Just a Protestant [VOL. – DO NOT READ] Just a Christian [VOL. – DO NOT READ] Seventh-day Adventist [VOL. – DO NOT READ] Don’t know/Refused NOTE: FOR FULL RESULTS SEE TABLE FOLLOWING QK3v. 1 In mid-June, upon completion of 6,000 interviews, interviewing was halted for a brief period and the data were weighted to allow for a preliminary review of the data. In an experiment, half of respondents up to that point were asked about their spouse’s/partner’s “religion, if any” and the other half of respondents were asked about their spouse’s/partner’s “present religion, if any.” The former question matches the 2007 Landscape Study. Analysis of this experiment found that the former question produced higher estimates of religious intermarriage than the latter question. This is presumably because of the context in which it was asked. When Q.K1 follows the Q.J series of questions (about the religion in which the respondent was raised), some respondents appear to answer by describing their spouse’s/partner’s childhood religion when they are not prompted to report specifically on their spouse’s/partner’s “present” religion. Beginning June 20 (when data collection resumed following this brief hiatus) and for the remainder of the field period, all respondents were asked the latter question. In total, 92% of all respondents received the “present religion, if any” version of the question, which minimizes the bias introduced in estimates of intermarriage resulting from having asked some respondents a different version of the question. Results reported here reflect combined responses to both questions. www.pewresearch.org 174 PEW RESEARCH CENTER ASK IF MARRIED: SPYEAR In what year did you and your spouse get married? [INTERVIEWER NOTE: CURRENT MARRIAGE ONLY] ENTER YEAR BASED ON THOSE WHO ARE MARRIED: Married Married Married Married Married Married Married before 1960197019801990200020101960 1969 1979 1989 1999 2009 2014 4 7 11 16 20 Total Married 4 8 12 17 21 Evangelical tradition 6 10 13 17 20 Mainline tradition 3 6 10 12 17 Historically black Prot. trad. 5 8 13 19 21 Catholic 3 4 12 19 22 Mormon 7 10 13 15 15 Jehovah’s Witness 6 10 13 17 19 Jewish 1 5 5 6 17 Muslim 0 4 10 10 27 Buddhist * * 2 4 24 Hindu 2 2 7 15 20 Other faiths 2 4 7 14 19 Unaffiliated Orthodox Christian and “Other Christian” are not included due to insufficient sample size. www.pewresearch.org 25 23 21 31 22 28 19 21 41 25 44 32 31 13 12 11 18 9 12 18 11 20 23 24 21 20 DK/ Ref (VOL) Total 2 2 2 3 3 1 3 1 5 2 1 1 2 100 100 100 100 100 100 100 100 100 100 100 100 100 Sample size 17,827 4,853 3,444 626 3,810 454 124 498 110 103 131 228 3150 175 PEW RESEARCH CENTER ASK IF MARRIED OR LIVING WITH A PARTNER: SPHISP Is your [IF MARRIED: spouse; IF LIVING WITH A PARTNER: partner] of Hispanic, Latino, or Spanish origin, such as Mexican, Puerto Rican or Cuban? ASK IF MARRIED OR LIVING WITH A PARTNER: SPRACE Which of the following describes your [IF MARRIED: spouse’s; IF LIVING WITH A PARTNER: partner’s] race? You can select as many as apply. White, Black or African American, Asian or Asian American or some other race. [RECORD UP TO FOUR IN ORDER MENTIONED BUT DO NOT PROBE FOR ADDITIONAL; NAME FIRST MENTION SPRACE_1, SECOND MENTION SPRACE_2, THIRD MENTION SPRACE_3, FOURTH MENTION SPRACE_4] [IF R VOLS MIXED BIRACIAL, PROBE ONCE: What race or races is that?] ------------------------Non-Latino------------------- White Black or AfricanAmerican Asian or AsianAmerican Mixed race/ Or some other race Latino Total Sample size Total Married/Living with 71 8 4 2 15 100 19,682 a Partner 80 6 2 3 10 100 5,123 Evangelical tradition 87 3 2 2 6 100 3,656 Mainline tradition Historically black 9 82 * 2 6 100 710 Protestant tradition 61 3 3 1 32 100 4,222 Catholic 85 1 2 4 8 100 465 Mormon 38 29 2 2 29 100 133 Jehovah’s Witness 89 2 2 1 7 100 531 Jewish 41 25 34 * 1 100 117 Muslim 49 3 35 5 8 100 128 Buddhist 8 2 88 1 1 100 136 Hindu 77 3 2 7 11 100 292 Other faiths 73 6 5 3 13 100 3,863 Unaffiliated Based on those who are married or living with a partner and who answered the questions about their spouse’s/partner’s ethnicity and race. Results recalculated to exclude non-response. Orthodox Christian and “Other Christian” are not included due to insufficient sample size. www.pewresearch.org 176 PEW RESEARCH CENTER ASK IF SPOUSE/PARTNER BAPTIST AND NON-BLACK: Q.K3a Which of the following Baptist churches, if any, does your [IF MARRIED: spouse; IF LIVING WITH A PARTNER: partner] identify with most closely? The Southern Baptist Convention, the American Baptist Churches in the U.S.A., an independent Baptist church, or some other Baptist church? Southern Baptist Convention American Baptist Churches in USA Independent Baptist Baptist General Conference (VOL.) Baptist Missionary Association (VOL.) Conservative Baptist Association of America (VOL.) Free Will Baptist (VOL.) General Association of Regular Baptists (VOL.) Other Baptist (SPECIFY) Baptist not further specified (just a Baptist) (VOL.) Don’t know/Refused (VOL.) ASK IF SPOUSE/PARTNER BAPTIST AND BLACK: Q.K3b Which of the following Baptist churches, if any, does your [IF MARRIED: spouse; IF LIVING WITH A PARTNER: partner] identify with most closely? The National Baptist Convention, the Progressive Baptist Convention, or some other Baptist church? National Baptist Convention Progressive Baptist Convention Independent Baptist (VOL) Southern Baptist Convention (VOL.) American Baptist Churches in USA (VOL.) Other Baptist (SPECIFY) Baptist not further specified (just a Baptist) (VOL.) Don’t know/Refused (VOL.) ASK IF SPOUSE/PARTNER METHODIST AND NON-BLACK: Q.K3c Which of the following Methodist churches, if any, does your [IF MARRIED: spouse; LIVING WITH A PARTNER: partner] identify with most closely? The United Methodist Church, Free Methodist Church, or some other Methodist church? United Methodist Church Free Methodist Church African Methodist Episcopal (AME) (VOL.) Other Methodist Church (SPECIFY) Methodist not further specified (just a Methodist) (VOL.) Don’t know/Refused (VOL.) www.pewresearch.org 177 PEW RESEARCH CENTER ASK IF SPOUSE/PARTNER METHODIST AND BLACK: Q.K3d Which of the following Methodist churches, if any, does your [IF MARRIED: spouse; IF LIVING WITH A PARTNER: partner] identify with most closely? The African Methodist Episcopal (PRONOUNCE: uh-PISK-uh-pull) Church, the African Methodist Episcopal Church Zion, the Christian Methodist Episcopal Church, or some other Methodist church? African Methodist Episcopal (AME) African Methodist Episcopal Zion (AME Zion) Christian Methodist Episcopal Church United Methodist Church (VOL.) Other Methodist (SPECIFY) Methodist not further specified (just a Methodist) (VOL.) Don’t know/Refused (VOL.) ASK IF SPOUSE/PARTNER NONDENOMINATIONAL OR INDEPENDENT CHURCH: Q.K3e Which of the following kinds of nondenominational churches, if any, does your [IF MARRIED: spouse; IF LIVING WITH A PARTNER: partner] identify with most closely? An evangelical church, fundamentalist church, charismatic church, Interdenominational church, or some other kind of church? Nondenominational evangelical Nondenominational fundamentalist Nondenominational charismatic Interdenominational Community church (VOL.) Other (SPECIFY) Nondenominational not further specified (just nondenominational/independent) (VOL.) Don’t know/Refused (VOL.) ASK IF SPOUSE/PARTNER LUTHERAN: Q.K3f Which of the following Lutheran churches, if any, does your [IF MARRIED: spouse; IF LIVING WITH A PARTNER: partner] identify with most closely? The Evangelical Lutheran Church in America, the Lutheran Church Missouri Synod (PRONOUNCE: SIN-id), or some other Lutheran church? Evangelical Lutheran Church in America (ELCA) Lutheran Church, Missouri Synod Lutheran Church, Wisconsin Synod (VOL.) Other Lutheran Church (SPECIFY) Lutheran not further specified (just a Lutheran) (VOL.) Don’t know/Refused (VOL.) www.pewresearch.org 178 PEW RESEARCH CENTER ASK IF SPOUSE/PARTNER PRESBYTERIAN: Q.K3g Which of the following Presbyterian churches, if any, does your [IF MARRIED: spouse; IF LIVING WITH A PARTNER: partner] identify with most closely? The Presbyterian Church U.S.A., Presbyterian Church in America, or some other Presbyterian church? Presbyterian Church USA Presbyterian Church in America Associate Reformed Presbyterian (VOL.) Cumberland Presbyterian Church (VOL.) Orthodox Presbyterian (VOL.) Other Presbyterian Church (SPECIFY) Presbyterian not further specified (just a Presbyterian) (VOL.) Don’t know/Refused (VOL.) ASK IF SPOUSE/PARTNER PENTECOSTAL AND NON-BLACK: Q.K3h Which of the following Pentecostal churches, if any, does your [IF MARRIED: spouse; IF LIVING WITH A PARTNER: partner] identify with most closely? The Assemblies of God, Church of God Cleveland Tennessee, or some other church? Assemblies of God Church of God Cleveland Tennessee Four Square Gospel (or Four Square) (VOL.) Pentecostal Church of God (VOL.) Pentecostal Holiness Church (VOL.) Church of God in Christ (VOL.) Church of God of the Apostolic Faith (VOL.) Assembly of Christian Churches (VOL.) Other Pentecostal Church (SPECIFY) Pentecostal not further specified (just a Pentecostal) (VOL.) Don’t know/Refused (VOL.) ASK IF SPOUSE/PARTNER PENTECOSTAL AND BLACK: Q.K3i Which of the following Pentecostal churches, if any, does your [IF MARRIED: spouse; IF LIVING WITH A PARTNER: partner] identify with most closely? The Church of God in Christ, Church of God of the Apostolic (PRONOUNCE: Ah-puh-STOL-ik) Faith, or some other church? Church of God in Christ Church of God of the Apostolic Faith Assemblies of God (VOL.) Church of God (Cleveland Tennessee) (VOL.) Four Square Gospel (or Four Square) (VOL.) Pentecostal Church of God (VOL.) Pentecostal Holiness Church (VOL.) Other Pentecostal Church (SPECIFY) Pentecostal not further specified (just a Pentecostal) (VOL.) Don’t know/Refused (VOL.) www.pewresearch.org 179 PEW RESEARCH CENTER ASK IF SPOUSE/PARTNER EPISCOPALIAN OR ANGLICAN: Q.K3j Which of the following Episcopalian (PRONOUNCE: uh-pisk-uh-PALE-yun) or Anglican Churches, if any, does your [IF MARRIED: spouse; IF LIVING WITH A PARTNER: partner] identify with most closely? The Episcopal (PRONOUNCE: uhPISK-uh-pull) Church in the USA, the Anglican Church, or some other church? Episcopal Church in the USA Anglican Church (Church of England) Anglican Orthodox Church (VOL.) Reformed Episcopal Church (VOL.) Other Episcopalian or Anglican Church (SPECIFY) Episcopalian not further specified (just Episcopalian) (VOL.) Anglican not further specified (just Anglican) (VOL.) Don’t know/Refused (VOL.) ASK IF SPOUSE/PARTNER CHRISTIAN CHURCH, CHURCH OF CHRIST, DISCIPLES OF CHRIST: Q.K3k Which of the following Christian churches, if any, does your [IF MARRIED: spouse; IF LIVING WITH A PARTNER: partner] identify with most closely? The Church of Christ, Disciples of Christ, or some other church? Church of Christ Disciples of Christ Christian Churches and Churches of Christ (VOL.) United Church of Christ (VOL.) Nondenominational Christian Church (VOL.) Other (SPECIFY) Christian Church not further specified (VOL.) “He/she is just a Christian” (VOL.) Don’t know/Refused (VOL.) ASK IF SPOUSE/PARTNER CONGREGATIONAL OR UNITED CHURCH OF CHRIST: Q.K3l Which of the following congregational churches, if any, does your [IF MARRIED: spouse; IF LIVING WITH A PARTNER: partner] identify with most closely? The United Church of Christ, Conservative Congregational Christian, or some other church? United Church of Christ Conservative Congregational Christian Other Congregational (SPECIFY) Congregational not further specified (just Congregationalist/Church of Christ) (VOL.) Don’t know/Refused (VOL.) www.pewresearch.org 180 PEW RESEARCH CENTER ASK IF SPOUSE/PARTNER HOLINESS: Q.K3m Which of the following Holiness churches, if any, does your [IF MARRIED: spouse; IF LIVING WITH A PARTNER: partner] identify with most closely? The Church of the Nazarene (PRONOUNCE: na-zuh-REEN), the Wesleyan (PRONOUNCE: WES-leeun) Church, the Free Methodist Church, or something else? Church of the Nazarene Wesleyan Church Free Methodist Church Christian and Missionary Alliance – alliance (VOL.) Church of God (Anderson, Indiana) (VOL.) Salvation Army, American Rescue workers (VOL.) Other Holiness (SPECIFY) Holiness not further specified (just Holiness) (VOL.) Don’t know/Refused (VOL.) ASK IF SPOUSE/PARTNER REFORMED: Q.K3n Which of the following Reformed churches, if any, does your [IF MARRIED: spouse; IF LIVING WITH A PARTNER: partner] identify with most closely? The Reformed Church in America, the Christian Reformed Church, or some other church? Reformed Church in America Christian Reformed Church Other Reformed (SPECIFY) Reformed not further specified (just Reformed) (VOL.) Don’t know/Refused (VOL.) ASK IF SPOUSE/PARTNER CHURCH OF GOD AND NON-BLACK: Q.K3o Which of the following Churches of God, if any, does your [IF MARRIED: spouse; IF LIVING WITH A PARTNER: partner] identify with most closely? The Church of God Anderson Indiana, Church of God Cleveland Tennessee, or some other church? Church of God Anderson, Indiana Church of God Cleveland, Tennessee Church of God of the Apostolic Faith (VOL.) Worldwide Church of God (VOL.) Church of God in Christ (VOL.) Other Church of God (SPECIFY) Church of God not further specified (just Church of God) (VOL.) Don’t know/Refused (VOL.) www.pewresearch.org 181 PEW RESEARCH CENTER ASK IF SPOUSE/PARTNER CHURCH OF GOD AND BLACK: Q.K3p Which of the following Churches of God, if any, does your [IF MARRIED: spouse; IF LIVING WITH A PARTNER: partner] identify with most closely? The Church of God in Christ, the Church of God of the Apostolic (PRONOUNCE: Ah-puh-STOL-ik) Faith, or some other church? Church of God in Christ Church of God of the Apostolic (PRONOUNCE: Ah-puh-STOL-ik) Faith Church of God Anderson, Indiana (VOL) Church of God Cleveland, Tennessee (VOL.) Worldwide Church of God (VOL.) Other Church of God (SPECIFY) Church of God not further specified (just Church of God) (VOL.) Don’t know/Refused (VOL.) ASK IF SPOUSE/PARTNER MORMON OR LATTER-DAY SAINTS: Q.K3q Which of the following Mormon churches, if any, does your [IF MARRIED: spouse; IF LIVING WITH A PARTNER: partner] identify with most closely? The Church of Jesus Christ of Latter-day Saints, the Community of Christ, or some other church? Church of Jesus Christ of Latter Day Saints (LDS) Community of Christ Other Mormon (SPECIFY) Mormon not further specified (just a Mormon) (VOL.) Don’t know/Refused (VOL.) ASK IF SPOUSE/PARTNER ORTHODOX CHRISTIAN: Q.K3r Which of the following Orthodox churches, if any, does your [IF MARRIED: spouse; IF LIVING WITH A PARTNER: partner] identify with most closely? The Greek Orthodox Church, Russian Orthodox, Orthodox Church in America, or some other church? Greek Orthodox Russian Orthodox Orthodox Church in America Armenian Orthodox (VOL.) Eastern Orthodox (VOL.) Serbian Orthodox (VOL.) Other Orthodox (SPECIFY) Orthodox not further specified (just Orthodox) (VOL.) Don’t know/Refused (VOL.) www.pewresearch.org 182 PEW RESEARCH CENTER ASK IF SPOUSE/PARTNER JEWISH: Q.K3s Thinking about Jewish religious denominations, does your [IF MARRIED: spouse; IF LIVING WITH A PARTNER: partner] consider themself to be [READ LIST IN SAME ORDER AS Q.E3s IF RESPONDENT RECEIVED Q.E3s OR Q.J3s IF RESPONDENT RECEIVED Q.J3s, OTHERWISE RANDOMIZE ORDER OF OPTIONS 1-3, THEN READ 4-5 IN ORDER)? [PERMIT MULTIPLE RESPONSES, BUT DO NOT PROBE FOR ADDITIONAL RESPONSES; RECORD UP TO THREE IN ORDER OF MENTION; IF RESPONDENT GIVES ANY INDICATION THAT SPOUSE/PARTNER IS A MESSIANIC JEW OR PART OF THE “JEWS FOR JESUS” MOVEMENT OR A “COMPLETED JEW” CODE AS 4 AND BE SURE TO RECORD THIS AS THEIR VERBATIM SPECIFIED RESPONSE] Conservative Orthodox Reform Something else (SPECIFY) Or no particular denomination [VOL. DO NOT READ] Don’t know/Refused ASK IF SPOUSE/PARTNER MUSLIM: Q.K3t Is your [IF MARRIED: spouse; IF LIVING WITH A PARTNER: partner] Shi’a [PRONOUNCED SHE-uh], Sunni [PRONOUNCED SUE-knee], or another tradition? Shi’a Sunni Other (SPECIFY) Muslim, non-specific (VOL) Don’t know/Refused (VOL.) ASK IF SPOUSE/PARTNER BUDDHIST: Q.K3u Which of the following Buddhist groups, if any, does your [IF MARRIED: spouse; IF LIVING WITH A PARTNER: partner] identify with most closely? Theravada (PRONOUNCE: tare-ah-VAH-dah) Buddhism, Vipassana (PRONOUNCE: vi-PAHsah-nah) Buddhism, Mahayana (PRONOUNCE: mah-hah-YAH-nah) Buddhism (such as Zen, Son or Cha’n), Vajrayana (PRONOUNCE: vi-rah-YAH-nah) Buddhism (such as Tibetan), or something else? Theravada Buddhism Vipassana Buddhism Mahayana (Zen, Son, or Cha’n) Buddhism Vajrayana (Tibetan) Buddhism Jodo Shinshu (Higashi Honganji, Nishi Honganji) Buddhism (VOL.) Other Buddhist (SPECIFY) Buddhist not further specified (just a Buddhist) (VOL.) Don’t know/Refused (VOL.) www.pewresearch.org 183 PEW RESEARCH CENTER ASK IF SPOUSE/PARTNER HINDU: Q.K3v Which of the following Hindu groups, if any, does your [IF MARRIED: spouse; IF LIVING WITH A PARTNER: partner] identify with most closely? Vaishnava (PRONOUNCE: VAISH-nuh-vuh) Hinduism or Shaivite (PRONOUNCE: SHAI-vite) Hinduism, or is it something else? Vaishnava Hinduism Shaivite Hinduism Shaktism (PRONOUNCED: SHUCK-tism or SHOCK-tism) Hinduism (VOL.) ISKCON/Hare Krishna (VOL.) Vedanta (PRONOUNCED: vi-DAHN-tuh or vay-DAHN-tuh) (VOL.) Other Hindu (SPECIFY) Hindu not further specified (just Hindu) (VOL.) Don’t know/Refused (VOL.) www.pewresearch.org 184 PEW RESEARCH CENTER Summary Table: Religious Identity of Spouse/Partner of Survey Respondents (Based on those married or living with a partner, n=19,955) Evangelical Protestant Churches Baptist in the Evangelical Tradition Southern Baptist Convention Independent Baptist in the Evangelical Tradition Conservative Baptist Association of America Free Will Baptist General Association of Regular Baptists Missionary Baptist in the Evangelical Tradition Other Baptist in the Evangelical Tradition Methodist in the Evangelical Tradition Nondenominational in the Evangelical Tradition Nondenominational evangelical Nondenominational charismatic Interdenominational in the Evangelical Tradition Nondenominational fundamentalist Community Church in the Evangelical Tradition "Nondenominational Christian" in the Evangelical Tradition Other nondenominational in the Evangelical Tradition Lutheran in the Evangelical Tradition Lutheran Church, Missouri Synod Lutheran Church, Wisconsin Synod Other Lutheran in the Evangelical Tradition Presbyterian in the Evangelical Tradition Presbyterian Church in America Other Presbyterian in the Evangelical Tradition Pentecostal in the Evangelical Tradition Assemblies of God Church of God Cleveland TN Apostolic Pentecostal in the Evangelical Tradition Calvary Chapel Church of God of the Apostolic Faith Foursquare Church Nondenominational Pentecostal in the Evangelical Tradition Pentecostal Church of God Pentecostal Holiness Church Other Pentecostal in the Evangelical Tradition Episcopalian/Anglican in the Evangelical Tradition Restorationist in the Evangelical Tradition Churches of Christ Christian Churches and Churches of Christ Other Restorationist in the Evangelical Protestant Tradition Congregationalist in the Evangelical Tradition Conservative Congregational Christian Conference Other Congregationalist in the Evangelical Tradition Holiness in the Evangelical Tradition Church of the Nazarene Free Methodist Church Christian and Missionary Alliance Church of God (Anderson, Indiana) Wesleyan Church Other Holiness in the Evangelical Tradition Reformed in the Evangelical Tradition Christian Reformed Church Other Reformed in the Evangelical Tradition Adventist in the Evangelical Tradition Seventh-day Adventist Other Adventist group in the Evangelical Tradition Anabaptist in the Evangelical Tradition Pietist in the Evangelical Tradition Other Evangelical/Fundamentalist Protestant non-specific in the Evangelical Tradition % of U.S. Adult Pop % of U.S. Adult Pop 2014 2014 26 10 6 3 * * * * 1 * 4 2 * * * * * 1 2 1 * * 1 * * 4 2 * * * * * * * * 1 * 1 1 * * * * * 1 * * * * * * * * * 1 * * * * * 1 Mainline Protestant Churches Baptist in the Mainline Tradition American Baptist Churches USA Other Baptist in the Mainline Tradition Methodist in the Mainline Tradition United Methodist Church Other Methodist in the Mainline Tradition Nondenominational in the Mainline Tradition Interdenominational in the Mainline Tradition Other nondenominational in the Mainline Tradition Lutheran in the Mainline Tradition Evangelical Lutheran Church in America (ELCA) Other Lutheran in the Mainline Tradition Presbyterian in the Mainline Tradition Presbyterian Church USA Other Presbyterian in the Mainline Tradition Episcopalian/Anglican in the Mainline Tradition Episcopal Church Anglican Church (Church of England) Other Episcopalian/Anglican in the Mainline Tradition Restorationist in the Mainline Tradition Disciples of Christ Other Restorationist in the Mainline Tradition Congregationalist in the Mainline Tradition United Church of Christ Other Congregationalist in the Mainline Tradition Reformed in the Mainline Tradition Reformed Church in America Other Reformed in the Mainline Tradition Anabaptist in the Mainline Tradition Friends in the Mainline Tradition Other/Protestant nonspecific in the Mainline Tradition Historically Black Churches Baptist in the Historically Black Protestant Tradition National Baptist Convention Progressive Baptist Convention Independent Baptist in Historically Black Protestant Tradition Missionary Baptist in Historically Black Protestant Tradition Other Baptist in the Historically Black Protestant Tradition Methodist in the Historically Black Protestant Tradition African Methodist Episcopal African Methodist Episcopal Zion Church Christian Methodist Episcopal Church Other Methodist in the Historically Black Protestant Tradition Nondenominational in the Historically Black Protestant Tradition Pentecostal in the Historically Black Protestant Tradition Church of God in Christ Apostolic Pentecostal in the Historically Black Protestant Tradition United Pentecostal Church International Other Pentecostal in the Historically Black Protestant Tradition Holiness in the Historically Black Protestant Tradition Protestant non-specific in the Historically Black Protestant Tradition % of U.S. Adult Pop 2014 Catholic 25 1 1 Mormon 2 5 Jehovah's Witness 1 4 1 Orthodox Christian * 16 2 1 * 1 2 Greek Orthodox Russian Orthodox Orthodox Church in America Other Orthodox Christian * * * * 1 1 1 1 1 1 1 Other Christian Metaphysical Spiritualist Unity Church Other Metaphysical Other in the "Other Christian" tradition * * * * * * * * Jewish 2 * * Buddhist 1 Muslim 1 * * Hindu 1 * Other world religions * Other faiths 1 * 1 * * * * 2 4 2 1 * * * 1 * Unitarians and other liberal faiths Unitarian (Universalist) Spiritual but not religious Deist Humanist Bit of everything, "own beliefs" Other Liberal Faith Groups New Age Pagan/Wiccan Other New Age Native American Religions 1 * * * * * * * * * * * * * * * Unaffiliated Atheist Agnostic Nothing in particular 19 2 3 14 1 * * * * * 1 Don't know/refused 1 185 PEW RESEARCH CENTER ASK IF SPOUSE/PARTNER CHRISTIAN: SPBORN Would your [IF MARRIED: spouse; IF LIVING WITH A PARTNER: partner] describe themselves as a born-again or evangelical Christian, or not? Total Married/Living with a Partner and have a spouse/ partner who is Christian Yes, would No, would not 48 46 Don’t know/ Sample Refused (VOL) Total size 6 www.pewresearch.org 100 14,833 186 PEW RESEARCH CENTER ASK ALL: CHILDREN Are you the parent or guardian of any children under 18 now living in your household? (IF YES, ASK: And may I ask how many?) No, not the parent or guardian of any children under 18 living in household ENTER NUMBER 1-50 (PROGRAMMER: 50=50 OR MORE) No children one two three Four or more Total Sample size 71 65 69 65 74 70 12 13 12 13 12 12 10 13 11 13 10 12 4 6 5 6 3 5 2 3 3 3 2 1 100 100 100 100 100 100 34,933 35,431 8,560 9,443 6,062 7,451 70 13 9 2014 64 15 11 2007 70 12 10 Catholic 2014 61 13 15 2007 59 11 13 Mormon 2014 51 14 14 2007 70 10 14 Orthodox Christian 2014 70 9 14 2007 71 11 10 Jehovah’s Witness 2014 63 16 11 2007 76 8 7 Other Christian 2014 72 12 8 2007 74 9 11 Jewish 2014 72 9 11 2007 62 11 13 Muslim 2014 53 13 19 2007 80 7 10 Buddhist 2014 70 16 11 2007 61 15 21 Hindu 2014 52 21 24 2007 74 10 11 Other faiths 2014 69 15 12 2007 74 11 9 Unaffiliated 2014 67 13 13 2007 Based on total answering. Results recalculated to exclude non-response. 5 6 5 7 10 12 4 5 5 6 5 4 2 4 10 9 3 3 3 2 4 3 4 5 3 4 3 4 8 9 1 1 3 4 3 4 3 4 3 6 * 1 0 1 1 1 2 2 100 100 100 100 100 100 100 100 100 100 100 100 100 100 100 100 100 100 100 100 100 100 100 100 1,908 1,989 7,172 8,029 661 577 186 360 244 215 158 129 845 681 237 116 263 411 199 256 603 449 7,532 5,031 Total Answering Evangelical tradition Mainline tradition 2014 2007 2014 2007 2014 2007 Historically black Protestant tradition www.pewresearch.org 187 PEW RESEARCH CENTER ASK ALL: Now, just a few questions for statistical purposes only… ASK ALL: AGE What is your age? years 97 or older 18-29 30-49 50-64 22 34 26 2014 20 39 25 2007 17 33 29 Evangelical tradition 2014 17 39 26 2007 16 29 29 Mainline tradition 2014 14 36 28 2007 20 36 29 Historically black Protestant trad. 2014 24 36 24 2007 17 33 29 Catholic 2014 18 41 24 2007 22 40 22 Mormon 2014 24 42 19 2007 26 40 21 Orthodox Christian 2014 18 38 27 2007 15 34 29 Jehovah’s Witness 2014 21 39 25 2007 15 28 37 Other Christian 2014 16 35 27 2007 22 27 26 Jewish 2014 20 29 29 2007 44 37 13 Muslim 2014 33 46 17 2007 34 30 23 Buddhist 2014 23 40 30 2007 34 56 6 Hindu 2014 18 58 19 2007 28 37 25 Other faiths 2014 26 37 27 2007 35 37 19 Unaffiliated 2014 31 40 20 2007 Based on total answering. Results recalculated to exclude non-response. Total Answering www.pewresearch.org 65+ Total Sample size 18 16 20 19 26 23 15 15 20 16 16 15 13 17 23 14 20 22 26 22 5 3 14 7 4 5 9 10 9 8 100 100 100 100 100 100 100 100 100 100 100 100 100 100 100 100 100 100 100 100 100 100 100 100 100 100 100 100 100 100 34,345 34,695 8,417 9,281 5,946 7,271 1,873 1,942 7,061 7,856 651 565 177 358 238 207 157 127 825 664 234 114 259 410 194 250 600 437 7,437 4,947 188 PEW RESEARCH CENTER ASK ALL: EDUC What is the highest level of school you have completed or the highest degree you have received? [DO NOT READ] Less than high school (Grades 1-8 or no formal schooling) High school incomplete (Grades 9-11 or Grade 12 with NO diploma) High school graduate (Grade 12 with diploma or GED certificate) Some college, no degree (includes community college) Two year associate degree from a college or university Four year college or university degree/Bachelor’s degree (e.g. BS, BA, AB) Some postgraduate or professional school, no postgraduate degree (e.g. some graduate school) Postgraduate or professional degree, including master’s doctorate, medical or law degree (e.g., MA, MS, PhD, MD, JD, graduate school) [MAKE FULL NOTE AVAILABLE FOR INTERVIEWERS: Enter code 3-HS graduate” if R completed vocational, business, technical, or training courses after high school that did NOT count toward an associate degree from a college, community college or university (e.g., training for a certificate or an apprenticeship)] COLLAPSED EDUCATION CATEGORIES: NET H.S. graduate or less Some college NET College graduate+ 41 32 27 Total Answering 43 35 21 Evangelical tradition 37 30 33 Mainline tradition 52 33 15 Historically black Protestant trad. 46 27 26 Catholic 27 40 33 Mormon 27 34 40 Orthodox Christian 63 25 12 Jehovah’s Witness 26 43 31 Other Christian 19 22 59 Jewish 36 25 39 Muslim 20 33 47 Buddhist 12 11 77 Hindu 29 38 34 Other faiths 38 32 29 Unaffiliated Based on total answering. Results recalculated to exclude non-response. www.pewresearch.org Total 100 100 100 100 100 100 100 100 100 100 100 100 100 100 100 Sample size 34,868 8,545 6,045 1,905 7,157 662 185 241 158 843 237 262 197 601 7,532 189 PEW RESEARCH CENTER ASK ALL: EDUC What is the highest level of school you have completed or the highest degree you have received? [DO NOT READ] SEE PREVIOUS PAGE FOR FULL QUESTION WORDING EDUCATION TREND FOR COMPARISON: Total Answering Evangelical tradition Mainline tradition Historically black Protestant trad. Catholic Mormon Orthodox Christian Jehovah’s Witness Other Christian Jewish Muslim Buddhist Hindu Other faiths Unaffiliated 2014 2007 2014 2007 2014 2007 Less than college 73 73 79 80 67 66 College graduate 27 27 21 20 33 34 Total 100 100 100 100 100 100 Sample size 34,868 35,298 8,545 9,411 6,045 7,429 2014 2007 2014 2007 2014 2007 2014 2007 2014 2007 2014 2007 2014 2007 2014 2007 2014 2007 2014 2007 2014 2007 2014 2007 85 84 74 74 67 71 60 54 88 92 69 60 41 41 61 60 53 52 23 26 66 61 71 71 15 16 26 26 33 29 40 46 12 8 31 40 59 59 39 40 47 48 77 74 34 39 29 29 100 100 100 100 100 100 100 100 100 100 100 100 100 100 100 100 100 100 100 100 100 100 100 100 1,905 1,985 7,157 7,990 662 578 185 362 241 211 158 129 843 676 237 115 262 408 197 253 601 448 7,532 5,009 Based on total answering. Results recalculated to exclude non-response. In 2007 this question read: “What is the last grade or class that you completed in school?” As in 2014, the 2007 question was open-ended, but, in 2007, interviewers had a different set of pre-coded response options to choose from, making comparisons of more specific categories difficult. www.pewresearch.org 190 PEW RESEARCH CENTER ASK ALL: Q.P2 In what country were you born? [DO NOT READ LIST; CODE 1 FOR U.S.; USE PRECODED LIST FOR OTHER COUNTRIES; PROBE FOR COUNTRY IF CONTINENT OR REGION GIVEN; IF RESPONDENT INDICATES THEY WERE BORN IN U.S.S.R., PROBE FOR SPECIFIC COUNTRY] NOTE: COUNTRIES HAVE BEEN RECODED INTO MAJOR GEOGRAPHIC REGIONS TREND FOR 2007 PROVIDED FOR COMPARISON PURPOSES. SEE FULL QUESTION WORDING BELOW. Full Sample Evangelical tradition Mainline tradition Historically black Prot. trad. Catholic Mormon Orthodox Christian 2014 2007 2014 2007 2014 2007 2014 2007 2014 2007 2014 2007 2014 U.S. Americas (excluding U.S.) Asia/ Pacific 85 88 91 93 93 95 93 95 72 76 92 93 59 9 8 6 4 3 2 4 3 22 19 5 4 2 3 2 1 1 1 1 * * 2 1 1 2 7 Europe Middle East/ North Africa SubSaharan Africa Other/ Undetermined DK/ Ref Total 2 2 1 1 2 2 * * 2 2 1 1 20 * * * * * * 0 0 * * 0 0 4 1 * * * * * 2 1 * * 0 0 7 * * * * 0 * * * * * 0 * 0 * * * * * * 1 1 * * 1 * 1 100 100 100 100 100 100 100 100 100 100 100 100 100 62 2 6 19 8 3 * 0 100 2007 74 24 * 1 0 1 0 * 100 Jehovah’s Witness 2014 83 14 * 1 0 * 1 * 100 2007 90 7 0 2 0 0 0 1 100 Other Christian 2014 94 3 0 0 1 0 0 2 100 2007 88 4 1 5 2 * 0 * 100 Jewish 2014 89 1 1 6 2 * * * 100 2007 36 3 27 7 12 12 1 2 100 Muslim 2014 53 4 19 5 11 6 2 * 100 2007 74 3 21 * 1 0 0 1 100 Buddhist 2014 74 1 22 2 * 0 1 0 100 2007 13 7 78 * 0 2 * * 100 Hindu 2014 14 7 75 2 0 1 1 * 100 2007 93 3 1 2 * * 0 1 100 Other faiths 2014 95 2 1 2 0 0 * 0 100 2007 87 6 3 3 * * * * 100 Unaffiliated 2014 88 7 3 2 * * * * 100 2007 In 2007 respondents were first asked “Were you born in the United States, or in another country?” Those who were born outside the United States were then asked “In what country were you born?” www.pewresearch.org 191 PEW RESEARCH CENTER ASK ALL: Q.P2 In what country were you born? [DO NOT READ LIST; CODE 1 FOR U.S.; USE PRECODED LIST FOR OTHER COUNTRIES; PROBE FOR COUNTRY IF CONTINENT OR REGION GIVEN; IF RESPONDENT INDICATES THEY WERE BORN IN U.S.S.R., PROBE FOR SPECIFIC COUNTRY] ASK IF BORN OUTSIDE THE U.S./PUERTO RICO: Q.P3 Are you currently a citizen of the United States, or not? Full Sample Evangelical tradition Mainline tradition Historically black Protestant trad. Catholic Mormon Orthodox Christian Jehovah’s Witness Other Christian Jewish Muslim Buddhist Hindu Other faiths Unaffiliated 2014 2007 2014 2007 2014 2007 2014 2007 2014 2007 2014 2007 2014 2007 2014 2007 2014 2007 2014 2007 2014 2007 2014 2007 2014 2007 2014 2007 2014 2007 Respondent is a citizen Respondent is not a citizen Total 93 94 96 97 97 98 98 98 86 87 97 97 87 91 86 89 98 98 98 98 76 88 95 93 49 60 98 99 94 94 7 6 4 3 3 2 2 2 14 13 3 3 13 9 14 11 2 2 2 2 24 12 5 7 51 40 2 1 6 6 100 100 100 100 100 100 100 100 100 100 100 100 100 100 100 100 100 100 100 100 100 100 100 100 100 100 100 100 100 100 The “Respondent is a citizen” column includes those who were born in the U.S. or Puerto Rico as well as those who answered QP3 affirmatively. The 2007 survey did not include QP2, but rather asked respondents “Were you born in the United States, or in another country?” Those who were born outside the United States were then asked “In what country were you born?” Respondents answering that question by indicating they were born in U.S. territories (such as Guam or another U.S. territory) are included in the “Respondent is a citizen” column. www.pewresearch.org 192 PEW RESEARCH CENTER ASK ALL: Q.P2 In what country were you born? [DO NOT READ LIST; CODE 1 FOR U.S.; USE PRECODED LIST FOR OTHER COUNTRIES; PROBE FOR COUNTRY IF CONTINENT OR REGION GIVEN; IF RESPONDENT INDICATES THEY WERE BORN IN U.S.S.R., PROBE FOR SPECIFIC COUNTRY] ASK IF BORN OUTSIDE THE U.S.: Q.P4 In what year did you come to live in the U.S? [RECORD VERBATIM RESPONSE] RECORD RANGE 1900-2014 ------------------------ Immigrated ------------------------- Born in U.S. 1900- 19601959 1969 19701979 1980- 1990- 20001989 1999 2007 20082014 Don’t know/ Refused (VOL) Total 85 1 1 1 2 3 3 2 1 100 2014 88 1 1 1 2 3 2 N/A 1 100 2007 91 * 1 1 1 2 2 1 * 100 Evangelical tradition 2014 93 * 1 1 2 2 1 N/A * 100 2007 93 1 1 1 1 1 1 1 * 100 Mainline tradition 2014 95 1 1 1 1 1 1 N/A * 100 2007 93 * * * 1 1 2 1 1 100 Historically black Prot. trad. 2014 96 * * * 1 1 1 N/A * 100 2007 73 1 2 3 5 6 6 3 2 100 Catholic 2014 77 1 2 2 5 7 5 N/A 2 100 2007 93 * * 1 2 1 3 * * 100 Mormon 2014 93 * 1 2 1 2 1 N/A 0 100 2007 60 2 4 4 2 9 14 5 1 100 Orthodox Christian 2014 2007 62 3 3 5 8 11 7 N/A 1 100 75 1 * 2 5 6 6 3 2 100 Jehovah’s Witness 2014 83 1 1 2 2 6 4 N/A * 100 2007 92 * * 0 3 3 2 0 0 100 Other Christian 2014 96 1 2 0 0 1 0 N/A 0 100 2007 88 2 1 1 2 2 1 1 1 100 Jewish 2014 90 1 2 2 2 2 1 N/A 0 100 2007 38 * 1 2 7 21 10 18 2 100 Muslim 2014 54 * 1 8 13 11 11 N/A 2 100 2007 74 * * 3 8 6 5 3 1 100 Buddhist 2014 74 2 2 4 8 6 4 N/A * 100 2007 13 * 1 4 6 18 27 31 * 100 Hindu 2014 14 1 4 12 17 29 20 N/A 5 100 2007 94 * * 1 1 1 2 * * 100 Other faiths 2014 95 1 1 1 1 1 * N/A 0 100 2007 87 * 1 1 1 3 3 2 * 100 Unaffiliated 2014 88 1 1 2 2 4 2 N/A 1 100 2007 The 2007 survey did not include QP2, but rather asked respondents if they were born in the U.S. or another country. See full question wording on table QP2. “Born in U.S.” column also includes those who responded “don’t know” when asked what country they were born in. These respondents did not receive the follow up question about year of immigration. Full Sample www.pewresearch.org 193 PEW RESEARCH CENTER ASK IF BORN IN U.S.: Q.P6 In what country was your father born? [DO NOT READ LIST; IF “SAME,” SELECT COUNTRY; CODE 1 FOR U.S.; USE PRECODED LIST FOR OTHER COUNTRIES; PROBE FOR COUNTRY IF CONTINENT OR REGION GIVEN; IF RESPONDENT INDICATES THEY WERE BORN IN U.S.S.R., PROBE FOR SPECIFIC COUNTRY] NOTE: COUNTRIES HAVE BEEN RECODED INTO MAJOR GEOGRAPHIC REGIONS: Full Sample Evangelical tradition Mainline tradition Historically black Protestant trad. Catholic Mormon Orthodox Christian Jehovah’s Witness Other Christian Jewish Muslim Buddhist Hindu Other faiths Unaffiliated U.S. Americas (excluding U.S.) Asia/ Pacific 77 85 88 88 60 88 37 67 86 71 19 56 4 85 77 4 3 2 2 6 2 2 4 1 1 * 4 2 3 4 1 * * * 1 * 1 1 1 1 5 8 7 * 2 Europe Middle East/ North Africa SubSaharan Africa Other/ Undetermined DK/ Ref 2 1 2 * 5 1 12 2 1 13 * 4 1 3 2 * * * 0 * 0 7 0 1 2 7 0 0 0 * * * * 1 * 0 1 * 0 * 1 0 * 0 * * * * 0 * 0 0 0 0 * 0 0 0 0 * 1 1 1 1 1 * * * 0 * 3 1 0 1 1 1 Undesignated 1 Resp. not born in U.S. Total * * * 0 * 0 0 0 0 0 0 0 0 0 1 15 9 7 7 28 8 41 26 10 12 64 26 87 7 13 100 100 100 100 100 100 100 100 100 100 100 100 100 100 100 For some questions asked of a subset of eligible respondents and filtered on previous questions subject to backcoding, the term “undesignated” is used to denote those respondents who did not receive the question even though they should have received it. www.pewresearch.org 194 PEW RESEARCH CENTER ASK IF BORN IN U.S.: Q.P7 In what country was your mother born? [DO NOT READ LIST; IF “SAME,” SELECT COUNTRY; CODE 1 FOR U.S.; USE PRECODED LIST FOR OTHER COUNTRIES; PROBE FOR COUNTRY IF CONTINENT OR REGION GIVEN; IF RESPONDENT INDICATES THEY WERE BORN IN U.S.S.R., PROBE FOR SPECIFIC COUNTRY] NOTE: COUNTRIES HAVE BEEN RECODED INTO MAJOR GEOGRAPHIC REGIONS: Full Sample Evangelical tradition Mainline tradition Historically black Protestant trad. Catholic Mormon Orthodox Christian Jehovah’s Witness Other Christian Jewish Muslim Buddhist Hindu Other faiths Unaffiliated U.S. Americas (excluding U.S.) Asia/ Pacific 78 86 88 90 61 87 44 69 87 74 21 55 4 88 78 3 3 2 2 6 3 * 3 2 1 2 5 2 2 4 1 1 1 * 1 1 1 0 * * 4 11 7 * 2 Europe Middle East/ North Africa SubSaharan Africa Other/ Undetermined DK/ Ref 2 1 2 * 4 1 11 1 1 11 1 3 * 2 3 * * * 0 * 0 3 0 0 2 7 0 0 0 * * * * * * 0 1 * 0 * * 0 * 0 * * * * 0 * 0 0 0 0 0 0 0 0 * * * * * 1 * 0 * * 0 0 * 0 0 1 * www.pewresearch.org Resp. not born Undesin ignated U.S. * * * 0 * 0 0 0 0 0 0 0 0 0 * 15 9 7 7 28 8 41 26 10 12 64 26 87 7 13 Total 100 100 100 100 100 100 100 100 100 100 100 100 100 100 100 195 PEW RESEARCH CENTER ASK ALL: INCOME Last year, that is in 2013, what was your total family income from all sources, before taxes? Just stop me when I get to the right category. [READ IN ORDER] Less than $10,000; 10 to under $20,000; 20 to under $30,000; 30 to under $40,000; 40 to under $50,000; 50 to under $75,000; 75 to under $100,000; 100 to under $150,000; $150,000 or more ASK IF INCOME EXCEEDS $150,000: INCOME2 And was that [READ LIST]? 150 to under $200,000; $200 to under $250,000; 250 to under $300,000 [OR] $300,000 or more Less than $30,000 30 to under $50,000 50 to under $75,000 75 to under $100,000 100 to under $150,000 $150,000 or more Total Sample size 35 20 15 12 11 8 100 30,490 2014 31 22 17 13 10 8 100 29,435 2007 35 22 16 12 9 6 100 7,462 Evangelical tradition 2014 34 24 18 11 8 5 100 7,943 2007 29 20 14 14 13 10 100 5,208 Mainline tradition 2014 25 21 18 15 12 9 100 6,142 2007 53 22 11 7 5 3 100 1,704 Historically black Prot. trad. 2014 47 26 12 7 4 4 100 1,656 2007 36 19 14 12 10 8 100 6,137 Catholic 2014 31 20 16 14 11 8 100 6,565 2007 27 20 18 16 14 6 100 594 Mormon 2014 26 21 22 16 9 7 100 512 2007 18 17 19 18 17 12 100 155 Orthodox Christian 2014 20 24 16 13 13 15 100 290 2007 48 25 14 8 3 1 100 208 Jehovah’s Witness 2014 42 23 17 9 5 4 100 178 2007 28 25 14 11 13 8 100 148 Other Christian 2014 29 21 13 13 11 12 100 111 2007 16 15 11 14 18 27 100 708 Jewish 2014 14 11 17 12 17 29 100 520 2007 34 17 20 9 11 9 100 205 Muslim 2014 n/a n/a n/a n/a n/a n/a n/a n/a 2007 36 18 19 13 8 5 100 233 Buddhist 2014 25 19 17 17 8 14 100 357 2007 17 13 14 20 20 16 100 172 Hindu 2014 9 10 15 22 20 23 100 220 2007 38 16 15 12 9 10 100 542 Other faiths 2014 28 25 16 13 8 10 100 378 2007 33 20 14 12 11 9 100 6,790 Unaffiliated 2014 29 23 16 13 10 9 100 4,279 2007 Based on total answering. Results recalculated to exclude non-response. In 2007, the sample size for Muslims is too small to be shown. In 2007 respondents saying their family income was $150,000 or more did not receive the follow up question, INCOME2. Total Answering www.pewresearch.org 196 PEW RESEARCH CENTER ASK ALL: HH1 How many people, including yourself, live in your household? INTERVIEWER NOTE: HOUSEHOLD MEMBERS INCLUDE PEOPLE WHO THINK OF THIS HOUSEHOLD AS THEIR PRIMARY PLACE OF RESIDENCE, INCLUDING THOSE WHO ARE TEMPORARILY AWAY ON BUSINESS, VACATION, IN A HOSPITAL, OR AWAY AT SCHOOL. THIS INCLUDES INFANTS, CHILDREN AND ADULTS. Enter number 1-7 8 or more Don’t know/Refused Full Sample Evangelical tradition Mainline tradition Historically black Protestant trad. Catholic Mormon Orthodox Christian Jehovah’s Witness Other Christian Jewish Muslim Buddhist Hindu Other faiths Unaffiliated 1 person 2 people 3-4 people 5 or more people 15 14 16 20 14 8 15 14 24 15 11 16 15 20 16 32 33 38 28 30 24 30 29 28 36 14 28 22 31 31 36 36 34 34 37 31 42 37 34 34 38 39 43 37 38 16 16 12 15 19 34 12 19 11 13 36 15 19 12 14 www.pewresearch.org Don't know/ Refused (VOL) Total 1 1 1 2 1 3 1 1 3 2 2 2 1 1 1 100 100 100 100 100 100 100 100 100 100 100 100 100 100 100 197 PEW RESEARCH CENTER ASK IF MORE THAN ONE PERSON IN HH: HH3 How many, including yourself, are adults, age 18 and older? Enter number 1-7 8 or more Don’t know/Refused Total with more than 1 person Evangelical tradition Mainline tradition Historically black Protestant trad. Catholic Mormon Orthodox Christian Jehovah’s Witness Other Christian Jewish Muslim Buddhist Hindu Other faiths Unaffiliated 1 adult 2 adult 3-4 adults 5 or more adults 5 5 4 13 4 3 1 4 2 3 3 4 1 6 5 59 61 65 52 56 56 65 56 63 65 45 52 59 58 57 31 29 28 29 34 34 33 32 29 26 42 37 30 31 32 4 4 2 4 5 6 1 9 1 5 9 5 9 5 4 www.pewresearch.org Don't know/ Refused (VOL) Total 1 1 1 2 1 1 1 * 5 2 1 2 2 1 1 100 100 100 100 100 100 100 100 100 100 100 100 100 100 100 Sample size 27,908 6,956 4,701 1,436 5,786 586 147 201 106 670 210 207 171 436 6,042 198 PEW RESEARCH CENTER READ TO ALL: For statistical purposes I have to ask just a couple of final questions… ASK ALL: FERT How many children have you ever had? Please count all your biological children who were born alive at any time in your life. [INTERVIEWER NOTE: IF R ASKS WHETHER ADOPTED CHILDREN OR STEPCHILDREN SHOULD BE INCLUDED, SAY: No, we’re asking you only to count all your biological children who were born alive at any time in your life; IF R IS UNCOMFORTABLE WITH THIS QUESTION, SAY: We understand that this is a sensitive question. We ask it in this way for a very specific research purpose – so that we can estimate the total fertility rate of the population. IF R IS UNCOMFORTABLE SPECIFICALLY BECAUSE THE QUESTION DOES NOT INCLUDE ADOPTED CHILDREN, SAY: It’s not that we’re not interested in adoption. It’s just that this question is asked for the very specific purpose of trying to estimate the total fertility rate of the population.] [RECORD RESPONSE (Range 0-50)] Full Sample Evangelical tradition Mainline tradition Historically black Protestant trad. Catholic Mormon Orthodox Christian Jehovah’s Witness Other Christian Jewish Muslim Buddhist Hindu Other faiths Unaffiliated No children 1 or 2 children Three or more children 31 23 26 24 27 25 44 26 38 34 49 55 54 43 47 38 42 45 37 36 21 36 39 39 39 25 32 36 39 34 29 34 28 37 36 53 16 34 20 26 24 12 9 16 18 www.pewresearch.org Don't know/ Refused (VOL) Total 1 1 1 2 1 1 4 1 3 1 1 1 1 2 1 100 100 100 100 100 100 100 100 100 100 100 100 100 100 100 199 PEW RESEARCH CENTER ASK ALL: SEXASK Are you male or female? [DO NOT READ LIST] Male Female Other (VOL.) Don’t know (VOL.) Refused (VOL.) Full Sample Evangelical tradition Mainline tradition Historically black Protestant tradition Catholic Mormon Orthodox Christian Jehovah’s Witness Other Christian Jewish Muslim Buddhist Hindu Other faiths Unaffiliated 2014 2007 2014 2007 2014 2007 2014 2007 2014 2007 2014 2007 2014 2007 2014 2007 2014 2007 2014 2007 2014 2007 2014 2007 2014 2007 2014 2007 2014 2007 Male Female Total 48 48 45 47 45 46 41 40 46 46 46 44 56 46 35 40 50 46 52 52 65 58 51 53 62 61 50 54 57 59 52 52 55 53 55 54 59 60 54 54 54 56 44 54 65 60 50 54 48 48 35 42 49 47 38 39 50 46 43 41 100 100 100 100 100 100 100 100 100 100 100 100 100 100 100 100 100 100 100 100 100 100 100 100 100 100 100 100 100 100 In 2007 figures are based on interviewer assessment of respondent’s gender. In 2014 results are based on responses to SEXASK unless the respondent did not identify as male or female, in which case results are based on interviewer assessment of the respondent’s gender. www.pewresearch.org 200 PEW RESEARCH CENTER ASK ALL: LGBT Do you personally think of yourself as [READ IN ORDER] ONE, [IF MALE, INSERT: gay,; FOR ALL OTHERS, INSERT: gay or lesbian,], TWO, straight, that is, not gay, or THREE, bisexual? Total Evangelical tradition Mainline tradition Historically black Protestant trad. Catholic Mormon Orthodox Christian Jehovah’s Witness Other Christian Jewish Muslim Buddhist Hindu Other faiths Unaffiliated Gay or lesbian Straight, that is, not gay Bisexual Something else Don’t Know Refused Total 2 1 2 2 2 1 4 * 6 2 1 3 * 7 4 92 95 94 93 90 96 91 89 87 92 93 84 89 79 89 3 2 2 2 2 1 1 3 2 3 2 11 6 11 5 * * * * * * * 0 1 * 0 0 0 2 * 1 1 1 * 2 1 * 5 3 1 2 0 * * 1 2 1 1 3 3 1 4 3 2 2 1 1 4 1 1 100 100 100 100 100 100 100 100 100 100 100 100 100 100 100 www.pewresearch.org


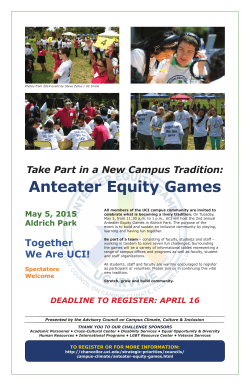

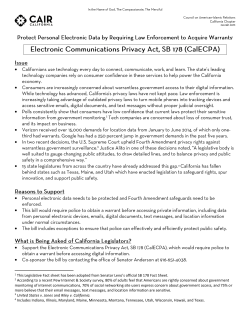


© Copyright 2026