
E-Government Portal Updates` Evaluation:
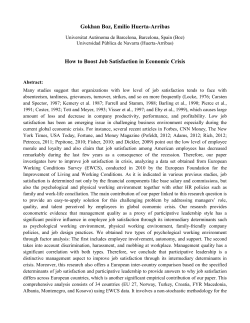
54 International Journal of Public Administration in the Digital Age, 2(2), 54-74, April-June 2015
E-Government Portal
Updates’ Evaluation:
A Comparative Analysis
Leonidas Anthopoulos, Business School, Technological Education Institute of Thessaly,
Thessaly, Greece
Kleanthis Sirakoulis, Business School, Technological Education Institute of Thessaly,
Thessaly, Greece
ABSTRACT
More than a decade has passed since the launch of the initial e-Government one-stop web portals, which
concern central points for digital access by citizens, enterprises and government. Due to the broad audience
that these portals serve, various analyses have been performed concerning their effectiveness with regard to
service delivery; trustworthiness with regard to service availability; usability; accessibility; and user satisfaction etc. The results from these analyses have extreme interest for governments, since they reflect government
strategic performance, internal efficiency and effectiveness, while they have been utilized for their upgrades.
E-Government portal upgrade appears to be something usual and various updates have been observed in most
portals during this timeframe. This paper addresses and important issue: “do e-Government portal updates
enhance user satisfaction?” To this end, a comparative qualitative evaluation of some major e-Government
portals is performed, with the use of the American Customer Satisfaction Index (ACSI) during 2009 and 2012.
Keywords:
Accessibility, e-Government, Evaluation, One-Stop, Portal, Usability, User Satisfaction
1. INTRODUCTION
E-Government has been introduced since the
early 1990s as the means to transform government processes to more effective, efficient and
transparent ones; to engage citizens in policy
and decision making; and to modernize public
processes in general (Anthopoulos & Fitsilis,
forthcoming). This government transformation
has been based on various initiatives, according
to a corresponding e-strategic planning, which
concern –among others- investments on information and communication technologies (ICT);
civil servants’ training on ICT skills; diffusion
programs such as, campaigns; public process
reengineering; and respective legislature’s
alignment etc. All these efforts result in citizen
points of access that deliver public information
and services to target audiences.
Alternative points of government access are
named channels (Janssen et al., 2003; Vasilakis
et al., 2007; Reddick & Turner, 2012) and con-
DOI: 10.4018/ijpada.2015040104
Copyright © 2015, IGI Global. Copying or distributing in print or electronic forms without written permission of IGI Global is prohibited.
International Journal of Public Administration in the Digital Age, 2(2), 54-74, April-June 2015 55
cern web portals, call centers, traditional office
visits etc. Channels’ performance reflects public
sector’s efficiency and effectiveness, since service and information delivery is the outcome
of the public internal processes. Effectiveness
deals with the quality of public services and
the degree of its independence from political
willing; the quality of policy formulation and
implementation; and the credibility of the government’s commitment to such policies (World
Bank, 2012). On the other hand, government
efficiency concerns public sector performance
or productivity rates and it is mainly associated
with public spending effects to socio-economic
indicators (Hauner & Kyobe, 2008). Both these
definitions justify that these points of access
deliver information and service flows according
to the existing public sector’s efficiency and
effectiveness and to this end, their performance
is important to be measured.
This paper focuses on web channels and
more specifically to the one-stop e-Government
portals, which concern single-points, centrally
official websites, from which citizens access
their governments (Wimmer, 2002; Anthopoulos et al., 2007). The existence of one-stop
e-Government portals requires (Wimmer, 2002)
interconnected agencies; service integration;
and content and service presentation in a logical
manner. Such portals are supposed to be unique
for national cases, as well as for supranational
efforts. Indicative representatives concern USA.
gov (for the U.S. Federal Government); Gov.uk
(for the U.K. Government) etc., while youreurope.eu is a representative supranational case.
The evaluation of e-Government portals
and websites has been approached by various
scholars, while e-Government assessment
alone is of great scientific and political interest.
However, the evaluation of one-stop portals’
updates has not been investigated. More specifically, although most of these portals have
been updated –even more than once- from
their initial appearance, which could be justified by corresponding technological evolution,
service integration or usability improvements,
the outcome from these updates has not been
measured. For instance, USA.gov initially ap-
peared as FirstGov (in late 1990s) (Thompson
et al., 2003) and it was updated to at least 3
versions until today.
With regard to portals’ updates, this paper
aims to answer the following questions: “how
can end-user satisfaction from one-stop eGovernment web portals be measured?” and
“do e-Government portal updates enhance
user satisfaction?”. These two questions are
crucial to be answered for e-Government
scholars. More specifically, the answer to the
first question will explore existing satisfaction
measurement methods from e-Government
portals. On the other hand, the answer to the
second question will demonstrate whether onestop portals’ updates succeed in their mission,
which should be the end-user satisfaction against
previous versions.
The remaining of this paper is structured as
follows: section 2 presents the context of onestop e-government portals and compares user
satisfaction methods. In section 3 the research
method and the corresponding domain study
are illustrated, while the extracted findings are
summarized and discussed. Finally, section 4
contains results and future thoughts.
2. BACKGROUND
This section presents the theoretical context
of one-stop e-Government portals and e-Government satisfaction. One-stop e-Government
concerns a single point of access to public
information and services offered even-by different public authorities (Wimmer, 2002). The
existence of online one-stops requires agencies’
interconnection, integration and interoperability -mainly based on open standards-, while
end-users (citizens, enterprises or other public
agencies) are must hold the appropriate skills
and infrastructure to access these single points
of access (Borras, 2004). From their appearance
in late 1990s one-stop portals were primary
based on e-commerce technologies in order to
deliver online services via web and voice channels to e-Government end-users (Anthopoulos
et al., 2007). Most of them adopted usability
Copyright © 2015, IGI Global. Copying or distributing in print or electronic forms without written permission of IGI Global is prohibited.
56 International Journal of Public Administration in the Digital Age, 2(2), 54-74, April-June 2015
Table 1. e-Government web portal evaluation frameworks/models
e-Government web portal evaluation framework/
model
Scholars
W3C WAI
Taufik et al. (2007)
Usability Assessment Framework
Nielsen (1993); Silius & Tervakari (2003); Large et al.
(2002); Glassey & Glassey (2004); Wilder (2007)
Usability; Content consistency; and Openness
Kokkinari et al. (2005)
Web Diagnostic Tools
Choudrie et al. (2004)
TAM and Section 508 Guidelines
Jaeger & Matterson (2009)
Formative and Summative
Thompson et al. (2003)
Five-index evaluation model
Garcia et al. (2005)
(Wilder, 2007) and accessibility (Taufik et al.,
2007) features early, as a means to enhance
end-users’ satisfaction (Zhang & von Dran,
2000). These features vary from World Wide
Web Consortium’s (W3C) Web Accessibility
Initiative (WAI) standards to even localization
options in terms of cultural and social trends and
habits (del Rio, 2013). To this end, Reddick &
Turner (2012) determine that user satisfaction
impacts service channel selection and concluded
that e-Government rather becomes an alternative –to traditional channels- mean for citizens
to access their governments, instead of a global
change for public transactions.
The evaluation of e-Government portals
(Table 1) can be performed with means of
usability’s evaluation, basically presented by
Nielsen (1993) and later adopted by other
scholars for web portal evaluation (i.e., Silius
& Tervakari (2003); Large et al. (2002); Glassey
& Glassey (2004)). Kokkinari et al. (2005) extended Nielsen’s framework in order to evaluate
a set of Cyprian e-Government portals. In their
analysis, they considered except from usability
features others related to content’s consistency
and simplicity; and openness to the public.
Choudrie et al. (2004) used web diagnostic tools
to evaluate e-Government web sites. Jaeger
& Matteson (2009) evaluated e-Government
website with the examination of the Technology
Acceptance Model (TAM) and the adoption of
Section 508 Guidelines. Thompson et al. (2003)
combined all the above techniques and per-
formed a normative and summative evaluation
of federal e-Government web portals. Garcia et
al. (2005) introduced a five-index model, which
evaluates e-Government web portals according
to cognitive effort; tolerance; reach; physical
effort; and trust.
With regard to satisfaction’s context, the
Expectation-Confirmation Theory (ECT) (Oliver, 1980) states that consumers ground their
initial expectation -prior to purchase- and after a
period of initial consumption they build perceptions about the performance of the consumed
product/service. Next, consumers will decide
on their level of satisfaction based on the extent
to which their expectation is confirmed through
comparing the actual performance of the product/service against their initial expectation of
the performance (Alawneh et al., 2013). Satisfied consumers form re-purchasing intentions,
which is called consumer loyalty.
Beyond the abovementioned technical and
usability criteria, authors performed a literature
review with regard to e-Government satisfaction
measurement and identified various existing
frameworks and models (Table 2). One-stop
e-Government portals’ performance and corresponding satisfaction has been investigated
by various scholars and organizations so far
and alternative models can be located (Fitsilis
et al., 2010). These models can be aggregated
in satisfaction’s direct and indirect measurements. Direct for instance, are utilized by Cap
Gemini, which has performed annual investiga-
Copyright © 2015, IGI Global. Copying or distributing in print or electronic forms without written permission of IGI Global is prohibited.
International Journal of Public Administration in the Digital Age, 2(2), 54-74, April-June 2015 57
Table 2. Literature review on e-Government satisfaction measurement
e-Government Evaluation
Framework/Model
Direct/Indirect Satisfaction
Measurement
Scholars/Organization
e-Government project success
evaluation framework
Indirect
Fitsilis et al. (2010)
e-Government benchmark
framework
Direct
Capgemini (2011)
American Customer Satisfaction
Index (ACSI)
Direct
Accenture (2012), Park (2007)
e-Service Quality
Indirect
Magoutas et al. (2007);
Papadomichelaki & Mentzas (2012)
e-Government Readiness
Indirect
Tucker (2012), United Nations
(2012)
COBRA
Indirect
Osman et al. (2011)
e-Government Acceptance Model
Indirect
Park (2007)
e-Satisfaction Determinants
Direct
Alawneh et al. (2013)
tions since 2001, with regard to online availability of public services across Europe (Cap
Gemini, 2011). Cap Gemini has introduced an
e-Government benchmark framework, which
aims to measure user satisfaction (Cap Gemini,
2012), via comparing user experience from
public service execution, with experiences
from non-governmental services (i.e., banking
services). Moreover, Accenture (2009; 2012)
has performed various investigations concerning citizen satisfaction from e-Government
services. These measurements have been based
on the American Customer Satisfaction Index
(ACSI) and recognized early dissatisfaction in
2005 (when citizens turned back to traditional
channels), while today digital citizens appear
to demand more from their governments:
findings from U.S.A. show that the majority
of people would use digital services if offered
by government, especially for routine transactions. And over half want to conduct all their
government business digitally in the future
(Accenture, 2012).
On the other hand, indirect measurements
focus on service availability and quality. Magoutas et al. (2007) for instance, introduced an
e-service quality measurement model; Papadomichelaki & Mentzas (2012) measured e-service
quality too, with a multiple-item scale model;
Tucker (2012) compared several assessment
instruments (i.e., SERVQUAL, governance,
Strategic Alignment Model etc.) and concluded
on an e-Government readiness model, which
measures organization’s efficiency for e-service
delivery. This approach has similarities to the
United Nations (UN) e-Government Readiness
Index (EGDI) (United Nations, 2012), which
measures respective public sector’s internal
capacity. Readiness lies behind one-stop portal’s
performance since it corresponds to service
availability and quality. However, EGDI is
analyzed in three other indexes, one of which is
the Online Service Index, which measures service availability and accessibility. Osman et al.
(2011) compared various e-government Value
Measurement Models (VMM), e-Government
success models and e-Government Service
Quality models and introduced their individual
evaluation framework, which associates satisfaction with Costs, Opportunities, Benefits
and Risks Analysis. Park (2007) compared
the introduced an e-Government acceptance
model, which was based on the combination
of three widely accepted theoretical evaluation
models (SERVQUAL, ACSI and Technology
Acceptance Model (TAM)). Alawneh et al.
Copyright © 2015, IGI Global. Copying or distributing in print or electronic forms without written permission of IGI Global is prohibited.
58 International Journal of Public Administration in the Digital Age, 2(2), 54-74, April-June 2015
(2013) validated a set of determinants, which
influence user satisfaction from e-Services:
security and privacy; trust; accessibility; awareness; and quality.
All the above findings give answer to
the first question of this article with regard to
“how can end-user satisfaction from one-stop
e-Government web portals be measured”. More
specifically, literature findings depict that enduser satisfaction can be measured either directly
with qualitative studies or via service quality
evaluation; or indirectly with the assessment of
technical features, web metrics, service quality
or acceptance models. Although this literature
review was not exhaustive, it returns a broad
picture concerning how different schools
of thought propose methods for one-stop eGovernment evaluation.
3. DOMAIN STUDY
In order to answer the second question of this
paper, this section contains qualitative findings
from the evaluation of the updates of some major
one-stop e-government portals. The selection
of the examined portals occurred in late 2009
for the purposes of the module “Graduate
Seminar”, which is performed at the Project
Management Department of the Technological
Education Institute (TEI) of Thessaly, Greece.
Only students who have fulfilled their studies
and are close to their graduation can attend
this module, while the context of this module
concerned e-Government Strategic and Project
Management during the academic years from
2009 to 2012. Among the other teaching context,
students investigated and became aware of the
Greek one-stop e-Government portal, named
ERMIS (www.ermis.gov.gr), as a means to
define initial expectations from a corresponding website and to evaluate their satisfaction
accordingly.
3.1. Research Methodology
A sample of a total amount of 256 students
was participated during the period lasted from
October 2009 to June 2012 in a qualitative
survey over their satisfaction from different
one-stop e-Government portals. This sample
was homogeneous, consisting of young citizens
all aged between 22 and 24, all completing
their graduate educational level; they were all
good English speakers, which was the primary
language in all the examined cases, except from
the German case, which is offered in English too.
However, even the German case was examined
in the German language for the corresponding
e-service execution, with the support of German translators. Moreover, all students where
taught about one-stop e-Government under
the Graduate Seminar module and the Greek
respective portal. The participation was obligatory for the purposes of this module, while two
different tutors observed students’ attitudes
during this study in order to secure survey’s
objectivity. In this paper the findings from the
analysis only from the 63 of the participants
is presented, since the overall analysis has not
been completed yet. Thus some reasonable
limitations are introduced, but the outcomes
from this study can be considered efficient to
generate a primary picture over the comparative
satisfaction that the examined websites and their
updates provided.
The selection of the examined one-stop
portals was based on the following criteria: a)
size of target-audience and project size, which
would lead to potential updates (something
that really happened in the examined period);
b) launching year (as early as possible); c)
location, so that representatives only from
developed countries of all continents would be
incorporated; d) ranked in the top 35 countries in
e-Government readiness index, but with different values (United Nations, 2008), meaning that
representatives from top to lower positions had
to be selected. The investigation started during
the winter semester of 2009 and continued on
the same websites until the spring semester of
2012, although their classification according to
the e-Government readiness index changed. The
reason that the selected websites remained the
same was the purpose of this paper, which is to
demonstrate a comparative evaluation of each
website’s updates during the same timeframe.
Copyright © 2015, IGI Global. Copying or distributing in print or electronic forms without written permission of IGI Global is prohibited.
International Journal of Public Administration in the Digital Age, 2(2), 54-74, April-June 2015 59
Table 3. sample’s size over time
Year
Participants
2009
12
2010
4
2011
28
2012
19
To this end, the following five (5) portals
(Table 4) were identified to fulfill all these criteria: United States of America (U.S.A.) (USA.
gov), which was launched in 2000 as FirstGov,
changed its name in 2007 and ranked 4th in eGovernment readiness index in 2008; United
Kingdom (U.K.) (gov.uk), which was online in
1999 as UKOnline, renamed to directgov.uk in
2004 and to gov.uk in 2012, while it was rated
10th in e-Government readiness index; Canada
(Canada.gc.ca), which was available online
in 2000 and ranked 7th; Australia (Australia.
au) that was sorted in the 8th position of the
e-Government readiness index and launched in
2000; and Germany (bund.de) that was ranked
22nd and launched in 2000. Moreover, one
supranational case was selected from the European Union, named YourEurope.eu that was
initially online in 2005. Finally, for reasons of
comparison with the previously selected cases,
a smaller national representative was located
in New Zealand (ranked 18th in e-Government
readiness index) and it was selected for the
following reasons: it was implemented entirely
from national funding and efforts, while and it
serves a quite small community compared to
the other selected cases. Various updates were
observed in time for all the examined portals,
some of which were dramatic (i.e., USA.gov
renovation in 2010 and Gov.uk renovation
in 2012), while others concerned small-scale
changes (i.e., corresponding e-service changes).
For the purposes of this study, students
behaved as end-users and measured their satisfaction from the offered online content and
services, during the execution of the same, predefined public service: “locate a postgraduate
program in the examined country in the project
management domain”. The selection of this eservice was based on the following reasons: it
was fully understood by the participants, who
realized its successful execution when they
were able to locate such a program. Moreover,
it is a service that is offered to foreigners in
all the examined cases, since most one-stop
e-Government portals focus on locals and immi-
Table 4. the selected one-stop e-Government portals
Country
One-Stop e-Government
Portal
e-Government
Index Ranking
(2008)
e-Government
Index Ranking
(2012)
Launch
Year
USA
www.usa.gov
4th
5th
2000
UK
www.gov.uk
10
3rd
1999
Canada (CAN)
www.canada.gc.ca
7th
11th
2000
Australia (AUS)
www.australia.au
8th
12th
2000
Germany (DE)
www.bund.de
22
17th
2000
European Union (EU)
www.youreurope.eu
0.59 (value)
0.72 (value)
2005
New Zealand (NZL)
www.newzealand.govt.nz
18th
13th
2002
th
nd
Copyright © 2015, IGI Global. Copying or distributing in print or electronic forms without written permission of IGI Global is prohibited.
60 International Journal of Public Administration in the Digital Age, 2(2), 54-74, April-June 2015
Figure 1. The American Customer Satisfaction Index (ACSI)
grants and the corresponding e-services cannot
be tested by someone who is not aware of the
particular legislature and internal environment
of a foreign country.
Each student evaluated individually its
satisfaction, with regards to the expectation
from the Greek ERMIS one-stop portal. Different students each semester faced potentially
different versions of the examined websites,
which was one of the requirements of this
study, without being aware of the previous
version –which secures the objectivity of this
study-. The satisfaction measurement has been
utilized aimed to evaluate the updates of the
examined portals with the end user satisfaction
measurement.
Satisfaction was measured with the use of
the ACSI due to its direct satisfaction measurement and simplicity among the other theoretical
models, which were presented in (Table 2). The
ACSI consists of the following elements (Figure
1) (Park, 2007):
•
•
Customer expectations’ determination,
which concerns anticipation prior to consumer’s experience;
Perceived quality, which represents customer evaluation of the quality of his recent
consumption experiences;
•
•
•
Perceived value that defines the pricerelative quality;
Customer complaints that document individual comments regarding the experience
from the consumed product/service;
Customer Loyalty, which demonstrates
whether the customer intends to consume
this product/service again.
For the purposes of the ACSI, all participants were requested to answer the following
questions with the Likert scale from 0 to 10 (0:
not satisfied; to 10: very satisfied). The scale
was selected to be broad in order to identify
even small variances between qualitative results.
Q1: How easily can I understand where I am?
The purpose of this question was to examine
usability features, which were previously
explained to the participants (i.e., brand
name, logo size and position, explanation
text and figures etc.). This question was
crucial to develop an initial satisfaction
feeling of the participant, since none was
previously aware of the examined case that
was presented to him.
Q2: How much satisfied am I from the online
service? This question was answered after
the execution of the abovementioned on-
Copyright © 2015, IGI Global. Copying or distributing in print or electronic forms without written permission of IGI Global is prohibited.
International Journal of Public Administration in the Digital Age, 2(2), 54-74, April-June 2015 61
Table 5. Results’ change during time
Q1
Q2
Q3
Q4
YEAR
N
Mean Rank
Mean Rank
Mean Rank
Mean Rank
2009
71
147,2
136,78
94,54
101,96
2010
20
203,15
158,4
162,13
121,58
2011
107
142,89
154,47
172,6
176,42
2012
125
180,18
183,35
191,22
190,23
Total
323
line service. The overall satisfaction was
generated by the successful location of the
e-service’s target (the identification of an
appropriate to the participant postgraduate
program in project management) and it was
evaluated with Likert values.
Q3: How easily can I find what I look for? This
question was answered after the execution
of the abovementioned online service. Students defined their satisfaction with Likert
values, regarding how easily he navigated
in the website, found the appropriate path
to the objective, as well as concerning the
existence other usability features (i.e., help,
wizards, search etc.).
Q4: Would I use this website for the execution
of the same or similar e-service? This
question aimed to measure with Likert
values the customer’s loyalty concerning
the examined website and it is a prerequisite
for the ACSI.
3.2. Statistical Analysis
Collected data were analyzed with the SPSS
version 17 software, which is appropriate and
widely accepted for statistical analyses. The first
outcome from this analysis illustrates that participants’ answers improved during time (Table
5) (Figure 2), which can be interpreted to an
overall improvement of their gained experience
from the examined cases. This improvement
is statistically important according to Kruskal
Wallis test (Table 6).
With regard to the analysis of each question’s individual results, Kruskal Wallis tests
Figure 2. Sample’s overall experience over time
Copyright © 2015, IGI Global. Copying or distributing in print or electronic forms without written permission of IGI Global is prohibited.
62 International Journal of Public Administration in the Digital Age, 2(2), 54-74, April-June 2015
Table 6. Kruskal Wallis test’s results regarding sample’s answers over time
Q1
Q2
Q3
Q4
Chi-Square
15,322
12,742
51,864
47,888
Df
3
3
3
3
Asymp. Sig.
,002
,005
,000
,000
Chi-Square*
11,189
12,701
51,288
43,106
df*
2
2
2
2
Asymp. Sig.*
,004
,002
,000
,000
illustrate significant changes in time (Table 7)
for all the questions. YourEurope portal received
good ranking steadily in question 1 (Q1), while
German portal gathered low ranking in the same
question. Moreover, Canadian portal’s evaluation in Q1 significantly rises in 2012, which can
be interpreted to a significant improvement in
website’s corresponding appearance (Figure 3).
The answers in question 2 (Q2) show
similar performance of the European and the
German portals, while New Zealand’s perfor-
mance raises significantly during 2012 (Figure
4). Moreover, users ranked steadily high YourEurope portal -except from 2010- and steadily
low the German website in questions 3 (Q3) and
4 (Q4), while the Canadian performance rises
importantly after 2010 in the same question
(Figures 5, 6). All these findings demonstrate
an overall sample’s satisfaction from European
portal, dissatisfaction from the German case and
variances in time for the other examined cases.
Table 7. Kruskal Wallis test’s results regarding individual question’s answers over time
2009
2010
2011
2012
Chi-Square
25,371
10,621
67,141
18,492
df
5
4
4
6
Asymp. Sig.
0
0,031
0
0,005
Chi-Square
35,845
14,947
66,72
38,889
df
5
4
4
6
Asymp. Sig.
0
0,005
0
0
Chi-Square
28,427
16,028
50,914
41,554
df
5
4
4
6
Asymp. Sig.
0
0,003
0
0
Chi-Square
35,71
14,55
43,417
32,483
df
5
4
4
6
Asymp. Sig.
0
0,006
0
0
Q1
Q2
Q3
Q4
Copyright © 2015, IGI Global. Copying or distributing in print or electronic forms without written permission of IGI Global is prohibited.
International Journal of Public Administration in the Digital Age, 2(2), 54-74, April-June 2015 63
Figure 3. Q1 performance in time
Then, each examined case was analyzed
with regard to participants’ replies in time
(Table 8). To this end, USA.gov (Figure 7) did
not illustrate important differences in time for
the Q1, which shows that despite this portal’s
updates, participants do not appear to be satisfied from its usability features. Kruskal Wallis
analysis does not return significant differences
for U.K. (Figure 8), which shows that participants gained the same experience in time
from Gov.uk portal. Canadian portal (Figure
9) shows significant variances in time for all
the questions, which shows that this portal’s
updates affected sometimes positively and
others negatively user satisfaction. Data for
YourEurope portal (Figure 10) shows that Q1
and Q2 were not affected in time, meaning that
users had the same experience from its usability
features and expectations; Q3 and Q4 were increased in time, which determines a significant
improvement in overall satisfaction and loyalty
from the participants. Australian one-stop portal
(Figure 11) shows significant variances in time
for all the questions, but the overall opinion was
Figure 4. Q2 performance in time
Copyright © 2015, IGI Global. Copying or distributing in print or electronic forms without written permission of IGI Global is prohibited.
64 International Journal of Public Administration in the Digital Age, 2(2), 54-74, April-June 2015
Figure 5. Q3 performance in time
evolved in time, which shows that this portal’s
updates affected positively user satisfaction.
Users’ rankings for Bund.de (Figure 12) return
unimportant variances for all the questions but
Q1; this portal’s updates affected negatively
user satisfaction from usability features in 2011.
Finally, findings from New Zealand (Figure 13)
depict an important growth in time, with regard
to user satisfaction.
In order to identify significant changes from
year to year, a Mann – Whitney and Wilcoxon
analyses was performed on the collected data
(Table 9). This analysis does not return statistically important variances between 2009 and
2011 for Q1, but significant changes for the other
questions. This finding can be interpreted to
the following: although usability features were
updated due to various renovations (i.e., USA.
gov redesign in 2010) between 2009 and 2011
in the examined portals, the overall satisfaction’s experience from the tested e-service was
not affected. On the other hand, no significant
change appears for the period 2011 and 2012.
Figure 6. Q4 performance in time
Copyright © 2015, IGI Global. Copying or distributing in print or electronic forms without written permission of IGI Global is prohibited.
International Journal of Public Administration in the Digital Age, 2(2), 54-74, April-June 2015 65
Table 8. Kruskal Wallis test’s results regarding each portal’s performance over time
USA
N
Q1
Q2
Q3
Q4
2009
12
25,58
16,58
13,92
9,63
2010
4
42,38
24
34,75
31,75
2011
28
36,16
34,29
28,93
35,68
2012
19
27,74
40,05
47,37
40,76
Chi-Square
5,579
14,143
26,536
23,777
df
3
3
3
3
Asymp. Sig.
0,134
0,003
0
0
UK
N
Q1
Q2
Q3
Q4
2009
11
21,14
14,86
11,91
13,5
2010
4
30,63
34,13
30,25
31,63
2011
20
28,25
31,53
36,6
33,95
2012
19
29,74
29,18
26,37
27,95
Chi-Square
2,495
9,721
18,894
12,695
df
3
3
3
3
Asymp. Sig.
0,476
0,021
0
0,005
Canada
N
Q1
Q2
Q3
Q4
2009
12
27,33
31,25
12,5
11,83
2010
4
42,13
30
20
25,25
2011
19
12,5
17,24
36,89
32,32
2012
19
39,53
34,87
29,16
33,05
Chi-Square
33,273
13,316
19,181
16,436
df
3
3
3
3
Asymp. Sig.
0
0,004
0
0,001
N
Q1
Q2
Q3
Q4
2009
12
27,04
18,88
16,29
27,96
2010
4
42,88
33,5
40,13
2,63
2011
20
30,43
33,2
24,5
28,08
2012
19
YourEurope.eu
22,92
27,13
36,53
33,29
Chi-Square
6,294
7,449
15,914
12,869
df
3
3
3
3
Asymp. Sig.
0,098
0,059
0,001
0,005
N
Q1
Q2
Q3
Q4
12
12,13
11,04
7,96
9,17
Australia
2009
continued on following page
Copyright © 2015, IGI Global. Copying or distributing in print or electronic forms without written permission of IGI Global is prohibited.
66 International Journal of Public Administration in the Digital Age, 2(2), 54-74, April-June 2015
Table 8. Continued
2010
2011
2012
19
18,45
19,13
21,08
20,32
Chi-Square
3,898
6,65
16,433
11,622
df
1
1
1
1
Asymp. Sig.
0,048
0,01
0
0,001
N
Q1
Q2
Q3
Q4
2010
4
26,75
28,75
17,63
16,38
2011
20
14,35
18,78
20,68
19,8
2012
19
29,05
23,97
24,32
25,5
Chi-Square
14,248
3,018
1,414
2,959
df
2
2
2
2
Asymp. Sig.
0,001
0,221
0,493
0,228
N
Q1
Q2
Q3
Q4
12
7,88
6,75
7,46
6,83
11
Australia
2009
Germany
2009
2010
2011
2012
16,5
17,73
16,95
17,64
Chi-Square
9,502
15,517
11,501
14,899
df
1
1
1
1
Asymp. Sig.
0,002
0
0,001
0
Copyright © 2015, IGI Global. Copying or distributing in print or electronic forms without written permission of IGI Global is prohibited.
International Journal of Public Administration in the Digital Age, 2(2), 54-74, April-June 2015 67
Figure 7. USA.gov
The same analysis for each of the examined case (Table 10) identifies the following:
a significant improvement in Q3 appears for
the USA, meaning that the examined service
was improved during the examined period; Q3
becomes worse in time for the UK portal, which
shows that the same service was not improved
but rather declined according to the participants; Q1 and Q2 were improved for Canada,
which determine a usability improvement and
an overall satisfaction increment with regard
to participants’ expectations; Q2 improves in
2009-2011 for the EU portal, which confirms
a corresponding improvement in the examined
e-service; finally, Q3 rises during 2011 to 2012
for the EU portal, which depicts an overall satisfaction increment compared to respondents’
expectations.
3.3. Discussion
The above findings come out only from the
24.6% (63 out of 256) of the participants of
this study, since the analysis is still in progress.
Figure 8. Gov.uk
Copyright © 2015, IGI Global. Copying or distributing in print or electronic forms without written permission of IGI Global is prohibited.
68 International Journal of Public Administration in the Digital Age, 2(2), 54-74, April-June 2015
Figure 9. Canada.gc.ca
However, the outcomes can be considered
efficient to provide a primary picture of this
comparative study, due to the sample’s homogeneity and survey’s objectivity. Moreover,
participants were fully aware of the context of
one-stop e-Government, while they had developed their expectations from various e-services’
execution in Greek one-stop e-Government
portal and from the corresponding e-service
execution in Greece.
The qualitative data that have been collected were examined with various tests with
the SPSS version 17 and the following findings
are returned:
•
•
Participants’ answers were improved
during time, which can be interpreted to
an overall improvement of their gained
experience from the examined cases.
Participants appear more satisfied in general from YourEurope.eu portal and this
Figure 10. YourEurope.eu
Copyright © 2015, IGI Global. Copying or distributing in print or electronic forms without written permission of IGI Global is prohibited.
International Journal of Public Administration in the Digital Age, 2(2), 54-74, April-June 2015 69
Figure 11. Australia.au
•
•
satisfaction increases during the examined
period and transforms to an increased
loyalty.
Students feel satisfied from YourEurope’s
usability features and steadily dissatisfied
from the German portal’s usability. On the
contrary, their corresponding satisfaction
increased in 2012 for the Canadian case,
which is interpreted to a significant website’s update.
USA.gov was renovated in 2010. However,
this update did not affect participants’ feelings against this portal’s usability.
•
•
Gov.uk was updated significantly with
regard to its appearance in 2012. However,
participants were not satisfied from its usability renovation. In general, the answers
from all the questions do not generate
important variances in participants’ satisfaction from the corresponding updates.
Participants’ satisfaction from Australian
portal varies in time for all the questions,
but the overall opinion was evolved, which
shows that this portal’s updates affected
positively user satisfaction.
Figure 12. Bund.de
Copyright © 2015, IGI Global. Copying or distributing in print or electronic forms without written permission of IGI Global is prohibited.
70 International Journal of Public Administration in the Digital Age, 2(2), 54-74, April-June 2015
Figure 13. newzealand.govt.nz
•
Findings from New Zealand depict an
important growth in time, with regard to
user satisfaction.
All these findings show that not all updates
and renovations focus on customer satisfaction
neither they succeed in meeting user expectations. Moreover, the complexity of one-stop
portals’ evaluation is validated. For instance,
corresponding developers must be aware of
all the potential audiences and leverage their
satisfaction. Furthermore, all the examined
cases redirected transparently the user to a
corresponding educational website to fulfill
this e-service and locate the postgraduate program, which means that the examined e-service
concerns a four-stage one (Anthopoulos et al.,
2007). However, none of the respondents realized this redirection and the overall satisfaction
was connected to the initially accessed one-stop
portal. This final finding is extremely important
for one-stop portal developers and opens new
research areas, such as “connected web experiences” or “interconnected satisfaction”.
Table 9. Mann: Whitney and Wilcoxon analyses for 2-year comparisons
2009-2011
Q1
Q2
Q3
Q4
Mann-Whitney U
1924,000
1574,500
879,000
863,000
Wilcoxon W
3052,000
2702,500
2007,000
1991,000
Z
-,574
-2,224
-5,507
-5,570
Asymp. Sig. (2-tailed)
,566
,026
,000
,000
2011-2012
Q1
Q2
Q3
Q4
Mann-Whitney U
2843,500
3005,000
2938,500
3044,000
Wilcoxon W
6671,500
6833,000
6766,500
6872,000
Z
-1,562
-1,016
-1,251
-,889
Asymp. Sig. (2-tailed)
,118
,310
,211
,374
Copyright © 2015, IGI Global. Copying or distributing in print or electronic forms without written permission of IGI Global is prohibited.
International Journal of Public Administration in the Digital Age, 2(2), 54-74, April-June 2015 71
Table 10. Mann: Whitney and Wilcoxon analyses for 2-year comparisons for each case
USA
Q1
Q2
Q3
Q4
Mann-Whitney U
203,000
210,500
109,000
216,000
Wilcoxon W
393,000
616,500
515,000
622,000
Z
-1,406
-1,255
-3,466
-1,103
Asymp. Sig. (2-tailed)
,160
,209
,001
,270
UK
Q1
Q2
Q3
Q4
Mann-Whitney U
178,000
180,500
118,500
151,500
Wilcoxon W
388,000
370,500
308,500
341,500
Z
-,344
-,275
-2,104
-1,103
Asymp. Sig. (2-tailed)
,731
,783
,035
,270
Q1
Q2
Q3
Q4
Mann-Whitney U
18,500
66,000
129,500
160,500
Wilcoxon W
208,500
256,000
319,500
350,500
Z
-4,898
-3,365
-1,518
-,593
Asymp. Sig. (2-tailed)
,000
,001
,129
,553
Q1
Q2
Q3
Q4
Mann-Whitney U
101,000
43,500
79,500
117,000
Wilcoxon W
179,000
121,500
157,500
195,000
Z
-,784
-3,335
-1,636
-,121
Asymp. Sig. (2-tailed)
,433
,001
,102
,903
Q1
Q2
Q3
Q4
Mann-Whitney U
141,500
162,500
103,000
148,500
Wilcoxon W
331,500
352,500
313,000
358,500
Z
-1,408
-,829
-2,533
-1,220
Asymp. Sig. (2-tailed)
,159
,407
,011
,222
Canada
EU (2009-2011)
EU 2011 - 2012
4. RESULTS AND
FUTURE THOUGHTS
This paper focused on one-stop e-Government
comparative satisfaction evaluation. More specifically it addressed one-stop portals’ renova-
tions and updates and how these updates affect
end-users satisfaction. To this end, the authors
stated two important research questions. The
first one concerned framework and methods
for e-Government satisfaction measurement
and it was answered with literature findings.
Copyright © 2015, IGI Global. Copying or distributing in print or electronic forms without written permission of IGI Global is prohibited.
72 International Journal of Public Administration in the Digital Age, 2(2), 54-74, April-June 2015
More specifically, one-stop e-Government is
evaluated both with technical standards (i.e.,
meeting usability features) and with satisfaction criteria.
The second question focused on whether
portal updates enhance user satisfaction. This
question was investigated with the examination of various major e-Government one-stop
portals, whose selection was based on a set
of objective criteria. Seven one-stop portals
were examined during 2009 and 2012 by a
homogeneous student sample in Greece and
the corresponding findings’ analysis is still in
progress. However, existing results illustrate
important findings, which can be utilized by
one-stop e-Government portals. For instance,
USA.gov and Gov.uk renovations did not affect
respondents’ satisfaction from the examined
e-service.
Some limitations are reasonably located
and have to be considered: the first one concern that this research is in progress and not
all data have been analyzed. This limitation
will be overcome with the completion of this
analysis. However, the presented percentage is
quite efficient (almost 25% of the total sample)
and a primary picture can be observed. Another
limitation concerns that only one e-service was
tested and evaluated. However, the importance
of the examined e-service is extensive, due to
the broad audience of educational services.
Additionally, it is not easy for a foreigner to
evaluate a one-stop portal without executing
local e-services. To this end, future research
will combine satisfaction’s evaluation findings
from both e-services that focus to locals and
foreigners. Finally, new research questions
have been identified from the findings of this
paper and address the evaluation of e-four-stage
e-services, which are executed in interconnected
websites. These questions are expected to be
addressed in future research too.
REFERENCES
Accenture (2009). From e-Government to eGovernance: Using new technologies to strengthen
relationships with citizens [online]. Retrieved, March
2014 from http://akgul.bilkent.edu.tr/egov/Accenture_Institute_Health_Public_Service_From_eGovernment_to_eGovernance.pdf
Accenture (2012). Build It and They Will Come?
The Accenture Digital Citizen Pulse Survey and
the Future of Government Operations [online].
Retrieved, March 2014 from http://www.accenture.
com/SiteCollectionDocuments/PDF/AccentureDigital-Citizen-FullSurvey.pdf
Alawneh, A., Al-Refai, H., & Batiha, K. (2013).
Measuring user satisfaction from e-Government
services: Lessons from Jordan. Government Information Quarterly, 30(3), 277–288. doi:10.1016/j.
giq.2013.03.001
Anthopoulos, L., Siozos, P., & Tsoukalas, I. A. (2007).
Applying Participatory Design and Collaboration
in Digital Public Services for discovering and redesigning e-Government services. Government Information Quarterly, 24(2), 353–376. doi:10.1016/j.
giq.2006.07.018
Borras, J. (2004). International Technical Standards
for e-Government. Electronic. Journal of E-Government, 2(2), 139–146.
Cap Gemini. (2011). eGovernment Benchmark
Framework 2012-2015. Retrieved, March 2014
from http://ec.europa.eu/digital-agenda/sites/digitalagenda/files/eGovernment%20Benchmarking%20
method%20paper%20published%20version_0.pdf
Cap Gemini. (2011). Digitizing Public Services in
Europe: Putting ambition into action. 9th Benchmark
Measurement. Retrieved, March 2014 from https://
ec.europa.eu/digital-agenda/sites/digital-agenda/
files/egov_report.pdf
Choudrie, J., Ghinea, G., & Weerakkody, V. (2004).
Evaluating Global e-Government Sites: A View using Web Diagnostic Tools. Electronic. Journal of
E-Government, 2(2), 105–114.
del Rio, M. S. (2013). Improving the Citizen Experience in the use of Mexican Government Websites.
European Scientific Journal, 3, pp. 38-41, ISSN:
1857 – 7881.
Fitsilis, P., Anthopoulos, L., & Gerogiannis, V. (2010).
An evaluation framework for e-government projects.
In Ch. Reddick (Ed.), Citizens and E-Government:
Evaluating Policy and Management. Hershey, PA:
IGI Global; doi:10.4018/978-1-61520-931-6.ch005
Copyright © 2015, IGI Global. Copying or distributing in print or electronic forms without written permission of IGI Global is prohibited.
International Journal of Public Administration in the Digital Age, 2(2), 54-74, April-June 2015 73
Garcia, A. C., Maciel, C., & Pinto, F. B. (2005). A
Quality Inspection Method to Evaluate E-Government Sites. In M. A. Wimmer et al. (Eds.), EGOV
2005, LNCS 3591 (pp. 198–209). Berlin, Heidelberg:
Springer-Verlag. doi:10.1007/11545156_19
Papadomichelaki, X., & Mentzas, G. (2012).
e-GovQual: A multiple-item scale for assessing
e-government service quality. Government Information Quarterly, 29(1), 98–109. doi:10.1016/j.
giq.2011.08.011
Glassey, O., & Glassey, O. F. (2004). Proximity
Indicator for e-Government: The Smallest Number
of Clicks. Journal of E-Government, 1(4).
Park, J. H. (2007). How Citizens Accept e-Government Service: A Comparison of Four Theoretical
Models. The Korean Journal of Policy Studies,
21(2), 143–156.
Hauner, D., & Kyobe, A. (2008). Determinants of
Government Efficiency: International Monetary
Fund (IMF) Working Paper. Retrieved, Dec. 2013
from http://www.imf.org/external/pubs/ft/wp/2008/
wp08228.pdf
Jaeger, P., & Matterson, M. (2009). e-Government
and Technology Acceptance: The Case of the Implementation of Section 508 Guidelines for Websites.
Electronic. Journal of E-Government, 7(1), 87–98.
Janssen, M., Wagenaar, R., & Beerens, J. (2003).
Towards a Flexible ICT-Architecture for MultiChannel E-Government Service Provisioning. In
the proceedings of the 36th Hawaii International
Conference on System Sciences (HICSS), IEEE.
Kokkinari, A. I., Mylonas, S., & Mina, S. (2005).
E-Government Initiatives in Cyprus. In the Proceedings of the eGovernment Workshop ’05 (eGOV05).
Large, A., Beheshti, J., & Rahman, T. (2002). Design
Criteria for Children’s Web Portals: The Users Speak
Out. Journal of the American Society for Information
Science and Technology, 53(2), 79–94. doi:10.1002/
asi.10012
Magoutas, B., Halaris, C., & Mentzas, G. (2007).
An Ontology for the Multi-perspective Evaluation
of Quality in E-Government Services. In M. A. Wimmer, H. J. Scholl, & A. Grönlund (Eds.), EGOV 2007,
LNCS 4656 (pp. 318–329). Springer-Verlag Berlin
Heidelberg. doi:10.1007/978-3-540-74444-3_27
Nielsen, J. (1993). Usability Engineering. Academic
Press.
Oliver, R. (1980). A cognitive model of the antecedents and consequences of satisfaction decisions. JMR,
Journal of Marketing Research, 17(4), 460–469.
doi:10.2307/3150499
Osman, I., Anouze, A. L., Irani, Z., Lee, H., Balci,
A., Medeni, T.D. & Weerakkody, V. (2011). A new
COBRAS Framework to Evaluate e-Government
Services: a citizen centric perspective. In the proceedings of the tGov Workshop 2011 (tGOV11).
Reddick, Ch., & Turner, M. (2012). Channel choice
and public service delivery in Canada: Comparing e-government to traditional service delivery.
Government Information Quarterly, 29(1), 1–11.
doi:10.1016/j.giq.2011.03.005
Silius, T., & Tervakari, M. (2003). An evaluation of
the usefulness of web-based learning environments.
The evaluation tool into the portal of Finnish virtual
university. In the Proceedings of the Conference on
University Networks and E-learning.
Taoufik, I., Kabaili, H., & Kettani, D. (2007). Designing an E-Government Portal Accessible to Illiterate
Citizens. In the proceedings of the ICEGOV2007,
ACM ISSN 978-1-59593-822 -0/07/12
The World Bank. (2012) The Worldwide Governance
Indicators (WGI) [online]. Retrieved, December
2013 from http://info.worldbank.org/governance/
wgi/index.aspx#home
Thompson, K. M., McClure, C. R., & Jaeger, P.
T. (2003). Evaluating federal websites: Improving
e-Government for the people. In J. F. George (Ed.),
Computers in society: Privacy, ethics, and the Internet
(pp. 400–412). Upper Saddle River, NJ: Prentice Hall.
Tucker, S.-P. L. (2012). Assessing and Modeling
the Readiness of Electronic Government. International Journal of Electronic Commerce Studies, 3(2),
251–270. doi:10.7903/ijecs.1094
United Nations. (2008). E-Government Survey
2008: From e-Government to Connected Governance [online]. Retrieved, March 2014 from http://
unpan1.un.org/intradoc/groups/public/documents/
un/unpan028607.pdf
United Nations. (2010). E-Government Survey
2010: Leveraging e-government at a time of financial and economic crisis [online]. Retrieved,
March 2014 from http://www.epractice.eu/files/
UN%20E-Government%20Survey%202010%20
-%20Part%20I.pdf
Copyright © 2015, IGI Global. Copying or distributing in print or electronic forms without written permission of IGI Global is prohibited.
74 International Journal of Public Administration in the Digital Age, 2(2), 54-74, April-June 2015
United Nations. (2012). E-Government for the People
E-Government Survey 2012 [online]. Retrieved,
March 2014 from http://unpan1.un.org/intradoc/
groups/public/documents/un/unpan048065.pdf
Vasilakis, C., Lepouras, G., & Halatsis, C. (2007).
A knowledge-based approach for developing multichannel e-government services. Electronic Commerce Research and Applications, 6(1), 113–124.
doi:10.1016/j.elerap.2006.07.004
Wimmer, M. (2002). Integrated service modelling
for online one-stop government. Electronic Markets,
12(3), 149–156. doi:10.1080/101967802320245910
Zhang, P., & von Dran, G. M. (2000). Satisfiers
and Dissatisfiers: A two-factor Model for Website
Design and Evaluation. Journal of the American
Society for Information Science, 51(14), 1253–1268.
doi:10.1002/1097-4571(2000)9999:9999<::AIDASI1039>3.0.CO;2-O
Wilder, A.J. Usability of Government Websites. A
Master’s Paper for the M.S. in L.S degree. April, 2007.
Leonidas Anthopoulos is an Associate Professor at the Business School of the TEI of Thessaly, Greece. Dr.
Anthopoulos has IT research, planning and Management experience with the development and deployment
of municipal and organizational IT environments. At his previous job positions, as an Expert Counselor at
the Hellenic Ministry of Foreign Affairs in e-Government and e-Diplomacy areas, as an IT researcher and
manager at the Research Committee of the Aristotle University of Thessaloniki (Greece), Municipality of
Trikala (Greece), Administration of Secondary Education of Trikala (Greece) and Information Society S.A.
(Greece), he was responsible for planning and managing the development of multiple IT systems for Greek
Government and for various Public Organizations. Among them it worth mentioning the Digital City of
Trikala (e-Trikala) project, the SYZEFXIS and Police-online projects, the central portal for the Hellenic
Ministry of Foreign Affairs etc. He is the author of several articles published on prestigious scientific journals, books and international conferences. His research interests concern, among others, e-Government,
Enterprise Architecture, Social Networks, etc.
Kleanthis Sirakoulis, Assistant Professor at Business School, TEI of Thessaly, Greece, School of Business
and Economics. Dr. Syrakoulis has extensive mathematics and project management experience mainly
focused on scheduling techniques, resource constraint management, statistics and non-governmental organizations (NGOs). He worked, as business manager and consultant for many public organizations. He
is the author of many articles published on prestigious scientific journals. His research interests include:
Project Management, Scheduling, NGOs, etc.
Copyright © 2015, IGI Global. Copying or distributing in print or electronic forms without written permission of IGI Global is prohibited.


© Copyright 2026