
Planning for Success - Digital Education & Innovation
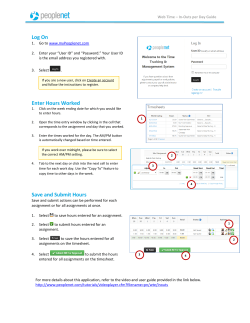
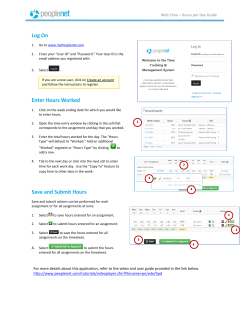
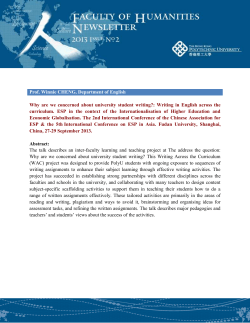
Planning for Success: How Students Use a
Grade Prediction Tool to Win Their Classes
Caitlin Holman1, Stephen J. Aguilar2, Adam Levick1, Jeff Stern1,
Benjamin Plummer2, Barry Fishman1, 2
1
University of Michigan
School of Information & USE Lab
105 S. State Street,
Ann Arbor, MI 48109-1285 USA
+ 1(734) 647-8027
2
University of Michigan
School of Education & USE Lab
610 E. University Ave
Ann Arbor, MI 48109-1259 USA
+1 (734) 764-8416
[email protected], [email protected], [email protected], [email protected],
[email protected], [email protected]
ABSTRACT
Gameful course designs require a significant shift in approach for
both students and instructors. Transforming a standard course into
a good game involves fundamentally altering how the course
functions, most notably by giving students greater control over
their work. We have developed an application, GradeCraft, to
support this shift in pedagogy. A key feature of the application is
the Grade Predictor, where students can explore coursework
options and plan pathways to success. We observed students in
two gameful courses with differing designs using the Grade
Predictor in similar ways: they spent similar amounts of time per
session, increased usage when assignments were due and before
making significant course decisions, predicted different types of
assignments at different rates, and made more predictions in
preparation for the end of semester. This study describes how
students plan their coursework using the GradeCraft Grade
Predictor tool.
Categories and Subject Descriptors
K.3.1 [Computers and Education]: Computer Uses in Education
– computer-assisted instruction, computer-managed instruction.
General Terms
Management, Measurement, Design, Human Factors, Theory
Keywords
Learning Analytics, Design-Research, Gameful Instruction,
Higher Education
Permission to make digital or hard copies of all or part of this work for
personal or classroom use is granted without fee provided that copies are
not made or distributed for profit or commercial advantage and that
copies bear this notice and the full citation on the first page. To copy
otherwise, or republish, to post on servers or to redistribute to lists,
requires prior specific permission and/or a fee. Request permissions
from [email protected].
LAK’15, March 16–20, 2015, Poughkeepsie, NY, USA. Copyright is
held by the owner/author(s). Publication rights licensed to ACM.
ACM 978-1-4503-3417-4/15/03…$15.00
http://dx.doi.org/10.1145/2723576.2723632
1. INTRODUCTION
Gameful instruction uses the design of successful games as
inspiration for the redesign of formal courses [8, 9, 14]. A central
goal of this approach is to increase student engagement and
motivation, enabling students to take on a more active role in their
own education [3, 7]. Common mechanics employed by gameful
classrooms include: having students begin with zero points and
earn them by completing assignments [7]; promoting student
autonomy by offering a variety of assignments to students and
allowing them to select which ones to complete [8]; implementing
leveling systems; using avatars and pseudonyms to experiment
with identity within the course [15]; awarding badges to recognize
excellence [3]; and providing multiple pathways for students to
practice new skills—and recover in the event of failure [1].
Implementing gameful course designs has proven to be
challenging for both instructional staff and students. Typical
learning management systems (LMS) are designed to support
course structures where assignment grades are weighted according
to a pre-determined scheme to calculate a student's final grade.
This makes it difficult, if not impossible, to accurately track
student progress through the individualized and additive pathway
structure that gameful courses afford.
Past research indicates that even when multiple pathways to
success in a class exist, they may be difficult for students to
visualize [7]. In an effort to support students’ awareness of their
choices in gameful course environments, we designed and
developed GradeCraft, an online tool intended for use in
conjunction with a primary LMS like Sakai or Canvas. GradeCraft
helps students explore gameful syllabi and plan unique pathways
to success, while making it possible for instructors to manage the
workflow of these personalized course structures [10].
In this paper we explore how GradeCraft was used in two
different gameful courses, employing event data, grade outcomes,
and survey responses to examine how the Grade Predictor helped
students to strategize their coursework and related to learning and
motivation outcomes.
2. BACKGROUND
Gameful course designs are in the early stages of development;
there is much still to be learned regarding which aspects reliably
support student motivation and learning, and under what
conditions elements function most effectively. In a multi-year
study, comparing student engagement and outcomes in a gameful
course design as compared to the same course run in a traditional
format, resource access and discussion forum posts increased in
the gameful course implementations, but student grades and
lecture attendance did not [3]. Outside of the classroom, research
is also underway to understand the effects of specific game
mechanics: Mekler, et al., showed that the use of points, levels,
and leaderboards could successfully boost performance during an
image annotation task, but that these mechanics had no effect on
participants’ intrinsic motivation [11]. The effects of surface-level
gamification is mixed in terms of its effect on motivation and
performance. The implementation of gameful elements as a
foundation for course structure need further investigation to see if
they are more consistently motivating than surface integration.
Self-determination theory (SDT) is a useful theoretical framework
when thinking about the design of gameful courses. It posits that
support for three core human needs – autonomy, belonging, and
competence – is essential to producing intrinsic motivation.
Intrinsic motivation in learning has been linked to greater
conceptual learning and increased future interest in the topic or
skill [6][5][4]. Autonomy in the classroom is commonly
interpreted as empowering students’ ability to make meaningful
decisions regarding how and what they will learn, and in what
form they will be assessed. Competence highlights to the need to
challenge learners at the upper edge of their current skill level,
where they have an equal chance of success or failure.
Relatedness refers to the need to support connections between
peers, as well as between individual students and their instructors.
Part of the appeal of video games as inspiration for course design
is the ease at which some seem to have successfully satisfied these
needs for players. However, because games often maintain a layer
of behavioral incentives to drive player action, there has been
concern regarding the type of motivation they produce, and
whether it is appropriate for application to educational settings.
Ryan, Rigby, and Pryzbylski’s study on player motivation in
video games indicates that in-game support for each of the three
needs of SDT produced greater well-being in players (as expected
when intrinsically motivated), and increased the likelihood of
their playing the game in the future [13]. This suggests that
supporting the SDT framework within the design of gameful
courses is worthy of effort and investigation provided that
students are able to make sense of the choices available to them.
3. GRADECRAFT
GradeCraft is a web application developed at the University of
Michigan (UM) and dedicated to supporting gameful instruction.
At the time of this study, GradeCraft’s features included: a grade
planning utility we call the “Grade Predictor,” badges, teams and
team challenges, individualized assignment values where students
set the degree to which assignments will count towards their
grade, leveling displays, and opt-in pseudonym-driven
leaderboards.
GradeCraft is built using Ruby on Rails, and deployed on Amazon
Web Services (AWS) Elastic Compute Cloud (EC2). Feature
development occurs in response to feedback from faculty and
students, and our own evolving understanding of how design
interacts with student motivation. This paper focuses on student
use of the Grade Predictor.
3.1.1 The Grade Predictor
The Grade Predictor (Figure 1) was designed to support student
autonomy in gameful courses by helping them visualize the
possibly ways they could choose complete the assignment work
for the course successfully. The tool enables students to actively
experiment with which assignments they will work on, predict
how they will perform, and visualize the course grade they will
earn as a result. As the semester progresses, the Grade Predictor
fills in with students’ actual grades, keeping them informed of
their progress towards achieving their desired grade.
Figure 1: The GradeCraft Grade Predictor
3.2 Research Questions
This paper addresses the following research questions:
(RQ1) How do course events relate to Grade Predictor activity?
(RQ2) At what rate do students follow through on completing the
coursework they predict?
(RQ3) How do grade prediction behaviors differ between courses?
4. METHODS
4.1 Setting and Implementation
The following sections describe the pedagogical design of the two
gameful courses, Intro to Political Theory and Intro to
Information Studies, which are the settings for our analysis.
4.1.1 Intro to Political Theory
The grading system in Intro to Political Theory was designed to
support students’ autonomy through a two-step process. First,
students selected two out of four assignment types to complete:
in-class exams, essays, blogging, or a group project. Second,
students determined how these types were counted towards their
grade (lecture attendance, reading quizzes, and participation in a
discussion section also counted, but were not weighted).
4.1.2 Intro to Information Studies
Intro to Information Studies also incorporated two elements aimed
at supporting student autonomy and belonging. First, a variety of
assignment pathways were available so that students could direct
their course experience. Second, students were organized into
“houses” and collectively earned points for achievement on house
challenges throughout the semester.
4.2 Participants
There were 292 students enrolled in Intro to Political Theory, and
231 students in Intro to Information Studies, both large lecture
classes that act as gateways for their respective majors. Table 1
shows the demographic and academic information about the class
participants as obtained from UM's central student database.
Table 1: Participants’ Demographics and Year in School
Intro to
Political Theory
(N=292)
Intro to
Information Studies
(N=231)
Gender
Female
Male
41.90%
58.10%
43.90%
56.10%
Ethnicity
Caucasian
African American
Hispanic
Asian
Other
69.37%
3.52%
3.87%
13.38%
1.76%
65.85%
3.90%
4.39%
18.54%
0.98%
Academic Year
Freshmen
Sophomores
Juniors
Seniors
49.30%
36.97%
9.15%
4.58%
50.73%
15.12%
21.95%
12.20%
4.3 Data Sources
4.3.1 Data Processing and Reduction Procedures
GradeCraft uses the Granalytics [2] open source Ruby on Rails
gem to record platform-use analytics. Events were logged via
Redis and stored in a MongoDB NoSQL database. Grade data and
analytics data were merged and prepared for analysis using
Python and the pandas library [12]. We used Python to calculate
the total number of predictions made for each assignment by each
student. Because the event logging recorded all intermediate
predicted values, we only included predictions in this calculation
if they occurred more than three seconds after the previous
prediction for the same assignment by the same student.
5. RESULTS
There were a total of 4,763 predictor sessions throughout the
semester. 90% of students in Intro to Information Studies made
predictions (with an average of 9 sessions per student), as
compared to 95% of Intro to Political Theory students (on average
10 sessions per student). Students in both courses used the Grade
Predictor at similar times throughout the term, and the sessions in
both courses were roughly equal in length.
5.1 Grade Predictor Use by Session
Data indicate that predictor sessions were generally short, with
over 43% of them taking less than thirty seconds, and 74% of the
remainder finishing within three minutes (Figure 2).
Figure 2: Days from Start of Semester Compared to Density
of Predictions
5.1.1 RQ1: Grade Predictor Use Through the Term
In answer to RQ1, we can see the majority of predictions occurred
during two major peaks, which correspond with midterms and
finals (Figure 2). Heat map analysis (Figures 3 and 4) shows an
increase in use at both the middle and end of the term, and a dip in
activity on the weekends. By marking the due dates of large
assignments in each course using a solid black vertical line, we
then often see an increase in grade prediction activity on the day
these assignments are due (represented by the block immediately
to the right of the line). We also see an increase in sessions
between midnight and 3AM during midterms and finals.
Intro to Political Theory also shows a block of high activity
between weeks 6 and 8. The end of this time period coincides
with when students had to decide how to weight their assignments
to determine their final grade, suggesting that they used the Grade
Predictor to inform their choice.
5.2 Grade Predictor Use by Assignment Type
Tables 3 and 4 summarize students' prediction behaviors
categorized by assignment type. The Predicted column shows the
percentage of students in the whole class who used the Grade
Predictor to estimate their performance for assignments within
each category; Graded refers to the percentage of students who
completed these assignments (many of whom did so without
predicting their performance); Grade Only shows the percentage
of students who earned a grade but never made a prediction; and
Predictor Follow-Through show the percentage of students who
made a prediction and then followed through on that plan, as
observed by their having a grade (RQ2).
Table 3. Intro to Political Theory: Percentage of total class who
made a prediction, percentage of total class who received a
grade, percentage of students who received a grade but never
made a prediction, and percentage of students who made a
prediction and then earned a grade *= Optional assignment
category
Predicted
Graded
*Essays
61%
81%
30%
Predictor
FollowThrough
93%
Grade
Only
Attendance
54%
96%
46%
96%
Discussions
54%
96%
48%
93%
Readings
54%
94%
45%
95%
*Exams
51%
63%
38%
75%
*Blogging
36%
42%
48%
60%
*Group Projects
36%
31%
23%
65%
Across all but one assignment type, fewer students in Intro to
Political Theory predicted grades than earned them.
Approximately 54% of the class predicted their grades for the
weekly activities of Attendance, Readings, and Discussion
Sections, and 93%-96% of those who made a prediction for these
assignments followed through on those plans (Predictor FollowThrough). Essays stand out as the single most predicted category,
and maintain a 19%-34% higher follow-through rate as compared
to the other optional assignment types of Exams, Blogging, and
Group Projects. We know from the instructor that he heavily
encouraged all students to try this assignment (but did not require
it), which may explain the increased activity around this work as
compared to the other optional elements. Blogging and Group
Projects were both predicted at the same rate, with approximately
Figure 3: Heat map showing prediction sessions in Intro to Political Theory across the semester
Figure 4: Heat map showing prediction sessions in Intro to Information Studies across the semester
one third of the class considering these options. Group Projects
represents the one place where fewer students predicted their
grades than earned grades – this assignment type required students
to submit a proposal for approval, so it makes sense that some
students might have planned to engage in this activity by had their
proposal rejected. Comparatively, Blogging as an assignment type
displays the highest (alongside Discussions) rate of students who
earned a grade but never made a prediction. This could reflect that
students perceived this category to be easier thus making it less
important to predict.
Table 4. Intro to Information Studies: Percentage of total class
who made a prediction, percentage of total class who received
a grade, percentage of students who received a grade but
never made a prediction, and percentage of students who
made a prediction and then earned a grade *= Optional
assignment category
Predicted
Graded
Grade
Only
Boss Quests
80%
99%
19%
Predictor
Followthrough
100%
Newbie Quests
66%
98%
35%
97%
Adventures
49%
88%
44%
99%
*Mighty Tomes
43%
27%
33%
41%
*Random Encounters
37%
42%
57%
48%
*Side Quests
*Explorer Reports
28%
19%
35%
13%
74%
69%
34%
23%
*Pick Up Quests
11%
34%
88%
36%
Similarly to Intro to Political Theory, more students earned grades
than made predictions in all but two assignment categories
(Mighty Tomes and Explorer Reports). The most predicted
assignment category for this class was Boss Quests, where all
students were expected to complete one of the three assignments;
80% of students made a prediction for their achievement, while
99% of the total class completed the work. Newbie Quests and
Adventures were also compulsory, and showed a similar pattern to
the required assignments in Intro to Political Theory—
approximately half of the class made predictions, and those who
did had a near-perfect completion rate. However, whereas in Intro
to Political Theory students were asked to make a distinct choice
at a specified date, in Intro to Information Studies students were
free to do any of the optional assignments throughout the
semester. Less than half of the class earned grades for any single
optional category, suggesting that students were able to customize
the class to their own interests and abilities, and the low prediction
rates indicate that they did not require the Grade Predictor’s
support to be able to achieve success.
In each class students appear to have used relatively standard
(required) assignment categories as a foundation on which they
then planned which of the optional components to complete. This
would explain why we see relatively higher patterns of predicting
attendance assignments as compared to blog posts or group
projects in Intro to Political Theory. Since there were more
optional assignments within certain categories (e.g. side quests)
and assignments options were not as effectively portrayed in Intro
to Information Studies, we observed lower engagement overall
compared to Intro to Political Theory (RQ3).
6. Limitations & Future Work
9. REFERENCES
This study was limited by a gap in log file data for the first two
weeks of the semester when students might have been using the
Grade Predictor. In future work, we will be able to get a more
comprehensive picture of students’ grade predictions by recording
their engagement with the tool from the beginning of the
semester. Furthermore, the event tracking data do not allow us to
distinguish between times when students were merely “playing”
with the Grade Predictor as opposed to actively engaged with
predicting their grades. We need to do more to categorize the
different types of predictor sessions students engage in, and
determine what, if any, analytic markers we can use to distinguish
them. We also intend to explore how the value of students’ grade
predictions relates to the scores they receive on individual
assignments, and to their overall course success.
[1] Aguilar, S., Holman, C. and Fishman, B. Multiple Paths, Same
Goal: Exploring the Motivational Pathways of Two Distinct
Game-Inspired University Course Designs. (Madison, WI).
7. Conclusion
[5] Deci, E.L. and Ryan, R.M. 2002. Handbook of selfdetermination research. University of Rochester Press.
In answer to RQ1, there was a clear increase in grade prediction
leading up to the traditional high-intensity moments of midterms
and finals, at the choice point in a class that required students to
make a strategy in the semester (the due date for assignment
weighting decisions in Intro to Political Theory), and in response
to assignment due dates. Both the type of assignment (smaller,
weekly assignments versus larger, periodic work), and the context
of assignment selection structure seem to have affected whether
students followed through on their predictions (RQ2).
Outside of the structural relationships we saw, these courses
differed greatly in how much follow-through students displayed
(RQ3). In Intro to Political Theory, the smaller number of
assignments may have made it easier for students to predict more
accurately than in Intro to Information. Alternatively, grade
prediction may have been less necessary for students to feel like
they were in control of their own success in Intro to Information.
This study represents a first step in assessing how students use the
GradeCraft Grade Predictor to plan their work over the course of
the semester. Both of the courses studied are themselves works in
progress, changing in scope each semester. Now that we have
established a baseline understanding of how students use the
Grade Predictor tool we look forward to being able to explore
how structural changes impact student planning and engagement.
A common refrain we hear from students after they use the Grade
Predictor has been, “I wish I had this for all of my courses!”
While we believe that this type of planning tool is especially
important to support courses where central elements rely on
student-driven choice, we hope that this work will inspire
additional dialogue beyond just the gameful learning community
around how to provide students with opportunities and tools that
empower them to take control of their own learning outcomes.
8. Acknowledgements
Our thanks to the University of Michigan USE Lab, the Office of
Digital Education and Innovation, the Learning Analytics Task
Force, Stephanie Teasley, Steve Lonn, Mika LaVaque-Manty,
Cliff Lampe, Tim McKay, and all of the students who have helped
us design and build GradeCraft.
[2] AlfaJango 2014. Granalytics.
[3] Barata, G., Gama, S., Jorge, J. and Gonçalves, D. 2013.
Improving Participation and Learning with Gamification.
Proceedings of the First International Conference on Gameful
Design, Research, and Applications (New York, NY, USA, 2013),
10–17.
[4] Black, A.E. and Deci, E.L. 2000. The effects of instructors’
autonomy support and students’ autonomous motivation on
learning organic chemistry: A self-determination theory
perspective. Science Education. 84, 6 (Nov. 2000), 740–756.
[6] Deci, E.L. and Ryan, R.M. 1985. Intrinsic motivation and selfdetermination in human behavior. Plenum.
[7] Fishman, B.J. and Aguilar, S. 2012. Gaming the Class: Using
a Game-based Grading System to Get Students to Work Harder...
and Like It. Proc. GLS 8.0 (2012), 111–118.
[8] Fishman, B.J., Deterding, S., Vattel, L., Higgen, T., Schenke,
K., Sheldon, L., Ewing, C., Holman, C. and Aguilar, S. Beyond
Badges & Points: Gameful Assessment Systems for Engagement
in Formal Education. Games + Learning + Society (Madison).
[9] Gee, J.P. 2003. What videogames have to teach us about
learning and literacy. Palgrave Macmillan.
[10] Holman, C., Aguilar, S. and Fishman, B. 2013. GradeCraft:
What Can We Learn from a Game-inspired Learning Management
System? Proceedings of the Third International Conference on
Learning Analytics and Knowledge (New York, NY, USA, 2013),
260–264.
[11] Mekler, E.D., Brühlmann, F., Opwis, K. and Tuch, A.N.
2013. Do Points, Levels and Leaderboards Harm Intrinsic
Motivation?: An Empirical Analysis of Common Gamification
Elements. Proceedings of the First International Conference on
Gameful Design, Research, and Applications (New York, NY,
USA, 2013), 66–73.
[12] pydata 2014. pandas.
[13] Ryan, R.M., Rigby, C.S. and Przybylski, A. 2006. The
Motivational Pull of Video Games: A Self-Determination Theory
Approach. Motivation and Emotion. 30, 4 (Dec. 2006), 344–360.
[14] Sheldon, L. 2012. The multiplayer classroom: Designing
coursework as a game. Cengage Learning.
[15] De Shutter, B. and Abeele, V.V. Gradequest - Evaluating the
impact of using game design techniques in an undergraduate
course.


© Copyright 2026