
- D-Scholarship@Pitt
Dengue in Buenos Aires: An analysis of the factors
contributing to increased incidence of dengue fever in urban
environments
by
Miriam Frisch
Bachelor of Philosophy, University of Pittsburgh, 2015
Submitted to the Graduate Faculty of
The Graduate School of Public Health in partial fulfillment
of the requirements for the degree of
Bachelor of Philosophy
UNIVERSITY OF PITTSBURGH
University Honors College
This thesis was presented
by
Miriam Frisch
It was defended on
March 16, 2015
and approved by
Dr. Ben Dalziel, Department of Ecology and Evolutionary Biology, Princeton University
Dr. Michael R Glass, Lecturer, Urban Studies Program, University of Pittsburgh
Dr. Scott Morgenstern, Professor, Department of Political Science, University of Pittsburgh
Thesis Director: Dr. Wilbert van Panhuis, Assistant Professor, Department of Epidemiology,
University of Pittsburgh
ii
Copyright © by Miriam Frisch
2015
iii
Dengue in Buenos Aires: An Analysis of Factors Contributing to Increased Incidence of
Dengue Fever in Urban Environments
Miriam Frisch, Bachelor of Philosophy
University of Pittsburgh, 2015
Dengue is a neglected infectious disease transmitted by the Aedes aegypti mosquito,
which primarily inhabits urban tropical areas. Dengue is endemic in more than 100 countries;
over the last 50 years, there has been a 4.6 fold increase in dengue incidence, spreading to a
larger geographical region. In Argentina, there is low dengue incidence, and cases are
concentrated in the northern tropical regions. However, in 2009, the capital city of Buenos Aires,
located in a temperate region, experienced a historic outbreak of autochthonous and imported
dengue. This study approaches the socio-demographic factors possibly associated with this
outbreak and the spatial relationship between these factors and dengue fever in Buenos Aires.
Fieldwork was done in Buenos Aires where I conducted interviews with dengue experts,
and collected dengue and socio-demographic data. Dengue cases in 2009 were analyzed by
hospital area of the city in relation to 2010 census data on population density, place of birth,
proportion of the population with unsatisfied basic needs, and sanitary installations in homes.
Odds ratios and case level analyses were done between dengue and these risk factors. GIS was
used to determine spatial distribution of risk factors and dengue in Buenos Aires.
In interviews, dengue experts in Buenos Aires argued immigration and access to
sanitation contributed to the spike in dengue incidence and high concentration of cases in the
southern periphery of the city during the 2009 outbreak. High immigrant populations were
iv
thought to be associated with spatial disparities of dengue and increased incidence in these areas.
Yet, contrary to interview findings, odds ratios fail to show correlation between areas with
increased immigration and high dengue by hospital area. Findings suggest trends of positive
correlation between areas with high dengue and high poverty. Dengue appears to be higher in
areas with low population density as well.
v
TABLE OF CONTENTS
PREFACE .................................................................................................................................... XI
1.0
INTRODUCTION ........................................................................................................ 1
2.0
BACKGROUND: DENGUE FEVER ........................................................................ 3
2.1
DENGUE IN LATIN AMERICA....................................................................... 4
2.2
DENGUE IN ARGENTINA ............................................................................... 5
2.2.1
3.0
The Emergence of Dengue in Buenos Aires................................................ 6
BACKGROUND: THE REPUBLIC OF ARGENTINA ........................................ 10
3.1
ECONOMIC DEVELOPMENT IN ARGENTINA 1990-PRESENT .......... 11
3.2
AN URBAN HISTORY OF BUENOS AIRES ................................................ 12
3.3
3.2.1
Immigration to Buenos Aires ..................................................................... 13
3.2.2
Urban development in Buenos Aires ......................................................... 14
3.2.3
Economic Re-structuring ........................................................................... 16
BEYOND THE FEDERAL TERRITORY OF BUENOS AIRES ................ 18
4.0
PURPOSE ................................................................................................................... 20
5.0
METHODOLOGY..................................................................................................... 22
5.1
QUALITATIVE ANALYSIS: INTERVIEWS ............................................... 24
5.2
STATISTICAL METHODS ............................................................................. 26
vi
5.2.1
Data Collection ............................................................................................ 26
5.2.2
Data Management ....................................................................................... 28
5.3
ODDS-RATIOS.................................................................................................. 33
5.4
CASE LEVEL TESTS....................................................................................... 36
6.0
RESULTS ................................................................................................................... 37
6.1
QUALITATIVE ANALYSIS: INTERVIEWS ............................................... 37
6.1.1
Climate ......................................................................................................... 38
6.1.2
Urbanization ................................................................................................ 38
6.2
7.0
STATISTICAL ANALYSIS ............................................................................. 40
6.2.1
Geo-statistical Distribution ........................................................................ 43
6.2.2
Odds Ratio Analyses ................................................................................... 50
DISCUSSION ............................................................................................................. 55
7.1
TREATMENT AND PREVENTION .............................................................. 59
7.2
STRENGHTS AND LIMITATIONS............................................................... 62
8.0
CONCLUSIONS ........................................................................................................ 66
9.0
FUTURE DIRECTIONS ........................................................................................... 68
APPENDIX A .............................................................................................................................. 69
APPENDIX B .............................................................................................................................. 73
BIBLIOGRAPHY ....................................................................................................................... 81
vii
LIST OF TABLES
Table 1: Hospital Areas Assigned Values for Odds Ratio............................................................ 30
Table 2: Traditional Odds Ratio Format40 .................................................................................... 33
Table 3: Confirmed cases of dengue by Hospital Area in 2009. .................................................. 41
Table 4: Odds Ratio of Population Density .................................................................................. 50
Table 5: Odds Ratios of Proportion of Residents Born in a Country Bordering Argentina ......... 50
Table 6: Odds Ratio of People Living with Unsatisfied Basic Needs (UBN) .............................. 51
Table 7: Odds Ratios of Proportion of Homes Lacking Sanitary Installations............................. 51
Table 8: Risk Factors for Dengue in Buenos Aires ...................................................................... 52
Table 9: Odds Ratio of Population Density for Risk Factor Analysis .......................................... 73
Table 10: Odds Ratios of Proportion of Residents Born in a Country Bordering Argentina for
Risk Factor Analysis ..................................................................................................................... 73
Table 11: Odds Ratios of Proportion of Homes Lacking Sanitary Installations for Risk Factor
Analysis......................................................................................................................................... 73
Table 12: Odds Ratio of People Living with Unsatisfied Basic Needs (UBN) for Risk Factor
Analysis......................................................................................................................................... 74
Table 13: Residences with Sanitary Installations by Commune for the City of Buenos Aires
census 46 ........................................................................................................................................ 75
viii
Table 14: Population Distribution by Place of Birth per Commune (%), City of Buenos Aires,
2010. 46 .......................................................................................................................................... 76
Table 15: Total Population by Sex, Surface Area and Population Density by Commune. .......... 77
Table 16: % Population Lacking Basic Needs by Commune. City of Buenos Aires 2010. 46 ..... 78
Table 17: Conversion from Commune Area to Hospital Area38................................................... 79
ix
LIST OF FIGURES
Figure 1: Confirmed Cases of Dengue in Argentina, by year. 13 .................................................... 6
Figure 2: Suspected Cases of Dengue in Buenos Aires, Argentina. 13 ........................................... 7
Figure 3: Map of Buenos Aires. 28 ................................................................................................ 15
Figure 4: Map of Hospital Areas in Buenos Aires 38 .................................................................... 29
Figure 5: Intersection of Hospital Area and Commune in Buenos Aires 38.................................. 32
Figure 6: Confirmed Cases by Transmission Type in 2009. City of Buenos Aires. 46 ................. 42
Figure 7: Suspected and Confirmed Cases of Dengue in by Epidemiologic Week. City of Buenos
Aires 2009. 46 ................................................................................................................................ 42
Figure 8: Geographical Distribution by Hospital Area of Dengue Incidence in Buenos Aires38 . 44
Figure 9: Geographical Distribution by Hospital Area of Dengue and Population Density
(Appendix B) ................................................................................................................................ 46
Figure 10: Geographical Distribution by Hospital Area of Dengue and Proportion w/UBN
(Appendix B) ................................................................................................................................ 47
Figure 11: Geographical Distribution by Hospital Area of Dengue and Proportion w/ Adequate
Sanitation (Appendix B) ............................................................................................................... 48
Figure 12: Geographical Distribution by Hospital Area of Dengue and Proportion born in
Bordering Country (Appendix B) ................................................................................................. 49
x
PREFACE
I would like to extend my sincerest thanks to a number of organizations and people without
whom this Bachelor in Philosophy thesis would have been impossible. Thank you to the SIT
Argentina: Public Health in Urban Environments study abroad program staff for your
exceptional help and guidance. Thank you for facilitating my interviews with everyone I
requested and assisting with my data collection and analysis. I especially want to thank María
Eugenia Royer and Ana Rita Diaz Muñoz, whose guidance was critical in the development of
this study and the success of my fieldwork. Thank you for your help editing my emails and
interview questions, ensuring that questions were asked respectfully and in a culturally sensitive
context.
In the US, there are so many people I have to thank. Thank you to Liza Mitgang for
always being there for the advice I need at the time I need to hear it. Thank you to Shawn
McCoy for the hours you dedicated to helping me develop methodology, and teaching me all I
needed to know regarding GIS. Thank you to Roger Rouse for your guidance on shaping this
project into a globalized context. To Dr. Michael Glass and Dr. Scott Morgenstern, thank you for
your extensive suggestions and feedback on numerous drafts, and providing invaluable
suggestions and assistance in the structure and development of this work. Thank you to Dr. Ben
Dalziel as well for sitting as an external member on my committee and providing great feedback.
xi
Thank you especially to Dr. Wilbert van Panhuis for your constant encouragement and advising
from start to finish, and ensuring my thesis reached fruition.
Finally, to my friends, Alex, and my mother, father and sister: I don’t think it’s quite
possible to thank you enough for your love and support every day, and especially throughout this
process. You have shaped my mind, heart, and life; for that I will be forever thankful. This thesis
would not be possible without you.
xii
1.0
INTRODUCTION
Dengue fever is a tropical infectious disease endemic in over 100 countries throughout South
America, Southeast Asia, the Western Pacific, and Africa.1 Over the last 50 years, dengue has
affected larger geographical region and disease incidence has increased, causing serious
challenges internationally in its prevention and treatment.2 Areas that have previously not been
affected or trained to handle dengue are forced to deal with larger outbreaks.
Global political, social, and climate changes are believed to contribute to growing
international dengue prevalence. Climate and temperature changes, increased migratory and
travel patterns, economic restructuring and socio-demographic inequalities in urban areas must
all be considered in the context of this disease. It is critical to understand the risk factors
affecting rising incidence rates globally in order to develop effective prevention and treatment
strategies for large urban areas generally unprepared to handle this serious disease.
In the past ten years, Buenos Aires, Argentina, has experienced historically high dengue
incidence. 1 Buenos Aires is located in a temperate area and does not exhibit the typical tropical
environment in which dengue is endemic. This study examines the relationship between sociodemographic risk factors and dengue fever, using a historic outbreak in 2009 as the point of
1
Incidence is used to compare disease patterns on the population level. In this study,
incidence refers to the number of cases/100,000 people.
1
analysis. I analyze the spatial distribution of dengue cases within areas of Buenos Aires, and the
associated risk factors that may contribute to this geographic disparity in spread of dengue.
This study is critical in providing an epidemiological perspective to a situation that has
largely been studied from an individual patient or biological level. I intend to contribute to the
larger discussion of the evolving role of dengue in Buenos Aires by analyzing this disease at a
population level, which can be used in constructing comprehensive prevention and treatment
models can be used for modeling larger prevention and treatment models for Buenos Aires and
other cities experiencing a growing dengue problem.
I approach this analysis by first focusing on the disease itself, and then applying this
background to disease incidence in Argentina and Buenos Aires and to a historical context. I
intend to identify underlying contributors that may have played a part in the distribution and
quantity of cases during the 2009 outbreak. I argue that the presence of high poverty indicators
and low population density are associated with higher dengue incidence in certain areas of
Buenos Aires during this outbreak. Immigration from Bolivia and Paraguay is commonly cited as
the primary reason for the spike in dengue cases in Buenos Aires. Yet, this study fails to find
statistically positive correlation between areas with high dengue and areas with high immigration
rates.
This first chapter of background focuses on the rising global incidence of dengue since
the 1970s, methods of transmission and treatment. The second chapter puts dengue into a
political and social context in Argentina and within Buenos Aires specifically.
2
2.0
BACKGROUND: DENGUE FEVER
Dengue is a tropical infectious disease that is rising in severity and prevalence in the Global
South, especially in Latin America, Southeast Asia, and the Pacific. In September 2013, 40% of
the world’s population was at risk for contracting dengue.1 Approximately 50 to 100 million
infections occur each year.1
The Aedes aegypti is the primary vector that transmits the dengue virus.1 The Ae. Aegypti
prefer an urban habitat to lay their eggs in artificial water storage containers that are common in
cities, including flowerpots and water storage containers.1 These containers are often present in
lower-economic areas lacking sanitary installments and running water. Here, water is often kept
in storage containers for drinking, cooking and discretion purposes.
Dengue is spread through a cycle that begins with the Ae. Aegypti laying eggs in artificial
water storage containers.1 Ae. Aegypti are first infected with the virus when feeding on someone
infected with dengue, normally five days after the person contracts the virus.3 The mosquito
carries the virus for the rest of its average 14 day lifespan, transmitting dengue to other healthy
humans when feeding.3 Four to seven days after becoming infected, patients may begin
exhibiting symptoms, though many are asymptomatic.3
There are four strains of dengue, and infection with one does not provide immunity
against the others.1 Infection with dengue produces flu-like symptoms; dengue hemorrhagic
fever can develop when a patient is infected with the same strain of dengue more than once.1
3
Currently there is no treatment for dengue, but early detection and appropriate case management
can reduce fatality rates to below 1%.4 Control of dengue depends on the reduction of Ae.
Aegypti and Ae. albopictus (secondary vector) populations, e.g. through community interventions
including the elimination and treatment of mosquito infested containers.5, 6
The Ae. Aegypti is highly sensitive to changes in climate and temperature. Rising
temperatures, and increased precipitation and humidity characteristic of tropical areas lead to
faster vector reproduction, and thus increased spread of dengue. 7
2.1
DENGUE IN LATIN AMERICA
Dengue is a growing problem in Latin America and the Caribbean. An epidemic in Mississippi,
USA, in 1945 spurred the Pan-American Health Organization (PAHO) to call for the elimination
of the Ae. Aegypti strain in the Americas entirely by 1947.8 Between 1952 and 1965, 19 countries
in Latin America were free of the mosquito.8 However, in the past 30 years, there has been a 4.6
fold increase in dengue incidence in areas where the disease was previously eliminated.8
This reappearance in Latin America is predominantly in the Southern Cone of South
American, which includes Brazil, Paraguay, Bolivia, Chile, Uruguay and Argentina. In 2007,
more than one million cases were reported in the Americas.9 Since 2000, Brazil has accounted
for 63% of cases in South America.10 Beginning in the 1980s, Bolivia, Paraguay and northern
Argentina have reported cases as well.10 The tropical environment in this region allows for easier
transmission of dengue.3
In 2009, there were significantly higher numbers of cases of dengue throughout the Latin
American region. Outbreaks were observed in Bolivia, Paraguay, Mexico, as well as Argentina.
4
11
Brazil reported steadily increasing numbers of cases from 2008-2010 as well.
11
The regional
increase in dengue transmission during this time also led to increase in dengue throughout
Argentina, including more temperate regions. This 2009 outbreak is significant because it was
the first time that a large number of cases of this tropical disease were recorded in temperate
regions of Argentina, including Buenos Aires, Argentina. 12
2.2
DENGUE IN ARGENTINA
The number of cases in Argentina prior to 2009 was relatively low, especially compared to
endemic countries such as Brazil.12 With the tropical climate, dengue has long been an issue in
the northern provinces of Argentina, especially those bordering with Brazil.12 In line with
eradication trends in the mid-20th century, dengue was eradicated from the country as part of the
nation-wide campaign in 1963. Yet, in 1986, the vector was reported again, increasing the spread
of the disease.12 Over the next 10 years, provinces throughout the country were declared reinfested with the disease.12 2009 marked a year of especially high numbers of cases throughout
the country, in line with the larger regional outbreak. Over the first half of this year, when the
outbreak was the most severe, Argentina reported over 26,000 confirmed cases of dengue, and
deaths from dengue for the first time. (Figure 1) The majority of cases were in the northern
provinces of Chaco, Catamarca and Salta, located closer to the equatorial belt. 11
5
Number of Cases (in thousands)
30
25
20
15
10
5
0
1997 1998 1999 2000 2001 2002 2003 2004 2005 2006 2007 2008 2009 2010 2011 2012
Year
Figure 1: Confirmed Cases of Dengue in Argentina, by year. 13
2.2.1
The Emergence of Dengue in Buenos Aires
Up until the early 2000s, the southern central region of Argentina was dengue-free.12 Cases were
only occasionally diagnosed, due to travel to endemic regions by patients who develop
symptoms upon their return to Buenos Aires.
The 2009 outbreak throughout the Americas also affected the more temperate areas in
Argentina.11 The federal capital city, Buenos Aires, located in this temperate region, was
previously dengue-free, but in 2009, reported cases of both imported and autochthonous (locally
transmitted and infected) dengue.10 Buenos Aires recorded 240 laboratory-confirmed cases in
2009, and over 600 cases were suspected to be dengue. 12 (Figure 2) This was the highest number
of cases ever recorded in the city.12
6
Buenos Aires is one of the most densely populated cities in the continent with three
million habitants; an outbreak of dengue has serious implications for a city of this size.6 The
federal capital city is only 78 square miles, small compared to other large metropolitan areas in
South America, including Sao Paulo, which is 576 square miles or Rio de Janeiro (the largest
city in South America), which is 16,871 square miles. 14 Thus, with a large population in a small
geographic area, the spread of any infectious disease must be taken seriously.
Number of Suspected Cases
700
600
500
400
300
200
100
0
1999 2000 2001 2002 2003 2004 2005 2006 2007 2008 2009 2010 2011 2012 2013
Figure 2: Suspected Cases of Dengue in Buenos Aires, Argentina. 13
The dengue outbreak in 2009 was unique because it was the first time Buenos Aires
reported autochthonous cases of dengue. Prior cases had been imported from other areas. This
outbreak is also historic because it occurred in a relatively temperate area; Buenos Aires has a
climate similar to New York City, USA, and is located on the same latitude lines as Cape Town,
7
South Africa. In 2009, the city faced a serious dengue problem, and had to not only limit disease
importation into Buenos Aires, but also stop the spread of the disease within its own boundaries.
A variety of factors are thought to contribute to the 2009 outbreak in Buenos Aires.
Worldwide, climate change is considered the major contributor to increased dengue incidence.15
With increased temperatures and precipitation, the Ae. Aegypti has a more comfortable climate in
which to reproduce, with more clean water sources to lay eggs. However, prior studies
demonstrate that temperature change in Buenos Aires and Argentina is a contributor but not the
only factor causing increased dengue incidence.15 Carbajo et al. proposed that a combination of
geographic, demographic, and climate factors influenced the spread of the vector further south in
Argentina into Buenos Aires, and contributed to Buenos Aires reporting cases during the
outbreak in 2009. 15
These investigators emphasized the multi-faceted approach to analyze the spread of
dengue.15 While temperature may have its impacts, geographic and demographic factors are
influential in spread.15 However, this study does not outline specific geographic and
demographic factors that may contribute to increased incidence.15 As a result, my study serves as
a follow-up to analyze particular poverty and geographic indicators within Buenos Aires, within
a certain timespan, to reiterate the claim that societal risk factors have an effect on dengue spread
as well.
Immigrant movement into Buenos Aires from the bordering countries of Paraguay and
Bolivia is a main factor that dengue experts focused on when discussing dengue prevention and
rising incidence rates.10 With regular travel between Bolivia, Paraguay and Brazil and Argentina,
immigrants and travelers are thought to be importing the disease into the northern provinces and
to migrant populations in large urban areas such as Buenos Aires. 10
8
However, I argue that other characteristics of the capital city besides immigration
increased the area’s susceptibility to dengue during this broader outbreak throughout the region.
Immigration may be a factor in the transmission of dengue, but it is not the only factor that is
associated with dengue spread throughout Buenos Aires. Rather, I argue poverty indicators
account for the spread of dengue in the city better than immigration, and can be used to
understand the uneven distribution of dengue cases throughout the city.
At this point in time, there is particular reason to focus on dengue spread in previously
unaffected areas. New evidence has demonstrated that other mosquito species, including a
subtropical and temperate species are more comfortable in the climate in Buenos Aires, and have
substantial competence for the dengue vector.
16
These studies suggest that a higher incidence
rate of dengue in these climates, especially more southward in Argentina in areas including
Buenos Aires, is possible in the future. 16
9
3.0
BACKGROUND: THE REPUBLIC OF ARGENTINA
The Republic of Argentina is a geographically and environmentally diverse country, making the
study of dengue particularly interesting. It is located in the ‘Southern cone’ of South America,
with the northern provinces located directly below the equatorial belt, while the southernmost
provinces are home to numerous glaciers and penguin populations. 17
Argentina is a middle-income country based on a federal system, with 22 provinces and a
federal capital of Buenos Aires.18 Argentina has a population of 41.09 million, the second largest
population in South America after Brazil.19 The population is predominantly of European
descent, with only a small proportion of indigenous or mestizo descent.20 Argentina is considered
an exception in the Latin American region in terms of its homogenous, highly educated
population largely made up of European immigrants. 17
The majority of the Argentine population (89.4%) lives in urban areas, resulting in socioeconomic disparities between rural and urban areas and elite and poor within the country.19 The
rural areas in the northern tropical areas of Argentina located near the country border are
generally poorer with large minority populations, and report much higher dengue incidence. For
the most part, these areas have poorer access to medical resources and a generally poorer quality
of health. 19
However, the federal capital of Buenos Aires, located within the larger province of
Buenos Aires, has a much different demography. Quality of life is generally higher and people
10
with different ethnic and socio-economic backgrounds live in the city, creating deep cultural
divides between Buenos Aires residents and those of the rural inland.17 There are deep-set
inequality issues in the country, especially between the “porteños” who live in Buenos Aires, and
those who live inland. Analysts argue Argentina has “little potential for social progress” given
this disparity. 17
Socio-economic inequality issues are particularly relevant in infectious disease spread. I
argue that it is through the establishment of inequality throughout Argentina that poorer areas
become much more susceptible to contract and spread dengue without proper prevention and
treatment practices in place.
3.1
ECONOMIC DEVELOPMENT IN ARGENTINA 1990-PRESENT
The inequality reported in Buenos Aires has increased exponentially in the past 20 years, which
may have made some populations more susceptible to dengue transmission compared to others.
Due to neoliberal influences and economic restructuring in the 1990s, the economic and political
climate in Argentina changed significantly.21 The introduction of new economic policies focused
on restructuring Argentina’s economy led to high inflation, increasing rates of income inequality,
and huge trade deficits in the late 1990s and early 2000s.21 Between 2001 and 2002, Argentina’s
economy collapsed when they defaulted on over $144 billion in loans.21 This economic collapse
increased the poverty rate from 35.9% to over 53% of the population. The percentage of poor
households also doubled 26.2 in May 2001 to 41.4 in May of 2002. 21
The economic and political turmoil during this time had huge implications for public
health, and arguably created an environment that allowed for increased dengue transmission in
11
certain areas of the city during the regional outbreak of 2009. With poverty and unemployment
increasing significantly, a greater proportion of the population was living in poor conditions with
poor access to health care due to lower access and higher cost. The economic crash furthered the
divide between rich and poor, leaving greater proportions of the population with unsatisfied basic
needs and less access to sanitary installments (i.e. flushing toilets), potentially increasing risk of
contracting dengue.
The economic crash resulted in a variety of populist policies and restructuring aimed at
reducing poverty and restoring the country to pre-crisis conditions. A reformed universal health
system was established with stratified levels of payment and service, with the aim of providing
equal access health services.22 Though complicated, this system was influential in reducing the
major health disparities apparent after the economic crash.
This restructuring, among other governmental programs, has resulted in major health
improvement over the past 10 years and arguably limited what could have been much worse
dengue epidemics later on, with a more centralized health system. These reforms were critical in
Argentina’s recovery from the 2001-2002 crash though poverty rates were slow in declining over
the next 10 years. In 2009, poverty rates throughout the country were still higher than they were
in 1990. 23
3.2
AN URBAN HISTORY OF BUENOS AIRES
Within the larger socio-economic and geographic context of Argentina, we can better understand
the factors affecting dengue incidence and its spread. In this section, I approach the urban
development of Buenos Aires through socioeconomic divides and the issues existing within the
12
federal city limits. The City of Buenos Aires is its own “federally constitutional unit” in the
larger province of Buenos Aires that includes the surrounding municipalities, towns and suburbs.
The federal capital city has a population of approximately three million people, with the greater
region containing approximately 9.5 million people.
24
The greater metropolitan area of Buenos
Aires is important to study as well; however this study, due to data availability, focuses only on
the federal capital of Buenos Aires.
3.2.1 Immigration to Buenos Aires
Buenos Aires has become a conglomerate of international and domestic immigrants and their
descendants. This movement escalated particularly in the 1940s when millions of Europeans
moved to Buenos Aires to escape World War II Europe.25 In the early 20th century, roughly 80%
of these immigrants were from Italy or Spain.25 The influx of immigration provided a large
source of labor that, combined with major industrialization, allowed Buenos Aires to become a
major economic force and urban center in South America. In the twentieth century, the capital
city made up approximately 40% of the entire Argentine production.25
Characterized by diverse population, Buenos Aires is a city divided into cultural
neighborhoods, with areas clearly distinguishable by ethnicity, religion and socio-economic
status. This ethnic and socio-economic distribution is believed to affect dengue distribution
throughout the city.
Buenos Aires has remained ethnically diverse in the past 100 years, and migrants have
continued to move there. Recently, immigrant populations have originated from Asia, inland
Argentina, and within South America.25 The economic growth experienced in Buenos Aires,
especially with high poverty throughout the country after the economic collapse, has led many
13
inland Argentinians to move to Buenos Aires in search of employment and education. Since
1991, the drastic changes in socio-demographic conditions in Buenos Aires are hypothesized to
be partially a result of migration of rural farmers to the urban center.26 Clinicians within Buenos
Aires argue that people coming and traveling from dengue endemic countries and regions of
Argentina are the main transmitters of dengue within Buenos Aires, due to regular and seasonal
travels to their home countries where they contract dengue. 27
3.2.2
Urban development in Buenos Aires
I analyzed urban growth and development within Buenos Aires to determine the spatial
distribution of immigrant communities and the socio-economic divides. An understanding of
how the city has developed, including socio-economic disparities and population density
differences, is important to apply in analysis of the spread of dengue in these neighborhoods.
Buenos Aires has grown from the central urban core out to the periphery.25 The federal
capital buildings are centered within the main business district of Buenos Aires, the Microcenter,
marked in the red circle in Figure 3. North of the Microcenter area are predominantly upperincome neighborhoods with up-scale apartment buildings and Western architectural design. The
northern periphery of the city also experienced an explosion of gated communities in the 1990s
for middle to upper class families looking to avoid the violence of the city inside the safety of
these developments.25 These developments were more westernized with shopping malls and New
York City style high-rise apartment buildings surrounding them. 25 The center and northern areas
of the city feel very Western in architecture and development; some parts are very reminiscent of
the Upper West Side of New York City, or parts of Europe.
14
Recently, there has been significant urban development east of the Microcenter in Puerto
Madero with gentrifying American and European developments. However, the poverty in
Buenos Aires is evident especially on this eastern riverfront; directly south of the elite
developments in Puerto Madero are some of the poorest communities in the city, commonly
known as villas miserias (shanty towns). 25
Figure 3: Map of Buenos Aires. 28
The periphery of the city is comparatively less dense than the Microcenter, though the
population density is still high enough to be considered an urban area. Immigrants moving to the
city have settled in the periphery and suburbs of the city, primarily in the northern and southern
15
areas, where there were small properties available for purchase.25 Today, South American and
domestic immigrants to Buenos Aires have settled in the periphery of the city. These areas,
generally report higher cases of dengue than in the center core. Experts have argued that the
disparity in dengue incidence between the periphery and core is due to the high concentration of
immigrants in the periphery. However, their analysis often fails to consider the high poverty rates
and other socioeconomic disparities that also affect these areas.
Significant increases in immigration in Buenos Aires have resulted in an huge population
growth and rapid urbanization and led to serious issues of urban sustainability including
sanitation, housing, provision of water and sewage, trash disposal, lack of access to health and
education centers. These problems were only heightened after the economic crash of 2001.29
Of the approximately three million people within Buenos Aires, roughly 65,000 live in
squatter settlements.
30
These shantytowns lack sanitation and social services and are home to
many newcomers to the city. One shantytown has grown from roughly 350 citizens in 2001 to
1,500 in 2010.
30
Many people are forced to live in these areas due to the high property costs
within the city. Plans were in place in 1998 to alleviate the poverty and lack of appropriate
housing in these areas, but today, the populations in these areas continue to grow, and be the
poorest areas of the city.
30
I argue that these poorer areas of the city are more likely to have
higher levels of dengue incidence due to poor conditions compared to wealthier neighborhoods.
3.2.3 Economic Re-structuring
In line with neoliberal restructuring in Argentina and throughout Latin America, in the late
1990s, the Buenos Aires water and sewage systems were privatized. This change drastically
affected access to these basic resources, and most likely increased people’s use of water storage
16
containers, especially for those who could no longer afford to pay for water and sanitation
services. 31
This privatization caused significant disparities in access to resources by different sociodemographic groups. Users who lived in higher socio-economic areas had greater purchasing
power and benefitted disproportionately over those in areas with less purchasing power and
greater poverty.31 Increased market principles and regulation resulted in increased legislation and
decreased tolerance for people obtaining water and electricity illegally.31 Combined with the
privatization policies, the 1990s resulted in a significant loss of resources for the urban poor in
Buenos Aires. 31
I argue the economic restructuring that occurred in the 1990s was a major contributor to
increased inequality in Buenos Aires and would affect the spread of dengue throughout the city
during the outbreak in 2009. The 2001-2002 crash and resulting economic policies
overwhelmingly affected the poor living in Buenos Aires. Thousands of formal sector jobs were
lost, resulting in a significant rise in the informal economic sector.32 This change in the labor
market would continue after the crash; in 2006, 40.8% of total wage earners were employed
through the informal sector.33 The percentage of the population lacking regular access to
healthcare increased from 19.7% in 1991 to 26.2% in 2002.26
The economic decisions of this time limited the low-income population’s access to basic
resources, furthering their inequality and propensity to contract mosquito-borne diseases such as
dengue fever. It is through policy shifts such as these in combination with existing socioeconomic disparities in the city, that I argue Buenos Aires developed into an environment that
catered more directly to the Ae. Aegypti, and spread of dengue.
17
3.3
BEYOND THE FEDERAL TERRITORY OF BUENOS AIRES
Issues of health and deep-set inequality extend beyond the federal borders of the capital city of
Buenos Aires. Outside the poor southern periphery of the capital city, extensive networks of
surrounding suburbs and municipalities also experienced the outbreak of dengue in 2009, and
have similar health-based inequalities.
The outbreak of dengue in 2009 did not stop at the city limits, and largely appears to be
connected to the outbreaks in the bordering localities. Similar environments are present in the
municipalities La Matanza and 3 de Febrero. Lower-income communities in these areas made up
primarily of immigrants represent larger trends in the development of the dengue outbreak in
2009. While the first initial autochthonous cases were diagnosed in patients living within the city
limits, cases would later also originated from outside city limits. Political borders do not limit
dengue.
During the outbreak of 2009, the neighboring municipalities of La Matanza and 3 de
Febrero reported the highest numbers of indigenous cases in the localities outside of Buenos
Aires.27 These areas border the southwest areas of the federal capital, where high dengue spread
also occurred.27 Within these areas, there was high vector density, given greater proportions of
people with the disease living in a small area. 27
There are also stark socio-economic inequalities in this sub-urban area; municipalities
have extreme poverty and high proportions of people living with unsatisfied basic needs, while
neighboring municipalities have very low poverty rates.34 This distinct geographic disparity
based on living situation can be partially explained by the presence of gated communities or
‘countries’ (originating from the term “country club”) in Buenos Aires, where upper-class
families live in new developments designed to exclude them from the surrounding
18
municipalities. Within these areas, poverty indicators demonstrate stark effects in the health of
these communities. 34
This study is limited to the federal capital city of Buenos Aires due to data availability
and limited time to conduct this study. However, analysis of the larger metropolitan area of
Buenos Aires, and the spread of dengue in this region both in 2009 and other years is also
critical, due to movements of residents over the city limits affecting transmission.
19
4.0
PURPOSE
It is critical to address economic and social policy shifts and the relationship they have increased
inequality. In this study, I analyze how these shifts may be associated with the spread of dengue
fever, a tropical infectious disease, in a temperate area. The increased spread of dengue fever is
not caused by one specific factor or change in society, but rather a conglomeration of factors that
create an environment in which the Ae. Aegypti thrive, reproduce, and infect humans with the
disease. Dengue fever is a disease that is thought to only be increasing in severity and geographic
spread. Understanding the relationship between socio-demographic risk factors and increased
dengue is crucial in developing prevention and treatment techniques.
The 2009 outbreak of dengue affected much of South America and since, the number of
cases throughout the region has continued to remain high. While broader factors including the
higher incidence levels regionally may have contributed to higher incidence levels in Buenos
Aires, Argentina, I argue that socio-demographic inequalities throughout the city caused some
regions of the city to be disproportionately burdened with the disease. This is especially apparent
in disparities between the central core and northern periphery and the southern periphery.
Immigration is thought to cause increased dengue incidence in certain areas of Buenos
Aires during this outbreak, because immigrants primarily reside in the southern periphery of the
city. However, my data analysis conducted in this study does not show a relationship between
areas of the city with high immigration and high dengue levels. I argue that the
20
underdevelopment in areas of Buenos Aires, leading to high poverty and low population density
influenced the spread of dengue during the outbreak in 2009 more so than immigration.
Prior studies on dengue in Buenos Aires have focused on case level analysis and looking
at the geography of the area, but have not put the cases of dengue into an epidemiological
framework that analyzes the dengue cases on the population level with available sociodemographic data. This study is unique and critical in understanding the role of urban planning
and development within public health, especially in ultra-urban areas such as Buenos Aires. The
following sections provide insight into the relationship between these two areas of study, and
further statistical analysis of the dengue cases in 2009 in relation to socio-demographic data for
the federal capital of Buenos Aires.
21
5.0
METHODOLOGY
The purpose of this investigation is to analyze the relationship between socioeconomic and
demographic risk factors and dengue incidence in Buenos Aires during the outbreak of 2009.
This study was conducted qualitatively and quantitatively over a fifteen-month period from
November 2014 to March 2015. The initial topic for this work originated from research done for
a public health methods class at the University of Pittsburgh on the Argentine health system, and
was expanded upon during studies and research over a four-month period in Buenos Aires,
Argentina in the spring of 2014. Data collection in Buenos Aires was made possible through the
study abroad program SIT Argentina: Public Health in Urban Environments.
To conduct this study, I lived in Buenos Aires for four months, studying the health
system, history and urban environment, applying my prior studies of the dengue situation, while
continuing to collect more information. I worked with Dr. Wilbert van Panhuis prior to my
departure and during my time in Argentina to design the work I planned to do while in
Argentina, and the analysis that needed to be done afterwards. I conducted literature reviews
using PubMed to find existing studies on dengue in Buenos Aires to understand the holes in
current analyses and used these works to shape the structure of my interviews and determine the
focal points of my analysis.
During the first three months in Argentina, I studied the Argentine health system and
health demographics to garner a general understanding of the health situation in both Argentina
22
and Buenos Aires specifically. This work was critical in providing a basis for my research. My
individual observations of social inequalities within this city, and the gap in current literature in
acknowledging this disparity in relation to the spread of dengue drove my thesis and
development of this study. I then conducted interviews with dengue experts, and used this
knowledge in my data analysis. My qualitative data was obtained through interviews, and my
quantitative data was obtained through published bulletins and data sets by the Argentine
government, and data summaries given to me by the Department of Epidemiology for the City of
Buenos Aires.
The qualitative and quantitative approach to this study makes it particularly effective in
understanding dengue in Buenos Aires, especially from an outsider’s perspective. The
information collected in interviews was used to organize and focus, using a snapshot approach,
specifically on dengue cases in 2009, and only in the federal capital of Buenos Aires. Within the
four-month period in Buenos Aires, preliminary data analysis suggested trends between risk
factors and increased dengue incidence in the city. Upon return to the United States, these data
were analyzed more in-depth using epidemiological and geo-statistical analytical tools.
This study is presented as the individual fieldwork of an undergraduate student who
observed and studied infectious disease spread in urban areas, paying particular attention to the
urban framework that may have contributed to spread. All experiences and analyses are my own.
These interviews were conducted with the approval of both the SIT study abroad program and
the University of Pittsburgh International Review Boards.
23
5.1
QUALITATIVE ANALYSIS: INTERVIEWS
Interviews were conducted with four dengue experts in the city of Buenos Aires who provided
different perspectives on the relationship between the socio-demographic disparities and dengue
in Buenos Aires. These interviews shaped the development of this study, the focus on the
specific socio-demographic factors analyzed, and allowed for further interviews to take place.
These interviews were also critical in providing data at the hospital area level for dengue, which
was unavailable in online databases.
The study abroad program SIT: Public Health in Urban Environments assisted me in
contacting dengue experts and potential interviewees and guided the development of my
research. Initial interviews took place with Dr. Aníbal Carbajo, who has published many of the
papers on which this study is based, and Marcelo Abril, who was recommended by program
coordinators given Organización Mundo Sano’s critical role in dengue prevention and treatment
within Argentina.15 The subsequent interviews emerged through the snowball effect after initial
referrals to speak with Dr. Carbajo and Abril.
All interviewees were contacted via email in Spanish. All interviews were also conducted
in Spanish. The interviewees decided place and time. Interviews were audio-recorded in Spanish,
which I transcribed and later translated into English. Interviews were conducted at Hospital
Muñiz, the infectious disease hospital where all dengue cases within the city were treated, as
well as within the Buenos Aires Department of Epidemiology, where all cases are monitored and
analyzed, and summaries presented to city officials, Organización Mundo Sano, and via email.
When conducting the arranged interviews, my study abroad program presented me for
my interviews as an American college student conducting a research project. This position
affected the power dynamics within these interviews. I was not taken as seriously as a researcher
24
than I believe may have been the case had I been presented as a researcher from the University of
Pittsburgh. The effort put into organizing these meetings by SIT staff also resulted in very
structured questions being asked. In acknowledgement of the culture and respectful nature in
which students address their superiors, I was limited in my ability to question the validity of
statements experts made. When I asked these follow-up questions, answers generally provided
limited explanation or merely defense of previous points.
This interview experience provided insight into how dengue, its treatment and
investigation are viewed in Buenos Aires by experts. Some interviewees were more willing to
discuss the controversial socio-demographic divisions within Buenos Aires, and their
relationship to dengue, while other experts strongly argued that dengue affected Buenos Aires
democratically in 2009. These interviews were critical in my understanding of dengue in Buenos
Aires from a field perspective; I gained various opinions on the factors contributing to increased
spread, as well as more general knowledge on dengue treatment and monitoring within the city.
This holistic knowledge is important when considering broader prevention tactics in the future,
and understanding how these policies may have contributed to increased spread of dengue during
the 2009 outbreak.
25
5.2
5.2.1
STATISTICAL METHODS
Data Collection
This project required extensive data on cases of dengue in Argentina and the surrounding
countries for reference, as well as city-specific data on dengue and socio-demographic factors for
the city of Buenos Aires. Dengue data were collected from the PAHO, the Argentine Ministry of
Health and the City of Buenos Aires Departments of Epidemiology. Data from PAHO and the
Argentine Ministry of Health were obtained from weekly online bulletins published with
statistics on the number of cases reported in that week. Dr. Esperanza Janeiro gave me data from
the City of Buenos Aires Department of Epidemiology on the number of cases by hospital area in
the city of Buenos Aires.
Cases of dengue can be categorized based on a determination of whether they are
suspected, probable, or laboratory confirmed. Suspected cases of dengue are cases that are
“clinically compatible cases of dengue that are epidemiologically linked to a case,” meaning that
patients are exhibiting symptoms of dengue, and may be from an area where other cases have
been reported.
35
Probable cases of dengue are “clinically compatible cases with laboratory
results indicative of presumptive infection.”35 Confirmed cases of dengue are “clinically
compatible cases with confirmed laboratory results.”35 Using suspected cases of dengue can be
beneficial for analysis because the larger margin of error is closer to accounting for cases that
were never diagnosed, compared to the confirmed case measure. However, for this study, the
most reliable data sources by hospital area in the city of Buenos Aires for 2009 had only data on
the number of confirmed cases. As a result, only confirmed cases were used for statistical and
geographical analysis.
26
Within Buenos Aires, district protocols are in place for clinics and hospitals for the
detection of dengue cases. Within 24 hours, clinics are required to send samples out for
laboratory testing, and obtain permission from the patient for this testing.
36
Cases are then
registered by the result of the laboratory testing, and sent to the Department of Epidemiology for
the City of Buenos Aires. 36 When these cases are detected, preventative measures are also taken
to educating the patient on dengue and how it is transmitted, and also receiving more information
about the area in which he or she lives. The city also takes measures to identify areas in which
the mosquitos are laying their eggs, and fumigating these areas to prevent further spread. 36
Socio-demographic data for the city of Buenos Aires and Argentina were collected
through the 2010 census conducted by and distributed online by the Argentine government.
Based on suggestions made by dengue experts and prior analysis done studying health-based
inequalities in Buenos Aires, socio-demographic factors with data collected in the survey were
chosen for analysis. These factors were suspected to have high values in the same areas that also
had high dengue incidence. Per the Argentine census, all risk factors used were recorded by
commune within the Buenos Aires.
These risk factors are:
1. Population Density (residents/km2). Population density was selected to determine if
denser areas had a higher propensity for the disease.
2. The proportion of the population born outside of Argentina, in a bordering country (i.e.
Brazil, Uruguay, Bolivia, Chile, or Paraguay). This measure accounts for immigrant
communities living in Buenos Aires.
27
3. The proportion of the population lacking adequate sanitation (i.e. running water and
sewage systems). Lack of adequate sanitation accounts for the presence of water storage
in areas.
4. The proportion of the population living with unsatisfied basic needs (UBN). This is a
common poverty measure within Latin America, translated from ‘necesidades básicas
insatisfechas’. It is a comprehensive account of considerations including the number of
homes with more than three people living in each room, living situation (homelessness,
living in a permanent home), sanitary conditions, whether children are attending school,
subsistence capacity (when the head of the household has not completed more than the
third year of primary school).37
5.2.2
Data Management
Dengue data were organized by confirmed and unconfirmed cases by month or epidemiological
week. For this study, due to data availability, only laboratory-confirmed cases were used for
analysis. To account for differences in population between hospital areas, incidence rates
(number of cases/100,000 people) were used for this study.
Within the city of Buenos Aires, dengue cases were analyzed on the hospital area level.
There are 12 hospital areas in Buenos Aires, and each hospital area represents a district with one
main hospital to which residents of that area report (Figure 4). All dengue cases were treated at
Hospital Muñiz, the infectious disease hospital in Buenos Aires. Cases were recorded and
separated by the hospital area of residence for each patient. The hospital in each of these hospital
areas is responsible for cases and disease monitoring in its region. For simplification purposes,
28
each hospital area was labeled
1 with a number, as shown in Table 1, and labeled in Figure 4.
9
9
8
6
1
2
3
0
4
5
7
10
11
Figure 4: Map of Hospital Areas in Buenos Aires 38
29
Table 1: Hospital Areas Assigned Values for Odds Ratio
Hospital Area
Mejía
Zubizarreta
Durand
Alvarez
Vélez Sarsfield
Santojanni
Tornú
Argerich
Fernandez
Pirovano
Penna
Piñero
Label
0
1
2
3
4
5
6
7
8
9
10
11
Data available on the hospital area level added complexity to this analysis. Census data is
collected and categorized by city communes, which has a different geographic distribution
within Buenos Aires than the hospital area. There are 15 communes in Buenos Aires, and 12
hospital areas. Hospital areas and communes overlapped in total geographic area within the city
limits, but there is not a direct correlation between hospital area and communes. Geo-statistical
analysis was required to determine the relationship between the hospital and communes. This
analysis was necessary in order to conduct any direct quantitative study between sociodemographic factors from the 2010 census on commune level, and dengue rates collected in the
2009 outbreak by hospital area. Through geo-statistical analysis, census data on the commune
level were converted to the hospital area level. Geographic data on the hospital area and
commune coordinates were obtained through the City of Buenos Aires website.
30
Geographic Information System (GIS) software was used to determine correlation
between hospital area and commune. Using textbook procedures, the intersection between
hospital area and commune was calculated, yielding the proportional area of each commune
within the hospital area, as shown in the table below.
To find the proportion of each commune area within respective hospital areas, I divided
the area of intersection (of the hospital area and commune area) by the total commune area. This
value gave me the proportion of each commune that is in the geographic region of each hospital
area. This proportion was used to convert socio-economic factors from the commune scale to the
hospital area scale through which I can directly analyze that data to dengue data, all on the
hospital area scale.
I found the proportional socio-demographic variable for each hospital area by multiplying
the proportion value calculated above by the socio-economic factor value for each commune.
Given that each hospital contains more than one commune, I then added all of the proportions for
each hospital area together to find the total socio-demographic variable for each hospital area. In
this way, I converted data that was on the commune level scale to the hospital area scale. (Table
2)
The figure below demonstrates the distribution between hospital area and commune.
(Figure 5) Each commune is displayed in a different color, with the hospital area borders
displayed in black. This demonstration shows the unequal intersections of hospital areas with
communes. While there are some communes that are entirely encompassed by a single hospital
area, others overlap numerous hospital areas.
31
Figure 5: Intersection of Hospital Area and Commune in Buenos Aires 38
32
5.3
ODDS-RATIOS
Odds ratios determine the odds that one risk factor leads to having a disease, or other factors.
Using the following calculation, an odds ratio computes whether areas with exposure to a risk
factor have higher odds of having high disease levels, compared to areas that are not exposed to a
risk factor. If the odds ratio is greater than 1, it indicates that there are higher odds of exposed
areas having high disease levels. If the odds ratio is less than 1, it indicates that there are lower
odds of exposed areas having high disease levels. 39
Table 2: Traditional Odds Ratio Format40
Exposed
NotExposed
High
Disease level
A
B
A/B
Low
Disease level
C
D
C/D
Odds Ratio=
Odds
(A/A+C) / (C/A+C)
(B/B+D)/(D/B+D)
=AD/BC
I chose to use odds ratios in this study because it is a calculation that does not require a
large sample size. Other statistical tools, including regressions, require a much larger sample size
to determine statistical significance and correlation. The odds ratio calculation can be used to
suggest relationships in the data that can later be further analyzed with a larger sample size. This
odds ratio does not explain risk, but can being to explain relationships between risk factors and
disease levels.
33
Using the odds ratio with data available for socio-demographic risk factors and dengue
data for 2009, I wanted to determine if areas with high levels of socio-demographic risk factors
had higher odds of having higher dengue cases during the 2009 outbreak. I compiled data into a
manner that could be used in the 2x2 tables used in odds ratio calculations. I determined what
constituted an area that was “exposed” versus one that was “not exposed,” using the table above
as a model. I then calculated the city average for each socio-demographic variable by hospital
area, and used this value to split my data into an “exposed group” (hospital areas with above
average rates of the socio-demographic risk factor) and an “unexposed group” (hospital areas
with below average rates of the socio-demographic risk factor). In my analysis, I denoted above
average hospital areas as “high” and below average hospital as “low.”
I also used this method to separate hospital areas with high levels of dengue from those
with low levels of dengue. I first calculated the city average of all hospital areas dengue
incidence, and used this value to separate areas with above the city-average dengue incidence
from those with below-average dengue incidence. I denoted those with above average dengue
incidence as “high dengue” and those with below average dengue incidence as “low dengue.”
Thus, this method allowed me to divide hospital areas by socio-demographic risk factor and
dengue incidence by the city average of each, for analysis in a 2x2 odds ratio table. I conducted
these calculations for each socio-demographic risk factor, and created odds ratio tables for each,
using the same dengue data for each.
Odds ratios were computed for each of the four socio-demographic risk factors. For each
factor, the odds of an area with high levels of the risk factor (above city average) having high
levels of dengue (above city average) were computed using the equation in Table 2. I also
calculated the 95% confidence interval for each odds ratio. The confidence interval is used to
34
show the range in which the odds ratio would fall 95% of the time if the same calculation were
repeated 100 times. I used MedCalc software to calculate the confidence interval. 40, 41
For two odds ratio analyses done in this study, there were zero hospital areas that
exhibited above average rates of the risk factor and above-average rates of dengue. This means
that one of the cells in the 2x2 table had zero hospital areas, thus making the equation in Table 2
impossible to compute. To resolve this situation, I added one value to each cell, i.e. the cell of
the odds ratio table that currently had zero hospital areas in it, now has one, and the other three
other cells have an additional value added to them. Thus, the correct proportions were
maintained within the table, and the calculations were now feasible. I made this adjustment for
the odds ratios of dengue data and the immigration risk factor data (proportion of the population
born in bordering countries to Argentina), and of dengue and population density data. This was
done for the odds ratios on immigration and population density. In these 2x2 tables, the values
for high factor and high dengue are simply denoted with a 1, and no hospital areas are listed in
parenthesis.
35
5.4
CASE LEVEL TESTS
Given that the dataset used in this study is small, I used basic probability analysis to gain an
additional perspective on the relationship between socio-demographic risk factors and dengue
incidence in Buenos Aires during 2009. I used the calculation below to find the probability that a
case of dengue was located in a hospital with a high risk factor. Using the equation below, the
probability that a case was located in a hospital area with a high risk factor. The following
equation was used:
# cases of dengue in hospital areas with high risk factor
=____________________________________________________________________
Total number of cases of dengue in the city of Buenos Aires
Given that data on each case was not available, and the small sample size, this test can
provide additional understanding of the data available. This analysis is important because it
provides a closer case level analysis, compared to the population level analysis.
This method of analysis does not explain the characteristics of each patient diagnosed
with dengue. Data on each of the patients was not available for this study. Rather it assists the
understanding of how cases are distributed within the city in relation to the risk factor levels
throughout the city.
36
6.0
6.1
RESULTS
QUALITATIVE ANALYSIS: INTERVIEWS
Interviews were conducted with experts across the scope of dengue research. Dr. Aníbal Carbajo
is a researcher at the University of Buenos Aires, Marcelo Abril is a researcher with the
Organización Mundo Sano, Dr. Esperanza Janeiro is the dengue expert for the Department of
Epidemiology of Buenos Aires, and I also met with members of the medical team of Dr. Alfredo
Seijo, from the Zoonosis Department of the Buenos Aires infectious disease hospital, Hospital
Muñiz.
The interview with Dr. Carbajo was conducted via email, while the three other
interviews were held in person. In these interviews, dengue prevention and treatment, as well as
dengue data, and cases of dengue in Buenos Aires were discussed.
All interviewers gave similar responses regarding dengue in Buenos Aires. Dengue is
considered to be a “re-emerging pathology, that isn’t the flu.” 42 Interviewees supported the idea
that socio-demographic factors were associated with increased dengue incidence, yet Dr. Janeiro
argued dengue is a “democratic” disease, affecting socio-demographic groups equally.
42
They
all believed that there was not a single factor that explained all of the cases of dengue, but rather
a combination of temperature, demographic and socio-economic factors. These perspectives are
organized into the two general areas under which socio-demographic factors from census data
37
were chosen for analysis. These factors are related to urbanization, climate change, immigration,
and poverty indicators.
6.1.1
Climate
Temperature change is often used to explain a spike in dengue incidence. During an outbreak,
there are distinct causes for the spike in incidence compared to a normal year in a dengue
endemic region. According to Carbajo, while temperature cannot account for steady increases in
incidence over time, it may be a factor causing dengue outbreaks.43 With an increase in
temperature, the climate is more favorable for the mosquitos to reproduce, and thus there is a
greater possibility of transmission of the virus exists.43 However, other factors are more
predominant in affecting dengue outbreaks.
6.1.2
Urbanization
Using Buenos Aires as the focal point, interviewees argued that urbanization has contributed to
increased dengue incidence, with factors such as the availability and usage of running water,
population increases, tourism and immigration changing the environment. The population
increase recently in Buenos Aires has affected urban growth and development, with many
aspects of urban life altered.
As Carbajo explained, increases in population can lead to unplanned growth in underdeveloped parts of the city, with fewer resources and poorer living conditions.
43
According to
both Carbajo and Abril, these areas may have less access to running water in their homes, with
residents storing water in their own water storage containers.43, 44 These storage containers are
38
ideal locations for Ae. Agypti reproduction.44 An additional factor of unplanned growth is a less
effective recycling removal system; rainwater can accumulate in materials waiting for recycling,
increasing risk of mosquito reproduction and dengue transmission.44
Interviewees referenced large migrant populations from Bolivia and Paraguay to be
another contributor to the 2009 dengue outbreak. Many immigrants travel back to their home
countries during the summer months (during which Christmas and New Years fall in Argentina),
when mosquito reproduction is at a yearly high. There are high rates of dengue in these
bordering countries as well, and many immigrants return to Buenos Aires with the virus. The
climate at this time contributes to easier spread of the disease to others upon return to Buenos
Aires.45 For the most part, these immigrant communities are concentrated in distinct parts of the
city, increasing possibility of dengue transmission there.45
According to Drs. Romer, Correa and Abril, dengue cases in Buenos Aires were reported
in both rich and poorer communities.45 They said the higher dengue incidence is generally
bimodal; it is associated with poor immigrant communities and in wealthier communities with
vacations to tropical areas.44, 45
These experts suggested an association between dengue in the bordering countries to
Argentina, Bolivia and Paraguay and the rising dengue incidence in Buenos Aires and Argentina.
According to Dr. Romer, “when they [Bolivia and Paraguay] have dengue cases, we have dengue
cases.” 45
39
6.2
STATISTICAL ANALYSIS
Buenos Aires, Argentina, experienced the highest levels of dengue in the past ten years in 2009,
with 240 confirmed cases, more than twice the incidence in 2008. The majority of these cases
were diagnosed in the first weeks of the year, between epidemiological weeks 1 and 23, the
summer season. In 2009, the highest number of cases was recorded between weeks 10 and 17
(Figure 7). Data for every socio-demographic factor by commune were collected and are listed in
Appendix B.
In table 3, confirmed cases of dengue are separated by hospital area of residence, and
geographic region of these hospital areas (north, central or southern zone). Regional transmission
indicates cases of dengue where patients contracted the disease outside of the city of Buenos
Aires. Autochthonous cases are those that were transmitted locally within the city. Due to the
small sample size, all confirmed cases were used for analysis, and incidence rates, rather than
caseloads were analyzed because they give a relative measure of spread of dengue within the
city, accounting for population fluctuation.
40
Table 3: Confirmed cases of dengue by Hospital Area in 2009.
City Zone
Hospital Area
of Residence
Northern
Zone
Zubizarreta
Subtotal:
North
Central Zone
Subtotal:
Central
Southern
Zone
Subtotal:
South
Total: City
Total Number
of Confirmed
Cases
Incidence
level
(Cases per
100,000
residents)
Cases of
regional
transmission
4.0
3.5
2.0
Pirovano
Tornú
Fernandez
12.0
4.0
10.0
30.0
2.8
3.8
2.2
2.7
5.0
1.0
3.0
11.0
1.2
0.9
0.7
1.0
Velez
15.0
9.9
11.0
7.3
Alvarez
Durand
R. Mejía
18.0
24.0
19.0
76.0
8.3
6.8
5.9
7.3
15.0
10.0
4.0
40.0
6.9
2.8
1.2
3.8
Santojanni
62.0
26.7
47.0
20.2
Piñero
Penna
Argerich
43.0
43.0
9.0
134.0
13
13
5.9
15.1
21.0
21.0
5.0
86.0
6.4
6.4
3.3
9.7
240
7.9
137.0
4.5
41
Regional
Transmission
Incidence
(Cases of
regional
transmission
per 100,000
residents)
1.7
Number of Confirmed Cases
Confirmed Cases of Dengue in
Buenos Aires in 2009
150
100
Confirmed cases of local
transmission
50
0
Northern
Central
City Zone
Southern
Confirmed cases of
regional transmission
Figure 6: Confirmed Cases by Transmission Type in 2009. City of Buenos Aires. 46
Legend:
Blue: suspected cases
Red: laboratory confirmed cases
Green: confirmed cases by regional
transmission
Figure 7: Suspected and Confirmed Cases of Dengue in by Epidemiologic Week. City of Buenos
Aires 2009. 46
42
6.2.1
Geo-statistical Distribution
Spatial distribution was used to better understand the relationship between socio-demographic
factors in different areas of the city and dengue incidence. Certain areas of the city exhibit higher
dengue incidence. Using basic geo-statistical mapping through GIS software, dengue incidence
was mapped by hospital area. The map below provides a perspective to understand the basic
geographic distribution in dengue cases throughout the city. This case distribution was used as a
framework to then assess the relationship between this incidence rate, and socio-demographic
factors in each of the hospital areas.
43
Figure 8: Geographical Distribution by Hospital Area of Dengue Incidence in Buenos Aires38
44
Figure 8 demonstrates that dengue cases are concentrated within the southern portion of
the city. The areas with the darkest colors on the spectrum, in the south of the city, are Velez
Sarsfield, Santojanni, Penna and Piñero, which have all been identified as poorer, less dense
areas of the city as demonstrated below.
The maps below are a display of socio-demographic factors by hospital area. Spatial
demonstrations of data confirm the concentration of dengue cases within the southern portions of
the city. For each map below, the distribution of dengue is shown, followed by the distribution of
each socio-demographic risk factor. Using the spectrum of color as a point of reference, it is
clear that there is association between the areas in the south of the city (darkened areas) with
high levels of dengue, and high poverty indicators. Further, the hospital areas with the highest
dengue incidence have relatively lower population density, compared to the rest of the city.
These maps thus indicate that areas in the periphery of the city that are generally poorer and less
dense also have higher dengue incidence. However, as shown in Figure 12, the southern hospital
areas do not have above average levels of people born in bordering countries. These data are
important in developing a broader understanding of dengue and its spread, and the factors
affecting it in Buenos Aires.
45
Figure 9: Geographical Distribution by Hospital Area of Dengue and Population Density (Appendix
B)
46
Figure 10: Geographical Distribution by Hospital Area of Dengue and Proportion w/UBN
(Appendix B)
47
Figure 11: Geographical Distribution by Hospital Area of Dengue and Proportion w/
Adequate Sanitation (Appendix B)
48
Figure 12: Geographical Distribution by Hospital Area of Dengue and
Proportion born in Bordering Country (Appendix B)
49
6.2.2
Odds Ratio Analyses
Odds ratios were calculated for each risk factor. The results are separated based on sociodemographic factor and discuss initial distribution of the factor throughout the city using GIS
analysis, and odds ratio tests conducted.
Table 4: Odds Ratio of Population Density
Rate of dengue
Population Density
Low (hospital areas)
High (hospital areas)
Odds Ratio
95% CI
Low (hospital areas)
5 (1,3,6,8)
5 (4, 5,10,11)
0.2
0.017 – 2.39
High (hospital areas)
5 (0,2, 7, 9)
1 (null)
Table 5: Odds Ratios of Proportion of Residents Born in a Country Bordering Argentina
Rate of
Dengue
% People born in
country bordering
Argentina
Low (hospital areas)
Low (hospital areas)
7 (1,2,3,6,8,9)
3 (7,0)
High (hospital areas)
5 (4, 5,10,11)
1 (null)
Odds Ratio
0.47
95% CI
0.0369 – 5.90
50
High (hospital areas)
Table 6: Odds Ratio of People Living with Unsatisfied Basic Needs (UBN)
Rate of dengue
% People living with
unsatisfied basic
needs (UBN)
Low (hospital areas)
High (hospital areas)
Low (hospital areas)
High (hospital areas)
6 (1,2,3,6, 8, 9)
1
2 (0, 7)
3 (5,10,11)
9
0.5629 –143.90
Odds Ratio
95% CI
Table 7: Odds Ratios of Proportion of Homes Lacking Sanitary Installations
% Homes Lacking
Sanitary Installations
Rate of dengue
Low (hospital areas)
High (hospital areas)
Odds Ratio
95% CI
Below Average
(hospital areas)
5 (1,23,6,9)
1
Above Average
(hospital areas)
5 (0, 7,8)
3 (5,10,11)
3.00
0.22 – 39.61
The odds ratios computed above show that the areas with high population density have
odds 0.2 times higher to have above-average dengue incidence than areas with low population
density. Areas with high proportions of people born in a bordering country have odds 0.47 times
higher of having above-average levels of dengue than areas with low immigration levels. Areas
with high proportions of people lacking adequate sanitation have odds three times higher of
having high levels of dengue than areas with low proportions of people lacking adequate
sanitation. Areas with high proportions of people living with UBN have odds nine times higher
than areas with low proportions of people living with UBN.
Using the above odds ratio calculations, a summative odds ratio table was constructed
(Table 8). This table identifies the risk factors of high dengue, and shows the odds of these high
51
risk factors with high levels of dengue. To find these, the odds ratio tables were reversed for the
original odds ratios of population density and proportion of people born in a bordering country,
because here, the data suggest that there is higher risk of dengue with low presence of these risk
factors. The calculations done for these new odds ratios are present in Appendix B. However, for
the poverty indicators of sanitation and UBN, high levels of dengue are present in areas with the
higher risk factors, as is shown in the tables above.
As shown in Table 8, the odds of having dengue are five times higher in hospital areas
with low population density, 2.14 times higher in hospital areas with low immigrant populations,
five times higher in areas with hospital areas with people lacking adequate sanitation, and five
times higher in hospital areas with high proportions of people living with UBN. We then
compared the odds ratios with the spatial distribution of cases and dengue, to determine that an
environment with high poverty, low migrant populations and low population density in the south
of the city is the environment that had the greatest odds for high dengue incidence.
Table 8: Risk Factors for Dengue in Buenos Aires
Risk Factor
Low population density
Low population proportion of immigrants
High proportion of people lacking adequate sanitation
High proportion of people living with UBN
Odds Ratio
5
2.1429
5
9
95% CI
0.42 – 59.66
0.17 – 27.11
0.22 – 313.86
0.35 – 548.99
The confidence intervals for all risk factor analyses are large, due to the small sample
size, and prevent these findings from being statistically significant. However, the odds ratios
calculated are extreme values using this scale; they all have a large difference from 1.00.
According to effect size, the greater distance the odds ratio is from one suggests greater
52
significance in the data. The large effect size for all odds ratios suggests that further studies need
to be done, but that these factors are related to dengue incidence. 47
When conducting the distribution of the risk factors across dengue cases, calculations
revealed similar findings. Cases of dengue were:
•
•
•
•
76% more likely to be in areas of low population density;
89.4% more likely to come from areas with low proportions of people born in
bordering countries;
71.5% more likely to come from areas with high proportions of homes lacking
adequate sanitation; and
67% more likely to come from areas with high proportions of residents with
UBN.
Furthermore, the areas of the city with low population density, low immigration rates,
and high poverty indicators are generally in the south of the city. Piñero, Penna and Santojanni
all exhibit the highest dengue incidence in the city, and low population density. This aggregate
level data suggests an association between dengue and these risk factors.
Dengue experts stated that the majority of cases were from immigrants, yet the hospital
areas with the highest proportions of immigrants, Argerich and Mejía, did not report high dengue
incidence. While lack of dengue reporting is an obvious factor to be considered, these hospital
areas are also above the city-average of population density, suggesting that the higher population
density in these areas has limited the spread of dengue.
Overall, we see that population density and geographic spread, combined with poverty
indicators, appears to be related to dengue trends throughout Buenos Aires. We see that three
hospital areas in the south of the city demonstrate low population density, high poverty
indicators and low immigrant populations. These hospital areas are Santojanni, Penna and
Piñero, located in the south of the city. Though there is a large confidence interval, these findings
53
suggest that dengue is more prevalent in the sub-urban areas in the southern parts of the city,
outside of the ultra-dense city core.
54
7.0
DISCUSSION
This study is being conducted at a critical time, as infectious disease continues to spread
worldwide, and our general understanding of how prevention methods are affected by urban
environments and vice versa. Our world is only becoming more connected with time, making the
health of one individual increasingly dependent on the health of the population. Increased travel,
communication, and highly developed treatment resistant strains of bacteria and viruses only
make health a more prevalent theme in the globalized world. Urban planners and public health
workers need to approach designing and reinforcing urban environments with consideration to
the spread of disease.
The clinicians and researchers at Hospital Muñiz emphasized that dengue crosses
national boundaries, and has moved from Bolivia and Paraguay, and the north of Argentina to
the temperate urban area of Buenos Aires. One physician noted “when Bolivia has dengue, we
have dengue.”45 However, my data analysis failed to show any correlation between areas
associated with high immigrant populations in Buenos Aires and areas with high dengue
incidence. Given that this analysis was conducted at the population level, these findings suggest
a need to understand the characteristics of those who were diagnosed with dengue in each area,
and whether these characteristics match the broader population based socio-demographic data
analyzed in this study.
55
In interviews conducted with dengue experts, dengue was described as a “democratic
disease,” equally affecting those from all socio-demographic backgrounds.42 However, the data
analyzed in this study suggest otherwise in Buenos Aires; there appear to be distinct factors that
influence the probability of contracting dengue.
It is clear that urban planning may have a significant role in the role of dengue in Buenos
Aires. Relationships between socio-demographic factors and dengue incidence in 2009 by
hospital area are related based on the geography of the city. There are clear divides by socioeconomic standards within the city that are clear when analyzing the population level.
This data suggests a possible relationship between the areas exhibiting high poverty and
areas with increased dengue incidence, implying that urban growth and developmental factors
may have played a part in determining the spread of dengue during the 2009 outbreak. Further,
with increased migration into the city, the unplanned, underdeveloped areas on the periphery of
the city became home to people living in a lower economic quality of life that I argue puts them
at risk for contracting dengue.
I argue the southern periphery has larger proportions of residents in higher states of
poverty, and the highest number of residences lacking sanitary installments, where the highest
number of dengue cases is also recorded. Many of the areas located on the periphery of the city
are lower-income communities, at points labeled as ‘slum cities.’ 48 There have been 56 reported
informal settlements within the city that lack sanitation systems, basic access to services, and
governmental action to reduce the poverty.48 Approximately 10% of the population in Buenos
Aires is reported to live in these areas, with more moving there after the economic crash in
2002.48 The government has committed resources to improving these areas, with little action
actually taken. These areas on the periphery of the city are located close to higher socio-
56
economic areas that emphasize the inequality within this city.48 These disparities have been
especially apparent within the last 20 years, with water privatization and neoliberal policies
implemented, and a failure of city government to act to reduce disparities.
48
It is critical for
poverty to be addressed in these areas in order for effective dengue prevention.
Studies done internationally on dengue and socio-economic factors have shown that areas
with higher poverty indicators may be more at risk for dengue than in higher-income areas.
49
One example is in Recife, Brazil. Here, dengue infection rates were 3 times higher in deprived
areas of the city than in privileged areas.
49
Living in a house rather than an apartment, higher
number of persons living in a room, and higher age were all positively associated with increased
risk for infection.
49
This investigation on Buenos Aires reinforces the work that Braga et al.
conducted in Recife. In the less dense areas of Buenos Aires, that are identified as areas with
higher dengue incidence levels, there are more houses than high rise apartment buildings, and
given the high poverty levels, there may also be more people living in a smaller number of
rooms. 49
Data analyzed for this study reinforce the claim that the residences lacking sanitation and
areas with extreme poverty lead to habits putting them at risk for Aedes aegypti reproduction and
easier circulation of the mosquito and thus faster transmission. According to interviews, the lack
of density in this area as well could be due to the lack of organized building and planning in this
area, and higher poverty rates compared to other parts of the city.
Dengue is not compatible in extremely urban environments. This mosquito prefers an
urban domestic environment that may not be immediately available in the high-rise apartment
buildings that are much more prevalent at the core of Buenos Aires, where the use of open water
containers are also more infrequent.50 Areas in the southern periphery are different; residents
57
may have more water containers due to lack of sanitary installments, and lower population
density due to less urban planning and poorer populations. Both of these factors create a better
environment for the disease in the periphery.
Looking at hospital areas Argerich and Mejía suggests that population density plays a
potential role in determining dengue incidence; with a lower density, there may be more
unplanned developments that provide water containers for the Aedes aegypti to lay their eggs. 48
Both areas report high poverty indicators but dengue incidence well below the city average.
These hospital areas, especially Mejía, are located very close to the city core, with a much more
urban environment and fewer opportunities for mosquito reproduction. Meanwhile, the hospital
areas located in the south of the city, Penna, Piñero and Santojanni also have high poverty
indicators, but high dengue incidence, along with below-average population density
Together, a larger picture is generated that outlines the geographic disparities, both socioeconomic and dengue based, that identify larger trends in the data. Data suggest that as part of
prevention and treatment of dengue, methods of addressing poverty and geographical inequalities
need to be incorporated. Rather than approaching dengue as a disease in need of prevention,
comprehensive urban development practices that improve the quality of life in poor areas with a
higher propensity of dengue will provide a more sustainable model for dengue prevention in the
long-term. I argue that in order for dengue to effectively be prevented and reduced in the future,
sustainable poverty reduction tactics need to be enacted that addresses the poor living conditions
in the southern periphery of the city. The current prevention tactics are not sufficient for longterm infectious disease reduction, especially when such diseases appear to be associated with
poverty.
58
7.1
TREATMENT AND PREVENTION
The findings demonstrated in this study suggest a need for increased sanitary installments and
poverty reduction in the south of the city. This study and others suggest that there is lower risk
for dengue spread in areas with improved living conditions. Within Buenos Aires, measures
taken to reduce the need for open water storage containers, develop permanent housing in slum
areas and assist residents to no longer be in poverty are critical to address for long-term dengue
prevention.
However, current prevention and treatment tactics used in Argentina, to my knowledge,
do not include more holistic measures such as those mentioned above. Dengue is primarily
treated rather than actively prevented. The prevention treatments currently are designed to
address the immediate factors that increase spread of dengue, such as open water containers (i.e.
removing flower pots, water storage containers, etc.). They are not designed to address the
underlying issues of why much of the population may be using water storage containers
originally. In this section, I analyze the limited information available on treatment and
prevention methods in place in Buenos Aires, through which to suggest larger policy changes
more comprehensive in addressing issues.
In Buenos Aires, according to Romer, there is not an “existing culture of dengue.”45
Thus, the efficacy of dengue prevention is dependent on the perspective of the population about
the disease. However, when there is increased concern about dengue in the population, greater
prevention measures are taken, with increased vigilance in the population and by physicians.
During these periods, more people generally report suspected cases of dengue. Yet, when there
are fewer cases in a year, there is generally less awareness of prevention methods and lower
suspected case reporting.
59
Abril emphasized that dengue prevention is lacking due to poor understanding of the
disease by medical practitioners and civilians.44 Dengue is not commonly the first diagnosis
considered by doctors when patients present fever and flu symptoms. Dengue symptoms are
very similar to other sicknesses, including the common flu; many patients are misdiagnosed.
Further, with mild symptoms similar to other diseases, many people do not go to the hospital
with dengue symptoms, because they do not perceive them to be serious. The lack of adequate
education in Buenos Aires, especially during years with low dengue incidence, leads to
additional dengue transmission and failure to correctly implement treatment and prevention
strategies 44
Numerous protocols exist to prevent and treat dengue. According to Dr. Janeiro, the
current Dengue Prevention and Control Plan for Buenos Aires aims to provide methods of
control that integrate the public health laboratory, the environment, the patient, the vector, other
epidemiologic indicators, and communication between public health officials and the population.
Through this multifaceted approach, this plan aims at controlling dengue by focusing primarily
on eliminating places where mosquitos reproduce.
This method is focused primarily on treatment and fumigation. The nationally approved
protocol calls for fumigation of the area surrounding the home of a suspected or confirmed
patient of dengue, eliminating mosquito transmission and reproduction.44 Neighboring persons
living close to the index patient are also monitored for symptoms.
44
While the prevention
strategy can be effective, with a lack of knowledge about dengue, many people have the disease
and are not diagnosed. As a result, there are many areas that do not receive fumigation, allowing
additional transmission. Further, the weakness in this prevention strategy is the lack of mosquito
elimination prior to an outbreak of dengue. These programs focus more on treatment of dengue
60
rather than its prevention. According to Drs. Correa and Romer, this is a major problem needing
to be addressed.
Behavioral prevention methods include advertising within public transportation systems,
especially trains moving from the suburban municipalities into the city. However, field
observations found few signs and warnings regarding dengue within the city of Buenos Aires.
Observations and research of marketing tactics for dengue in Buenos Aires indicate that dengue
prevention in the city appears to be more responsive when an increased number of cases are
reported.
Ultimately, this research failed to identify existing comprehensive tactics that aimed at
sustainably eliminating water storage containers or poverty conditions that may create better
environments for mosquito reproduction and dengue transmission. I argue that long-term
sustainable improvements in the southern periphery of the city are necessary to effectively
reduce dengue transmission within Buenos Aires. If attention to dengue is only paid during times
of outbreak, the disease will not be able to be well controlled in the future.
I propose that dengue prevention and treatment be reconsidered at a comprehensive level
that works to understand the poverty indicators that are the underlying effectors of increased
dengue incidence. Through addressing these demographic disparities throughout the city, I argue
that dengue incidence will be able to be more effectively controlled during outbreaks, and other
diseases will be reduced in the long run.
61
7.2
STRENGHTS AND LIMITATIONS
This investigation is beneficial because it provides an alternate perspective on the dengue
situation in Buenos Aires in 2009 that can be applied to future prevention tactics. The majority of
other studies done analyzing the dengue situation in Buenos Aires have focused on case level
data. Primarily, these studies seek to understand the characteristics of patients diagnosed with
dengue fever.
This study is unique because it studies the environmental and population level to
understand broader factors that may have contributed to patients having dengue. Even if a patient
is not struggling economically, living in a low-economic area where other residents lack running
water may put them more at risk to contract dengue than a low-income resident living in a
higher-income neighborhood. Therefore, a basic analysis of the population demographics and a
comparison of this data to the distribution of dengue cases throughout this city can add to the
understanding and prevention of dengue in the future.
However, there are limitations to this study, and much remains to be understood, both
qualitatively and statistically to prevent future spread of dengue in Buenos Aires, Argentina.
These limitations arise from time constraints of fieldwork in Argentina and data availability
(both online and from public health workers in Buenos Aires). These limitations affect the
statistical significance of this study and limit the conclusions we are able to make.
Firstly, my time in Buenos Aires, Argentina was limited to a four-month period, with one
month dedicated entirely to intensive fieldwork. Due to acclimation periods, curricular
requirements, and limited connections with dengue experts in Buenos Aires prior to my arrival, I
was limited in the quantity of interviews I could conduct, and experts on dengue I could gather
62
information and data from. Additional time in Buenos Aires could have allowed for further data
collection, both qualitative and quantitative.
Data availability was another limitation in this study. As noted previously, the only
available dengue data for this study was obtained from the national and city-level Ministries of
Health. While the majority of data is provided online, I was only able to obtain the most valuable
data for this study (dengue cases by hospital area) by meeting directly with a staff member from
the City of Buenos Aires Department of Epidemiology, who coordinates all dengue reporting in
the city. The data recording methods used in this office, and availability of detailed analysis of
case-level data was limited due to what was given to me.
For this study, having data on suspected and confirmed cases of dengue by hospital area
is preferred for analysis, because suspected cases are a more realistic measure of dengue, when
accounting for a-symptomatic cases that are not part of the confirmed case count. However, the
suspected cases of dengue published by the Buenos Aires Ministry of Health in weekly bulletins
proved to be unreliable (i.e. the cumulative yearly count of dengue cases would decrease from
one week to the next). Therefore, the only available data was laboratory confirmed cases, which
was provided by the Department of Epidemiology for the City of Buenos Aires. Using a smaller
number of cases (given that they are confirmed rather than suspected) affected data trends and
created stronger outliers that shifted the data.
Another limitation in the quantitative data in this study is the possibility that there were
cases of dengue within Buenos Aires that were never confirmed or diagnosed, thus affecting the
quality of this dataset. I argue this issue may be true especially in the hospital areas Argerich
and Mejía, where dengue incidence was low, but socio-demographic indicators were equivalent
to the areas of the city with higher dengue. Future studies will benefit from a thorough study of
63
socio-demographic factors in Buenos Aires in relation to suspected cases of dengue, that provide
a more accurate picture of the situation.
Secondly, the major limitation is the sample size. Attempts were made to study hospital
areas in Buenos Aires’ surrounding municipalities in addition to those within the federal capital,
in order to increase the sample size and significance of the data. However, data proved to be
inconsistent in these areas with city data, in terms of reliable data collection throughout 2009.
Further study of these surrounding areas will be important in the future, given the high dengue
incidence in these areas as well, and the complex socio-demographic based inequalities present
here as well.
Thirdly, the lack of controls throughout this study also limited this analysis. Here, it is
important to address the issue of the “ecological fallacy” in my study, meaning ascribing
attributes to individuals from population-based datasets. Based on the available data used in this
study, I cannot make direct assumptions that the cases of dengue in each area were from patients
who lived in high poverty or lower density areas, or were (were not) born in countries bordering
Argentina. My dataset is limited to population level data, and I do not have information on the
individual case-level. Therefore, a limitation of this study may be differing environmental and
socio-economic conditions of the patients who contracted dengue in Buenos Aires, than the
socio-economic data for their hospital area of residence.
To account for this issue, a control population sample living in each of these areas
without contracting dengue would have been beneficial in both odds ratio analysis and general
understanding of the situation in each of these areas. Secondly, there is not data detailing the
spread of each socio-demographic factor on a smaller scale than the hospital area. Data based on
the spread of the factors throughout the hospital areas would allow for socio-economic
64
disparities within hospital areas, and further the understanding of areas of the city that affected
the data.
Small sample size, lack of controls, and limited data availability provide numerous future
studies to be conducted to analyze the dengue situation in Buenos Aires Argentina. From this
study, I cannot make any risk inferences based on these findings, bur rather only suggest that
trends may be present within the data between socio-demographic factors and dengue on the
population level within the federal capital.
65
8.0
CONCLUSIONS
The aim of this study is to provide a comprehensive picture of the interrelated role between
dengue and socio-demographic factors in the City of Buenos Aires. These findings suggest that
immigration and climate are not the main factors contributing to increased dengue incidence
during the outbreak of 2009; rather, areas with high poverty indicators and low population
density within the city demonstrate higher propensity for dengue. Immigration was thought to be
the main factor contributing to higher incidence in some hospital areas within the city. However,
my findings suggest that socio-demographic factors are more strongly associated with areas with
increased dengue than with immigration rates. This result is critical in understanding the spread
of dengue within large urban areas, and the failure to consider the larger, holistic picture over
singular cases of dengue.
Trends within the data between dengue incidence and socio-demographic data suggest
that the outbreak in 2009 was not the result of one socio-demographic risk factor but rather
numerous factors that create an environment for the Ae. aegpyti, to reproduce and for the disease
to be transmitted. These factors (population density, place of birth, sanitary installments in
homes, and unsatisfied basic needs) suggest that there are poorer neighborhoods in the southern
regions of the city, with increased temporary and public housing lacking adequate sanitation, and
higher proportions of residents lacking basic needs. Combined with a lower population density,
these areas demonstrate higher dengue incidence than the central core. Ultimately, it can be
66
stated that these socio-demographic factors, even with disparities in the data, suggest that
poverty indicators and population density are critical in considering dengue incidence throughout
Buenos Aires.
The outbreak of 2009 in Buenos Aires was significant because it introduced a largely
tropical disease to a temperate area. Buenos Aires still appears to be severely lacking in the
educational methods to treat and prevent dengue, and did not do enough to effectively target the
most at-risk populations. Qualitative aspects of this study identify a lack of education and
awareness of dengue throughout the city, by all people. Without adequate awareness of the
disease, its symptoms and how its spread, by both the general population as well as medical
experts and government officials, Buenos Aires appears to have increased propensity to develop
an increased caseload of dengue in the future, if issues of inequality and prevention are not
approached.
On a policy level, I argue that the prevention and treatment tactics for dengue must take
place on a multi-level, multi-sided front, with poverty assistance and sanitation access more
readily available to those living in underdeveloped areas with high levels of poverty. There
should be more education regarding dengue and prevention methods in these areas as well,
ensuring that people are aware of dengue and both reporting when cases are suspected and taking
necessary precautionary measures. While these are obviously large-scale measures, steps towards
addressing them are critical for the future of this city, and as a model for other temperate
climates that are developing greater risk for dengue.
67
9.0
FUTURE DIRECTIONS
Much remains to be analyzed internationally about the role of socio-demographic factors in the
spread and prevention of dengue. This study was limited by the small sample size and data sets
of only confirmed cases in Buenos Aires, Argentina. For this existing hypothesis of correlation
between poverty indicators and higher dengue incidence, the next steps of this study are to
expand a similarly modeled analysis to other cities in this region, and within Argentina, to the
surrounding municipalities of Buenos Aires. I want to further test my hypothesis to better
analyze the relationship between poverty indicators and dengue incidence.
Additional data collection and analysis within major cities in Bolivia and Paraguay, as
well as the southeastern regions of Brazil will be collected and analyzed in relation to census
data from these regions, and compared with similar factors. Further, additional study will focus
on the other cities within Argentina, especially in the northern region that have experienced
much higher cases of dengue. This will provide an additional perspective of a tropical disease
that has experienced increased incidence in past years. Together, the aim of these future
directions is to garner a greater understanding of the role of socio-demographics in dengue, and
utilize this understanding to shape further prevention and policy decisions.
68
APPENDIX A
A.1
INTERVIEW QUESTIONS
A.1.1 Interview Questions for Dr. Aníbal Carbajo
1. In your article published in 2012, you stated that climate was not the principal
predictor of dengue distribution in Argentina. In your opinion, why do many
dengue experts focus exclusively on climatic factors to explain dengue
spread? What is the relationship between the three predictors that you used in
your model?
2. You stated that temperature and demographic factors have importance in the
geographic distribution of dengue in Buenos Aires. Can you provide an
example of this relationship?
3. Can you expand upon the demographic factors you believe impact dengue in
Buenos Aires, and what the impact is?
4. It is clear that in Argentina, the dengue spread is different depending on the
geographic area. Why does the geography and factors relating to geography
play such an impactful role here?
A.1.2 Interview Questions for Marcelo Abril
1.
Your work from 2012 states that water storage containers are one of the
containers that increase the reproduction of Aedes Aegypti, and as a result, can
strengthen the transmission of dengue. Do you believe that there are also
socio-economic factors that affect the transmission in other areas of Argentina
such as Missiones? What factors do you believe play a role?
69
2. You stated that temperature and demographic factors have importance in the
geographic distribution of dengue in Buenos Aires. Can you provide an
example of this relationship?
3. Can you expand upon the demographic factors you believe impact dengue in
Buenos Aires, and what the impact is?
4. It is clear that in Argentina, the dengue spread is different depending on the
geographic area. Why does the geography and factors relating to geography
play such an impactful role here?
5. In your opinion, what are the similarities and differences in the situation in
Missiones and the Metropolitan Area of Buenos Aires?
6. Do you think that there is a relationship between the incidence of dengue in
Buenos Aires and in Missiones?
7. What do you believe the reasons are for the increase in dengue in Buenos
Aires?
8. In your opinion, what are the best methods for dengue prevention and
reduction in areas of Argentina that have only recently experienced dengue?
9. Do you believe the prevention campaigns in Missiones and the rest of
Argentina are effective? If not, what would make them more effective?
10. In the future, with temperature and climate changes, how do you think dengue
incidence within Argentina will be affected?
11. Can you expand upon the methodology of studies on the quantity of
mosquitos in an area and the cases of dengue?
12. What do you believe to be the prevalence of asymptomatic transmission
Argentina? How can this be reduced?
70
13. I’m interested in the ages of people that have dengue. Are those infected with
dengue in Argentina particularly adults or children?
14. What do you recommend to be the best resources for accessing data on
dengue based on hospital area or commune?
A.1.3 Interview Questions for Dr. Esperanza Janeiro
1. What data does the Department of Epidemiology collect regarding cases of
dengue? Is it possible to access data on the following factors:
a. Dengue data based on the neighborhoods within the city of Buenos
Aires
b. Confirmed and suspected dengue cases by year?
c. Dengue data by locality in the city?
d. Dengue data divided by imported and indigenous cases of dengue
e. Do you know the proportion of patients that are immigrants?
f. Dengue data based on sex, age, level
g. Dengue data by week for 2009
2. Can you explain the Dengue Prevention Plan and Intensive Monitoring?
3. How are these plans affected by factors that differ throughout the city, such as
population density?
4. How do the prevention plans in place for Buenos Aires differ from those for
other cities and countries?
71
A.1.4 Interview Questions for Dr. Seijo
1. In your paper published by the CDC, you stated that dengue risk is higher
during the end of summer in the periphery of the city. Why are these areas
more at risk than other areas of the city?
2. Are there specific populations that live here that you believe affect
transmission of dengue?
3. In your experience, are there specific characteristics or differences in the
autochthonous and imported cases?
4. Additionally, did you observe a higher percentage of people living with
unsatisfied basic needs or lack of sanitation? Do you believe there is a
correlation between these factors and dengue incidence?
5. Do you believe that changes in temperature and other factors affect dengue
incidence in Buenos Aires?
6. Proportionally, how many cases of dengue are diagnosed? How can you
improve this ratio in the future?
7. Do you believe that the Dengue Prevention Plan put in place in Buenos Aires
is effective? What are the limitations of this program?
72
APPENDIX B
B.1
SUPPLEMENTARY DATA: ODDS RATIOS RE-ORGANIZED FOR RISK
FACTOR ANALYSIS
Table 9: Odds Ratio of Population Density for Risk Factor Analysis
Rate of dengue
Population Density
High (hospital Areas)
Low (Hospital areas)
Odds Ratio
95% CI
Low (hospital areas)
5 (4, 5,10,11)
5 (1,3,6,8)
5
0.42 – 59.66
High (hospital areas)
1 (null)
5 (0,2, 7, 9)
Table 10: Odds Ratios of Proportion of Residents Born in a Country Bordering Argentina for Risk Factor
Analysis
Rate of
Dengue
% People born in
country bordering
Argentina
High (hospital areas)
Low (hospital areas)
High (hospital areas)
5 (4, 5,10,11)
1 (null)
Low (hospital areas)
7 (1,2,3,6,8,9)
3 (7,0)
Odds Ratio
2.14
95% CI
0.17 – 27.10
Table 11: Odds Ratios of Proportion of Homes Lacking Sanitary Installations for Risk Factor Analysis
Rate of dengue
Odds Ratio
95% CI
% Homes Lacking
Sanitary Installations
Low (hospital areas)
High (hospital areas)
Below Average (hospital
areas)
5 (1,23,6,9)
1
3.00
0.22 – 0.61
73
Above Average
(hospital areas)
5 (0, 7,8)
3 (5,10,11)
Table 12: Odds Ratio of People Living with Unsatisfied Basic Needs (UBN) for Risk Factor Analysis
Rate of dengue
Odds Ratio
95% CI
% People living with unsatisfied
basic needs (UBN)
Low (hospital areas)
High (hospital areas)
9
0.5629 <x<143.8949
74
Low (hospital areas)
6 (1,2,3,6, 8, 9)
1
High (hospital
areas)
2 (0, 7)
3 (5,10,11)
B.1.1 Census Data
Table 13: Residences with Sanitary Installations by Commune for the City of Buenos Aires census 46
Commune
1
2
3
4
5
6
7
8
9
10
11
12
13
14
15
Total
Total number of homes
84,468
73,156
80,489
76,455
76,846
75,189
81,483
58,204
56,495
61,453
71,460
78,547
100,506
102,918
72,465
1,150,134 [100.000]
Sanitary Installation
With flushing toilets
Without flushing toilets
[percentage of total]
[percentage of total]
78,339 [92.74]
72,695 [99.37]
79,169 [98.36]
71,433 [93.43]
76,066 [98.99]
74,862 [99.57]
78,124 [95.878]
52,003 [89.346]
55,409 [98.078]
60,934 [99.155]
71,004 [99.362]
78,160 [99.507]
100,102 [99.598]
102,449 [99.544]
71,479 [98.639]
1,122,228 [97.574]
75
6,129 [7.256]
461 [0.630]
1,320 [1.640]
5,022 [6.569]
780 [1.015]
327 [0.435]
3,359 [4.122]
6,201[10.653]
1,086 [1.922]
519 [0.845]
456 [0.638]
387 [0.492]
404 [0.402]
469 [0.456]
986 [1.361]
27,906 [2.426]
Table 14: Population Distribution by Place of Birth per Commune (%), City of Buenos Aires, 2010. 46
Commune
City
of
Buenos Aires
(%)
Other provinces in
Argentina (%)
From
Bordering
Country
to
Argentina (%)
10.8
Non-bordering
country to Argentina
(%)
1
45.3
Province
Buenos Aires
(%)
13.8
2
56.6
16.7
19.2
2.1
5.2
3
49.0
16.2
19.4
4.8
10.5
4
58.2
10.8
14.0
12.0
5.0
5
58.5
15.4
15.8
3.4
6.8
6
69.1
13.5
12.2
3.4
1.8
7
65.9
8.9
9.8
10.7
4.6
8
65.7
6.8
10.6
14.7
2.2
9
10
71.0
69.4
8.1
10.6
9.9
7.6
6.9
4.8
3.9
7.5
11
72.3
10.3
10.0
2.1
5.4
12
65.6
17.5
11.4
2.6
2.8
13
68.4
13.1
10.9
2.5
5.1
14
58.0
17.7
17.3
2.2
4.7
15
62.2
13.0
15.3
4.2
5.3
Total
62.1
13.0
13.8
5.8
5.2
22.6
76
7.5
Table 15: Total Population by Sex, Surface Area and Population Density by Commune.
City of Buenos Aires 201046
Commune
Population
Surface area (km2)
Population Density (res./km2)
Total
Men
1
205886
107789
98097
17.37
11849.66
2
157932
89890
68042
6.29
25100.49
3
187537
101936
85601
6.39
29365.20
4
218245
115079
103166
21.70
10059.29
5
179005
98199
80806
6.66
26876.94
6
176076
97206
78870
6.85
25700.65
7
220591
118110
102481
12.43
17753.38
8
187237
97692
89545
22.29
8398.26
9
161797
85590
76207
16.50
9803.36
10
166022
89050
76972
12.64
13134.93
11
189832
101363
88469
14.09
13471.86
12
200116
107589
92527
15.56
12859.92
13
231331
127499
103832
14.58
15869.11
14
225970
125389
100581
15.78
14324.16
15
182574
98089
84485
14.32
12747.40
2890151
1560470
1329681
203.5
14205.58
Total
Women
77
Table 16: % Population Lacking Basic Needs by Commune. City of Buenos Aires 2010. 46
78
B.1.2 Hospital Area/Commune Intersection Calculation
Table 17: Conversion from Commune Area to Hospital Area38
Hospital
Label
0
1
2
3
4
5
6
7
8
9
10
11
Commune
1
9
13
6
7
10
1
2
3
10
2
3
5
6
10
4
5
6
4
5
11
6
7
8
10
12
13
0
8
13
14
7
8
10
14
1
3
11
12
13
2
3
4
Commune Area
Intersection Area
6660526
6385991
17802807
14120042
15570927
14322897
6660526
6851029
12422901
14322897
6851029
12422901
12656557
14120042
14322897
16505306
12656557
14120042
16505306
12656557
22192611
14120042
15570927
15772496
14322897
21701236
17802807
6140873
15772496
17802807
14571813
15570927
15772496
14322897
14571813
6660526
12422901
22192611
21701236
17802807
6851029
12422901
16505306
1483329
6385991
3275665
5904720
2028247
994603
4124296
3983335
923112
3376056
2027168
2131062
1370790
5249649
1474258
922590
8557378
2547725
10850008
1037452
11181619
417949
1269473
98887
7942272
8126099
9463654
6140873
14664106
4501855
384514
12273206
1009504
535708
14187299
1052901
718259
760517
13436433
542534
840527
8650468
4732708
79
Multiplier
(Intersection Area/Commune Area)
0.133
0.573
0.294
0.661
0.227
0.111
0.332
0.321
0.0744
0.272
0.165
0.174
0.113
0.428
0.120
0.0767
0.711
0.212
0.470
0.0450
0.485
0.0430
0.130
0.0102
0.816
0.462
0.538
0.239
0.571
0.175
0.0150
0.438
0.0360
0.0191
0.501
0.0638
0.0435
0.0461
0.814
0.0329
0.0321
0.330
0.180
5
11
12
12656557
22192611
21701236
1690937
10250475
58905
80
0.064480465
0.390881146
0.002246223
BIBLIOGRAPHY
1.
WHO. Dengue and severe dengue Media Center: WHO; 2013 [cited 2013]. Available
from: http://www.who.int/mediacentre/factsheets/fs117/en/.
2.
Zambrini DAB. Neglected lessons from the 2009 dengue epidemic in Argentina. Rev
Saúde Pública. 2011;45(2).
3.
CDC. Dengue: Epidemiology: CDC; 2010 [28/5/2014]. Available from:
http://www.cdc.gov/dengue/epidemiology/.
4.
Evaluación de la Estrategía de Gestión Integrada para la prevención y control del dengue
en Argentina [press release]. PAHO, 11/08/2013 2013.
5.
Costa F, Fattore, G., Abril, M. Diversity of containers and buildings infested with Aedes
aegypti in Puerto Iguazú, Argentina. Cad Saúde Pública. 2012;28(9):1802-6.
6.
Statistics WP. Buenos Aires Population worldpopulation.com2013 [cited 2014].
Available from: http://www.worldpopulationstatistics.com/buenos-aires-population-2013/.
7.
Prevention CfCaD. Dengue and Climate 2010 [2/6/2015]. Available from:
http://www.cdc.gov/dengue/entomologyEcology/climate.html.
8.
Tapia-Conyer R, Méndez-Galván JF, Gallardo-Rincón H. The growing burden of Dengue
in Latin America. Journal of Clinical Virology. 2009;47(2).
9.
PAHO.
Argentina
2012
[12/7/2103].
Available
from:
http://www.paho.org/saludenlasamericas/index.php?id=18&option=com_content&Itemid=&lang
=en.
10.
San Martin JL, Brathwaite O, Zambrano B, Solorzano JO, Bouckenooghe A, Dayan GH,
et al. The epidemiology of dengue in the americas over the last three decades: a worrisome
reality. The American journal of tropical medicine and hygiene. 2010;82(1):128-35.
11.
Olivia Brathwaite Dick JLSM, Romeo H. Montoya, Jorge del Diego, Betzana Zambrano,
and Gustavo H. Dayan. Review: The History of Dengue Outbreaks in the Americas. American
Journal of Tropical Medicine. 2012;87(4):584-93.
12.
PAHO-WHO. Vigilancia de Dengue en Argentina. In: PAHO-WHO Ádv, Dirección de
Epidemiología, Ministerio de Salud de la Nación, Argentina, editor. 2013.
13.
Argentina MdSd. Actualización de la situación de vigilancia de dengue
en la República Argentina al 21-05-2013 2013.
14.
Brittanica TEoE. Buenos Aires, Argentina. Encyclopedia Brittanica.
15.
Carbajo A, Cardo, M, Vezzani, D. Is temperature the main cause of dengue rise in
non-endemic countries? The case of Argentina. International Journal of Health Geographics.
2012;11(26).
16.
Lourenco-de-Oliveira R, Rua, A, Vezzani, D, Willat, G, Vazeille, M, Mousson, L,
Failloux, A. Aedes aegypti from temperate regions of South
81
America are highly competent to transmit
dengue virus. BMC Infectious Disease. 2013;13(610).
17.
Nouzellies G MG. The Argentina Reader: History, Culture, Politics Duke University
Press; 2009 12/7/2013.
18.
Seara JP MM. Civil Registration in the Republic of Argentina. In: Statistics IIfVRa,
editor. Besthesda, MD1979.
19.
Ministry of Health A. Indícadores Básicas de Argentina 2012 In: Nación MdSPdl, editor.
http://www.deis.gov.ar: Organización Panamerica de la Salud, Ministerio de Salud de Argentina;
2012.
20.
Mirassou C. Health system and aboriginal communities in the province of Formosa,
Argentina. Medicina (Buenos Aires). 2013;73:453-6.
21.
Franko P. The Puzzle of Latin American Economic Development. Plymouth, UK:
Rowman & Littlefield Publishers, INC; 2007.
22.
Belló M B-M, V. . Sistema de salud de argentina. Salúd publico de México. 2011;53(2).
23.
World Databank: Health and Nutrition Statistics [Internet]. World bank. 2012 [cited
120/09/2013]. Available from: http://databank.worldbank.org/data/views/reports/tableview.aspx.
24.
Total del país . Población por sexo, tasa de variación intercensal, según provincia. Años
2001
2010
[Internet].
2010.
Available
from:
http://www.censo2010.indec.gov.ar/preliminares/cuadro_totalpais.asp.
25.
Langer ED. Buenos Aires. In: Krinsbruner, editor. Kinsbruner, Jay, . 2nd ed. Detroit, MI:
Scribner's Sons; 2008. p. 800.
26.
Jorge Morello SDM, Andrea Rodríguez. SustainableDevelopmentand Urban Growth in
the Argentine Pampas Region. ANNALS of the American Academy of Political and Social
Science. 2003;590(1):116-30.
27.
Seijo A, Romer Y, Espinosa M, Monroig J, Giamperetti S, Ameri D, et al. [Outbreak of
indigenous dengue in the Buenos Aires Metropolitan Area. Experience of the F. J. Muniz
Hospital]. Medicina. 2009;69(6):593-600.
28.
ESRI, cartographer National Geographic World Map http://www.arcgis.com2015.
29.
Leston E. Urban Mutations in the Buenos Aires metropolitan Area. Holcim Forum for
sustainable construction
30.
Lahrichi K. Poverty keeps growing in Buenos Aires as Country Wakes Up in Default.
International Finance Magazine. 2014.
31.
Pírez P. Buenos Aires: fragmentation and privatization of the metropolitan city.
Environment and Urbanization. 2002;14(1):145-58.
32.
Franko P. The Puzzle of Latin American Economic Devleopment. Plymouth, UK:
Rowman & Littlefield Publishers, INC; 2007.
33.
Maurizio R. Labour informality in Latin America: the case of Argentina, Chile, Brazil,
and Peru. Brooks World Poverty Institute. 2012.
34.
Arrossi S. Inequality and health in the metropolitan area of Buenos Aires. Environment
and Urbanization. 1996;8(2).
35.
Prevention
CfDCa.
Dengue
virus
infections
2015.
Available
from:
http://wwwn.cdc.gov/nndss/script/casedef.aspx?CondYrID=655&DatePub=2010-01-01.
36.
Epidemiology Do. Dengue: City of Buenos Aires Report Week 15. In: Epidemiology,
editor.: Ministry of Health, City of Buenos Aires 2014.
37.
INDEC. Mapa de Necesidades Básicas Insatisfechas 2001 indec.gov.ar2001
[02.16.2015]. Available from: http://www.indec.gov.ar/nuevaweb/cuadros/74/Aqui7.pdf.
82
38.
Aires CoB. Buenos Aires Data. 2014.
39.
McHugh ML. Lessons in biostatistics: The odds ratio calculation, usage and
interpretation. Biochemia Medica. 2009;19(2).
40.
MedCalc. Odds Ratio. 2015.
41.
Minnesota Uo. Confidence Intervals of Odds Ratios and Relative Risk 2010.
42.
Janeiro DE. El Rol de Dengue en Buenos Aires, Argentina. In: Frisch M, editor. SIT:
Public Health in Urban Environments2014.
43.
Carbajo DA. El Rol de Dengue en CABA. In: Frisch M, editor. SIT: Public Health in
Urban Environments 2014.
44.
Abril LM. El Rol de Dengue en Buenos Aires. In: Frisch M, editor. SIT: Public Health in
Urban Environments 2014.
45.
Yamila Romer JC. Experiecias con dengue en el Hospital Muñiz. In: Frisch M, editor.
2014.
46.
Epidemiology Do. Epidemiologic Bulletin for the City of Buenos Aires. In:
Epidemiology Do, editor. Ministry of Health, City of Buenos Aires 2009.
47.
Gail M. Sullivan RF. Using Effect Size—or Why the P Value Is Not Enough. Journal of
Graduate Medical Education. 2012;4(3):272-82.
48.
The Unplugged: Efforts to integrate shantytowns are hampered by a lack of trust and
money. The Economist. 2014.
49.
Cynthia Braga CF, Luna, Celina Maria Turchi Martelli, Wayner Vieira de Souza, Marli
Tenório Cordeiro, Neal Alexander, Maria de Fátima Pessoa Militão de Albuquerque, José
Constantino Silveira Júnior, and Ernesto T. Marquesa. Seroprevalence and risk factors for
dengue infection in socioeconomically distinct areas of Recife, Brazil. Acta Tropical.
2010;113(3).
50.
Sushil K. Gilotra LER, and N. C. Bhattacharya. Observations on possible competitive
displacement between populations of Aedes aegypti Linnaeus and Aedes albopictus Skuse in
Calcutta*. Bulletin World Health Organization. 1967;37(3):437-46.
83
84


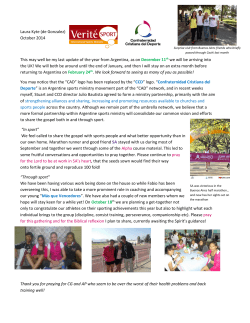
![[sample] •](http://cdn1.abcdocz.com/store/data/000276252_1-14409bc2560e9ff610fe6fe9347b4d62-250x500.png)


© Copyright 2026