
Optimum Incubation Temperature for the Plate Count of Milk and Water
Optimum Incubation Temperature for the Plate
Count of Milk and Water
By
Azza Mutwakil Khalid
B.Sc. (Agric.) Honours
University of Khartoum
٢٠٠٢
A thesis submitted in partial fulfillment of the requirements
of the degree of M.Sc. in Food Science and Technology
Supervisor,
Professor Hamid Ahmed Dirar
Department of Botany and Agricultural Biotechnology
Faculty of Agriculture
University of Khartoum
٢٠٠٦
DEDICATION
To my beloved great parents who always stood behind
and encouraged me to finish this work
To my sisters and brother,
To my friends and colleagues,
To my supervisor,
I dedicate this work
With all my love.
AZZA
ACKNOWLEDGEMENTS
First I thank Allah, who gave me the ability to complete this
work.
My deep thanks go to my supervisor Professor Hamid Ahmed
Dirar, for his guidance, advice and help.
I would like to thank all the Microbiology staff members of
Sudanese Standards and Meteorology Organization and the technical
staff members of the Dept. of Food Science and Technology and the
Dept. of Botany and Agricultural Biotechnology, Faculty of
Agriculture, University of Khartoum.
I deeply thank my uncle Abdulnaser and Dr. El Muez who
made my way bright.
My thanks also go to my colleagues at the Dept. of Botany and
Agricultural Biotechnology, Faculty of Agriculture, University of
Khartoum.
CONTENTS
Dedication
Acknowledgements
Contents
List of Tables
List of Figures
List of Appendices
Abstract
Arabic Abstract
CHAPTER ONE: INTRODUCTION
CHAPTER TWO: LITERATURE REVIEW
Part I: Counting Microorganisms
٢٫١ The parameters of foods that affect microbial growth
٢٫١٫١ pH
٢٫١٫٢ Moisture content
٢٫١٫٣ Oxidation-reduction potential (O/R,Eh)
٢٫١٫٤ Nutrient content
٢٫١٫٥ Antimicrobial constituents
٢٫١٫٦ Temperature
٢٫١٫٧ Relative Humidity of Environment
٢٫١٫٨ Presence and Concentration of Gases in the Environment
٢٫٢ General Viable Counts
٢٫٣ Microbial Counting Techniques
٢٫٣٫١ Plate Counts
٢٫٣٫١٫١ Pour Plates and Spread Plates
٢٫٣٫٢ Most Probable Number (MPN) Counts
٢٫٣٫٣ Dye Reduction Method
٢٫٣٫٤ Direct Microscopic Count (DMC)
٢٫٤ Total Viable Counts as Indicators of Food Sanitary Quality
٢٫٥ Culture Medium
Part II: Water
٢٫٦ Importance of water
٢٫٧ Water-borne diseases
٢٫٨ Standards for drinking water
٢. ٩ International drinking water standards
٢٫١٠ Water pollution
٢٫١١ Contamination of drinking water
Part III: Milk
٢٫١٢ Animal wealth in Sudan
Page
i
ii
iii
vi
vii
viii
ix
xi
١
٣
٣
٣
٣
٣
٤
٥
٦
٧
٧
٨
٨
٩
١٠
١١
١٢
١٣
١٤
١٥
١٦
١٧
١٧
٢٠
٢٢
٢٣
٢٣
٢٤
٢٥
٢٥
٢٫١٣ Milk
٢٫١٤ Nutritive value of milk
٢٫١٥ Sources of contamination
٢٫١٥٫١ Interior of the udder
٢٫١٥٫٢ Exterior of the udder
٢٫١٦ Microorganisms in raw milk
٢٫١٦٫١ Lactic acid bacteria
٢٫١٦٫٢ Coliforms
٢٫١٦٫٣ Milk spoilage microorganisms
٢٫١٦٫٤ Pathogenic bacteria in raw milk
٢٫١٧ Microbiological standards for raw milk
٢٫١٧٫١ Standards of dairy products
٢٫١٨ Pasteurization
CHAPTER THREE: MATERIALS AND METHODS
٣٫١ Sterilization
٣٫١٫١ Hot-air oven
٣٫١٫٢ Autoclaving
٣٫٢ Preparation of Media
٣٫٢٫١ Solid Media
٣٫٢٫١٫١ Plate count agar
٣٫٢٫٢ Liquid Media
٣٫٢٫٢٫١ Peptone Media
٣٫٣ Preparation of Butterfield’s phosphate buffer
٣٫٣٫١ Stock solution
٣٫٤ Collection of samples
٣٫٥ Preparation of sample dilutions
٣٫٦ Microbiological methods
٣٫٦٫١ Viable count of bacteria
٣٫٦٫١٫١ Milk (raw and pasteurized milk)
٣٫٦٫١٫٢ Water (running and stagnant)
٣٫٧ Isolation of dominant microorganisms
٣٫٨ Purification of isolates
٣٫٩ Tests for the tentative identification of bacteria
٣٫٩٫١ Gram stain
٣٫٩٫٢ The staining of bacterial spores
٣٫٩٫٣ Motility test
٣٫٩٫٤ Catalase test
٣٫٩٫٥ Acid-fast test
٣٫٩٫٦ Sugar fermentation test
٢٦
٢٧
٢٧
٢٧
٢٩
٢٩
٢٩
٣٠
٣٠
٣٠
٣١
٣١
٣٢
٣٦
٣٦
٣٦
٣٦
٣٦
٣٦
٣٦
٣٧
٣٧
٣٧
٣٧
٣٨
٣٨
٣٩
٣٩
٣٩
٣٩
٤٠
٤٠
٤١
٤١
٤١
٤١
٤٢
٤٢
٤٣
CHAPTER FOUR: RESULTS AND DISCUSSION
CHAPTER FIVE: CONCLUSION AND RECOMMENDATION
REFERENCES
APPENDICES
٤٤
٥٣
٥٤
٥٨
LIST OF TABLES
Page
Table A: Water resources of the hydrosphere.
١٩
Table B: Chemical composition of milk given by different
٢٦
authors.
Table ١: Tentative identification of bacteria
٥٢
LIST OF FIGURES
Page
Figure A: Major chemical components of raw milk.
٢٨
Figure ١: Effect of incubation temperature on the plate count
٤٥
of raw milk.
Figure ٢: Effect of incubation temperature on the plate count
٤٧
of pasteurized milk.
Figure ٣: Effect of incubation temperature on the plate count
٤٩
of running water.
Figure ٤: Effect of incubation temperature on the plate count
of stagnant water..
٥٠
LIST OF APPENDICES
Page
Appendix ١: Effect of incubation temperature on the plate
٥٨
count of raw milk.
Appendix ٢: Effect of incubation temperature on the plate
٥٩
count of pasteurized milk.
Appendix ٣: Effect of incubation temperature on the plate
٦٠
count of running water.
Appendix ٤: Effect of incubation temperature on the plate
count of stagnant water.
٦١
ABSTRACT
This work was meant to determine the optimum incubation
temperature for the plate count of raw and pasteurized milk and of
running and stagnant water. Three different incubation temperatures
were tested ٢٥°C, ٣٢°C and ٣٧°C.
The optimum incubation temperature for the plate count of raw
milk was found to be ٣٢°C which gave the highest total viable count
ranging from ٥,٤٩ x ١٠٤ to ٥,٢٦ x ١٠٥ cfu/ml; the dominant
microorganism was tentatively identified as Listeria.
The optimum incubation temperature for the plate count of
supposedly commercial pasteurized milk was found to be ٣٧°C which
gave the highest total viable count ranging from ١,٣٠ x ١٠٦ to ١,٥٢ x
١٠٦ cfu/ml, the dominant microorganisms being Streptococcs,
Leuconostoc and Pediococcus.
The optimum incubation temperature for the running water and
stagnant water was ٢٥°C which gave the highest viable count ranging
from ٣,٠٠ x ١٠٢ to ٣,٧ x ١٠٢ cfu/ml (running water) and from ٢,٦٥ x
١٠٣ to ٢,٩٧ x ١٠٣ cfu/ml (stagnant water) and the dominant
microorganisms were Bacillus in running water and Staphyglococcus
and Micrococcus in stagnant water.
The values of count given above were the highest and were
those at ٧٢ hrs of incubation but although the count at ٤٨ hrs of
incubation was slightly lower, this incubation time is recommended
for both water and milk for reasons of economy in time and cost.
ﻤﻠﺨﺹ ﺍﻷﻁﺭﻭﺤﺔ
ﺃﺠﺭﻴﺕ ﻫﺫﻩ ﺍﻟﺩﺭﺍﺴﺔ ﻟﻤﻌﺭﻓﺔ ﺩﺭﺠﺔ ﺍﻟﺘﺤﻀﻴﻥ ﺍﻟﻤﺜﻠﻰ ﻟﻠﻠﺒﻥ ﺍﻟﺨﺎﻡ ﻭﺍﻟﻠﺒﻥ ﺍﻟﻤﺒﺴﺘﺭ
C ،٢٥°ﺒﺎﺴﺘﺨﺩﺍﻡ ﺜﻼﺙ ﺩﺭﺠﺎﺕ ﺘﺤﻀﻴﻥ ﻤﺨﺘﻠﻔﺔ ﻟﻠﻌﻴﻨﺎﺕ ﻭﺍﻟﻤﺎﺀ ﺍﻟﺠﺎﺭﻱ ﻭﺍﻟﻤﺎﺀ ﺍﻟﺜﺎﺒﺕ.
C ،٣٢°C .٣٧°
٣٢°ﻭﻗﺩ ﺃﻋﻁﺕ ﻨﻤﻭﹰﺍ Cﺒﺎﻟﻨﺴﺒﺔ ﻟﻠﺒﻥ ﺍﻟﺨﺎﻡ ﻓﺈﻥ ﺩﺭﺠﺔ ﺍﻟﺘﺤﻀﻴﻥ ﺍﻟﻤﺜﻠﻰ ﻫﻲ
ﻭﺍﻟﺒﻜﺘﺭﻴﺎ ﺍﻟﺴﺎﺌﺩﺓ ﻓﻲ ﻫﺫﻩ ﺍﻟﻌﻴﻨﺔ cfu/mlﻴﺘﺭﺍﻭﺡ ﻤﺎ ﺒﻴﻥ ١٠٥ × ٥,٢٦ﺇﻟﻰ ١٠٥ × ٥,٤٩
ﺒﻌﺩ ﺍﻟﺘﻌﺭﻴﻑ ﺍﻟﻤﺒﺩﺌﻲListeria.ﻫﻲ ﺒﻜﺘﺭﻴﺎ ﻤﻥ ﺠﻨﺱ
C ٣٧°ﺒﺎﻟﻨﺴﺒﺔ ﻟﻠﻠﺒﻥ ﺍﻟﻤﻔﺘﺭﺽ ﺇﻨﻪ ﺘﺠﺎﺭﻱ ﻤﺒﺴﺘﺭ ﻓﺈﻥ ﺩﺭﺠﺔ ﺍﻟﺘﺤﻀﻴﻥ ﺍﻟﻤﺜﻠﻰ ﻫﻲ
ﻭﺍﻟﺒﻜﺘﺭﻴﺎ cfu/mlﻭﻗﺩ ﺃﻋﻁﺕ ﺃﻋﻠﻰ ﻨﻤﻭﹰﺍ ﻴﺘﺭﺍﻭﺡ ﻤﺎ ﺒﻴﻥ ١٠٦× ١,٣٠ﺇﻟﻰ ١٠٦ × ١,٥٢
ﻭ Streptococcus, Leuconostoc,ﺍﻟﺴﺎﺌﺩﺓ ﻓﻲ ﻫﺫﻩ ﺍﻟﻌﻴﻨﺔ ﻫﻲ ﺒﻜﺘﺭﻴﺎ ﻤﻥ ﺠﻨﺱ
Pediococcus .
ﺒﺎﻟﻨﺴﺒﺔ ﻟﻠﻤﺎﺀ )ﺍﻟﻤﺎﺀ ﺍﻟﺠﺎﺭﻱ ﻭﺍﻟﻤﺎﺀ ﺍﻟﺜﺎﺒﺕ( ﻓﺈﻥ ﺩﺭﺠﺔ ﺍﻟﺘﺤﻀﻴﻥ ﺍﻟﻤﺜﻠﻰ ﻫﻲ
٣
)ﻟﻠﻤﺎﺀ ٢٥°cfu/mlﻭﻗﺩ ﺃﻋﻁﺕ ﻨﻤﻭﹰﺍ ﻴﺘﺭﺍﻭﺡ ﻤﺎ ﺒﻴﻥ ١٠٣ × ١,٣٢ﺇﻟﻰ C ١٠ × ١,٥٩
) ﻟﻠﻤﺎﺀ ﺍﻟﺜﺎﺒﺕ( ﻭﺍﻟﺒﻜﺘﺭﻴﺎ cfu/mlﺍﻟﺠﺎﺭﻱ( ،ﻭﻤﻥ ١٠٣ × ٢,٩٧ﺇﻟﻰ ١٠٣ × ٢,٦٥
ﻟﻌﻴﻨﺔ ﺍﻟﻤﺎﺀ ﺍﻟﺠﺎﺭﻱ ﻭ Bacillus.ﺍﻟﺴﺎﺌﺩﺓ ﻫﻲ ﺒﻜﺘﺭﻴﺎ ﻤﻥ ﺠﻨﺱ
ﻟﻌﻴﻨﺔ ﺍﻟﻤﺎﺀ ﺍﻟﺜﺎﺒﺕMicrococcus.ﻭStaphylococcus
ﺍﻹﻋﺩﺍﺩ ﺍﻟﻤﻴﻜﺭﻭﺒﻴﺔ ﺍﻟﺘﻲ ﺃﻋﻁﻴﺕ ﺃﻋﻼﻩ ﻫﻲ ﺍﻷﻋﻠﻰ ﺍﻟﺘﻲ ﻭﺠﺩﺕ ﻭﺒﻌﺩ ﺘﺤﻀﻴﻥ
ﻟﻤﺩﺓ ٧٢ﺴﺎﻋﺔ ﻭﻟﻜﻥ ﻋﻠﻰ ﺍﻟﺭﻏﻡ ﻤﻥ ﺇﻥ ﺍﻷﻋﺩﺍﺩ ﺒﻌﺩ ﺘﺤﻀﻴﻥ ٤٨ﺴﺎﻋﺔ ﻜﺎﻨﺕ ﺃﻗل ﺒﻘﻠﻴل،
ﻴﻭﺼﻰ ﺒﺎﻋﺘﻤﺎﺩ ﻤﺩﺓ ﺍﻟﺘﺤﻀﻴﻥ ﺍﻷﺨﻴﺭ ﻷﺴﺒﺎﺏ ﺍﻻﻗﺘﺼﺎﺩ ﻓﻲ ﺍﻟﺯﻤﻥ ﻭﺍﻟﺘﻜﻠﻔﺔ.
CHAPTER ONE
INTRODUCTION
We all live in a world filled with microbes from birth until
death (Tortora, et al., ١٩٩٨), so the environmental around us is
polluted including food especially milk and water.
For many years the Sudanese people did not pay much
attention to water pollution problems but today the population is
aware of the importance of good water quality and its relation to
diseases.
The current interest in the formulation of standards for the
quality control of food-stuffs in this country has prompted this work
on the microbiological standards of milk. One of the most useful
indices of the hygienic quality of milk and one on which milk grading
is usually based is the count of live microorganisms in milk. This is
done by the plate count method (American Public Health Association,
١٩٧١).
Total viable counts on food products not only reflect handling
history, state of decomposition, or degree of freshness but they may in
some instances reflect on the sanitary quality of foods. Total viable
counts most effectively evaluate the sanitary quality of foods that do
not support microbial growth (Jay, ١٩٨٦).
Objectives
١. Study the effect of incubation temperature on the plate count
of water and milk.
٢. To find the optimum incubation temperature for the plate
count of water and milk.
CHAPTER TWO
LITERATURE REVIEW
Part I: Counting Microorganisms
٢,١ The Parameters of Foods that Affect Microbial growth
٢,١,١ pH
It has been well established that most microorganisms grow
best at pH values around. ٧,٠ (٦,٦-٧,٥), while few grow below ٤,٠.
Bacteria tend to be more fastidious in their relationships to pH than
molds and yeasts, with the pathogenic bacteria being the most
fastidious (Jay, ١٩٨٦).
٢,١,٢ Moisture Content
One of man’s oldest methods of preserving foods is drying or
desiccation, and precisely how this method came to be used is not
known. The preservation of foods by drying is a direct consequence of
removal or binding of moisture without which microorganisms do not
grow. It is now generally accepted that the water requirements of
microorganisms should be defined in terms of the water activity (aw)
in the environment. The aw most fresh foods is above ٠,٩٩.
Bacteria require higher values of aw for growth than fungi,
with gram-negative bacteria having higher requirements than gram
positives, most spoilage bacteria do not grow below aw ٠,٩١, while
spoilage molds can grow at as low aw as ٠,٨٠.
Staphylococcus aureus was found to grow at aw as low as ٠,٨٦,
while Clostridium botulinum does not grow below aw ٠,٩٤. Just as
yeasts and molds grow over a wider pH range than bacteria, the same
is true for aw. The lowest reported aw values for bacteria of any type is
٠,٧٥ for halophilic (literally, “salt-loving”) bacteria, while xerophilic
(“dry-loving”) molds and osmophilic (preferring high osmotic
pressures) yeasts grow at aw values of ٠,٦٥ and ٠,٦٠.
Certain relationships have been shown to exist between aw,
temperature and nutrition. First, at any temperature, the ability of
microorganisms to grow is reduced as the aw is lowered. Second, the
range of aw over which growth occurs is greatest at the optimum
temperature for growth; and third, the presence of nutrients increases
the range of aw over which the organisms can survive. The specific
values given above, then, should be taken only as reference points,
since a change in temperature or nutrient content might permit growth
at lower values of aw (Jay, ١٩٨٦).
٢,١,٣ Oxidation-reduction Potential (O/R, Eh)
It has been known for many years that microorganisms display
varying degrees of sensitivity to the oxidation-reduction potential of
their growth medium. The O/R potential of a substrate may be defined
generally as the ease with which the substrate loses (oxidized) or gains
electrons (reduced). Aerobic microorganisms require an oxidized
environment for growth while anaerobes require reduced environment.
Some bacteria such as the genus Clostridium, require reduced
conditions for growth while others such as the genus Bacillus require
oxidized conditions for growth. Some bacteria such as Lactobacilli
and Streptococci are often referred to as microaerophiles. Some
bacteria have the capacity to grow under either aerobic or anaerobic
conditions. Such types are referred to as facultative anaerobes (Jay,
١٩٨٦).
٢,١,٤ Nutrient Content
In order to grow and function normally, the microorganisms of
importance in foods require water, source of energy, source of
nitrogen, vitamins and minerals.
Concerning the importance of water to growth with respect to
the other four groups of nutrients, molds have the lowest requirement,
followed by yeasts, gram- positive bacteria, and gram- negative
bacteria.
As sources of energy, food-borne microorganisms may utilize
sugars, alcohols and amino acids. Some few microorganisms are able
to utilize complex carbohydrates such as starches and cellulose. Fats
are used also by microorganisms as sources of energy.
The primary nitrogen sources utilized by heterotrophic
microorganisms are amino acids.
Microorganisms may require B vitamins in low quantities and
most natural foods tend to have an abundant quantity for those
organisms that are unable to synthesize their essential requirements
such as gram-negatives and molds. The gram-positive bacteria are the
least synthesizing and must therefore, be supplied with one or more of
these compou
nds before they will grow (Jay, ١٩٨٦).
٢,١,٥ Antimicrobial Constituents
The stability of some foods against attack by microorganisms
is due to the presence of certain naturally occurring substances that
have been shown to have antimicrobial activity. Among these are
eugenol in cloves, allicin in garlic, cinnamic alddehyde and eugenol in
cinnamon, allyl isothiocyanate in mustard. Cows’ milk contains
several antimicrobial substances including lactoferring, conglutinin
and the lactoperoxide system. Casein as well as some free fatty acids
that occur in milk have been shown to be antimicrobial (Jay, ١٩٨٦).
٢,١,٦ Temperature
Microorganisms grow over every wide range of temperatures.
The lowest temperature at which a microorganism has been reported
to grow is -٣٤°C while the highest is somewhere in excess of ٩٠°C. It
is customary to place microorganisms into three groups based upon
their temperature requirements for growth. Those organisms that grow
well below ٢٠°C and have their optimum between ٢٠° and ٣٠°C are
referred to as psychrophiles or psychrotrophs. Those that grow well
between ٢٠° and ٤٥°C with optima between ٣٠° and ٤٠°C are
mesophiles. Those with optima between ٥٥°-٦٥°C are referred to as
thermophiles.
Molds are able to grow over wider ranges of temperature than
bacteria. Yeasts grow over the psychrophilic and mesophilic
temperature ranges but generally not within the thermophilic range
(Jay, ١٩٨٦).
٢,١,٧ Relative Humidity of Environment
The relative humidity (R.H.) of the environment is important
both from the standpoint of aw within food and the growth of
microorganisms at the surfaces. When the aw of food is set at ٠,٦٠
, it is important that this food be stored under conditions of R.H. that
does not allow the food to pick up moisture from the air and thereby
increase its own surface and subsurface aw to a point when microbial
growth can occur (Jay, ١٩٨٦).
٢,١,٨ Presence and Concentration of Gases in the Environment
The storage of food in atmospheres containing increased
amount of CO٢ up to about ١٠٪ is referred to as “ controlled
atmosphere”. Carbon dioxide has been shown to retard fungal rotting,
also the ozone (O٣) added to food storage environments has a
preservative effect upon certain foods. This gas has been tried with
several
foods
and
found
to
be
effective
against
spoilage
microorganisms. Both CO٢ and C٣ are effective in retarding the
surface spoilage of beef quarters under long-term storage (Jay, ١٩٨٦).
٢,٢ General Viable Counts
General viable counts are determined usually by colony
counting methods although the multiple tube technique may be used if
low concentrations of bacteria are expected. The choice of medium
and incubation conditions is difficult when general viable counts are
attempted on the mixed microflora usually found in foods. Frequently
viable count are required of populations for which there is little
knowledge of the types of organisms present, and in these
circumstances, because of the variety of nutritional and physical
requirements represented, it is impossible to obtain counts that truly
indicate the number of viable organisms present (Harrigan, ١٩٩٨).
٢,٣ Microbial Counting Techniques
To detect and count the viable microorganisms in the samples
different methods are used: plate count agar method, membrane
filtration method, most probable number method and dye reduction
methods. Electrometric methods, nucleic acid probes and the
polymerase chain reaction and for total number of microorganisms in
a sample are also used. The Breed’s smear method for direct
microscopic counts, direct microscopic counts by membrane filtration,
direct epifluorescent filter technique (DEFT), flow cytometry, ATP
determination by bioluminescence and turbidimetric methods are
other techniques (Harrigan, ١٩٩٨).
The four basic methods employed are the plate count method,
the most probable number (MPN) method as a statistical
determination of viable cells, the dye-reduction techniques to estimate
numbers of viable cells and the direct microscopic count for both
viable and non-viable cells (Jay, ١٩٨٦).
٢,٣,١ Plate Counts
The most frequently used method of measuring bacterial
populations is the plate count method. An important advantage of this
method is that it measures the number of viable cells. One
disadvantage may be that it takes sometime, usually ٢٤ hours or more
for visible colonies to form. This can be a serious problem in some
applications, such as quality control of milk, when it is not feasible to
hold a particular lot for this length amount of time.
The plate count is based on three assumptions, that each
bacterium grows and divides to produce a single colony, that the
original inoculum is hamogeneous, and that no aggregate of cells are
present.
When a plate count is performed, it is important that only a
limited number of colonies develop in the plate, when too many
colonies are present. Some cells are over-crowed and do not develop:
these conditions cause inaccuracies in the count. Generally, only
plates with ٢٥-٢٥٠ colonies are counted. To ensure that some colony
counts will be within this range, the original inoculum is diluted
several times in a process called serial dilution (Tortora, et al., ١٩٩٨).
٢,٣,١,١ Pour Plates and Spread Plates
A plate count is done by either the pour plate or the spread
plate method. In pour plate method either ١,٠ ml or ٠,١ ml of dilutions
of the bacterial suspension is introduced into dish. The medium in
which the agar is kept liquid by holding it in a water bath at about
٥٠°C, is poured over the sample, which is then mixed into the medium
by gentle agitation of the plate. When the agar solidifies, the plate is
incubated. With the pour plate technique, colonies will grow within
the agar (from cells suspended in the medium as the agar solidifies) as
well as on the surface of the agar plate (Tortora, et al., ١٩٩٨).
This technique has some drawbacks because some relatively
heat – sensitive microorganisms may be damaged by the method agar
and will therefore be unable to form colonies. Also, when certain
differential media are used, the distinctive appearance of the colony on
the surface is essential for diagnostic purposes. Colonies that form
beneath the surface of a pour plate are not satisfactory for such tests.
To avoid these problems, the spread plate method is frequently used,
٠,١ ml inoculum is added to the surface of the medium with a
specially-shaped sterilized glass rod. This hot positions all the
colonies on the surface and avoids contact of the cells with the hot
agar (Tortora, et al., ١٩٩٨).
Among the disadvantages of the plate method is the problem
of spreaders (especially when the agar surface is not adequately dry
prior to plating), and the crowding of colonies, which makes
enumeration more difficult. In spite of the disadvantages of the pour
plate method, it is most usable because it measures the number of
viable cells.
٢,٣,٢ Most Probable Number (MPN) Counts
In these counts, the concentration of viable organisms or
propagules is inferred from examining multiple cultures prepared from
aliquots of dilution series, and determining the portions of such
cultures that show growth and those that do not show growth in
suitable growth medium (Harrigan, ١٩٩٨).
Three serial dilutions are then planted into nine or fifteen tubes
of appropriate medium for the three or five tube method, respectively.
Numbers of organisms in the original sample are determined by use of
standard MPN tables. Among the advantages that this method offers
are the following: it is relatively simple, results from one laboratory
are more likely than plate counts results to agree with those from
another laboratory, specific groups of organism can be determined by
use of appropriate selective and differential media and it is the method
of choice for determining fecal coliform densities. Among the
drawbacks to its use is the large volume of glassware required, the
lack of opportunity to observe the colonial morphology of the
organisms, and its lack of precision (Jay, ١٩٨٦).
٢,٣,٣ Dye Reduction Methods
These methods depend on the ability of microorganisms to
alter the oxidation-reduction potential of a medium. They are in
consequence a measure of the activity of microorganisms in the test
system rather than of the numbers in the sample. Suitable indicator
dyes include methylene blue and resazurin. The length of time taken
to reduce the dye depends on the mass and activity of bacteria present
in the sample: the greater the number present, the shorter the time
required for reduction. However, many other factors are important,
including the nature of the sample, the medium used and the types of
organisms present. The organisms must be capable of metabolism and
growth in the medium to which the dye is added, and if the sample
itself is incapable of supporting growth the dilution liquid should be a
nutritious liquid. For reproducible end results the test system,
including the sample, must be of a sufficiently constant chemical
composition to have an invariable effect on the microorganisms
present.
Dye-reduction tests have a long history of use in the dairy
industry for assessing the overall microbial quality of raw milk.
Among their advantage are: they are simple, rapid, and in expensive;
and only viable cells actively reduce the dyes. Disadvantages are: not
all organisms reduce the dyes equally; and they are not applicable to
food specimens that contain reductive enzymes unless special steps
are employed (Jay, ١٩٨٦).
٢,٣,٤ Direct Microscopic Count (DMC)
In its simplest form, the DMC consists of making smears of
food specimens or cultures onto a microscope slide, staining with an
appropriate dye and viewing and counting cells with the aid of a
microscope (oil immersion objective). DMCs are most widely used in
the dairy products and the specific method employed is that originally
developed by R.S. Breed (Breed Count) (Jay, ١٩٨٦).
The method consists of adding ٠,٠١ ml of sample to a slide
and staining. The organisms or clumps of organisms are then
enumerated. The latter involves the use of a calibrated microscope
slide.
Among the advantages of DMC are: it is rapid and simple; cell
morphology can be assessed; and it lends itself to fluorescent probes
for improved efficiency. Among its disadvantages are: it is a
microscopic method and therefore fatiguing to the analyst, both viable
ad non-viable cells are enumerated; food particles are not uniformly
distributed relative to single cells and clumps; some cells do not take
the stain well and may not be counted. In spite of its drawbacks, it
remains the fastest way to make assessment of microbial cells in a
food product (Jay, ١٩٨٦).
٢,٤ Total Viable Counts as Indicators of Food Sanitary Quality
Total viable counts (more often aerobic plate counts, APC) on
food
products
not
only
reflect
handling
history,
state
of
decomposition, or degree of freshness; but they may in some instances
reflect on the sanitary quality of foods. Total counts most effectively
evaluate the sanitary quality of foods that do not support microbial
growth.
Low total counts do not always represent safe products and
may contain coliforms and it is also possible to have low-count foods
in which toxin-producing organisms have grown and produced toxins
that remain stable to conditions that may not favor the continued
survival of the cells (Jay, ١٩٨٦).
A more recent study of a large number of ready-to-eat foods
suggests that the APC is the most suitable method for evaluation of
the microbial quality of foods and that where food safety is of concern
a search for specific pathogens should be made.
٢,٥ Culture Medium
A culture medium is any nutrient liquid or solid that can be
used in laboratory for the growth of microorganisms. Such a medium
should resemble the natural substrate (e.g. blood serum for animal
pathogens, milk for milk microorganisms, soil extract for soil
microorganisms) on which the microorganisms grow. Whatever, the
medium, it must include all the necessary requirements for growth,
which vary according to the organism it is desired to grow but will
include:
(a) Water.
(b) Nitrogen – containing compounds (e.g. peptides, proteins,
amino acids, nitrogen – containing inorganic salts).
(c) Energy source (e.g. carbohydrate, peptides, amino acids,
protein).
(d) Accessory growth factors.
The nutritional requirements of bacteria range from the
simple inorganic requirements of autotrophs to the many vitamins and
growth factors required by some of the fastidious bacteria (including
pathogens and the lactic acid bacteria). Therefore, it is not possible to
formulate a medium capable of supporting the growth of all
microorganisms. However, the commonly used empirical media, such
as nutrient broth and nutrient agar, are capable of supporting the
growth of many bacteria. Furthermore, a medium such as nutrient agar
can be used as a basal medium to which is added, for example, blood
to ٥-١٠٪, serum or milk, to provide the complex growth factors
needed by the more fastidious bacteria; lactic-acid bacteria require Bgroup vitamins which can be provided by the addition of yeast extract.
A nutrient medium can be made selective or biochemically
diagnostic by the addition of suitable compounds (Harrigan, ١٩٩٨).
The glucose tryptone yeast agar (plate count agar) medium
(PCA) is more usable and that is due to the fact that PCA allows the
growth of more types than does nutrient agar (Harrigan, ١٩٩٨).
Part II: Water
٢,٦ Importance of Water
Water is essential to sustain life; therefore, a satisfactory
supply must be made available to consumers. Every effort should be
made to maintain drinking-water quality as high as practicable.
Protection of water supplies from contamination is the first line of
defense. Source protection is almost invariably the best method of
ensuring safe, drinking-water and is to be preferred to treating a
contaminated water supply to render it suitable for consumption. Once
a potentially hazardous situation has been recognized, the availability
of alternative sources, and the availability of suitable remedial
measures must be considered.
As far as possible, water sources must be protected from
contamination by human and animal waste, which may contain a
variety of bacterial, viral and protozoan pathogens and helminthes
parasites. Failure to provide adequate protection and effective
treatment will expose the community, to the risk of water-borne
diseases.
The acceptable quality of water is defined by WHO guidelines
as that which is suitable for all usual domestic purposes, including
personal hygiene (WHO, ١٩٩٣). It should be palatable, wholesome, be
attractive to sense of sight and hygienically safe. There is an urgent
need for simple, effective, low-cost methods for the production of
water free of pathogenic and harmful chemical substances (John,
١٩٧٧).
On the surface of the continents water appears in more
scattered form, covering ٢,٥ million km٢ of its territory. From this, the
area of fresh water amounts to ٢ million km٢. The volume of fresh
water is small in comparison with that of seas and oceans (Table A). It
amounts to barely ٠,٤٪ of the surface area of the Earth and
approximately ١٪ of the area of the continents (Chhatwal, et al.,
١٩٩٣).
Table A: water resources of the hydrosphere
(Source: Chhatwal, et al., ١٩٩٣)
Location and state of stored water Amount ١٠١٢ tons
Percent
١،٣٨٠،٠٠٠
٩٨،٩٠٠
١٦،٧٠٠
١،٠٧٧
Fresh water
٠،٠٢٥
٠,٠٠٢
Water vapour in atmosphere
٠،٠١٣
٠,٠٠١
Underground water
٠،٢٥٠
٠,٠٢٠
Seas
Polar and mountain and snow
١،٣٩٦،٩٨٨
Total
١٠٠,٠٠٠
Forrest (١٩٥٦) reported that there were acute shortages in both
surface and underground waters in many locations in the world.
Careless pollution or contamination of streams, lakes and underground
sources has greatly impaired the quality of the available water. It is
therefore of utmost importance for our future planning that good
conservation and sanitary measures be practiced to ensure enough
water supply.
٢,٧Water-borne Diseases
Water is unsafe for human consumption when it contains
pathogenic microorganisms. Pathogenic microorganisms (and their
associated diseases) may include bacteria, such as Salmondla typhi
(typhoid fever), Vibrio cholerae (Cholera), Shigella (dysentery,
shigellosis), viruses such as poliovirus or hepatitis a virus and
protozoa such as Giardia lamblia (giardiasis) or Cryptosporidium
parvum (cryptosporidiosis). Giardia is a protozoan parasite that
infects the upper portion of the small intestine of humans and many
other species of mammals. The usual mode of transmission is personto-person through what is termed the “fecal-oral route”. The least
common mode of transmission is water-borne. Cryptosporidium is a
protozoan parasite, like Giardia. Both humans and animals may serve
as sources of environmental contamination and human infection. In
١٩٩٣-١٩٩٤, cryptosporidiosis caused by Cryptosporidium parvum
was the leading cause of illness associated with contaminated drinking
water in the United States. Other disease outbreaks during that time
were caused by Giardia lamblia, Salmonella, Shigella, Campylobacter
jejuni and Vibrio cholerae (cdc..gov/epa/mmwr/wr.html).
Recognition that water was a source of pathogenic
microorganisms was made in the late ١٨٠٠’s. Because it was, and still
is, very expensive and time consuming to test for all the possible
microbial pathogens in water, it was suggested in the late ١٨٠٠’s that
a single group of microorganisms that come from the same source as
human pathogens (i.e., the gastrointestinal tract) could be used to
indicate the presence of pathogens. In ١٩١٤, the USA Public Health
Service adopted the use of coliform bacteria as indicator
microorganisms to indicate the presence of faecal contamination in
water. Ideally, if indicator microorganisms are detected in any
substance, it indicates the presence of faecal contamination and
therefore possible presence of pathogenic microorganisms in the
water. Indicator microorganisms are tested for because they are easier
and cheaper to test for than all the possible pathogens that might be
present. The most common indicators are total coliform bacteria,
faecal coliforms and Escherichia coli (E. coli). It is very important to
note that the presence of coliforms, faecal coliforms or even
Escherichia coli in water does not mean that pathogenic
microorganisms are present. It only gives an indication that they might
be present. Presence of coliform or faecal coliform bacteria does not
determine
whether
a
sample
will
make
someone
ill
(Wga.org/WQIS/G/ossary/Ecoli.htmi).
Water-borne diseases are “dirty-water” diseases, i.e., those
caused by water that has been contaminated with human or animal
faeces or chemicals. Worldwide, the lack of sanitary waste disposal
and of clean water for drinking, cooking, and washing is to blame for
over ١٢ million deaths a year
http://www.infofrhealth.org/pr/m١٤/m١٤/chap٥ ١.shtml).
٢,٨ Standards for Drinking-Water
Drinking-water standards around the world are in a continuous
state of evolution as more information becomes available and is
valuated. No single standard for drinking-water quality that suffices
for all countries but there is a considerable degree of agreement on
contaminates and their allowable contaminates (Sayre, ١٩٨٨). Yet
different approaches to regulation and different conditions in countries
will maintain differences in standards currently enforced. Although
standards and monitoring programs are in place for most public water
supplies around the world, bottled water, which is being increasingly
popular, is often not regulated.
The first priority of water supplies in all countries is to ensure
that drinking water is bacteriologically safe. In the United States,
reporting of water-borne disease outbreaks has been and continues to
be voluntary. Based on the available data, the incidence of waterborne diseases had declined from ٨ cases per ١٠٠،٠٠٠ person-years
during ١٩٢٠-١٩٤٠ to ٤ cases during ١٩٧١-١٩٨٠ (Crawn, ١٩٨٦).
Over the last few decades, the number of chemicals appearing
in the standards has increased and will continue to increase as more
data become available (Ronald, ١٩٩٧).
٢,٩ International Drinking-Water Standards
The WHO is an international body and, using experts from
around the world, has developed guidelines (WHO, ١٩٨٤) to be used
as a basis for developing standards in all countries, particularly those
countries that lack the resources to perform the basic information of
gathering and assessment tasks involved. WHO notes that the
guidelines are to be considered in the environmental, social, economic
and cultural milieu of the country. The guidelines have undergone
various revisions through the years (Ronald, ١٩٩٧).
٢,١٠ Water Pollution
The term “water pollution” refers to the addition to water of an
excess of material that is harmful to humans, animals or desirable
aquatic life, or otherwise causes significant departures from the
normal activities of various living communities in or near bodies of
water.
٢,١١ Contamination of Drinking-Water
The term “contamination” is defined as the presence in water
of bacteria from the intestinal tract of warm-blooded animals
including man.
El Shazali and Erwa (١٩٧١) reported that studies in the Sudan
have clearly demonstrated the close association of biological
contamination of drinking-water with the high prevalence of diarrheal
diseases and certain enteric pathogens.
A study in the Nile and in wells at Khartoum area by Elhassan,
et al. (١٩٨٤), indicated that there were ٩٣-٤٦٠ cells/١٠٠ ml either
coliform or faecal coliforms in Nile water and ٣-٢, ٤٠٠ cells/١٠٠ ml
of either coliforms or faecal coliforms in wells, but tap water
contained only ٣ clls/١٠٠ ml of either coliforms or faecal coliforms.
Hammad and Dirar (١٩٨٢) found that zeers were faecally
contaminated, with faecal coliforms in ٦٩,٨٨٪ and faecal streptococci
in ٩١,٥٦% of samples examined. Data from Sierra Leone on the
waters from surface sources showed that these waters had extremely
low dissolved chemical contents, but a variable, often high level of
faecal bacterial contamination (Wright, ١٩٨٤).
Mahgoub (١٩٨٤) noted that the present practice of effluent
disposal from Khartoum North Treatment Plant (disposing industrial
sewage) can form a serious potential source of surface and ground
water contamination.
Part III: Milk
٢,١٢ Animal Wealth in Sudan
Sudan is one of the largest African countries which have a big
livestock population and is considered the second in Africa (Ministry
of Animal Resources, ١٩٩٨).
Animal census of ٢٠٠٢ is the latest estimate which gave
animal resources in the Sudan as ١٣٢،٤٤٢،٠٠٠ heads, cattle
٣٩،٤٧٩،٠٠٠ heads, sheep ٤٨،١٣٦،٠٠٠ heads, goats ٤١،٤٨٥،٠٠٠ heads
and camels ٣،٣٤٢،٠٠٠ heads. For Khartoum State, the estimation of
animal wealth is ١،٢٥٢،٨٤٨ heads, cattle ٢٢٥،٠٣٠ heads, sheep
٤٠٩،١٥٦, goats ٦١٣،٩٧٨ heads and camels ٤،٦٧٩ heads (Ministry of
Animal Resources, ٢٠٠٣).
The pastoral tribes of the western, eastern, southern and central
Sudan possess the traditional primary sources of milk from cattle and
other animals in the Sudan.
٢,١٣ Milk
Bovine milk may be defined as the liquid from the mammary
glands of healthy and normally fed cows.
The composition of milk varies widely depending on a large
number of factors including breed, season, stage of lactation, milking
interval, health of the cow and level and type of feed. Several authors
reported comparable values of milk chemical composition (Table B).
Table B: Chemical composition of milk given by different
authors. Source: FAO Food and nutritional paper ١٤/٣, (١٩٧٩).
Richmond
Davies
{In Davis & Maodonald
(١٩٥٣)}
Person D
(١٩٧٦)
Webb, et al.
(١٩٧٤)
Fat
٣,٧٥
٣,٦٧
٣,٦١
٣,٥-٢,٧
Protein
٣,٢٠
٣,٤٢
٣,٢٩
٣,٥
Lactose
٤,٧٠
٤,٧٨
٤,٦٥
٤,٩
Ash
٠,٧٥
٠,٧٣
٠,٧٥
٠,٩
٢,١٤ Nutritive Value of Milk
It is recognized that milk is a good type of food and has well
balanced basic nutrients such as easily digestible fat, carbohydrate
material and contains high percentage of complete easily digestible
animal protein in addition to some of the important vitamins: A, B, E
and also contains important mineral compounds, like calcium and
phosphorus (Chandan, ١٩٩٧, Fig. A).
٢,١٥ Sources of Microbial Contamination
٢,١٥,١ Interior of the Udder
O’Conore (١٩٩٥) reported that the species of bacteria found in
milk as it comes from the udder are limited to few genera. The
micrococci are generally present in the greatest proportion followed
by streptococci and rods. Milk taken aseptically from normal udder
has ٣٠٠-١٠٠٠ bacterial cells per ml.
Figure A: Major chemical components of raw milk.
Source: Chandan (١٩٩٧).
Milk
Water ٨٧,٤٪
Total solids ١٢,٦٪
Solid-non-fat ٨,٩٪
Lactose ٤,٨٪
Protein ٣,٤٪
Why proteins ٠,٦٪
Fat ٣,٧٪
Minerals ٠,٧٪
Casein ٢,٨
٢,١٥,٢ Exterior of the Udder
Swarling (١٩٥٩) reported that under normal practical
conditions contamination of milk can result from different sources
including dung, water, soil, the cow itself, the milkers and milking
facilities.
Robinson (١٩٩٠) and Richard (١٩٥٨) mentioned that udder
skin and milking machines contribute equally to the microbial count
of
milk.
However,
milking
machines
gave
markedly
high
contamination with psychrotrophs, penicillin resistant psychrotrophs,
coliforms and heat-resistant bacteria. O’Conore (١٩٩٥) reported that
coliform bacteria and members of the genus Bacillus may enter the
milk from soil.
Thomas et al. (١٩٧١) indicated that cow’s milking
environment, pipeline milking plants and farm bulk tanks comprised a
bacterial contamination.
٢,١٦ Microorganisms in Raw Milk
٢,١٦,١ Lactic Acid Bacteria (LAB)
LAB are a group of bacteria able to ferment lactose of milk to
lactic acid. Examples of these microorganisms are:
(i)
Streptococci
- Streptococcus lactis.
- Streptococcus cremoris.
(ii)
Lactobacilli
- Lactobacillus casei.
- Lactobacillus lactis.
- Lactobacillus bulgaricus.
(iii)
Leuconstoc.
- Leuconostoc mesenteroides.
٢,١٦,٢ Coliforms
These are indicator organisms associated with the presence of
pathogens and can cause rapid spoilage of milk.
٢,١٦,٣ Milk Spoilage Microorganisms
Pseudomonas fluorescens, Pseudomonas fragi some species and
strains of Bacillus, Clostridium, Corynebacterium, Arthrobacter,
Lactobacillus. Microbacterium, Micrococcus and Streptococcus can
survive pasteurization and grow at refrigeration temperatures.
٢,١٦,٤ Pathogenic Microorganisms in Milk.
Proper handling and storage of milk and also pasteurization
have decreased the milk-borne diseases such as tuberculosis,
brucellosis and typhoid fever and other food-borne illnesses resulting
from the ingestion of raw milk or dairy products made from milk not
properly pasteurized or contaminated after processing. The following
bacterial pathogens are still a concern in raw milk and other dairy
products:
Bacillus
enterocolitica,
cereus,
Salmonella
Listeria
monocytogenes,
species,
Escherichia
Yersinia
coli
and
Campylobacter jejuni.
٢,١٧ Microbiological Standards for Raw Milk
Milk was the first food product for which microbiological
standards were adopted in the United States.
٢,١٧,١ Standards for Dairy Products
(A) From ١٩٦٥ recommendations of the U.S. Public Health
Service.
(a) Grade A raw milk for pasteurization: Not to exceed
١٠٠،٠٠٠ bacteria per milliliter prior to commingling with
other producer milk; and not exceeding ٣٠٠،٠٠٠ per
milliliter as commingled milk prior to pasteurization.
(b) Grade A pasteurized milk and milk products (except
cultured products), not over ٢٠،٠٠٠ bacteria per milliliter,
and not over ١٠ coliforms per milliliter.
(c) Grade A pasteurized cultured products: not over ١٠
coliforms per milliliter.
(B) Certified milk (American Association of Medical Milk
Commissions, Inc.):
(a) Certified milk (raw): Bacterial plate count not exceeding
١٠،٠٠٠ colonies per milliliter; coliform colony count not exceeding
١٠ per milliliter.
(b) Certified milk (pasteurized): bacterial plate count not
exceeding ١٠،٠٠٠ colonies per milliliter before pasteurization and ٥٠٠
per milliliter in route samples. Milk not exceeding ١٠ coliforms per
milliliter before pasteurization and ١ coliform per milliliter in route
samples (Jay, ١٩٨٦).
٢,١٩ Pasteurization
In the early days of microbiology, Louis Pasteur found a
practical method of preventing the spoilage of beer and wine. Pasteur
used mild heating, which was sufficient to kill the organisms that
caused the particular spoilage problem without seriously damaging the
taste of the product. The same principle was later applied to milk to
produce what we now call pasteurized milk. Milk was first pasteurized
to eliminate the tuberculosis bacterium. Many relatively heat-resistant
(thermoduric) bacteria survive pasteurization, but these are unlikely to
cause disease or cause refrigerated milk to spoil. Almost all
pathogenic viruses are inactivated by pasteurization (Tortora, et al.
١٩٩٨).,
In the classic pasteurization treatment of milk, the milk was
exposed to a temperature of about ٦٣°C for ٣٠ minutes, this treatment
being known as holder method. Most milk pasteurization today uses
higher temperature, at least ٧٢°C for only ١٥ seconds. This treatment,
known as high-temperature short-time (HTST) pasteurization, is
applied as the milk flows continuously past a heat exchanger. In
addition to killing pathogens, HTST pasteurization lowers total
bacterial counts, so the milk keeps well under refrigeration.
As conventional microbiological tests require ١-٢ days before
the result is obtained and because milk is a highly perishable product,
quality assurance can be obtained by confirming that pasteurization
has occurred by using the phosphatase test.
However, a number of outbreaks of enteritis caused by
Salmonella or Campylobacter in pasteurized milk have been caused as
the result of post-pasteurization contamination. In one outbreak, the
contamination was through a faulty flow diversion valve. In another,
the contamination occurred through faulty valves on a pipe loop which
was associated with the cleaning-in-place circuit. As the pathogens
could be introduced by leakage of relatively small volumes of raw
milk into the pasteurized milk, it is extremely unlikely that a
phosphatase test would be able to detect such a fault (Harrigan, ١٩٩٨).
Thus, in addition to the phosphatase test, which can be used in
a quality control role, microbiological assessments can be used in a
quality assurance role to determine the quality of product already
produced, distributed and sold, so that a decision can be taken whether
or not to accept future batches of product from that source.
Aerobic mesophilic counts at ٣٠-٣٢°C and coliform or total
Enterobacteriaceae counts, may be performed. After pasteurization the
general viable count should be not more than ٣٠٠٠٠ per ml (and
counts of less than ٥٠٠٠ per ml on the freshly pasteurized milk should
be readily attainable). Total Enterobacteriaceae (or coliforms) should
not be detected in ١ ml of product (less than ١ per ml should be a
readily attainable standard) (Harrigan, ١٩٩٨).
Pasteurized milk should be stored at refrigeration temperatures
until consumption, so that the aerobic mesophilic count at ٣٠°C will
increase (many of the psychrotrophic hemophiles being detectable in
counts
incubated
at
٣٠°C).
However,
coliforms
and
other
Enterobacteriaceae should not multiply in pasteurized milk properly
stored, so there is no justification for increasing the permitted count of
these organisms in any standard applied to milk sampled at retail
outlets.
CHAPTER THREE
MATERIALS AND METHODS
٣,١ Sterilization
٣,١,١ Hot-air Oven
Glassware (Petri-dishes, pipettes, tubes, flasks and glass rods),
wrapped in aluminum foil, were sterilized in the hot air oven at ١٦٠°C
for two hour (Barrow and Gelthan, ١٩٩٣).
٣,١,٢ Autoclaving
Used for sterilization of media, solutions and materials which
could not withstand the dry heat. The exposure time was ١٥ minutes
١٢١°C under ١٥ pounds pressure (Barrow and Gelthan, ١٩٩٣).
٣,٢ Preparation of Media
٣,٢,١ Solid Media
٣,٢,٢ Plate Count Agar
This is a non-selective medium for general viable counts of
bacteria in food (Harrigan, ١٩٩٨). It was obtained in dehydrated form
(biomark laboratories pune ٤١١ ٠١١ " India"). The medium was
composed of yeast extract, tryptone, D-glucose and granulated agar. It
was prepared according to the manufacturer’s instructions by using
١٧,٥ g in one liter distilled water. The medium was allowed to boil in
water bath until it was completely dissolved and autoclaved at ١٢١°C
for ١٥ minutes.
٣,٢,٣ Liquid Media
٣,٢,٤ Peptone Water (Oxid)
Fifteen grams of dehydrated peptone water were suspended in
a liter of distilled water, mixed well, then pH adjusted to ٧,٢ and
autoclaved at ١٢١°C for ١٥ minutes.
٣,٣ Preparation of Butterfield’s Phosphate Buffer
٣,٣,١ Stock Solution
KH٢PO٤
٣٤ g
Distilled water
٥٠٠ ml
The pH was adjusted to ٧,٢ with ١ N NaOH. The volume was
brought to ١ litre with distilled water. The solution was sterilized ١٥
min at ١٢١°C and stored in refrigerator (FAO, ١٩٩٢).
For dilution blanks an amount of ١,٢٥ ml of above stock
solution was taken and the volume brought to ١ litre with distilled
water, dispensed into bottles to ٩٠ ± ml and sterilized for ١٥ min at
١٢١°C (FAO, ١٩٩٢).
٣,٤ Collection of Samples
A total of ١٦ samples of running and stagnant irrigation Nile
water were collected from Shambat. A total of ٨ raw bovine milk was
obtained from the University of Khartoum’s Farm. Plate counts were
carried out within ٢ hours after milking. A total of ٨ Commercial
pasteurized milk samples was bought from Kenana milk product
factory in Kenana and plate counts carried out ٢٤ hours after
pasteurization.
Data given in the results express the average data for each
group of samples.
٣,٥ Preparation Dilutions of Samples
One ml from the water sample was taken by sterile pipette and
transferred to the first tube containing ٩ ml of ٠,٩٪ phosphate buffer
solution as a diluent to give a ١٠-١ dilution; with a sterile pipette ١ ml
from this first dilution tube was transferred to a second tube of sterile
diluent to give a ١٠-٢ dilution, then further dilutions were made. Ten
ml from the milk sample was taken by sterile pipette and transferred to
the first bottle containing ٩٠ ml of dilutient to give a ١٠-١ dilution;
with a sterile pipette ١ ml from the first dilution bottle was transferred
to a second bottle of ٩ ml sterile diluent to give a١٠-٢ dilution then
further dilutions were made.
٣,٦ Microbiological Methods
٣,٦,١ Viable Count of Bacteria
٣,٦,١,١ Milk (Raw and Pasteurized Milk)
Plate Count Agar was used for enumeration of bacteria, using
the pour-plate technique as described by Harrigan and McCance
(١٩٧٦). Ten ml of homogeneous milk were added to ninety milliliters
of phosphate buffer to give ١/١٠ dilution and then further dilutions
were made by transferring ١ ml of ١st dilution to ٩ ml buffer. One ml
from each suitable dilution was transferred aseptically into sterile
Petri-dishes and plate count agar media was added. The inoculum was
mixed with the medium and allowed to solidity. The plates were made
in duplicates for each dilution and incubated at ٢٥, ٣٢ or ٣٧°C for ٧٢
hrs. The result was reported as the viable bacterial count per ١ml of
sample. Counting of the colonies was done every ٢٤ hrs with the help
of colony counter (Scientific & Electronics Ltd.). The rule of counting
only plates containing between ٣٠ and ٣٠٠ colonies were strictly
followed whenever possible.
٣,٦,١,٢ Water (Running and Stagnant)
Plate Count Agar was used for enumeration of bacteria, using
the pour-plate technique as described by Harrigan and McCance
(١٩٧٦). One ml of homogenous water were added to nine milliliters of
phosphate buffer to give ١/١٠ dilution and further dilutions made as
above. One ml from suitable dilutions was transferred aseptically into
sterile Petri-dishes and plate count agar media was added. The
inoculum was mixed with the medium and allowed to solidity. The
plates were made in duplicate for each dilution and incubated at ٢٥,
٣٢ or ٣٧°C for ٧٢ hrs. The result was reported as the viable bacterial
count per ١ ml of sample. Counting of the colonies was done every ٢٤
hrs with the help of colony counter.
٣,٧ Isolation of Dominant Microorganisms
Dominant colonies of microorganisms were chosen from
plates used for viable count and kept for further tests.
٣,٨ Purification of Isolates
Isolates were taken from the viable counts plates. One separate
colony is touched with sterile inoculating loop, and the cells thus
removed by streaking on a solid medium. The purified culture thus
obtained was further purified by repeating the above procedure (Kiss,
١٩٨٤).
٣,٩ Tests for the Tentative Identification of Bacteria
Identification tests of bacteria were repeated three times for
each microorganism. Tentative identification was done according to
(Harrigan, ١٩٩٨).
٣,٩,١ Gram Stain
A discrete colony was picked carefully with sterile wire loop.
The colony was emulsified in a drop of sterile normal saline, placed
on a clean slide and spread evenly to make a thin film. The slide was
allowed to dry. The smear was fixed by using flame. Then the smear
was stained as described by Harrigan and McCance (١٩٧٦).
٣,٩,٢ The Staining of Bacterial Spores
The smear was done as describe in ٣,٩,١ and then stained by
Malachite Greens as described by (Harrigan, ١٩٩٨).
٣,٩,٣ Motility Test
The organism to be tested was grown for ٢٤ hours at ٣٧°C in
a liquid medium containing (g/L): ١٠ yeast extract, ٣٠ CaCO٣ and ٢٠
ml ethanol and pH adjusted to ٦,٧ (Frateur, ١٩٥٠). A drop of the
culture was transferred to cover slip and the motility was examined
using a light microscope.
٣,٩,٤ Catalase Test
A small parts of the colony was added to ١ ml of ٣٪ hydrogen
peroxide on a slide. In the presence of catalase, gas formulation is
observed (Kiss, ١٩٨٤).
٣,٩,٥` Acid-Fast Tests
The following tests were followed:
Cover the slide with strong Ziehl-Neelsen’s carbol fuchsin
and heat the underside of the slide with a lighted alcohol-soaked swab.
Stop heating when the slide steams. Keep the slide hot and replenish
the stain if necessary, taking care not to allow the smear to become
dry. Heat for ٥ min, not allowing the staining solution to boil. Wash
well. Decolorize with acid-alcohol or with ١, ٥ or ٢٠٪ sulphuric acid.
The excess stain is removed as a brownish solution, and the smear will
become brown. Rinse in water, when the film will appear pink once
more. Apply more acid and repeat the rinsing several times until the
film appears faintly pink upon washing. Wash well. Counter stain with
Loeffler’s methylene blue for ٥ min. Wash well and carefully remove
the stain deposits from the back of the slide with filter paper. Blot dry
and examine (Harrigan, ١٩٩٨).
٣,٩,٦ Sugar Fermentation Test
To ١,٥ g peptone water, ١٪ glucose and ١٪ indicator
(Andrade’s) were added. Durham tubes were used to detect gas
production. Cultures were inoculated and incubated anaerobically at
the optimum temperature ٣٧°C and were examined daily for ٧ days.
Gas production indicates positive test (Harrigan and McCance, ١٩٧٦).
CHAPTER FOUR
RESULTS AND DISCUSSION
Effect of Incubation Temperature on the plate count of raw milk
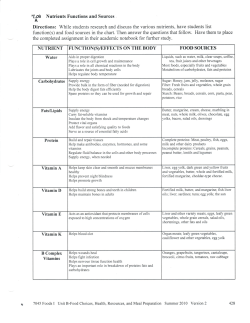
As can be seen in Fig. ١ there were three temperatures tested
(٢٥°C, ٣٢°C, ٣٧°C). Temperature ٢٥°C gave the least growth and
incubation in ٣٢°C gave the highest viable count. With respect to
incubation time, it can be seen that counts at ٣٢°C, ٣٧°C and ٢٥°C
reach the maximum at ٤٨ hrs or ٧٢ hrs of incubation. This result
disagrees with Dirar (١٩٧٦) who found that incubation at ٣٧°C gave
the highest viable count and both counts at ٣٧°C and ٢٥°C reached the
maximum at ٤٨ hrs of incubation. It might be during ٣٠ years new
strains of microorganisms have appeared or new practices followed. In
United States of America, for instance, the incubation for the plate
count of milk is ٢٣ ± ١°C for ٤٨ hrs ±٣ (Hausler, ١٩٧٢). These
specifications were originally set up by a research committee of
bacteriologists (Babel, et al., ١٩٥٥). Other work shows that incubation
temperatures of ١٠, ٢٠, ٢٧ and ٣٠°C gave higher counts than ٣٣°C or
٣٧°C and the selected organisms from plates incubated at the different
temperatures grew best at ٢٠°C and ٢٧°C. The author recommended
the use of ٢٧° as incubation temperature, instead of the present ٣٢°C
for the plate count of raw milk. Smith, et al. (١٩٧٣) obtained highest
25 °C.
5.8
5.2
5
37 C
5.6
5.4
4.8
4.6
24
48
Incubation Time(hrs)
72
Fig . ١ Effect of Incubation Temperature on the Plate of Raw Milk (Appendix ١)
L o g o f Via ble Co un
32 C
counts when plates were incubated at ٢٩٫٩°C for ٤٨ hrs. Our results
show clearly the incubation temperature of ٣٢°C is by far more
superior to the lower temperature of ٢٥°C for the plate count of raw
milk. The viable count of chilled farm raw milk was less than ١٠٤ per
ml, bulk raw milk was less than ١٠٥ and the total viable count under
aseptic conditions was less than ١٠٣ per ml (Harrigan and McCane,
١٩٧٦). We should remember that milk samples under test differ
because the atmospheric temperatures vary between cold countries
and tropical countries like Sudan. This fact shows that it is unwise
copying of standards of one country to another without testing.
In this study the dominant microorganism in raw milk was
Listeria (Table ١). This disagrees with Elgadi (٢٠٠٣) who reported
that Streptoroccus was obtained in high counts from Khartoum town
raw milk samples. Our samples were taken from Shambat University
Farm but Listeria is not commonly reported as a dominant species
although it is commonly found in milk (Jay, ١٩٨٦).
Effect of Incubation Temperature on The plate Count of
Pasteurized Milk
In Fig. ٢ of the three incubation temperatures shown it can be
seen that the lowest count was given at ٢٥°C while ٣٧°C gave the
highest count.
Log. of Viable Coun
6.3
6.2
6.1
6
5.9
5.8
5.7
5.6
5.5
24
48
72
Incubation Time(hrs)
25 °C.
32 °C.
37 °C.
Fig .٢ Effect of Incubation Temperature on the Plate of Pasteurized Milk (Appendix ٢)
Plates incubated at ٣٢°C and ٣٧°C attained the maximum
count only after ٣ days of incubation. This result also disagrees with
Direr (١٩٧٦) in Sudan and committee’s finding in America (Babel et
al., ١٩٥٥). It might be that the differences are due to using different
sanitation materials for cleaning the flours and utensils.
The dominant microorganisms in pasteurized milk (Table ١)
are Streptococcus – Leuconostoc – Pediococcus and this agrees with
O’Conore (١٩٩٥) who reported that the species of bacteria found in
milk as it comes from the udder are limited to few genera, while The
micrococci are generally present in the greatest proportion followed
by streptococci and rods.
Effect of Incubation Temperature on the Plate Count of Water:
Results, as shown in Fig. ٣ and Fig. ٤, show that the
optimum incubation temperatures are not the same as in the case of
milk. It can be seen that ٢٥°C gave the maximum count (running
water and stagnant water). In this study the result disagrees with Dirar
(١٩٧٦) who found that incubation at ٣٧°C gave the highest viable
counts and ٢٥°C gave the least growth. In U.S.A an incubation
temperature of ٢٠°C+٠٫٥ is used for ٤٨-+ ١hrs or a temperature of
٣٥°C+- ٠٫٥ for ٢٤± ٢hrs for the plate count of water (Dirar, ١٩٧٦).
4
3
2
1
0
24
48
Incubation Time(hrs.)
72
25 °C.
32 °C.
37 °C.
Fig .٣ Effect of Incubation Temperature on the Plate Count of Running Water (Appendix ٣)
Lo g. of Viable Co unt
Log. of Viable Coun
3.6
3.4
3.2
3
2.8
2.6
24
48
Incubation Time (hrs.)
72
25 °C.
32 °C.
37 °C.
Fig .٤ Effect of Incubation Temperature on the Plate Count of Stagnant Water (Appendix ٤)
The dominant microorganisms is Bacillus in running water
and Staphylococcus and Micrococcus in stagnant water (Table ١). This
result agrees with Ahmed (٢٠٠٥) and disagrees with Elrofaei (٢٠٠٠)
with respects to water samples taken from
factory cisterns and
drinking water at Jebel Awllia and Jeberona, respectively.
Table ١: Tentative identification of bacteria from water (running
water, stagnant water)
and milk (raw milk, pasteurized milk).
Isolate
Character
Gram stain
Acid fast
Endospores
produced
Catalase
positive
Cells spherical
Cell rod
shaped
Aerobic
Motile
Good growth
on plate count
agar
Sugar
fermentation
test
Tentative
genus
١
٢
٣
٤ ٥ ٦ ٧ ٨ ٩ ١٠
١١
١٢
+
-
+
-
+
-
+ + + + + +
- - - - - - - - + + +
+
-
+
-
+
-
+
+
+
+ + + + + +
-
-
-
+
-
+
-
+
-
- - - - - + + + + + +
+
-
+
-
+
-
+ + +
+ + +
+ + +
+
+
+
+ + +
Staphylococcus
Micrococcus
group
١،٢،٣ ≡ stagnant water samples
samples.
٤،٥،٦ ≡ Raw milk samples
milk samples
Listeria
Bacillus Streptococcus
–
Leuconostoc
–
Pediococcus
group
٧،٨،٩ ≡ Running water
١٠،١١،١٢ ≡ Pasteurized
CHAPTER FIVE
CONCLUSION AND RECOMMENDATION
In conclusion we recommend the incubation temperature of
٣٢°C for raw milk and temperature of ٣٧°C for pasteurized milk. For
running water we recommend the temperature of ٢٥°C and for the
stagnant water we recommend the temperature of ٢٥°C. In all cases
we recommend the incubation time of ٤٨ hrs for economy in time and
cost although incubation for ٧٢ hrs gave slightly higher counts.
More studies and researches should be done because it is not
correct to designate an incubation temperature for the plate count of
water and milk on one or two researcher’s results. Team work is
needed to obtain the correct results to contribute to finding standards
and specifications special for our country Sudan.
REFERENCES
Ahmed, F.I. (٢٠٠٥). Microbiological Quality of Water in some Food
Facilities Storage Cisterns in Khartoum North Industrial
Area.
American Public Health Association. Standard Methods for the
Examination of Water and Wastewater. ١٣th Editor, APHA,
Inc. Washington, DC – ١٩٧١, p. ٦٦٠.
Babel, F.J.; Collins, E.B.; Olson, J.C.; Peters, I.I.; Watrous, G.H. and
Spech, M.L. (١٩٥٥). The standard plate count of milk as
affected by the temperature of incubation. J. Dairy Sci. ٣٨:
٥٠٣.
Barrow, G.I. and Gelthan, R.K.A. (١٩٩٣). Cowan and Steel’s. Manual
for the Identification of Medical Bacteria. London.
Cambridge Univ. Press.
Chandan, R. (١٩٩٧). Dairy based ingredient Newer knowledge of
dairy
foods,
cited
in
http://www.national
dairycouncil.org./medant/newerknowledge/nk٤,١٤ml.
Chhatwal, G.R.; Mehra, M.C.; Katyal, T.M.; Salake, M. K. and
Nagahiro, T. (١٩٩٣). Environmental Water Pollution and its
Control, New Delhi, Anmol Publications.
Crawn, G.F. (١٩٨٦). Statistics of Water-Borne Outbreaks in United
States. G.F. Cawn, (ED). CRC Press, Boca Raton, FL.
Dirar, H.A. (١٩٧٦). Optimum incubation temperature for the plate
count of milk. Sudan J. Fd. Sci. Technol. ٨: ٥٥-٦٠.
ElHassan, B.; Awadelkarim, M.A.; Abdel Magid, H.M.; Ibrahim, I.S.
and Dirar, H.A. (١٩٨٤). Water quality and quantity and their
impact on health in Khartoum Province, Sudan. Water
Quality Quarterly, ٩(٤): ٢٢٥-٢٣٠.
Elgadi, Z. A. (٢٠٠٣). Isolation and identification of lactic acid bacteria
and yeast from raw milk. M.Sc. Thesis, Faculty of Agric.,
University of Khartoum.
Elrofaei, N.A. (٢٠٠٠). Microbiological Examination of Drinking
Water for the displaced People Living Around Khartoum
State. Ph.D. Thesis, Faculty of Agric., University of
Khartoum.
El Shazali, H. and Erwa, H. (١٩٧١). An overlooked source of
gastroenteritis in Sudanese children, Sudan Medical J., ٩:
٤٥.
FAO
(١٩٩٢). Manual of food quality control ٤-Rev. ١.
microbiological analysis. FAO food and nutrition paper
١٤/٤ Rev. ١, Food and Agricultural Organization of the
United Nation, Rome.
FAO (١٩٧٩). Food and nutrition Paper (١٤/٣), manual of food quality
control ٣ commodities, Rome.
Forrest, B. (١٩٥٦). Rural Water Supply and Sanitation. John Wiley
and Sons, Inc. New York.
Frateur, J. (١٩٥٠). Essai sur la systematique des acetobacters. La
cellule, ٥٣: ٢٨٧-٣٩٢. (Cited in Bergey’s Manual of
Systematic Bacteriology vol. ١, p. ٢٦٨ (١٩٨٤). Baltimore:
William & Wilkins, (ISBN).
Hammad, Z.H. and Dirar, H.A. (١٩٨٢). Streptococci versus coliforms
as indicators of faecal contamination in sebeel water. Sudan
Notes and Records, ٥٩, ١٦٠-١٧٥.
Harrigan, W.F. (١٩٩٨). Laboratory Methods in Food Microbiology,
٣rd ed. Academic Press, San Diego, California.
Harrigan, W.F. and Mc Cance, M.E. (١٩٧٦). Laboratory Methods in
Food and Dairy Microbiology. Academic Press, London.
Hausler, W.J. (١٩٧٢). Standard Methods for the Examination of Dairy
Products. APHA, Inc., Washington, DC. ١٣th Edition. P. ٨١.
Jay, J.M. (١٩٨٦). Modern Food Microbiology, ٣rd ed. Van Nostrand
Reinhold Company, New York.
John, W.C. (١٩٧٧). Water Supply and Pollution Control, ٣rd ed., New
York: Harpar and Raw Publishers, Inc.
Kiss, I. (١٩٨٤). Testing Methods in Food Microbiology. A Textbook,
Elseevier, New York.
Mahgoub, D.M. (١٩٨٤). Coliform Bacteria in the Nile at Khartoum.
M.Sc. Thesis, Faculty of Agric., University of Khartoum.
Ministry of Animal Resources (١٩٩٨). Administration of Planning and
Economy of Animal Resources.
Ministry of Animal Resources (٢٠٠٣). Statistical Bulletin for Animal
Resources Issue No. ١٢, pp. ٣-٢٩.
O’Conore, C.B. (١٩٩٥). Rural Dairy Technology. International
Livestock Research Institute, Addis Ababa, Ethiopia.
Richard, Z.D. (١٩٥٨). Treatment of milk for cheese with H٢O٢. J.
Dairy Sci., ٤١: ١٤٦.
Robinson,
R.K.
(١٩٩٠).
Dairy
Microbiology
Vol.
(١)
the
Microbiology of milk ٢nd edition, Elseevier London and
New York ١٦٥-١٦٧.
Ronald, L.D. (١٩٩٧). Theory and Practice of Water and Waste Water
Treatment. John Wiley and Sons. Inc. New York.
Sayre, I.M. (١٩٨٨). International Standards for Drinking Water. J.
American Water Works Association, ٨٠, ١: ٥٣-٦٠.
Smith, K.L.; Mortinez, E.A.; Pilkhane, S.V. and Mull, L.E. (١٩٧٣).
Effect of incubation time and temperature on plate count of
raw milk. J. Dairy Sci. ٥٦: ٣٠٤.
Swarling, D. (١٩٥٩). The influence of the use of detergents and
sanitizers on the farm with regard to the quality of milk and
milk products. Dairy Sci. Abst., ٢١: ١-١٠.
Thomas, B.S.; Druce, G.R. and Jones, M. (١٩٧١). Influence of
production conditions on the bacteriological quality of
refrigerated farm bulk tank milk. J. Appl. Bacteriol. ٣٤:
٦٥٩-٦٧٧.
Tortora,G.J.; Funke, B.R. and Case, C.L. (١٩٩٨). Microbiology an
Introduction, ٦th ed. Benjamin/Cummings
Company, Menlo Park, California.
Publishing
WHO (١٩٨٤). Guidelines for Drinking Water Quality vol. ١, WHO,
Geneva.
WHO, (١٩٩٣). Guidelines for Drinking Water Quality, vol. ٢, WHO,
Geneva.
Wright, R. (١٩٨٤). Water quality analysis and integral component of
water supply development in developing countries. Water
Bulletin, ٩(٤): ٢٢٣-٢٢٤.
Appendix I
Effect of incubation temperature on the plate count of raw
milk.
Incubation
temperature °C
٢٥°C
٣٢°C
٣٧°C
Incubation
time (hr)
Viable count
(cfu/ml)
Log of viable
count
٢٤ hrs
١,١٩ x ١٠٥
٥,٠٧
٤٨ hrs
١,٣١ x ١٠٥
٥,١١
٧٢ hrs
١,٣٤ x ١٠٥
٥,١٢
٢٤ hrs
٥,٢٦ x ١٠٥
٥,٧٢
٤٨ hrs
٥,٤٩ x ١٠٥
٥,٧٤
٧٢ hrs
٥,٤٩ x ١٠٥
٥,٧٤
٢٤ hrs
٤,٤٧ x ١٠٥
٥,٦٥
٤٨ hrs
٤,٥٧ x ١٠٥
٥,٦٦
٧٢ hrs
٤,٦١ x ١٠٥
٥,٦٦
Appendix ٢
Effect of incubation temperature on the plate count of
pasteurized milk.
Incubation
temperature °C
Incubation
time (hr)
٢٤ hrs
Viable count
(cfu/ml)
٥,٧ x ١٠٥
Log of viable
count
٥,٧٥
٢٥°C
٤٨ hrs
٨,١ x ١٠٥
٥,٩٠
٧٢ hrs
٨,٣ x ١٠٥
٥,٩١
٢٤ hrs
١,١٢ x ١٠٦
٦,٠٥
٤٨ hrs
١,١٨ x ١٠٦
٦,٠٧
٧٢ hrs
١,٢٧ x ١٠٦
٦,١٠
٢٤ hrs
١,٣٠ x ١٠٦٥
٦,١١
٤٨ hrs
١,٤٥ x ١٠٦
٦,١٦
٧٢ hrs
١,٥٢ x ١٠٦
٦,١٨
٣٢°C
٣٧°C
Appendix ٣
Effect of incubation temperature on the plate count of
running water
Incubation
temperature °C
Incubation
time (hr)
٢٤ hrs
Viable count
(cfu/ml)
٣,٧ x ١٠٢
Log of viable
count
٢,٥٦
٢٥°C
٤٨ hrs
٣,٠٠ x ١٠٣
٣,٤٧
٧٢ hrs
٣,٠٠ x ١٠٣
٣,٤٧
٢٤ hrs
٩,٨ x ١٠٢
٢,٩٩
٤٨ hrs
١,٤٥ x ١٠٣
٣,١٦
٧٢ hrs
١,٥٢ x ١٠٣
٣,١٨
٢٤ hrs
١,٣٢ x ١٠٣
٣,١٢
٤٨ hrs
١,٥٥ x ١٠٣
٣,١٩
٧٢ hrs
١,٥٩ x ١٠٣
٣,٢٠
٣٢°C
٣٧°C
Appendix ٤
Effect of incubation temperature on the plate count of
stagnant water.
Incubation
temperature °C
٢٥°C
٣٢°C
٣٧°C
Incubation
time (hr)
Viable count
(cfu/ml)
Log of viable
count
٢٤ hrs
٢,٦٥ x ١٠٣
٣,٤٢
٤٨ hrs
٢,٩٠ x ١٠٣
٣,٤٦
٧٢ hrs
٢,٩٧ x ١٠٣
٣,٤٧
٢٤ hrs
٢,٢٠ x ١٠٣
٣,٣٤
٤٨ hrs
٢,٢٥ x ١٠٣
٣,٣٥
٧٢ hrs
٣,٢٦ x ١٠٣
٣,٣٥
٢٤ hrs
٩,٨ x ١٠٢
٢,٩٩
٤٨ hrs
١,٨٧ x ١٠٣
٣,٢٧
٧٢ hrs
١,٩٣ x ١٠٣
٣,٢٨


© Copyright 2026