
The Feeding Value Of Millet Processing By-product
The Feeding Value Of Millet
Processing By-product On Broiler Chick
Performance
By
Altalib Abakar Ahmed Abakar
B.Sc. Animal Production
(University of Alazher-Egypt)
1985
A thesis submitted to the University of Khartoum in
fulfilment for the Requirements of the Degree of
Master of Science
In Poultry Production
Supervisor: Dr. Saadia Abd El Moniem Abbas
Department of Poultry production
Faculty of Animal Production
University of Khartoum
August- 2008
`
DEDICATION
gÉ tÄÄ Åç wxtÜ ytÅ|Äç ÅxÅuxÜá?
j|à{ ÄÉäx tÇw ÜxáÑxvà
TÄàtÄ|u
i
ACKNOWLEDGEMENTS
I would like to express my sincere gratitude and appreciation to
my supervisor Dr. Saadia Abd El Moniem Abbas for her constructive
guidance,
encouragement
and
attention
through
this
work.
Acknowledgement is extended to Professor Omer Elamin and Dr.
Abdelshakoor Haroun for their help.
Thanks are also to my wife and my children and my brother Ali
Abakker for their encouragement and support. Many thanks are due to
my colleagues Abdel Hafeez Hamed and Amal Abdalla Tyfoor and
Bakhait Mansour Dousa and Madani for unlimited care and moral
support.
This work could not have been possible without the family
tremendous help, encouragement and support, to whom Iam really
indebted.
ii
LIST OF CONTENTS
page
Dedication ……………………………………………………………….
i
Acknowledgements……………………………………………………….
ii
List of contents …………………………………………………………
iii
List of tables……………………………………………………………....
iv
Abstract…………………………………………………………………..
vi
Arabic abstract …………………………………………………………..
viii
CHAPTER ONE: INTRODUCTION…………………………...……
1
CHAPTER TWO: REVIEW OF LITERATURE ………………...…
3
2-1
Description of pearl millet…………………………………………
3
2-1-1 Pearl millet Processing in Sudan ………………………………….
3
2-2
Botanical source and agronomy of pearl millet …………………..
4
2-3
Dehulling of pearl millet …………………………………………
6
2-4
The chemical composition of pearl millet ....................................
6
2-4-1
Lipids of pearl millet …………………………………………….
9
2-4-2
Fatty acid composition of pearl millet …………………………..
10
2-5
Comparative evaluation of the feeding value of different cereal
11
grains in poultry nutrition ……………………………………………...
The chemical composition of Maize, Millet, Wheat and Sorghum
11
2-5-2 The nutritive value of maize, millet and wheat in broiler diets
14
2-6
Anti nutritional factors in pearl millet …………………………….
19
2-6-1 Anti thyroid and goitrogenic effect of millet ……………………..
20
2-5-1
2-7
2-7-1
Cereal milling by-products ………………………………………… 21
Hominy chop or hominy feed ……………………………………
iii
21
2-7-2
Cereal bran …………………………………………
21
2-7-3
Wheat Pollard or middling ………............................................
22
CHAPTER THREE: MATERIALS AND METHODS ………….....
23
3-1 Processing of canfut ((Millet Processing by-
23
product)…........………………………………………………………
3-2 Experimental Birds …………………………………………
23
3-3 Experimental Diets ……………………………………………..
24
3-4 Housing and Equipments……………………………………
25
3-5 Management and data collection …………………………..
26
3-6 Experimental design and statistical analysis
27
CHAPTER FOUR: RESULTS …………..............................................
30
CHAPTER FIVE: DISCUSION …………...........................................
41
CONCLUSION AND RECOMMENDATIONS……………………...
43
REFFRENCES …………………………………………………………..
44
APPENDIX……………………………………………………………….
51
iv
LIST OF TABLES
Table Title
Page
1-
The feed formulation of the experimental diets (%)……
2-
The calculated chemical composition of the experimental
diets(%) …………………………………………………….
3-
31
Proximate analysis or nutrient composition of common
barns………………………………………………………
5-
29
Proximate analysis of canfut(millet processing byproduct)(%) ………………………………………………..
4-
28
32
The overall performance of the experimental birds during
0-6 weeks of age . ………………………………………..
33
6-
Weekly mean feed intake of the experimental birds……..
35
7-
Weekly live body weight gain of the experimental birds
(g/bird/week) ………….......................................................
8-
Weekly mean feed conversion ratio of the experimental
birds ………….............................................
9-
36
38
Summary table of the carcass parameters of the
experimental birds (g/bird/6week) …………....................
39
10- Feeding cost of the experimental diets. ............................
40
v
ABSTRACT
An experiment was conducted to study the feeding value of a
millet processing by-product locally known as (canfut) in broiler diets,
and to assess its feeding and economical value in comparison with
other cereal grains and their by-products.
One hundred and fifty one-day old unsexed commercial broiler
chicks (Ross 308) were randomly assigned to five experimental diets.
Each experimental treatment had 3 replicates each of 10 experimental
chicks. The five experimental diets were formulated to contain
different levels of canfut, namely (0%(1), 5%(2), 10%(3), 15%(4), 20%(5))
replacing sorghum grain in basal diet weight by weight. Chicks were
fed the experimental diets for six weeks, and feed intake , live body
weight, body weight gain and feed conversion ratio were recorded
weekly.
The results of the experiment showed significant differences in
feed intake among the treatments (P<0.05), being highest in the group
fed the diet containing 15% canfut followed by the group fed the diet
containing 20% while the control diet without canfut showed the lowest
level of feed intake. The results did not reveal any significant
differences in live weight, body weight gain, or feed conversion ratio
among the experimental treatments. The results also did not show
statistically significant differences among the treatments with respect
to the measured carcass parameters , except for gizzard weight. The
gizzard weight of chicks receiving the 15% canfut diet showed
increased gizzard weight (36.7g). In conclusion, performance
vi
parameters of increased canfut percentage in the diet increased from
5%, to 20%, lead to lower cost with better financial benefits compared
to the control diet.
vii
ﺧــﻼﺻﺔ ﺍﻷﻃـــﺮﻭﺣﺔ
ﺍﺠﺭﻴﺕ ﺘﺠﺭﺒﺔ ﺤﻘﻠﻴﺔ ﻟﻤﻌﺭﻓﺔ ﺍﺜﺭ ﺍﻟﻘﻴﻤﺔ ﺍﻟﻐﺫﺍﺌﻴﺔ ﻟﻠﻜﻨﻔﻭﺕ )ﻤﺨﻠﻔـﺎﺕ ﺍﻟـﺩﺨﻥ(
ﻜﻤﺼﺩﺭ ﻟﻠﻁﺎﻗﺔ ﻓﻰ ﻋﻼﺌﻕ ﺍﻟﺩﺠﺎﺝ ﺍﻟﻼﺤﻡ ﻭﻤﻌﺭﻓﺔ ﺍﻟﻘﻴﻤﺔ ﺍﻻﻗﺘﺼﺎﺩﻴﺔ ﻟﻬﺎ ﺒﺎﻟﻤﻘﺎﺭﻨﺔ ﻤـﻊ
ﺍﻟﻌﻼﺌﻕ ﺍﻷﺨﺭﻯ .ﺍﺴﺘﻌﻤﻠﺕ ﻤﺎﺌﺔ ﻭﺨﻤﺴﻭﻥ ﻜﺘﻜﻭﺕ ﻻﺤﻡ ﻤﻥ ﻨﻭﻉ ،ROSSﺘﻡ ﺘﻭﺯﻴـﻊ
ﺍﻟﻜﺘﺎﻜﻴﺕ ﻋﺸﻭﺍﺌﻴﹰﺎ ﺒﻴﻥ ﺍﻟﻤﻌﺎﻤﻼﺕ.
ﺘﻤﺕ ﺘﻐﺫﻴﺔ ﺍﻟﻜﺘﺎﻜﻴﺕ ﻓﻰ ﺍﻟﺘﺠﺭﺒﺔ ﻋﻠﻰ 5ﻋﻼﺌﻕ ﻤﺘﺴﺎﻭﻴﺔ ﻓﻰ ﻤﺤﺘﻭﻯ ﺍﻟﺒﺭﻭﺘﻴﻥ
ﻭﺒﻨﺴﺏ ﻤﺨﺘﻠﻔﺔ ﻤﻥ ﺍﻟﻜﻨﻔﻭﺕ )ﻤﺨﻠﻔﺎﺕ ﺍﻟـﺩﺨﻥ( ﻤﻭﻗـﻊ ﺍﻟﺩﺭﺍﺴـﺔ ،%10 ،%5 ،%0
،%20 ،%15ﺩﺍﺨل ﻋﻼﺌﻕ ﺍﻟﺫﺭﺓ )ﺍﻟﻔﺘﺭﻴﺘﻪ( )ﺃﺤﺩ ﻫﺫﻩ ﺍﻟﻌﻼﺌﻕ ﺘﻌﺘﺒﺭ ﻋﻠﻴﻘﺔ ﻗﻴﺎﺴﻴﺔ ﻻ
ﺘﺤﺘﻭﻯ ﻋﻠﻰ ﻜﻨﻔﻭﺕ) ﻤﺨﻠﻔﺎﺕ ﺍﻟﺩﺨﻥ(.ﺍﺴﺘﺨﺩﻤﺕ ﻜﺘﺎﻜﻴﺕ ﻋﻤﺭ ﻴﻭﻡ ﻓﻲ ﻫﺫﻩ ﺍﻟﺘﺠﺭﺒـﺔ،
ﻭﺍﺴﺘﻤﺭﺕ ﻟﻔﺘﺭﺓ ﺴﺘﺔ ﺍﺴﺎﺒﻴﻊ .ﺘﻡ ﺘﺴﺠﻴل ﺍﻟﻌﻠﻑ ﺍﻟﻤﺴﺘﻬﻠﻙ ،ﺍﻟﻭﺯﻥ ﺍﻟﻤﻜﺘـﺴﺏ ،ﺍﻟـﻭﺯﻥ
ﺍﻟﺤﻰ ﻭ ﺤﺴﺎﺏ ﻨﺴﺒﺔ ﺍﻟﺘﺤﻭﻴل ﺍﻟﻐﺫﺍﺌﻰ ،ﻜﻤﺎ ﺘﻡ ﺍﺨﺫ ﺍﻭﺯﺍﻥ ﺍﻟﻘﻠﺏ ﻭﺍﻟﻘﻭﺍﻨﺹ ﻭﺍﻟـﺭﺌﺘﻴﻥ
ﻭﺃﻁﻭﺍل ﺍﻻﻤﻌﺎﺀ ﺍﻟﺩﻗﻴﻘﺔ ﻭﺍﻟﻐﻠﻴﻅﺔ ﻭﺍﻻﻋﻭﺭﻴﻥ.
ﺃﻅﻬﺭﺕ ﻨﺘﺎﺌﺞ ﺍﻟﺘﺠﺭﺒﺔ ﻭﺠﻭﺩ ﻓﺭﻭﻗﺎﺕ ﻤﻌﻨﻭﻴﺔ ﺒﻴﻥ ﺍﻟﻤﻌﺎﻤﻼﺕ ﻓﻲ ﻜﻤﻴﺔ ﺍﻟﻌﻠـﻑ
ﺍﻟﻤﺴﺘﻬﻠﻙ ﻓﺎﻟﻜﺘﺎﻜﻴﺕ ﺍﻟﻤﻐﺫﺍﻩ ﻋﻠﻰ ﻋﻠﻴﻘﺔ ﺒﻨﺴﺒﺔ %15ﺃﻅﻬﺭﺕ ﺍﺴﺘﻬﻼﻙ ﺍﻜﺒـﺭ ﻟﻠﻌﻠـﻑ
ﺘﻠﺘﻬﺎ ﺘﻠﻙ ﺍﻟﻤﻐﺫﺍﻩ ﻋﻠﻰ ﻋﻠﻴﻘﺔ ﺒﻨﺴﺒﺔ ،%20ﺒﻴﻨﻤﺎ ﺴﺠل ﺍﻗل ﻤﻌـﺩل ﺍﺴـﺘﻬﻼﻙ ﻟﻠﻌﻠﻴﻘـﺔ
ﺍﻟﻘﻴﺎﺴﻴﺔ .ﻓﻲ ﺍﻟﻤﻘﺎﺒل ﻻ ﻴﻭﺠﺩ ﻓﺭﻕ ﻤﻌﻨﻭﻯ ﺒﻴﻥ ﺍﻟﻤﻌﺎﻤﻼﺕ ﺍﻟﺨﻤﺴﺔ ﻓﻰ ﺍﻟﻭﺯﻥ ﺍﻟﻤﻜﺘﺴﺏ
viii
ﻭﺍﻟﻭﺯﻥ ﺍﻟﺤﻰ ،ﺍﻟﻜﺘﺎﻜﻴﺕ ﺍﻟﻤﻐﺫﺍﻩ ﻋﻠﻰ ﺍﻟﻌﻠﻴﻘﺔ ﺍﻟﻘﻴﺎﺴﻴﺔ ) (%0ﺴﺠﻠﺕ ﺍﻗل ﻭﺯﻥ ﻤﻜﺘﺴﺏ
ﻭﻭﺯﻥ ﺤﻰ .ﻟﻡ ﺘﺴﺠل ﺍﻟﻨﺘﺎﺌﺞ ﻓﺭﻭﻗﺎﺕ ﻤﻌﻨﻭﻴﺔ ﺒﻴﻥ ﺍﻟﻤﻌـﺎﻤﻼﺕ ﻓـﻲ ﻨـﺴﺒﺔ ﺍﻟﺘﺤﻭﻴـل
ﺍﻟﻐﺫﺍﺌﻰ ،ﺍﻁﻭﺍل ﺍﻻﻤﻌﺎﺀ ﺍﻟﺩﻗﻴﻘﺔ ﻭﺍﻟﻐﻠﻴﻅﺔ ﻭﺍﻻﻋـﻭﺭﻴﻥ ﻭﻓـﻰ ﺍﻭﺯﺍﻥ ﺍﻟﻘﻠـﺏ ﻭﺍﻟﺭﺌـﺔ
ﻓﻴﻤﺎﻋﺩﻯ ﺍﻭﺯﺍﻥ ﺍﻟﻘﻭﺍﻨﺹ ﻭﺍﻟﺘﻲ ﺃﻅﻬﺭﺕ ﻓﺭﻕ ﻤﻌﻨﻭﻱ ﺒﻴﻥ ﺍﻟﻤﻌﺎﻤﻼﺕ ﺤﻴـﺙ ﺴـﺠﻠﺕ
ﺍﻭﺯﺍﻥ ﺍﻟﻘﻭﺍﻨﺹ ﻟﻠﻜﺘﺎﻜﻴﺕ ﺍﻟﻤﻐﺫﺍﻩ ﻋﻠﻰ ﻋﻠﻴﻘﺔ ﺒﻨﺴﺒﺔ %15ﻤﺨﻠﻔﺎﺕ ﺩﺨﻥ ﺍﻋﻠﻰ ﺍﻷﻭﺯﺍﻥ،
ﺒﻴﻨﻤﺎ ﺴﺠﻠﺕ ﺍﻗل ﻤﻌﺩل ﻻﻭﺯﺍﻥ ﺍﻟﻘﻭﺍﻨﺹ ﻟﻠﻜﺘﺎﻜﻴﺕ ﺍﻟﻤﻐﺫﺍﻩ ﻋﻠﻰ ﺍﻟﻌﻠﻴﻘﺔ ﺍﻟﻘﻴﺎﺴﻴﺔ .ﺇﻀﺎﻓﺔ
ﻤﺨﻠﻔﺎﺕ ﺍﻟﺩﺨﻥ ﺍﻟﻲ ﻋﻠﻴﻘﺔ ﺍﻟﺩﺠﺎﺝ ﺍﻻﺤﻡ ﺘﺅﺩﻱ ﺍﻟﻲ ﺘﻘﻠﻴل ﺍﻟﺘﻜﻠﻔﺔ ﻭﺯﻴـﺎﺩﺓ ﺍﻟـﺭﺒﺢ ﺩﻭﻥ
ﺍﻟﺘﺄﺜﻴﺭ ﻋﻠﻲ ﺍﻷﺩﺍﺀ ﺍﻟﻌﺎﻡ.
ix
x
CHAPTER ONE
1- INTORDUCTION
Sorghum and millet grains constitute the major source of
dietary energy and protein for millions of people in Africa; besides
they are also utilized as animal feeds. Poultry production in the
Sudan continued to depend almost completely on sorghum grains as
the major source of dietary energy. It is well known that sorghum is
a staple food for human population in the Sudan, and there exists a
competition between humans and poultry for sorghum, which is
sometimes reflected in high prices of sorghum and grains. This
consequently leads to a rise in the production cost of poultry
products. For this reason , there is an eminent and urgent need to
explore alternative sources to supply feed energy and protein for
poultry, in order to reduce the present competition between human
and poultry for sorghum in the Sudan.
Millet Pennistum glaucum is considered the second cereal
grain for human and animal feeding after sorghum in the Sudan. In
Darfur and Kordofan areas, millet is widely grown and used as
human food. It is commonly decorticated (dehulled) and the bran
portion mixed with broken grains are produced as a by-product
locally known as canfut. Due to seasonal variation in the production
of sorghum and its price fluctuation, these by-products can constitute
a major source of energy in poultry and animal feeds, and may lead
to reduced cost of production. Therefore, the present study was
conducted to investigate the feeding value of canfut as a source of
energy in broiler diets and to assess its economical value compared
with other cereal grains.
-1 -
CHAPTER TWO
2- REVIEW OF LITERATURE
2-1 Description of pearl millet:
Millets are small seeds of annual cereal grasses, many of
which are adapted to hot dry climates. Pearl millet is the most
widely grown of all the millets (Hulse et al 1980). According to
Purseglove (1972) pearl millet includes a number of cultivars. Bor
(1960) considered these races as a single collective species. Other
workers have suggested that various races do not have a common
origin, but may have arisen from many wild species from different
parts of Africa. About 2000 years ago, the crop was carried to East
and Central Africa and to India (Hulse et al 1980). Pearl millet is
divided into two broad classes, early and late season millet. There is
a considerable variation in most cultivars, because a mixture of
cultivars is usually planted and the crop is cross pollinated.
Pearl millet kernels are about one-third the size of sorghum
kernels, with an average weight of about 9 mg; and are generally
pear shaped. The most common colours of the grain is grey, but
colours ranging from creamy white through yellow to black are
known (Sullivan et al 1990).
2-1-1 Pearl Millet Processing in Sudan:
In western Sudan, millet grain is the main staple food; and it is
consumed mostly after husking. It is processed in several types of
food dishes as non fermented whole millet to produce Assida, Balila
-2 -
and Marisa(alcohol). Also its extracted starch, known as Geer, is
processed from fermented decorticated millet (Khatir, 1990).
One of the by-products of milling of millet, known as (canfut)
consists of the outer coating of millet kernel (Husk), together with
broken millet grains and a small amount of whole grains. This
product of millet processing is used for livestock feeding, but is not
commonly used in poultry feeding. Studies on its use as poultry feed
are few. The average weight of sack of canfut is about 70-75 kg,
priced at (15 SDG) compared to sorghum grain of comparable
weight (90 SDG).
2-2 Botanical Source and Agronomy of Pearl Millet:
Of all the world's cereals, pearl millet (Pennistum glaucum) is
the sixth most important cereal. It descended from a wild west
African grass, which was domesticated more than 4000 years ago
probably in what is now the hear of Sahara Desert. It spreaded from
its home land to East Africa and then India, both places adopted it
largely and it became a staple food. Pearl millet (Pennisetum
typhoides) is found widely in Asia and Africa, and it's grain became
an important food crop. It is generally grown in tropical areas with
low rainfall and it is also cultivated as an irrigated crop in certain
areas. The grain has a hard, smooth outer covering, white, yellow,
red or black in colour according to the variety (Johnson and
Raymond, 1974).
-3 -
The genus Pennisetum is distributed throughout the tropics and
subtropics of the world. It includes about 140 species. One African
species, Pennisetum glaucum (L.) was domesticated as the cereal
pearl millet, and another African species Pennisetum purpureum
schemach became widely distributed as a tropical forage grass
(Brunkeen et al., 1977).
Marchais and Tostain (1985) reported that variation within
cultivated pearl millet is recognized as races typhoides, nigritarum,
globusum and leonis. Race typhoids are grown across the arid
Savanna from Senegal to Egypt and South Africa. Race nigritarum is
extensively grown, from Nigeria to the Sudan. The race globusum is
widely distributed in West Africa. The race Leonis is the principal
pearl millet in Sierralione and extends north to Mauritania.
Pearl millet is the most drought tolerant of all domesticated
cereals, it is widely found in the semi-arid tropics of Africa and
Asia. It is the principal food crop across sub-Saharn Africa and north
western India, but in terms of world production, pearl millet is not a
major cereal. It is planted on some 15 million hectares in Africa, and
10 million hectares in Asia, yielding approximately 10 million tons
of grain. Pearl millet is grown where no other cereal will yield grain,
in regions with 200-300 mm of annual rainfall. It extends into the
higher rainfall areas of the semi-arid tropics. The specific name
Pennisetum americanum (L.) Leek is not taxonomically valid and
the old name Pennisetum glucum (L.) R. Br. is now being adopted
(De Wet, 1986). Exburne, Ugandi, Baioda and Nutrifeed are the
main cultivars of pearl millet grown in the Sudan and are certified by
-4 -
the National Seed Administration. Baioda is the only local cultivar
purified by the National Seed Administration (National Seed
Administration- Sudan).
2-3
Dehulling of pearl millet:
Sorghum and millet are major sources of energy and protein
for millions of people in Africa and Asia. Many consumers
decorticate (dehull) the grain as the first step in food preparation.
The traditional Sudanese home mill is, the stone mill or
(quern) known locally as Murhaka. Beside the stone mill, one also
finds the funduk or the mortar and pestle type mill (Dirar 1993).
Recently different simple mechanical dehullers are used.
Dehulling would have some effects on the nutrients and
antinutrient content of pearl millet, such as a decrease in total
polyphenols, (Reichert and Youngs 1979), a decrease in tannin and
phytic acid content, (Monawar 1983), a decrease in moisture and
protein content, (Kenkpen 1986), a decrease in protein, polyphenols
and tannin content, (Alhage, 1999),an increase in starch percentage,
(Almieda-Dominquez et al, 1990),and an increase in moisture
content (Alhag, 1999).
2-4 Chemical composition of pearl millet:
The proximate analyses of African pearl millet indicated that
the protein content of the millet grain ranged from 9.8 to 15.2%,
crude fibre 0.40 to 4.10%, ash 1.5 to 3.7%, ether extract 3.5 to 8.0%,
-5 -
carbohydrates 75 to 84%, amino acids; leucine 581 to 917 mg/g,
methionine 93 to 125 mg/g, cystine 144 to 169 mg/g, tryptophan 69
to 76, threonine 68 to 272 mg/g, valine 299 to 437 mg/g and glycine
330 to 337 mg/g; and minerals; calcium 17 to 68 mg/100g,
phosphorus 119 to 720 mg/100g, Iron 1 to 2 mg/100g, thiamine 0.31
to 0.42 mg/100g, and niacin 1.46 to 5.62 mg/100g, (Ganry and
Bideau 1974). Johnson and Raymond (1964) reported that the
protein content of the whole grain varied from 12.5 to 14.4%, and it
has 12% moisture and 5% fat contents. Agarwal and Sinha (1964)
reported that the moisture content of the whole grain was 11.9%.
Simhaee et al (1971) reported that proximate analyses of millet
showed that protein content was 9.56%, ash was 3.4% and
metabolizable energy was 2895 Kcal/kg.
Chemical composition of pearl millet showed the content of
moisture, 11.4% crude protein, 4.3% ether extract, 2.7% ash, 0.32%
calcium, 0.39% phosphorus and 60.8% available carbohydrate
(Sharma et al 1979). Varriano – Marston and Hosney (1980) found
that the protein content ranged from 11.1 to 14.7%, and moisture
from 7.8 to 14.2% for pearl millet varieties grown in Kansas. Singh
et al (1987) showed that the protein content of high protein
genotypes ranged from 11.3% to 20.8% and fibre content ranged
from 1.53% to 1.72%.
For Sudanese varieties of pearl millet which were cultivated in
Darfur area, Khatir (1990) found that the protein content ranged
between 15.1 to 15.5%, fat from 6.58 to 7.05%, fibre was 3.52%,
moisture was 10.80%, and ash varied from 1.82% to 1.87%. The
-6 -
same authors found that the protein of millet which is cultivated in
the Eastern Sudan, ranged from 14.2 to 15.3%, fat from 6.36 to
6.47%, fibre from 3.18% to 3.67%, moisture from 10.62 to 11.72%
and Ash 1.55 to 1.75%.
Decorticated millet grains were analysed by Kenkpen (1986)
who reported that the chemical composition of the local Sudanese
pearl millet (whole grain) was 8.9% moisture, 15.6% protein, 5.8%
fat and 1.6% fibre, while in decorticated grain it was 8.4% moisture,
13.2% protein, 0.74 Ash, 3.2 fat and 1.2% fibre.
The air dried grains contained approximately 12.4% moisture,
11.6% protein, 5.0% fat, 67.1% NFE, 1.2% fibre and 2.7% ash. The
protein content varied from 8.8 to 16.1%, but it was low in lysine
and methionine, while the nutritive value was comparable to that of
rice and wheat (Onwueme and Sinha 1991).
Furthermore, the chemical composition of Bioda millet
cultivar reported by Eljack, (1993) showed that it contains 7.24%
moisture, 11.36% protein, 4.2% ether extract, 3.5% fibre, 3.08%
Ash, 0.4 calcium, 0.05 phosphorus and 15.61 MJ/kg of
metabolizable energy. Different results were reported by Abdelrazig
(1997) who reported that the whole grain of Bioda cultivar contained
12.67% protein, 3384 Kcal/kg metabolizable energy. Basaly (1996)
reported that crude protein was 12.3%, fat 5.3% and ash 2.4% in the
same cultivar.
Another study by Abdalla et al (1998) revealed that crude
protein content of ten pearl millet genotypes ranged from 8.5 to
-7 -
15.15%, fibre from, 2.6 to 4.0%, ash from 1.6 to 2.4%, oil from 2.7
to 6.9%, starch from 58.5% to 70.0% and moisture from 9.1 to
11.7%.
Recently Ladu (2000) reported values for crude protein from
14.0 to 17.1%, ether extract from 2.14% to 4.43%, fibre from 2.29 to
4.76%, ash from 1.6 to 2.1% and moisture from 5.7 to 7.9% for
Sudanese pearl millet varieties.
2-4-1
Lipids of pearl millet
The lipid content of pearl millet is considered to be higher than
that of other cereals. Most lipids are concentrated in the germ,
pericarp, and alurone layers (Rooney 1978, Lai and Varriano
Marston, (1980), and it is generally assumed that lipid components
are responsible for the rapid deterioration of pearl millet quality
Ether extractable lipids range from 3.0 to 7.4%, and they were
mostly in the germ and they are similar in composition to that of
sorghum (Hulse et al 1980). Various authors reported lipid content
ranging from 3.0 to 6.5% (Pruthi and Bhatia 1970; Burton et al
1972; Freeman and Bocan (1973), which was higher than that of
wheat, corn, rice or sorghum.
Badi and Monawar (1987) reported that millet grains
contained higher lipid content (5.1%) than that of sorghum and
wheat. Badi et al (1976) showed that the major components in the
non-polar free lipids of millet and sorghum were triglycerides.
-8 -
Pearl millet seed has been reported to contain about 4 to 5%
total oil, which is similar to that of corn and sorghum (Jellum and
Powell, 1971).
Obizoba and Atii (1994) reported a higher value for lipid
(about 11.1%) for the pearl millet whole seed. Also Abdalla (1996)
reported that the main value of ten pearl millet genotypes was 5.2%
with a range of 2.7 to 7.1%. A low value of only 0.57 to 0.90% lipid
from pearl millet grown in Kansas was reported by Lai and Varriano
Marston (1980). These different values for lipid content of millet
may be attributed to variation related to the types of millet cultivars
and the methods of lipid extraction.
2-4-2
Fatty acids composition of pearl millet :
Generally pearl millet oil tends to be richer in palmitic and
stearic acids and lower in oleic acid compared to sorghum oil
(Rooney 1978).
Jellum and powell (1971) reported a range in fatty acids
content of pearl millet lines of diverse origin as 20.2 to 30.6% oleic,
31.7 to 40.3% linoleic, 16.7 to 25.0% palmitic, 1.8 to 8.0% stearic
and 2.3 to 5.8% linolenic acid. In addition , they reported average
values of 0.64% and 0.55% for arachidic and palmitoleic acid
respectively.
Agarwal and Sinha (1964) showed that the millet grain oil was
composed mainly of oleic 53.84%, linoleic 34.88%, and palmitic
10.809% acids with small amounts of stearic 0.28% and myristic
-9 -
acid 0.20%. Morrison et al (1984) showed that the fatty acid
compositions of the total lipids in pearl millet were 55 to 63%, and
that palmitic acid ranged between 4% to 28% oleic, 29 to 46% and
linoleic 1 to 4%.
2-5 Comparative evaluation of the feeding value of different
cereal grains in poultry nutrition:
It has been well established that the nutritive value of cereal
grains depends on their chemical composition and nutrients content,
and the extent of digestibility, absorption and metabolism of these
nutrients and their utilization in the catabolic and anabolic body
processes.
2-5-1 The Chemical composition of maize, Millet, wheat and
sorghum:
The nutritive value of cereal grains depends on their chemical
composition with respect to their content of dry matter, crude
protein, carbohydrates, ether extract, minerals and vitamins. There
exists some variation in these constituents among the different types
of cereal grains, as well as among varieties within the same cereal
grain. Accordingly, some variation exists in the metabolizable
energy content, crude protein content and protein quality among the
different cereal grains and varieties.
In a study to compare the chemical composition of maize,
wheat and millet; Simhae et al., (1971) reported that the
metabolizable energy of millet was lower than that obtained for both
-10 -
maize and wheat. Crude protein of millet was higher than in wheat
or maize. The same author also reported that proximate analysis of
millet revealed that the moisture content was 11.73%, crude protein
9.56%, ash 3.4%, and the metabolizable energy was 12.11 MJ kg-1.
Results reported by Pokhriyal et al. (1977) showed that protein
content of pearl millet ranged from 11 to 14.7%, lysine and
therionine ranged from 2.56 to 3.46% and from 1.99 to 2.44 (g/16g
N), respectively, and glycine content was found to range from 2.15
to 3.16 (g/16g N). Fetuga (1977) reported that the metabolizable
energy and the metabolizable energy-corrected range were 12.73 –
14.82 and 12.06-14.32 MJ kg-1, respectively. Proximate analysis
showed that the dry matter content of pearl millet was 85.7, crude
protein 10.69% crude fibre 2.41%, ether extract 4.27% and ash
content was 2.87%. Sharma et al., (1979) showed that the chemical
composition of millet was 88.5% dry matter, 11.4% crude protein,
4.3% ether extract, 2.75% ash, calcium 0.32% phosphorous 0.39%
and available carbohydrate was 60.8%.In a study to compare the
chemical composition of millet, wheat and sorghum; Sharma et al.
(1979) reported that the crude protein content of wheat, millet and
sorghum were almost similar and higher than that of maize. Ether
extract content was lower for wheat and sorghum than for maize and
millet. In addition, maize was considerably lower in cellulose.
Available carbohydrate was almost similar in the three gains, but
was slightly lower in millet and sorghum.
Hulse et al. (1980) found that in all cereals, lysine was the
first-limiting amino acid, and protein quality of pearl millet is
-11 -
nutritionally superior to normal sorghum. The smaller seeds cereals
tended to be higher in protein content. Lysine content ranged from
71 to 212 (mg/g N) for sorghum and ranged from 109 to 297 for
pear-millet, and it tented to be higher in the embryo and in the
second fraction removed by abrasion milling. In all fractions of
sorghum and millet grains, proline and glutamine (mg/g N) were
inversely correlated with lysine. Hubbel (1980) reported that the
amino acid content of maize was 0.24% for lysine and 0.18% for
methionine. The protein content was 8.5%, calcium 0.01%, total
phosphorus
0.25%,
available
phosphorus
0.08%
and
the
metabolizable energy was 14.08 MJ kg-1. The protein content found
by Luis and Sullivan (1982) was 9.3% and the amino acids lysine
and methionine were 0.25% and 0.15% respectively. Hualn and
Proudfoot (1985) reported that untreated wheat bran contained lysine
4.26, methionine 1.45, threonine 3.29 and cystine 2.00 g/16g N.
In a study to evaluate the nutritional value of high-protein
genotype of pearl-millet, Singh et al., (1987) found that the protein
content of high-protein lines was greater by nearly 60% and starch
and soluble sugars together were 40% lower. The fat content was
lower by about 20% and the ash value of the high-protein lines was
slightly lower than the low-protein lines. Crude fibre and dietary
fibre were slightly higher in high-protein lines. The mineral content,
mainly Ca, Mn, Fe and Zn of high-protein lines were similar to
normal cultivars. They also observed that pearl-millet of highprotein linens contained a considerable amount of hemicellulose and
non-protein nitrogen. The authors also found that lysine de-creased
-12 -
by 15% in high-protein lines compared to an approximately 50%
increase in their protein content and there were no marked
differences in the content of other amino acids. Whole wheat grain
contained 3.1 g kg-1 lysine and 2.1 g kg-1 methionine. The crude
protein was found to be 104 g kg-1 and the energy value was 12.2 kg1
(McDonald et al., 1987).
2-5-2. The nutritive value of maize, millet and wheat in broiler
diets:
In a study to compare the effect of maize, wheat and millet as
major sources of energy on broiler performance, Simhae et al.
(1971) found that chicks fed 600 g/kg-1 millet showed significant
higher feed conversion ratio, but body weight did not differ
significantly. The amino acid profile, weight gain and efficiency of
feed utilization were found to be favorable for pear millet as
compared to sorghum grain (Sanford et al., 1973). They also
observed that when millet and sorghum were fed to broiler chicks
the former was superior to the latter in the rate of body weight gain
and feed conversion efficiency.
Ayyaluswami et al. (1976) reported that feed intake appeared
to be more in chicks fed millet than those fed maize, and that the
body weight of the chicks at the end of 8 weeks did not differ
significantly.
In an experiment of Singh and Barsaul (1976), which was
conducted to replace maize by barley, sorghum and pearl millet in
the grower diet of white Leghorn and Rhode Island Red birds, the
-13 -
body weight gain in both breeds was the same on all the four
different cereals diets, but the chicks fed pearl millet tended to be
heavier and the feed conversion ratio was better in pearl millet, but
without showing significant differences. In another study, Yeong
and Syed Ali (1976) reported that there was a trend showing that the
chicken fed diets containing high levels of millet consumed more
feed than those fed on high maize diets, but the maize based diets
tended to be better in feed efficiency. Singh and Barsaul (1977) also
found that feeding millet with inclusion rate of 400 g kg-1 instead of
maize had the best-feed efficiency ratio.
Fetuga (1977) studied the efficiency of utilization of
metabolizable energy of some cereals and cereals-by-products. He
reported that body weight gain and feed efficiency utilization clearly
followed the trends of metabolizable energy values of the cereals
and their by products. The metabolizable energy being best in low
fibre cereals and worse with increasing fibre content. In a study of
utilization of different cereals in broiler diets, Sharma et al. (1979)
found that a lower rate of millet inclusion significantly supported
higher weight gain than did wheat and sorghum, and there were no
significant differences between weight gain supported by millet and
maize. In higher inclusion rates, feeding millet resulted in significant
improvement in broiler performance.
In a study to assess the nutritive value of high-lysine maize in
the diets of broilers, Gous and Gevers (1982) observed that broilers
fed on diets with yellow maize meal, white high-lysine maize meal,
or yellow high-lysine maize meal, showed no significant differences
-14 -
among the dietary treatments in weight gain or feed intake, but
performance was better with high-lysine maize (particularly the
white variety) than with normal maize.
Dexmair et al. (1982) gave meat chicks diets based on maize
supplying metabolizable energy (ME) 12.13 to 13.39 MJ kg-1, and
crude protein content at 17 to 23.5% during the periods 1 to 28, 29 to
49 and 50 to 56 days. They found that the best performance was that
attained with dietary ME content of 12.55, 12.97 and 13.39 MJ kg-1,
and crude protein content of 23.5, 19.0 and 17.0% during the three
periods, respectively. When two periods were used, the best
performance was attained with ME of 12.97 MJ kg-1 and 22%
proteins given from 1 to 28 days and ME of 13.39 MJ kg-1 and 19%
protein given from 29 to 50 days.
Mazanowski et al. (1982) reported that partial or total
replacement of ground maize with ground wheat and a fat
preparation did not significantly depress live weight gain. Abate and
Gomez (1983) found that over 8-weeks experimental period diets
containing pearl millet gave significantly higher weight gain than
those containing finger millet.
An experiment was conducted to by Paliwal et al (1983) to
assess the nutritive value of maize as a broiler feed. The workers
found that broiler chicks, -initially 15 days old, fed on a control diet
based on 45% maize, or test diets in which one-third, two-thirds or
all of the maize was replaced by hominy feed, gave mean body
weight gain of 1.466, 1.386, 1.463 and 1.328 kg, respectively, and
-15 -
feed efficiency rate 2.64, 2.93, 3.21 and 3.62 g/g body weight gain,
respectively.
Mukhtar et al. (1985) reported that broiler chicks fed on diets
based on maize and rice polishing with 0, 10, 20, 30 or 40% soybean
oil meal for 8 weeks, showed the following average total body
weight gains; 1847, 1866, 1977, 2098 and 2142g, respectively. Feed
intake was 2.46, 2.40, 2.38, 2.32 and 2.31 kg/kg gain for the same
meal percentages, respectively.
Mehta et al. (1985) studied the effect of replacement of maize
grain by grain sorghum; the diet used was based on maize 60% with
groundnut oil meal, wheat bran, fish meal and minerals, or with
sorghum 20, 30 or 40% of diet replacing an equal weight of maize.
Diets crude protein was 19.1 to 19.9% by analysis, and
metabolizable energy 11.75 to 11.98 MJ kg-1 by calculation. They
found no significant differences among the final average body
weight gain, feed intake on feed conversion ratio. It was concluded
that up to 66% of the maize in the diet could be replaced with
sorghum grain without affecting body weight gain, feed intake or
feed efficiency.
Park et al. (1985) carried out an experiment to evaluate the
effect of replacing maize with sorghum on the diets of growing
chickens, form three days old to 20 weeks. The basal diet used was
60% maize or 15, 30, 45 or 60% sorghum replacing maize. body
weight gains were 1513, 1430, 1420, 1419 and 1429 g, feed
consumption was 7767, 7674, 7730, 7612 and 7441 g, and feed
-16 -
efficiency was 5.14, 5.37, 5.45, 5.35 and 5.22 g/g gain, respectively.
There were no significant differences due to diet in utilization of dry
matter, protein, fat and carbohydrate. It was concluded that sorghum
grain could partially or completely replace maize in the diets of
chickens.
Bougon et al. (1985) studied the effect of feeding broiler
chicks on wheat. Commercial crossbred chickens of both sexes had
growing and finishing diets, containing theoretically 12.89 and 13.35
MJ metabolizable energy per kg and 21.9% and 20.0% protein. Diets
were based on maize or wheat plus 2.5% Soya oil. All the diets had
5% to 6% tallow. With wheat, final live weight and feed conversion
efficiency were 2221 and 1982 g, compared with 2197 and 2020 g
for maize. Carcass yield was not increased significantly. Abdominal
fat as percentage of live weight and proportion of dry matter in
carcass were the same with both feeds. Abdominal fat reached 80 g
in both trials.
Rajni et al. (1986) found that replacing maize with sorghum,
finger-millet, and pearl-millet at a level of 375 kg-1 resulted in no
significant differences in body weight at 56 days old, but there was
an improvement in weight gain of broilers when maize in the control
diet was completely replaced by finger-millet or pearl-millet at 8
weeks of age.
Mohamedain et al. (1986) in a local study in Sudan reported
that feed intake was high in maize-based diet, low in sorghum, diets
and intermediate in millet diets; and there was no significant
-17 -
differences among the three diets used. They also found that birds
reared on the sorghum-based diet showed significantly lower live
weight and final body weight than those fed either millet or maize,
and a significant reduction in dressing out percentage was observed
in the birds maintained on sorghum diet compared to those fed millet
or maize diets.
2-6 Anti nutritional factors in pearl millet:
Reichert (1979) reported that the pH-sensitive pigments in
pearl millet are important from a nutritional point of view. Pearl
millet seeds of many cultivars are dark grey or yellow in color, and
this pigmentation is markedly reduced by the traditional rapid
absorption of acid; and without dehulling whitening of the seed
requires up to 25 hours, because the acid is only absorbed through
all areas of the seed around the embryo. The major pH-sensitive
pigments in pearl millet were found to be flavonoids. Glucosyvitexin was the major C-glycosyflavonoid reported by Reichert
(1979). Hulse et al. (1980) reported that defatted millet flour was
methanol extracted, when dissolved in water/acetic acid (85:15) and
T-butanol acetic acid/H2O (3:1:1); the methanol extraction removed
the dark grey pigment, which was mainly situated in the peripheral
region of the seed. The methanol extract was sensitive to pH and the
major compounds and their relative proportions responsible for this
pH-sensitivity are known as C-glycosyflavonoids. The same workers
reported that the methanol extracted flour contained phenolic acids,
which were released only by alkaline hydrolysis. The major alkali-18 -
labile phenolic acid was identified as ferulic acid. Concentrations of
total C-glycosyflavonoids and alkali-labile ferulic acid are present
mainly in the peripheral endosperm regions. By calculation, the
periphery of the seed comprising 10% of the kernel contains
approximately 580mg/100g C-glycosyflavonoids. Gaitan et al.
(1989) found that C-glyosyflavones comprised a high proportion
(0.1%) of the total weight of whole millet grain, and the fractions of
millet prepared by the progressive dehulling procedure displayed
progressively lower concentrations of C-glycosyflavones, so that the
bran fraction 1 contained the highest and the flour fraction 4
contained the lowest C-goycosyflaveone concentration.
2-6-1 Anti thyroid and goitrogenic effect of millet:
Osman and Fatah (1981) reported that goiter was more
prevailent in rural areas of Darfur states in the Sudan whereas much
as 74% of dietary energy is derived from millet, than in urban areas
where millet provided only 37% of the calories. Compared to
thyroids of rats fed a diet rich in sorghum, those fed a diet rich in
millet had a larger thyroid gland and the gland tended to be
hyperplasic (Osman 1981). Similar results were obtained by Eltom
et al. (1984) and Eltom (1985). These findings were in line with
results of Klopfenstein et al. (1983) who reported that animal fed
pearl millet do not grow after the second week, and the millet
deficient rations were highly correlated with higher weight gain. The
histological changes were quite apparent in thyroids of groups fed
-19 -
pearl millet. Thyroxin (T4) concentration was lower and triiodothyronine (T3) was higher in pearl millet fed rats.
Gaitan et al. (1989) reported that feeding pearl millet to rats
caused a significant reduction in body weight gain, together with a
reduction in tri-iodothyronine hormone (T3) concentration and
thyroxin (T4) concentration. The data indicated that pearl millet is
particulary rich in flavonoids which are known to have intrinsic
antithyroid activity, and that C-glycosyflavones are the active
antithyroid agent in pearl millet. The antithyroid activity increased
as the content of pearl millet from C-glycosyflavones was increased.
A recent study using broiler chicks by Elzubeir et al. (1993)
indicated that the body weight gain decreased and the thyroids
weight increased as the dietary graded level of millet was increased.
2-7 Cereal milling by-products:
2-7-1 Hominy Chop or Hominy Feed:
This is the by-product of the manufacture of maize. It is a
mixture of maize bran, maize germ and parts of the kennels. It is
slightly lower in energy than maize but is higher in protein and fibre
( Anthouy J. Smith, 1990).
2-7-2 Cereal brans:
Maize bran consists of the outer coating of the maize kernel. It
contains 15% crude fibre and is low in metabolizable energy. It is
not a suitable ingredient for inclusion in the diet of high producing
broilers or laying hens. ( Anthouy J. Smith, 1990.).
-20 -
Wheat bran consists almost entirely of the coarse outer coating
of the wheat kernel. It contains about 10% crude fibre, which limits
its nutritive value for poultry, but the protein of the bran is of a
better quality than that of wheat or maize grains.
Rice bran is a by-product arising from the milling of rice. It is
high in crude fibre and also in oil. The latter constituent may cause
problems of rancidity in feed during storage. It probably should not
be added to poultry diets at levels above 20% of the total ration.
(Anthouy J. Smith, 1990).
2-7-3 Wheat Pollard or Middling:
This feed consists of fine wheat bran mixed in varying
proportion with wheat meal. A good quality pollard should consist
of 50% bran and 50% wheat meal. It is appreciably more digestible
than wheat bran and has lower fibre content and a relatively high
protein content of 14-16% (Anthouy J.Smith, 1990).
-21 -
CHAPTER THREE
3- MATERIALS AND METHODS
The present experiment was carried out in the poultry
experimental house of the poultry unit in the Faculty of Animal
Production, University of Khartoum; during the period from
September to October 2005.
3-1 Processing of canfut, a by-product of millet milling:
In Darfur area, millet is widely grown and used as human
staple food after husking. The resulting bran with small and broken
grains (canfut) is produced as a by-product of
millet
processing.canfut was purchased from Darfur district, and used for
poultry feeding in the present experiment. Samples were taken and
analyzed for chemical composition and amino acid content.
3-2 Experimental Birds:
Two hundred day-old unsexed commercial broiler chicks
(Ross 308) were obtained from Kohia Poultry Company in Egypt.
On arrival, all the chicks were inspected for health and vigour, and
fed a basal diet for 3 days as adaptation period. Thereafter; one
hundred and fifty healthy chicks were selected, weighed and
randomly distributed into 15 experimental pens, of ten chicks each.
The mean initial weight of the chicks in all pens was approximately
equal. Five experimental diets were formulated and assigned
randomly to the experimental pens, with three replicates for each
diet in a completely randomized design arrangement.
-22 -
3-3 Experimental Diets:Five experimental diets were formulated from local poultry
feed ingredients, containing different levels of millet's by-product
(canfut) at the rate of 0%, 5%, 10%, 15% and 20%. The formulation
of the experimental diets is shown in table (1). The diets were
formulated from the common local poultry feed ingredients, and
were adjusted to meet the NRC (1994) nutrients requirements for
broiler chicks. The calculated analysis of the experimental diets is
shown in table (2). The calculated analysis was based on analytical
data of Sudanese feeds performed by the Central Animal Nutrition
Laboratory-at Kuku (1999) ,while the metabolizable energy values
were determined according to the formula derived by lodhi et al
(1976) .
-Lodhi formula was as follows:
ME kcal/kg = 1.549+0.102CP%+0.0275EE%+0.0148NFE%0.0034CF%.
The chemical analysis of millet's by-product (canfut) was
determined according to the method of A.O.A.C ( 1995) , and its
amino acid analysis was determined in the Central laboratory of the
Ministry of Science and Technology using spectrophotometer
(Sykam Amino acid Analyzer ).The amino acid analysis procedure
was as follows :
200 mg of canfut was weighed in a hydrolysis tube to prepare
hydrolysate sample. 5ml of 6NHcl were added and the tube was
-23 -
Table (1):The formulation of the experimental diets (%)
Ingredients(percent)
Control
Diet (2)
Diet (3)
Diet (4)
Diet (5)
diet (1)
%
%
%
%
62.44
57.13
51.45
46.01
40.00
0
5
10
15
20
Groundnut meal
19.7
19.7
19.7
20.1
20.1
Sesame seed meal
9.57
9.7
9.66
9.27
9.45
Super concentrate*
5
5
5
5
5
Dicalcum phosphate
0.94
0.92
0.92
0. 79
0. 80
Common salt
0.25
0.25
0.25
0.25
0.25
Vegetable Oil
0.60
0.70
1.2
1.78
2.50
Sorghum
Canfut
2
Lysine
1.1
1.1
1.2
1.2
1.3
Methionine
0.4
0.5
0.6
0.6
0.6
Total
100
100
100
100
100
* The chemical composition of the commercial super concentrate used in
this study are (Crude protein 40%; crude fat 2.0%; crude fibre 2.0%;
calcium 10.0%; phosphorus (avail) 4.0%; lysine 12.0%; methionine 3.0%
Meth.+ cystine 3.2%; ME 2100 Kcal/kg, and Sodium 2.60%). It is the
product of Wafi Company.
-24 -
Table (2): Calculated chemical composition of the experimental
diets (%).
Item
NRC
(1994)
Metabolizable
3200
Experimental Diets
1
2
3293.2 3298.1
3
4
3303.7 3304.8
5
3313.5
energy
(kcal\kg)
Crude protein
21.5
22.9
23.0
22.5
22.6
22.9
Lysine %
1.1
1.1
1.0
1.1
1.0
1.2
Methionine %
0.5
0.5
0.5
0.4
0.4
0.5
Calcium %
1.0
1.0
1.1
1.1
1.2
1.2
Av.
0.40
0.30
0.35
0.40
0.45
0.46
(N% × 6.25)
Phosphorus%
-25 -
tightly closed. The sample was incubated for 24 hours at 110oC. The
sample was allowed to cool and 125 mm filter paper was then used
to filter the hydrolysate .
200 ul of the filtrate was taken into another tube and was evaporated
at 140oC ovens for about 1 hour. 1 ml of diluting buffer was then
added to the dried sample and transferred to amino acid analyzer
vial, and then injected for analysis. After the separation of the
injected sample with a temperated cation separation column,
ninhydrine is added continuously to the system. An integrated
reagent dosing pump is responsible for the delivery of this reagent,
while an external buffer pump is delivering the eluent. After the
adding of ninhydrine, the eluent is lead through a high temperature
reactor coil of about 16 m length. With a typical flow rate of 0.7
ml/min the buffer ninhydrine mixture stays in the heated reactor for
about 2 min. During this time the mixture is heated to 130o C to
accelerate the chemical reaction.
The reaction products of the primary amino acids have a
maximum absorption at 570 nm, while the secondary amino acids
have their maximum at 440 nm. After the reaction the mixture is
lead through a dual- channel photometer where both wavelengths
(570 nm and 440 nm) are measured continuously.(Central
Laboratory- Ministry of Science and Technology- Soba- Sudan ).
3-4 Housing and Equipments:
-26 -
The experiment was conduced in an open-sided house, the
long axis of which was situated in an east-west direction to ease
ventilation and avoid solar radiation. The open-sided house was
divided into 15 small pens of 1m2 floor area, each. The house was
constructed of iron posts, corrugated zinc roofing, wire nettings
sides and packed bricks floor. Before the commencement of the
experiment the house was thoroughly cleaned and disinfected with
formalin. Each pen was provided with a clean disinfected tube feeder
and a fountain drinker. Dry wood shavings was used as a litter
material. Light was provided for 24 hours, in the form of natural day
light supplemented with an artificial light in the night. A (60) watt
electric bulb was used in each two adjacent pens.
3-5 Management and data collection:All the birds were vaccinated against New Castle disease (ND)
and Infectious Bronchitis disease (IB) at 5 days of age, using clone
30+IB strain. At 14 days of age, the birds were vaccinated against
Gumboro disease using D78 strain. When 21 days old, the birds
were vaccinated against New Castle disease using clone 30 strain in
drinking water. Feed intake, live body weight, were recorded
weekly.
The experiment continued for six weeks. The average
minimums and maximum daily temperature during the experimental
period is presented in appendix table (1) showing a minimum 26oC
and a maximum 41.6oC. At the end of the experiment, all the birds
-27 -
were fasted over night to empty their digestive tract, but allowed
water, before slaughter.
One bird was selected at random from each pen and used for
carcass analyses. Each of the selected birds was slaughtered and
allowed to bleed. Then, the birds were scalded using hot water, hand
plucked, washed and left to drain.The head and legs from the hock
joints were removed. The hot carcasses were weighed individually.
Dressing percentage was calculated by expressing the hot weight of
the dressed carcass to its live weight as percent.
The abdomen was opened and the caeca, duodenum, small and
large intestines were dissected and their lengths were measured. The
liver, heart and gizzard were also dissected and their weight was
determined.
3-6 Experimental design and statistical analysis:
A completely randomized design was used in this experiment.
The collected data was subjected to analysis of variance (ANOVA).
according to Steel and Torrire (1960). Differences between treatment
means were assessed for statistical significance using Duncanss new
multiple range test (Duncan 1955).
-28 -
CHAPTER FOUR
4- RESULTS
The proximate analysis of canfut samples is presented in table
(3) showing that dry matter content is 96%, crude protein 10.1%,
crude fibre 2.4%, ash 2.0%, and NFE 78.1%. The metabolizable
energy value is 2835 Kcal/ kg., calculated according Lodli et al
(1976). The amino acid analysis of canfut is presented in table (4)
together with that of other common grain brans .It can be seen that,
compared to some other grain brans (wheat and rice), millet
processing by-product (canfut) has higher DM percentage, and ME
content, while protein, amino acids and crude fibre contents are
much lower than in the other brans, (Table 4)
The performance of the experimental birds on the different
experimental treatments is summarized in table (5). The data present
the total mean feed intake, live body weight gain and the feed
conversion ratio over the six weeks experimental period. The weekly
values of these parameters, for each of the six weeks of the
experimental period, are shown in tables (6-7-8). The data on the
carcass parameters, namely length of duodnenum and the large and
small intestines, Length of Caeca, liver weight, heart weight, gizzard
weight, and dressing percentage, is summarized in table (9).
It can be seen in table (5) that, the dietary treatments have
significant effects on total mean feed intake (P< 0.05). The
-29 -
experimental birds fed on the diet containing 15% canfut (diet 4)
consumed significantly more feed than the birds on the other
experimental diets. A general trend in feed intake is also noticeable
showing that the highest feed intake (3586.7 g/bird) was attained by
the group of birds fed on the diet containing 15% canfut (diet 4),
followed by the group of birds fed on the diet containing 20% canfut
(diet 5) (3500.7g/bird), and the lowest total feed intake was attained
by the chicks fed on the control diet (0%canfut)
-30 -
Table (3): Proximate analysis of canfut (percent)
Constituents
%
Dry matter
96.0
Crude protein
10.1
Crude fibre
2.4
Ether extract
3.4
Ash
2.0
Nitrogen-free extract (NFE)
78.1
2835Kcal/Kg
ME
Metabolizable Energy (ME) values are calculated according to
Lodhi et al., 1976.
-31 -
Table (4) Nutrient composition of canfut compared to rice and wheat
brans
Nutrients(percent)
Dry matter
Protein
Crude Fibre
ME Kcal/Kg
Arginine
Lysine
Histidine
Leucine
Isoleucine
Valine
Methionine
Threonine
Tryptophane
Phenylalanine
Rice Bran
Wheat Bran
91.0%
12.9%
11.4%
1630
0.89%
0.59%
0.33%
0.90%
0.52%
0.75%
0.20%
0.48%
0.15%
0.58%
90.0%
15.7%
11.0%
1300
0.98%
0.59%
0.34%
0.91%
0.59%
0.73%
0.17%
0.42%
0.30%
0.49%
-32 -
Millet
Processing Byproduct
96.0%
10.1%
2.4%
2835
0.34%
0.25%
0.20%
0.49%
0.25%
0.35%
0.09%
0.20%
0.25%
Table (5): The overall performance of the experimental birds
during 0-6 weeks of age (g/bird/6 weeks).
Experimental
parameters
Experimental Diets (Treatments)
Control
5%
10%
15%
20%
1
Total feed
intake (g/birds)
3245.3b
2
3
3435.2ab 3395.2ab
SEM
4
5
3586.7a
3500.7ab
99.25*
Live body
weight gain
1637.7
1720.3
1657.5
1695.0
1651.0
44.95NS
1.98
2.00
2.05
2.12
2.12
0.07 NS
0
0
0
0
0
-
(g/bird)
Feed conversion
ratio (g feed/g
weight gain.
Mortality %
Note: from this table on:
- Values are means/treatment/ 6 weeks.
- Means in the same row with different letters are statistically
significant.
* Statistically significant (P<0.05).
- N.S = Not statistically significant.
- SEM = Standard error of the means
-33 -
The weekly feed intake data, (Table 6) indicate more or less
the same pattern of the total feed intake. Significant differences in
weekly feed intake were apparent only during the 2nd and 5th weeks
of the experimental period. During these weeks, the diets with 0%
canfut (diet 1), and 15% canfut diet (4) showed significant increases
in mean weekly feed intake over that of the other experimental diets.
The weekly feed intake during each of the 1st, 3rd, 4th and 6th weeks
of the experimental period did not show any significant differences
among the experimental treatments.
It can also be seen that, the dietary treatments had no significant
effects on total body weight gain of the experimental birds, (Table
5). The highest body weight gain (1720.3 g/bird) was achieved by
the birds fed on diet (2) (5% canfut) while the lowest live weight
(1637.6g/bird) was obtained by the birds fed on the (0% canfut), diet
(1).
The data on the weekly live weight gain of the experimental
birds, as presented in table (7), show variations in the weekly live
weight gain, but the dietary treatments had no significant effects on
this parameter .
-34 -
Table (6): Weekly mean feed intake of the experimental birds
(g/bird/week).
Treatments
Weeks
of Age
1
2
3
4
5
SEM
1
195.8
192.5
197.5
197.8
196.9
2.3 NS
2
454.1a
397.5c
414.1ab
443.0ab
429.7ab
8.8*
3
545.1
586.6
558.3
604.1
582.5
28.5 NS
4
680.8
710.0
707.7
720.0
719.1
13.0 NS
5
651.6c
766.6ab
710.0bc
826.3a
770.0ab
31.3*
6
717.6
781.8
807.5
795.3
802.5
46.0 NS
- Values are means/treatment/ week.
- Means in the same row with different letters are statistically
significant.
- NS = Not statistically significant
- *
= Statistically significant (P < 0.05).
- SEM = Standard error of Means
-35 -
Table(7):Weekly mean live body weight gain of the experimental
birds (g/bird/week).
Weeks
Treatments
of Age
1
2
3
4
5
SEM
1
121.0
129.1
126.6
131.6
120.0
5.4NS
2
258.3
283.3
270.8
266.6
251.6
17.3 NS
3
287.6
328.1
332.5
330.0
321.6
20.3 NS
4
370.0
361.0
345.8
368.0
361.0
9.1 NS
5
306.6
278.3
289.3
282.0
296.6
11.3 NS
6
295.0
340.3
292.3
316.6
300.0
20.2 NS
- Values are means/treatment/ week.
- Means in the same row with different letters are statistically
significant.
- NS = Not statistically significant
- SEM = Standard error of means
-36 -
The data on the mean feed conversion ratio, did not show
significant differences amang the dietary treatments (Table 5).
The best feed conversion ratio (1.98) was obtained by the group
of birds fed on the control ration (diet 1). The birds fed on the
diets with 15% and 20% canfut (diet 4 and 5) had the highest feed
conversion ratio (2.12). The data on the mean weekly feed
conversion ratio, presented in table (8) show that, the dietary
treatments had significant effects (P.<0.05) on the weekly feed
conversion ratio during the 2nd and 5th weeks of experimental
period.
The results of carcass parameters are summarized in Table( 9).
It can be seen that the dietary treatments had no significant effects
on these parameters, except for the mean gizzard weight. The
highest mean gizzard weight (36.73g/bird) was obtained by the
birds fed on the diet containing 15% canfut, while the lowest
mean gizzard weight (29.30 g/bird) was obtained by the birds fed
on the control diet with (0%) canfut.
Table (10) shows the feeding cost of the experimental birds on
the different diets. It can be seen that the birds receiving the 5% ,
10% , 15% and 20% dietary canfut had lower cost of total feed
consumed and had gained high financial benefits compared to the
birds fed the control diet .
-37 -
Table (8):
Weekly mean feed conversion ratio of the experimental birds
(g feed intake: g body weight gain)
Weeks
Treatments
of Age
1
2
3
4
5
SEM
1
1.6
1.4
1.5
1.5
1.69
0.1 NS
2
1.4b
1.4b
1.5ab
1.6ab
1.7a
0.1 *
3
1.9
1.8
1.6
1.8
1.8
0.2 NS
4
1.8
1.9
2.0
1.9
2.0
0.2 NS
5
2.1b
2.7a
2.4ab
2.9a
2.5ab
0.1 *
6
2.4
2.3
2.7
2.5
2.6
0.2 NS
- Values are means/treatment/ week.
- Means in the same row with different letters are statistically
significant.
- NS = Not statistically significant
- *
= Statistically significant (P < 0.05).
SEM = Standard error of means
-38 -
Table (9):
Summary table of the carcass parameters of the experimental birds
(g/bird/6week)
Carcass
Experimental Diets (Treatments)
parameters
1
2
3
4
5
SEM
160.0
188.6
177.0
172.0
155.3
12.2 NS
18.0
18.6
20.6
20.6
18.1
1.1 NS
34.7
37.9
34.367
37.4
35.6
2.9 NS
8.2
8.3
8.9
8.8
8.6
0.6 NS
29.3b
32.1ab
36.3 a
36.7 a
31.5ab
1.9 *
76.0
75.0
73.3
75.6
73.6
1.5 NS
(CM)
Length of
duodnenum +
L & S intestine
Length of
Caeca (cm)
Liver weight
(g/bird)
Heart weight
(g/bird)
Gizzard weight
(g/bird)
Dressing
percentage %)
- Values are means/treatment/ 6 weeks.
- Means in the same row with different letters are statistically
significant.
- NS = Not statistically significant
- *
= Statistically significant (P < 0.05).
- SEM = Standard error of means
-39 -
Table (10): Feeding cost of the experimental birds.
Items
Total feed consumed
Experimental diets
1
2
3
4
5
3.245
3.435 3.395 3.587 3.501
0.850
0.803 0.756 0.709 0.661
1.683
1.514 1.547 1.575 1.401
1.638
1.720 1.658 1.690 1.651
2.758
2.605 2.566 2.534 2.314
(kg/birds)
Price of kg feed (SDG)
Feed Cost per Kg body
weight gain(SDG)
Final live weight gain
(kg/bird/ 6 weeks)
Cost of total Feed
consumed(Kg)
-40 -
CHAPTER FIVE
5- DISCUSSION
The present study was conducted to investigate the feeding value
of canfut ( millet processing by-product ) as a source of energy on
broiler chicks performance, and to assess its economical value
compared with other cereal grains. The diets employed in the
experiment were based on different levels of canfut (0%, 5%,10%,
15%, 20%) replacing in a basal diet.
The data in (table 4) revealed that the dry matter of canfut was
higher than that of wheat and rice brans (NRC 1984, Central
laboratory- Ministry of Science and Technology 2008).
The Crude protein content of canfut was lower than that of
wheat bran and rice bran (NRC 1984), while the metabolizable
energy content of canfut was higher.
The fibre content of canfut was lower than that of wheat bran
and rice bran obtained by NRC (1984) and Anthouy J. Smith (1990);
Central Laboratory – Ministry of Science.
Comparing the three cereals milling by- products, the dry
matter content of canfut was the highest followed by that of rice
bran, then wheat bran (table 4). The crude protein content was
highest for wheat bran followed by rice bran and finally canfut. The
fibre content of wheat bran was highest than that of rice bran and
finally of canfut The metabolizable energy was highest for canfut
followed by rice bran, then wheat bran . The results of this analysis
study are in line with Fetuga’s report (1977) who found that the
-41 -
metabolizable energy being best in low fibre cereals and worse with
increasing fibre content.
Comparing the three cereals milling by- products, most amino
acids are lower in canfut (table 4) .The lower crude protein content
of canfut may be the reason for its low amino acid composition
compared with the two cereals milling by- products. This finding is
in general agreement with reports of Singh et al. (1987),who
observed that lysine de-creased by 15% in high-protein lines
compared to an approximately 50% increase in their protein content.
In the present study, feed intake was increased with increased
level of dietary canfut up to 15% and this result may be due to
adaptability of digestive tract of the birds to consume more
quantities of canfut, or it may reflect the fact that canfut has a
positive effect on feed intake when it is increased in the diet . This
is in agreement with the results obtained by Mohamedain et al.
(1986) when they noted that feed intake was high in maize-based
diet, low in sorghum and intermediate in millet based diets.
Addition of canfut had significant effects on gizzard weight of
the experimental birds due to increased fibre content in the diet.
Similar result was reported by T.Gidenne (1992), who observed that
high- fibre diet resulted in a higher digestive value for colon and
caecum, related to an improved degradation of cell wall.
Furthermore, digestive efficiency in the small intestine appeared
higher to a high- fibre diet than that for birds initially fed on a lowfibre diet .
The result of the experiment showed no significant differences
between treatments in live weight gain and feed conversion ratio
-42 -
among the experimental birds. Similar results were reported by
Fetuga (1977), who studied the metabolizable energy of some
cereals and cereal by- products. He reported that body weight gain
and feed efficiency ratio clearly followed the trends of dietary
Metabolizable energy values. The Metabolizable energy being best
in low fibre cereals and worsen with increasing fibre content.
Although the weight gain resulting from canfut diets was higher than
that of the control diet, it can be considered as an important
substitute of sorghum diets as it is a less expensive source of feed
energy for broilers .Research efforts are greatly required to explore
alternative sources of energy and promote their effective utilization
in poultry feeding. Such a development is strategically important for
supporting the expansion of the poultry industry in the country, and
for sparing cereal grains for human consumption in the face of the
increasing rate of population growth.
-43 -
CONCLUSION AND RECOMMENDATION
The Results of this study indicated that:
1-
There was a significant increase in feed intake as the
quantity of canfut was increased up to 15% in the ration .
2-
The dietary levels of canfut had no significant effect on
body weight gain or feed conversion ratio.
3-
Canfut in broiler chick diets can decrease the total cost of
feeding and hence reduce production cost, while keeping
the optimum performance of broiler chicks.
4-
Further Research work is necessary to assess the nutritive
value of canfut for monogastric animals, in view of its
relatively cheaper cost and availability, and to determine
the optimum quantities to be added in broilers chicks diets
without sacrificing economical performance.
-44 -
REFERENCES
Abate, A. N. and Gomez, M. (1983) Substitution of finger millet (Eleusine
coracana) and bulrush millet (Pennisetum typhoides) for maize
broiler feeds. Anim. Feed Science. Technal. 10:291-299.
AbdeHrazig, S.M.(1997) “Nutritional value of pearl millet in laying hen
diets”. M.Sc. thesis. University of Khartoum – Sudan.
Abdella, A.A. (1996). The effect of "Traditional processing on the nutritive
value of pearl millet" M.Sc. Thesis, University of Khartoum- Sudan
Abdella,A.A.,Eltainy,A.H.,Mohamed,B.E.andAbdella,A.H.(1998)“Proximate
composition, starch,phytate and mineral contents of 10 pearl millet
genotype”. Food chemistry, vol. 63.No.2.pp.243-246.
Agarwal ,P.N. and Sinha ,N. S. (1954). “Chemical composition of oils from
feed of Pennisteum typhoium.”
ALhage, M.A.(1999) “ Effect of fermentation and dehulling on nutritive
value and the vitvo protein digestibility of pearl millet” – M.Sc. thesis
University of Khartoum – Sudan.
Almeida – Domingues, H.D. Serra – Saldiva, S.O., Gomezma – Chado, M.
H., and Ronney, L.W. (1990). “ Production and Nutrition Value of
Weaning Foods From Mixtures of Pearl Millet and Compees”. Cereal
Chem. 70:14-18.
Anthouy J. Smith (1990), Centre for Tropical Veterinary Medicine.
University of Edinburgh 109-110.
A.O.A.C. (1980). Official methods of analysis , 10th ed .Association of
official analytial chemists , Washington,D.C.
Ayyaluswami, O, Jaagnathan, V. S. (1976). "Studies on maize, Ragi and
Cowding in chick Mash". Indian Vet. J. 44: 331-335.
-45 -
Badi, S.M., Hoseney, R.C. and Casady, A.J.(1976). “Pearl Millet, 1.
Characteristic by SEM, amino acid analysis, Lipid Composition and
Prolamine Solubility” Cereal Chem . 53:478-487.
Basaly , A. Y. (1996) “Nutritional and Chemical Evaluation of Pearl Millet
Grains”.(Pennsiteum typhoids stapf and Hubbard ,Poaceae )grown in
the Gizan area of Saudi Arabia.
Badi, S.M.and Monawar, L.Y.(1987). “ Sudanese Sorghum and Millet
Director”, paper in Food Research Center – Shambat –Sudan.
Bor , N. L. (1960). “The Crasses of Burma Ceylon , India and Pakistan .”
Oxford Pergamon.
Bougon, M.; L Hospitalier, R.; Protais, J. (1985). Effect of wheat on the
performance and body composition of chickens. Bulletin of d'
information, station experimental d' Aviculture d' Ploufragon, 25(2)
55-58, cited by Nutr. Abst. And Revieus. Vol 56.
BrunKeen, J.N., Dewett, J. M. J. and Harlan, J. R., (1977). The morphology
and domestication of pearl millet. Ecom. Bot. 31: 163-174.
Burton, G.W., Wallance, A.T.and Radic, K.O.O (1972). “ Chamical
composition and nutritive value of pearl Millet[ (Pennisetiem
typhoidium ) Burm stap and C.E. Htubbard ] grain . Crop Sci.
:12:187 -188.
Dewett, J. M. J., (1986) Pearl millet (P. glaucum) in Africa and India, Proc.
Int. Pearl millet workshop. 7-11 April, ICHRSAT, India P.3.
Dexmair, A.; Spiridin, G. ; Inculet, e.; Cheorghiev, M.; Vison, 1.; Popescu,
A .(1982). Graded feeding during the growth phase of meat Chickens.
2. Effect of energy. Protein ratio on the Perfrmance of meat chickens.
Lucrari Stintifice, instituful Agronomic “ Nicolae Balcescu”, D.25,
53-58. cited by : Nutr. Abst. And Reviews. Vol 53.
-46 -
Dirar, Hamid A.(1993) “ the Indigenous Fermented Foods of the Sudan A
study in African Food and Nutrition” Faculty of Agriculture
University of Khartoum - Sudan
Duncan,D.B.(1955) .“Multiple range and multiple F tests” Biometrics
11:1955.
Eljack, Ekpechi B. H. (1993). Nutritive value of Two cultivators of millet for
broiler chicks.
Eltom, M., Hofvander, Y., Torelon, 1. and Fellstron, B., (1984) Indemic
goiter in the Darfour region (Sudan) Epidemiology and Aetiology
Acta, Med. Scan. 215: 467-475.
Eltom, M., Salih, M. A. M., Bastorm, H. and Dahlberg, P.A, (1985)
Differences in aetiology and thyroid function endemic goiter between
rural and urban areas in the Darfur region in the Sudan. Acta
Endocrinal (Copenh) 108: 356-360.
ElZubeir, E. A., Ali, A. M. and Abdel Razig, S. M., (1993) Effect of pearl
millet on thyroid gland histology and blood serum Triodothyromine
(T3) and thyroxine (T4). Sud. J. Sci Anim. Husb. 38: (1.2) 44. 49.
Fetuga, B. L., (1977) The metabolizable energy value of some cereals and
cereals -by- products for chicken W. A. J. Biol. Appl. Chem. 20: 315.
Freeman, J.E. and Bocan, B.J.(1973). Pearl millet. Apotential crop for wet
milling cereal. Sci. Techn. 18:69 – 73.
Gaitan, F., Lindsay, R. H., Reichert, R. D., Inghar, S. H., Cooksei, R. C.,
Legan, L., Meydrech, E. F., Hill, J. and Eubota, K., (1989)
Antithyroid and goitro genic effect of millet role of
cglycosyflavones. J. Clinic Endocrinol M etab. 68: (4) 707-714.
Ganry, F. and Bideau, J.(1974). Effect of Nitrogenous Fertilizers On the
Yields and Nutritional Value of Millet (in French) Agronomic
Tropicaux Nogent. 29.1006.
Gouse, R.M.; Gevers, H.O.(1982). AN evaluation of high lysiue maize in the
diet of broilers. South African Jaurnal of Animal Science. 21(2):135142.
Hualn, H.W; Proudfoot, F. G. (1982). Nutritive value of sorghum grain for
broiler chickens. Canadian Journal of Animal Science 62(3): 869875.
-47 -
Hubbel, Charles, H. (1980). Feedstuff analysis table. Feedstuff 52(3): 42-47,
1960 (Jan. 21).
Hulse, J. H., Laing, E. M. and Pearson, O. E., (1980) Sorghum and Millets:
Their composition and nutritive value. East Kilibridge, Scotland and
Thomson litho Ltd.
Jellum, M.D. and Powell J.B.(1971). Fatty acid Composition of oils From
Pearl Millet seeds Aqrono. J.63:29-31.
Johnson, R. M. and Raymond, W. D. (1964). The chemical composition of
some tropical plants: 1, Finger and Bulursh millet. Tropical Sci.6:611
Johnson, R.N. and Raymond, W.D.(1974). The chemical composition of oils
from pearl millet seeds Agrono. J.63:29-31.
Kenkpen, D.Y. (1986). The Effects of Decortigation of Sorgum and Millet
on their Chemical Composition and Natritive Value. M. Sc. Thesis
Uneversity of Khartoum – Sudan.
Khatir, A. M. (1990). Chemical and Rehlogical Characteristic of Traditional
Extracted Millet Starch M.Sc. Thesis, University of Khartoum –
Sudan
Klopfenstein, C. F. Hosenerg R. C. and Leipold, H. W. (1983) Goitrogenic
Effects of Pearl millet Diets Nutr. Rep. Int 28: 1137-1143.
Ladu, M.M.(2000). Some Compositional Changes and Nutritive Value of
Malted Millet Grains. M.Sc. Thesis. University of Khartoum –
Sudan.
Lai, C.C. and Varriano – Marston, E. (1980). Lipids Content and Fatty acid
Composition of redd and bond Lipids in Pearl Millet Cereal
chem..57:271 – 274
Lodhi , G.N,Singh ,D, and ICH. Ponani , J . S . (1976) variation in nutrients
of feeding staffs rich in protein of reassessment at the chemical
method for metabolizable energy estimation for poultry . J. Agric .
Sci. Comb., vol.85, (1976),pp. 293-303.
Luis, E. S. Sullivan, T.W. (1982). Nutrient composition and feeding value of
proso millets sorghum grain and corn in broiler diets. Poultry
Science. 61:311-320.
-48 -
Marchais, L. and Tostain. S., (1985) Genetic divergence between wild and
cultivated pearl millet (Pennisetum typhoides) 11. characters of
domestication Zeitscher. Pflanzenzuchtung. 951: 245-261. Cited in:
Eldikhary, S.A., (1992) Growth and productivity of pearl millet as
affected by watering frequencies. M. Sc. Thesis. U of K.
Mazanowski, A.; Szukalski, G.; Kontecka, H. (1982). Simplified mixed feeds
in the diets for broiler chickens. Rocznike Akademic Rolniczej w
Pozrauin Zootechnika. No. 30, 159-168.Cited by Nutr. abst. and
review. Vol. 53.
McDonald, P., Edwards, R.A.and Greenhalgh, J.F.D-(1987). Animal
Nutrition. 4th . edn. Longman Group (EE) LTd., Hong kong.
Mehta, M.K.; Bhaid, M.V.; Singh, J.P. (1985). Effect of replacement of
maize grain by jower at different levels on the performance of starter
chickens. Poultry Adviser. 18(8):21-23.
Mohamedain G.M., Babiker, S.A and Mohamed, T.A. (1986). Effect of
feeding millet, maize and sorghum on performance. Yield and
chemical composition of broiler t. Trop. (Trinidad) 63(2): 173-176.
Monawar, L.Y.(1983) food Value of sudanese cereal grains. Ph.D. Thesis,
University of Khartoum – Sudan.
Morrison, W.R. Milligon, T.P. and Azudin, M.N., (1984). Relationship
between the amylase and lipid contents of starches from diploid
cereal. Sci. 2(4): 257-271.
Mukhatar, S.; Sarwar, M.; Aslam, Z. (1985). Effect of various levels of
soybeen meal on broiler chick performance. Pakistan Veterinary
Journal of Poultry Science. 32(3):212-215.
N.R.C.(National Research Council ). (1994). Nutrient requirements of
poultry (9th .ed).Washington Academy Press.
Obizoba, 1.C. and Atii, J.V.(1994). Evaluation of the Effect of Processing
Technigues on the Nutrient and Anti nutrient Content of Pearl Millet
( Pennisleum glaucum) Seeds. Plant Foods Hum Nutr. Jan. 45(1):2334.
-49 -
Onwueme, I. C. and Sinha, T.D. (1991). Field crop production in Tropical
Africa. Technical Center for Agricultural and Rural co-operation –
England.
Osman, A.K., and Fatah (1981). Factors other than iodine deficiency
contributing to the endemicity goiter in Darfur prarince (Sudan). J.
Human Nutrition 35:302-309.
Paliwal , V.K .; Vadav, K.R .; Khirwar , S . S .; Sharda , D . P. (1983).
Utilization of agro- industrial by-products by livestock and poultry .5.
Replacement of maize with hominy feed in broiler rations. Nutrition
abestract and review. Vol 53
Park, J.H.; Han, I.K.;Ha,J.K(1985).Studies on the nutritive value of
sorghum grain for growing chicken . Forean Journal of Animal
Science. 27(8) : 530-534.
Pokhriyal, T.C., Chatterjee, S.R and Abrol,Y.(1977). Protein content and
amino acid composition of pearl millet . J.Food Sci . Techno. India.
14:232-233.
Pruthi, J.D. and Bhatio, I.S. (1970). Lipids in Cereal ( Pennisetium
typhoidium) J.Sci., Food Agric. 21: 419 – 422.
Purseglove, J.W.(1972). “Tropical crops” Monocotyledons 1. Longman crop
Ltd., London.
Rajni,R.A., Rukmangadhan, S.; Ravindran, R.; Mohan, B.; Muruganadhan,
B.; vedhanayamam, K.(1986). Replacing maize with other grains in
broiler diet. Indian Jouranl of Poultry Science.21(4).343-344.
Reichert, R.A., (1979) the PH-sensitive pigments in pearl millet cereal cham56(4)291-291.
Richert , R . B .and Youngs , C . G. (1979). Bleach effect of acid on pearl
millet. Cereal Chem. 56 : 287-290.
Rooney, L.W.(1978). Sorghum and pearl millet lipids. Cereal Chem. 55:584
– 490
Sanford,P.E.- Camacho,F. Faakc, Deyos, C.W.and Casudy, A.J.(1973).
Performance of meat strain chicks fed pearl millet as source of energy
and protein poultry Sci. 52,208(Abstract)
Sharma, A. and Kapoor, A. C., (1996) Effects of various types of
fermentations on invirto protein and starch digestibility of differently
processed pearl millet. Nahrung. 40: (3) 142-145.
-50 -
Sharma, B. D., Sadagopn, V. R. and Reddy, D. R., (1979) Utilization of
different cereals in broiler diets – Br. Poult. Sci. 20: (4) 371-378
Singh, S.D. and Barsaul, C.S.(1977) Replacement of maize by Coarse grains
for growth production in white . Leghorn and Rhode Island Red
Birds. Ind. J. Anim. Sci. 46:96-99.
Sinhae,E. Ghorban, K. and Makarechian, E. (1971).Comparison of nutrient
value of corn, wheat and millet in broiler diets. Jranian. J. Agric
Res.1(1)51-55
Singh, P. Singh, U., Eggum, B.B., Kumar, K.A – and Andrew, D.J.(1987).
Nutritional Evalution of High Protein Gentotypes of Pearl Millet (
Pennisetum americannum ) J.Sci. Food Agric.
Singh, S.D. and Barsaul, S.S.(1977). A note on the efficiency and economics
of feeding different cereal grains on growth production in white
leghorn and Rhode Island Red Birds. Ind. J. Anim. Sci. 47(3), 159161.
Smith, R.L., Jensen, L.S., Hoveland. C.S. and Hanna, W.W., (1989) Use of
pearl millet, sorghum and tritical grain in broiler diet. J. Prod. Agri.
2:78-82.
Steel, R.G.D.;and Torrie, J. H.(1960).Principles and procedures of statistics,
with special reference to the Biometrical science. Mc-Graw-Hill
Co.Inc. Newyork, Toronto and London.
Sulivan, T.W. Douglass, J.H. derews, D.J. Bond. P.J., Stegmeir, W.D. and
Brethour, J.K.(1990). Nutritional value of pearl millet for food and
feed. Pages 83-94 in:Proc. Int. Conf. On Sorghum Nutritional
Quality. G. Ejeta, E.T.Mertz, L. Ronney. R. Schaffert J. Yohe, eds.
Purdue, Universty W. Lafayett, Indiana.
T.Gidenne (1992) Effect of fibre level , practical size and adaptation period
on digestibility and rate of passage as measured at the ileum and in
the faeces . British Journal of Nutrition , 67 ,pp 133-146.
Varriano – Marston, E. and Hoseney, R.C.(1980). Note on mineral Content
and Location in pearl Millet Cereal Chem.. 57:150-152.
-51 -
Yeong, S. W. and Syed Ali, A.B.(1976). The use of ragi. Broiler diets.
Mardi Res. Bullotion 4,(2)77-80.
-52 -
Appendix
Appendix (1). Average maximum and minimum daily temperature
(0C) during the experimental period (6 weeks)
Weeks
Max. oC
Min. oC
1
39.3
26.7
2
36.0
26.4
3
39.9
28.0
4
40.2
28.5
5
41.6
26.6
6
40.6
27.7
Source: Meteorological Corporation (Shambat Meteorological Station)
-53 -


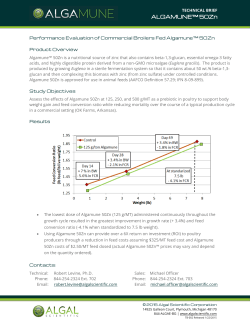

© Copyright 2026