
AVAILABILITY OF FISHMEAL AND FISH OIL AND IMPLICATIONS FOR AQUACULTURE
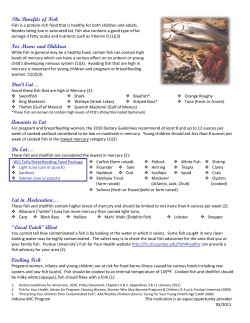
AVAILABILITY OF FISHMEAL AND
FISH OIL AND IMPLICATIONS
FOR AQUACULTURE
C.J. SHEPHERD
MASS BALANCE OF MARINE
INGREDIENTS PRODUCTION 2010
IFFO estimates
Whole Fish
13,886
Total
18,515
888
By-Products
4,629
4,166
Water Steam
13,461
INDUSTRIAL GRADE FORAGE
Landings tonnes
Gulf menhaden (Brevoortia patronus)
479,000
Atlantic menhaden (Brevoortia tyrannus)
212,000
Sand-eel (Ammodytes spp.)
486,500
Total 1,175,000 tonnes of which 100% converted
FOOD GRADE FORAGE
Peruvian anchovy (Engraulis ringens)
8,468,000
Japanese anchovy (Engraulis japonicus)
1,567,000
South African anchovy (Engraulis encrasicolus)
228,000
Sprat (Sprattus sprattus)
262,000
Blue whiting (Micromesistius poutassou)
678,500
Capelin (Mallotus villosus)
958,500
Total 12,162,000 tonnes of which an estimated 90% was converted
PRIME FOOD FISH
Atlantic herring (Clupea harengus)
656,500
European sardine (Sardina pilchardus)
639,000
Chilean jack mackerel (Trachurus murphyii)
Japanese jack mackerel (Trachurus japonicas)
Chub mackerel (Scomber japonicus)
LANDED VOLUMES
(GREATER THAN
200K TONNES) OF
FISH SPECIES USED
FOR REDUCTION
(AVERAGE OF 20012006) CLASSIFIED
BY THEIR DEGREE
OF ACCEPTABILITY
AS HUMAN FOOD
1,870,000
320,000
1,403,500
Californian sardine (Sardina sagax caerulea)
556,000
South African sardine (Sardina sagax)
263,000
Total 5,708,000 tonnes (average landings 2001 – 2006) of which an unknown percentage
was converted
after Wijkström, 2011
RAW MATERIAL FOR GLOBAL
MARINE INGREDIENTS PRODUCTION
2000-2010
Raw material sources for fishmeal
100%
90%
80%
70%
60%
By-products
50%
Whole wild fish
40%
30%
20%
10%
0%
2000
2005
2010
IFFO estimates
GLOBAL FISHMEAL AND FISH OIL
PRODUCTION
1964-2010 (TONNES X 103)
8000
7000
tonnes ,000
6000
5000
4000
Fishmeal
Fish Oil
3000
El Niňo
2000
1000
0
IFFO data
FISHMEAL AND FISH
OIL PRODUCTION
SHOWS SLOW
DECLINE BUT
CONTINUES TO BE
DOMINATED BY
PRODUCTION IN
SOUTH AMERICA.
PRODUCTION IN
EUROPE HAS
CONTINUED TO
DECREASE
IFFO data
CHANGING USES OF FISHMEAL
1960 TO 2010
ESTIMATED USE OF FISHMEAL BY
SECTOR IN 2010
The estimated use of fishmeal by sector 2010
Pigs
20%
Others
2%
Chickens
5%
Aquaculture
73%
IFFO estimates
TREND IN WEEKLY PRICE RATIO OF
FISHMEAL TO SOYABEAN MEAL
1993 TO MARCH 2012
IFFO data
CHANGING USE OF FISH OIL FROM
HYDROGENATED FAT TO AQUACULTURE
AND DIRECT HUMAN CONSUMPTION
Changing uses of fish oil
2010
1990
1960
2%
5%
20%
20%
16%
80%
24%
59%
3%
71%
Clockwise from the top
Hardened Edible
Aquafeed
Industrial
Refined Edible
IFFO estimates
FISH OIL USAGE (TONNES X 103)
2005-2011*
1,200
1,000
800
Other uses
600
Crude Oil human consumption
Aquaculture
400
200
0
2005
2006
2007
2008
2009
2010
2011
IFFO & GOED data
* 2011 is an estimate
SOURCES OF REFINED OIL 2011
4.0% 0.4%
5.8%
0.1%
3.0%
0.0%
6.8%
79.4%
Anchovy/Sardine
Cod
Tuna
Note over 95% comes from fish
Salmon
Algae
Krill
Yeast
Plant
Source GOED
SOURCES OF REFINED OIL 2011
1985
1986
1987
1988
1989
1990
1991
1992
1993
1994
1995
1996
1997
1998
1999
2000
2001
2002
2003
2004
2005
2006
2007
2008
2009
2010
2011E
VOLUMES OF SALMON FEED ARE
INCREASING
,000 tonnes
3000
2500
2000
North America
1500
UK
Chile
1000
Norway
500
0
CHANGING COMPOSITION OF SALMON
FEEDS OVER TIME WITH SUBSTITUTION
OF FISHMEAL & FISH OIL
100%
90%
Fish oil
80%
70%
60%
Alternative proteins
and starch
50%
40%
30%
20%
Fish meal
10%
0%
1995
Fish meal
2000
Alternative proteins and starch
2005
Fish oil
2010
Vegetable oils
N. Alsted pers. comm.
INCREASING AQUACULTURE DOES NOT USE
MORE MARINE INGREDIENTS
Global Aquaculture Production with fishmeal
and fish oil usage 2000-2010 tonnes millions
35.0
3.50
30.0
3.00
25.0
2.50
20.0
2.00
Fed Aquaculture
Fish meal in aquaculture
15.0
1.50
10.0
1.00
5.0
0.50
0.0
0.00
2000
2001
2002
2003
2004
2005
2006
2007
2008
2009
2010
Fish Oil in aquaculture
Data FAO & IFFO
CHANGING EPA/DHA CONTENT IN
NORWEGIAN SALMON
2002-2012
2002
% of total oil in salmon feed
2012
35%
35%
100%
33%
5%
1.5%
% fish oil in total diet
35%
12.6%
% EPA+DHA of dietary oil (if fish oil contains 20% EPA+DHA)
20%
7.2%
% fish oil* in added dietary oil
% dietary fish oil contribution via fish oil within fishmeal
EPA+DHA in 140g portion of salmon fillet containing 15% oil **
4200 mg
1512 mg
No. of days of EFSA requirement met by 1 portion (250 mg/day)
16.8
6.0
No. of days of UK/SCAN requirement met by 1 portion (450 mg/day)
9.3
3.4
No. of days of WHO requirement met by 1 portion (500 mg/day)
8.4
3.0
* Assumes fish oil mix of approx. 50% Peruvian anchovy and 50% North Atlantic sources
* *Assumes EPA & DHA levels in salmon fillet are the same as the oil in the feed
SO BY 2017 WE NEED:
Approximately 400,000 tonnes of crude oil for refining for
human consumption
Approximately 400,000 tonnes for salmonid feed
At least 200,000 tonnes for other aquaculture
Fish oil production is predicted to remain at around 1
million tonnes
Conclusion: we urgently need more sources of LC Omega 3
POSSIBLE SIGNIFICANT SOURCES
FOR 2015
• Algae
• Krill
• Genetically Modified oil seeds
ALGAE
• Two mains types of production:
– Fermentation: investing companies include
DSM Martek and Lonza
– Sunlight: Aurora and Algae Biosciences
• A lot of development on the back of
biofuel research e.g. Cellana in Hawaii
• Most still in the start up phase
ALGAE
• Ratio’s of EPA & DHA and concentrations
vary from species to species and growing
conditions
• Generally concentrations of LC Omega 3 in
the oil are higher than in fish oil
• Using a 30% EPA/DHA equivalence
production was around 5000 tonnes in 2011
and likely to be around 30,000 tonnes by
2017
KRILL
• Antarctic krill biomass estimated to be
200 - 400 million tonnes
• Managed by CCAMLR who have set a
TAC of 5 million tonnes with a trigger
level of 620,000 tonnes
• Current catches only around 200,000
tonnes per annum
• Aker Biomarine have obtained MSC
certification for their harvests
KRILL
• Aker Biomarine world’s largest harvester
of Antarctic Krill
• They represent about 50% of current
harvests
• High value but volumes are still small and
oil yields low
• Growth is rapid but total volumes likely to
be under 5000 tonnes of oil by 2017
GENETICALLY MODIFIED OIL
SEEDS
• There is no commercial production of plant
based EPA & DHA production
• The two species closest to market are soy
and rapeseed (canola)
GM SOY WITH LONGER-CHAIN
OMEGA-3 IS CLOSE
• Soymega from Monsanto
with high SDA is expected
to get regulatory
approval in the US this
year
• An EPA product is still a
few years away and DHA
is over the horizon
EPA & DHA FROM CANOLA ARE
BEING WORKED ON
• Dow AgroSciences & DSM are working
on producing DHA in canola
• Cargill and BASF announced in
November 2011 that they were
working on producing EPA and DHA
from canola
• A commercial product appears
several years away
Conclusion:
There is no EPA & DHA from land plants available today.
Unlikely to be significant volumes on the market in 2017. But
the potential to increase rapidly once developed means that
in ten years volumes could be considerable
LIKELY TRENDS IN SUPPLY AND USE OF
FISHMEAL AND FISH OIL GOING
FORWARD
• Continuing move to precautionary fishery management as well as to using fish
for direct human consumption instead of fishmeal production
• Increasing trend towards use of certification by marine ingredients producers
to reassure value chain on sustainability/responsible stock management
• At most a static supply of marine ingredients (~ 5 M tonnes pa fishmeal + 1 M
tonnes pa fish oil) going forward but with an increasing proportion of fishery
by-products
• Continuing switch to greater added value use (eg to aquaculture for fishmeal
instead of agriculture; and direct human consumption products for fish oil)
• Increasing focus on micronutrients in fish raw materials to extend their
availability and usefulness and create new added value products
• Continuing growth in demand for aquaculture feed, but accompanied by a
continuing trend towards substitution of marine ingredients and to their use
as strategic ingredients being restricted to critical stages in the life cycle
LIKELY TRENDS IN SUPPLY AND
USE (CONTD.)
• Emergence of new sources of raw material - It is unlikely that LC
omega-3 demand will be met by GM crop expression in next 5 years,
but algal oil is already entering human nutrition & pharmaceuticals
• From 2000 to 2010 the FIFO ratio for fed aquaculture has fallen from
0.6:1 to 0.3:1 - even so-called ‘carnivorous’ fish will increasingly be
commercially farmed to yield a net production of fish protein and oil
• It seems unlikely there is a ‘fishmeal trap’ meaning that aquaculture
growth will not be limited by the availability of marine ingredients
• In other words there’s enough fishmeal for aquaculture going forward
but fish oil could become limiting, pending availability of new sources
• Increasing fish oil demand for direct human consumption will mean
reduced availability for aquaculture resulting in lower LC omega-3
levels in aquaculture products – but also in higher omega-6 levels
• Increasing differentiation of salmon products by retailers is likely and
failure to meet international recommendations may become an issue
• Taking a global view, there are still areas for improvement, especially
the use of low value/trash fish fed raw to aquaculture in S E Asia
THANK YOU
[email protected]


© Copyright 2026